Article

Characteristics and Mechanism of Large Deformation of Tunnels in Tertiary Soft Rock: A Case Study

1
Key Laboratory of Geotechnical Mechanics and Engineering of Ministry of Water Resources, Changjiang River Scientific Research Institute, Wuhan 430010, China
2
China Water Resources Beifang Investigation, Design and Research Co., Ltd., Tianjin 300222, China
*
Author to whom correspondence should be addressed.
Buildings 2023, 13(9), 2262; https://doi.org/10.3390/buildings13092262
Submission received: 23 July 2023 / Revised: 28 August 2023 / Accepted: 1 September 2023 / Published: 6 September 2023

Abstract

:
During the excavation of a water-conveyance tunnel in Tertiary soft rocks in China, significant deformation of the surrounding rocks and damage to the support were observed. Substantial horizontal deformation, reaching magnitudes of meters, was observed in the right side wall after a certain period of tunnel excavation. Extensive investigations, including field surveys, monitoring data analysis, laboratory tests, and numerical simulations, were conducted to understand the underlying mechanisms of this large deformation. The section of the tunnel with large deformation consisted of Tertiary sandy mudstone, mudstone interbedded with marl, and glutenite. Laboratory tests and mineral composition analysis revealed that the sandy mudstone and mudstone interbedded with marl exhibited low strength, which was closely related to the water content of the rock specimens. The compressive strength gradually decreased with increasing water content, and when the water content of mudstone interbedded with marl reached 26.96%, the uniaxial compressive strength decreased to only 0.24 MPa. Additionally, sandy mudstone and mudstone interbedded with marl contained a significant amount of hydrophilic minerals, with montmorillonite constituting 30% and 34% of the two rock samples, respectively. The tunnel passed beneath a perennially flowing gully, and a highly permeable glutenite layer was present in the middle of the tunnel. This resulted in groundwater seepage from the inverted arch during excavation, leading to the softening effect on the mudstone interbedded with marl in the lower part of the tunnel. Through numerical simulation and back-analysis techniques, the varying degrees of softening induced by groundwater were quantitatively analyzed in the surrounding rocks on the left and right sides. The study revealed that the large deformation of the tunnel was triggered by two factors: the plastic flow caused by tunnel excavation under the low strength of the surrounding rocks and the softening effect of groundwater. The damage to the support system was primarily attributed to the squeezing and swelling deformation of the surrounding rocks and the non-uniform deformation between different rock layers.

1. Introduction

Large deformation is an engineering geological damage that is frequently encountered in tunnel construction. Ding et al. [1] defined the large deformation of surrounding rocks in tunnels as deformation that is significantly greater than normal and such that it may trigger adverse effects. The normal level of deformation in tunnels refers to the deformation that occurs in the surrounding rock of a tunnel section with non-adverse geological conditions after considering conventional support measures. Generally, when the deformation of the tunnel is at a normal level, the surrounding rock will not undergo damage caused by deformation. The first documented serious large deformation of surrounding rocks occurred in the Simplon tunnel in Switzerland that was completed in 1906. Significant deformation and damage occurred to surrounding rocks during excavation of the tunnel, attracting extensive attention among engineers [2]. Afterwards, large deformation of surrounding rocks to different extents also happened during the construction of the Arlberg expressway tunnel and Tauern tunnel in Austria [3,4], the Enasan tunnel in Japan [5], and the Jiazhuqing tunnel [6], Muzhailing tunnel [7], Wushaoling tunnel [8], and Hadapu tunnel [9] in China. The large deformation was also accompanied by damage to the supports and even engineering disasters such as failure of the surrounding rocks in the tunnels. These tunnels shared characteristics of a low strength of surrounding rocks and high ground stress, which resulted in large deformation of surrounding rocks and enduring deformation during construction.
The large deformation of surrounding rock after tunnel excavation may be attributed to either the tectonically high stress-dominated external environment or the low strength of rock masses. In the former case, the stress redistribution resulting from tunnel excavation under high ground stress conditions can induce significant secondary stress disturbances in the surrounding rock, leading to substantial deformations in soft rock formations as well as thin layered and anisotropic medium–hard rock formations [10,11]. In the latter case, it generally pertains to tunnel excavation taking place within soft rock formations [12,13,14,15,16]. Soft rocks are characterized by a low uniaxial compressive strength (UCS). According to the recommendation of the International Society for Rock Mechanics (ISRM), rocks with a UCS of less than 25 MPa are classified as soft rocks. Soft rocks are commonly related to specific lithology, including siltstone, mudstone, and diabase, which have UCSs far lower than intact hard rocks, such as granite, gneiss, limestone, and marble. Soft rocks have strong rheological properties and low strength [17], so stress redistribution in surrounding rocks lasts for a long time after excavating a tunnel in soft rocks: deformation of surrounding rocks generally lasts for several weeks to several months [18], and, on occasion, beyond one year [15]. Considering the high frequency and hazard of large deformation during the construction of tunnels in soft rocks, numerous scholars have investigated the mechanism underlying large deformations during construction [19,20,21,22,23]. Their research on the large deformation of surrounding rocks of tunnels excavated in soft rocks shows that squeezing and swelling are the main modes of deformation of soft rocks. The squeezing deformation of surrounding rocks is a result of yielding of rock caused by excavation-induced stress redistribution beyond the strength of the rock, and it is mainly dependent on the rock strength and overburden thickness, that is, the ground stress. Wood [19] evaluated the stability of tunnels by virtue of the ratio of the UCS of rocks to the overburden stress. After similarity investigation and analysis of more than 20 tunnels with large squeezing deformation, Aydan et al. [12,21] found that tunnels constructed in soft rocks are commonly subjected to squeezing failure when satisfying the following conditions: the ratio of the UCS of rocks to the overburden stress is less than two and the tangential strain in the side walls of tunnels exceeds 1%. In the Standard for Engineering Classification of Rock Mass (GB50218-2014) in China [24], the Rc/σmax index (Rc represents the saturated uniaxial compressive strength of rock, σmax represents the maximum initial stress in the direction vertical to the tunnel axis) is used to evaluate the behavior during tunnel excavation. When Rc/σmax is less than 4, spalling or extremely significant deformation and even large deformation are likely to occur in the rock surrounding a tunnel constructed in soft rock, and the deformation may persist. The swelling deformation of tunnels built in soft rocks refers to deformation due to the swelling of some minerals in the surrounding rocks in reaction with water. Chen [20] found that the volumetric swelling of surrounding rocks after reaction with groundwater is the main cause for deformation in Jinchuan deposit in China. In fact, it is generally impossible to separate squeezing and swelling in the excavation of tunnels in soft rocks, and a large deformation of surrounding rocks caused by squeezing or swelling alone is very rare.
To reveal the mechanism behind such a large deformation of tunnels built in soft rocks, many scholars generally performed comprehensive analysis from both mechanical and geological perspectives [15,18,25,26]. Bian et al. [16] studied the occurrence mechanism of large deformation for the Huangjiazhai tunnel in China by combining engineering analysis, laboratory analysis, and micro-analysis. Li et al. [27] analyzed the large deformation mechanism of the Jiaoding tunnel in layered rock strata and proposed treatment measures based on field tests and theoretical analysis. However, the mechanism underlying the large deformation of a specific project generally calls for targeted research because of the complex geological conditions and ground stress at specific sites. The present research focuses on the significant deformation of surrounding rock and the failure of supporting structures observed during the excavation of a tunnel in Tertiary soft rock in China. Various methods, including field geological investigation, analysis of deformation monitoring data during tunnel excavation, laboratory experiments, and numerical simulations, were employed to analyze the characteristics and mechanisms of the large deformations in the soft rock tunnel.

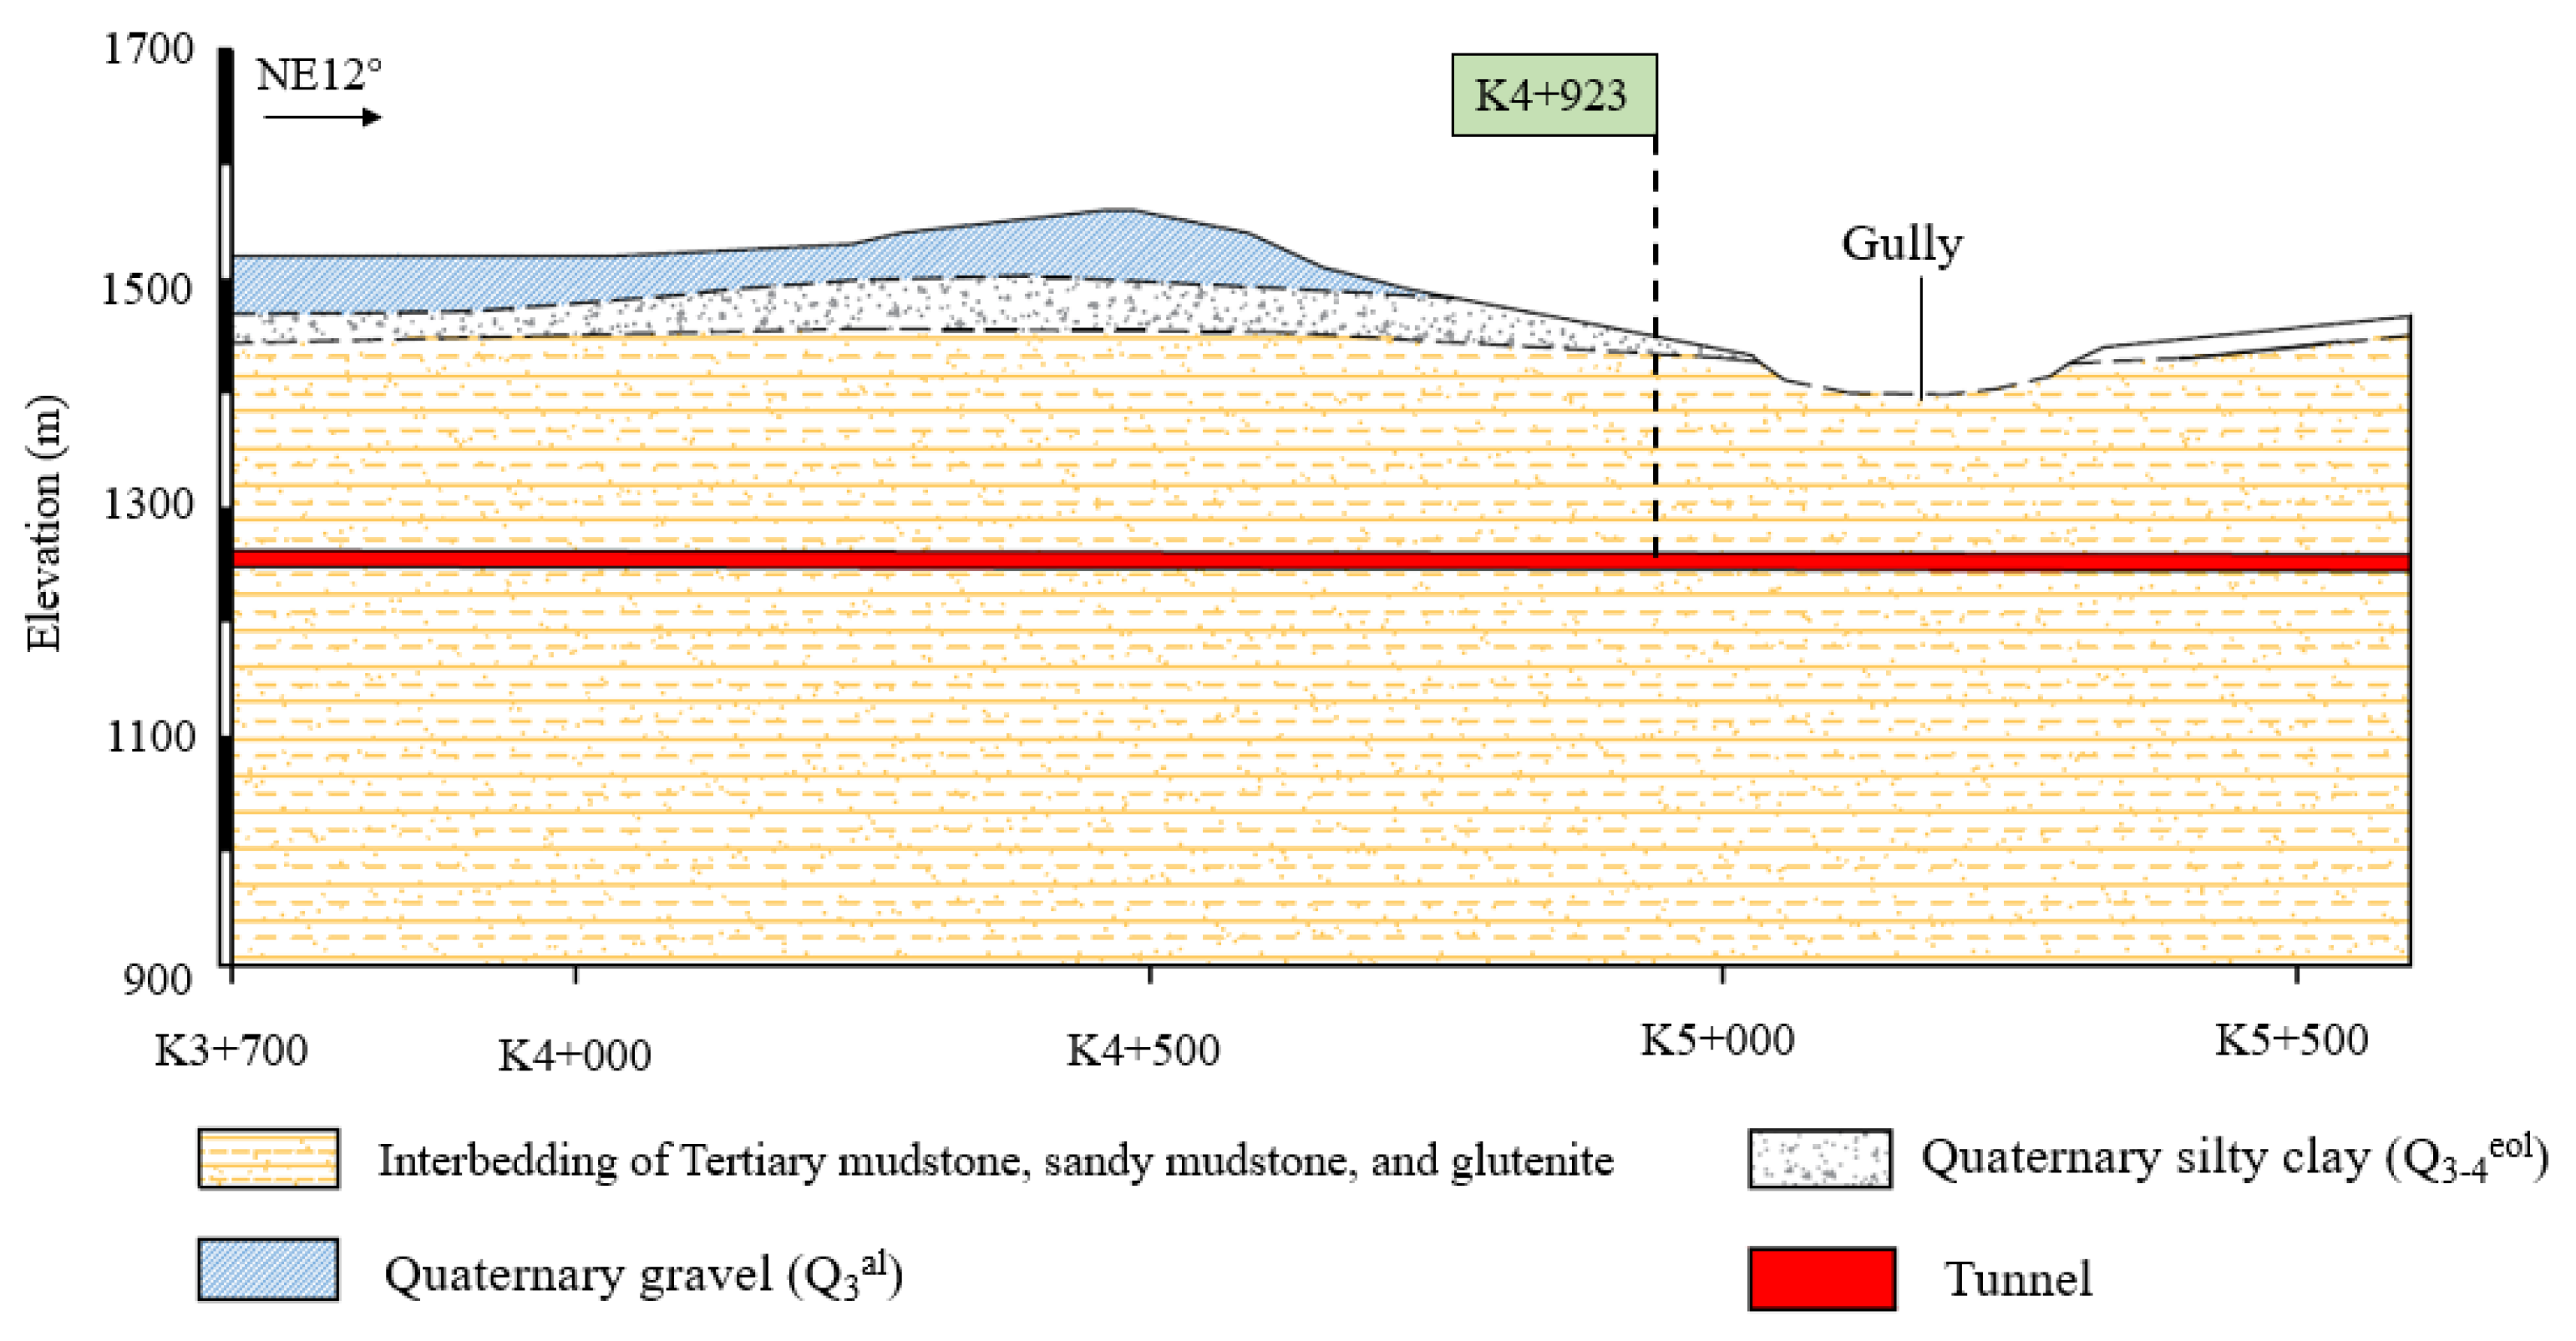
2. Geology and Topography

2.1. Topography

The water-conveyance tunnel has a total length of 41.823 km, maximum burial depth of 2268 m, design flow 70 m3/s, and diameter of 6.9 m [28]. It is designed as a free-flow tunnel and constructed using a drill and blast-heading method. The tunnel section studied here is in the chainage range of K3 + 700 to K5 + 500, beneath a hilly area where the ground elevation is 1420 to 1560 m. The tunnel section is buried at the depth of 140 to 300 m. The mountains in the area are relatively flat, with a natural slope angle of 25° to 35°. The tunnel section traverses beneath a gully with a width of 150 to 200 m. The topography in the area of the tunnel section is shown in Figure 1.

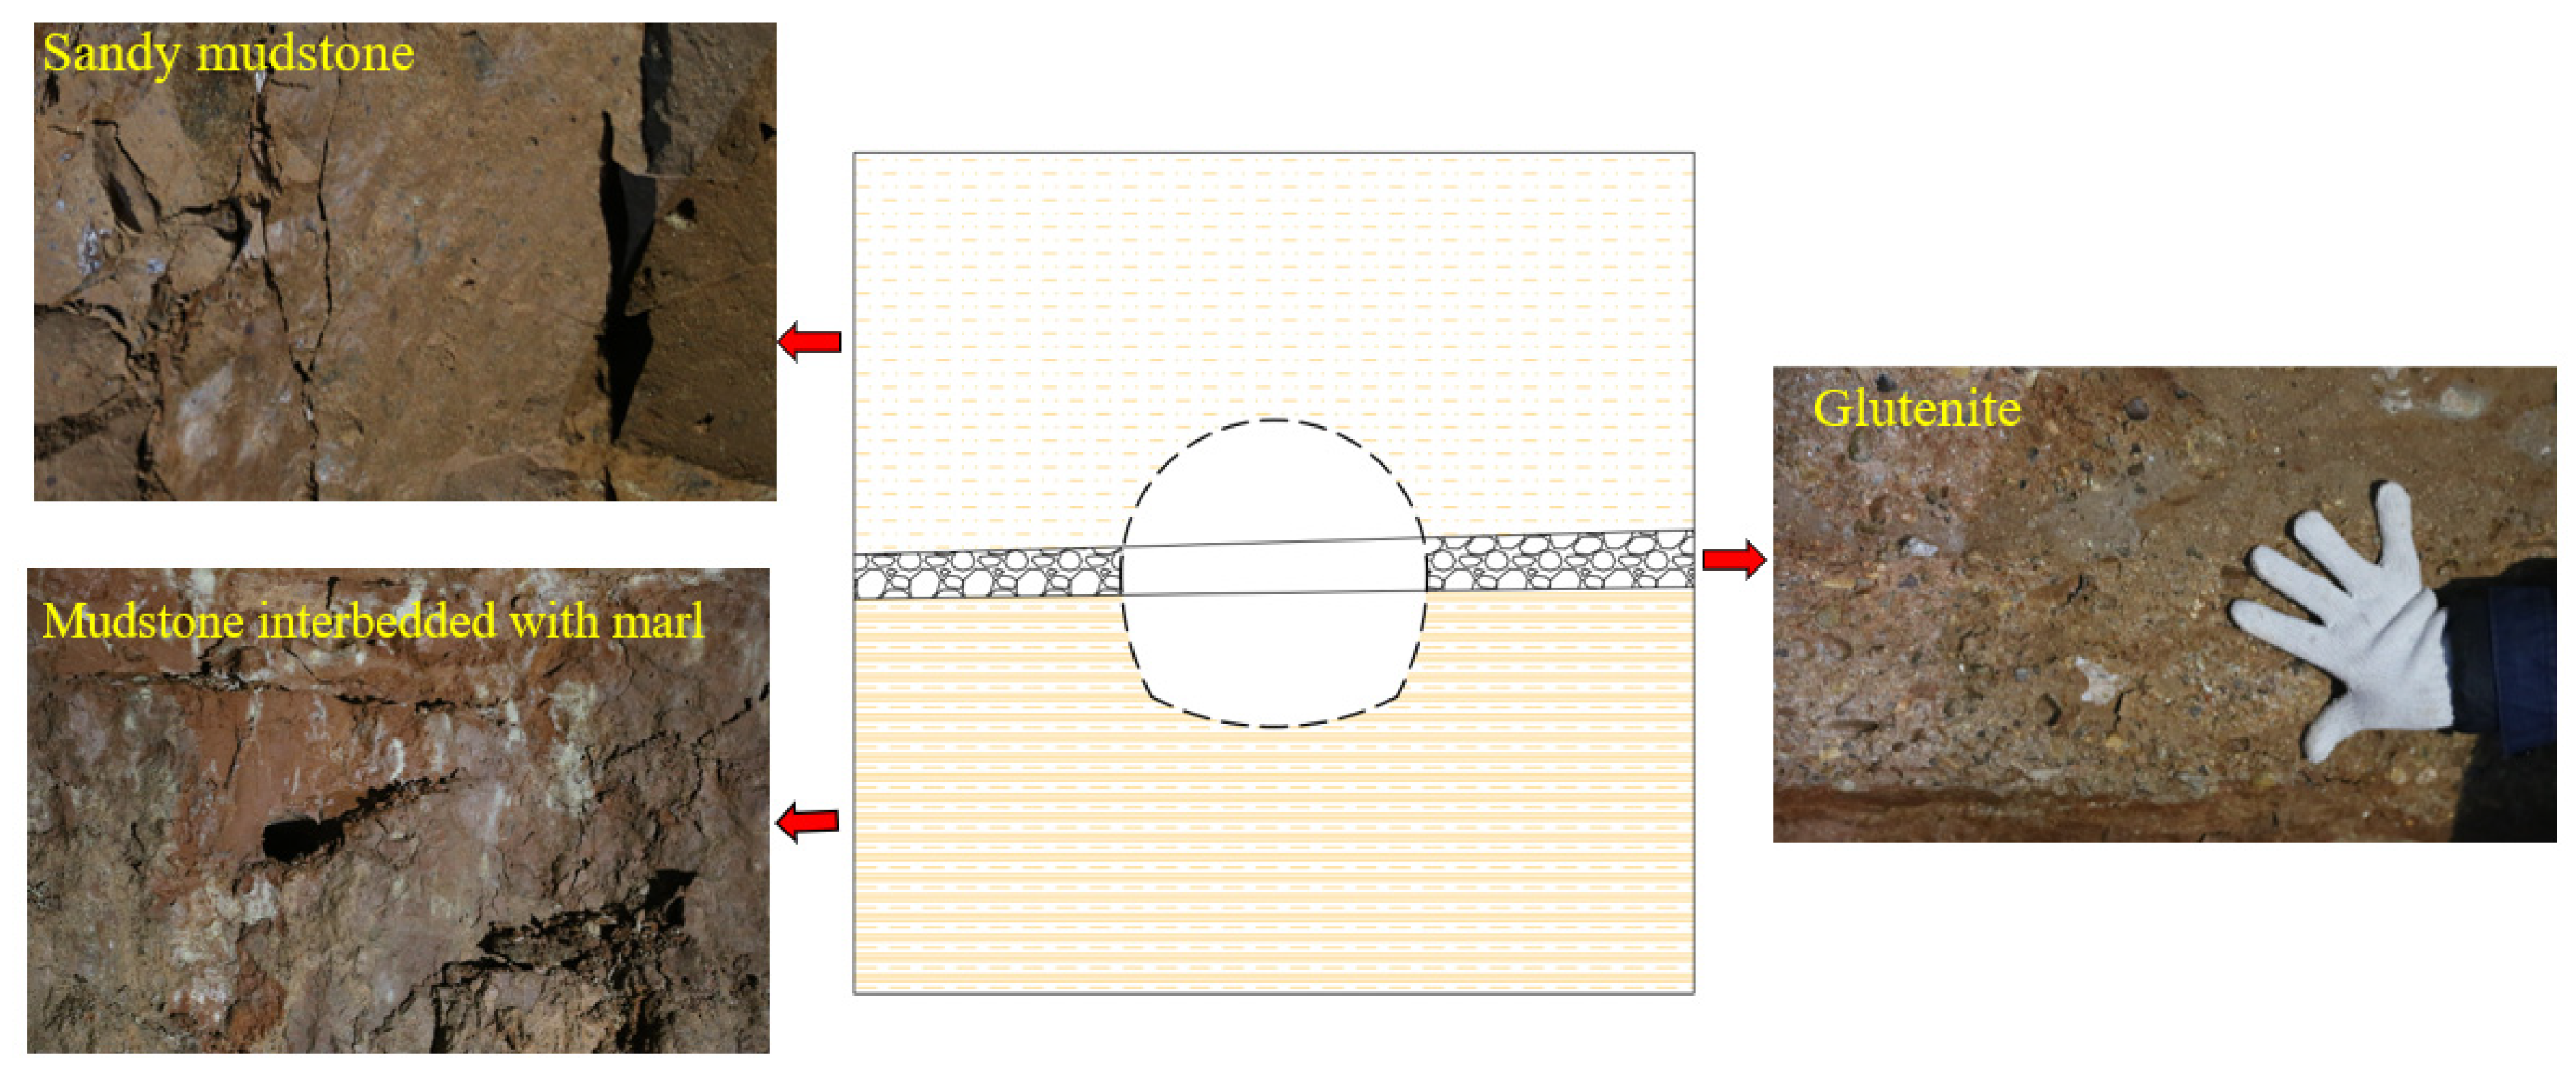
2.2. Strata and Lithology

Quaternary silty clay (Q3–4eol) and gravel (Q3al) form the main overburden in the region. The geological prospecting by drilling boreholes on the tunnel line shows that interbedding of Tertiary mudstone, sandy mudstone, and glutenite mainly occurs below the overburden (Figure 1). Glutenite, also known as conglomerate, is characterized by its coarse-grained nature, consisting of rounded or angular fragments of various sizes and types of rock cemented together by a finer-grained matrix.
Figure 2 illustrates the lithological distribution revealed at the tunnel face (K4 + 923) after excavation of the tunnel. Three types of rocks are found on the cross-section: namely, mudstone interbedded with marl, glutenite, and sandy mudstone. The upper portion of the cross-section predominantly consists of a reddish–brown, thick to ultra-thick sandy mudstone. This particular rock type exhibits weak to medium argillaceous and calcareous cementation. It has a natural moisture content of 18.03%. Situated in the middle of the cross-section is a medium-thick bedded, gravelly glutenite. This glutenite also displays a reddish–brown hue, which is accompanied by weak cementation and inadequate sorting of gravels. It exhibits a relatively moist condition and contains approximately 15% to 20% gravel, with grain sizes ranging from 5 to 10 mm and a maximum grain size of 30 mm. The particle sizes within the glutenite are unevenly distributed. The lower portion of the cross-section is occupied by mudstone interbedded with marl. This rock type primarily exhibits a reddish–brown color interspersed with off-white marl layers. The mudstone interbedded with marl displays weak argillaceous and calcareous cementation. Its natural moisture content is 15.48%.

2.3. Geological Structures
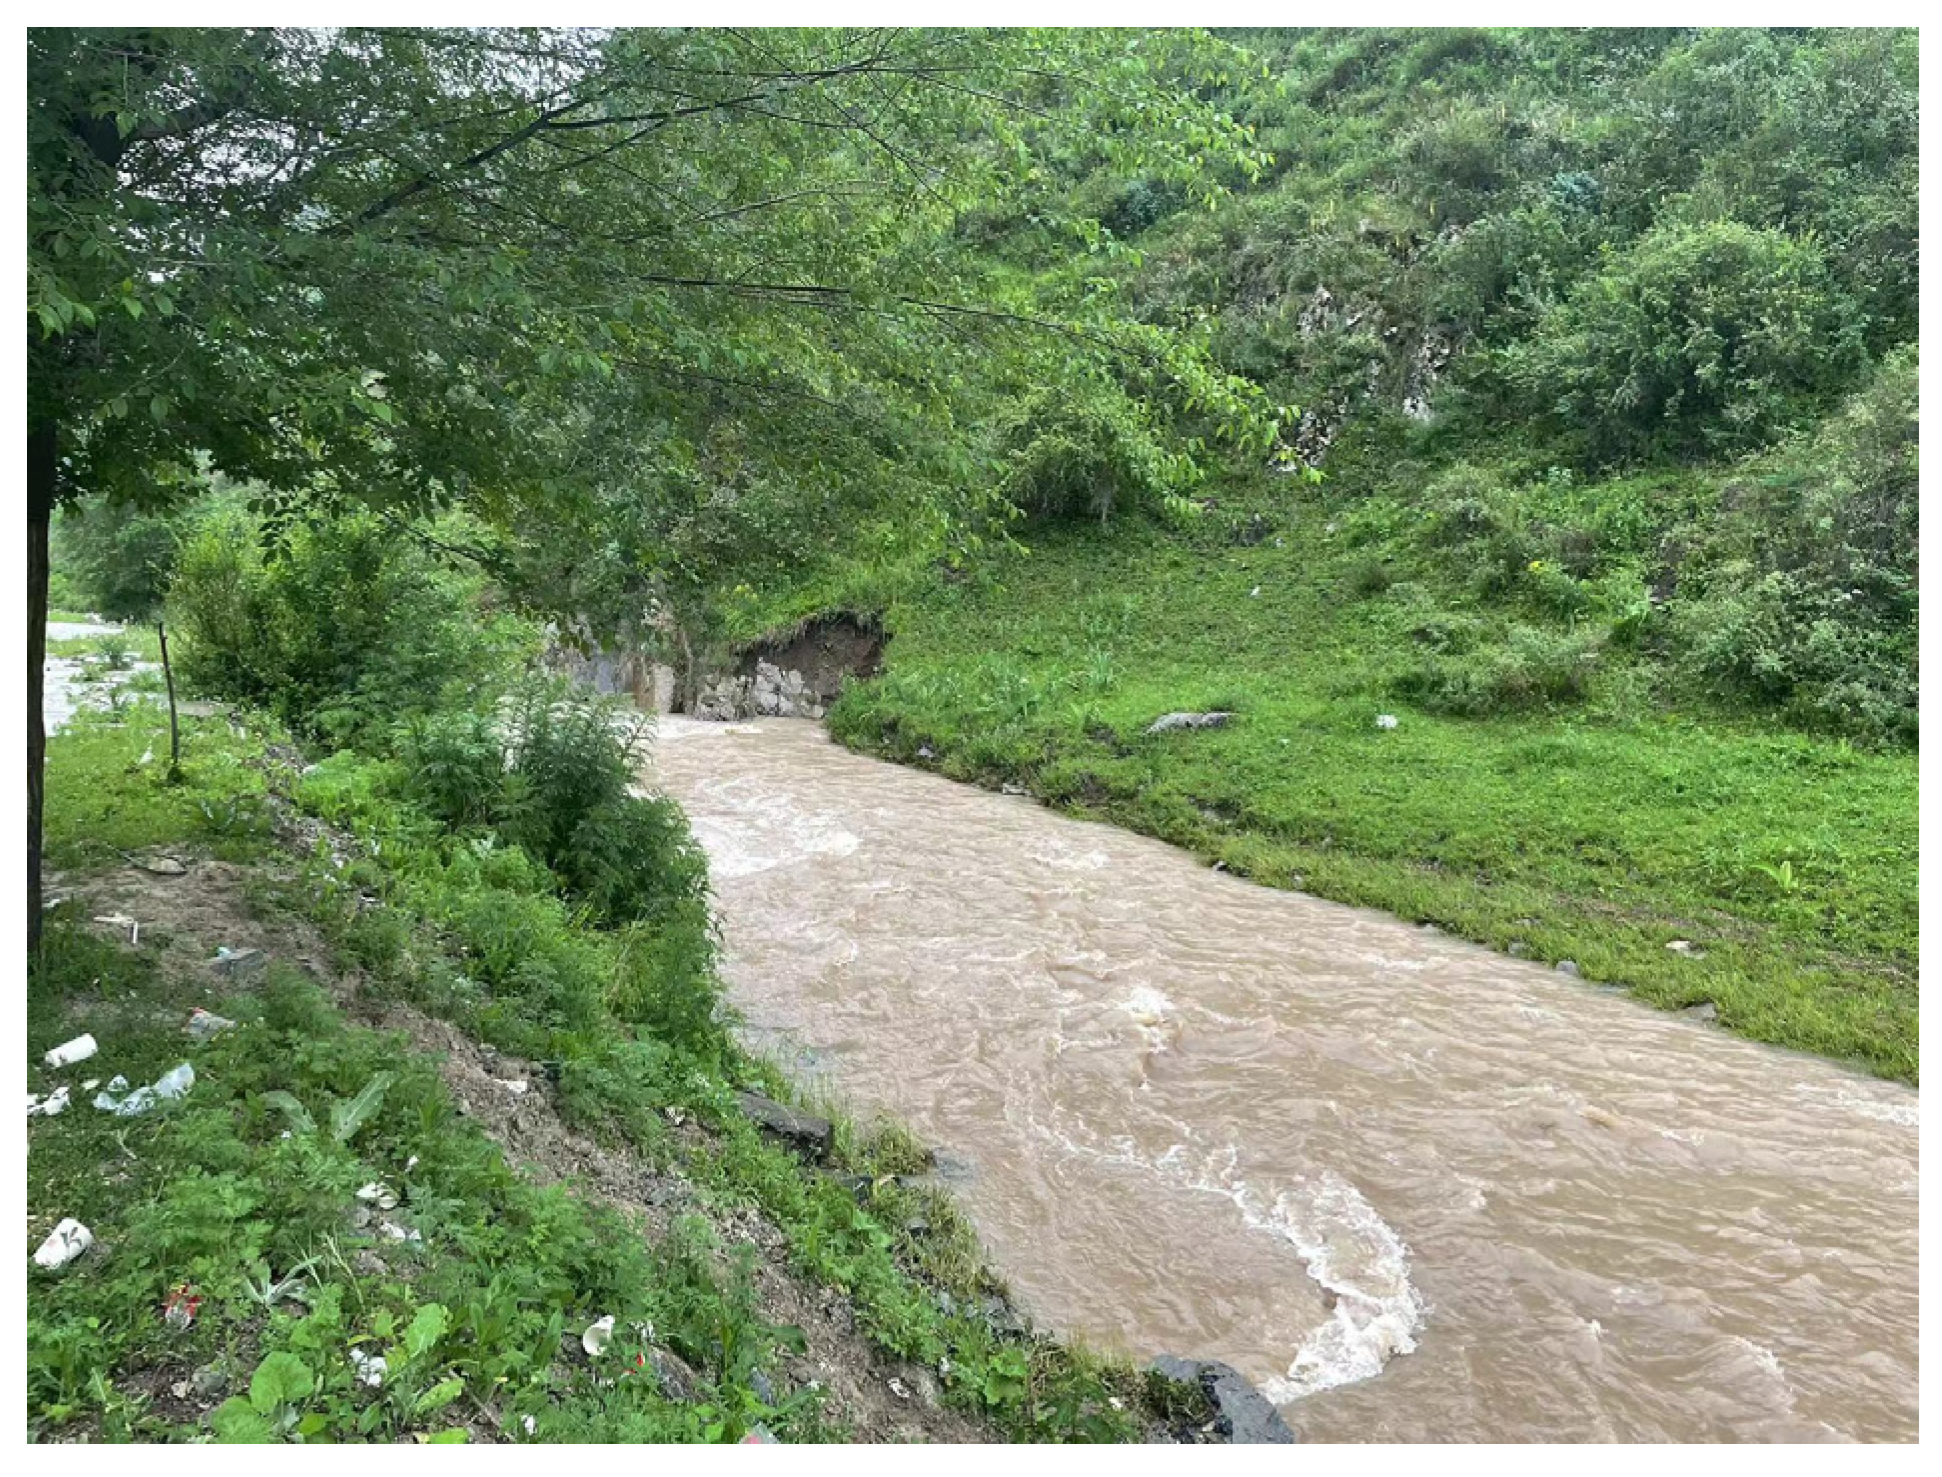
The geological prospecting results prior to construction show that there is no large fault in the region. Three fractures are mainly developed. ① The first is a fracture with occurrence of NW320°~325°SW∠30°~45° with straight and smooth fracture planes that is opened by 1 to 2 mm. It has striated mirror faces and is not filled; these lie at a spacing of 0.3 to 0.8 m. ② The second is a fracture with occurrence of NE25°~30°NW∠45°~50° with straight and smooth fracture planes with scratches opened by 0.5 to 1.0 mm. The fracture is not filled and has a spacing of 0.5 to 1.0 mm. ③ The third is a fracture with occurrence of NE45°~50°NW∠25°~30° with straight and smooth fracture planes opened by 0.5 to 1 mm. It is not filled and has a spacing greater than 1 m.

2.4. Hydrogeology

The tunnel section studied in the research traverses beneath a gully that has a width of 150 to 200 m at a vertical distance of 138 m from the tunnel. There are ice and snow meltwater from nearby mountains and atmospheric precipitation flow throughout the year in the gully. The design flood flows for the twenty-year and fifty-year return periods are 142 and 164 m3/s, respectively. The real scene of the gully is shown in Figure 3. The annual precipitation over the area is 350.2 mm, and the precipitation mainly occurs from April to September every year. During the tunnel excavation process, certain surrounding rocks within the tunnel section were observed to undergo water seepage, which was identified by the on-site geological engineer as being associated with the water source originating from the nearby gully.

3. Large Deformation during Tunnel Excavation and Analysis of Corresponding Monitoring Data

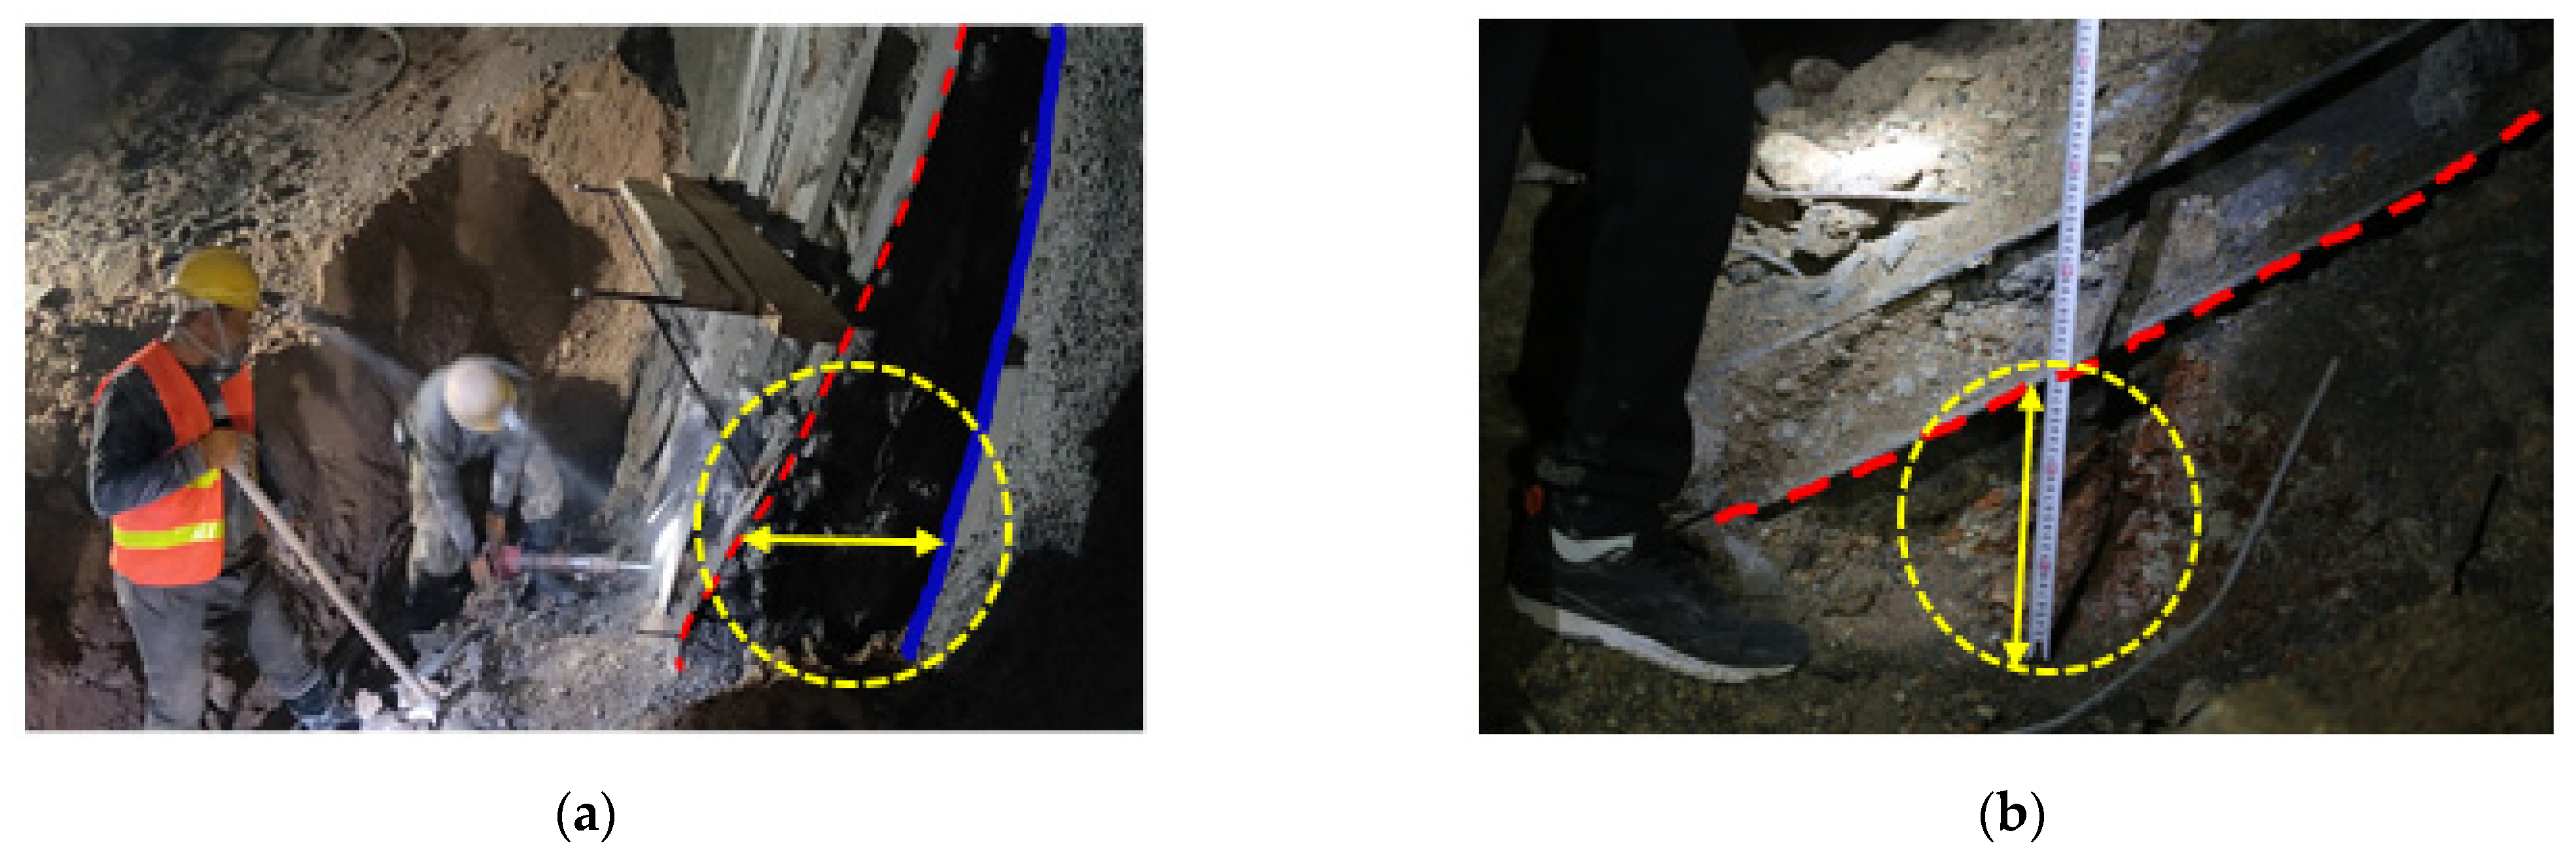
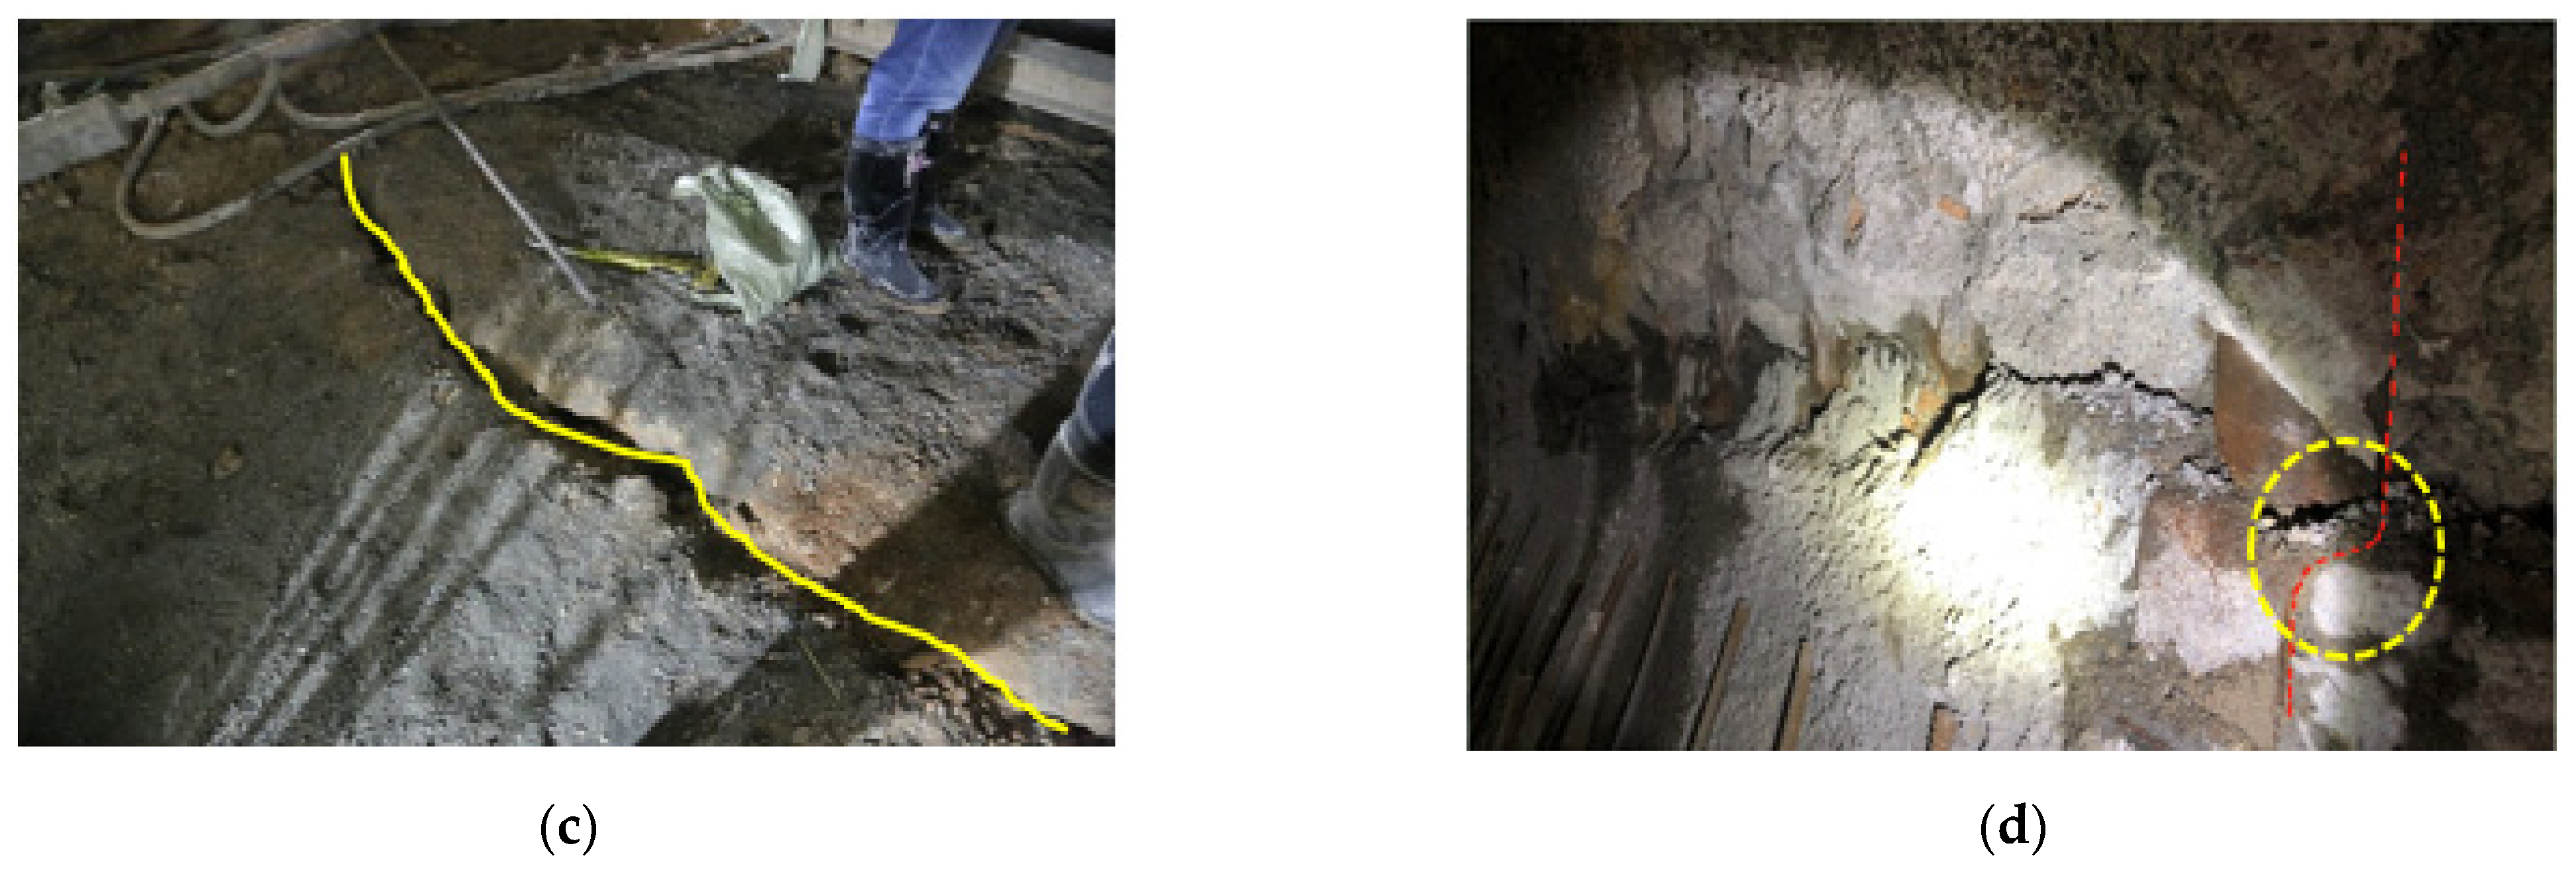
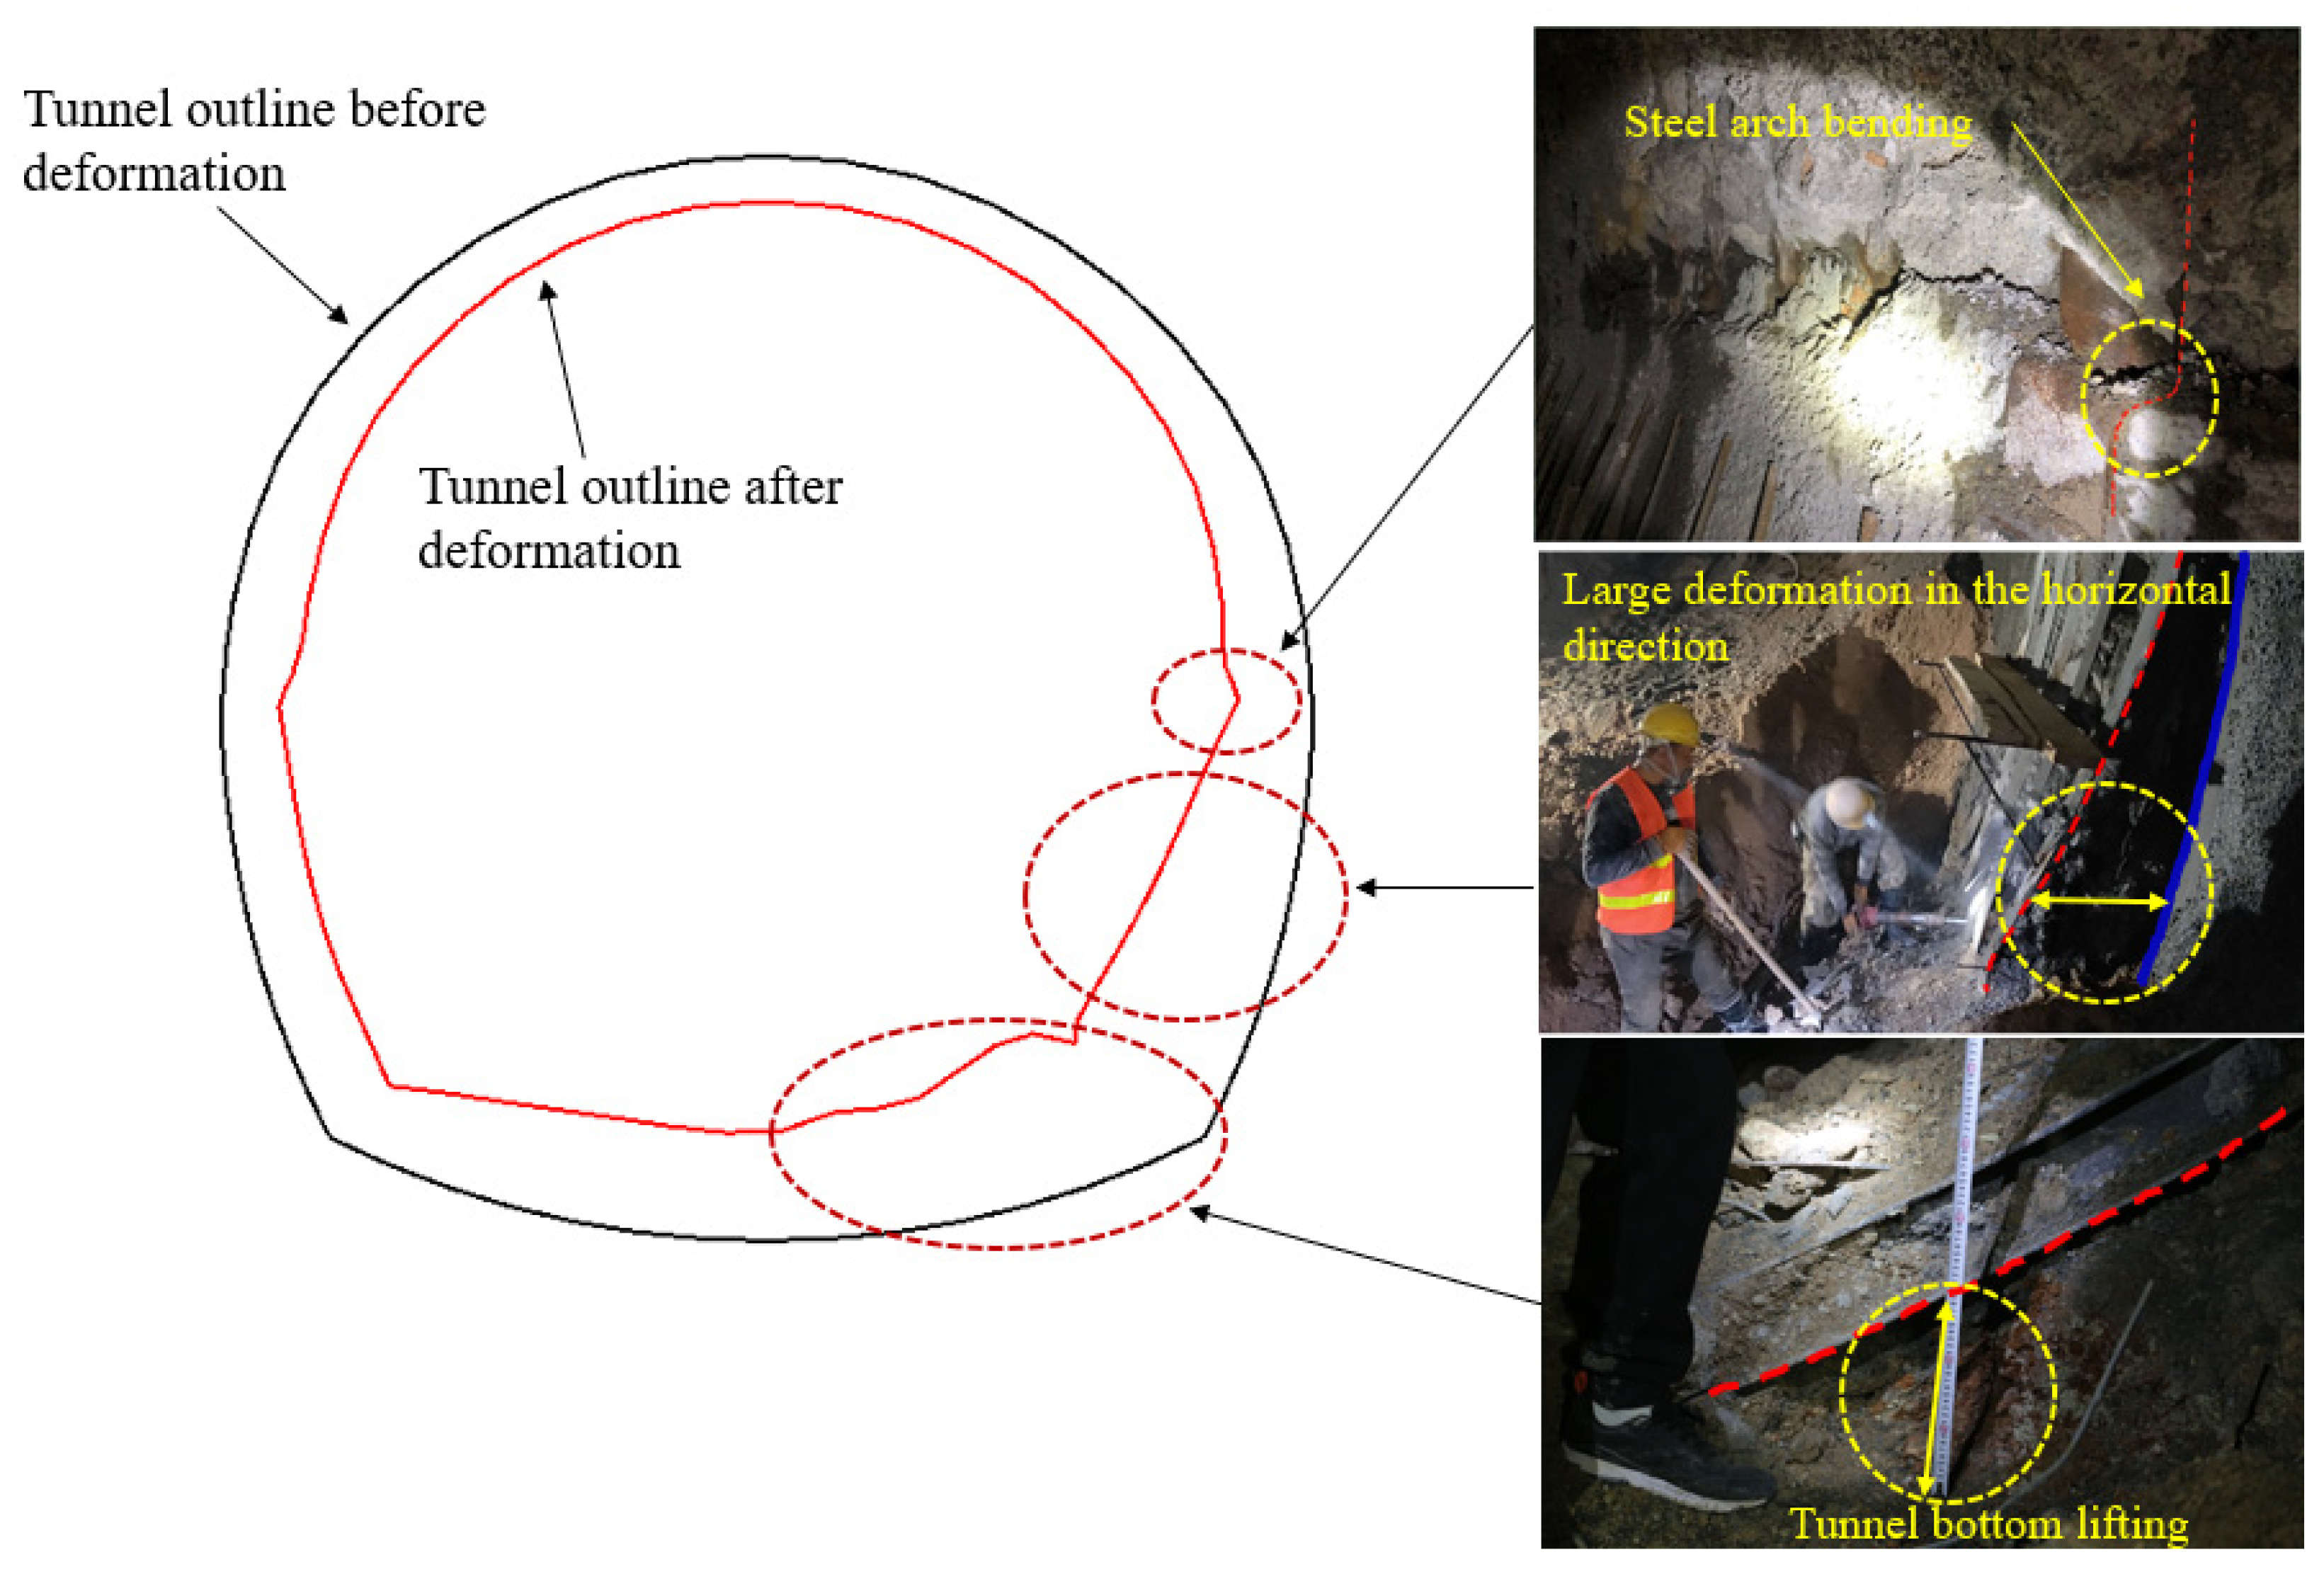
3.1. Large Deformation during Tunnel Excavation

The tunnel was constructed using the new Austrian tunneling method [29] with the implementation of effective drainage measures throughout the tunnel construction process. It was excavated in two benches, and the footage of each cyclic excavation is no longer than 250 mm. Based on the empirical evidence obtained from field construction, the average daily advance rate was observed to range from 1 to 1.5 m, which corresponds to a total of four to six cycles of simultaneous excavation of the upper and lower benches. The primary support system employed for the tunnel encompassed a composite approach involving the implementation of hollow grouting anchor bolts, steel arches, mesh reinforcement, and shotcrete. Subsequently, a reinforced concrete structure was utilized for the secondary lining. The detailed support parameters of the tunnel section are summarized in Table 1, and the excavation section size is shown in Figure 4.
In mid to late September 2019, large deformation occurred in the surrounding rocks during the excavation of the tunnel section K4 + 904 to K4 + 924. Monitoring data show that the maximum horizontal deformation at the deformation monitoring point on the right-hand wall on the cross-section at K4 + 923 was 990.6 mm, invading the construction space of the secondary lining. Then, the bottom of the tunnel section was also subject to sever heave. On 23 October 2019, longitudinal cracks were found on the lining in the tunnel section (K4 + 904.3 to K4 + 913.3) where a lining had been applied to the inverted arch; on 3 November 2019, the inverted arch was cracked and lifted upwards in the unlined tunnel section (K4 + 913.3 to K4 + 924). Meanwhile, support in the tunnel section with large deformation of surrounding rocks also suffered from a series of damaging events such as cracking of the shotcrete and yielding of its steel arch supports, posing a threat to the stability and long-term safety of the surrounding rock-support system in the construction and operating periods of the tunnel. Figure 5 shows the consequences of the large deformation and damage to the primary support in the tunnel section.

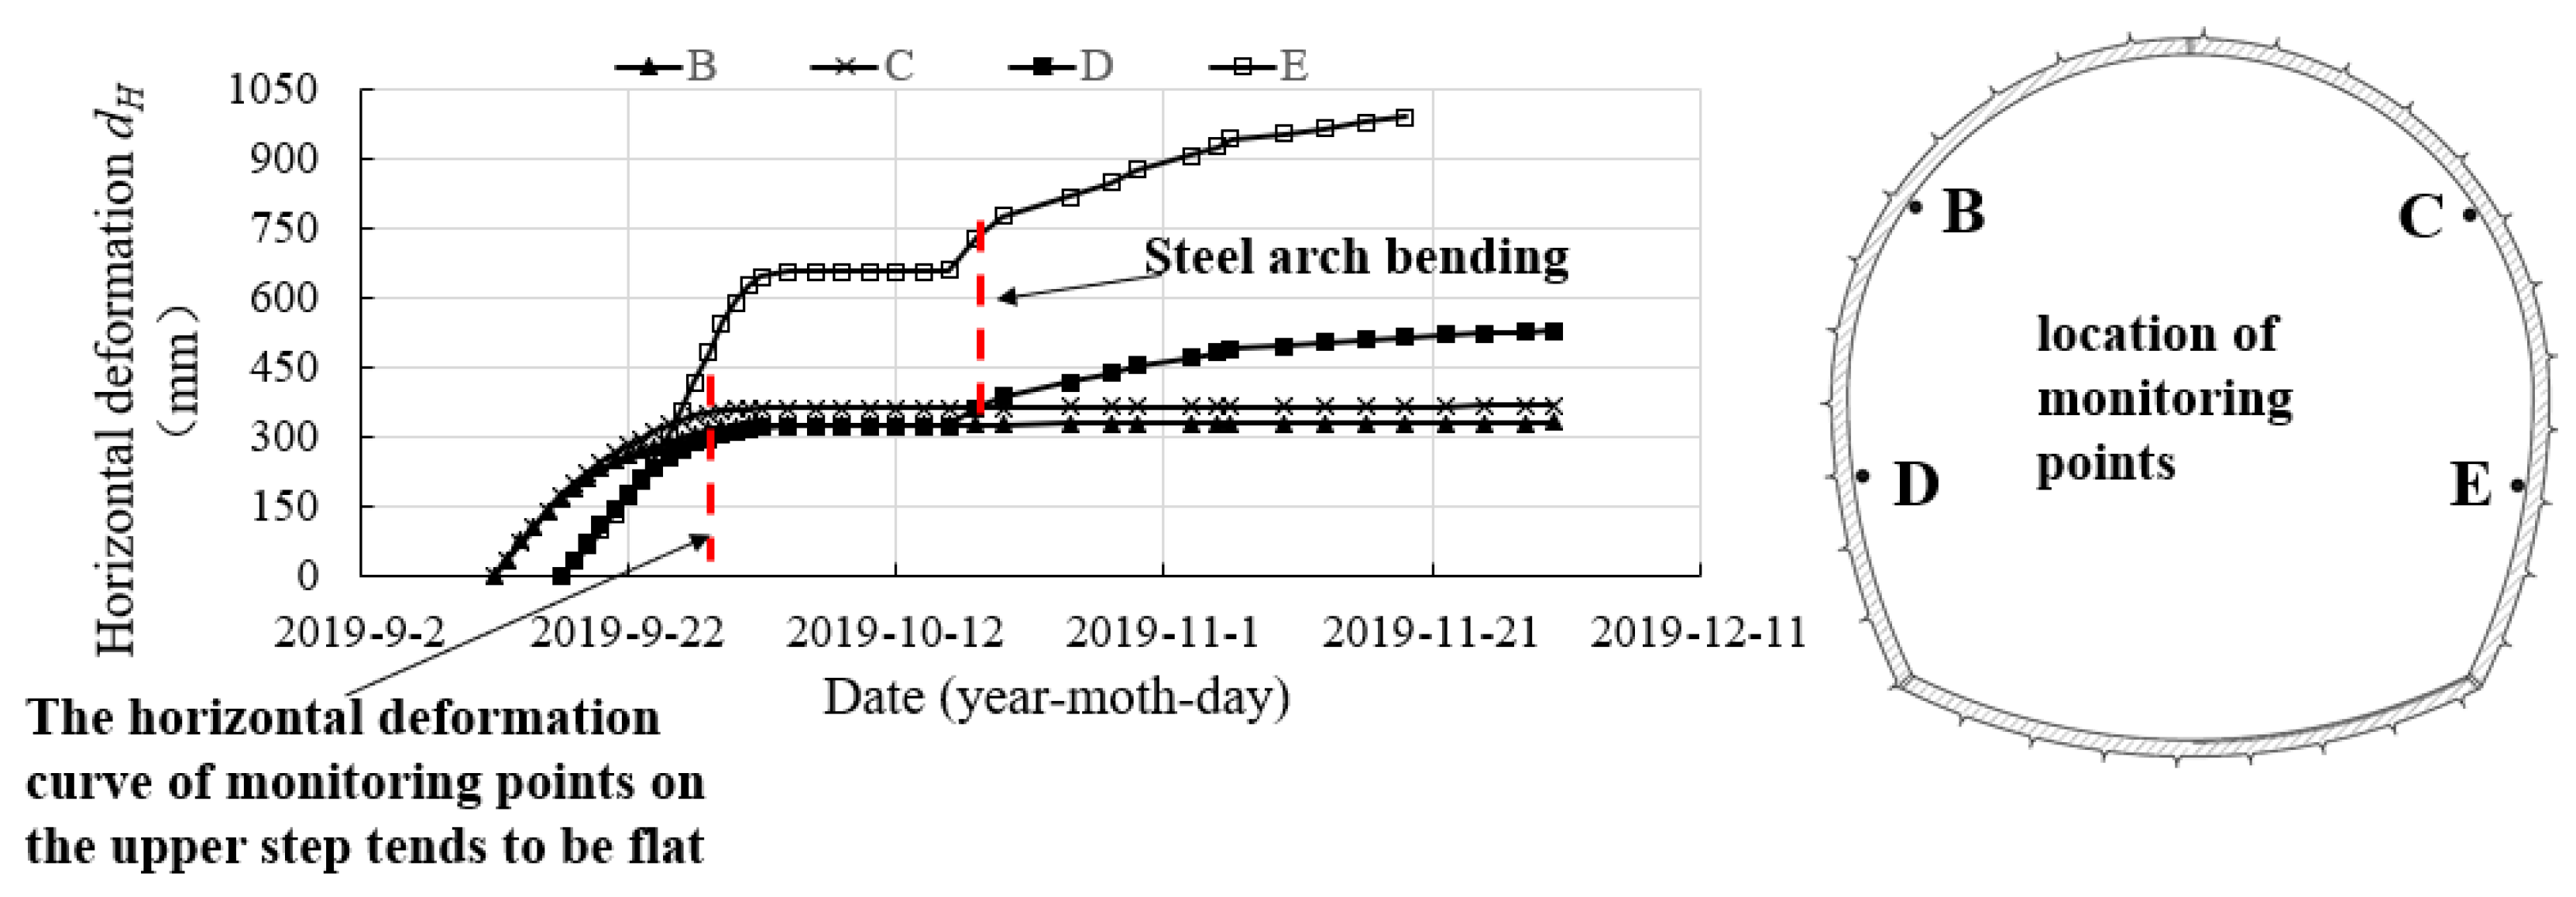
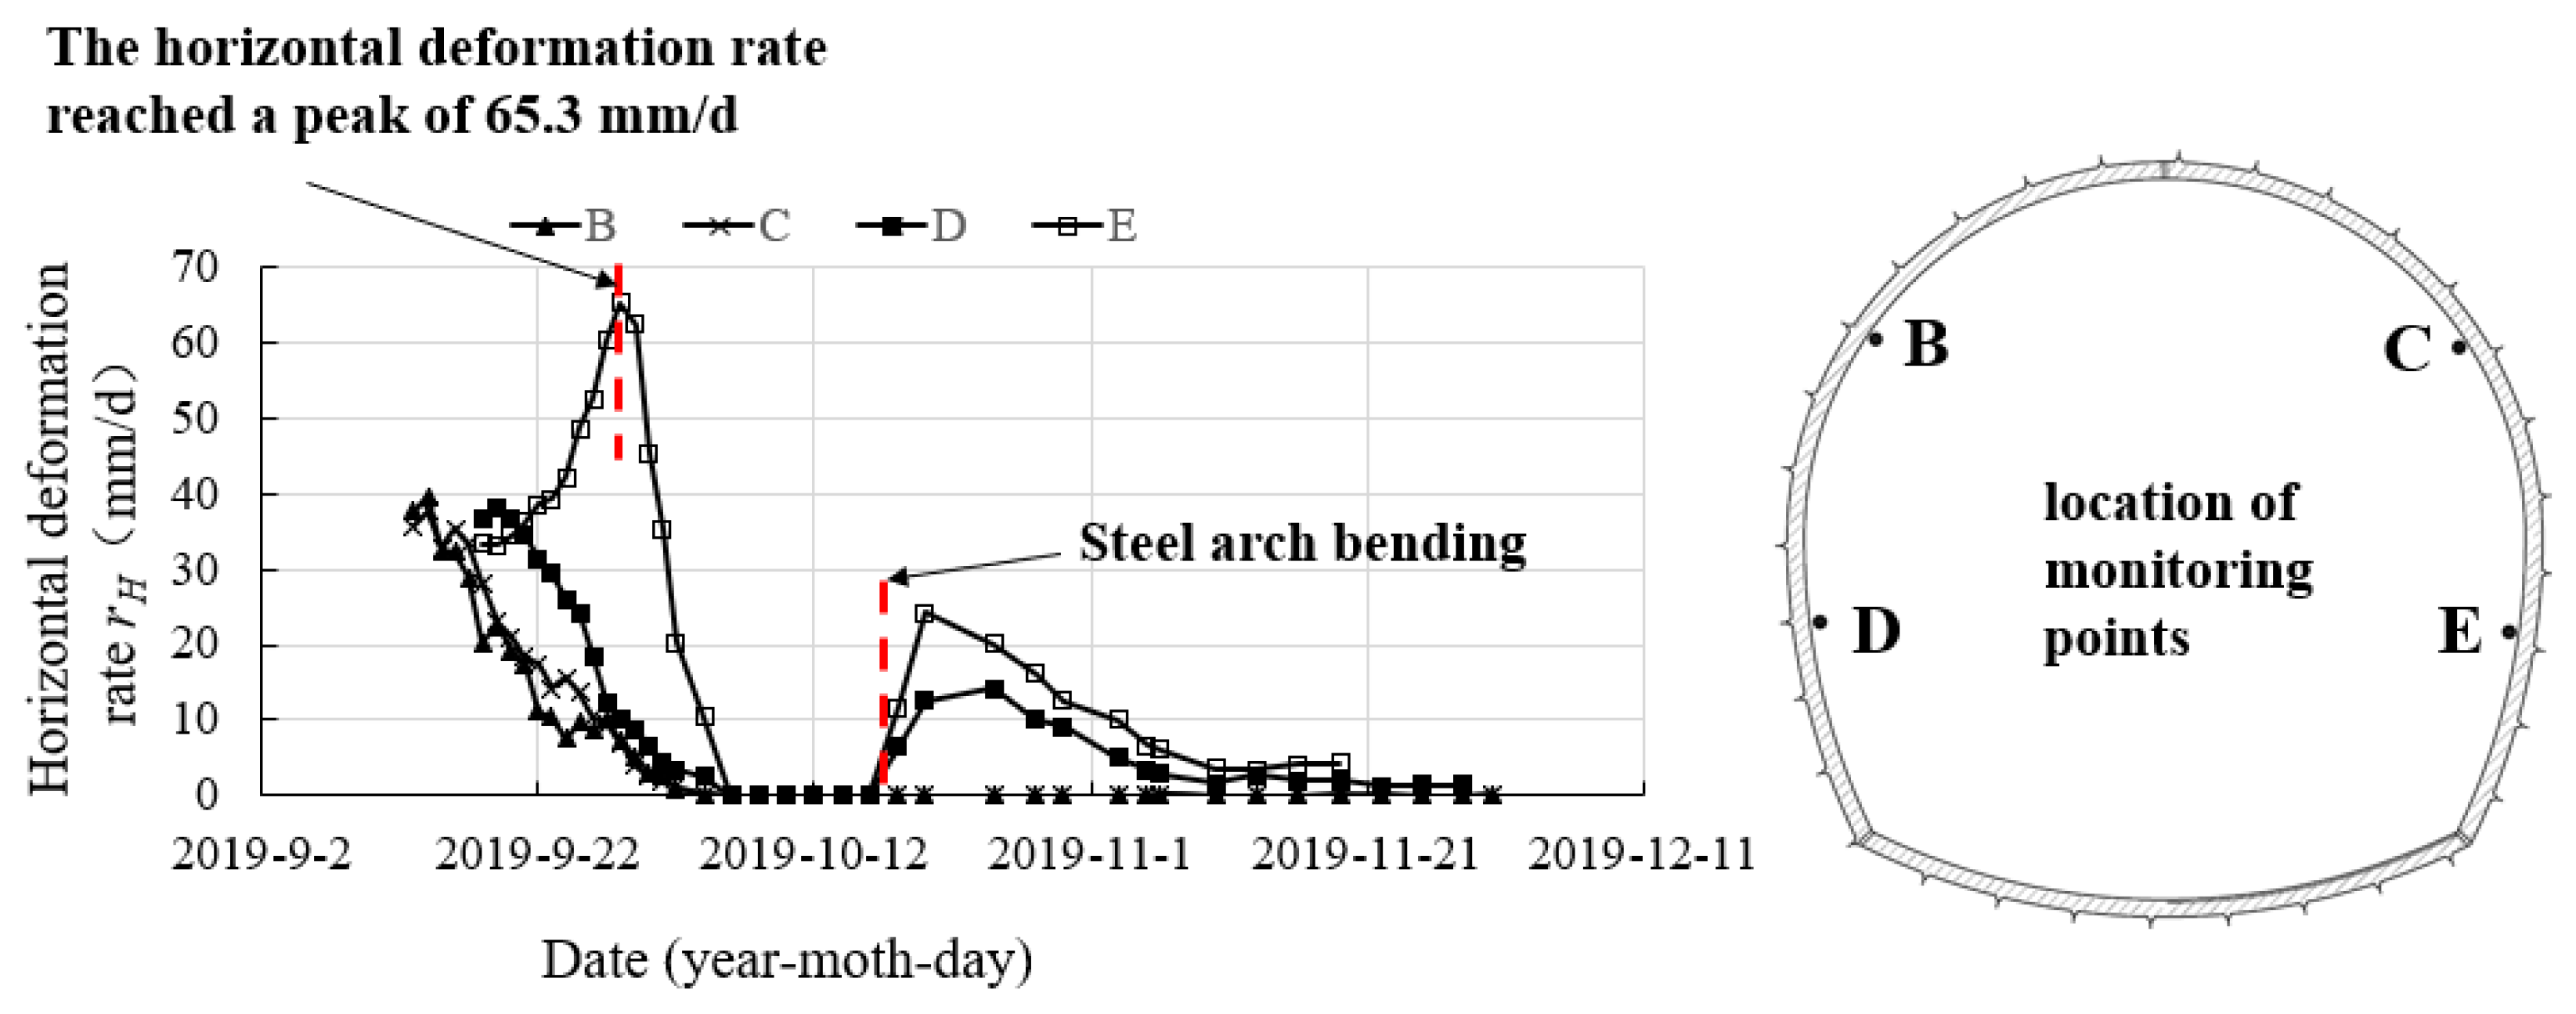
3.2. Analysis of Monitoring Data

The cross section K4 + 923 under monitoring is within the tunnel section K4 + 904 to K4 + 924 where large deformation occurred. The monitoring results of the cross-section include those at points B and C in the upper bench and points D and E in the lower bench. The points in the upper bench of the cross-section were monitored from 12 September 2019. Figure 6 shows the horizontal deformation curves of surrounding rocks on the cross-section at K4 + 923. Figure 7 shows the horizontal deformation rate curves of surrounding rocks on the cross-section at K4 + 923.
The deformation curves at monitoring points in the upper bench of the cross-section basically change in a consistent trend. The deformation rate always peaked on the second day of monitoring, which was followed by a gradual decrease. The deformation of surrounding rocks tended to gradually converge by 18 September 2019 (the 16th day of monitoring). By 30 November 2019 (the last time the monitoring points were used to collect data in the upper bench), the cumulative horizontal deformation at point B on the left spandrel was 332.2 mm, and the horizontal deformation rate was 0.2 mm/d; the cumulative horizontal deformation at point C on the right spandrel was 368.4 mm, and the horizontal deformation rate was 0.1 mm/d.
Points in the lower bench on the cross-section at K4 + 923 were monitored from 17 September 2019. The deformation rate at point D on the left-hand wall reached the peak on the second day of monitoring, with a horizonal deformation rate of 38.1 mm/d, which then gradually declined. By 2 October 2019 (the 15th day of monitoring), the deformation of surrounding rocks tended to converge. After starting to monitor the deformation at point E on the right-hand wall, the horizontal deformation inward to the tunnel increased constantly and reached a peak of 65.3 mm/d on 27 September 2019 (the 10th day of monitoring). Then, the rate of deformation gradually declined, and the deformation of surrounding rocks tended to convergence by 4 October 2019 (the 17th day of monitoring). On 18 October 2019, the deformation rates at points D and E in the lower bench tended to increase. The horizontal deformation rate at point D on the left-hand wall was 10.1 mm/d while that at point E on the right-hand wall was 16.2 mm/d on 26 October 2019. Thereafter, the deformation rates at the two points gradually decreased. By 30 November 2019, the cumulative horizontal deformation at point D on the left-hand wall was 530.7 mm with the horizontal deformation rate 1.4 mm/d. The cumulative horizontal deformation at point E on the right-hand wall was 990.6 mm by 19 November 2019, and the horizontal deformation rate was 4.4 mm/d.
According to the above analysis, the deformation curves at different positions in the upper bench of the cross-section K4 + 923 follow similar trends: the deformation rates both reached the peak on the second day of monitoring and then gradually declined, tending to converge on the 16th day of monitoring. In addition, the deformations on the left and right-hand sides in the upper bench are similar. After the first convergence of deformations at two points on the left and right-hand walls in the lower bench of the cross-section, the deformation rates increased significantly on 18 October 2019. According to the distortion of steel arches observed in the field during this time period, it is speculated that because the steel arches were under too much load and therefore locally yielded, the primary support failed to bear the pressure of surrounding rocks. This finally led to the large increase in deformation rates after the first convergence of deformations at points on left and right-hand walls in the lower bench. In addition, the horizontal deformation of the right-hand wall in the lower bench was significantly larger than that of the left-hand wall.

4. Investigation of Causes of the Large Deformation
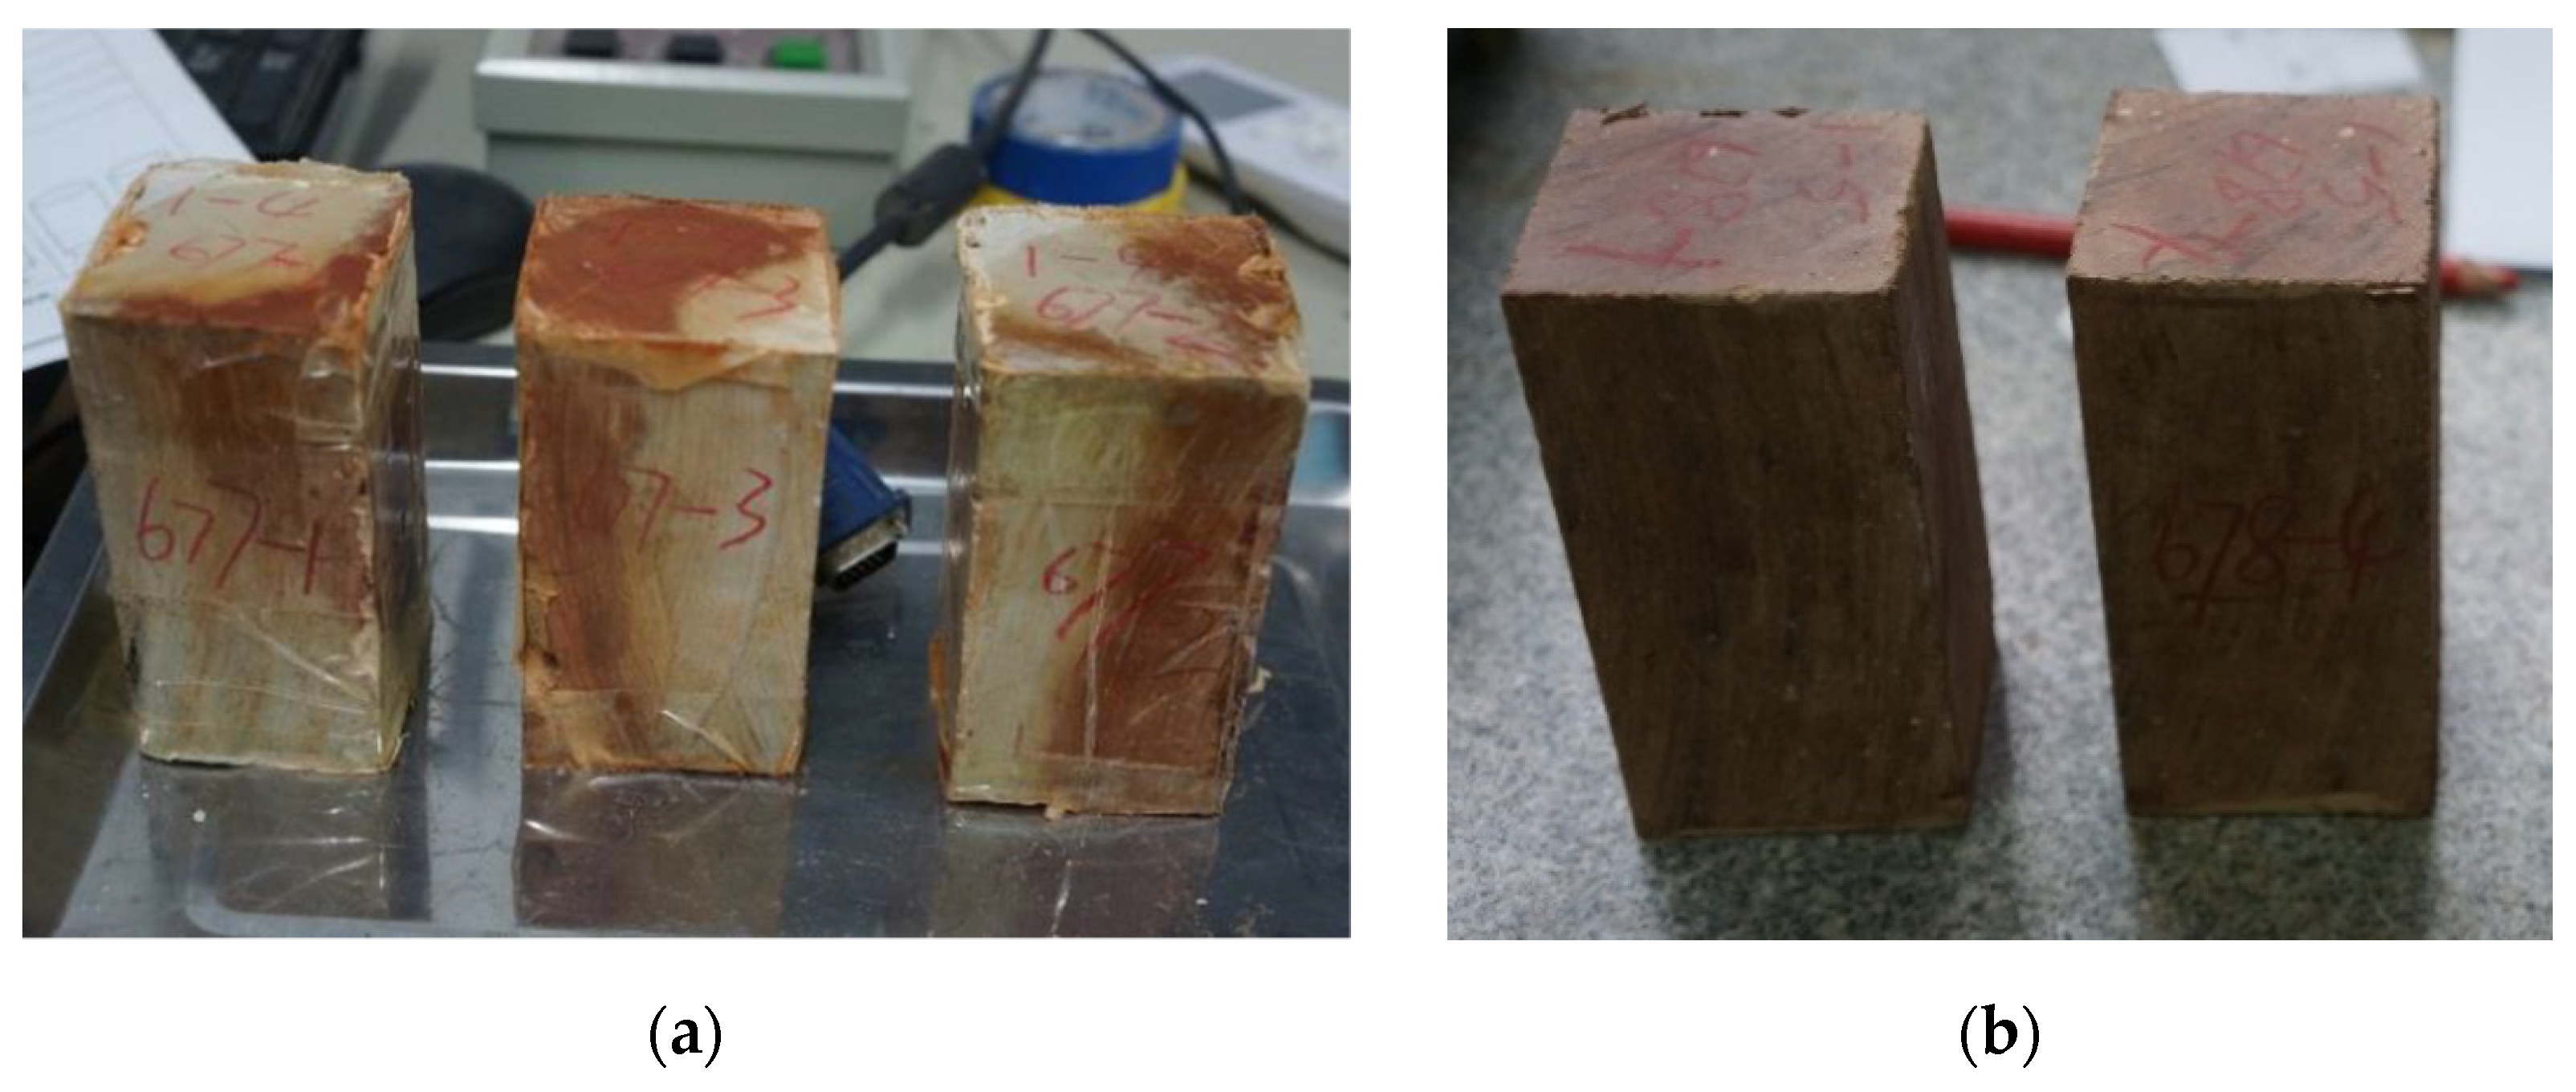
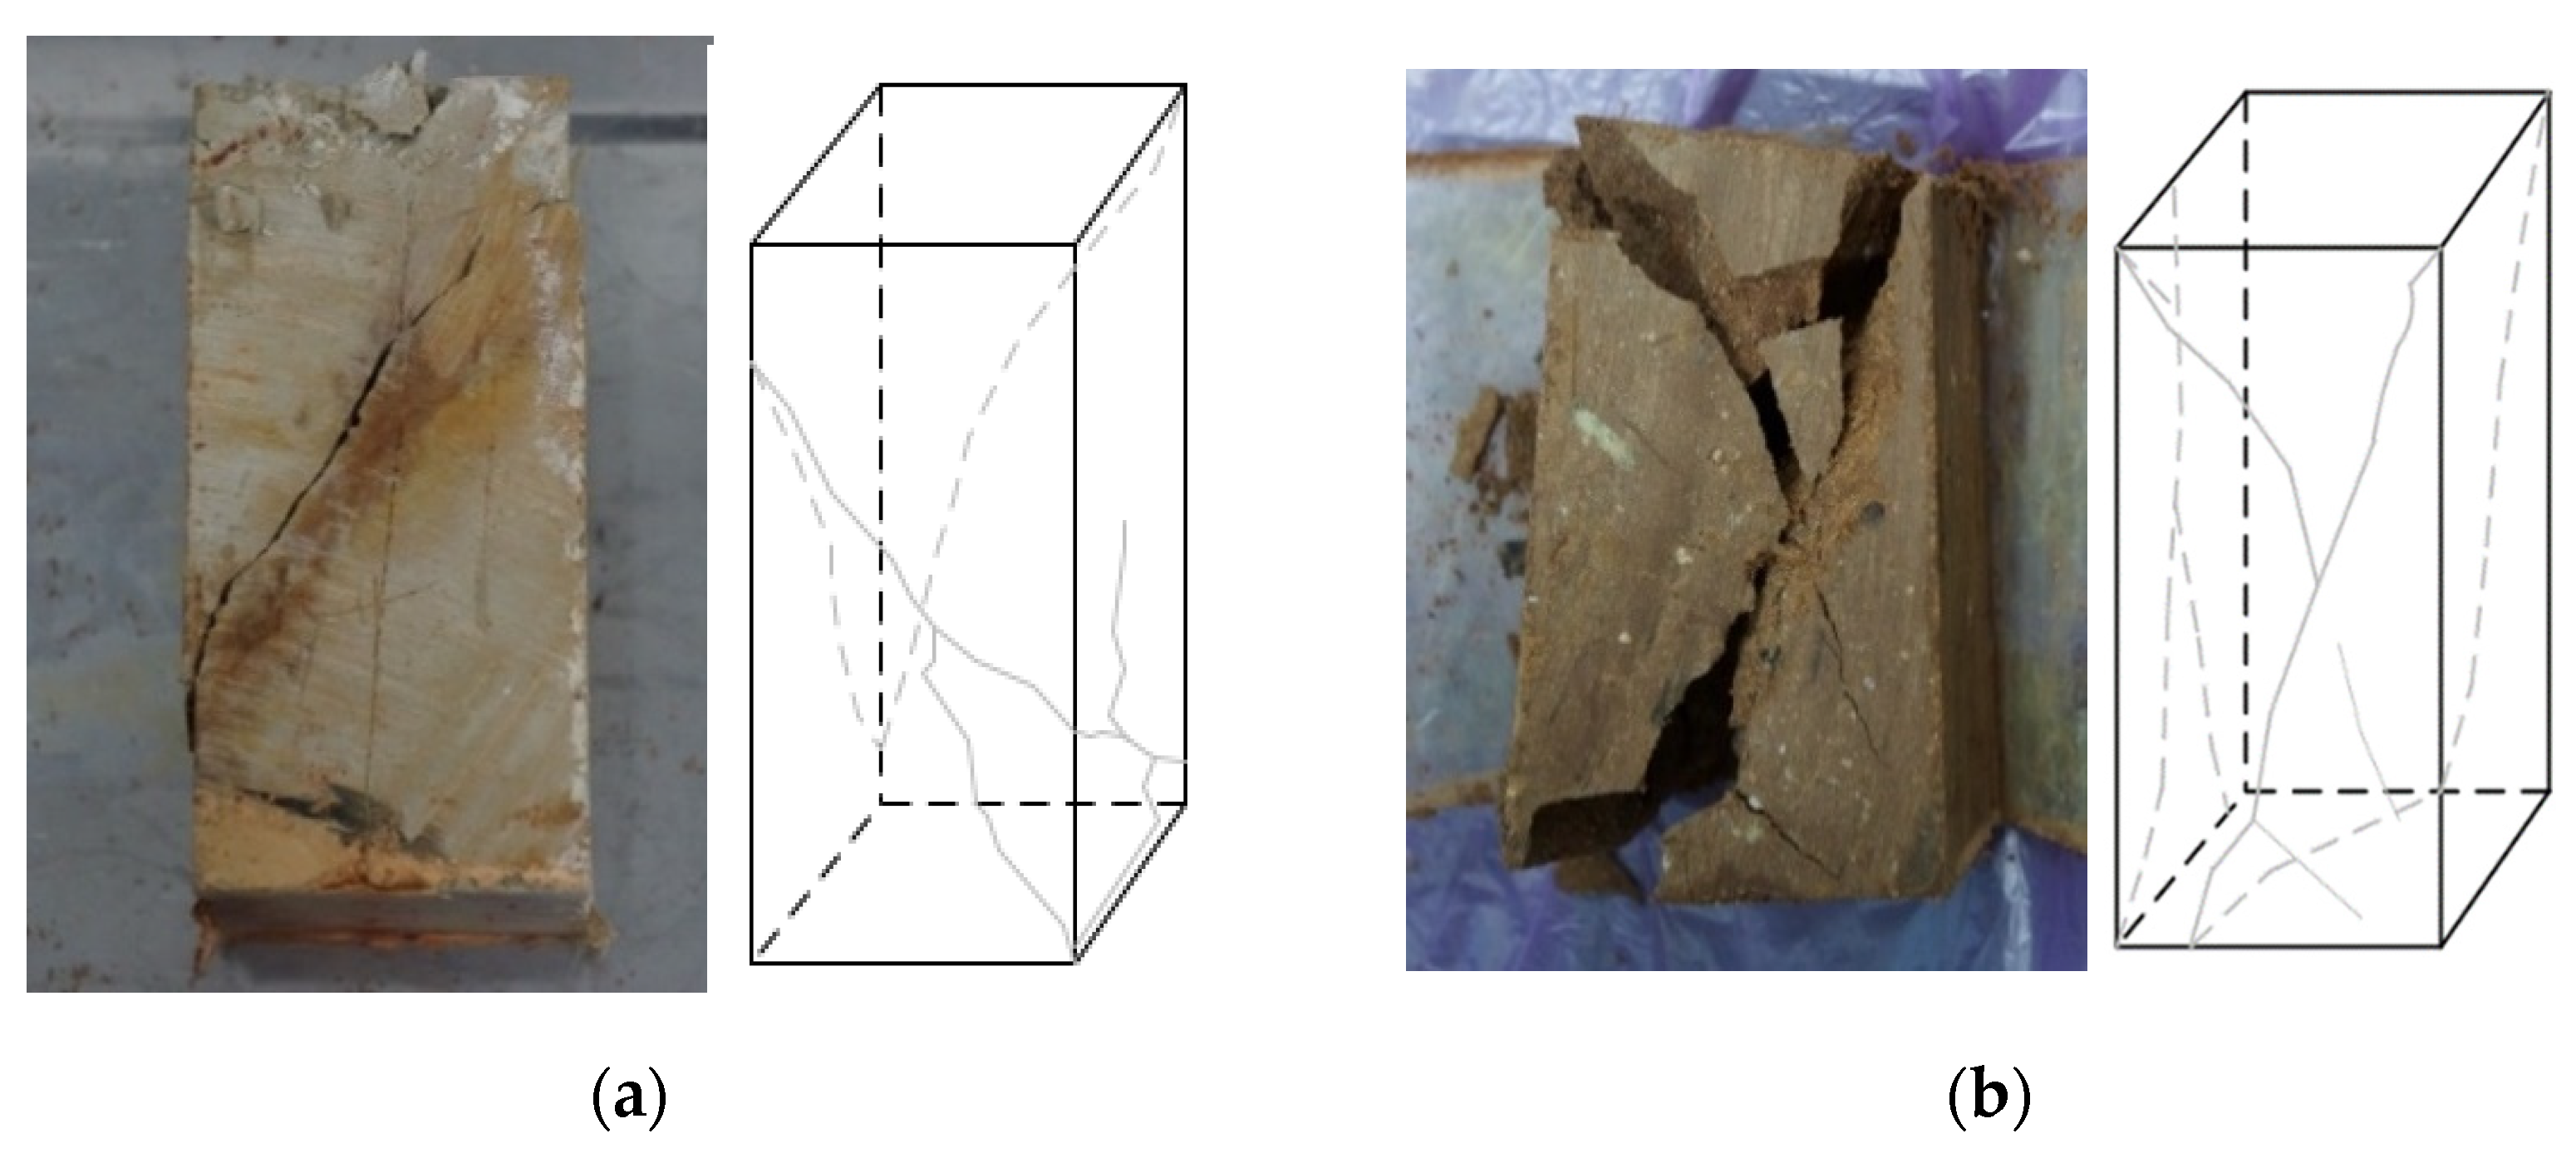
4.1. Rock Strength

The mudstone interbedded with marl and sandy mudstone exposed in the tunnel section with large deformation were sampled in the field, allowing measurement of the physico-mechanical properties of the rocks. The glutenite was not successfully sampled because it was too loose to allow intact specimen recovery. After being sampled in situ, the rock surfaces were sealed with paraffin immediately, and then the samples were wrapped using multiple layers of transparent tape and plastic film to ensure the intactness of samples and decrease water loss during transportation. The rock samples taken from the field were machined into cuboidal specimens measuring 50 mm × 50 mm × 100 mm (Figure 8a,b) and then immersed in water and air-dried to obtain specimens of different water contents. An RMT-301 (RMT-401) rigid servo-motor testing system for rocks was used to test the UCS of rock specimens, and the test results are listed in Table 2. According to the test results, except for some of the two types of rock specimens that have a UCS value between 5 and 15 MPa, the UCS of others is less than 5 MPa, so they are classified as soft to extremely soft rocks. The water content significantly affects the strength of the two types of rocks. To be specific, the UCSs of mudstone interbedded with marl and sandy mudstone decrease to different extents with the increasing water content; at a given water content, mudstone interbedded with marl has a lower UCS than sandy mudstone.
In the natural state, the morphology of the two samples subjected to failure under uniaxial compression is shown in Figure 9. From the observations of the failure states of the two rock samples under uniaxial loading, the two rock samples are shear failures under uniaxial stress. The fracture surface crosses the entire specimen diagonally, creating a complete fracture crack. Additionally, there are localized micro-cracks present on the end faces of the specimen.

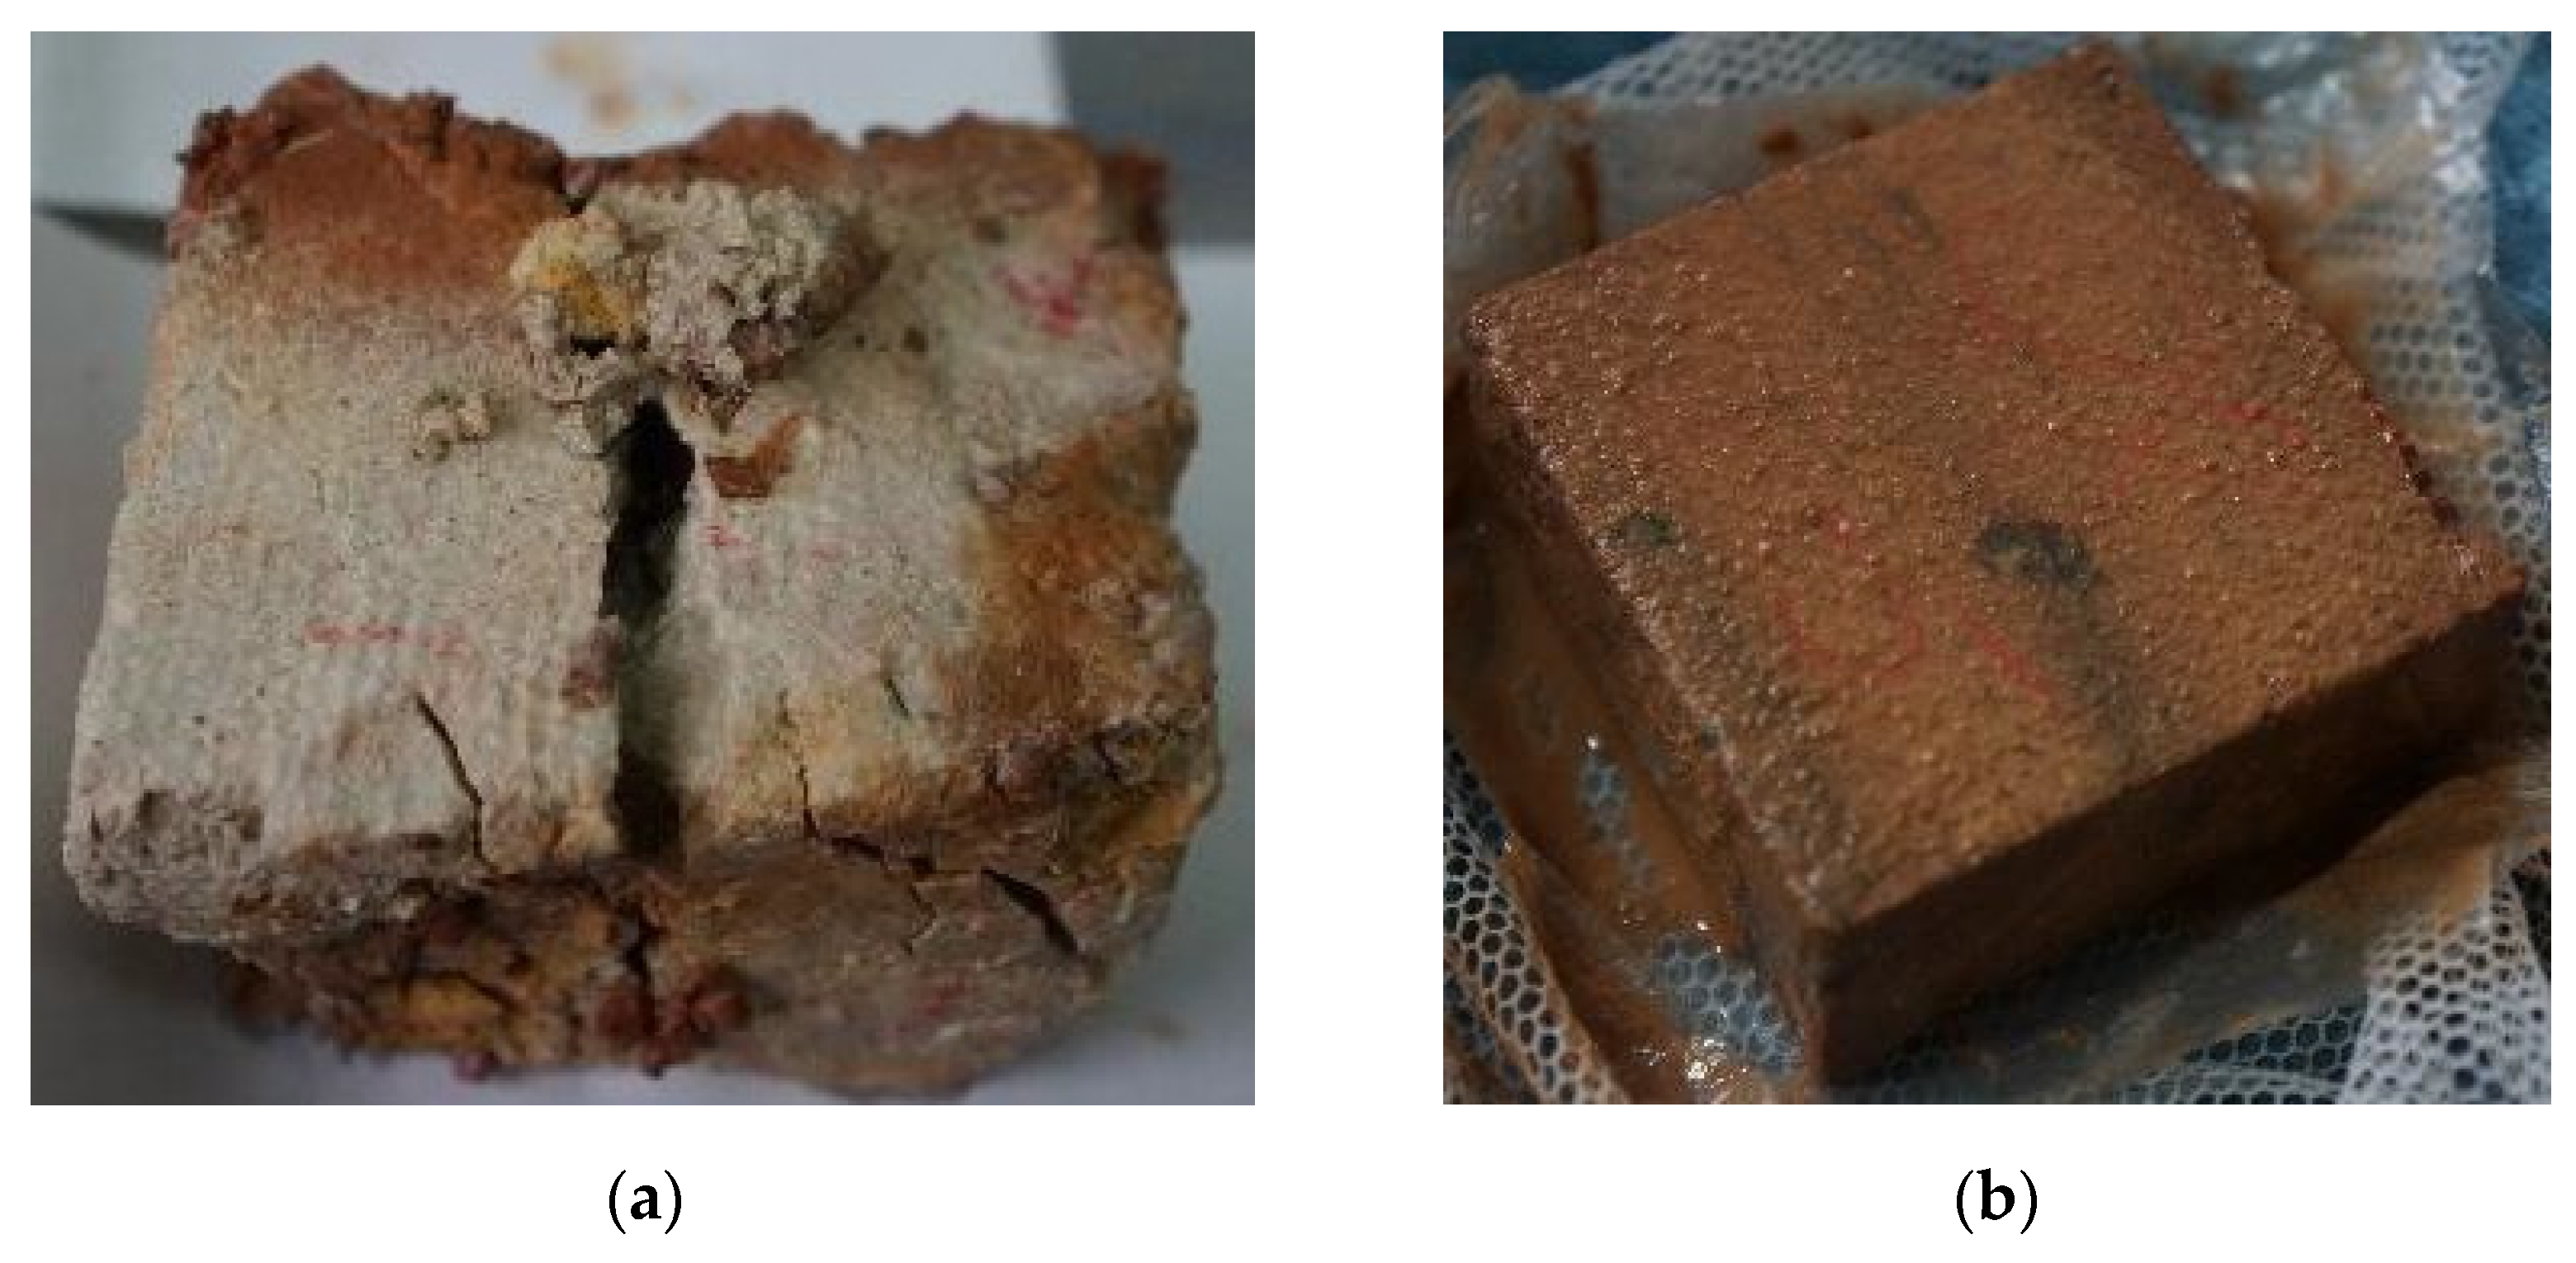
4.2. Swelling of Rocks
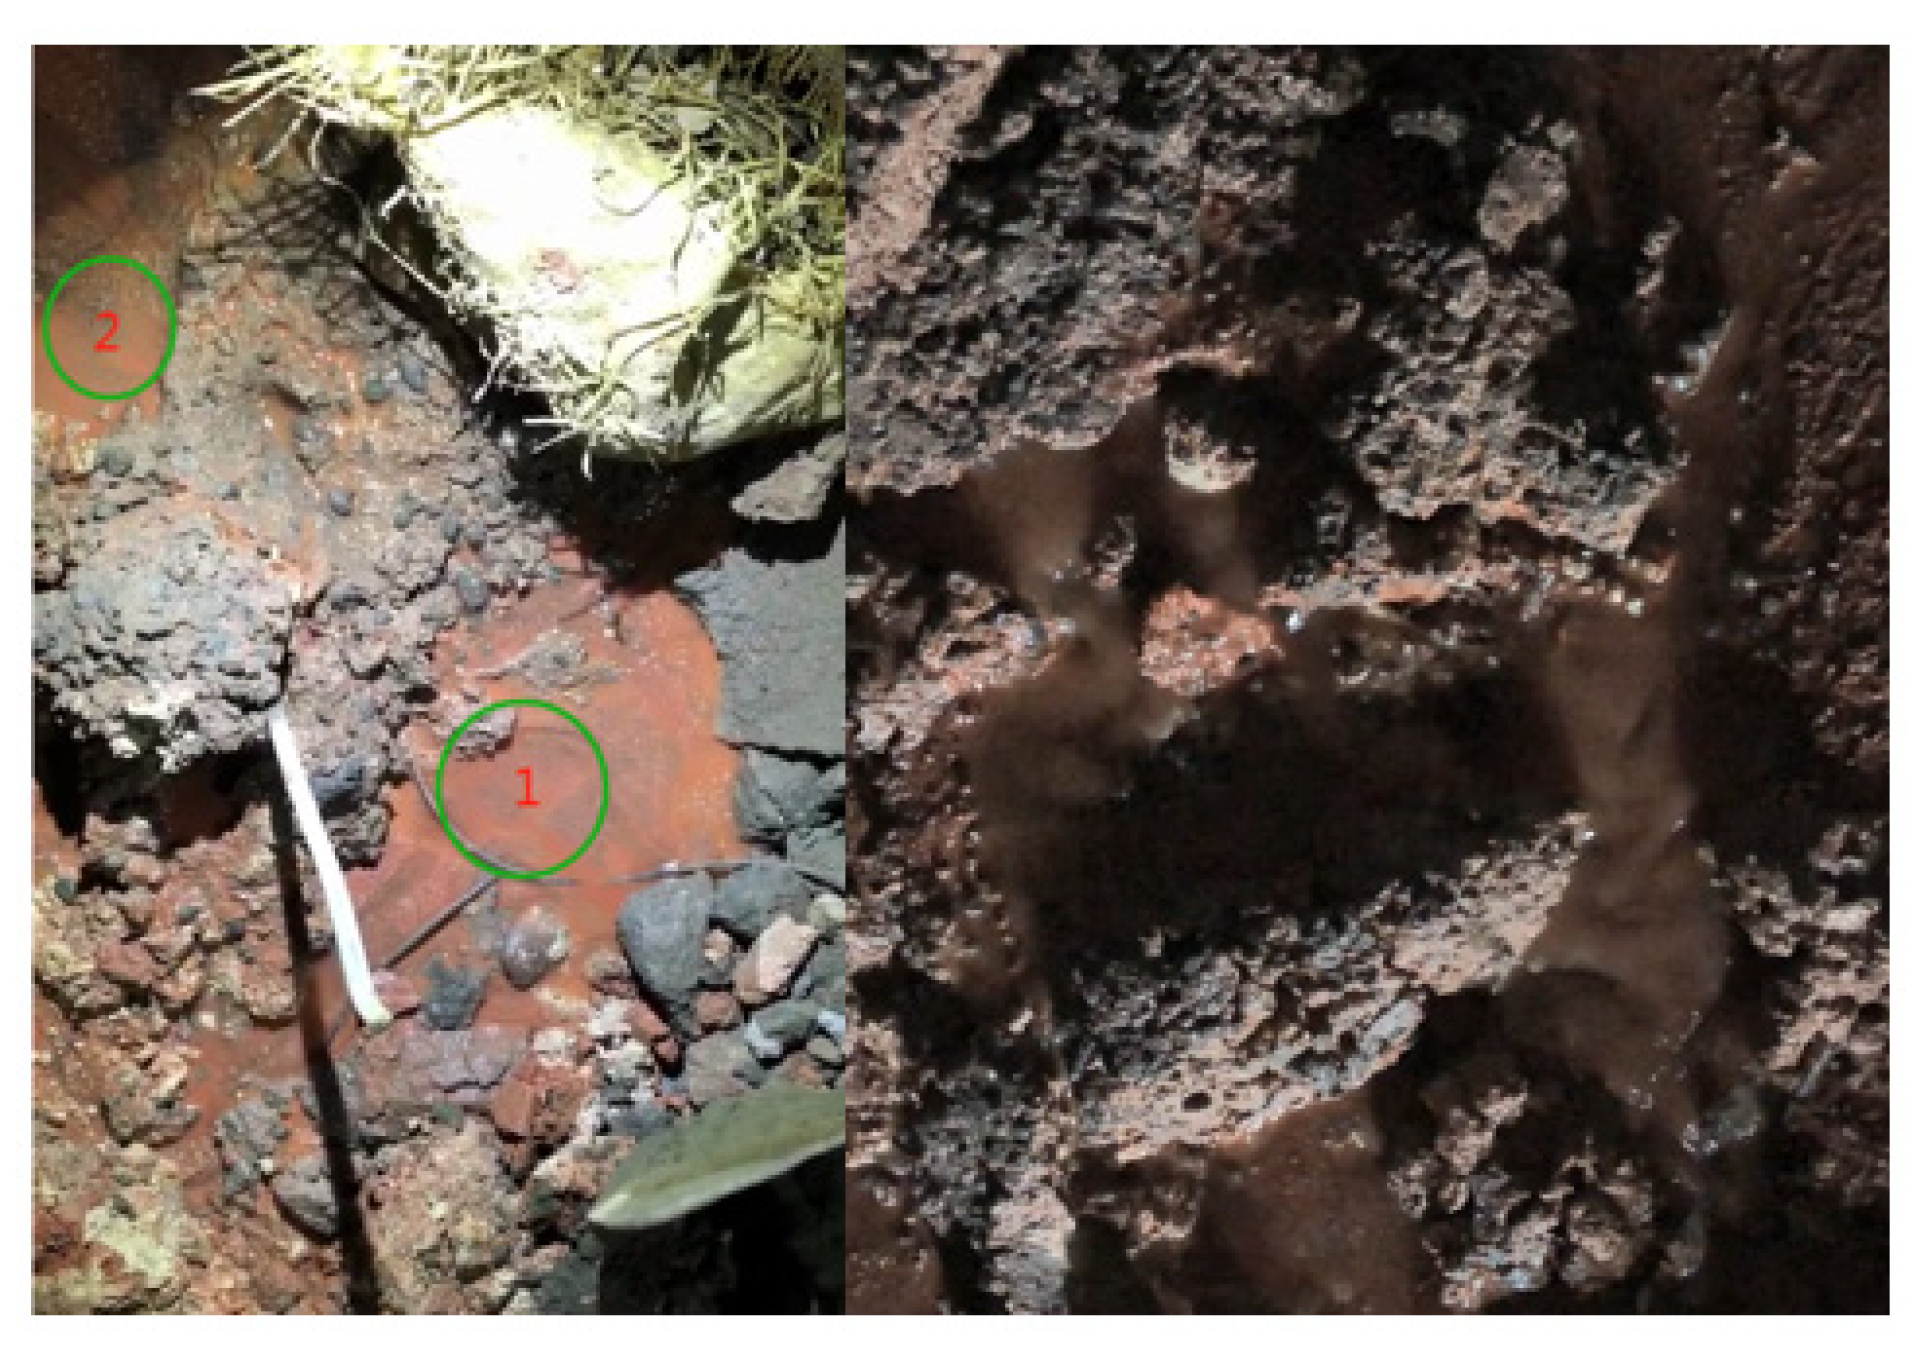
The swelling of rocks rich in clay minerals exposed to water is an important cause of the large deformation. We employed the X-ray diffraction (XRD) technique to analyze the composition of minerals in the rock samples. The testing and inspection were conducted in accordance with the Chinese Specification of testing quality management for geological laboratories (DZ/T0130-2018) [30] and the Joint Committee on Powder Diffraction Standards. The results are shown in Table 3. The minerals in the specimens of mudstone interbedded with marl are dominated by montmorillonite and quartz, which separately account for 34% and 30%, followed by illite, calcite, and feldspar. Calcite and montmorillonite are the dominant minerals in the specimens of sandy mudstone and they separately account for 45% and 30%; they are followed by illite, quartz, and feldspar. Both rock samples are enriched with clay minerals such as montmorillonite and illite, which confer upon them the characteristic of swelling.
The swelling tests (Table 4) indicate that the free swelling percentage and swelling pressure of mudstone interbedded with marl are 4.07% to 6.38% and 0.41 to 0.55 MPa, respectively; those of sandy mudstone are separately 1.31% to 1.51% and 0.22 to 0.34 MPa. It is evident that the mudstone interbedded with marl exhibits significantly higher swelling percentage and swelling pressure compared to sandy mudstone. The basis for the swelling tests is in accordance with the Chinese code for rock tests in water and hydropower projects [31].
Meanwhile, a cubic specimen of mudstone interbedded with marl and that of sandy mudstone were selected and immersed in water to investigate their hydrophilicity and observe the changes in their appearance after immersion for 24 h. As shown in Figure 10, mudstone interbedded with marl absorbed water and rapidly swelled after being exposed to water, showing argillation and softening characteristics. When exposed to water, mudstone interbedded with marl underwent physical and chemical reactions, which resulted in the swelling, breakage, and decomposition of the rock block. This was also mainly because mudstone interbedded with marl contains some clay minerals that have high hydrophilicity. After being immersed in water for 24 h, the rock block changed obviously in the shape and was argillated, losing almost all load-bearing capacity. As for sandy mudstone, only a thin muddy layer was formed on the surface of the specimen after being exposed to water, while the specimen did not change greatly in the appearance and retained its original shape. Some fragments spalled upon pinching the specimen manually.

4.3. Groundwater

The large deformation of tunnels is closely related to activities of groundwater. The tunnel face was basically dry in the initial stage of excavation, and local areas of the glutenite layer were moist. After 7 to 10 days, the glutenite layer had become saturated, which was accompanied by water seepage. After one month, groundwater began to seep from the tensile fractures occurring due to the uplift of the inverted arch at K4 + 914 (Figure 11). It was speculated that water in the tunnel was from the gully, although mudstone can be regarded as impermeable, whose permeability coefficient is generally 10−9~10−7 cm/s [32]. The strata exposed in the middle of the tunnel face were a glutenite layer (NW275°SW∠15°~25°) of high water permeability at an angle of 83° with the tunnel axis (NE12°). According to the direction of the tunnel axis and the occurrence of the glutenite layer exposed during excavation, the end of the glutenite layer is located just beneath the gully, thus forming a channel allowing the migration of groundwater. The formation of plastic zones in the excavation process caused changes in the seepage field, which guided groundwater to flow to the tunnel [33]. Based on the strength tests of the two types of rock samples and the water immersion test, it can be observed that the presence of groundwater has a significant softening effect on the mudstone interbedded with marl beneath the glutenite layer. This softening effect results in a considerable reduction in the strength of the rock mass. Furthermore, the presence of groundwater induces seepage forces within the rock mass. As the water flows through the rock mass, it exerts pressure on the rock grains, causing them to displace and facilitating the deformation of the rock mass. This seepage force acts as an additional mechanism for weakening the rock mass and reducing its strength. Overall, the combined effects of groundwater softening and seepage forces contribute to the significant reduction in the strength of the mudstone interbedded with marl beneath the glutenite layer. These findings highlight the importance of considering groundwater conditions in the stability analysis and design of engineering projects involving such rock masses.

4.4. Ground Stress

Ground stress also has important influences on the deformation of surrounding rocks. In the Chinese Code for Investigation of Geotechnical Engineering (GB50021-94) [34], the level of the initial stress field is evaluated using the Rc/σmax ratio. Rc/σmax is the ratio of the UCS of saturated rocks to the maximum principal stress. It is equivalent to using 0.25 as the critical value of σcm/P0 to distinguish rocks under medium and severe squeezing [35]. In the above code, the critical value of Rc/σmax is set to 4 to distinguish extremely high ground stress from high ground stress by summarizing geological data from multiple sources. When Rc/σmax is less than 4, a region is regarded as bearing extremely high ground stress.
However, the measured ground stress data collected in tunnels show that the initial ground stress field of the strata where a tunnel is excavated always has a lateral pressure coefficient not equal to unity: that is, the vertical initial stress is not equal to the horizontal one. Therefore, the mechanical responses of surrounding rocks and distribution of the secondary stress field caused by excavation of the tunnel also differ. On this basis, our research group proposed the criterion for large squeezing deformation considering the tectonic stress and excavation disturbance, as given by Equation (1) [1].
{ S S R = R ( 3 λ ) σ 0 max < 1 λ 1 S S R = R ( 3 1 λ ) σ 0 max < 1 λ > 1
where SSR represents the calculated strength–stress ratio of surrounding rocks; R is the UCS of rocks; λ denotes the lateral pressure coefficient of ground stress; and σ0max represents the initial maximum principal stress.
During the project planning phase, geostress tests in the region were conducted using the hydraulic fracturing method and stress relief method. The horizontal maximum principal stress σH is dominant in the elevation range of the tunnel in the region. The vertical stress σz is similar to the horizontal minimum stress σh. The quantitative relationship of the three principal stresses can be expressed as σH = 1.2σz and σH > σhσz. The burial depth of the tunnel section under investigation is 190 m, so the vertical initial ground stress on the tunnel section is about 4.5 MPa by estimating that the overburden above the tunnel has an average bulk density of 2.38 g/cm3. Then, the horizontal maximum principal stress is about 5.4 MPa. According to the laboratory test results, the UCS of mudstone interbedded with marl is about 0.84 MPa. Then, the SSR of surrounding rocks is calculated to be 0.072, which is much less than unity, so it is judged that large squeezing deformation will occur after excavation of the tunnel.

5. Numerical Simulations

Numerical simulations can be an important means of analyzing problems pertaining to rock engineering. A corresponding numerical model was established according to geological conditions revealed after excavation of the tunnel to quantify the softening effect of groundwater on mudstone interbedded with marl below the glutenite layer.

5.1. Initial Simulation Conditions

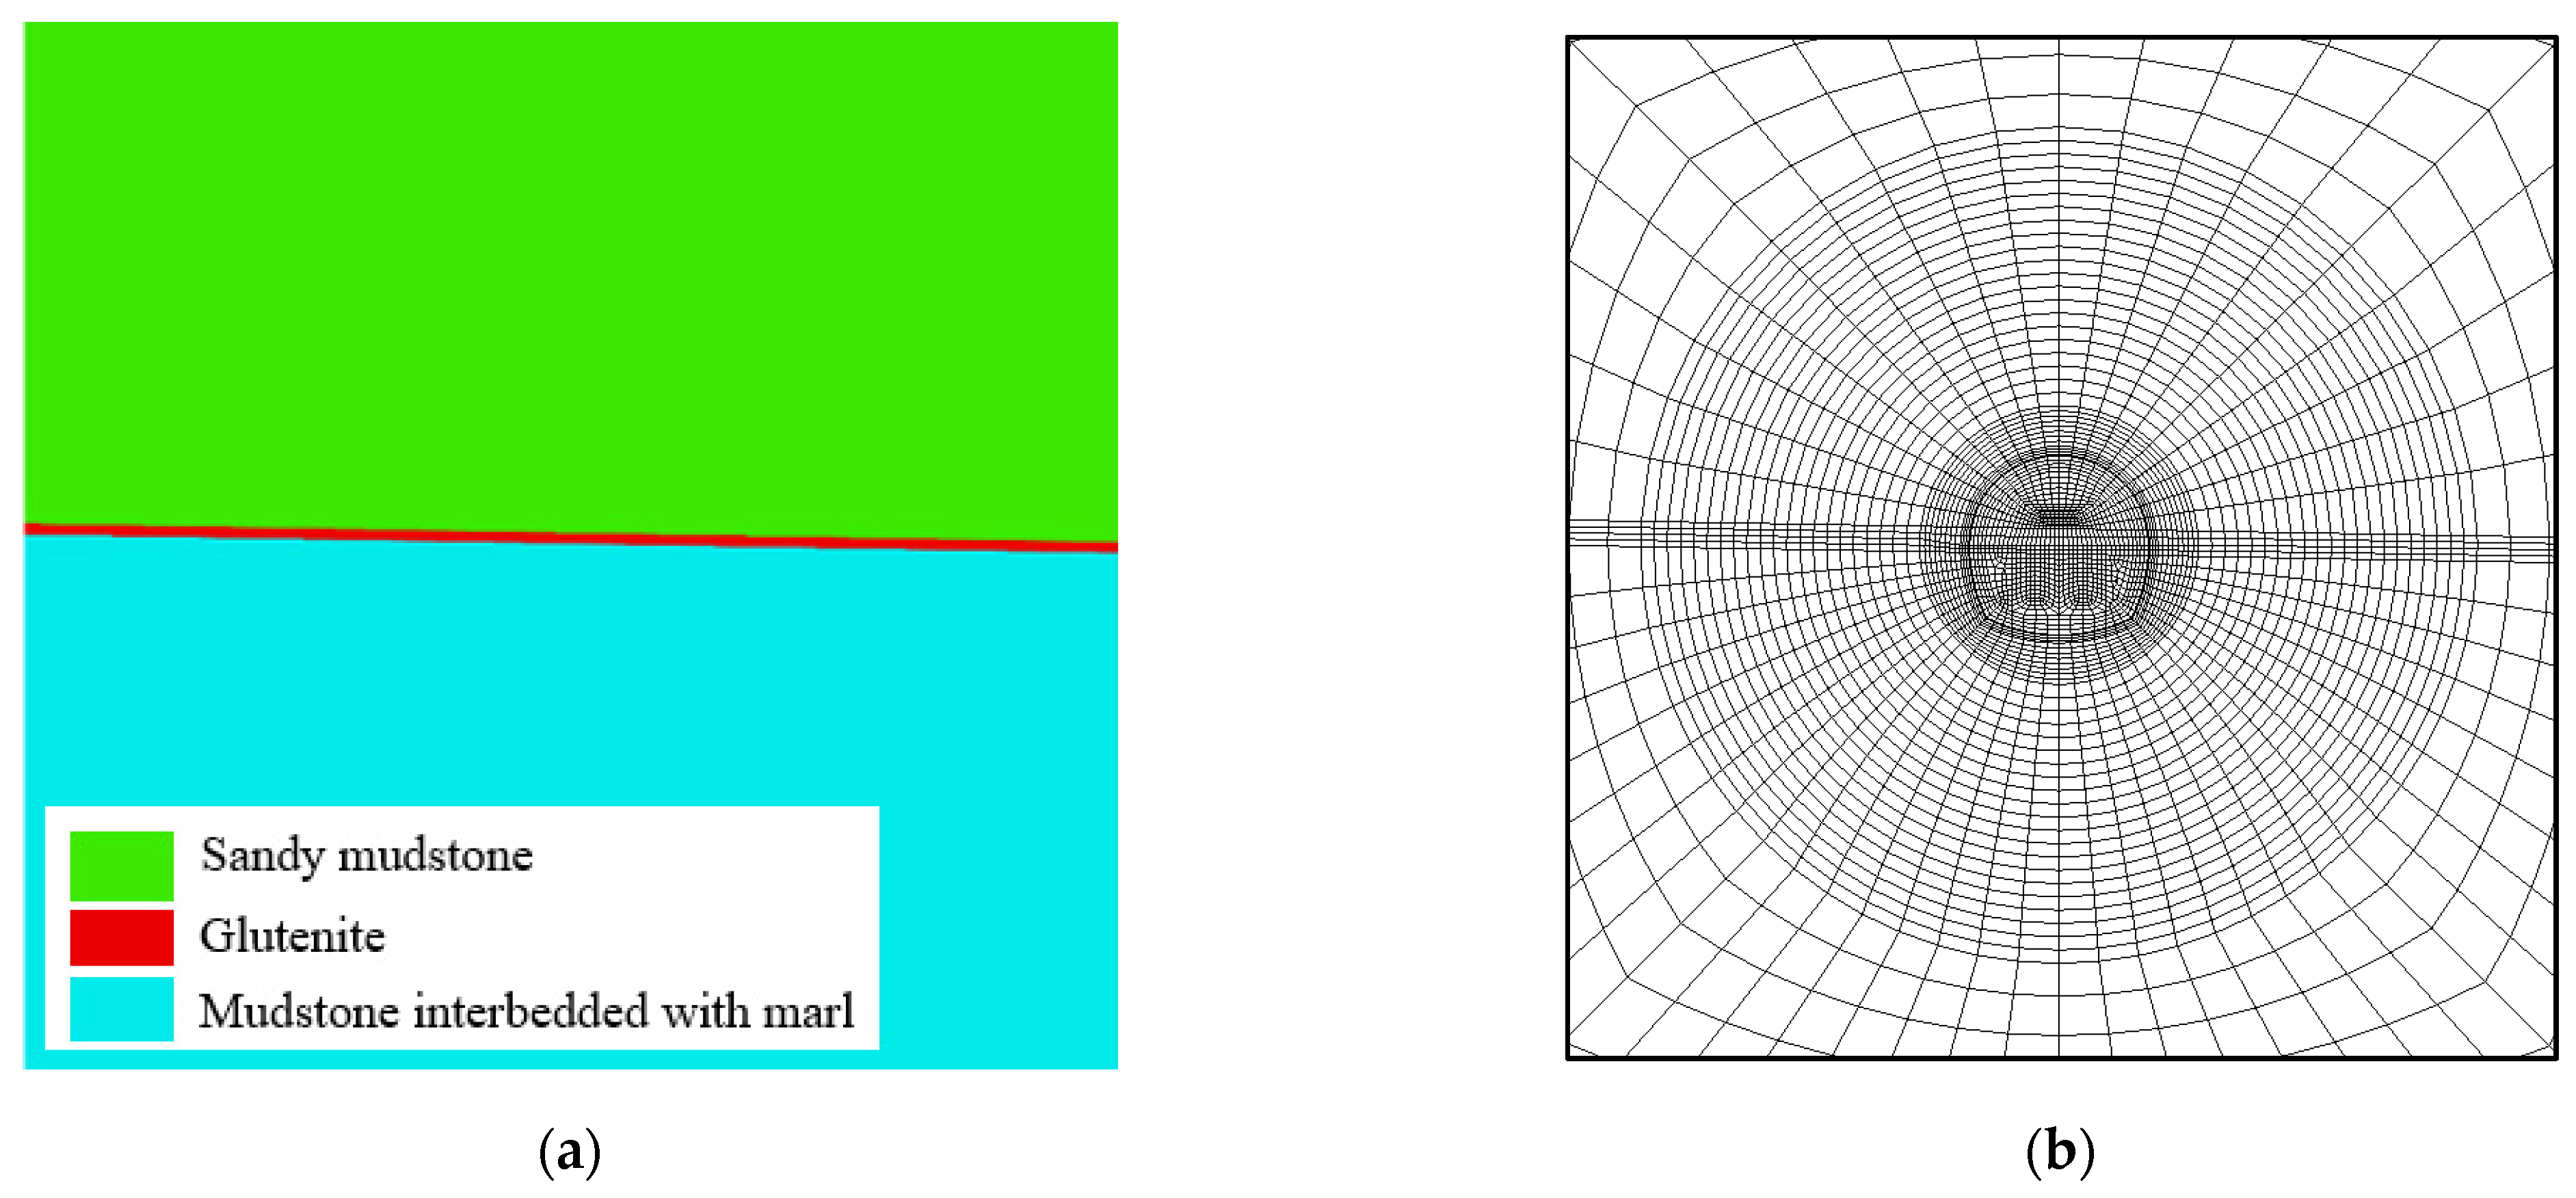
5.1.1. Methods and Model

The commercial software FLAC3D was used to conduct numerical simulation. Figure 12a shows the numerical model established based on the geological conditions revealed by excavation of the cross-section at K4 + 923, and Figure 12b displays the mesh generated around the tunnel. Hexahedral meshing was applied to the whole simulation model, forming 3548 elements and 7156 nodes. The model was in a range with the horizontal and vertical lengths both of 150 m. It is worth noting that the burial depth of the cross-section at K4 + 923 of the tunnel is 190 m, while the thickness of the overburden above the tunnel in the model is 75 m. Therefore, geostatic stress of overlying strata with a thickness of 115 m was also applied to the model in the simulation process. The boundary conditions for the numerical model are as follows: the left and right vertical sides are subject to horizontal restrictions only, while the bottom boundary is subject to both horizontal and vertical restrictions.

5.1.2. Mechanical Parameters of Rocks and Initial Ground Stress Field

The mechanical parameters of the three types of rock masses were provided based on results of laboratory tests and general geological judgment (Table 5). The ideal elasto-plastic constitutive model and Mohr–Coulomb yield criterion were used for simulations.
According to the measurements of in situ stress, the lateral pressure coefficients λH and λh of the horizontal maximum and horizontal minimum principal stresses were determined to be 1.2 and 1.0, respectively. Then, the initial in situ stress field of the simulation mesh could be obtained based on the two values.

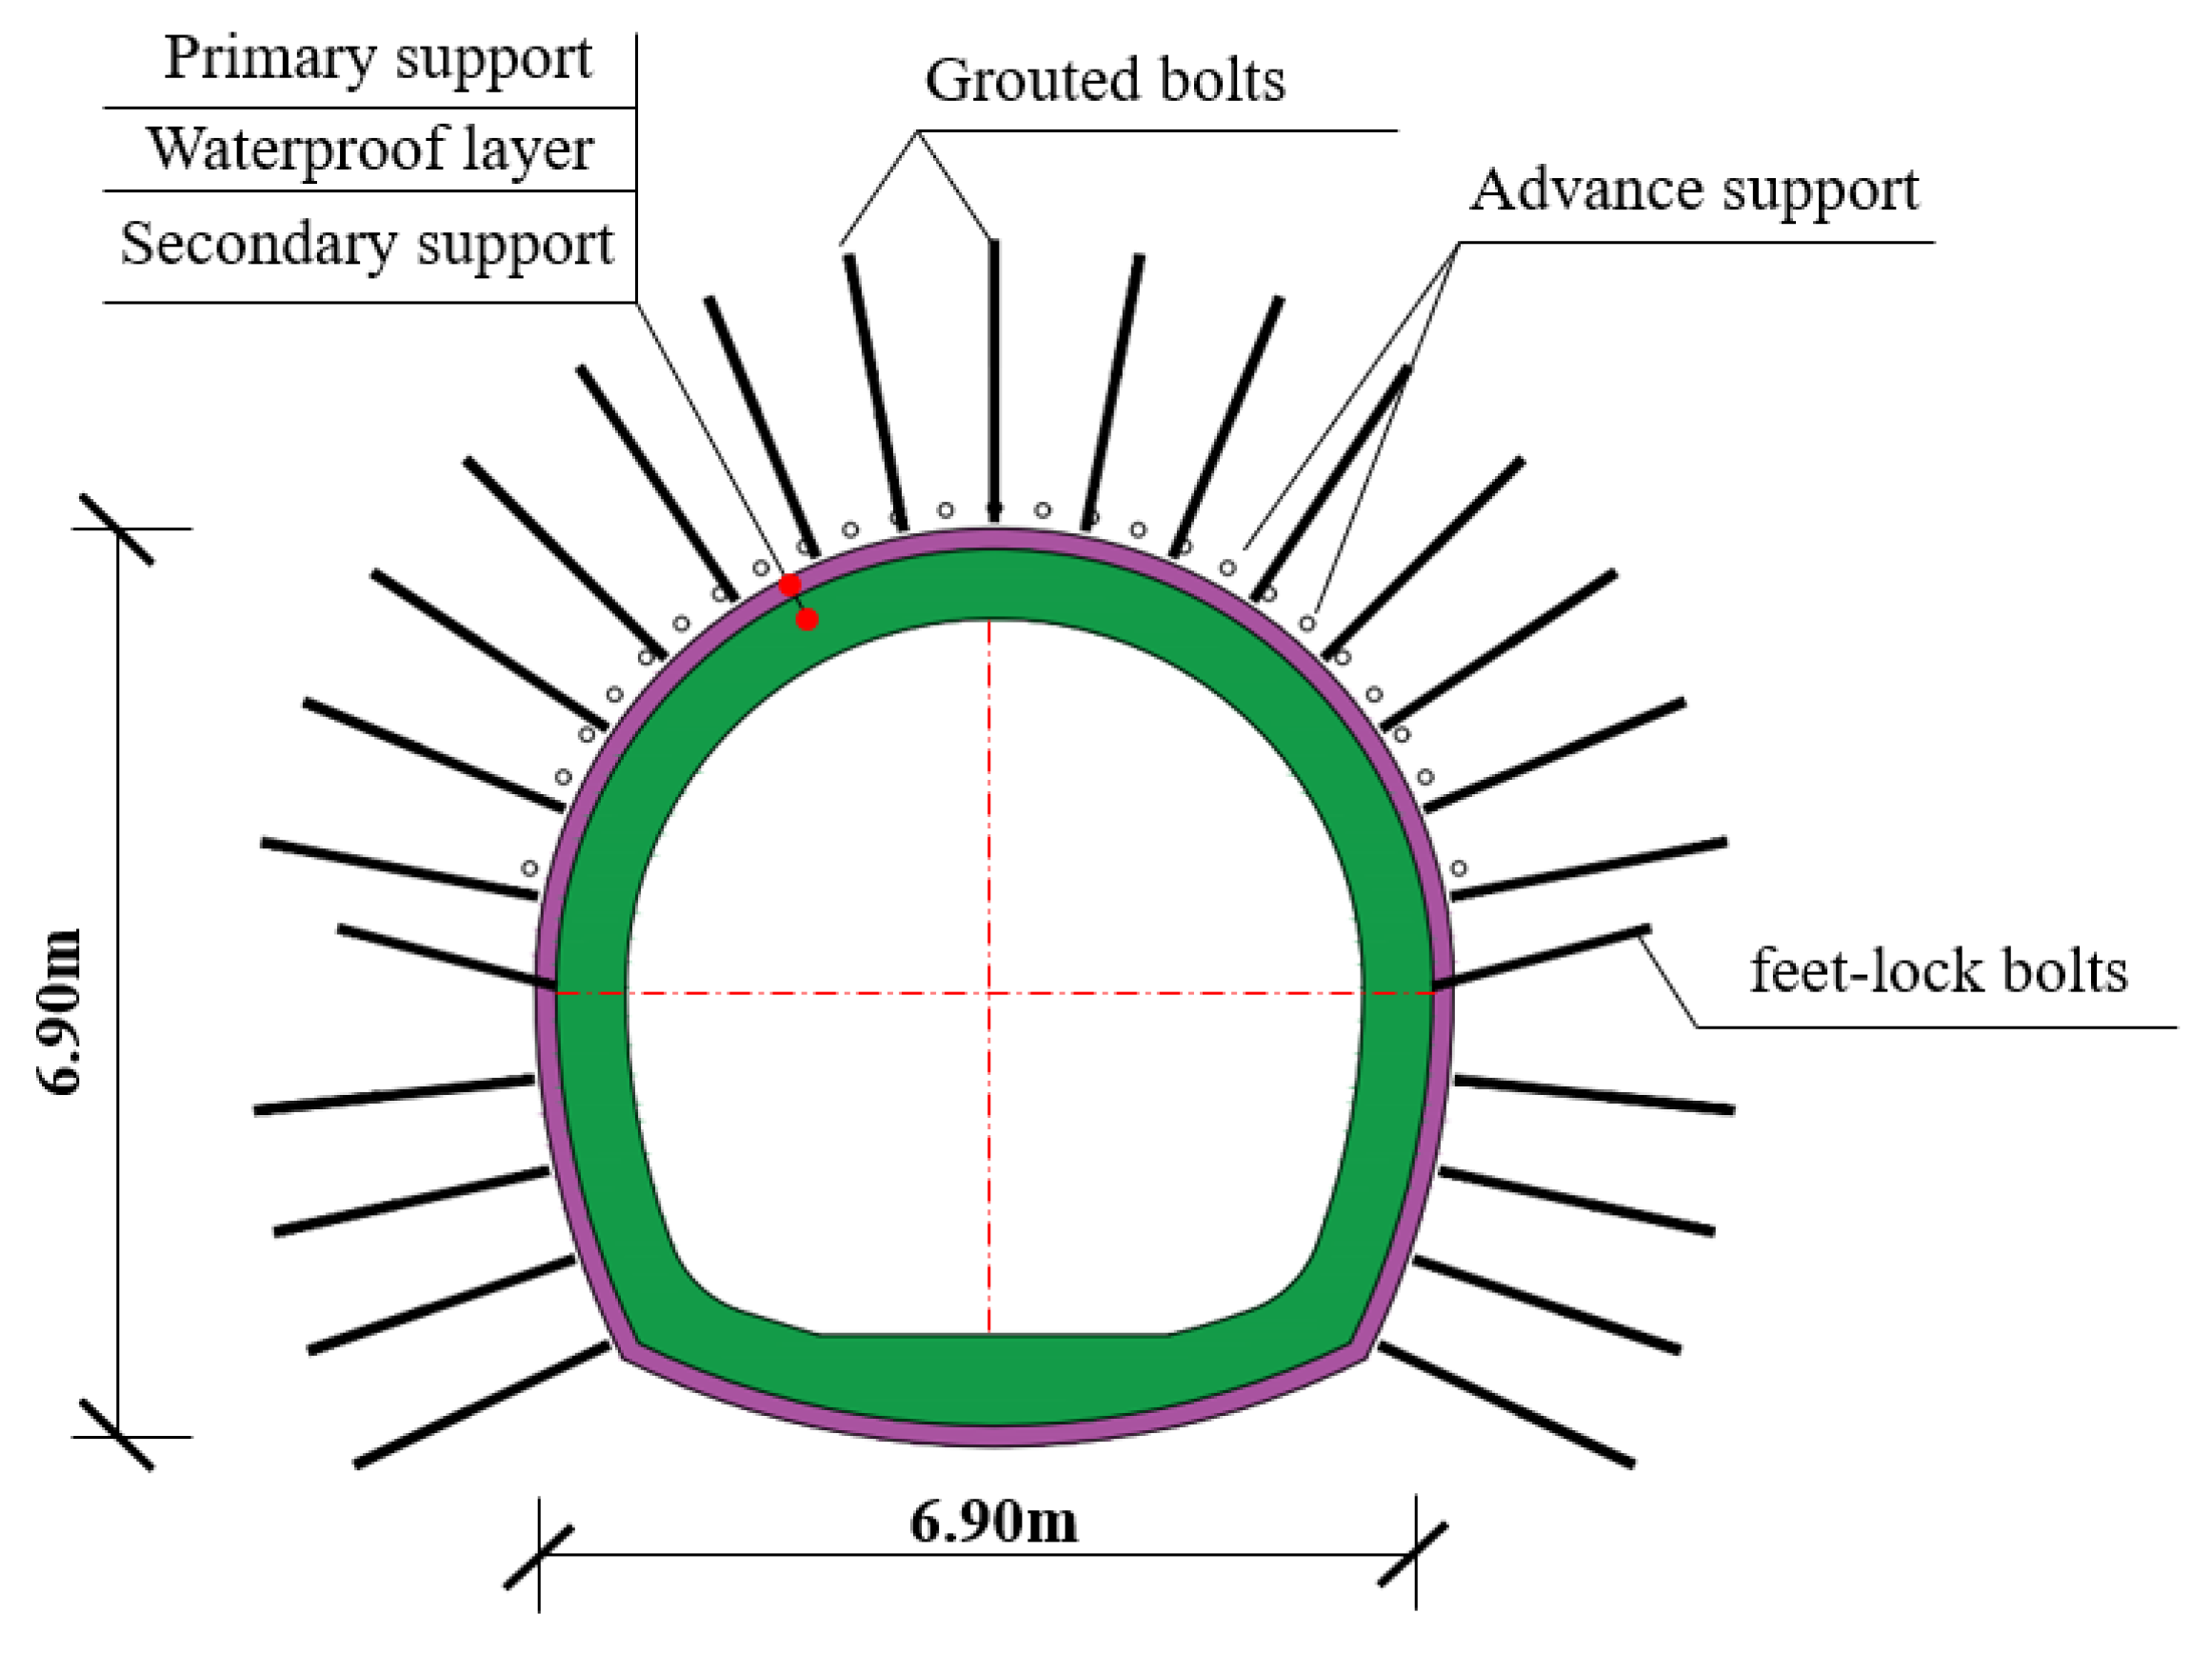
5.1.3. Support Measures of the Tunnel Considered in the Simulation

The support measures implemented during the tunnel excavation are outlined in Table 1. For the numerical simulation, distinct elements, namely cable, beam, and solid elements, were employed to represent the anchor bolts, steel arch, and shotcrete, respectively. The cable and beam elements are structural components integrated within FLAC3D. It is important to note that the simulation was conducted using a two-dimensional model; thus, the advance support measures specified in Table 1 were not considered in the simulation.

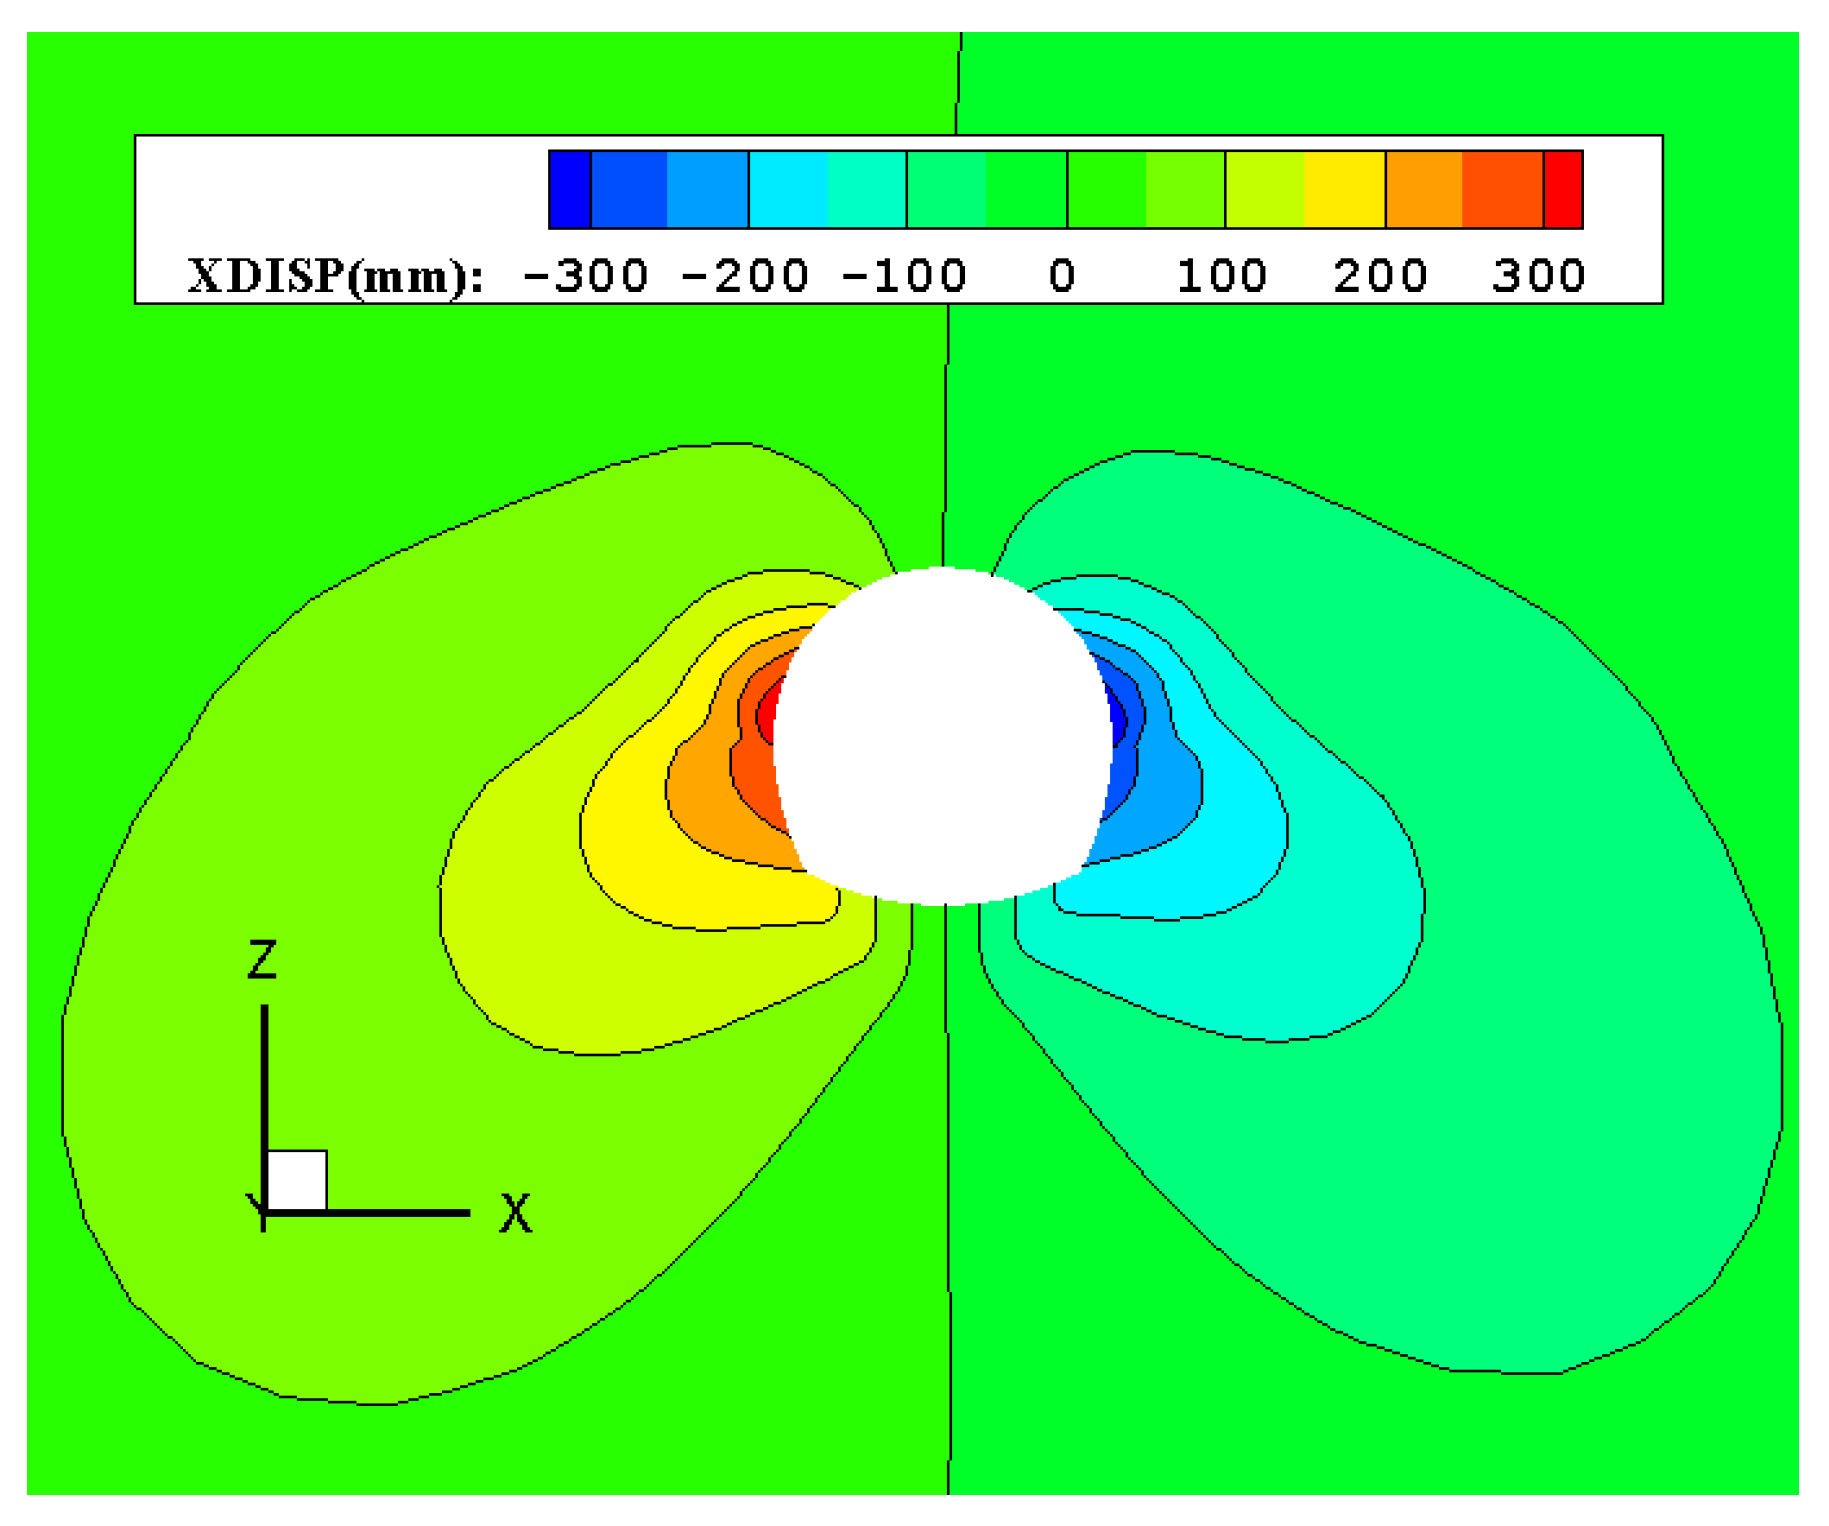
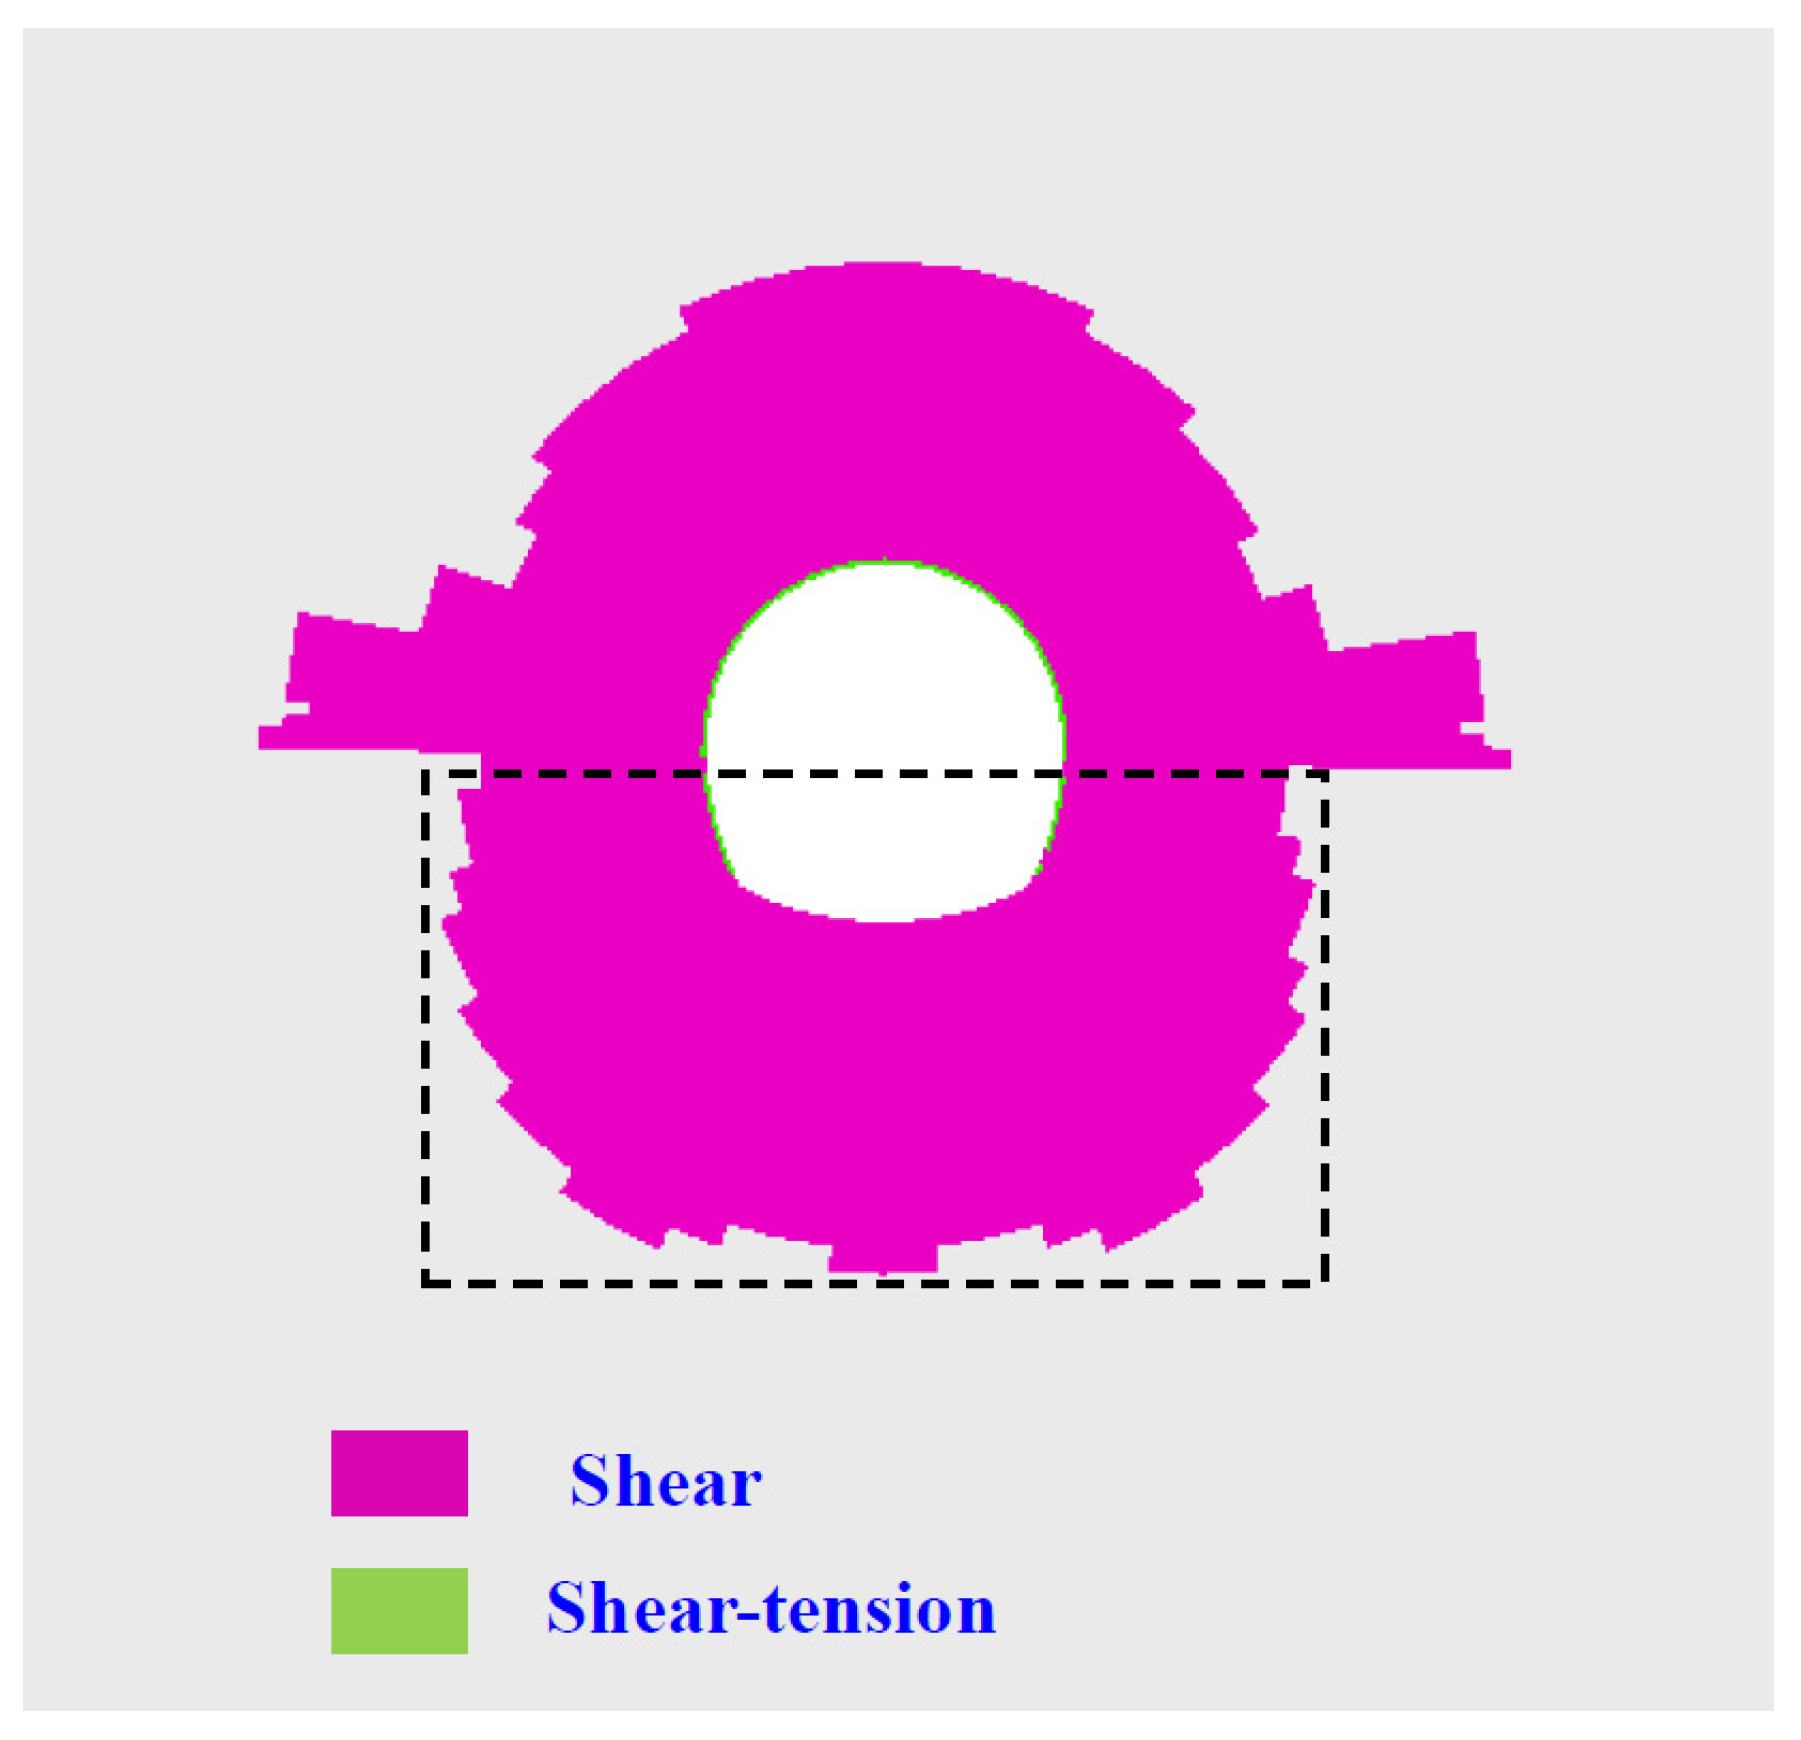
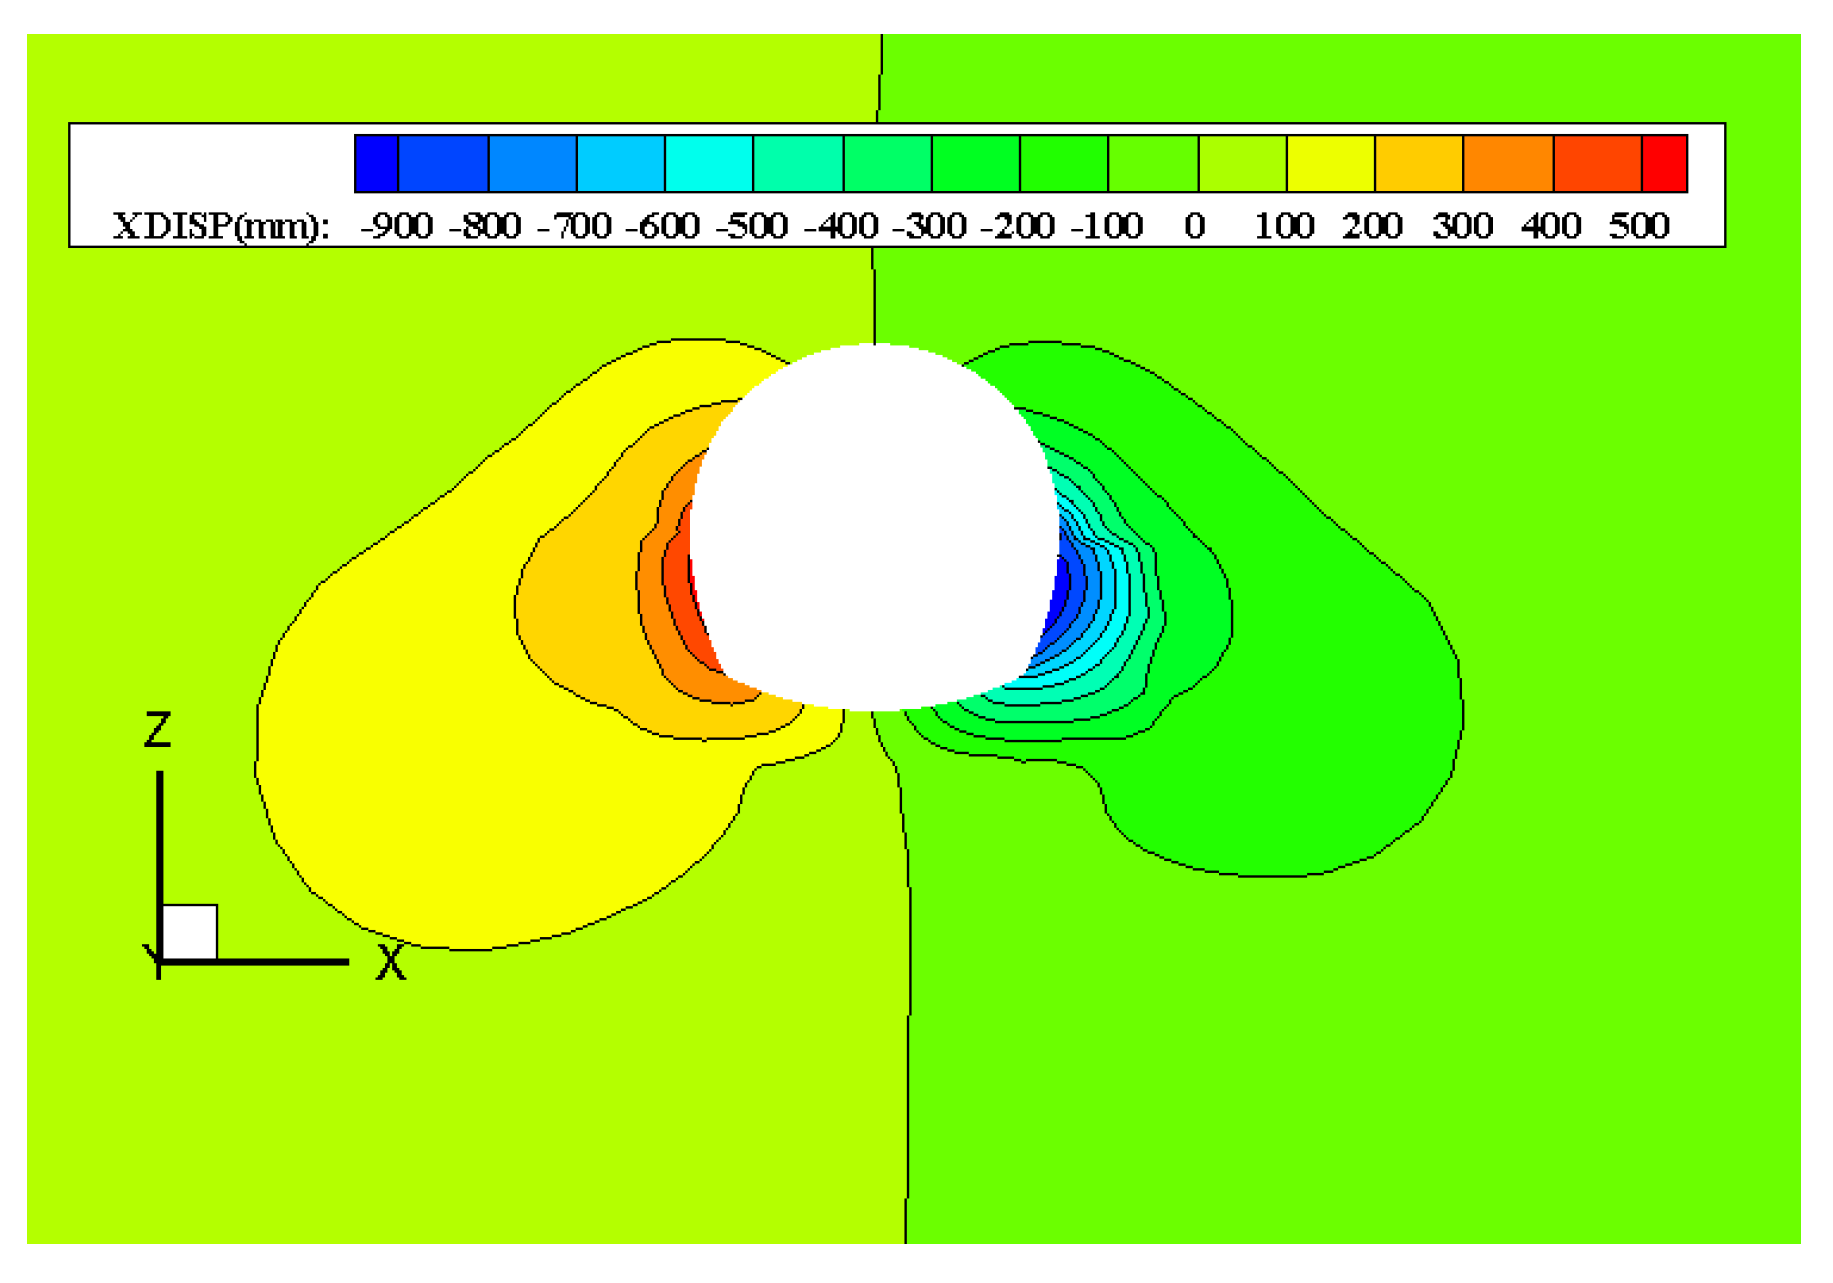
5.2. Analysis of Simulation Results

Figure 13 shows the horizontal deformation of rocks after excavation of the tunnel based on rock parameters in Table 1. The maximum horizontal deformation of the tunnel is found in the middle–upper part of the left and right-hand walls, and the horizontal deformation at this position in the right-hand wall is 366.5 mm. Figure 14 illustrates the distribution of plastic zones. The depths of plastic zones in the vault and side walls of the tunnel are 5.7 and 8.6 m, respectively. Plastic zones are dominated by shear plastic zones, with a small area of shear-tension plastic zones distributed in shallow surrounding rocks of the tunnel. The deformation of surrounding rocks obtained by numerical simulations was compared with that measured during excavation of the tunnel, which indicated that the two are consistent in the upper bench. However, the measured deformation of surrounding rocks in the lower bench is much greater than that attained by numerical simulation. This is because the softening effect of groundwater on the lower mudstone interbedded with marl was not considered in the numerical simulation. As mentioned in Section 4.3, the formation of plastic zones during the excavation induces changes in the seepage field, guiding groundwater to flow toward the tunnel, which thus significantly decreases the strength of mudstone interbedded with marl below the glutenite layer. This is also the cause for the significant increase in the deformation of surrounding rocks in the lower bench. Therefore, the rock mass parameters of mudstone interbedded with marl after encountering groundwater shall be obtained through back-analysis based on the monitoring data from the lower bench of the tunnel.
For simplicity, only the weakening effect of groundwater on the elastic modulus of rock mass is considered in the back-analysis process. The range of the surrounding rock involved in the back-analysis is the plastic zone of mudstone intercalated with marl, as shown by the black box line in Figure 14. According to results of back-analysis, the elastic modulus of softened mudstone interbedded with marl in the left-hand wall is 0.012 GPa, while that of the softened mudstone interbedded with marl in the right-hand wall is 0.007 GPa. Figure 15 shows the horizontal deformation of surrounding rocks after excavation of the tunnel when considering the softening effect of groundwater on mudstone interbedded with marl. The maximum horizontal deformation of the left-hand wall in the lower bench is 518.5 mm, while that of the right-hand wall is 992.2 mm, which is consistent with the measured deformation. Differential deformations are observed in the lower bench’s side walls, which are attributed to varying degrees of groundwater-induced softening effects on the mudstone interbedded with marl. Field surveys further reveal a relatively higher moisture content in the right-hand wall compared to the left, providing corroborative evidence for the aforementioned explanation.
According to the deformation value of surrounding rock obtained by numerical simulation, the tunnel outline after deformation is fitted, as shown in Figure 16. By comparing the tunnel outlines before and after the deformation of the surrounding rock, it can be seen that the results of the numerical simulation can well reproduce the large deformation and the damage of the supporting structure during the tunnel excavation.

6. Discussion on the Mechanism of Large Deformation

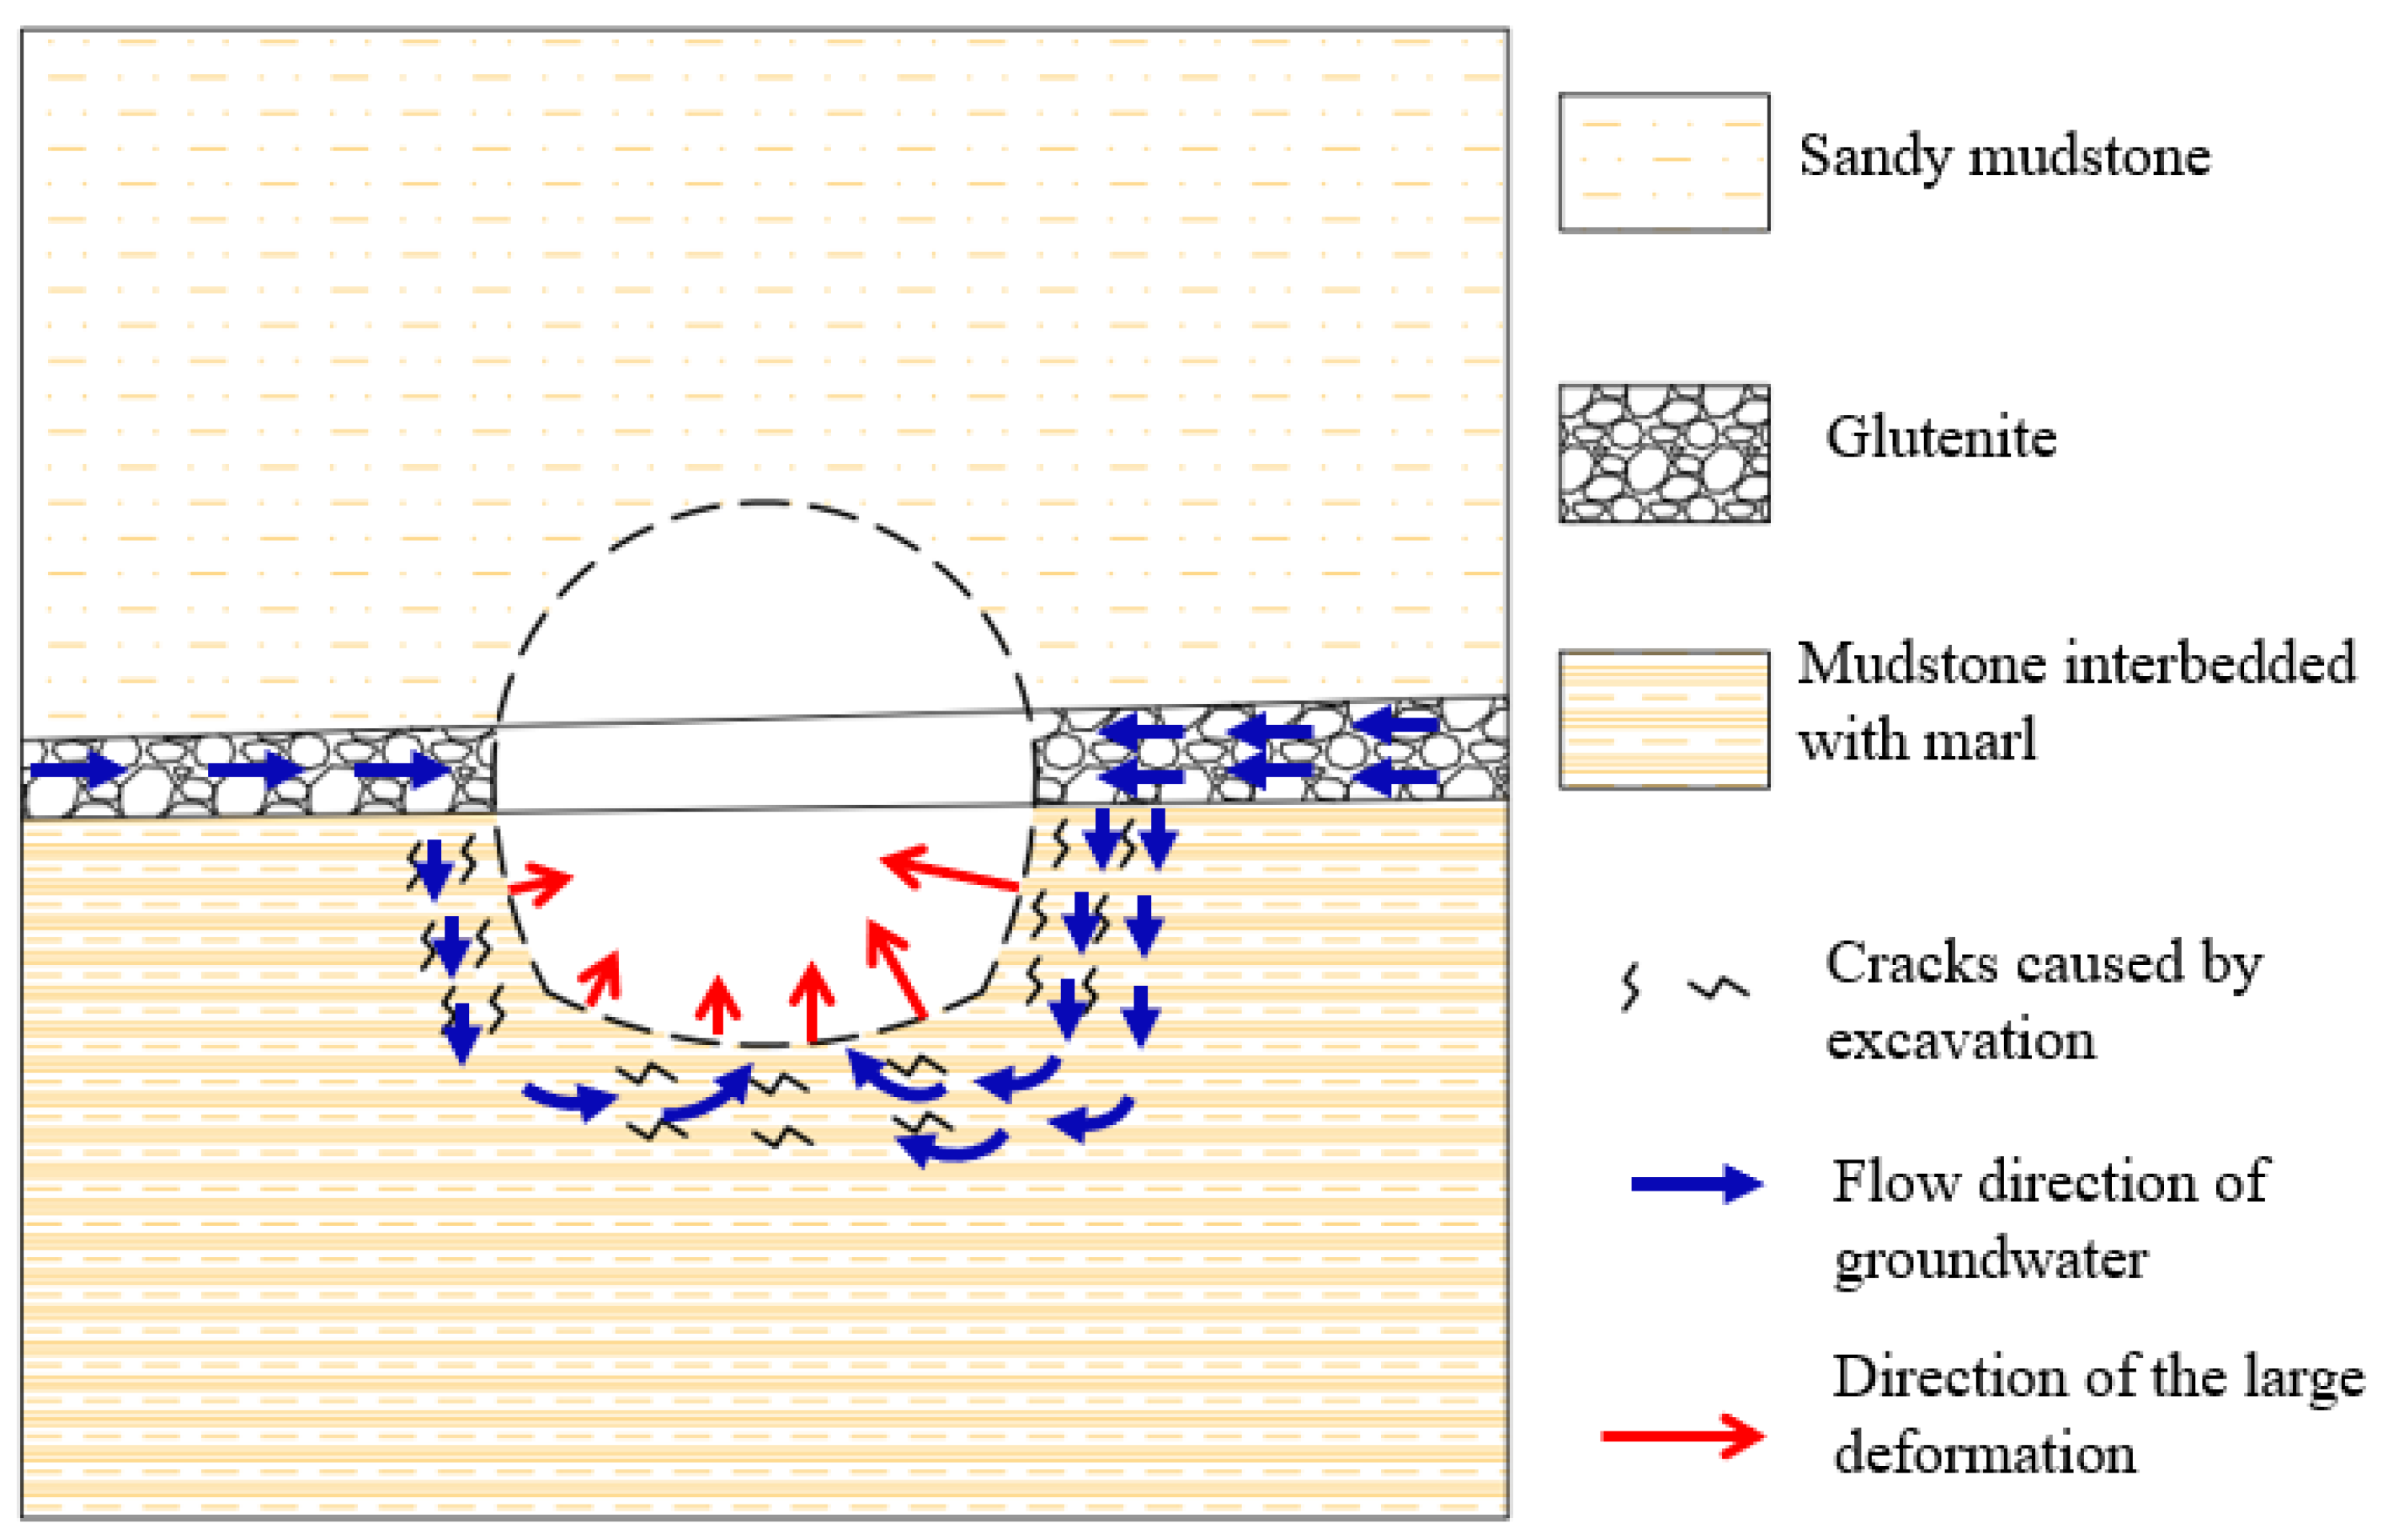
6.1. Plastic Flow of Soft Rocks

Plastic flow caused by excavation is regarded as one of the most important factors that induce a large deformation of surrounding rocks of tunnels constructed in soft rocks [17]. Excavation of a tunnel alters the stress state of surrounding rocks from typical three-dimensional compression to a two-dimensional state and even induces tensile stresses. The excavation also increases the tangential stress while reducing the radial stress and inducing large shear stresses within a certain depth range. Once the stress reaches the yield plane, the rocks enter the plastic state and undergo plastic deformation in the plastic zones [36].
Deformation in plastic flow can occur at various scales, namely minor, severe, and extreme, depending on factors such as the primary structure of surrounding rocks, ground stress, and rock strength. The tunnel section is primarily composed of mudstone interbedded with marl, sandy mudstone, and glutenite, which have UCSs lower than 25 MPa, as determined by test results. These rocks are classified as soft rocks. Furthermore, the ratio of the strength of the surrounding rocks to the ground stress in the tunnel section is relatively small, indicating a region with extremely high ground stress. The stress redistribution resulting from tunnel excavation significantly surpasses the strength of the surrounding rocks, leading to their plastic yielding and substantial plastic deformation. The numerical analysis results also provide strong evidence that when adopting the Mohr–Coulomb yield criterion, the depth of the plastic zone in the side wall reaches 8.6 m. Therefore, the entire cross-section at K4 + 923 exhibits an extremely severe squeezing deformation.

6.2. Softening Effect of Groundwater on Rocks

Results of laboratory tests indicate that the UCS values of mudstone interbedded with marl and sandy mudstone decrease to different extents with increasing water content, reflecting the softening effect of water on rocks. Softening is a phenomenon that changes over time and it reduces the shear strength of the rock. Reduction in the strength can be represented as descent of the rupture envelop with the decrease in non-linearity at low stress [37]. XRD results indicate that mudstone interbedded with marl and sandy mudstone exposed during excavation of the tunnel both contain clay minerals such as montmorillonite and illite, so these rocks are of high hydrophilicity. Although mudstone has a low coefficient of permeability, the glutenite layer with its high water permeability and fractures caused by excavation unloading provide conditions for the seepage of groundwater. Groundwater flows to mudstone along these fractures, thus softening the mudstone. Terzaghi [38] described the relationship between the internal softening and stability of a cutting slope constructed in a hard, cracked clay. It is worth noting that fractures and unloading both play an important role in the process.
Figure 17 depicts the mechanism through which the groundwater’s softening effect facilitates significant deformation of the tunnel’s surrounding rocks. The process is explained as follows: the tunnel section from K4 + 904 to K4 + 924 is close to the gully and the excavation of the tunnel changes the seepage path of the groundwater. The glutenite layer, with its high water permeability in the middle of the tunnel, becomes the preferential pathway for the migration of groundwater, so that the water content or permeability of surrounding rocks in the middle and lower parts of the tunnel increases significantly. Meanwhile, the surrounding rocks are unloaded and relaxed due to excavation of the tunnel, resulting in the initiation, propagation, and coalescence of fractures (Figure 9). This further increases the permeability of the rocks and significantly changes the moisture conditions therein. Surrounding rocks are argillated and softened when exposed to water, show significantly decreased strength, and swell to some extent, leading to large plastic deformation. In particular, the mudstone interbedded with marl in the middle and lower parts of the tunnel undergoes greater plastic deformation under the influences of the glutenite aquifer. Therefore, the mechanism of occurrence of the large deformation of the rock surrounding the tunnel section from K4 + 904 to K4 + 924 is closely related to the strata structure and lithological distribution of the section as well as water recharging from the gully.
In the tunnel section where the large deformation occurred, the mechanical performance of mudstone interbedded with marl below the glutenite layer is more significantly deteriorated compared with that of the sandy mudstone above the glutenite layer under the combined influences of the lithological difference and groundwater. The difference in the mechanical performance of surrounding rocks below and above the glutenite layer generates an uneven load on the primary support (as evinced by the larger deformation in the lower side walls than in the upper part). This also induces local buckling of the streel arch at the glutenite layer.

7. Conclusions

Based on the comprehensive analysis of field surveys, deformation monitoring data, laboratory tests, and numerical simulations, the following conclusions can be drawn regarding the significant large deformation and damage to support observed during the excavation of a tunnel in Tertiary soft rocks in China.
(1)
The large deformation of the surrounding rocks in the tunnel is primarily caused by two factors: plastic flow induced by tunnel excavation under low rock strength and the softening effect of groundwater on the surrounding rocks.
(2)
The occurrence mechanism of the large deformation in the rocks surrounding the tunnel is closely related to the strata structure, lithological distribution of the tunnel section, and water recharge from the gully.
(3)
The damage to the support structure in the tunnel is primarily driven by the combined effects of squeezing and swelling deformation of the surrounding rocks and non-uniform deformation between different rock layers.
In conclusion, the findings from this study highlight the importance of considering the strata structure, lithological distribution, and groundwater influence when assessing the potential for large deformation and damage to support during tunnel excavation in Tertiary soft rocks. These insights can inform future tunnel construction projects and help mitigate the risks associated with such geological conditions.

Author Contributions

D.L.: methodology, conceptualization, data curation, validation, writing. S.H.: conceptualization, reviewing, funding acquisition, supervision. X.D.: conceptualization, supervision. J.C.: data curation, resources. Y.Z.: data curation, reviewing. All authors have read and agreed to the published version of the manuscript.

Funding

This research was funded by the Fundamental Research Funds for Central Public Welfare Research Institutes (Grant No. CKSF2021457/YT and CKSF2021715/YT) and the National Natural Science Foundation of China (Grant No. 51979008).

Data Availability Statement

The data used to support the findings of this study are included in the article.

Conflicts of Interest

The authors declare no conflict of interest.

References

  1. Ding, X.L.; Zhang, Y.T.; Huang, S.L.; Chi, J.J.; Zhang, C.J.; Liu, D.X. Large deformation mechanism of surrounding rock masses of tunnels, prediction method of squeezing large deformation and its application. Chin. J. Rock Mech. Eng. 2023, 42, 521–544. [Google Scholar]
  2. Fox, F. The boring of the simplon tunnel, and the distribution of temperature that was encountered. Proc. R. Soc. Lond. Ser. A 1905, 76, 29–33. [Google Scholar]
  3. Enrich, H.A.C.K.L. Experiences from the construction of the Tauern Tunnel. Rock Mech. Felsmech Mec. Roches 1974, 6, 90. [Google Scholar]
  4. John, M. Construction of the Arlberg expressway tunnel tube. Tunn. Tunn. Int. 1980, 12, 45–50. [Google Scholar]
  5. Ito, Y. Design and construction by NATM through Chogiezawa fault zone for Enasan Tunnel on central motorway. Tunn. Undergr. 1983, 14, 7–14. [Google Scholar]
  6. Gao, S.J. Main countermeasures against the serious deformation of surrounding rock in Jiazhuqing Tunnel. Mod. Tunn. Technol. 1998, 1, 52–56. [Google Scholar]
  7. Liu, G.; Zhang, F.Y.; Li, X.Z.; Yang, Z.C. Research on large deformation and its mechanism of Muzhailing tunnel. Chin. J. Rock Mech. Eng. 2005, 24 (Suppl. S2), 5521–5526. [Google Scholar]
  8. Qing, S.H.; Huang, R.Q. Study on the large deformation characteristics of the soft rocks in Wushaoling tunnel. Mod. Tunn. Technol. 2005, 42, 7–14. [Google Scholar]
  9. Zhao, S.Q.; Lin, A.N.; Yan, X.J. Large deformation analysis and control for vertically-oriented slate in Hadapu Tunnel. Mod. Tunn. Technol. 2011, 48, 5. [Google Scholar]
  10. Song, S.W.; Feng, X.M.; Liao, C.G.; Cai, D.W.; Liu, Z.X.; Yang, Y.H. Measures for controlling large deformations of underground caverns under high in-situ stress condition—A case study of Jinping I hydropower station. J. Rock Mech. Geotech. Eng. 2019, 8, 605–618. [Google Scholar]
  11. Tian, Y.; Shu, X.Y.; Tian, H.M.; He, L.K.; Jin, Y.; Huang, M. Effect of horizontal stress on the mesoscopic deformation and failure mechanism of layered surrounding rock masses in tunnels. Eng. Fail. Anal. 2023, 148, 107226. [Google Scholar]
  12. Aydan, Ö.; Akagi, T.; Kawamoto, T. The squeezing potential of rock around tunnels: Theory and prediction with examples taken from Japan. Rock Mech. Rock Eng. 1996, 29, 125–143. [Google Scholar] [CrossRef]
  13. Hoek, E. Big Tunnels in Bad Rock. J. Geotech. Geoenviron. Eng. 2001, 127, 726–740. [Google Scholar]
  14. Yassaghi, A.; Salari-Rad, H. Squeezing rock conditions at an igneous contact zone in the Taloun tunnels, Tehran-Shomal freeway, Iran: A case study. Int. J. Rock Mech. Min. Sci. 2004, 42, 95–108. [Google Scholar] [CrossRef]
  15. Wang, M.Y.; Zhang, N.; Li, J.; Ma, L.J.; Fan, P.X. Computational method of large deformation and its application in deep mining tunnel. Tunn. Undergr. Space Technol. 2015, 50, 47–53. [Google Scholar]
  16. Bian, K.; Liu, J.; Liu, Z.P.; Liu, S.G.; Ai, F.; Zheng, X.Q.; Ni, S.H.; Zhang, W. Mechanisms of large deformation in soft rock tunnels: A case study of Huangjiazhai Tunnel. Bull. Eng. Geol. Envinron. 2019, 78, 431–444. [Google Scholar]
  17. Yoshida, N.; Nishi, M.; Kitamura, M.; Adachi, T. Analysis of mudstone deterioration and its effect on tunnel performance. Int. J. Rock Mech. Min. Sci. 1997, 34, 353.e1–353.e19. [Google Scholar] [CrossRef]
  18. Brox, D.; Hagedorn, H. Extreme deformation and damage during the construction of large tunnels. Tunn. Undergr. Space Technol. 1999, 14, 23–28. [Google Scholar] [CrossRef]
  19. Wood, A.M.M. Tunnels for roads and motorways. Q. J. Eng. Geol. Hydrogeol. 1972, 5, 111–126. [Google Scholar] [CrossRef]
  20. Chen, Z.J. The mechanical problems for the long-term stability of underground galleries. Chin. J. Rock Mech. Eng. 1982, 1, 1–20. [Google Scholar]
  21. Aydan, O.; Akagi, T.; Kawamoto, T. The squeezing potential of rocks around tunnels: Theory and prediction. Rock Mech. Rock Eng. 1993, 26, 137–163. [Google Scholar]
  22. He, M.C.; Jing, H.H.; Sun, X.M. Engineering Mechanics of Soft Rock; Beijing Science Press: Beijing, China, 2002. [Google Scholar]
  23. Li, G.F.; He, M.C.; Zhang, G.F.; Tao, Z.G. Deformation mechanism and excavation process of large span intersection within deep soft rock roadway. Min. Sci. Technol. 2010, 20, 28–34. [Google Scholar] [CrossRef]
  24. GB50218-2014; Standard for Engineering Classification of Rock Mass. China Planning Press: Beijing, China, 2014.
  25. Dalgic, S. Tunneling in squeezing rock, the Bolu tunnel, Anatolian motorway, Turkey. Eng. Geol. 2002, 67, 73–96. [Google Scholar] [CrossRef]
  26. Khanlari, G.; Meybodi, R.G.; Mokhtari, E. Engineering geological study of the second part of water supply Karaj to Tehran tunnel with emphasis on squeezing problems. Eng. Geol. 2012, 145, 9–17. [Google Scholar] [CrossRef]
  27. Li, J.Q.; Wang, Z.F.; Wang, Y.Q.; Chang, H.T. Analysis and countermeasures of large deformation of deep-buried tunnel excavated in layered rock strata: A case study. Eng. Fail. Anal. 2023, 146, 107057. [Google Scholar]
  28. Liu, D.X.; Chi, J.J.; Ding, X.L.; Huang, S.L.; Zhang, Y.T. Discussion on Lining Cracking Mechanism and Prevention Measures of A Water Conveyance Tunnel. Mod. Tunn. Technol. 2020, 57, 852–858. [Google Scholar]
  29. Anagnostou, G.; Kovári, K. The New Austrian Tunnelling Method: A Review of Recent Advances and Applications. Tunn. Undergr. Space Technol. 2017, 69, 139–153. [Google Scholar]
  30. DZ/T0130-2018; The Specification of Testing Quality Management for Geological Laboratories. China Planning Press: Beijing, China, 2018.
  31. SL/T264-2020; Code for Rock Tests in Water and Hydropower Projects. China Water Power Press: Beijing, China, 2020.
  32. Wang, T.T.; Huang, T.H. An experience of tunnelling in mudstone area in southwestern Taiwan. Tunn. Undergr. Space Technol. 2002, 17, 425–436. [Google Scholar] [CrossRef]
  33. Fattah, M.Y.; Shlash, K.T.; Salim, N.M. Effect of Reduced Ko Zone on Time Dependent Analysis of Tunnels. Adv. Civ. Eng. 2011, 2011, 963502. [Google Scholar]
  34. GB50021-94; Standard for Investigation of Geotechnical Engineering. China Planning Press: Beijing, China, 1994.
  35. Hsiao, F.Y.; Wang, C.L.; Chern, J.C. Numerical simulation of rock deformation for support design in tunnel intersection area. Tunn. Undergr. Space Technol. 2009, 24, 14–21. [Google Scholar]
  36. Chai, S.B.; Liu, H.; Song, L.; Li, X.P.; Fu, X.D.; Zhou, Y.Q. Static pressure and dynamic impact characteristics of filled jointed rock after frozen-thaw cycle damage. Front. Ecol. Evol 2023, 11, 1222676. [Google Scholar]
  37. Yoshida, N.; Adachi, T. FE analysis of time-dependent instability of cut slopes in clay shale. Int. J. Rock Mech. Min. Sci. Geomech. Abstr. 1993, 30, A255. [Google Scholar]
  38. Terzaghi, K. Stability of slopes in natural clay. In Proceedings of the 1st International Conference of Soil Mechanics and Foundations, Cambridge, MA, USA, 22–26 June 1936; pp. 161–165. [Google Scholar]
Figure 1. Geological profile of the water-conveyance tunnel (A part of the water conveyance tunnel section from K3 + 700 to K5 + 500).
Buildings 13 02262 g001
Figure 2. Lithology revealed by excavation at the K4 + 923 cross-section.
Buildings 13 02262 g002
Figure 3. Real picture of gully.
Buildings 13 02262 g003
Figure 4. Tunnel cross-sectional dimensions.
Buildings 13 02262 g004
Figure 5. Large deformation of surrounding rock and support failure during tunnel excavation. (a) Large deformation in the horizontal direction; (b) Tunnel bottom lifting; (c) Cracking at the bottom of tunnel; (d) Steel arch bending.
Buildings 13 02262 g005aBuildings 13 02262 g005b
Figure 6. Horizontal deformation curves of surrounding rocks at monitoring points on the cross-section at K4 + 923.
Buildings 13 02262 g006
Figure 7. Horizontal deformation rate curves of surrounding rocks at monitoring points on the cross-section at K4 + 923.
Buildings 13 02262 g007
Figure 8. Specimens of standard size: (a) Mudstone interbedded with marl and (b) Sandy mudstone.
Buildings 13 02262 g008
Figure 9. Uniaxial compression failure form of rock samples in the natural state: (a) Mudstone interbedded with marl with UCS of 0.84 MPa and (b) Sandy mudstone with UCS of 3.72 MPa.
Buildings 13 02262 g009
Figure 10. Appearances of the two types of rocks after being immersed in water for 24 h: (a) Mudstone interbedded with marl and (b) Sandy mudstone.
Buildings 13 02262 g010
Figure 11. Seepage of groundwater from the inverted arch near K4 + 914.
Buildings 13 02262 g011
Figure 12. Numerical simulation model and the mesh: (a) Numerical simulation model and (b) The mesh around the tunnel.
Buildings 13 02262 g012
Figure 13. Horizontal deformation of surrounding rocks of the tunnel when not considering the softening effect of groundwater.
Buildings 13 02262 g013
Figure 14. Plastic zones after excavation of the tunnel.
Buildings 13 02262 g014
Figure 15. Horizontal deformation of surrounding rocks of the tunnel when considering the softening effect of groundwater.
Buildings 13 02262 g015
Figure 16. Tunnel outlines before and after the deformation of the surrounding rock.
Buildings 13 02262 g016
Figure 17. Diagrammatic sketch for the mechanism of large deformation in the tunnel.
Buildings 13 02262 g017
Table 1. Rock support measures.
Support StageSupport MeasuresDetailed Parameters
Advance supportForepole: advanced steel pipeLocation: upper 160° range of tunnel roof; Diameter of pipes: 42 mm; Length of pipes: 5 m; Spacing of pipes: 0.35 m
Primary supportSteel archHW150-type; 0.5 m spaced steel bars with 22 mm diameter are used to connect the steel arch; feet-lock bolts are used to fix the steel arch
Anchor boltHollow grouting anchor bolt at 1.25 m × 1.25 m spacing and 3.5 m length
Shotcrete0.2 m thick with steel net
Secondary supportReinforced concrete lining0.6 m thick
Table 2. Results of the uniaxial compression tests on mudstone interbedded with marl and sandy mudstone.
LithologyTreatmentWater Content CW (%)Elastic Modulus E
(MPa)
UCS
(MPa)
Mudstone interbedded with marlUntreated15.48880.84
Air-dried for 4 days9.481491.44
Immersed in water for 1.5 h26.96120.24
Sandy mudstoneUntreated18.036543.72
Air-dried for 4 days6.998358.54
Immersed in water for 2 h18.214322.76
Immersed in water for 4 h26.102191.40
Immersed in water for 24 h36.651260.58
Table 3. Mineral compositions of mudstone interbedded with marl and sandy mudstone.
LithologyMineral Content CM (%)
MontmorilloniteQuartzIlliteCalciteFeldspar
Mudstone interbedded with marl343016155
Sandy mudstone301010455
Table 4. Results of the swelling test on mudstone interbedded with marl and sandy mudstone.
LithologyFree Swelling Percentage PEs (%)Swelling Pressure Ps (MPa)
Mudstone interbedded with marl4.07 to 6.380.41 to 0.55
Sandy mudstone1.31 to 1.510.22 to 0.34
Table 5. Suggested mechanical parameters of the rock masses.
LithologyUnit Weight γ (kN/m3)Shear StrengthTensile Strength ts (MPa)Elastic Modulus E (GPa)Poisson’s Ratio ν
Cohesion c (MPa)Friction Angle φ (◦)
Sandy mudstone21.00.3026.560.150.650.39
Glutenite21.00.2028.810.100.500.39
Mudstone interbedded with marl21.00.2824.230.140.090.39
Disclaimer/Publisher’s Note: The statements, opinions and data contained in all publications are solely those of the individual author(s) and contributor(s) and not of MDPI and/or the editor(s). MDPI and/or the editor(s) disclaim responsibility for any injury to people or property resulting from any ideas, methods, instructions or products referred to in the content.

