
An Approach to Predicting the Ballistic Limit of Thin Textile-Reinforced Concrete Plates Based on Experimental Results


Abstract
:1. Introduction
1.1. Overview of the Research Objective
1.2. State of the Art
2. Materials and Methods
2.1. Fine Concrete
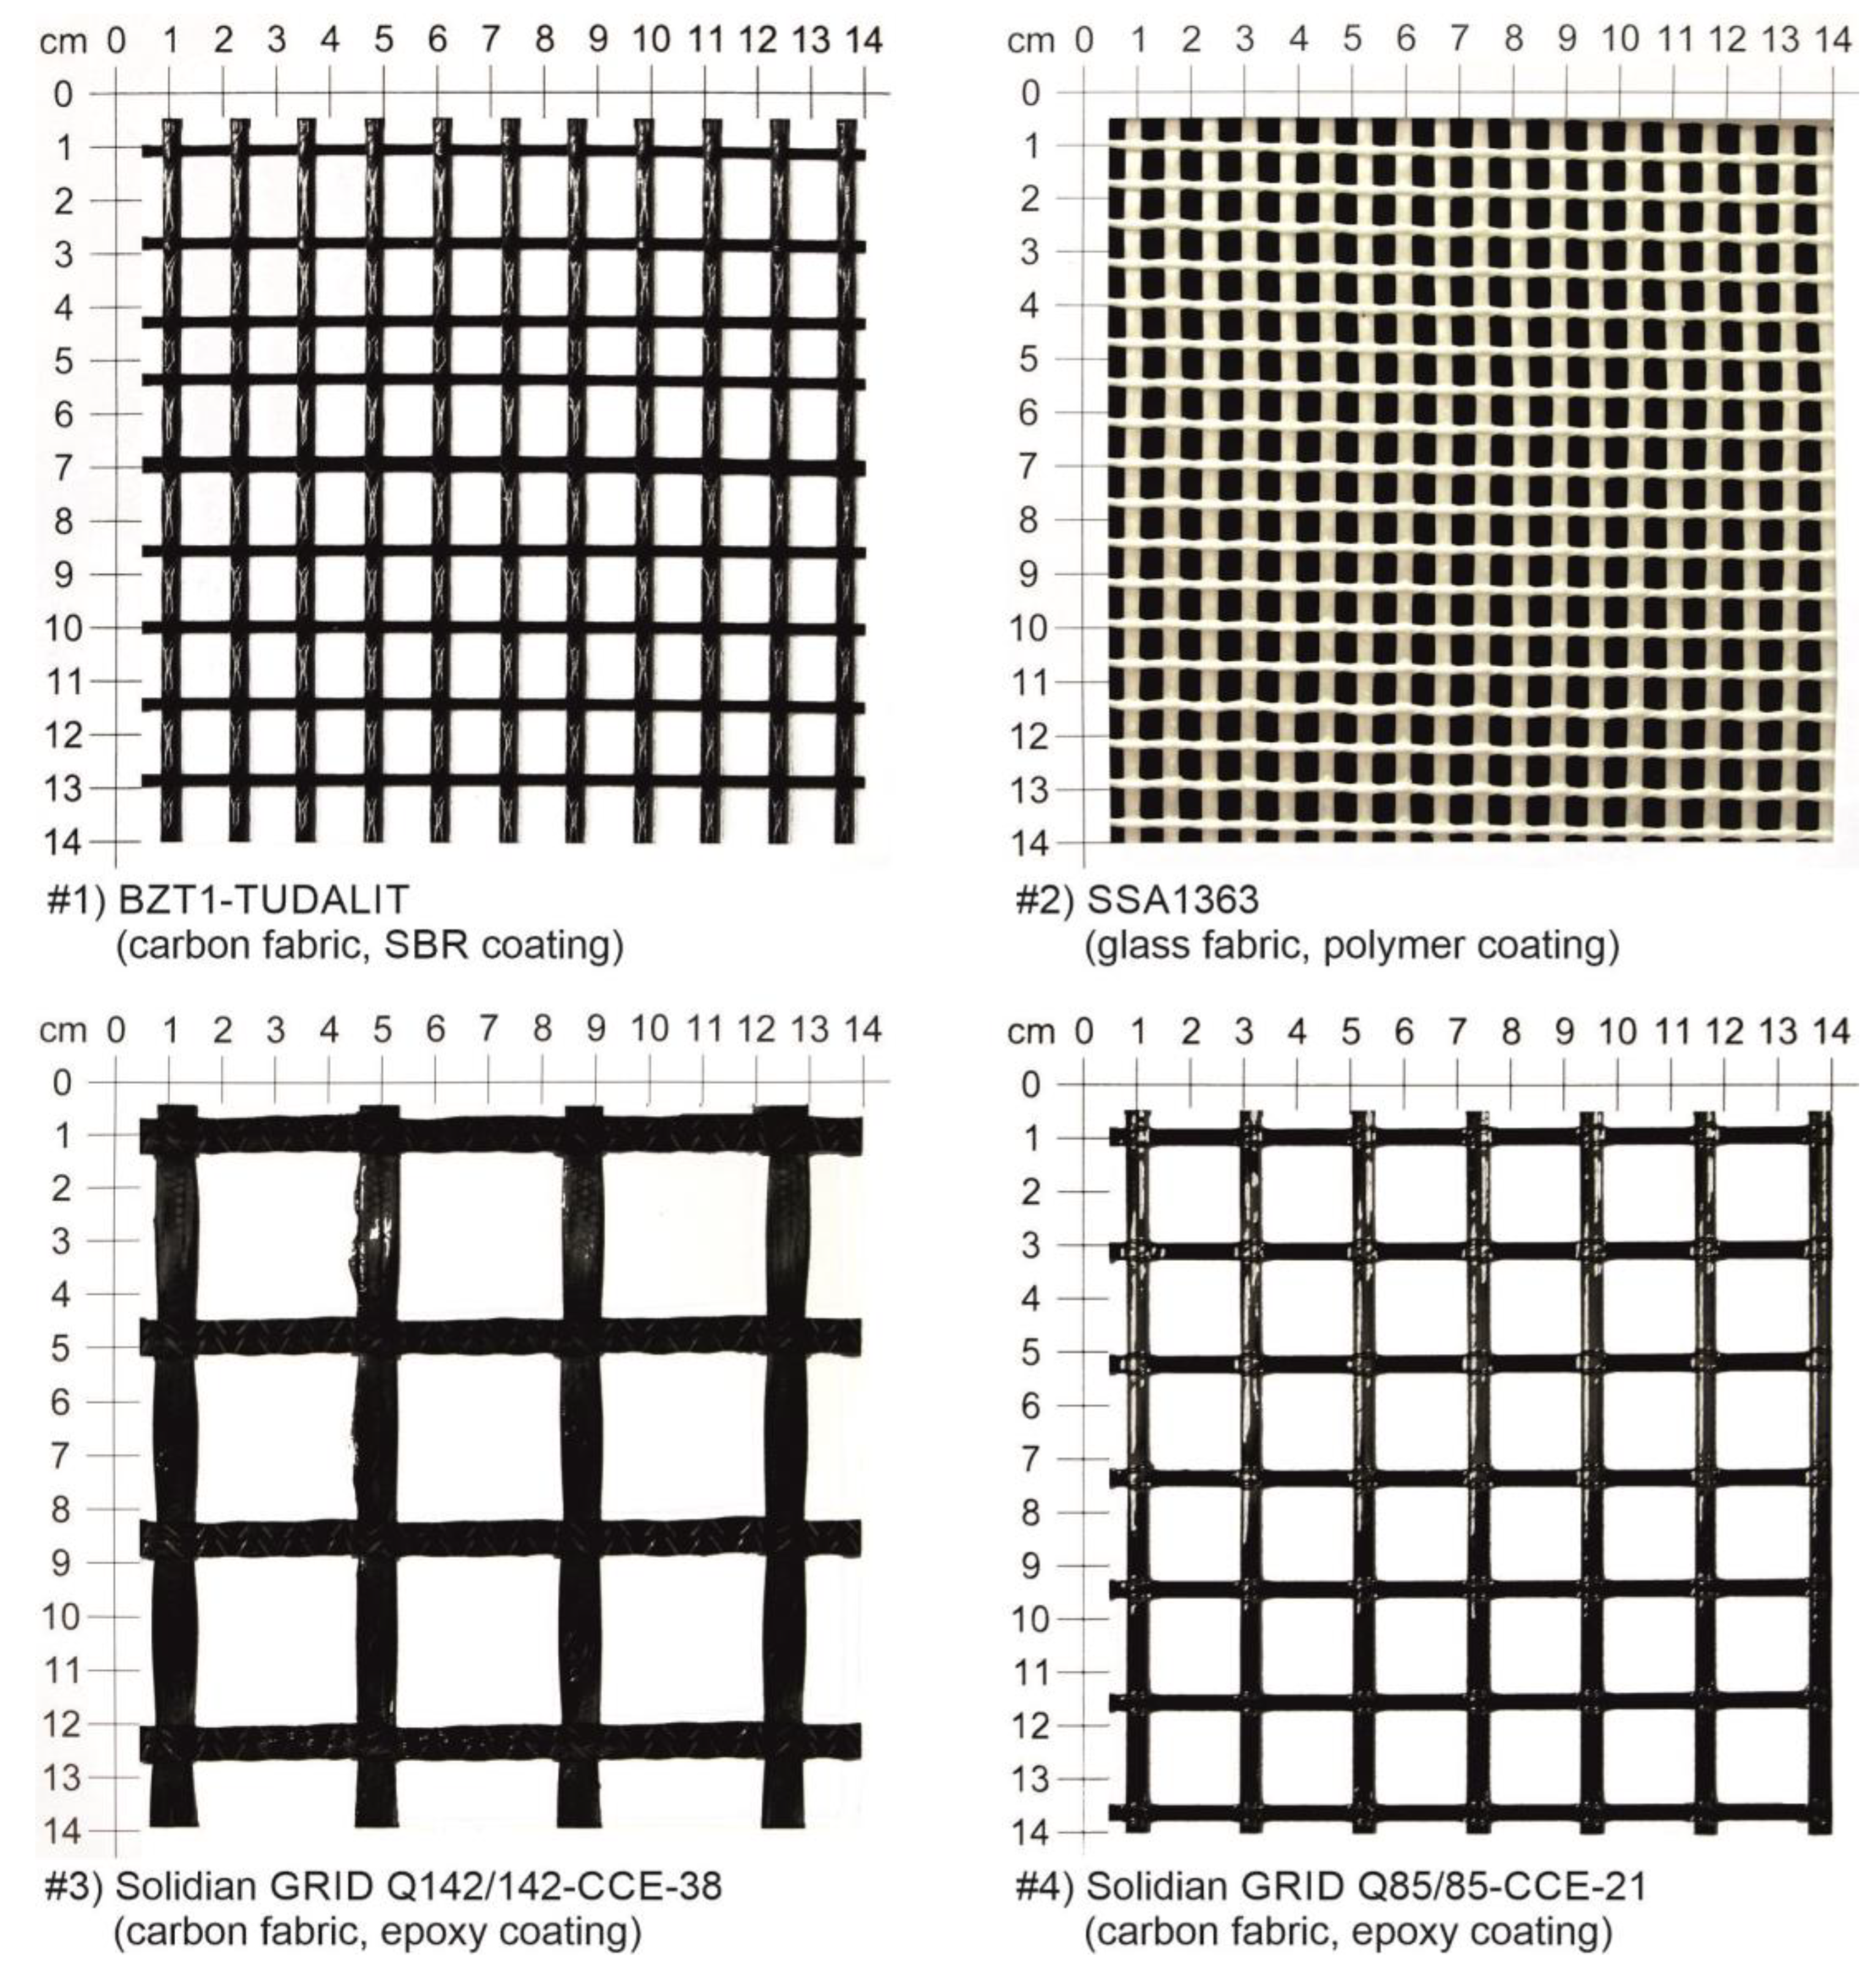
2.2. Fabrics
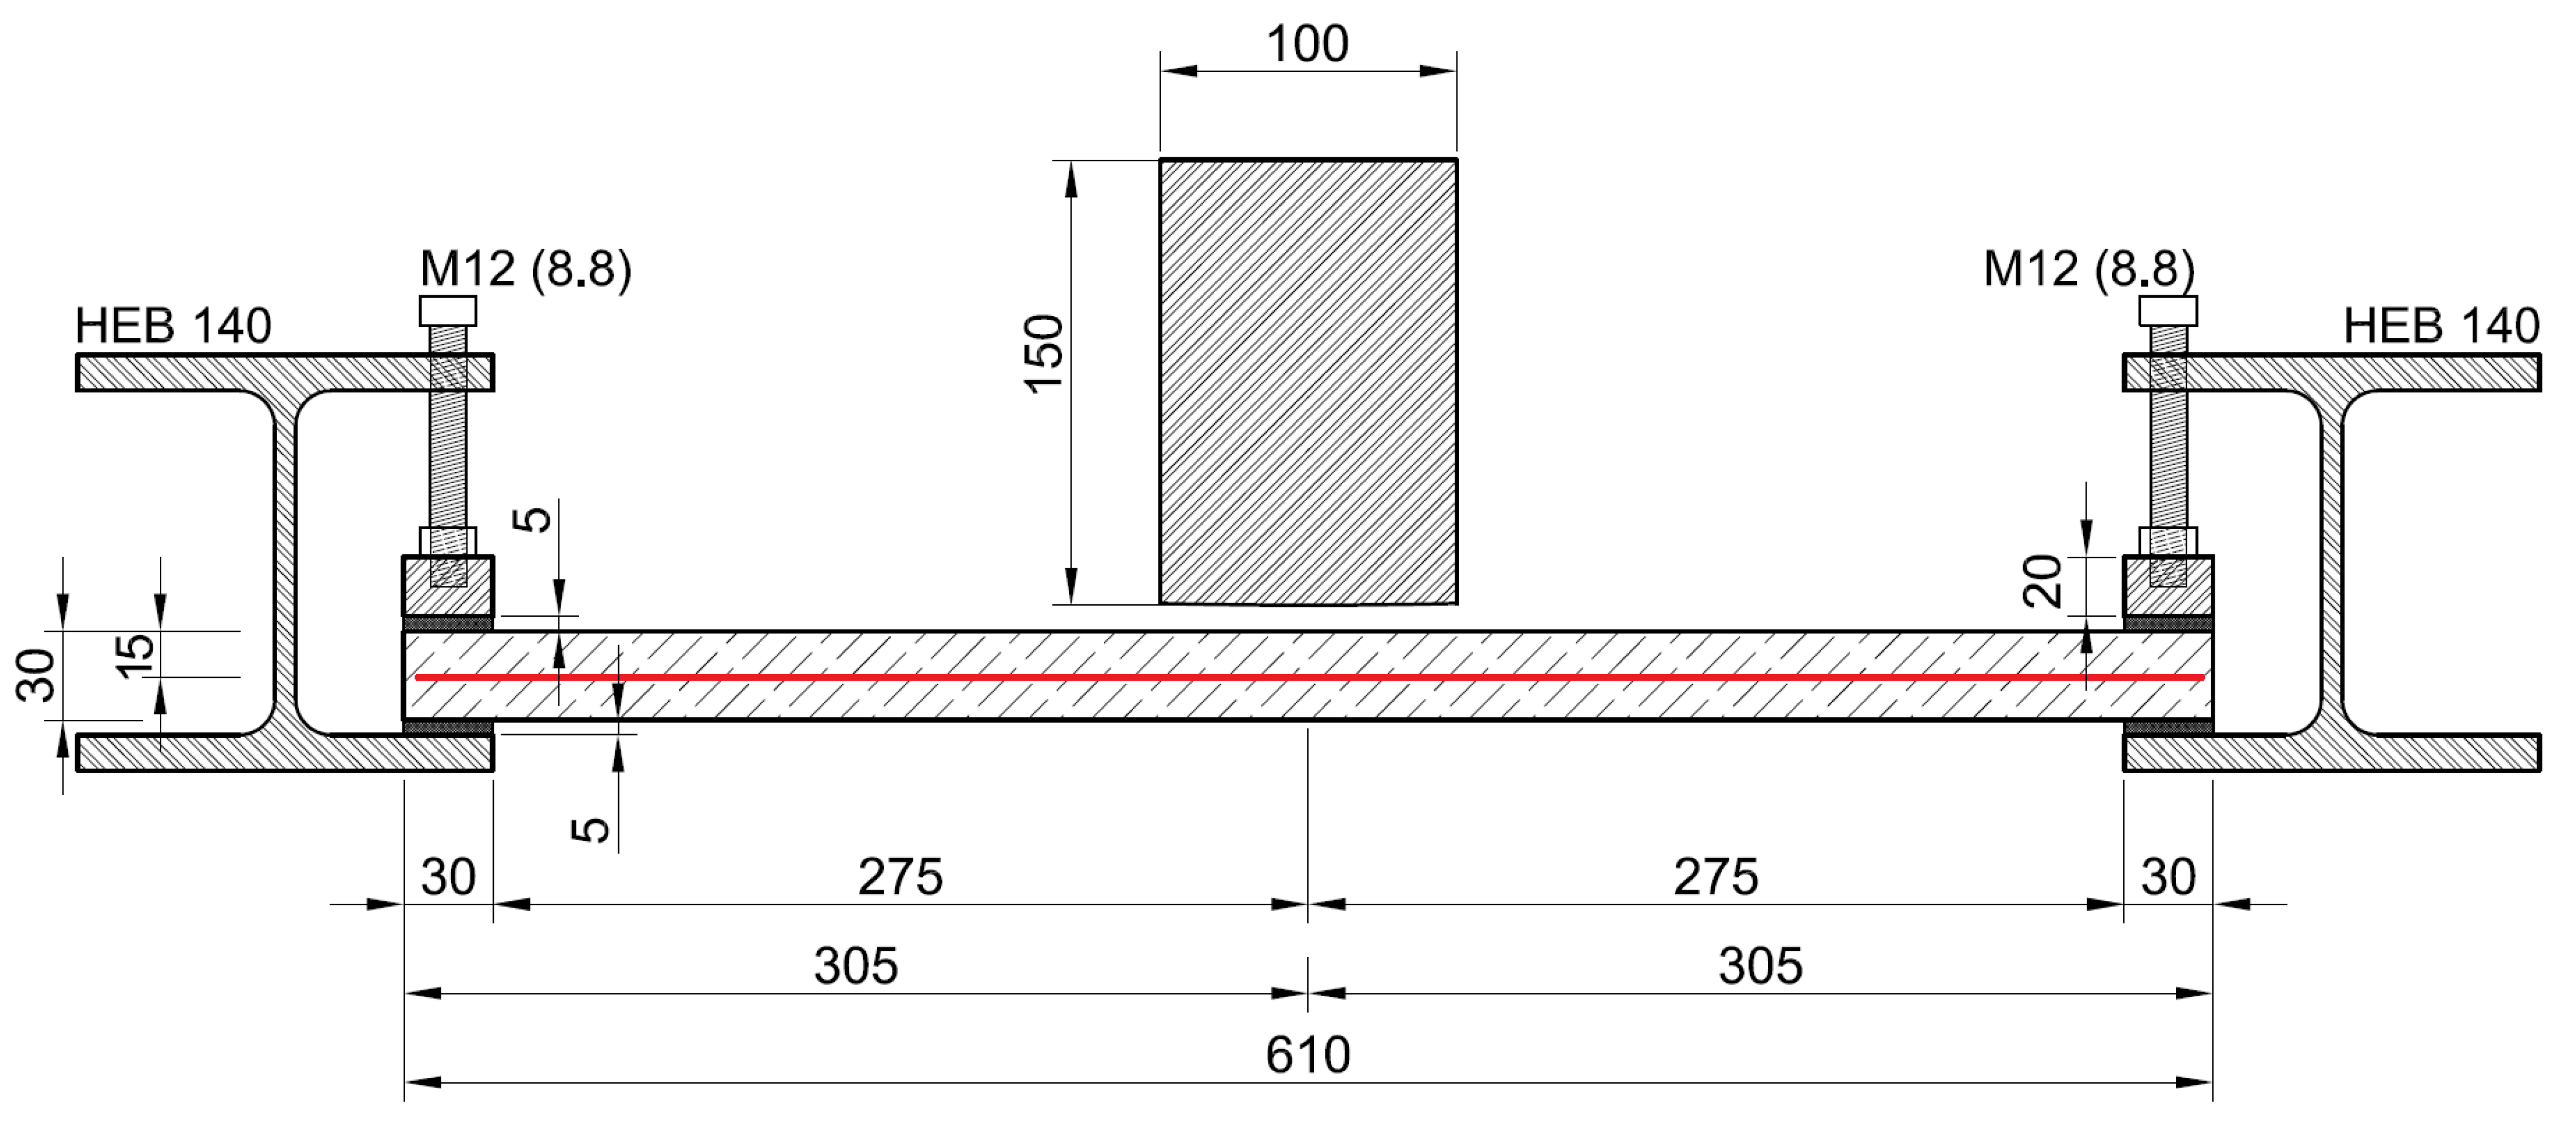
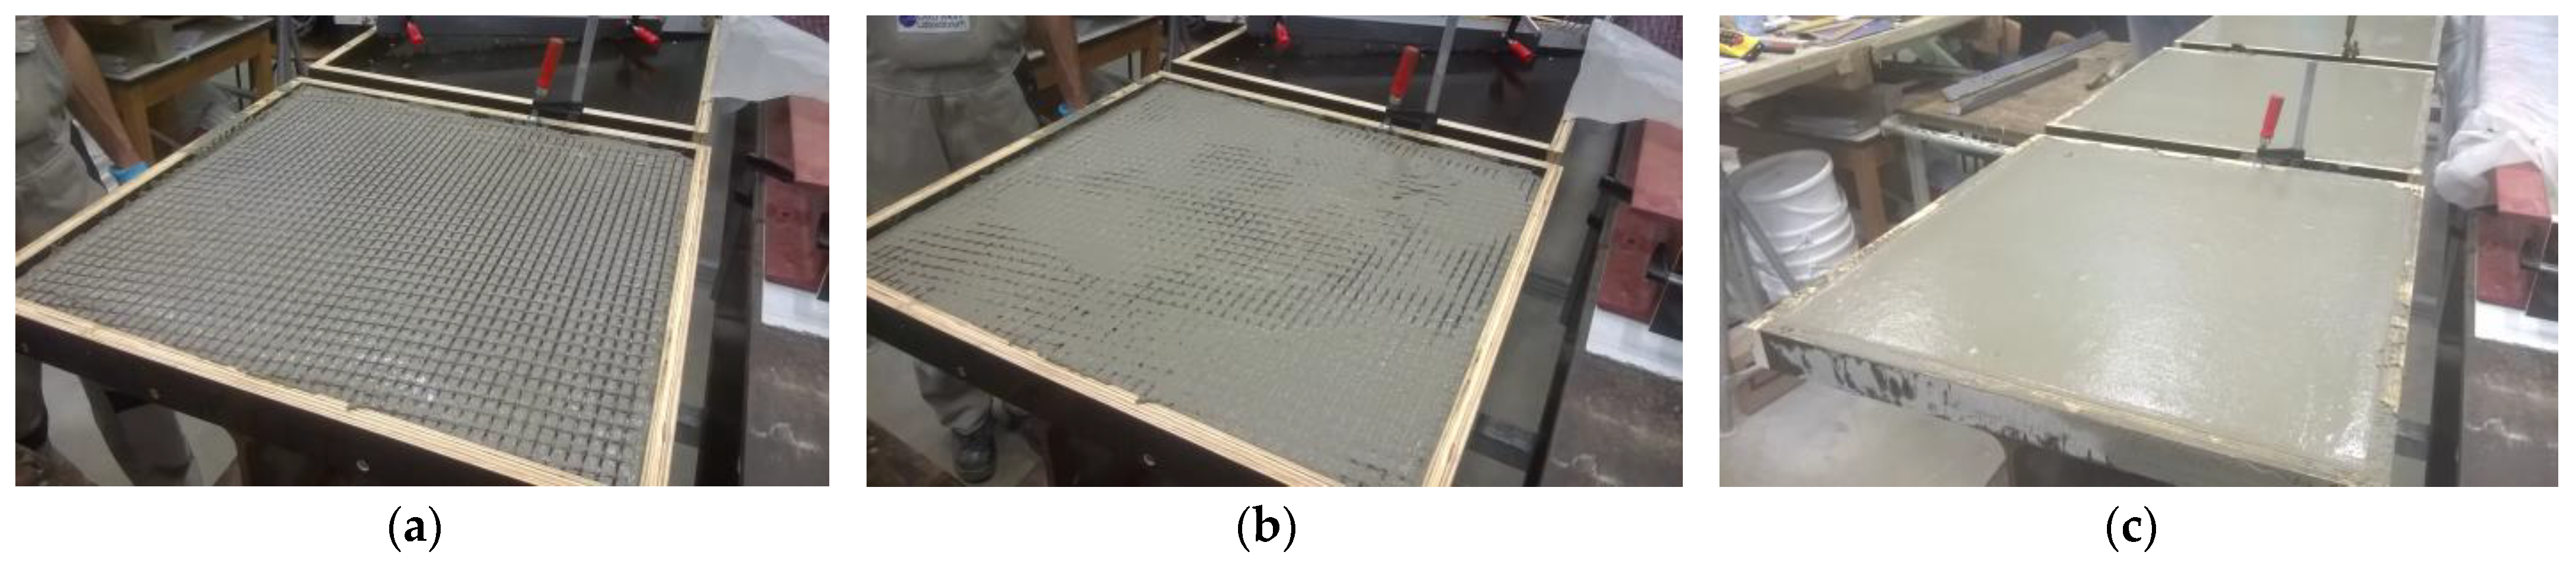
2.3. Specimens Used
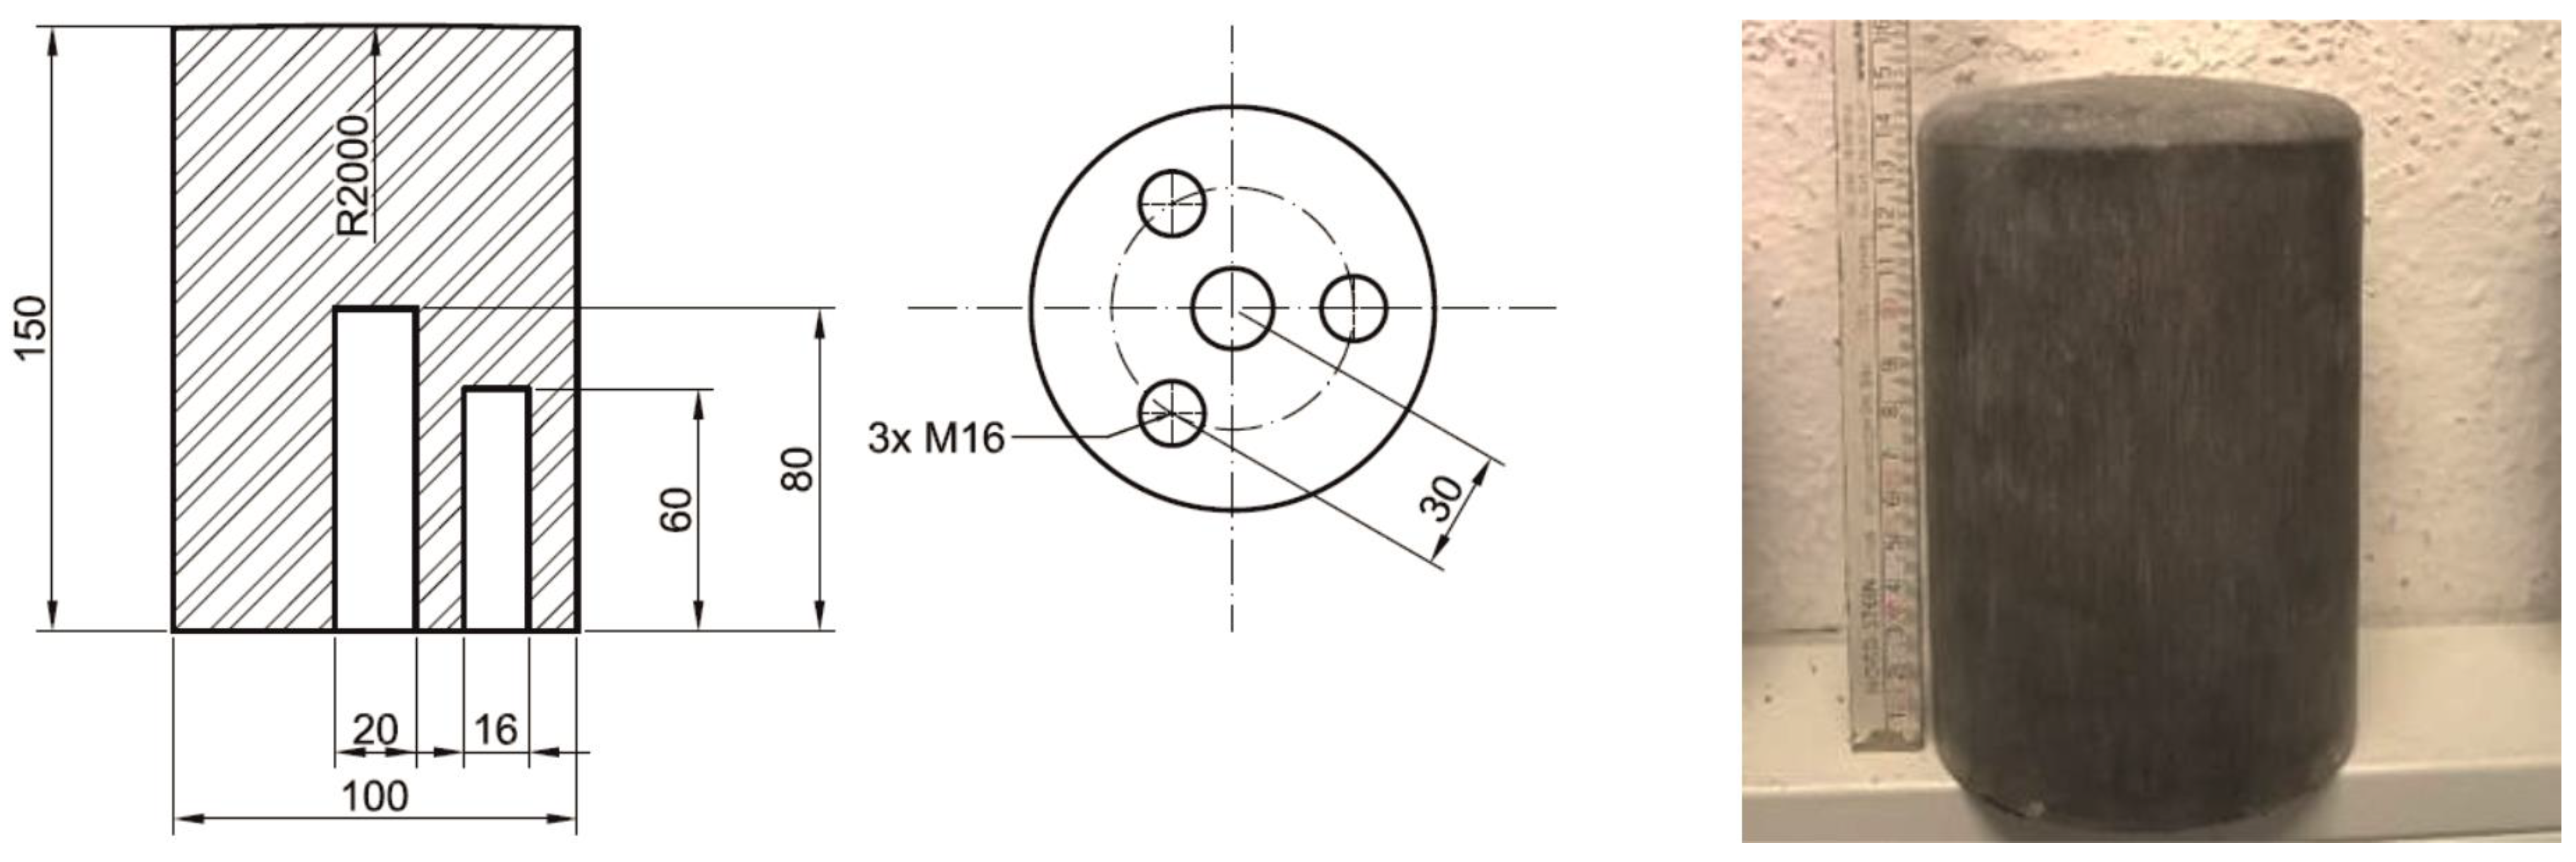
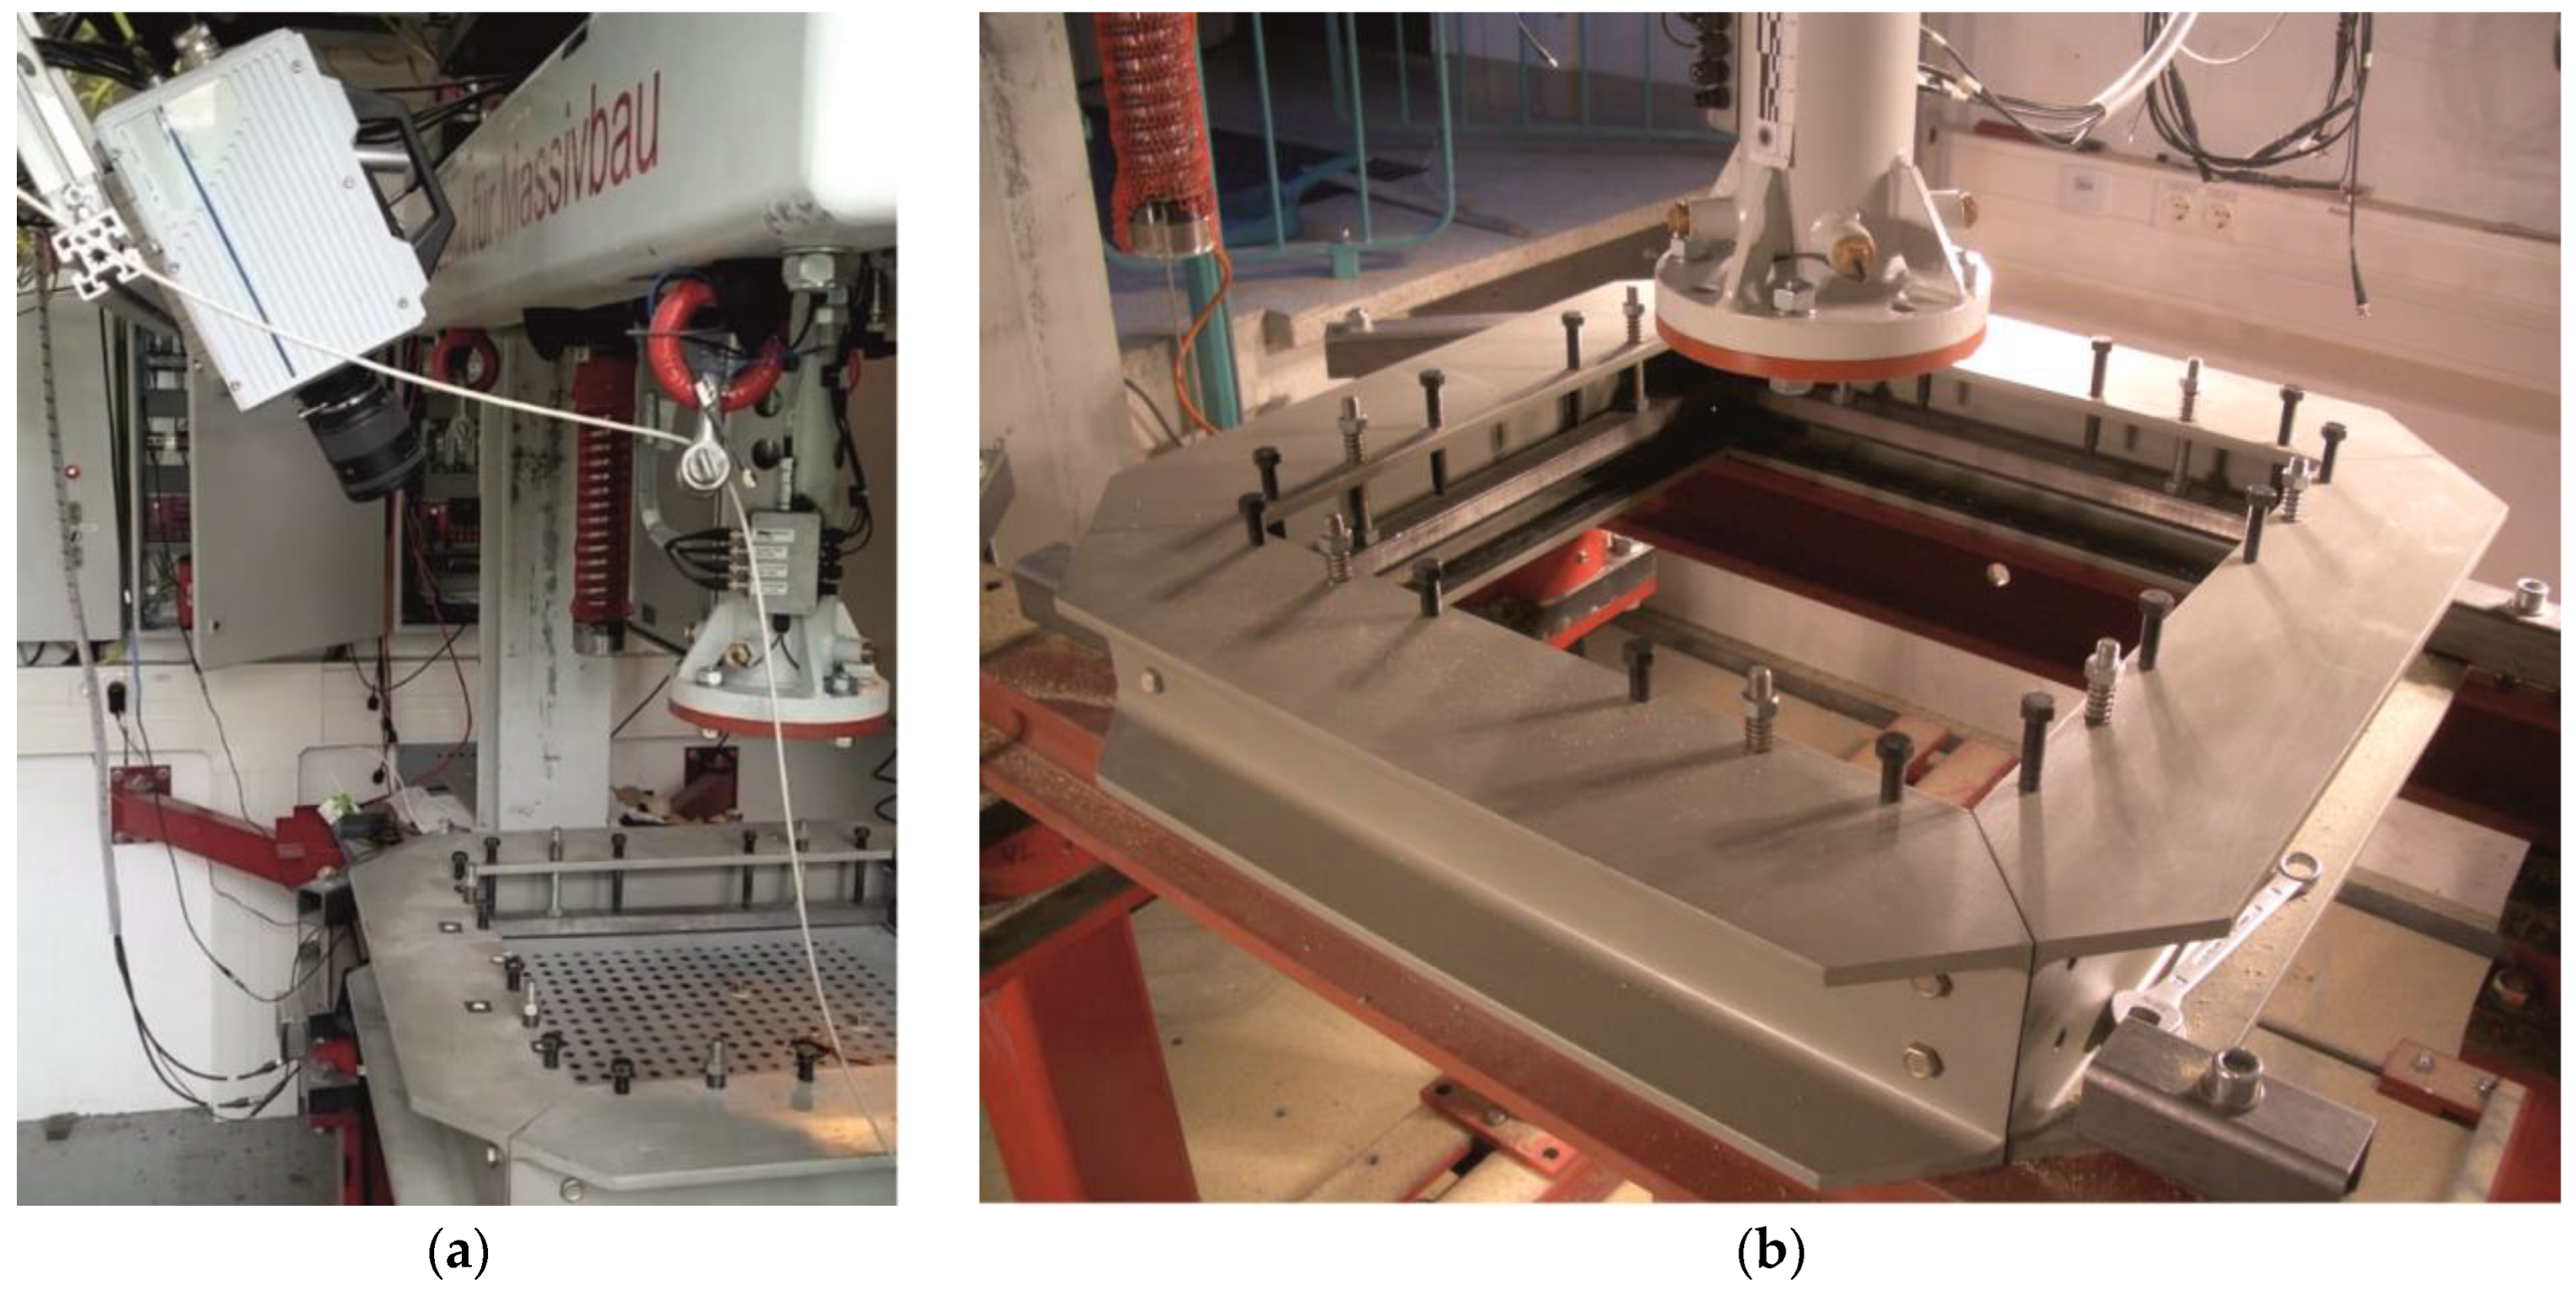
2.4. Experimental Setup and Measurement System
3. Results and Evaluation
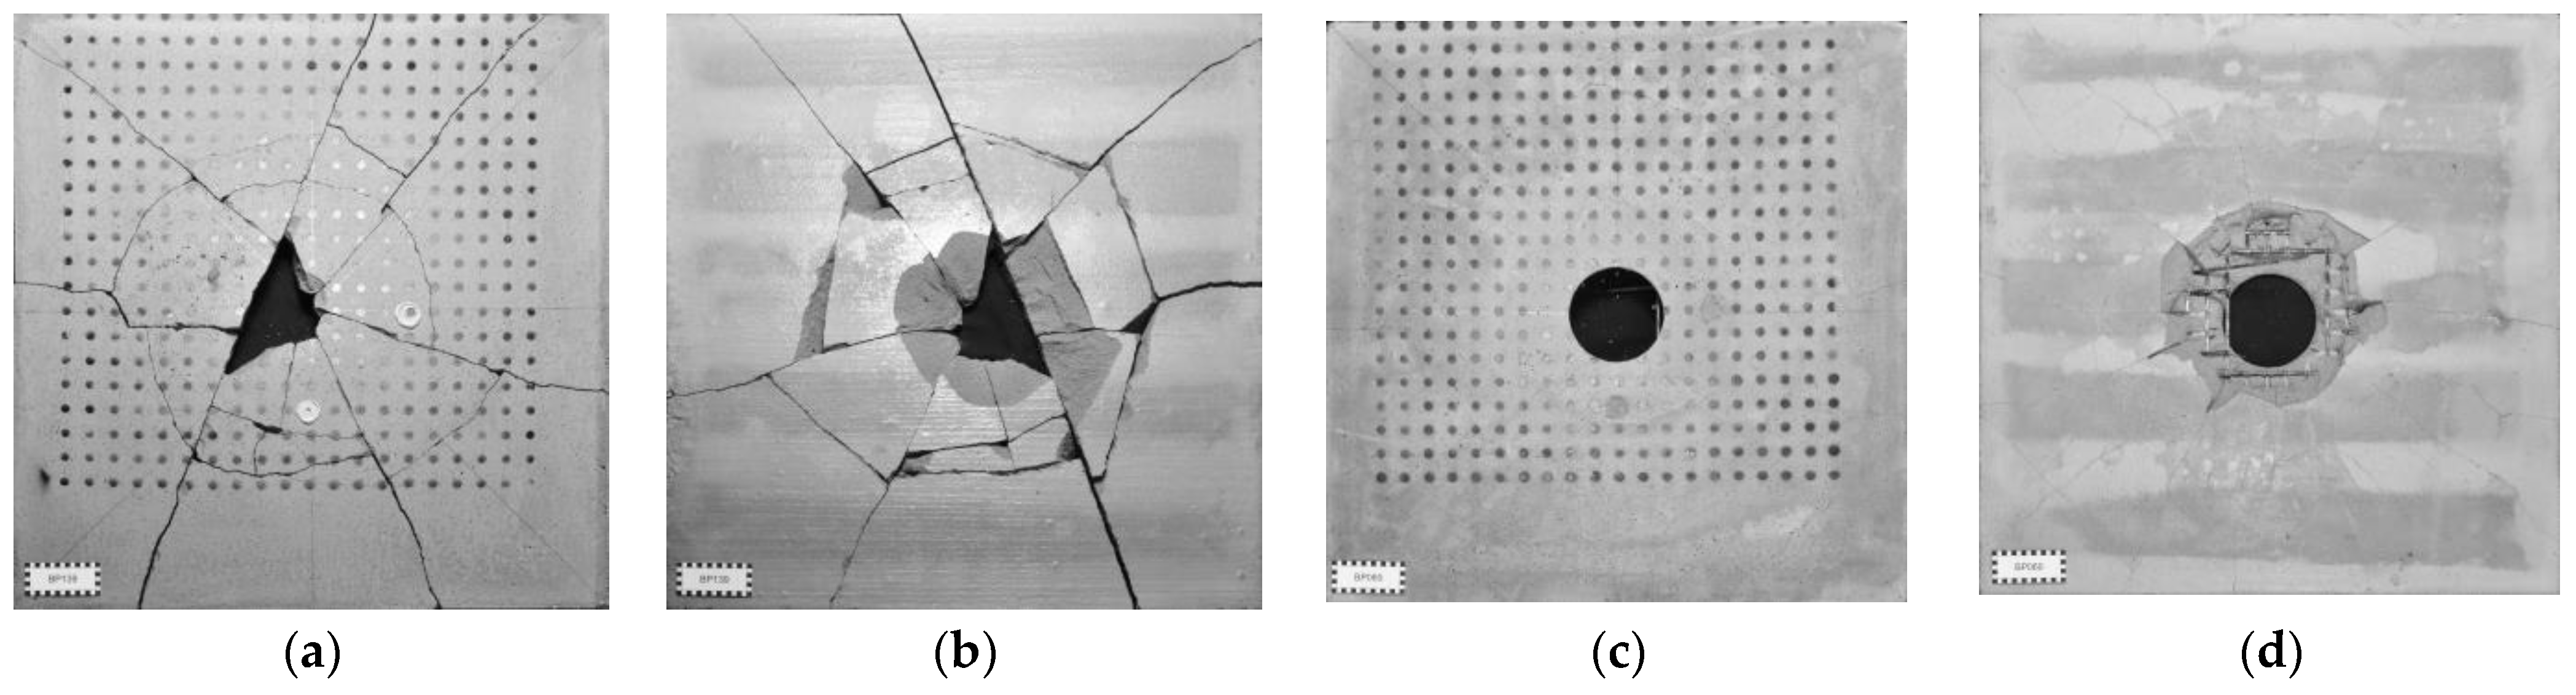
3.1. Experimental Results
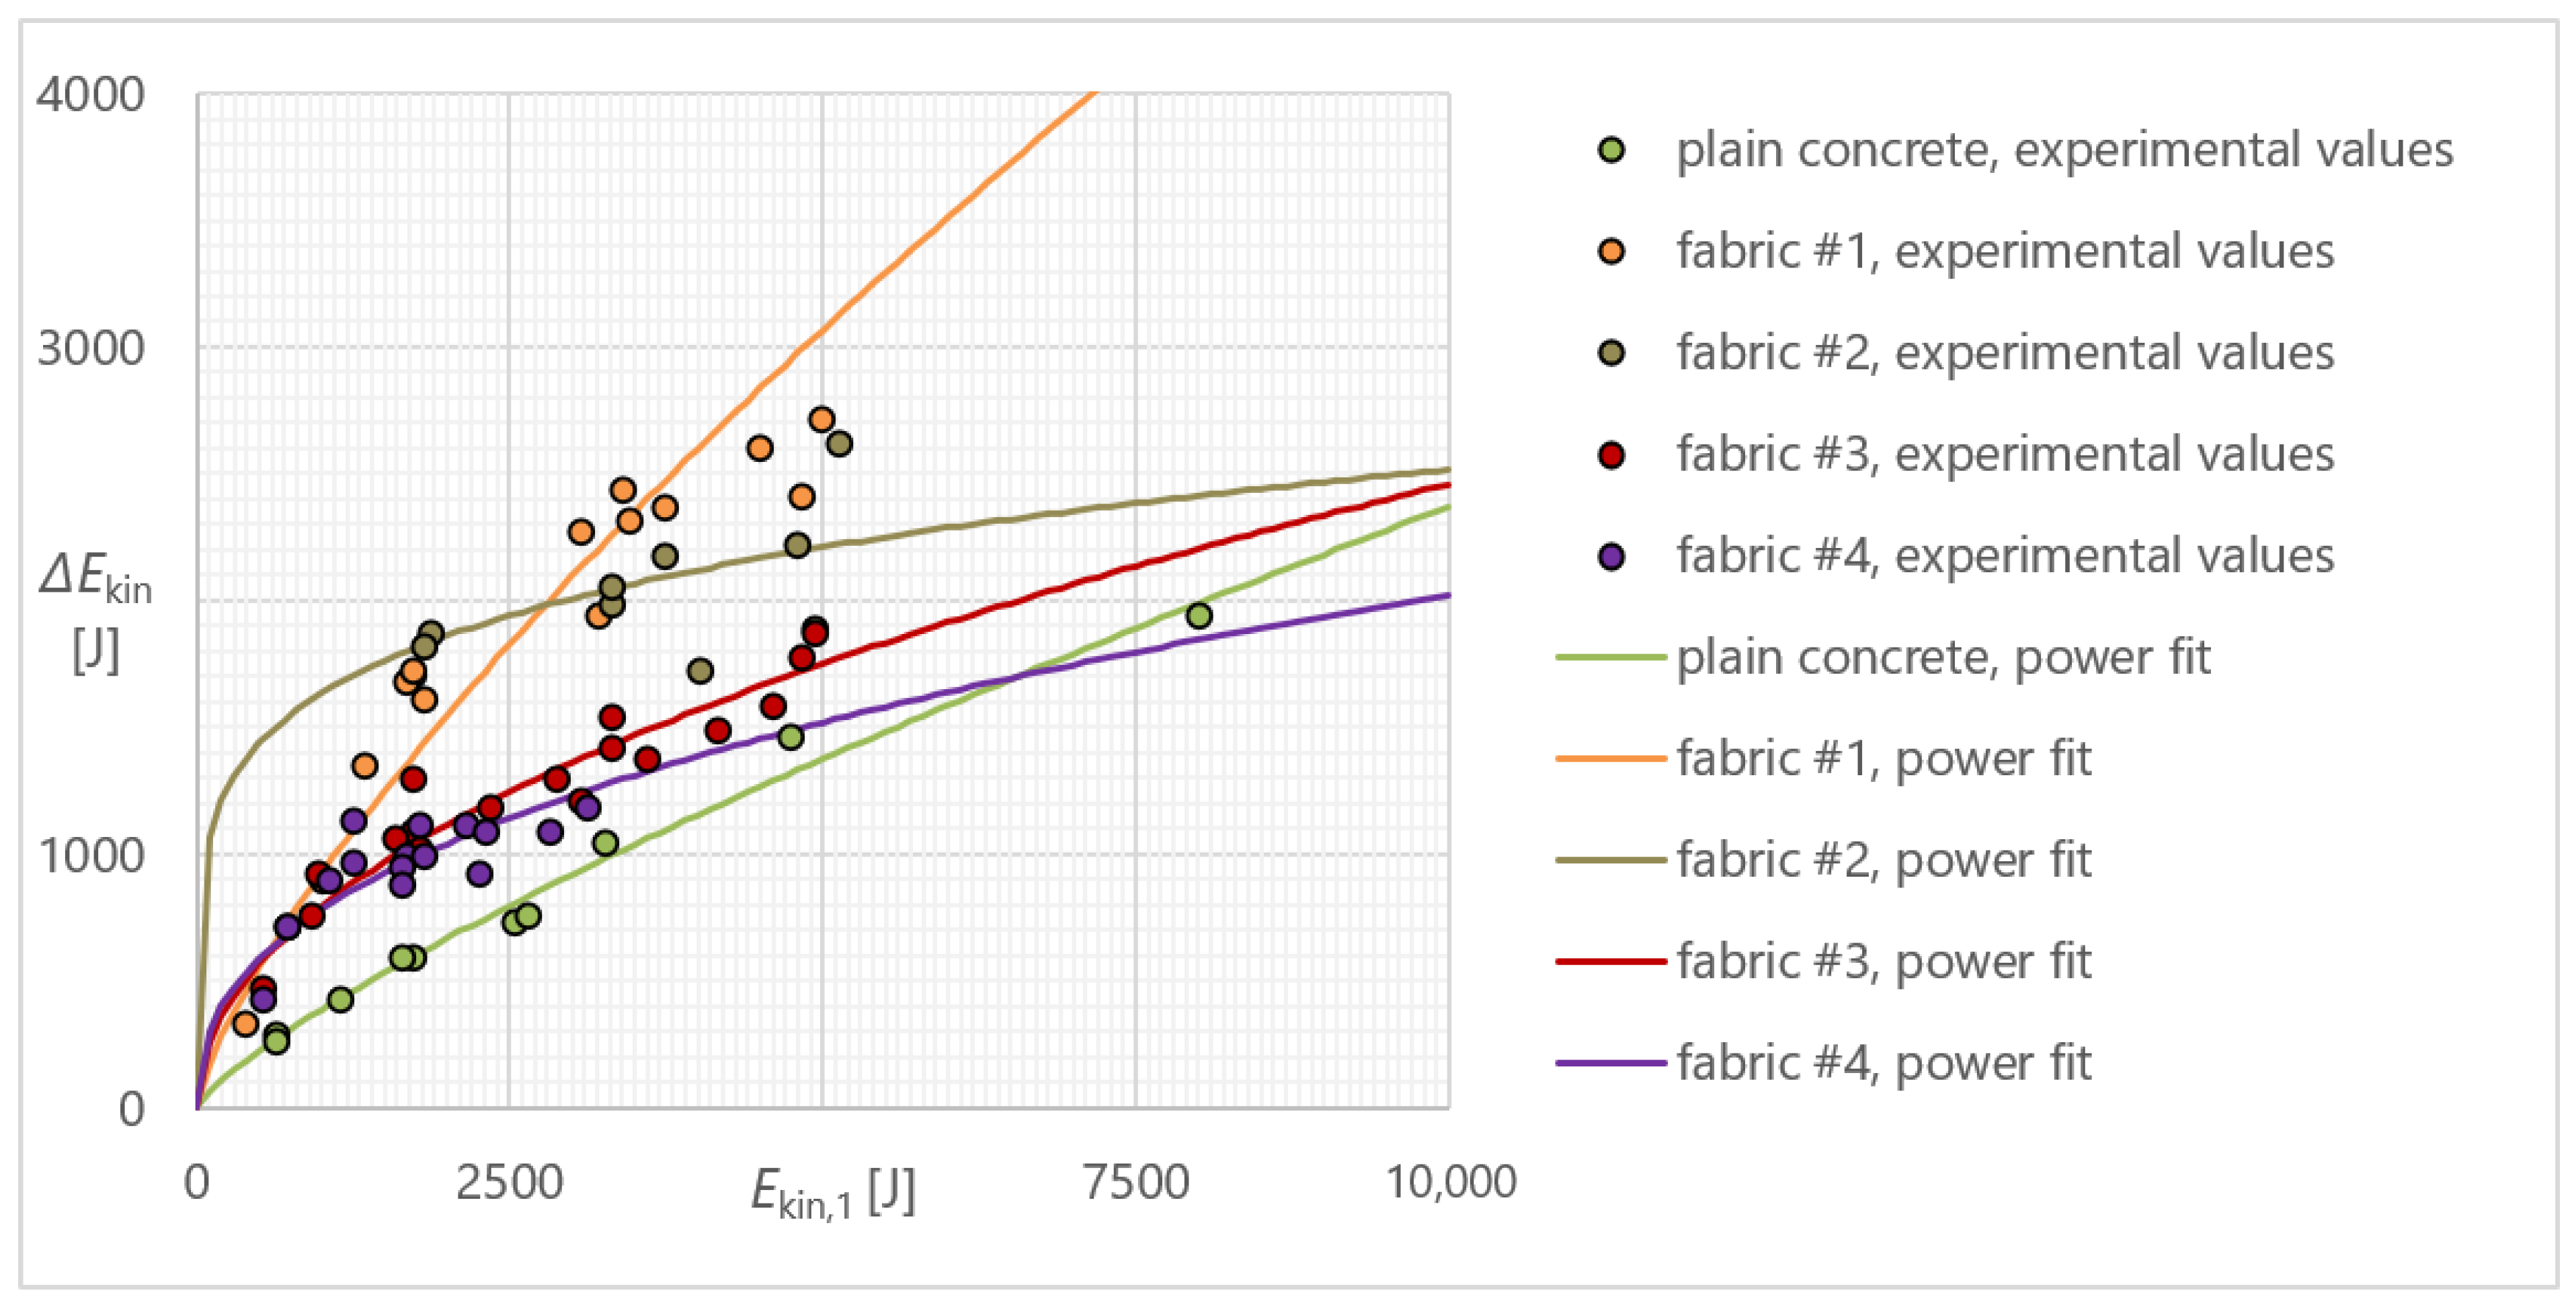
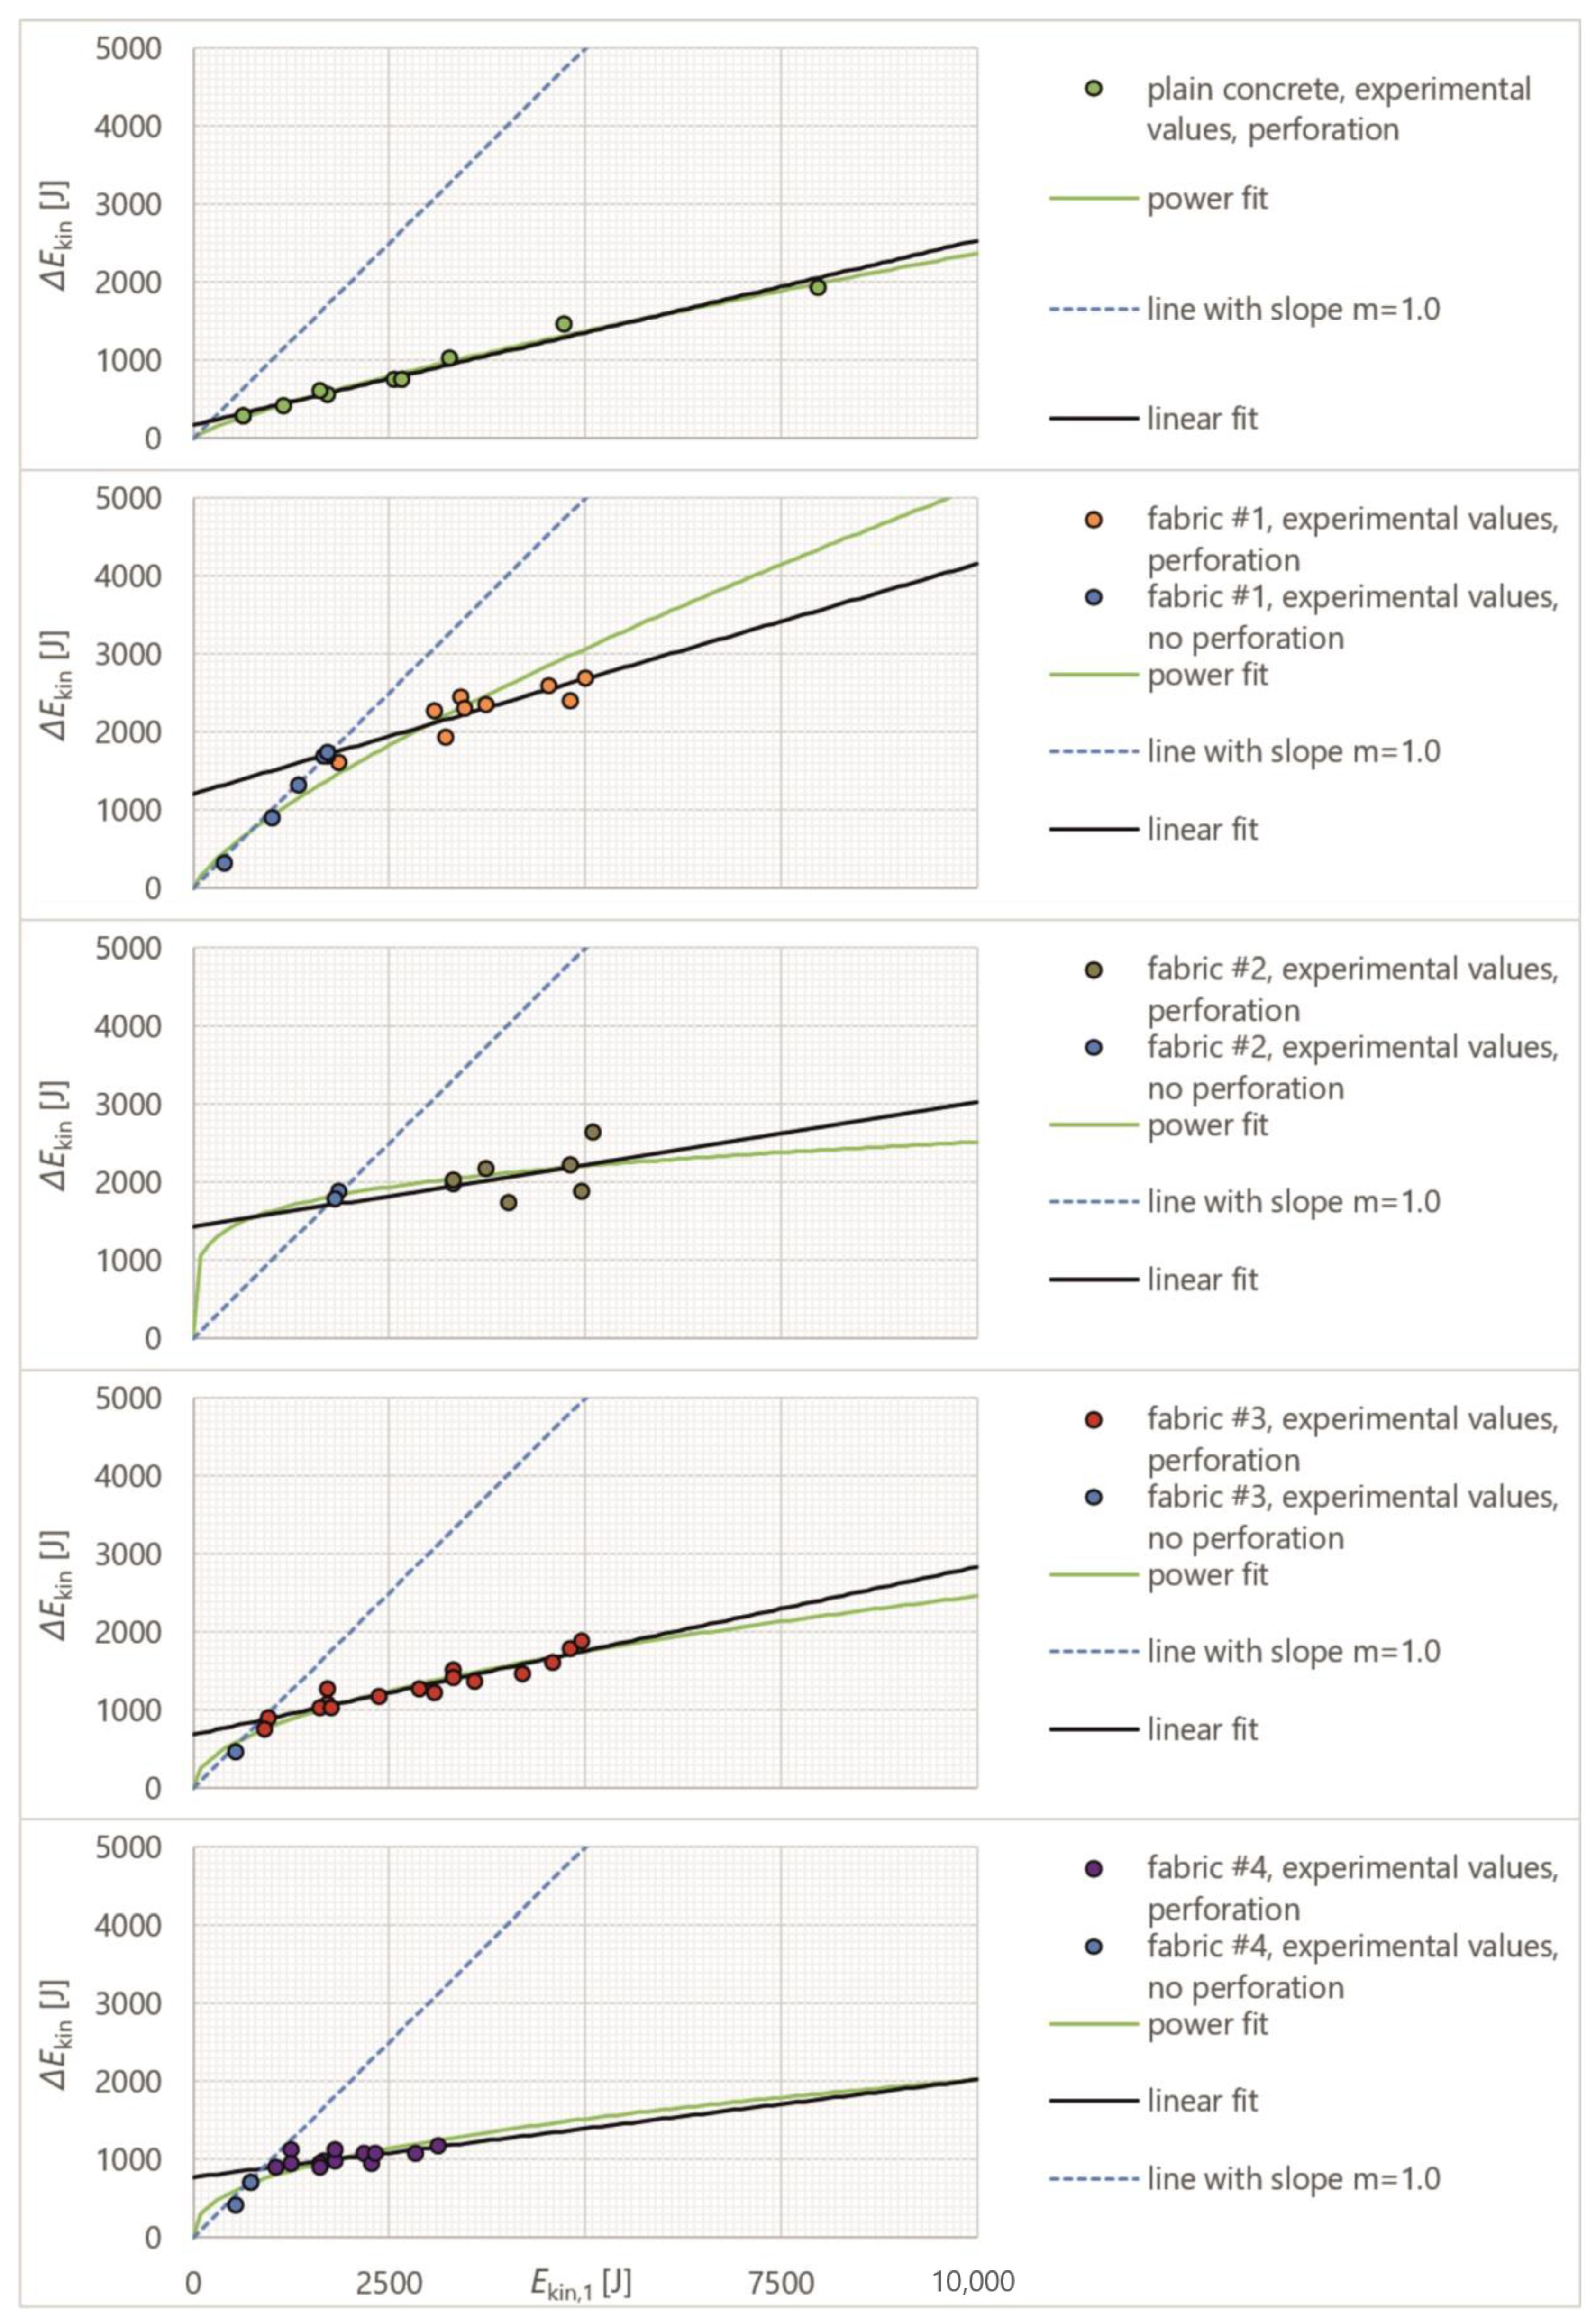
3.2. Experimental Evaluation Based on a Power Function
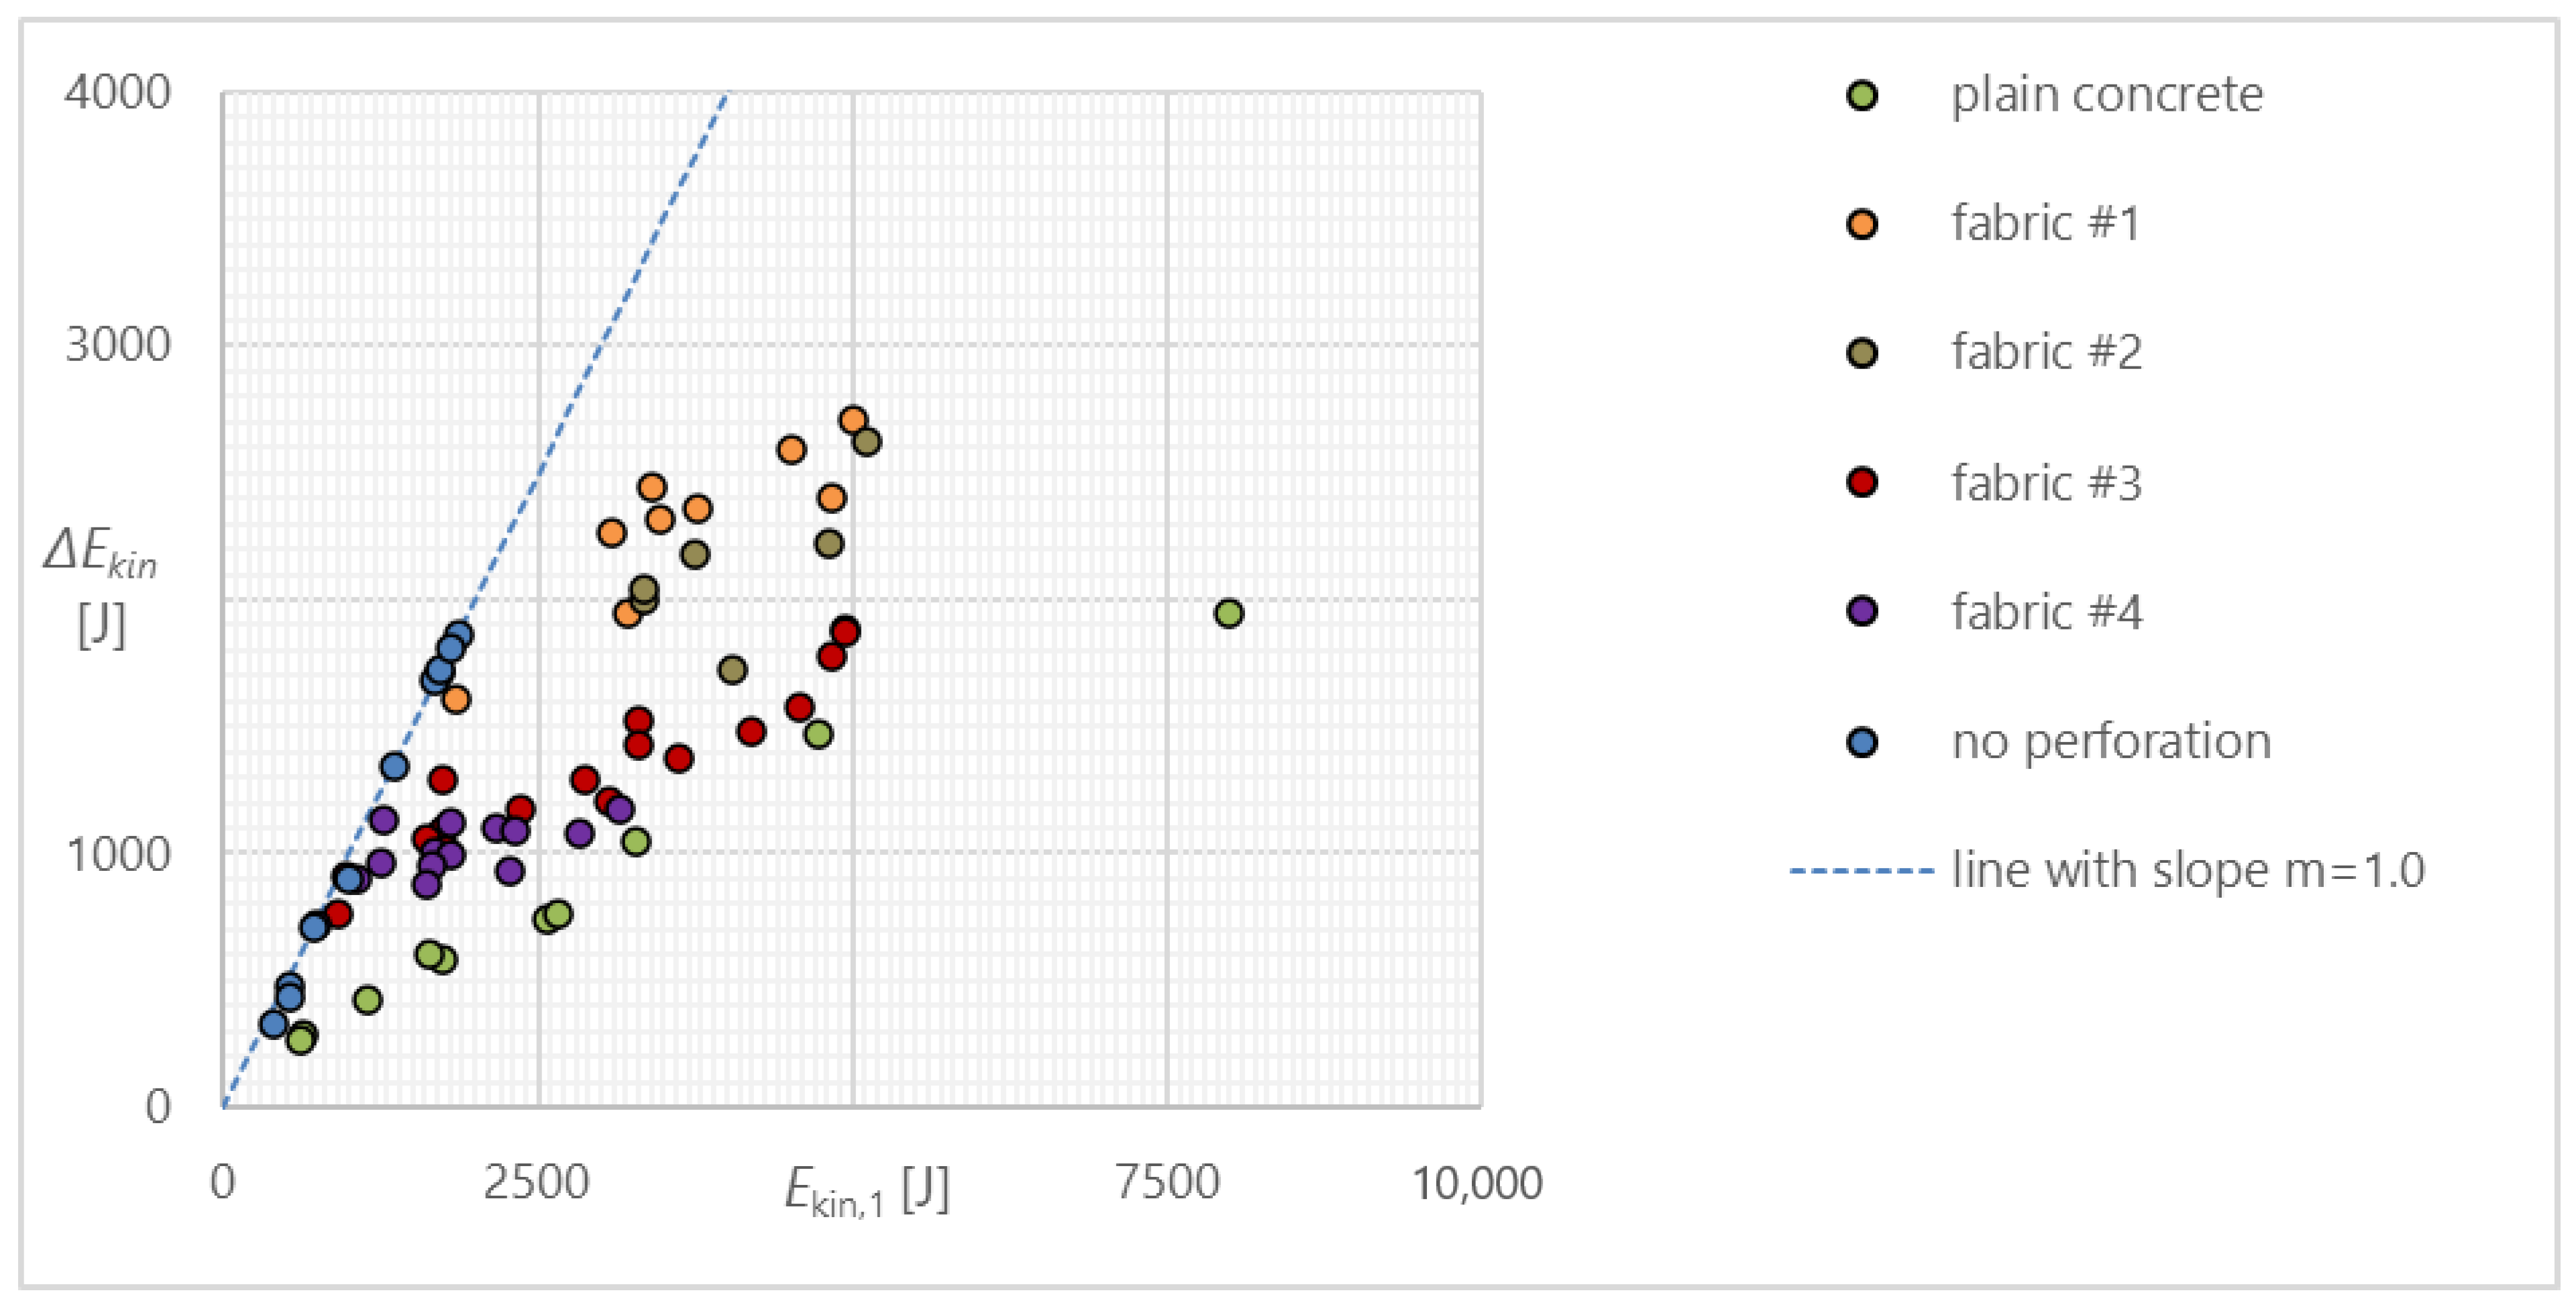
3.3. Experimental Evaluation Based on a Bilinear Functional Approach
3.4. Estimation of Perforation Velocity Based on the Bilinear Fit
4. Conclusions
Author Contributions
Funding
Data Availability Statement
Conflicts of Interest
References
- Hering, M. Untersuchung von Mineralisch Gebundenen Verstärkungsschichten für Stahlbetonplatten Gegen Impaktbeanspruchungen (Investigation of Mineral-Bonded Strengthening Layers for Reinforced Concrete Plates against Impact loads). Ph.D. Thesis, Technische Universität Dresden, Dresden, Germany, 12 August 2020. [Google Scholar]
- Máca, P.; Sovják, R.; Konvalinka, P. Mix design of UHPFRC and its response to projectile impact. Int. J. Impact Eng. 2014, 63, 158–163. [Google Scholar] [CrossRef]
- Sovják, R.; Vavřiník, T.; Zatloukal, J.; Máca, P.; Mičunek, T.; Frydrýn, M. Resistance of slim UHPFRC targets to projectile impact using in-service bullets. Int. J. Impact Eng. 2015, 76, 166–177. [Google Scholar] [CrossRef]
- Scheerer, S.; Zobel, R.; Müller, E.; Senckpiel-Peters, T.; Schmidt, A.; Curbach, M. Flexural Strengthening of RC Structures with TRC—Experimental Observations, Design Approach and Application. Appl. Sci. 2019, 9, 1322. [Google Scholar] [CrossRef]
- Raupach, M.; Cruz, C.M. Textile-reinforced concrete: Selected case studies. In Textile Fibre Composites in Civil Engineering; Triantafillou, T.C., Ed.; Woodhead Publishing: Soston, UK, 2016. [Google Scholar]
- Erhard, E.; Weiland, S.; Lorenz, E.; Schladitz, F.; Beckmann, B.; Curbach, M. Anwendungsbeispiele für Textilbetonverstärkung—Instandsetzung und Verstärkung bestehender Tragwerke mit Textilbeton. Beton Stahlbetonbau 2015, 110, 74–82. [Google Scholar] [CrossRef]
- Hering, M.; Curbach, M. A new testing method for textile reinforced concrete under impact load. In Web of Conferences, Proceedings of the ICCRRR: 5th International Conference on Concrete Repair, Rehabilitation and Retrofitting, Cape Town, South Africa, 19–21 November 2018; Alexander, M.G., Beushausen, H., Dehn, F., Moyo, P., Eds.; EDP Sciences: Ulis, France, 2018. [Google Scholar]
- Hering, M.; Kühn, T.; Curbach, M. Small-scale plate tests with fine concrete in experiment and first simplified simulation. Struct. Concr. 2020, 22, 637–649. [Google Scholar] [CrossRef]
- Tahenti, B.; Coghe, F.; Nasri, R. Ballistic Limit Estimation Approaches for Ballistic Resistance Assessment. Def. Sci. J. 2020, 70, 82–89. [Google Scholar] [CrossRef]
- Johnson, T.H.; Freeman, L.; Hester, J.; Bell, J.L. A Comparison of Ballistic Resistance Testing Techniques in the Department of Defense. IEEE Access 2014, 2, 1442–1455. [Google Scholar] [CrossRef]
- Kneubuehl, B.P. Ballistic Protection; bpk consultancy GmbH: Thun, Switzerland, 2002. [Google Scholar]
- PAGEL® Spezial-Beton GmbH & Co. KG: TEXTILFEINBETON. Technisches Merkblatt 0606/QS-Formblatt 10/21 Rev. 06. Available online: https://www.pagel.com/all/pdf/de/tf10_de.pdf (accessed on 27 April 2022).
- DIN EN 196-1; Prüfverfahren für Zement—Teil 1: Bestimmung der Festigkeit; Deutsche Fassung EN 196-1:2016—Methods of Testing Cement—Part 1: Determination of Strength; German Version EN 196-1:2016. European Standards: Prague, Czech Republic, 2016.
- Valmieras Stikla Škiedra. Technisches Datenblatt S 55–SSA–1363–14SM; Version Nr. 4, 31.03.2010; Valmieras Stikla Škiedra: Riga, Latvia, 2010. [Google Scholar]
- Lorenz, E. Endverankerung und Übergreifung Textiler Bewehrungen in Betonmatrices (End Anchorage and Overlapping of Textile Reinforcements in Concrete). Ph.D. Thesis, Technische Universität Dresden, Dresden, Germany, 16 December 2014. [Google Scholar]
- Schütze, E.; Bielak, J.; Scheerer, S.; Hegger, J.; Curbach, M. Einaxialer Zugversuch für Carbonbeton mit textiler Bewehrung|Uniaxial tensile test for carbon reinforced concrete with textile reinforcement. Beton Stahlbetonbau 2018, 113, 33–47. [Google Scholar] [CrossRef]
- Schütze, E.; Curbach, M. Zur experimentellen Charakterisierung des Verbundverhaltens von Carbonbeton mit Spalten als maßgeblichem Versagensmechanismus. Bauingenieur 2019, 94, 133–141. [Google Scholar] [CrossRef]
- Cherif, C.; Zierold, K.; Curbach, M.; Hering, M. Schlussbericht zu IGF-Vorhaben Nr. 19009 BG Textilverstärkte Betonkonstruktionen für Impaktbeanspruchungen (Impakt-Textilbeton-Konstruktionen); Technische Universität Dresden: Dresden, Germany, 2019. [Google Scholar]
- DIBT. Allgemeine Bauaufsichtliche Zulassung: Verfahren zur Verstärkung von Stahlbeton mit TUDALIT (Textilbewehrter Beton), Zulassungsnummer Z-31.10-182, Geltungsdauer: Vom 1.6. 2015—1.6. 2016; Deutsches Institut für Bautechnik: Berlin, Germany, 2016. [Google Scholar]
- Solidian GmbH. Technisches Datenblatt/Technical Data Sheet Solidian GRID Q142/142-CCE-38, Version 171129, 29.11.2017; Solidian GmbH: Albstadt, Germany, 2017. [Google Scholar]
- Solidian GmbH. Technisches Datenblatt/Technical Data Sheet Solidian GRID Q85/85-CCE-21, Version 190423, 23.04.2019; Solidian GmbH: Albstadt, Germany, 2019. [Google Scholar]
- Just, M.; Curbach, M.; Hering, M. Bauteilverhalten Unter Stoßartiger Beanspruchung Durch Aufprallende Behälter (Flugzeugtanks); Phase 1A: Maßstabseffekte bei Stoßartiger Beanspruchung. Abschlussbericht zum Reaktorsicherheitsforschungs-Vorhaben Nr. 1501438, Gefördert Durch das Bundesministerium für Wirtschaft und Energie (BMWi); Institut für Massivbau der TU Dresden: Hannover, Germany, 2016; 208p. [Google Scholar]
- Hering, M.; Kühn, T.; Curbach, M. Bauteilverhalten Unter Stoßartiger Beanspruchung Durch Aufprallende Behälter (Flugzeugtanks); Phase 1B: Quantifizierung der Schädigungen des Betongefüges, Teilprojekt: Fallturmversuche. Abschlussbericht zum Reaktorsicherheitsforschungs-Vorhaben Nr. 1501479, Gefördert Durch das Bundesministerium für Wirtschaft und Energie (BMWi); Institut für Massivbau der TU Dresden: Hannover, Germany, 2017; 415p. [Google Scholar]


| Label | Material | Impregnation | Mesh Size (mm) | Warp Thread (tex) | Weft Thread (tex) | Youngs- Modulus Warp|Weft (GPa) | Tensile Strength Warp|Weft (GPa) | |
|---|---|---|---|---|---|---|---|---|
| #1 | BZT1-TUDALIT ** | carbon | SBR | 11 × 14 | 3300 | 800 | 170|152 ** | 1.98|2.94 ** |
| #2 | SSA1363 *** | E-Glas | n.a. | 4 × 5 | 640 | 320 | n.a. | n.a. |
| #3 | Solidian GRID Q142/142-CCE-38 * | carbon | EP | 38 × 38 | 6400 | 6400 | >180|>180 **** | 2.50|2.80 **** |
| #4 | Solidian GRID Q85/85-CCE-21 * | carbon | EP | 21 × 21 | 3200 | 3200 | >220|>205 ***** | 3.30|3.55 ***** |
| Fabric | Number of Layers | atex (mm²/m) | Number of Tested Specimens |
|---|---|---|---|
| Plain concrete (pc) | / | 0.00 | 10 |
| #1 | 2 | 173.39 + 31.19 | 15 |
| #2 | 2 | 54.48 + 22.7 | 9 |
| #3 | 1 | 142 | 17 |
| #4 | 1 | 85 | 16 |
| Label Acc. to [1] | v1 (m/s) | v2 (m/s) | Δv (m/s) | Ekin,1 (J) | Ekin,2 (J) | ΔEkin (J) | Perforation | |
|---|---|---|---|---|---|---|---|---|
| pc-1 | BP144 | 12.15 | 9.18 | 2.97 | 620.01 | 353.94 | 266.07 | yes |
| pc-2 | BP139 | 12.31 | 9.18 | 3.13 | 636.45 | 353.94 | 282.51 | yes |
| pc-3 | BP217 | 16.53 | 13.12 | 3.41 | 1147.61 | 722.96 | 424.65 | yes |
| pc-4 | BP140 | 19.68 | 15.65 | 4.03 | 1626.67 | 1028.67 | 598.00 | yes |
| pc-5 | BP065 | 20.30 | 16.54 | 3.76 | 1730.78 | 1149.00 | 581.78 | yes |
| pc-6 | BP066 | 24.71 | 20.84 | 3.87 | 2564.45 | 1824.08 | 740.37 | yes |
| pc-7 | BP218 | 25.17 | 21.28 | 3.89 | 2660.82 | 1901.92 | 758.90 | yes |
| pc-8 | BP141 | 27.95 | 23.07 | 4.88 | 3281.05 | 2235.34 | 1045.71 | yes |
| pc-9 | BP142 | 33.56 | 27.88 | 5.68 | 4730.35 | 3264.64 | 1465.71 | yes |
| pc-10 | BP143 | 43.60 | 37.92 | 5.68 | 7984.03 | 6039.29 | 1944.74 | yes |
| Label Acc. to [1] | v1 (m/s) | v2 (m/s) | Δv (m/s) | Ekin,1 (J) | Ekin,2 (J) | ΔEkin (J) | Perforation | |
|---|---|---|---|---|---|---|---|---|
| #1-1 | BP129 | 9.83 | −4.27 | 14.10 | 405.84 | 76.58 | 329.26 | no |
| #1-2 | BP153 | 15.38 | −4.76 | 20.14 | 993.49 | 95.16 | 898.33 | no |
| #1-3 | BP133 | 17.95 | −1.63 | 19.58 | 1353.25 | 11.16 | 1342.09 | no |
| #1-4 | BP130 | 20.03 | 0.00 | 20.03 | 1685.04 | 0.00 | 1685.04 | no |
| #1-5 | BP127 | 20.18 | 0.00 | 20.18 | 1710.38 | 0.00 | 1710.38 | no |
| #1-6 | BP154 | 20.25 | 0.00 | 20.25 | 1722.26 | 0.00 | 1722.26 | no |
| #1-7 | BP151 | 20.93 | 7.39 | 13.54 | 1839.87 | 229.37 | 1610.50 | yes |
| #1-8 | BP132 | 27.14 | 14.02 | 13.12 | 3093.63 | 825.55 | 2268.08 | yes |
| #1-9 | BP155 | 27.70 | 17.45 | 10.25 | 3222.62 | 1278.91 | 1943.71 | yes |
| #1-10 | BP134 | 28.44 | 15.10 | 13.34 | 3397.10 | 957.64 | 2439.46 | yes |
| #1-11 | BP152 | 28.77 | 16.58 | 12.19 | 3476.39 | 1154.56 | 2321.83 | yes |
| #1-12 | BP128 | 29.92 | 18.28 | 11.64 | 3759.87 | 1403.47 | 2356.40 | yes |
| #1-13 | BP135 | 32.79 | 21.38 | 11.41 | 4515.77 | 1919.84 | 2595.93 | yes |
| #1-14 | BP156 | 33.94 | 24.07 | 9.87 | 4838.08 | 2433.33 | 2404.75 | yes |
| #1-15 | BP131 | 34.53 | 23.41 | 11.12 | 5007.75 | 2301.72 | 2706.03 | yes |
| Label Acc. to [1] | v1 (m/s) | v2 (m/s) | Δv (m/s) | Ekin,1 (J) | Ekin,2 (J) | ΔEkin (J) | Perforation | |
|---|---|---|---|---|---|---|---|---|
| #2-1 | BP020 | 20.78 | 0.00 | 20.78 | 1813.60 | 0.00 | 1813.60 | no |
| #2-2 | BP019 | 21.07 | 0.00 | 21.07 | 1864.57 | 0.00 | 1864.57 | no |
| #2-3 | BP021 | 28.17 | 17.85 | 10.32 | 3332.91 | 1338.21 | 1994.70 | yes |
| #2-4 | BP229 | 28.17 | 17.51 | 10.66 | 3332.91 | 1287.72 | 2045.19 | yes |
| #2-5 | BP022 | 29.85 | 19.28 | 10.57 | 3742.29 | 1561.22 | 2181.07 | yes |
| #2-6 | BP230 | 31.03 | 23.50 | 7.53 | 4044.02 | 2319.45 | 1724.57 | yes |
| #2-7 | BP023 | 33.83 | 24.81 | 9.02 | 4806.77 | 2585.25 | 2221.52 | yes |
| #2-8 | BP231 | 34.29 | 26.98 | 7.31 | 4938.38 | 3057.27 | 1881.11 | yes |
| #2-9 | BP024 | 34.92 | 24.37 | 10.55 | 5121.51 | 2494.37 | 2627.14 | yes |
| #3-1 | BP031 | 11.19 | −3.28 | 14.47 | 525.91 | 45.19 | 480.72 | no |
| #3-2 | BP041 | 14.78 | 6.07 | 8.71 | 917.48 | 154.75 | 762.73 | yes |
| #3-3 | BP029 | 15.29 | 4.06 | 11.23 | 981.89 | 69.23 | 912.66 | yes |
| #3-4 | BP042 | 19.58 | 11.44 | 8.14 | 1610.18 | 549.67 | 1060.51 | yes |
| #3-5 | BP032 | 20.30 | 12.37 | 7.93 | 1730.78 | 642.67 | 1088.11 | yes |
| #3-6 | BP025 | 20.32 | 10.29 | 10.03 | 1734.19 | 444.71 | 1289.48 | yes |
| #3-7 | BP026 | 20.54 | 13.43 | 7.11 | 1771.94 | 757.53 | 1014.41 | yes |
| #3-8 | BP033 | 23.70 | 16.76 | 6.94 | 2359.10 | 1179.77 | 1179.33 | yes |
| #3-9 | BP028 | 26.14 | 19.38 | 6.76 | 2869.86 | 1577.45 | 1292.41 | yes |
| #3-10 | BP039 | 27.02 | 21.04 | 5.98 | 3066.34 | 1859.26 | 1207.08 | yes |
| #3-11 | BP034 | 28.05 | 21.16 | 6.89 | 3304.57 | 1880.53 | 1424.04 | yes |
| #3-12 | BP027 | 28.06 | 20.60 | 7.46 | 3306.93 | 1782.31 | 1524.62 | yes |
| #3-13 | BP035 | 29.36 | 23.11 | 6.25 | 3620.44 | 2243.10 | 1377.34 | yes |
| #3-14 | BP038 | 31.59 | 25.39 | 6.20 | 4191.30 | 2707.54 | 1483.76 | yes |
| #3-15 | BP037 | 33.02 | 26.72 | 6.30 | 4579.35 | 2998.63 | 1580.72 | yes |
| #3-16 | BP030 | 33.94 | 27.00 | 6.94 | 4838.08 | 3061.80 | 1776.28 | yes |
| #3-17 | BP036 | 34.29 | 27.00 | 7.29 | 4938.38 | 3061.80 | 1876.58 | yes |
| #4-1 | BP052 | 11.22 | −4.69 | 15.91 | 528.73 | 92.38 | 436.35 | no |
| #4-2 | BP055 | 13.02 | 0.00 | 13.02 | 711.99 | 0.00 | 711.99 | no |
| #4-3 | BP053 | 13.20 | 1.98 | 11.22 | 731.81 | 16.47 | 715.34 | yes |
| #4-4 | BP049 | 15.94 | 6.30 | 9.64 | 1067.15 | 166.70 | 900.45 | yes |
| #4-5 | BP061 | 17.29 | 8.32 | 8.97 | 1255.57 | 290.73 | 964.84 | yes |
| #4-6 | BP056 | 17.39 | 5.68 | 11.71 | 1270.13 | 135.50 | 1134.63 | yes |
| #4-7 | BP062 | 19.61 | 13.21 | 6.40 | 1615.12 | 732.92 | 882.20 | yes |
| #4-8 | BP057 | 19.80 | 12.90 | 6.90 | 1646.57 | 698.92 | 947.65 | yes |
| #4-9 | BP051 | 20.02 | 12.72 | 7.30 | 1683.36 | 679.55 | 1003.81 | yes |
| #4-10 | BP063 | 20.67 | 12.68 | 7.99 | 1794.45 | 675.29 | 1119.16 | yes |
| #4-11 | BP054 | 20.72 | 13.91 | 6.81 | 1803.14 | 812.65 | 990.49 | yes |
| #4-12 | BP058 | 22.77 | 15.98 | 6.79 | 2177.59 | 1072.51 | 1105.08 | yes |
| #4-13 | BP059 | 23.28 | 17.88 | 5.40 | 2276.23 | 1342.72 | 933.51 | yes |
| #4-14 | BP064 | 23.46 | 17.06 | 6.40 | 2311.56 | 1222.38 | 1089.18 | yes |
| #4-15 | BP060 | 25.96 | 20.43 | 5.53 | 2830.47 | 1753.02 | 1077.45 | yes |
| #4-16 | BP050 | 27.34 | 21.61 | 5.73 | 3139.40 | 1961.37 | 1178.03 | yes |
| Reinforcement Configuration | a (-) | p (-) | R2 (-) |
|---|---|---|---|
| plain concrete | 1.695 | 0.7864 | 0.9847 |
| #1 | 5.390 | 0.7448 | 0.8921 |
| #2 | 447.890 | 0.1874 | 0.2809 |
| #3 | 26.815 | 0.4906 | 0.9062 |
| #4 | 45.241 | 0.4126 | 0.6755 |
| Reinforcement Configuration | m (-) | n (J) | R2 (-) |
|---|---|---|---|
| Plain concrete | 0.236 | 173.6 | 0.9757 |
| #1 | 0.295 | 1208.5 | 0.7682 |
| #2 | 0.159 | 1428.7 | 0.1771 |
| #3 | 0.215 | 688.6 | 0.8890 |
| #4 | 0.125 | 774.7 | 0.4470 |
| Ekin,1,PI = ΔEkin,PI(J) | vperf(m/s) | |
|---|---|---|
| plain concrete | 227.30 | 7.36 |
| #1 | 1713.46 | 20.20 |
| #2 | 1699.62 | 20.12 |
| #3 | 876.69 | 14.45 |
| #4 | 885.19 | 14.52 |
Disclaimer/Publisher’s Note: The statements, opinions and data contained in all publications are solely those of the individual author(s) and contributor(s) and not of MDPI and/or the editor(s). MDPI and/or the editor(s) disclaim responsibility for any injury to people or property resulting from any ideas, methods, instructions or products referred to in the content. |
© 2023 by the authors. Licensee MDPI, Basel, Switzerland. This article is an open access article distributed under the terms and conditions of the Creative Commons Attribution (CC BY) license (https://creativecommons.org/licenses/by/4.0/).
Share and Cite
Hering, M.; Sievers, J.; Curbach, M.; Beckmann, B. An Approach to Predicting the Ballistic Limit of Thin Textile-Reinforced Concrete Plates Based on Experimental Results. Buildings 2023, 13, 2234. https://doi.org/10.3390/buildings13092234
Hering M, Sievers J, Curbach M, Beckmann B. An Approach to Predicting the Ballistic Limit of Thin Textile-Reinforced Concrete Plates Based on Experimental Results. Buildings. 2023; 13(9):2234. https://doi.org/10.3390/buildings13092234
Chicago/Turabian StyleHering, Marcus, Jürgen Sievers, Manfred Curbach, and Birgit Beckmann. 2023. "An Approach to Predicting the Ballistic Limit of Thin Textile-Reinforced Concrete Plates Based on Experimental Results" Buildings 13, no. 9: 2234. https://doi.org/10.3390/buildings13092234