Article

Design Methodology of U-Shaped Infilled Composite Beams with Angled Shear Connectors Using Finite Element Analysis

1
Regional Center for Land, Infrastructure and Transport Technology, Kyungpook National University, Daegu 41566, Republic of Korea
2
School of Architecture, Kyungpook National University, Daegu 41566, Republic of Korea
*
Author to whom correspondence should be addressed.
Buildings 2023, 13(9), 2221; https://doi.org/10.3390/buildings13092221
Submission received: 5 July 2023 / Revised: 22 August 2023 / Accepted: 29 August 2023 / Published: 31 August 2023
(This article belongs to the Special Issue Modeling and Simulation of Reinforced Concrete Structures)

Abstract

:
A composite beam is a structural member that behaves as a single unit by using shear connectors between a concrete slab and an I-shaped steel girder. The composite ratio is crucial and is determined by the shear connectors’ ability to withstand the horizontal shear forces between the concrete and steel girder. In this study, a U-shaped composite beam was designed, which differs from conventional composite beams as it allows the use of a steel girder as a formwork. Moreover, angle-type shear connectors, instead of stud-type connectors, were employed. Based on this design, large-scale U-shaped composite beams with angle-type shear connectors were fabricated, and load tests were conducted to analyze the behavior after composite action and the influence of shear connector spacing. Additionally, the strength of the angle-type shear connectors used in this paper was evaluated through finite element analysis. Finally, a strength evaluation method for composite beams of this configuration is proposed.

1. Introduction

In order to increase the land utilization ratio, modern buildings are undergoing a trend towards high-rise construction and longer spans. Consequently, the selection of structural systems that satisfy the economic use of materials and the efficiency of construction methods has become a crucial issue. Each individual material possesses its own advantages and drawbacks. Notably, concrete and steel are commonly used structural materials. Concrete boasts excellent fire resistance and sound insulation; however, a significant drawback is its inability to bear tensile loads effectively. Conversely, steel exhibits uniform high strength properties, yet suffers from poor fire resistance and susceptibility to corrosion. Consequently, to address these distinctive strengths and weaknesses, composite structures have emerged as a solution.
Composite beams, among various composite members, utilize shear connectors to leverage the advantages of concrete and steel, achieving efficiency in structural performance. In order to resist the horizontal shear forces at the interface between the steel girder and the concrete slab, stud anchors are commonly used. Currently, the majority of composite beams in use are of the exposed type, where a concrete slab is placed on top of a steel girder, and extensive research has been conducted on this configuration [1,2,3]. Efforts are currently underway to expedite the construction timeline of composite beams. As a result, extensive research is being conducted on U-shaped composite beams, where the steel frame acts as formwork, contributing to an augmented horizontal shear force between the concrete and the steel frame [4,5,6,7,8]. The U-shaped composite beam entails the fabrication of a U-shaped steel frame, which is subsequently filled with concrete. While the act of infilling concrete brings about disadvantages, including an escalation in applied loads and the potential occurrence of internal corrosion, it concurrently amplifies the transmission of horizontal shear forces. In contrast to the traditional exposed composite beams, which exclusively assess shear strength based on the web strength of the steel frame and consequently lead to excessively cautious designs, infilled composite beams experience a rise in shear strength due to the concrete infill that lends support to the steel frame’s web. Thus, there arises a necessity to delve into the study of U-shaped infilled composite beams. Furthermore, within this study, when employing shear connectors in infilled composite beams, the need for supplementary spacing supports may arise to withstand the lateral pressure of the concrete. However, by utilizing angled shear connectors, not only can they fulfill the role of shear connectors but they can also concurrently serve as spacing supports. As a result, in this study, angled shear connectors were utilized.
The existing design equations [9] are only used for channel-type and stud-type shear connectors. There are no design equations available for angle-type shear connectors. Therefore, the strength of angle-type shear connectors is currently designed based on design equations for channel-type shear connectors, which have a similar form [10,11,12]. In this paper, we evaluate the flexural capacity of composite beams using angle-type shear connectors and present a corresponding finite element analysis model. Ultimately, through the finite element analysis model, we aim to propose a design method for angle-type shear connectors of a similar configuration to that of this paper.

2. Experiment

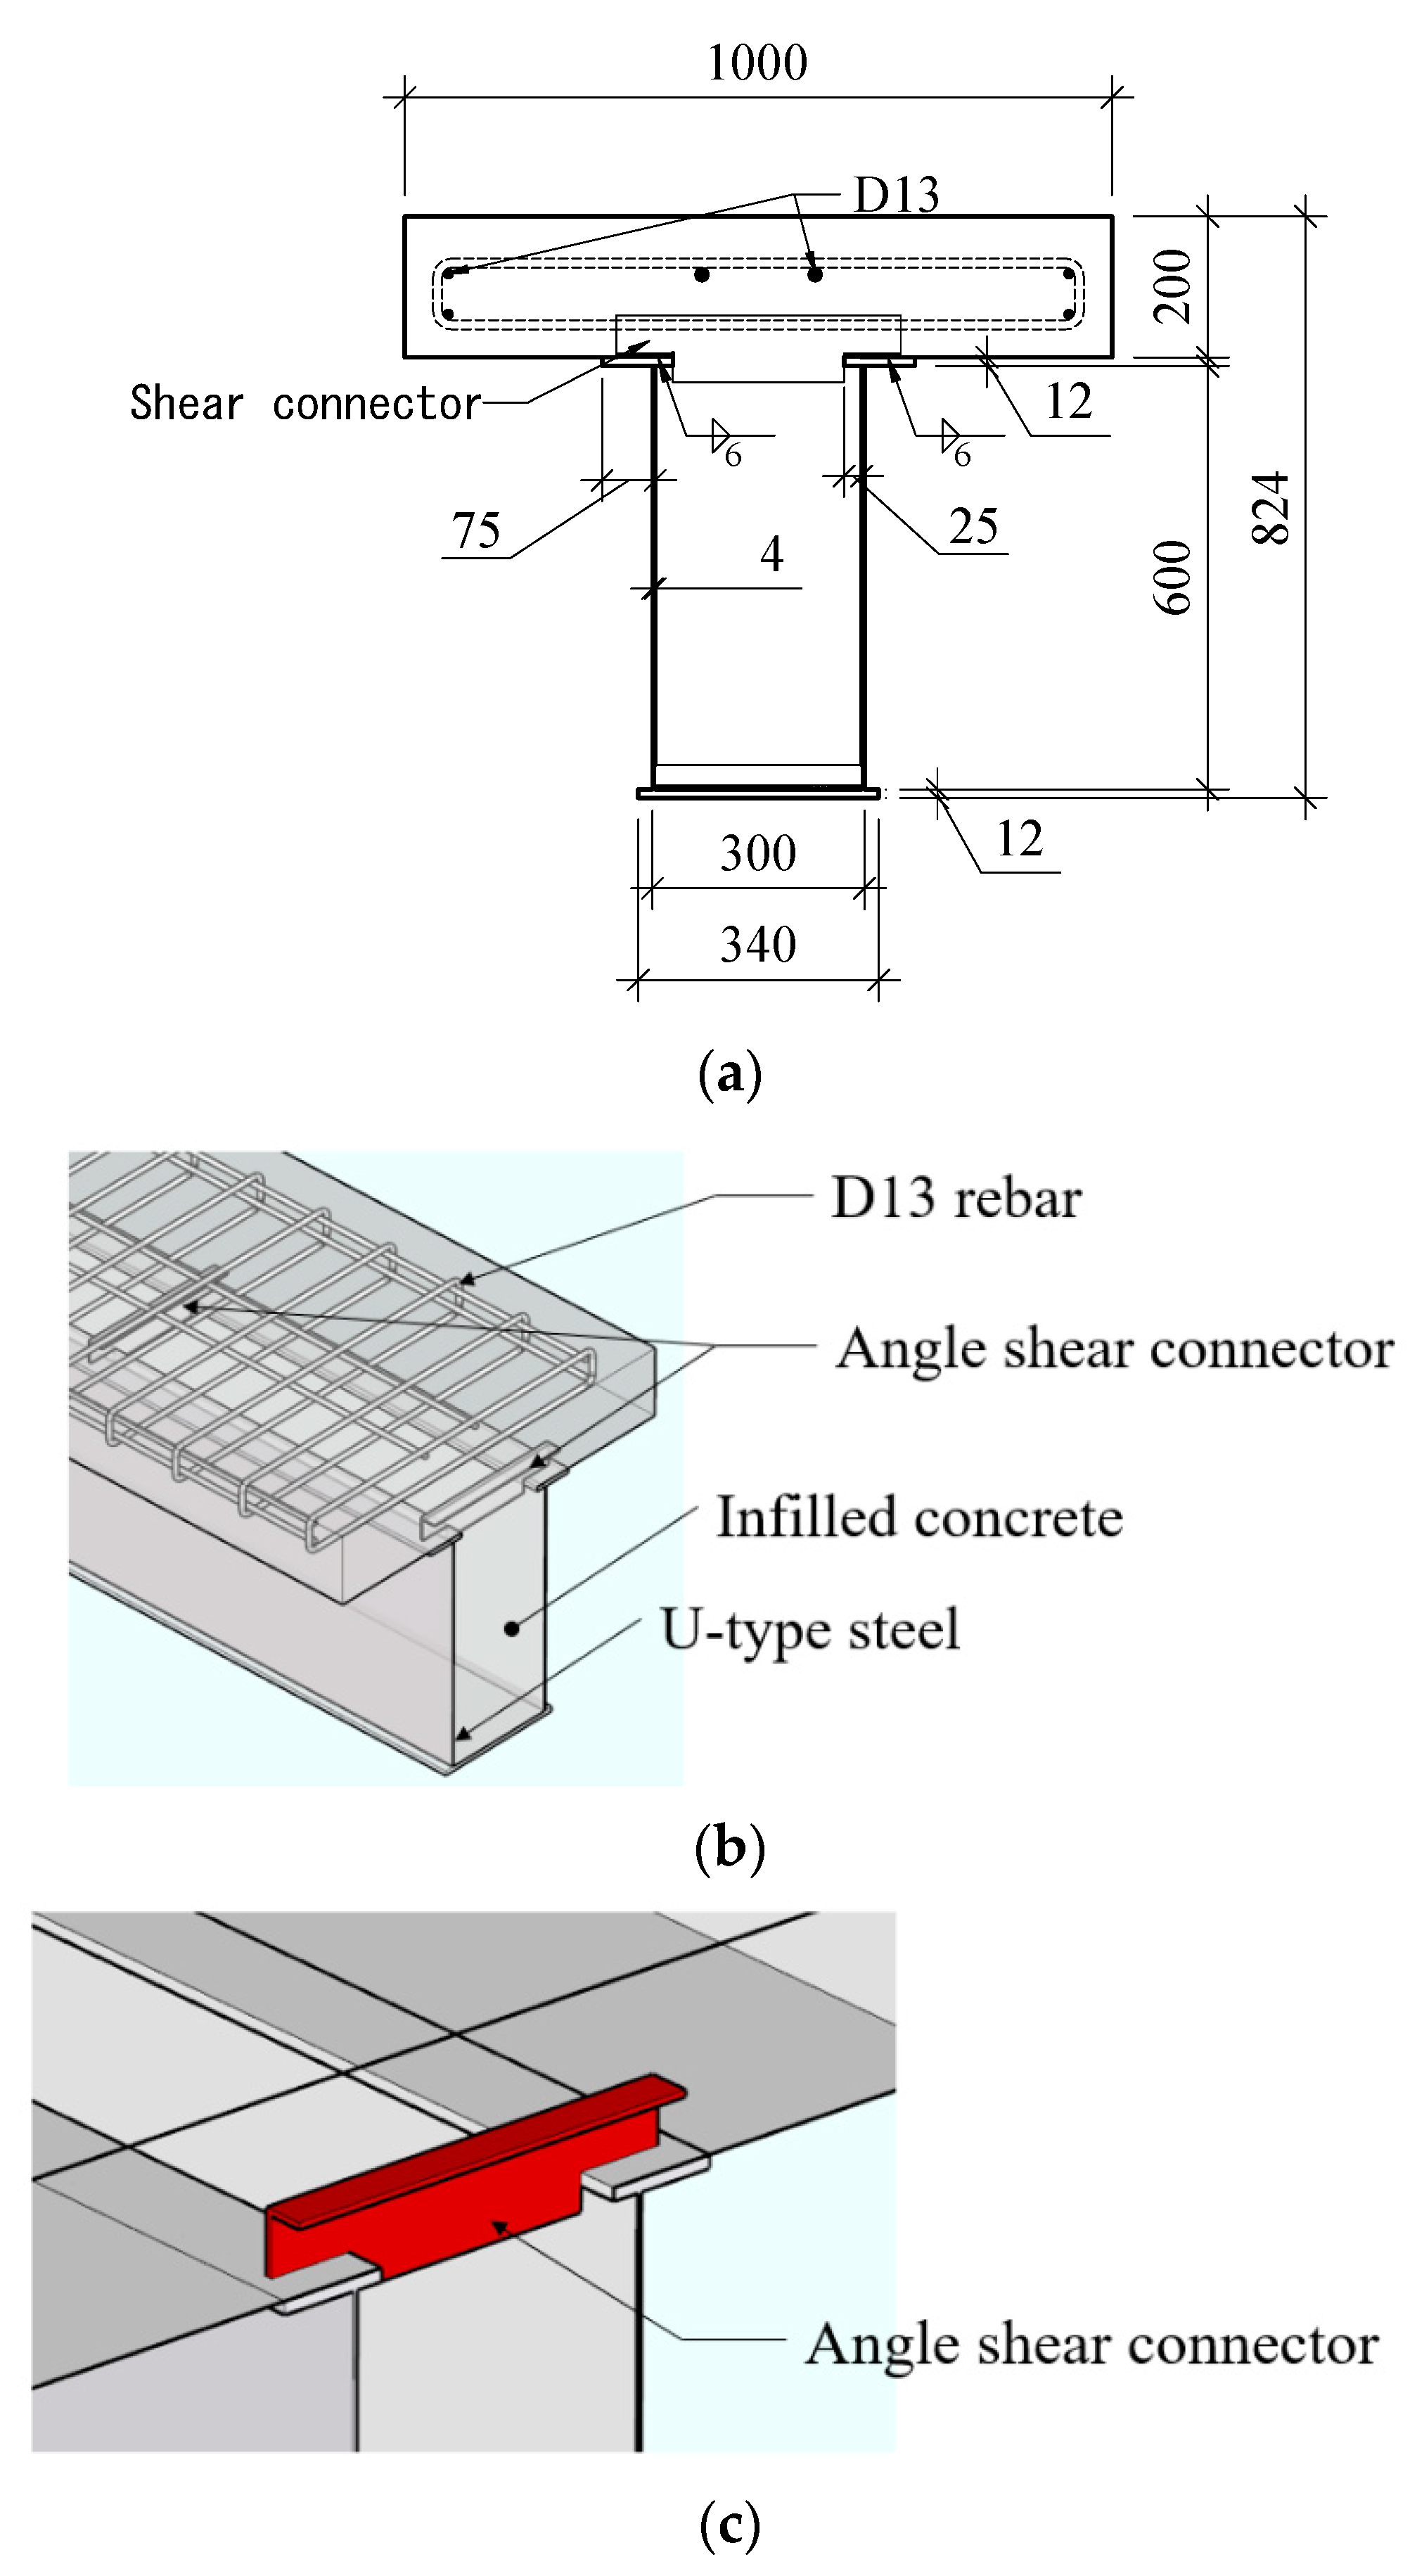
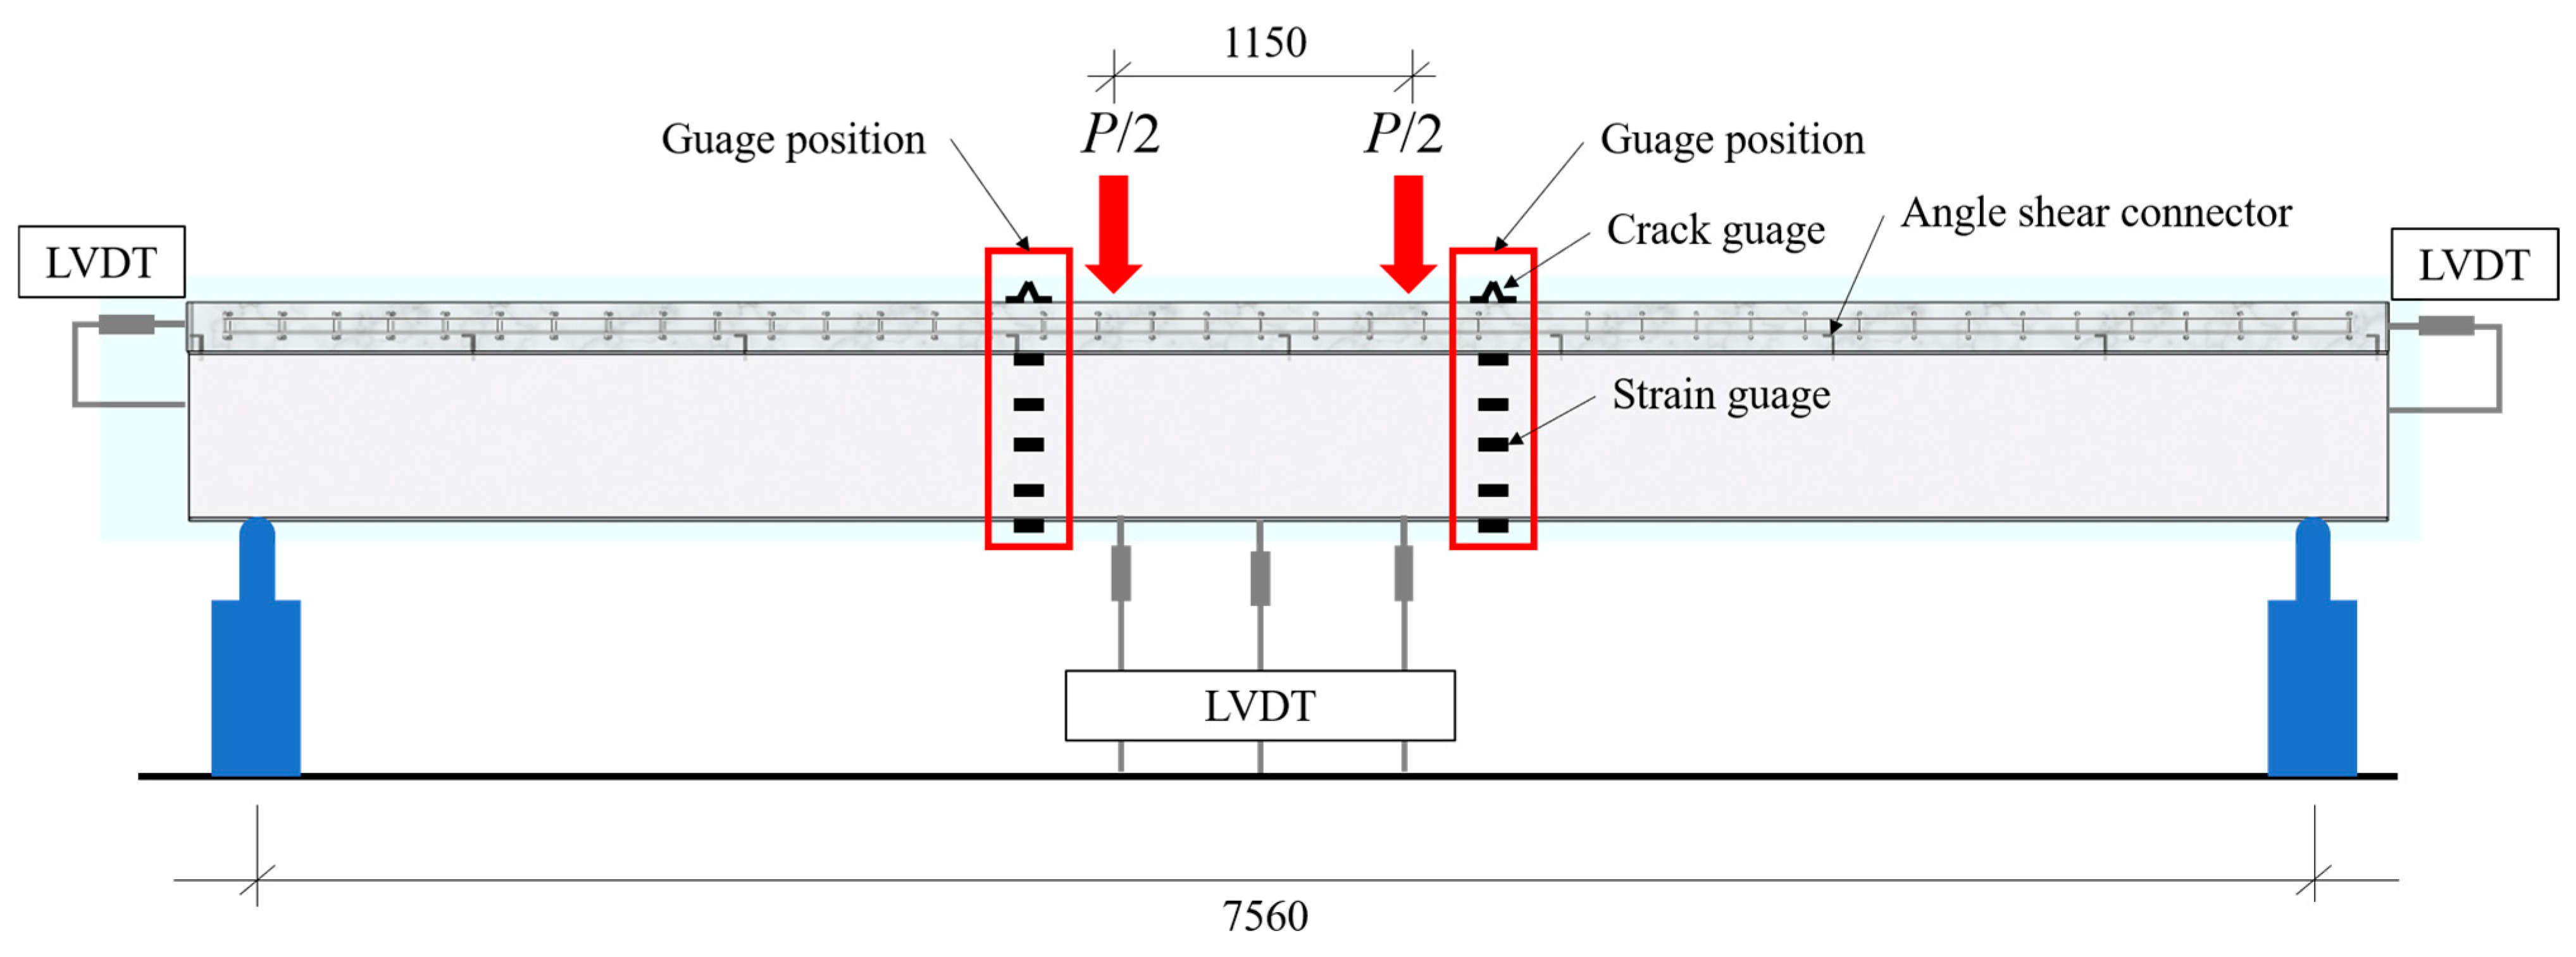
2.1. Experimental Plan

One of the crucial factors determining the maximum strength in composite beams is the degree of composite action between the concrete and the steel girder. In this paper, the spacing of shear connectors, which directly affects the degree of composite action, was set as a variable. The design of the composite beams was planned in a manner by which the experiment concludes upon concrete crushing, and the strength of the shear connectors was designed based on the existing design equations. Table 1 summarizes the names of the specimens and their corresponding variables. CB-21 and CB-13 were designed to exhibit fully composite behavior, while the CB-9 specimen was intended to demonstrate partial composite behavior. The height of the steel girder was set to 624 mm, and the height of the slab was 200 mm, resulting in a total height of 824 mm for the specimens. The length of the specimens was set to 8080 mm to match the site conditions. For the distribution of moments, a two-point loading scheme was planned with a distance of 1150 mm, taking into consideration the site conditions. The spacing of the shear connectors was set to 1000 mm, 600 mm, and 400 mm, respectively. The shear connectors were designed in the form of angle-type shear connectors with a height of 80 mm, a width of 400 mm, and a thickness of 6 mm. The reinforcement for the slab included D13 bars for main reinforcement and D10 bars for tie reinforcement, installed at 200 mm intervals. The concrete was designed with a strength of 24 MPa. The web of the steel girder was made of SS275 (equivalent to A36), and the flange and shear connectors were made of SM355 (equivalent to A572) steel.
Figure 1a shows a cross-section of the composite beam. The size of the concrete slab was set to 1000 × 200 (width × thickness), considering the experimental conditions and loading range. The thickness of the steel girder web was set to 4 mm, and the width of the bottom flange was 340 mm. Figure 1b represents a perspective view of the specimen, showing the appearance of the shear connectors and the reinforcement. The shear connectors were installed at points that do not affect the reinforcement, and their shape was installed in a configuration that connects the upper flange as indicated in Figure 1c. The shear connectors were oriented in the same direction for ease of installation.
Figure 2 shows the experimental set up of the specimen. The specimen length was set to 8080 mm to match the field conditions, with a span of 7560 mm. For the distribution of moments, a two-point loading configuration was employed, considering the field conditions, with a spacing of 1150 mm planned for the experiments. The specimen was subjected to a two-point loading using a Universal Testing Machine (UTM) with a capacity of 10 MN. The loading speed was controlled at 0.05 mm/s. The test was terminated when the strength decreased to 80% of the maximum load after reaching the maximum load.
Displacement gauges were installed at the center of the beam and at the loading points to measure the deflection of the beam. Additional displacement gauges were also installed at both ends to measure the slip between the concrete and the steel beam. Strain gauges were placed near the loading points to locate the neutral axis during yielding. Crack gauges were installed on the top surface of the slab to measure the deformation of the concrete. Furthermore, strain gauges were attached at intervals of 1000 mm near the loading points to assess the yield point of the flange.

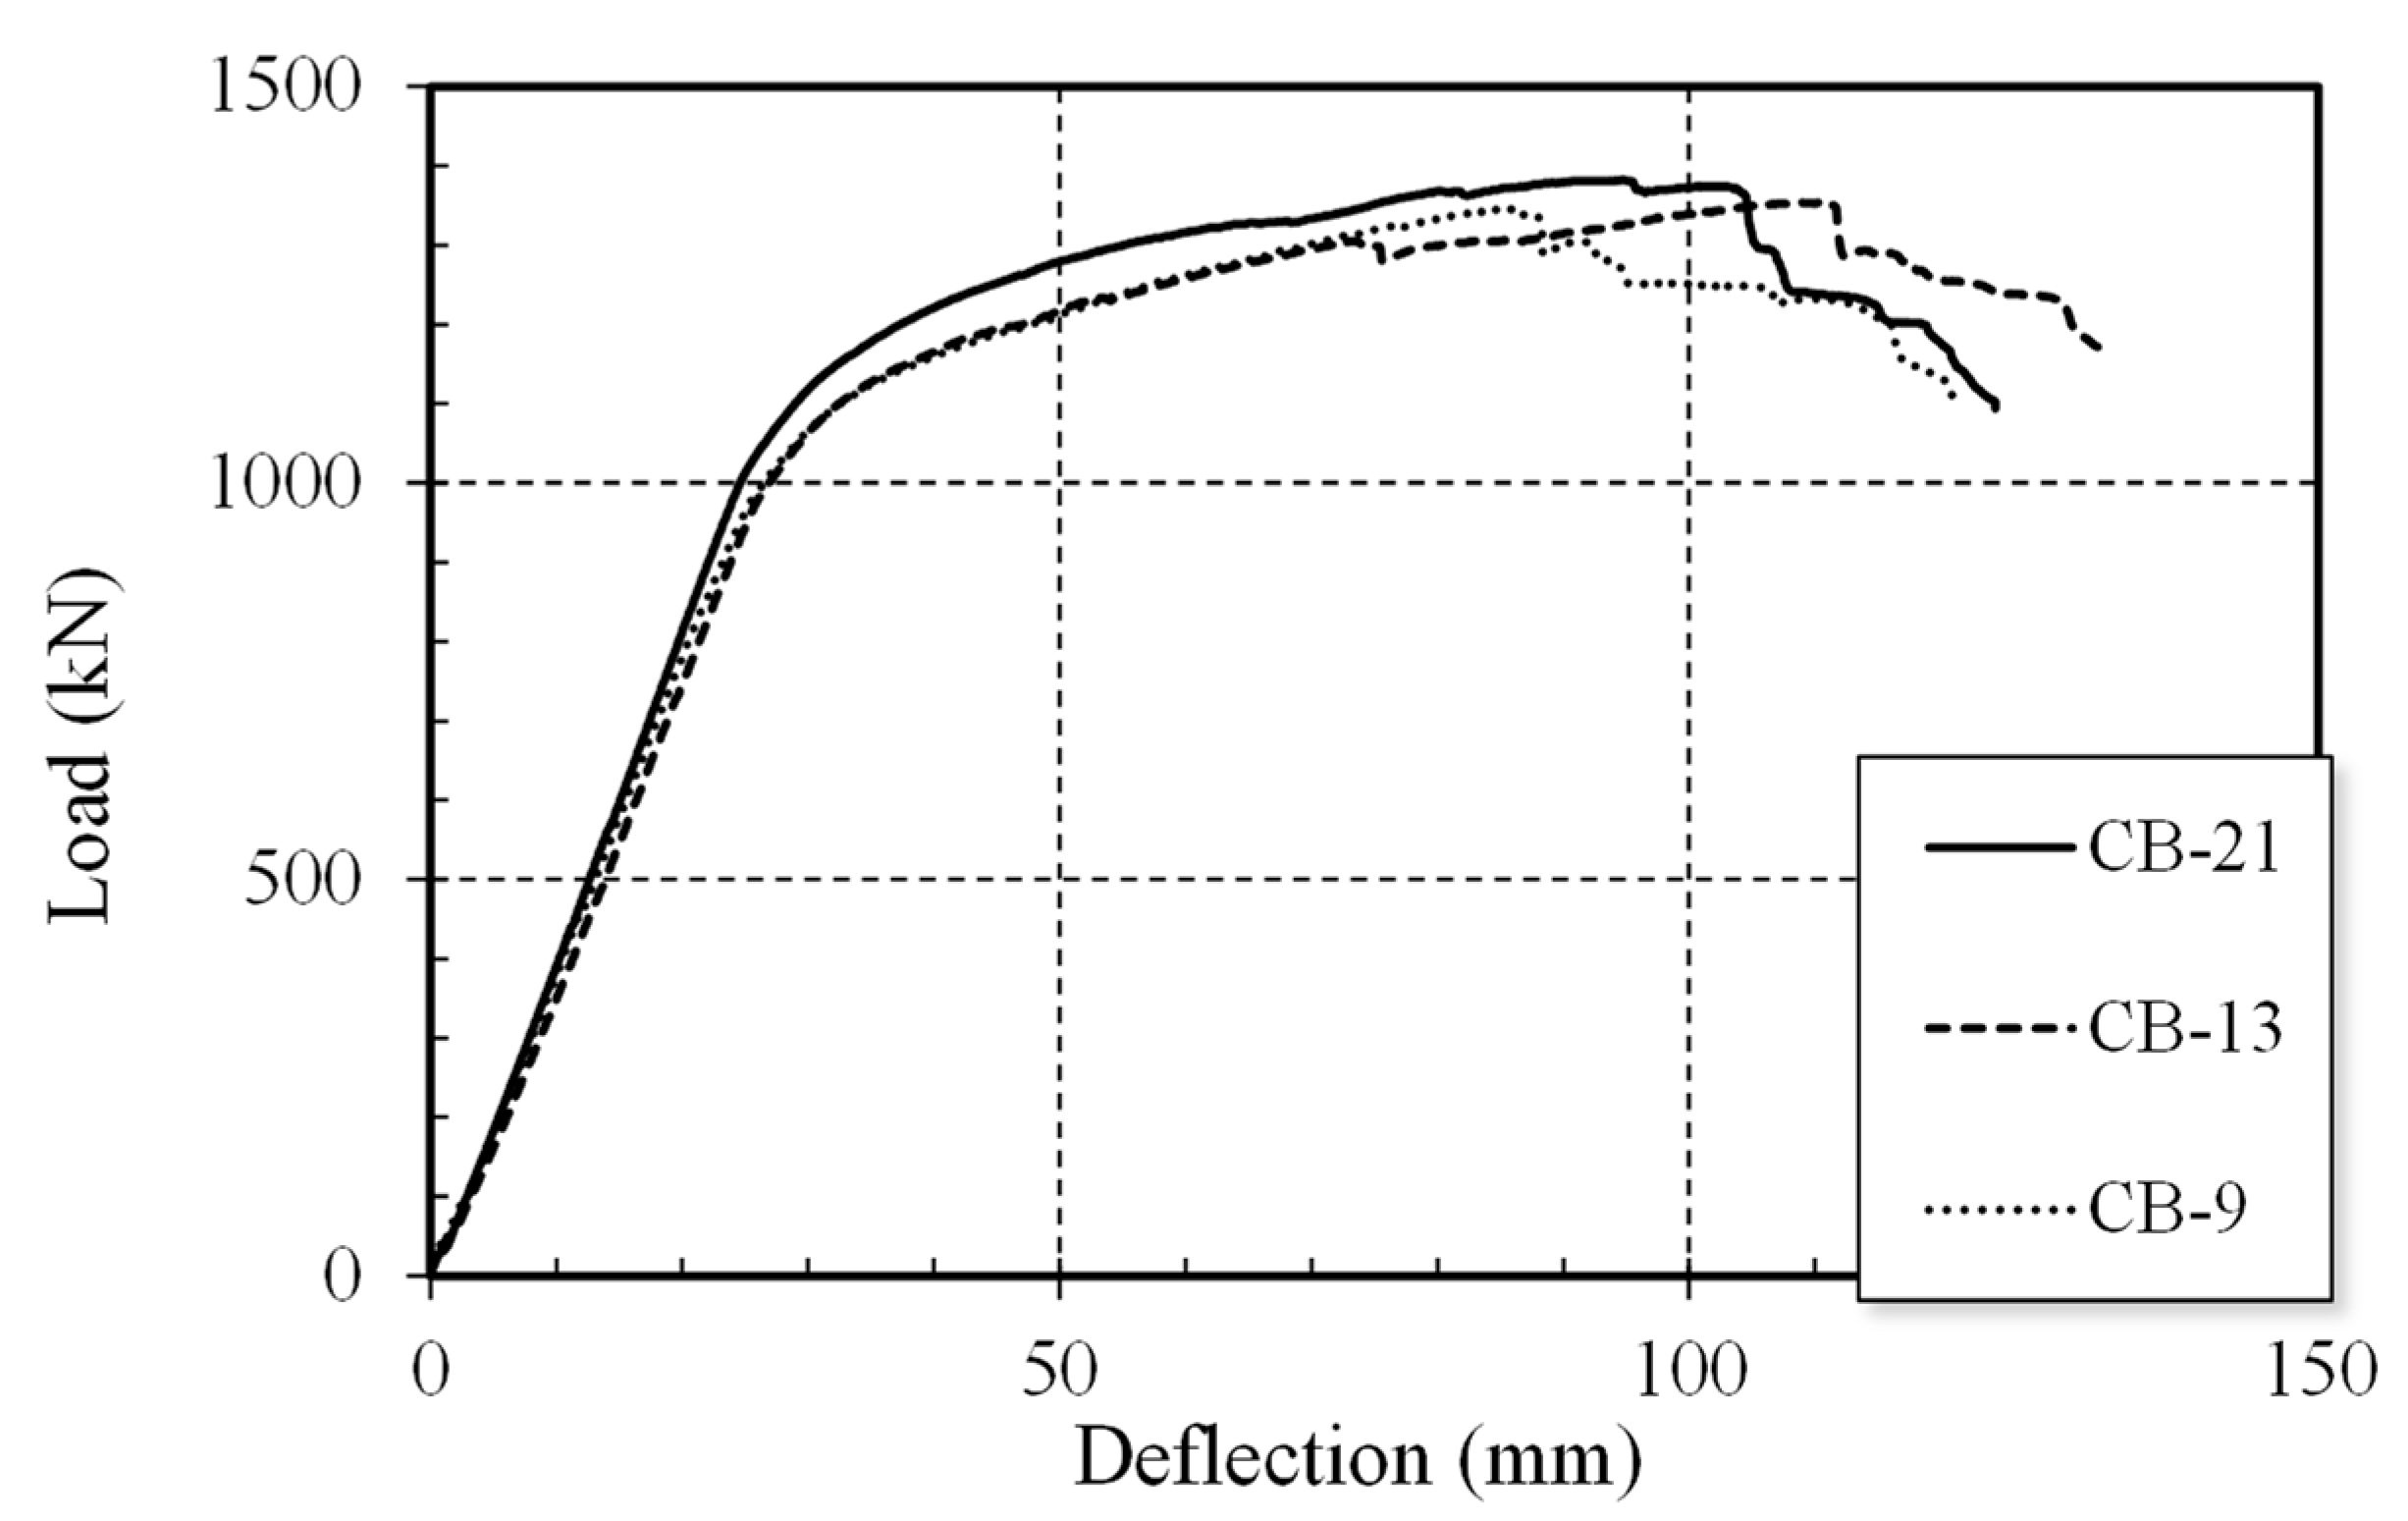
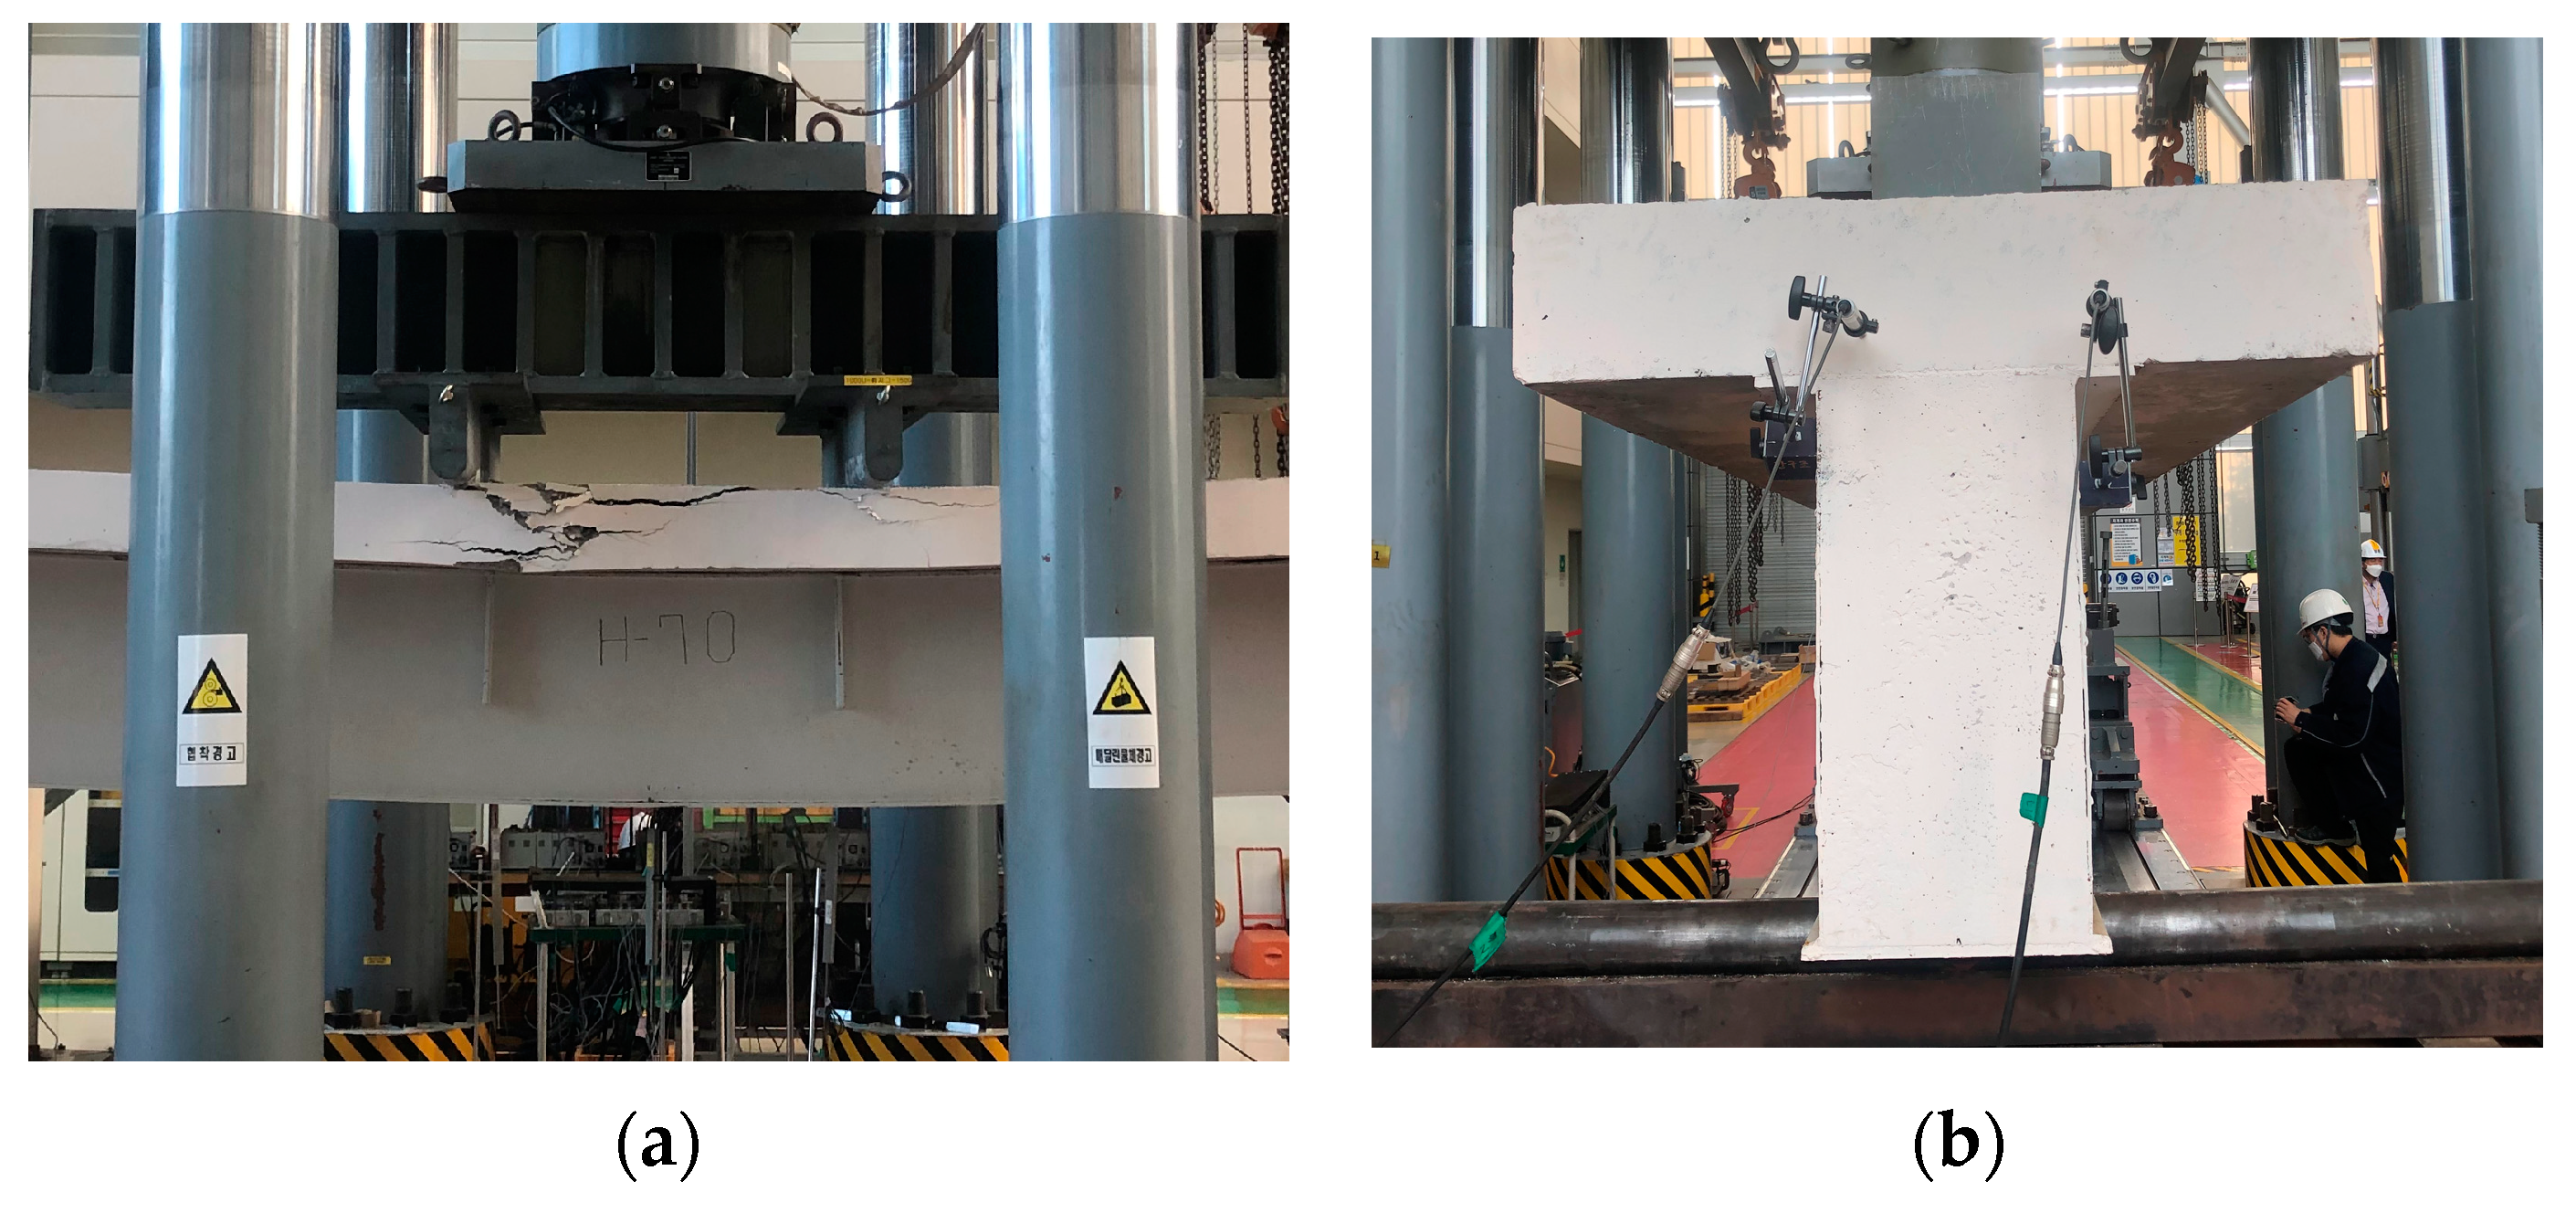
2.2. Experiment Results

Table 2 presents the results of material tests conducted following ASTM standards [13]. For A36 4 t, the yield strength was measured as 361.25 MPa, and the tensile strength was 454.50 MPa. For A36 6 t, the yield strength was measured as 356.75 MPa, and the tensile strength was 430.79 MPa. As for the material used for the flange (A572), the yield strength was 383.21 MPa, and the tensile strength was 554.82 MPa. The average compressive strength of the concrete was measured as 21.57 MPa.
Figure 3 depicts the experimental results of the composite beam. The initial slopes were similar in all cases, and both yield strength and tensile strength exhibited minor variations depending on the spacing of shear connectors. The specimen with the narrowest spacing of the shear connectors showed the highest yield strength and ultimate strength. However, there was little difference between the specimens with shear connector spacings of 600 mm and 1000 mm. This can be attributed to the non-uniform strength distribution within the concrete.
Table 3 summarizes the experimental results. The yield strength and ductility were evaluated following the method suggested by AC495 [14]. This involves assessing the yield strength as the strength value corresponding to the deflection at the intersection point of a horizontal line drawn through the maximum strength and a line connecting the 2/3 point of the maximum strength. The yield strengths of the specimens were measured in the order of shear connector spacing as 1165.72 kN, 1135.51 kN, and 1121.33 kN, respectively. The maximum strengths were measured as 1382.09 kN, 1353.74 kN, and 1346.95 kN, respectively. The ductility values were 3.67, 3.69, and 3.51, respectively. Ultimately, it was observed that narrower shear connector spacing resulted in superior yield strength, maximum strength, and ductility.
Figure 4 illustrates the failure modes of the specimens. All specimens experienced collapse of the upper slab, resulting in a decrease in the strength of the specimens. No slip of the lateral concrete was observed.
The theoretical calculation of the composite beam was determined based on the stress–strain distribution as shown in Figure 5. Using this stress–strain distribution, the compressive force C acting on the concrete slab of the test specimen was determined as the minimum value among Equations (1)–(3). Equation (3) involves the shear strength of the shear connector, denoted as Q n , and in this study, an angled shear connector was used. Therefore, Equation (4) for the shear strength of a channel-shaped shear connector was utilized to calculate Q n [9].
C = A s F y
C = 0.85 f c k A c
C =   Q n
Q n = 0.3 ( t f + 0.5 t w ) L a f c k E c
Here, A s is the total cross-sectional area of steel section, F y is the yield strength of steel, f c k is the compressive strength of concrete, A c is the total cross-sectional area of concrete, t f is the flange thickness of the angle, t w is the web thickness of the angle, and E c is the elasticity modulus of the concrete.
Equation (5) calculates the design flexural strength in the positive moment region, taking into account the composite effect with the slab. After the manifestation of the composite action, it is assumed that no lateral-torsional buckling occurs due to the restraining effect.
M n = C ( d 1 + d 2 ) + P y ( d 3 d 2 )
Here, d 1 is the distance from the center of compression force C in the concrete to the top of the steel member, d 2 is the distance from the center of compression force in the steel member to the top of the steel member (if there is no compression force on the steel member, d 2 is equal to 0), P y is the tensile strength of the steel member, and d 3 is the distance from the center of action of P y on the steel member to the top of the steel member.
There is no available equation for the angle-shaped shear connector used in this study. Therefore, assuming a channel-shaped shear connector and calculating based on the existing equation for channel sections, the strength can be estimated to be approximately 802.84 kN, as shown in Table 4. CB-21 and CB-13 exhibit fully composite behavior with strengths calculated at 1182.14 kN. The CB-9 specimen displays partial composite behavior, with a strength of 1153.86 kN. The theoretical analysis yields an average value of 1.16, indicating uniformity. The lower theoretical value is attributed to the neglect of compression-side reinforcement and the absence of consideration for the effect of tensile-side concrete. However, since a reduction in strength was observed in the experimental results, it is desired to infer the strength of the angle-shaped shear connector through computational analysis.

3. Finite Element Analysis

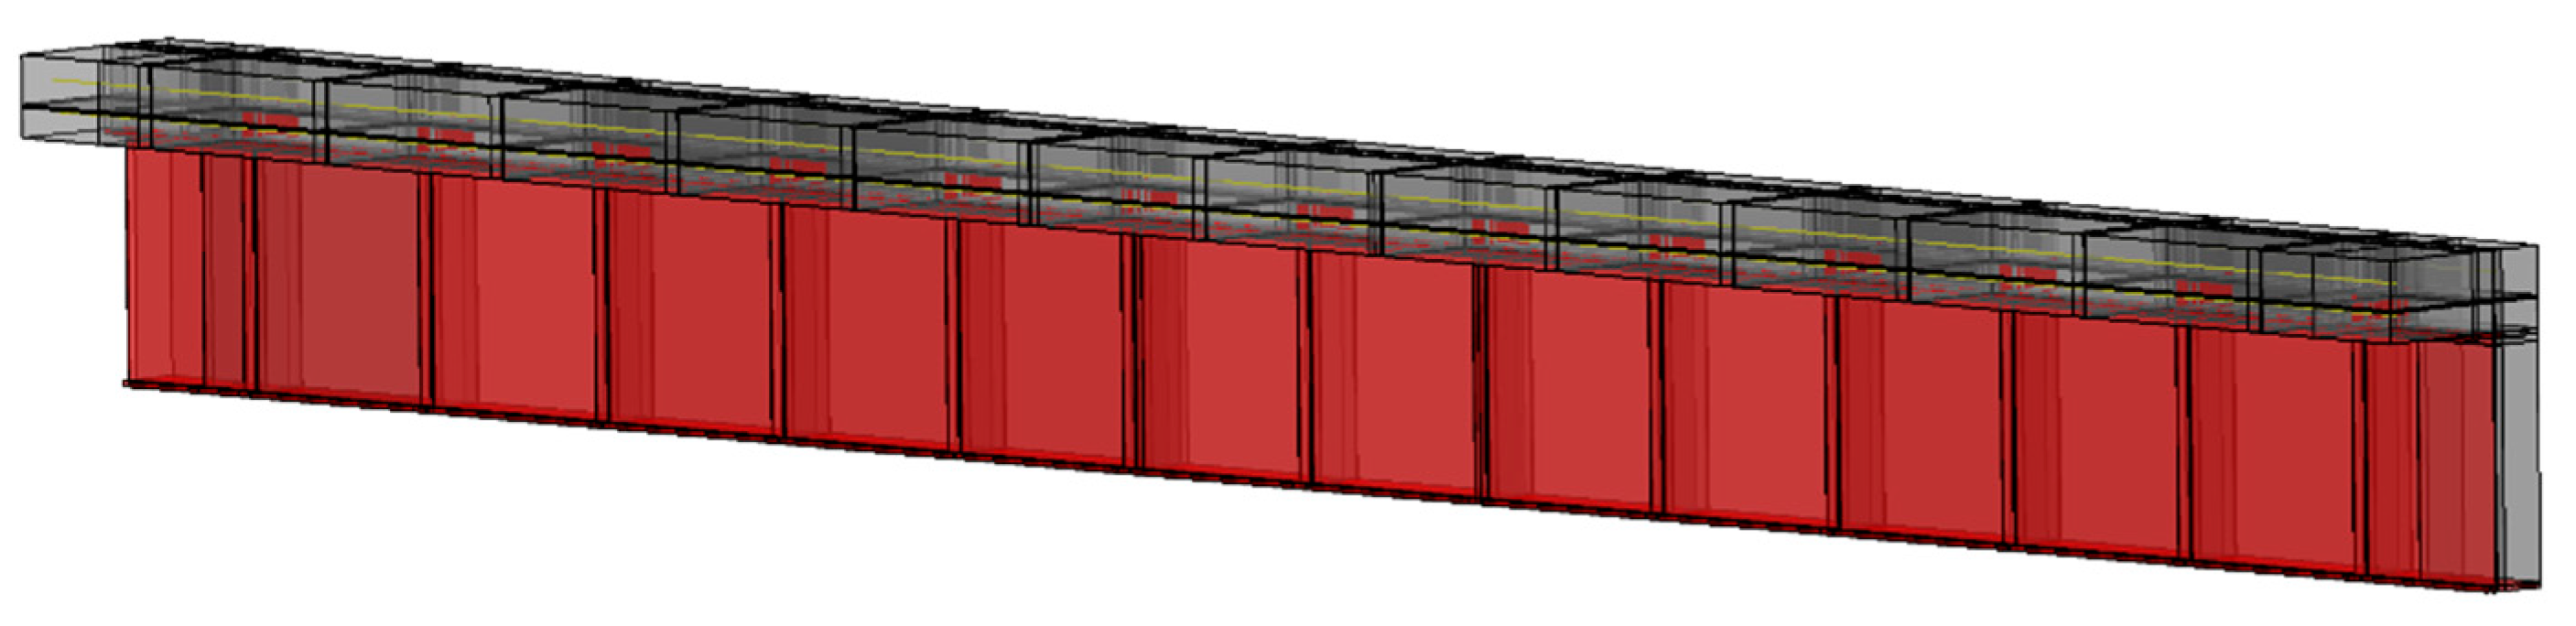
3.1. General Information on the Analysis Model

In the analysis, the widely used general-purpose nonlinear finite element analysis software, ABAQUS (version 2023), was employed [15]. In this paper, a proposed analysis model for the composite beam was developed by referring to various concrete models currently available.
The concrete and steel elements were modeled using reduced integration solid elements (C3D8R) with eight nodal points. Due to the significantly increased analysis speed of concrete, reduced integration elements were used to accelerate the analysis process. The analysis model was created by modeling only half of the composite beam since its shape is symmetric, as shown in Figure 6. The boundary conditions were set to match the actual experiment, and the mesh size was set to 50 throughout the model, except in areas with the shear connectors, where it was set to 10. General contact elements were utilized for contact analysis, and all contact surfaces within the specimen were defined. The contact behavior was defined such that normal direction contact used the hard contact feature to prevent penetration under compression and allow separation under tension. The tangential direction contact was defined using the penalty feature to provide resistance against friction. The friction coefficient between steel and concrete was set to 0.65 for the analysis [16].
For the reinforcement embedded in the concrete, truss elements were used for modeling, and the embedded element feature was utilized to integrate them with the concrete’s behavior.
Finite element analysis can be broadly classified into implicit and explicit methods. Generally, the implicit method involves iterative calculations at each step, resulting in the higher accuracy of the solution. However, it is time-consuming, and less suitable for analyzing the present study’s results due to its lower convergence rate. Therefore, in this research, the explicit method, which has a higher convergence rate, was employed for the analysis.

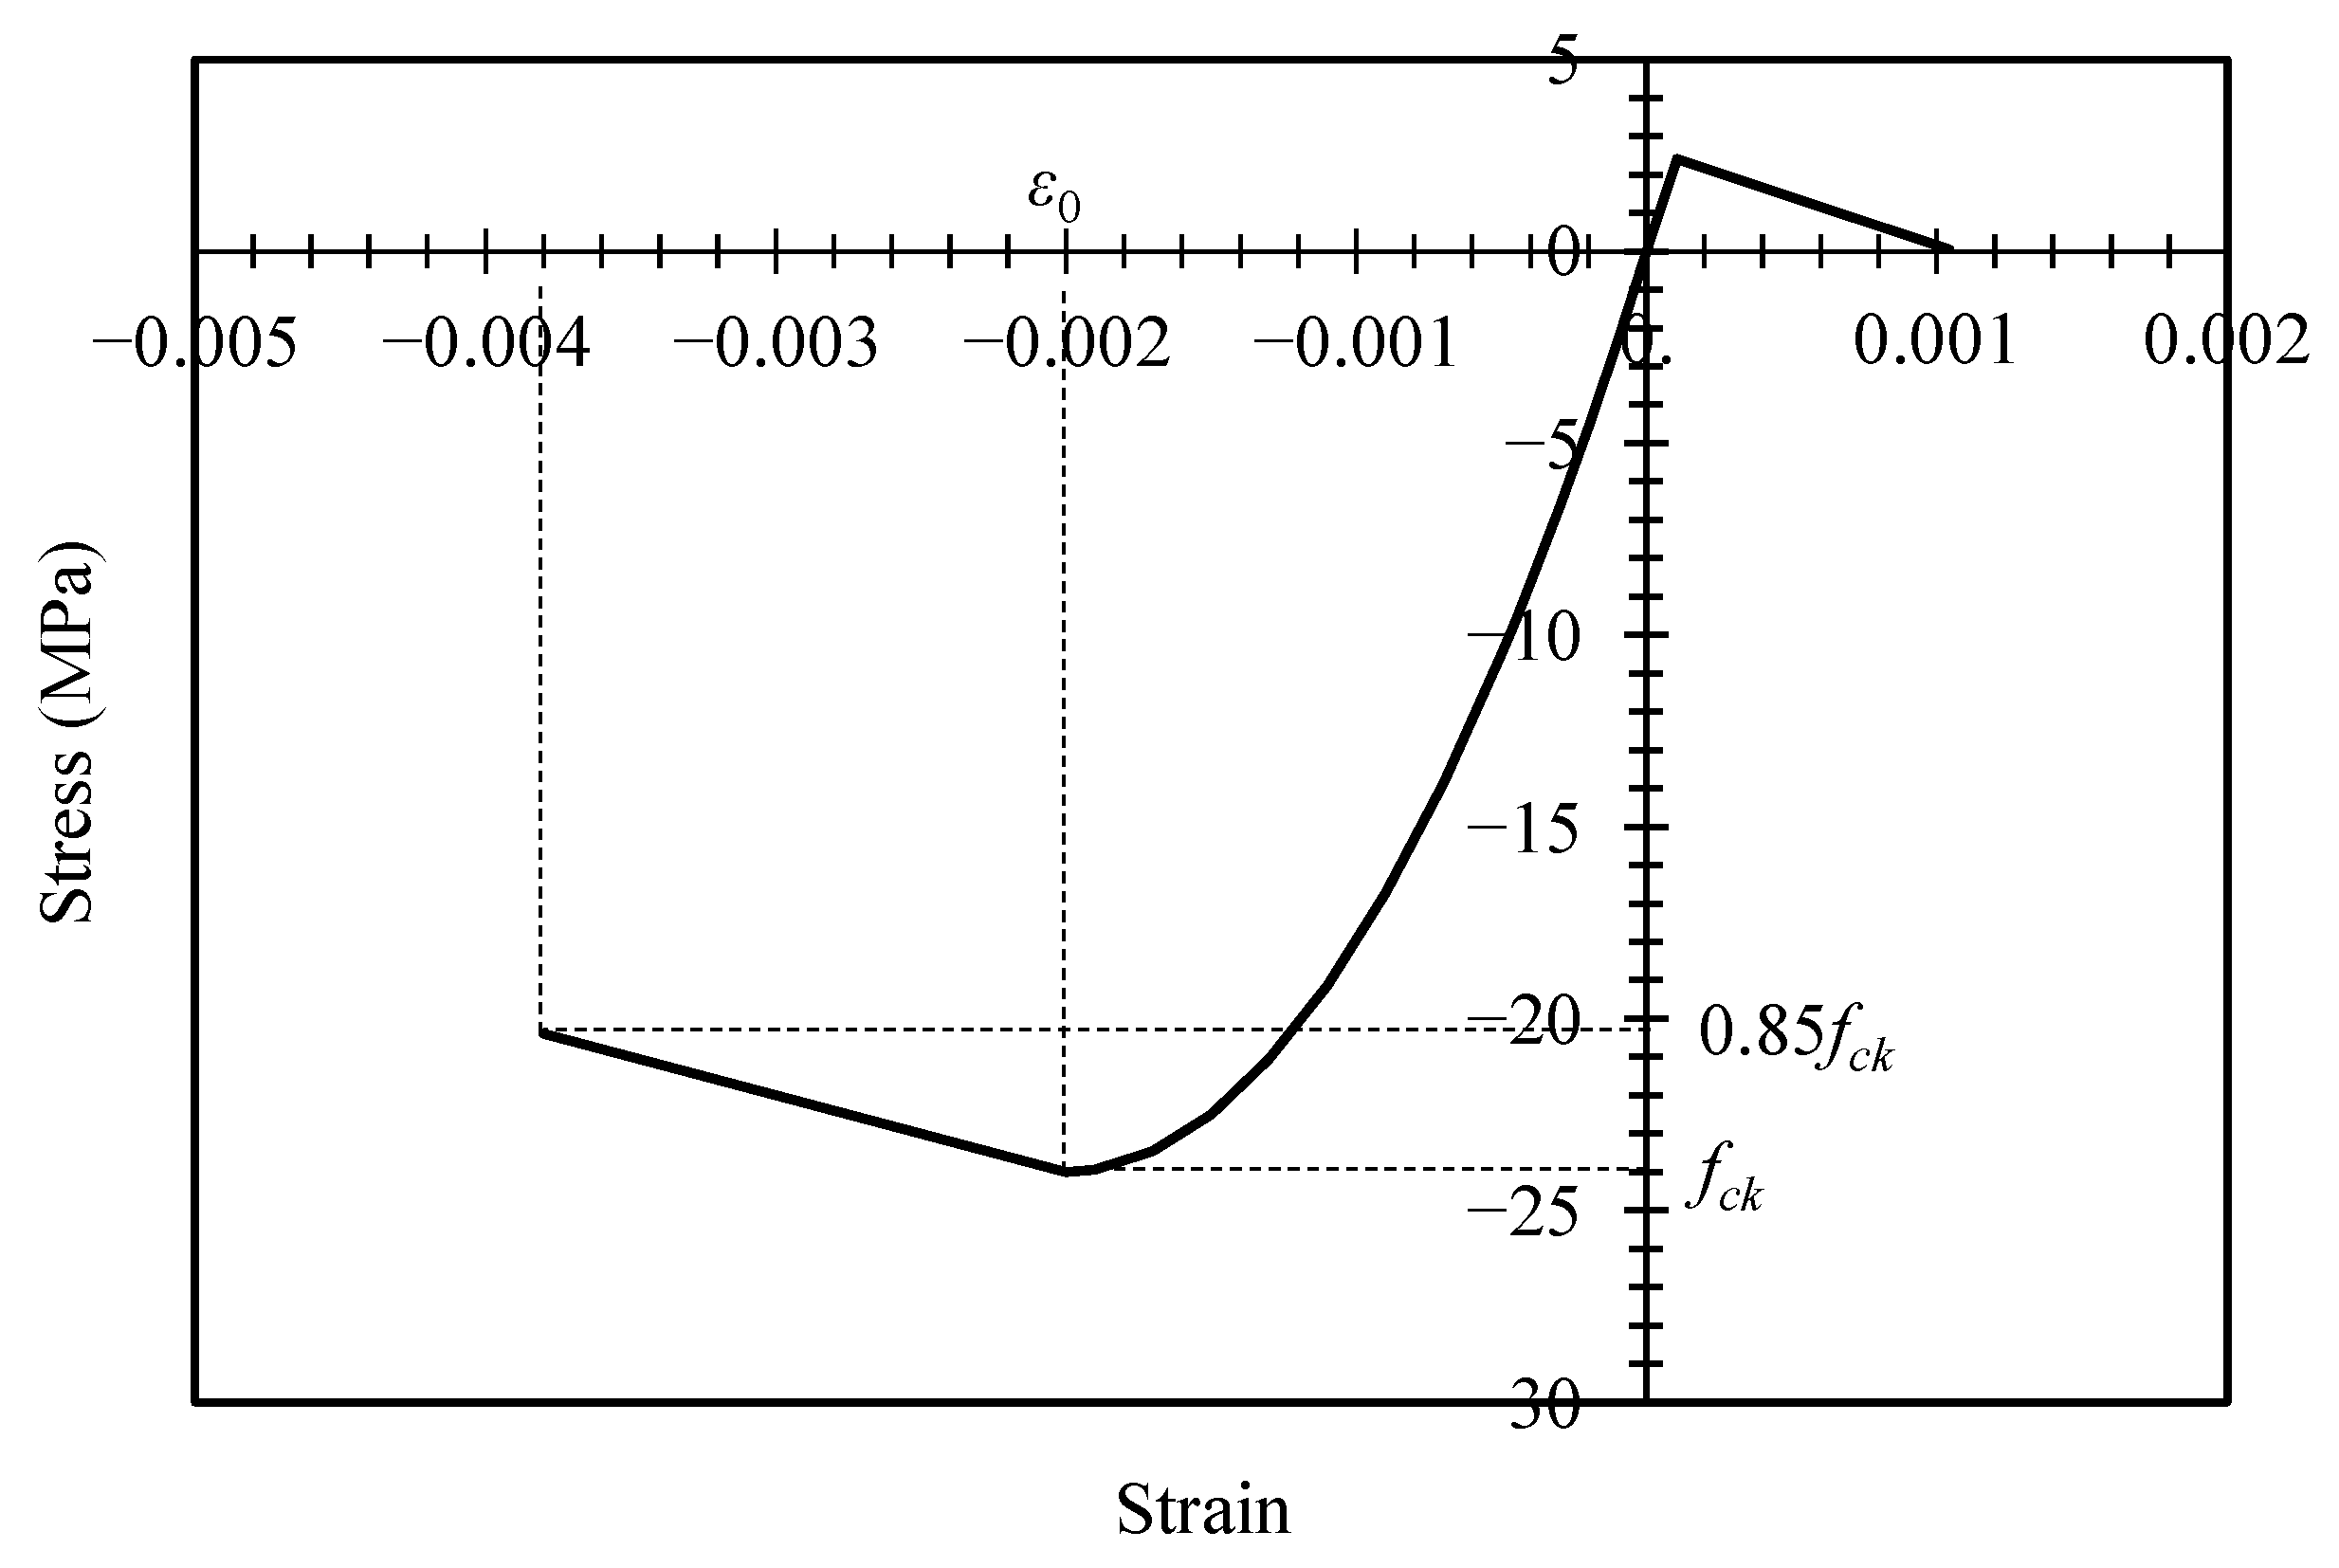
3.2. Concrete Analysis Model

The stress–strain behavior of concrete, encompassing both tension and compression, was represented using the concrete damaged plasticity feature, which allows for the depiction of stress reduction after reaching the maximum stress. The input values used for this feature are presented in Table 5 [17,18].
The damage parameter in concrete represents the coefficient that converts the elastic modulus of concrete when there is a decrease in strength after the elastic range. The calculation was carried out based on the abbreviated stress–strain behavior recommended by ABAQUS. The elastic modulus of concrete ( E c ) was calculated using Equation (6) provided by ACI 318, and a Poisson’s ratio of 0.2 was used for concrete [19].
E c = 4700 f c k
The stress–strain relationship of concrete was modeled using the formulation proposed by Hognestad, as shown in Figure 7. Although various concrete models accounting for strength degradation have been presented, the Hognestad model was selected for its computational speed and convergence characteristics [20,21]. The equations for the Hognestad model are given as follows: (7) and (8) [21].
f c = f c k [ 2 ε c ε 0 ( ε c ε 0 ) 2 ]   for   ε 0 ε c 0
f c = f c k [ 1 0.15 ε c ε 0 ε c u ε 0 ]   for   ε c u ε c ε 0
Here, f c is the stress of concrete, ε c is the strain of concrete, f c k is the compressive strength of concrete, ε c u is the ultimate compressive strain of concrete, and ε 0 is the strain at maximum stress f c k . In this analysis, ε 0 was set at 0.002.
In the analysis of concrete beams, tension behavior of concrete has a minimal influence. However, ABAQUS requires a tension softening curve for concrete. Therefore, a linear tension behavior was assumed for concrete. The tensile strength of concrete ( f t ) was taken as f t = 0.1 f c k , and the ultimate tensile strain ( ε t u ) was selected as ε t u = 10 f t / E c .
In addition, the characteristic and damage variables for concrete compression and tension were generally set to the default values provided by ABAQUS. The dilation angle, which defines the post-peak behavior, was input at 38. The eccentricity, which is a measure of the ratio between compressive and tensile strengths of concrete, was set to 0.1.
The ratio of biaxial compression strength to uniaxial compression strength (ratio) can be calculated based on experimental results. However, in this study, the default value of 1.16 provided by ABAQUS was used. The parameter controls the yield surface of the concrete plasticity model and is known to have a value distribution based on previous research. In this study, the default value of 2/3 provided by ABAQUS was used [15].
The viscosity parameter can be adjusted to improve the convergence of the analysis by modifying the viscosity. However, in this analysis, the convergence was not significantly affected, so a value of 0 was used.

3.3. Steel Part Analysis Model

For the steel component, the stress–strain curve determined from material testing needs to be converted from nominal stress–strain to true stress–strain before being input into ABAQUS. The following equation was used to perform the conversion, and the resulting values were input into ABAQUS [15].
σ t r u e = σ n o m ( 1 + ε n o m )
ε l n p l = ln ( 1 + ε n o m ) σ t r u e E
Here, σ t r u e is the true stress, σ n o m is the nominal stress, ε n o m is the nominal strain, ε l n p l is the true plastic strain, and E is the elastic modulus.

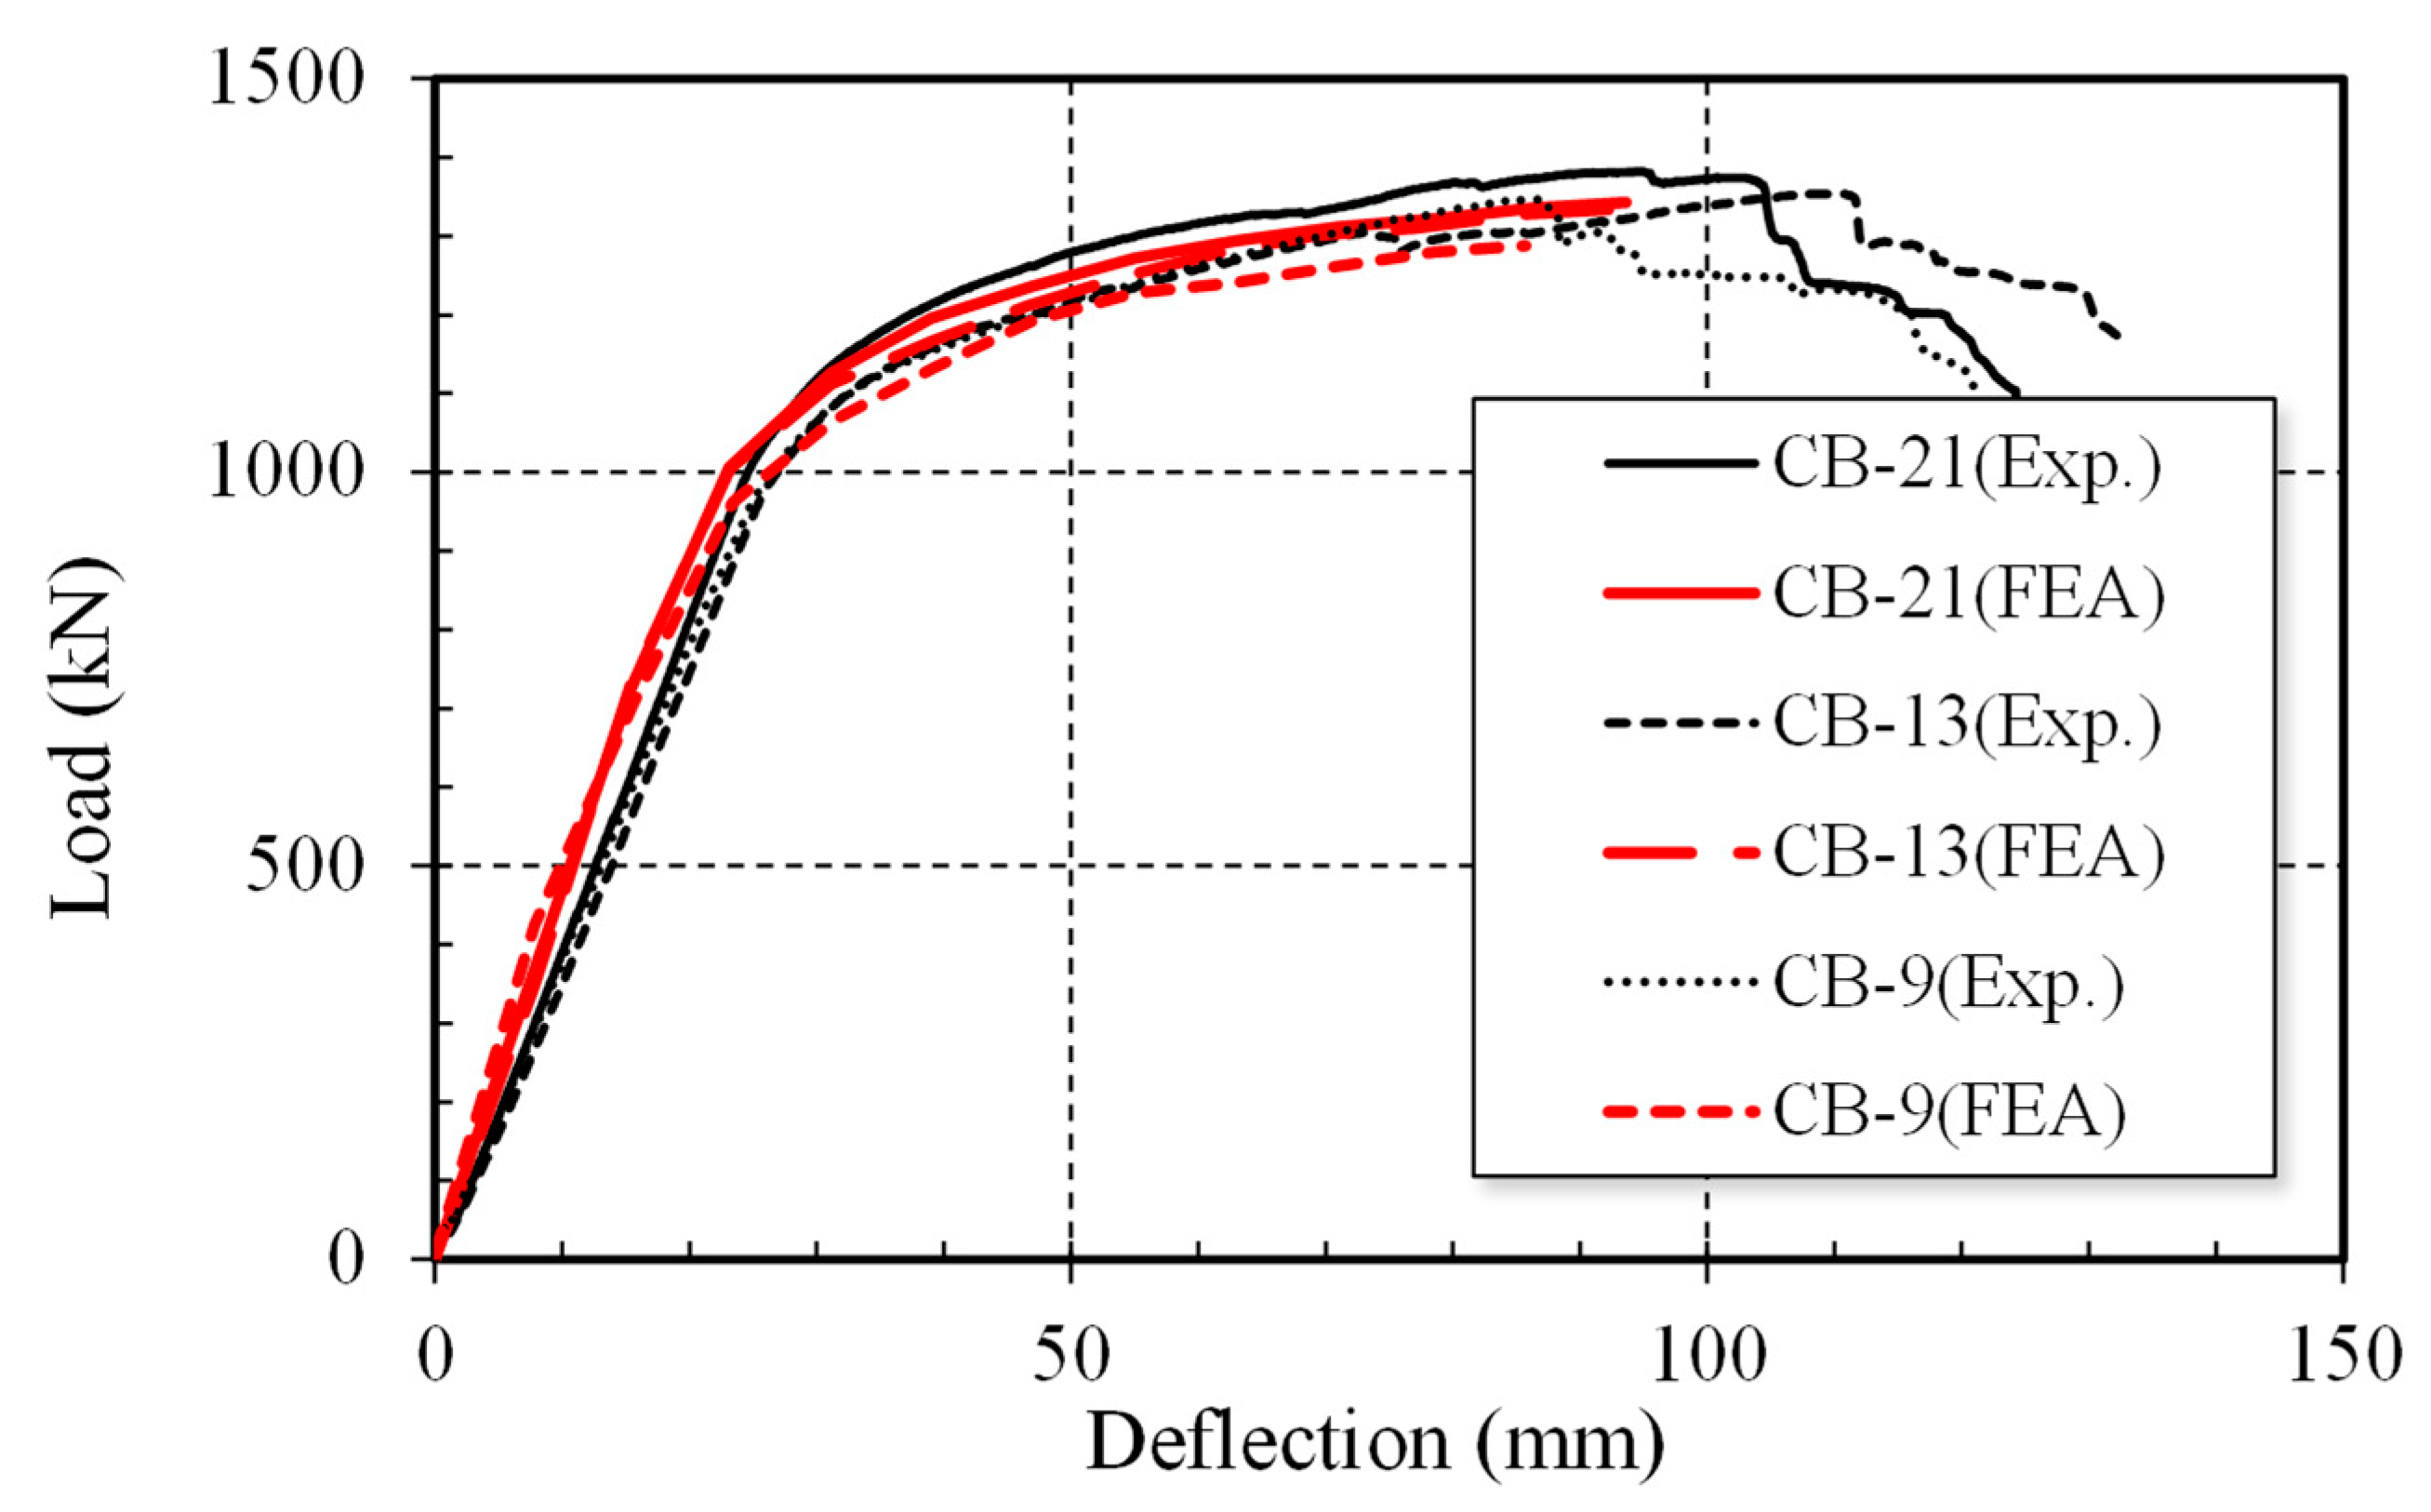
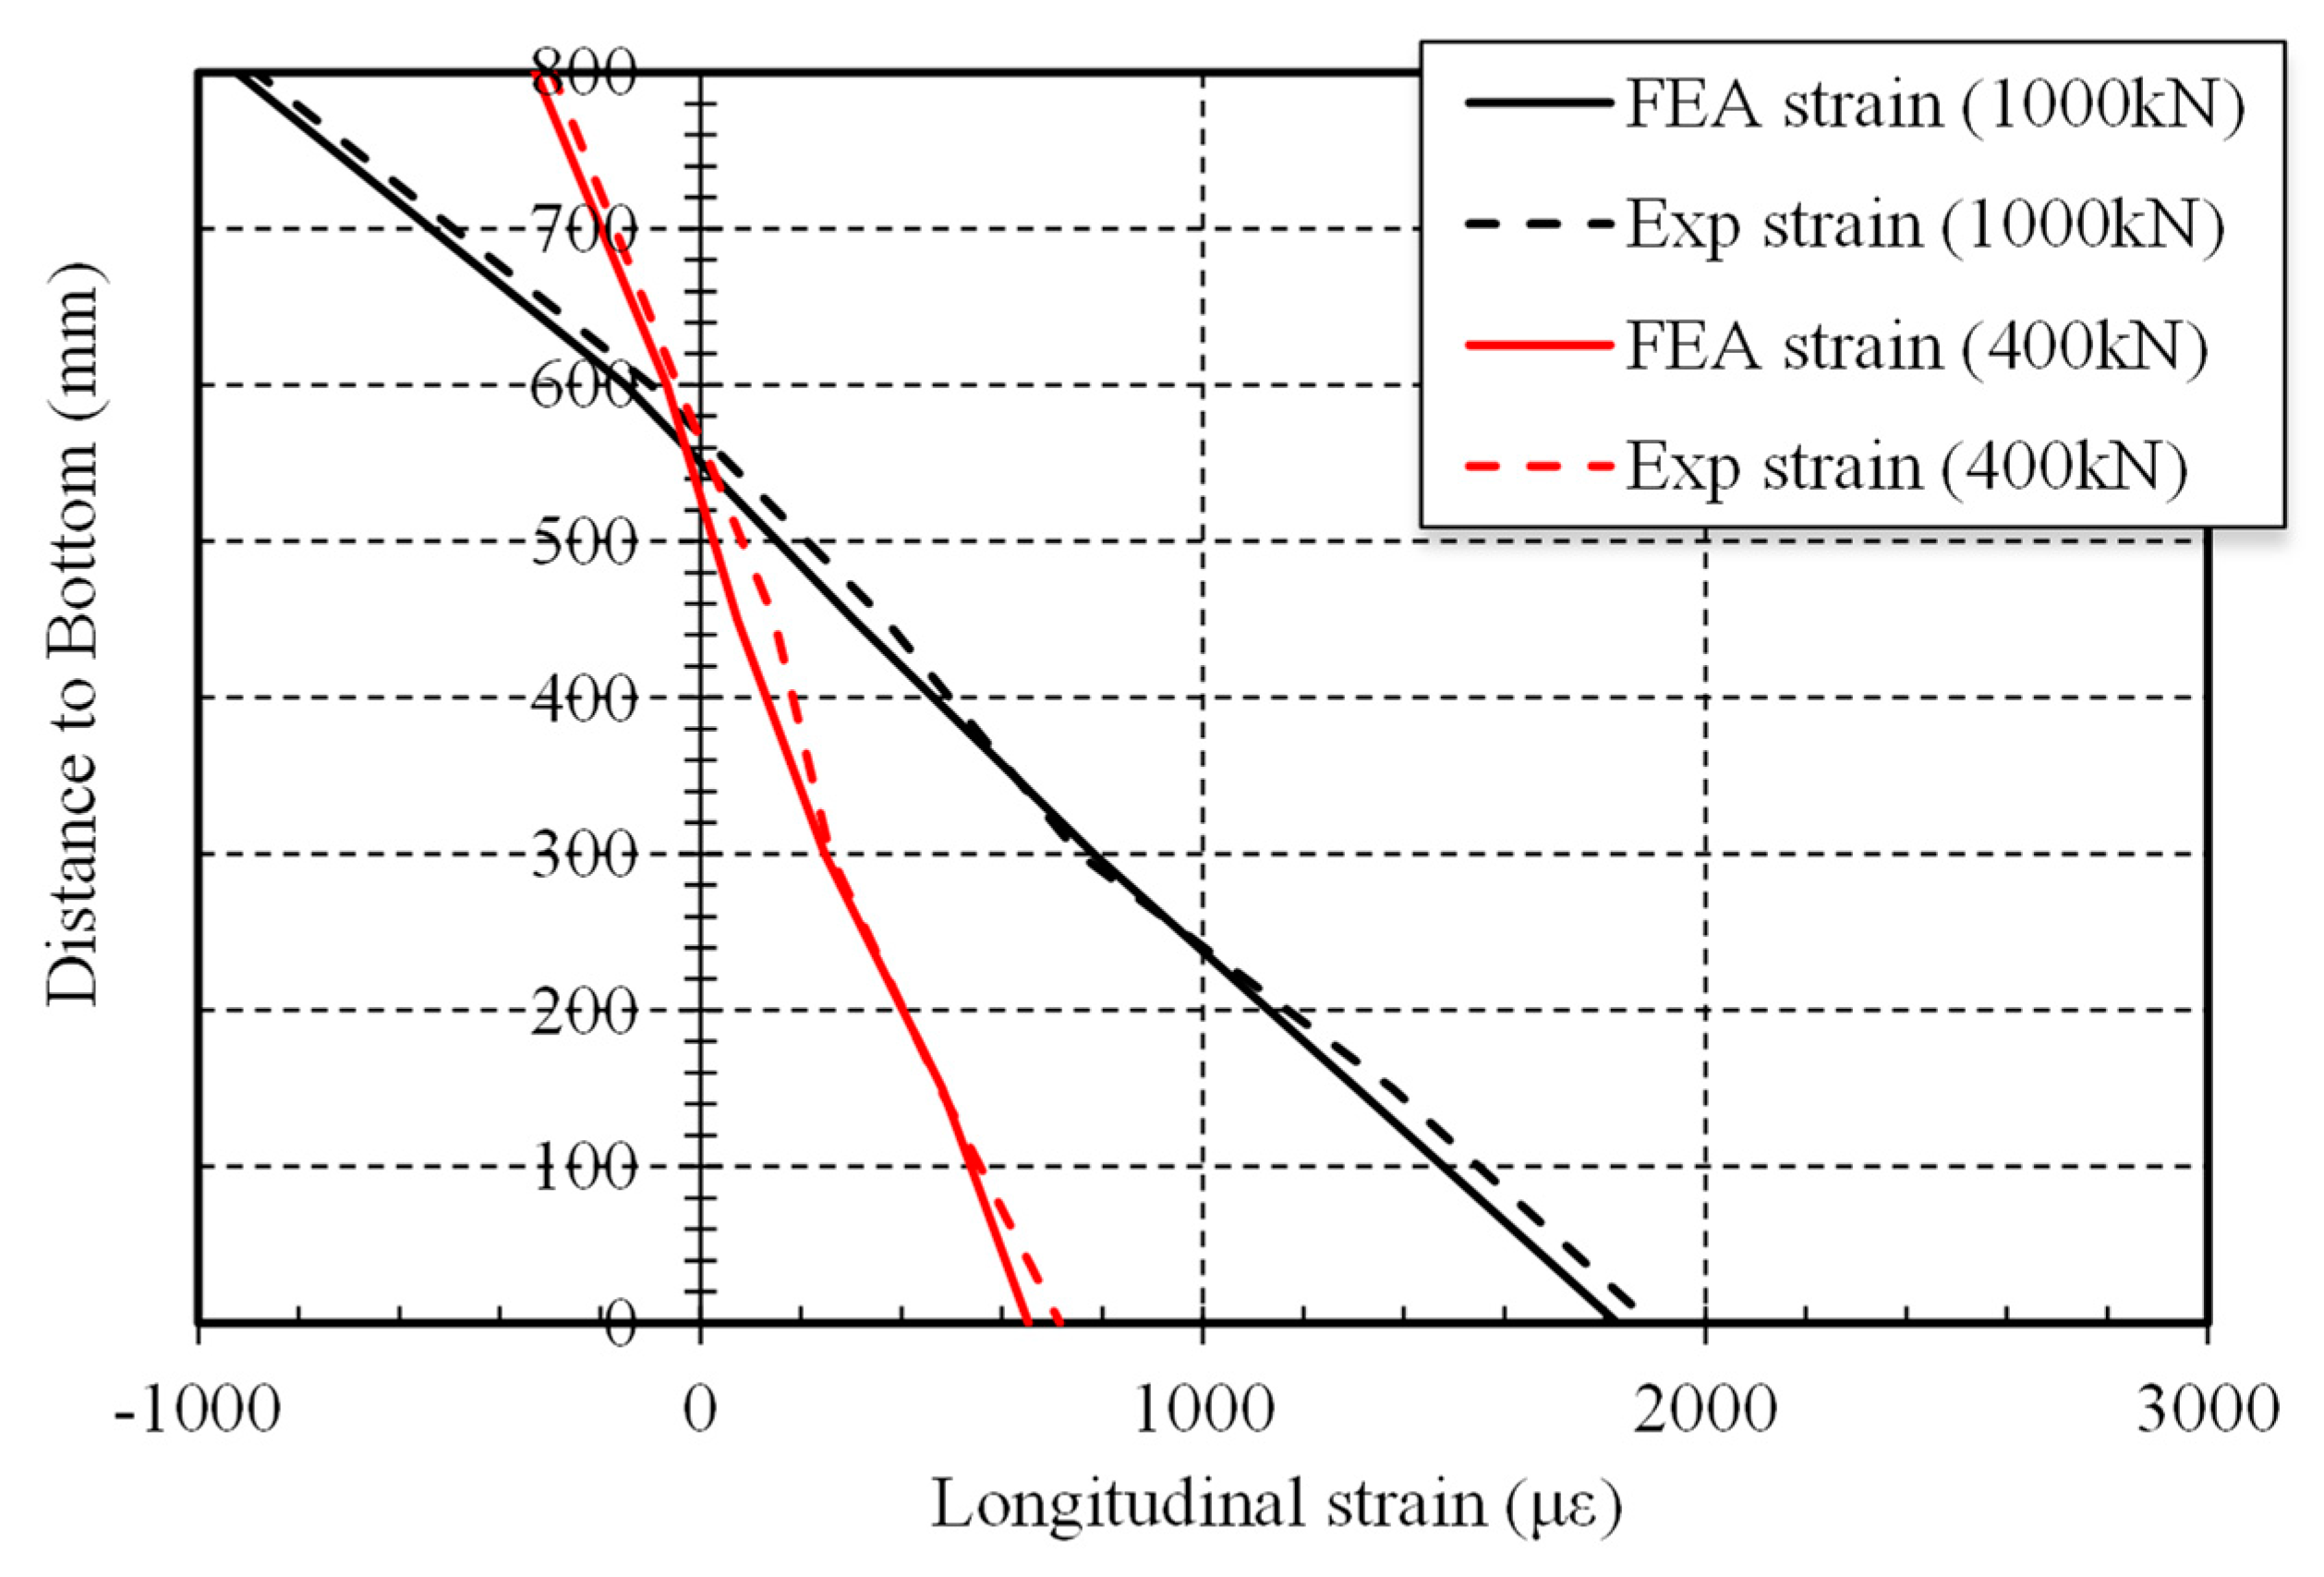
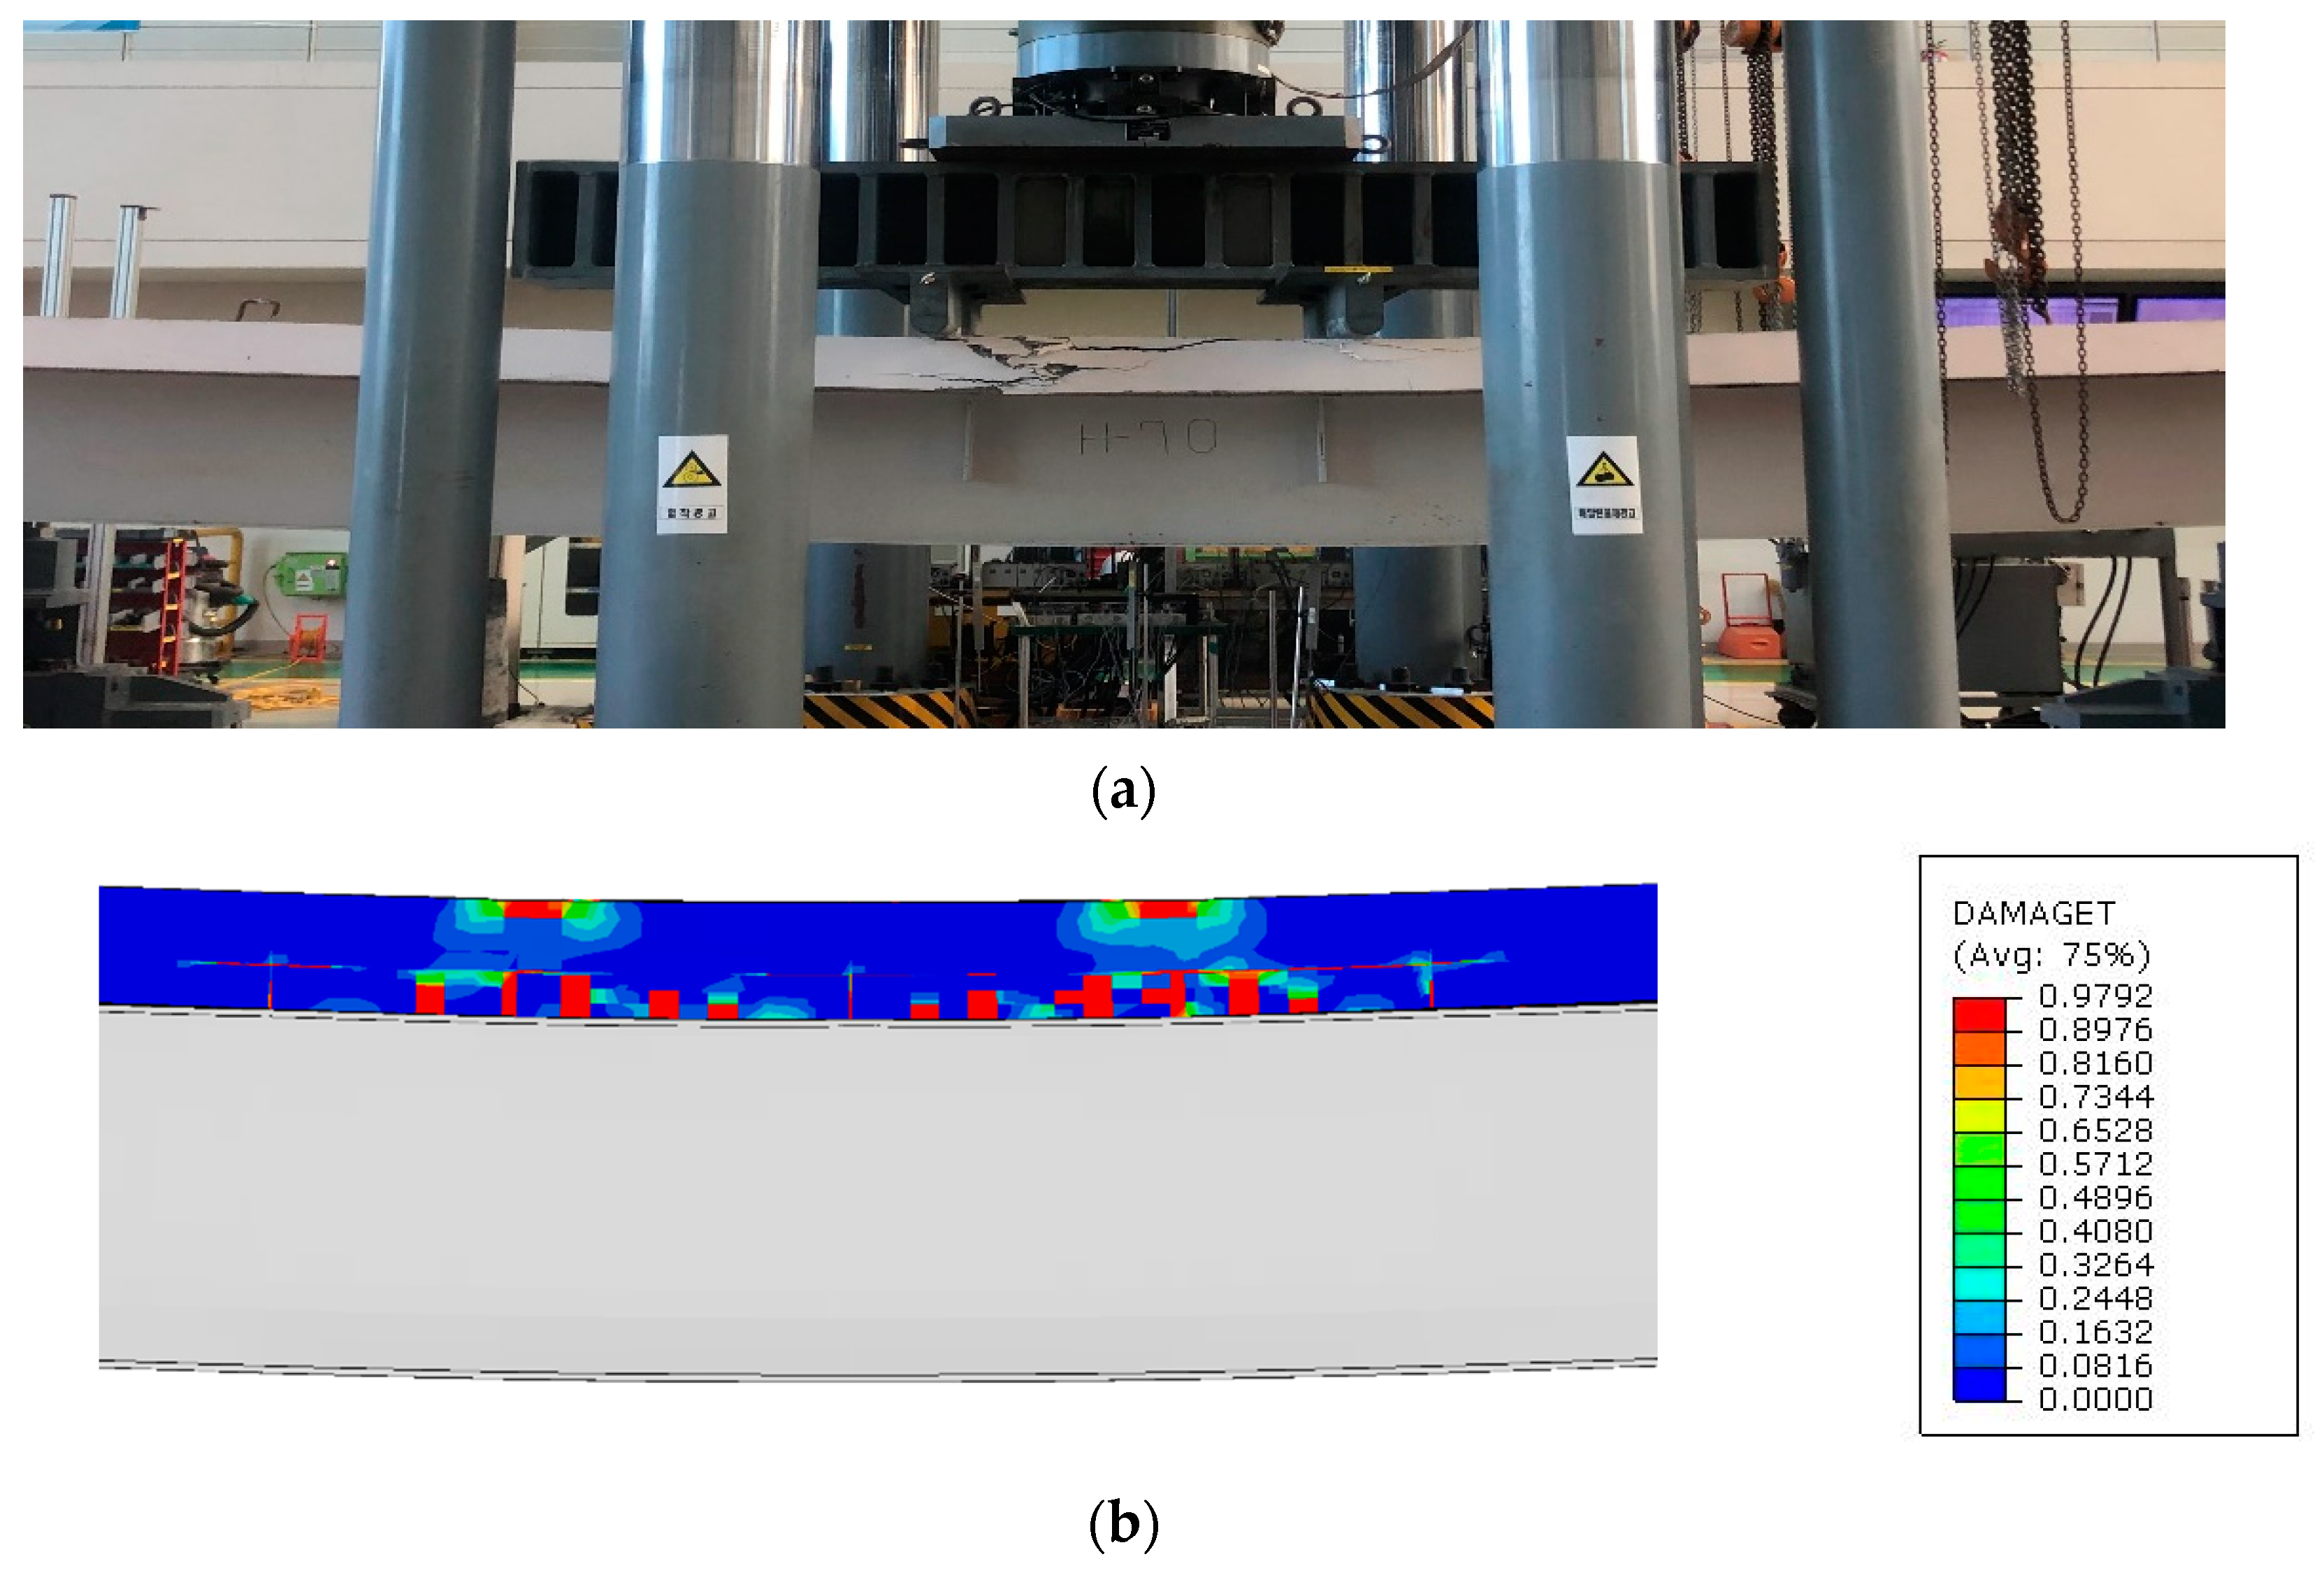
3.4. Verification and Parameter Analysis of the Analysis Model

Table 6 summarizes the analysis model, where the variables are represented by the number of shear connectors. The initial analysis and verification were conducted on the existing specimens CB-21, 13, and 9. The validated analysis method was then used to analyze the models with varying numbers of shear connectors. Additionally, in order to evaluate the strength in the absence of shear connectors, the analysis was also performed on models with zero shear connectors.
Figure 8 illustrates the results of the analysis for the existing test specimens. The analysis was terminated at the point where overall concrete crushing occurred in the girder section. In the actual experimental results, an increase in the spacing of the shear connectors led to a decrease in the maximum strength. The analytical results also indicated a reduction in the maximum strength with a widening spacing of shear connectors. In terms of ductility, the experimental findings showed that CB-13 exhibited the highest ductility, while CB-9 demonstrated the lowest. However, the analytical results suggested that ductility also decreased proportionally as the spacing of shear connectors became narrower. This is likely attributable to the non-uniform distribution of concrete strength and strain in the actual specimens, and the finite element analysis assumes a uniform representation of concrete strength and strain. Furthermore, there is minimal difference in ductility between CB-21 and CB-13 within the analytical findings. Figure 9 compares the deformation distribution based on strength between experimental and analytical results. Notably, it highlights the deformation comparison between CB-21 specimens at strengths of 400 kN and 1000 kN. It is evident that the deformation distribution at the same location exhibits remarkable similarity between the two cases. Ultimately, due to the similarity in initial stiffness and maximum strength, as well as the consistent trend in ductility, the analytical model is deemed to be reliable. Figure 10 compares the failure modes of the experiment and analysis, where Figure 10b represents the degree of tensile damage in concrete. A value close to one indicates the occurrence of tensile failure in concrete. In the actual test specimen, tensile cracks occurred in the lower part, so the computational analysis is deemed to be similar to the actual experiment.
Figure 11 shows the load–displacement curves obtained from the variable analysis. It can be observed that, as the number of shear connectors decreases, the maximum strength decreases. Up to 13 shear connectors, it was determined that the behavior exhibited fully composite action. In the analysis results, no shear connector failure occurred, and the analysis was terminated based on concrete crushing. From nine and fewer shear connectors, high stresses were observed in the shear connector region. Assuming a tensile strength of the weld material as 430 MPa, the analysis was terminated if the stress in the shear connector region exceeded this value.
In the actual experiments, even if concrete crushing occurred, the behavior of partial damage led to the ductile behavior of the composite beam. However, in the analysis, the strength reduction due to concrete crushing was not considered, resulting in no decrease in strength. Furthermore, in this study, the strength of the angle-type shear connectors was analyzed, and an analysis method based on this was proposed. Therefore, it was determined that the analysis method is reliable.
Table 7 compares the maximum strengths obtained from the experimental and analytical results. For the CB-21 specimen, the experimental strength was 1382.09 kN, and the analytical strength was 1359.28 kN. For the CB-13 specimen, the experimental strength was 1353.74 kN, and the analytical strength was 1335.49 kN. Lastly, for the CB-9 specimen, the experimental strength was 1346.95 kN, and the analytical strength was 1287.89 kN. The ratios between the experimental and analytical strengths were very close, with values of 1.02, 1.01, and 1.05, respectively.
Based on the previous finite element analysis results, it was observed that the capacity of the composite beam varies with the number of shear connectors. This allows us to infer the strength of the angle-type shear connectors used in this study. In order for the composite beam to achieve its maximum composite action, it should be able to transmit all the compressive forces in the concrete, requiring a strength of approximately 4080 kN. Based on the experimental and analytical results, it can be concluded that up to 13 shear connectors exhibited complete composite behavior. Therefore, the individual strength of each shear connector can be calculated as 627.70 kN. Using this information, the resistance of the composite beam can be calculated using the equation provided earlier.
Table 8 compares the finite element analysis results with the inferred values of the shear connectors presented earlier. The ratios between the analysis results and the theoretical calculations range from 1.13 to 1.20, showing a consistent distribution. The higher strength observed in the analysis results can be attributed to a conservative evaluation of the maximum strength during the analysis. When the number of shear connectors was zero, the flexural strength of the steel and the bending strength of the concrete were calculated separately and combined, resulting in a ratio of 1.37. The larger deviation compared to other theoretical values can be attributed to the presence of minor composite behavior due to the friction between the concrete and the steel even in the absence of shear connectors.
Based on the previous experimental results, numerical analysis, and finite element analysis, the behavior of the composite beam using angle-shaped shear connectors was evaluated. The comparison between the experimental results and numerical analysis provided confidence in the reliability of the numerical analysis, allowing for the inference of the strength of the angle-shaped shear connectors. This inference enabled theoretical calculations, and it is deemed that the strength of the composite beam can be calculated based on this, taking safety into consideration during the design process.

4. Conclusions

The aim of this paper was to evaluate the behavior of a filled composite beam using angle-shaped shear connectors and to propose a design method for such composite beams through numerical analysis. The results obtained from this study are summarized as follows:
(1)
In this study, angled shear connectors were employed as shear connectors. Due to the absence of an existing design equation, the design was based on a channel-shaped design equation. However, the actual experimental results revealed that, as the spacing of shear connectors increased, the maximum strength and ductility decreased. This indicates that the design of angled shear connectors using the existing design formula is deemed inappropriate.
(2)
To infer the strength of the angled shear connectors, numerical simulations were conducted. Comparing the experimental results with the computational analysis results for model validation, the strength ratio was found to be 1.03, indicating a very high level of reliability.
(3)
Through this study, the strength of the angled shear connectors used in the experiments was determined to be 627.70 kN. If designing a complete composite beam using the existing channel-shaped design equation, the number of shear connectors would decrease. This could lead to a design that lacks sufficient strength.
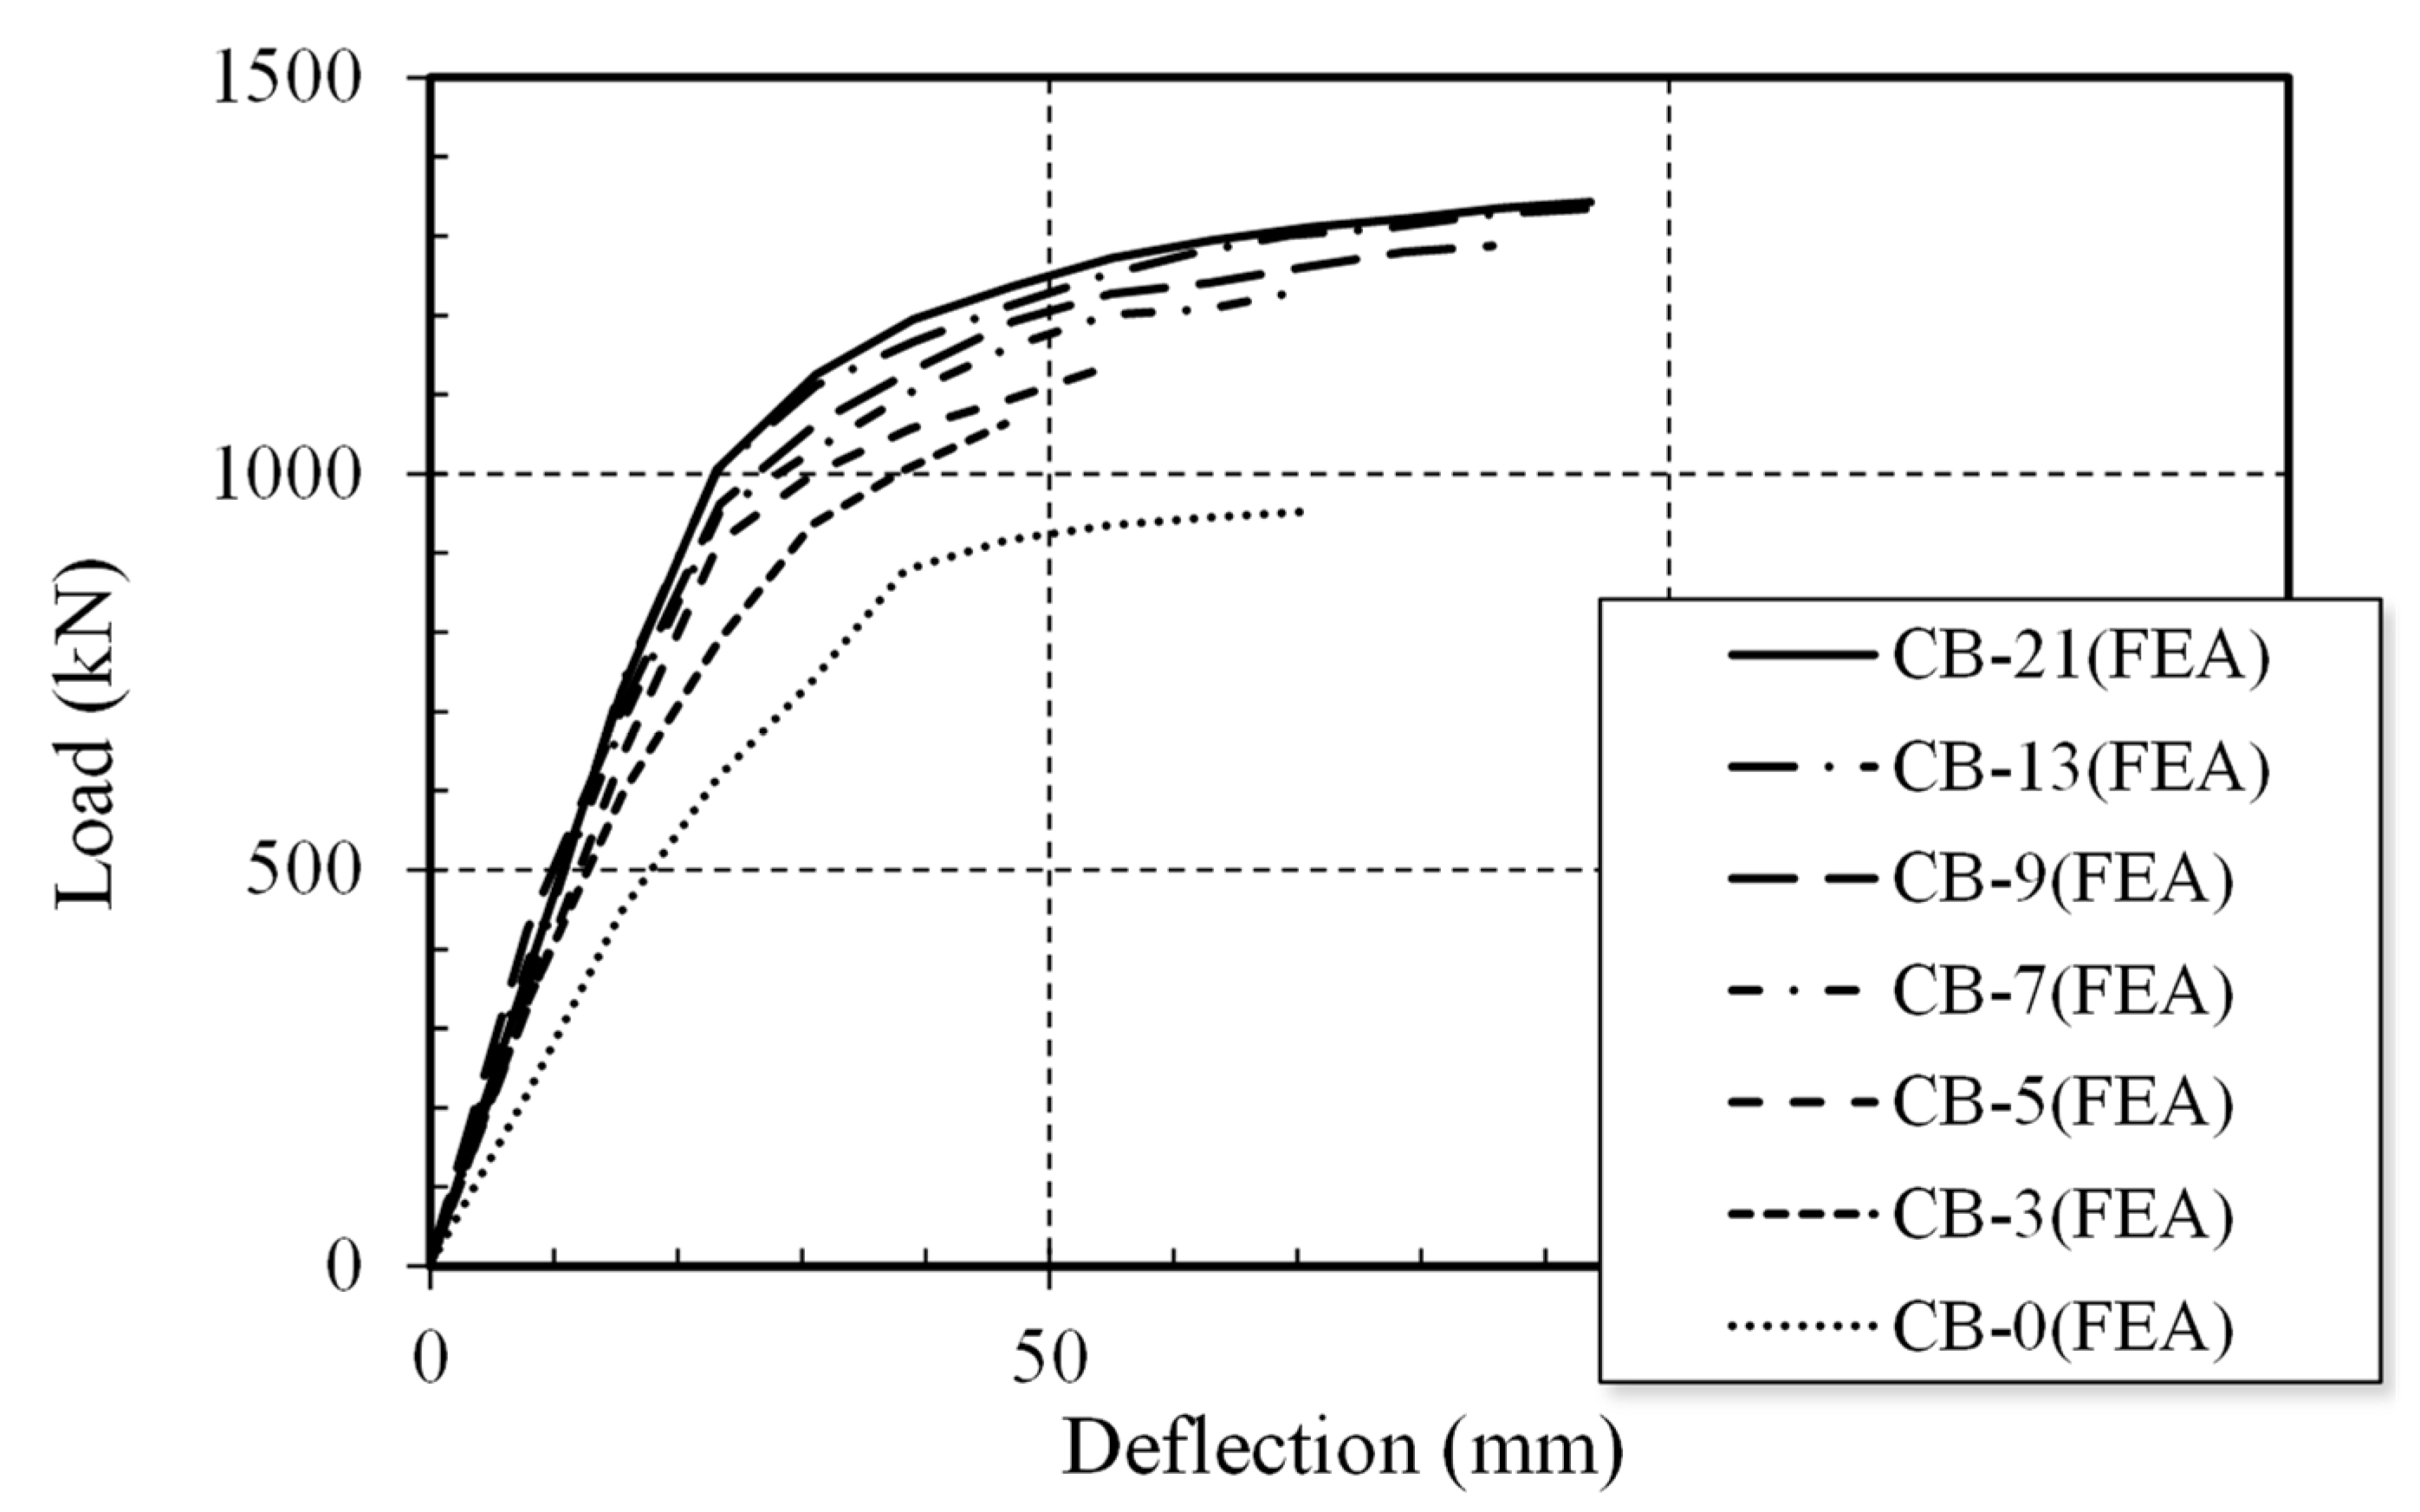
(4)
Through the analysis of the composite beam without shear connectors, it was observed that, even without shear connectors, the composite beam exhibits composite behavior due to friction. Therefore, it can be concluded that when designing a composite beam using shear connectors, consideration of this frictional composite behavior can potentially lead to a reduction in the number of shear connectors.

Author Contributions

Conceptualization, J.-S.L., J.-H.W. and H.-D.L.; data curation, J.-S.L. and H.-D.L.; formal analysis, J.-S.L. and H.-D.L.; investigation, J.-S.L. and J.-H.W.; methodology, J.-S.L. and H.-D.L.; project administration, K.-J.S.; resources, J.-S.L., J.-H.W. and H.-D.L.; software, J.-S.L.; supervision, K.-J.S. and H.-D.L.; validation, K.-J.S. and H.-D.L.; visualization, J.-S.L. and J.-H.W.; writing—original draft, J.-S.L. and H.-D.L.; writing—review and editing, K.-J.S. and H.-D.L. All authors have read and agreed to the published version of the manuscript.

Funding

This study was funded by Innovation&smart Heavy Industry Co., LTD.

Data Availability Statement

The data presented in this study are available upon request from the corresponding author.

Conflicts of Interest

The authors declare no conflict of interest.

References

  1. Tong, L.; Chen, L.; Wang, X.; Zhu, J.; Shao, X.; Zhao, Z. Experiment and Finite Element Analysis of Bending Behavior of High Strength Steel-UHPC Composite Beams. Eng. Struct. 2022, 266, 114594. [Google Scholar] [CrossRef]
  2. Zhang, J.; Li, T.; Hu, X.; Gong, S.; Hong, W.; Feng, J. Flexural Behavior of Steel-MPC Based High Performance Concrete Composite Beams Subjected to Hogging Moments. Eng. Struct. 2023, 276, 115335. [Google Scholar] [CrossRef]
  3. Yang, T.; Zhou, X.; Liu, Y. Flexural Performance of Prefabricated Composite Beams with Grouped Bolt Shear Connectors under Positive Bending Moments. Eng. Struct. 2023, 277, 115387. [Google Scholar] [CrossRef]
  4. Liu, Y.; Guo, L.; Li, Z. Flexural Behavior of Steel-Concrete Composite Beams with U-Shaped Steel Girders. In Proceedings of the 12th International Conference on Advances in Steel-Concrete Composite Structures (ASCCS 2018), Valencia, Spain, 27–29 June 2018; pp. 161–167. [Google Scholar] [CrossRef]
  5. Turetta, M. Development of an Innovative U-Shaped Steel-Concrete Composite Beam Solution: Experimental and Numerical Studies on the Mechanical Behaviour. Ph.D. Thesis, Université de Lorraine, Lorraine, France, Université du Luxembourg, Luxembourg, 2019. [Google Scholar]
  6. Yan, Q.; Zhang, Z.; Yan, J.; Laflamme, S. Analysis of Flexural Capacity of a Novel Straight-Side U-Shaped Steel-Encased Concrete Composite Beam. Eng. Struct. 2021, 242, 112447. [Google Scholar] [CrossRef]
  7. Liu, Y.; Guo, L.; Shi, J.; Wang, J. Push-out Tests of Shear Connectors in U-Shaped Steel–Concrete Composite Girder. Structures 2021, 31, 769–780. [Google Scholar] [CrossRef]
  8. Zhao, Y.; Li, Z.; Ma, H.; Kan, J.; Zhang, N. Shear Behavior of U-Shaped Steel–Concrete Composite Beams with Positive and Negative Loading. Int. J. Civ. Eng. 2022, 20, 1229–1246. [Google Scholar] [CrossRef]
  9. AISC Committee. Specification for Structural Steel Buildings (ANSI/AISC 360-16); American Institute of Steel Construction: Chicago, IL, USA, 2016. [Google Scholar]
  10. Jiang, H.; Fang, H.; Liu, J.; Fang, Z.; Zhang, J. Experimental Investigation on Shear Performance of Transverse Angle Shear Connectors. Structures 2021, 33, 2050–2060. [Google Scholar] [CrossRef]
  11. Arévalo, D.; Hernández, L.; Gómez, C.; Velasteguí, G.; Guaminga, E.; Baquero, R.; Dibujés, R. Structural Performance of Steel Angle Shear Connectors with Different Orientation. Case Stud. Constr. Mater. 2021, 14, e00523. [Google Scholar] [CrossRef]
  12. Liu, Y.; Guo, L.; Qu, B.; Zhang, S. Experimental Investigation on the Flexural Behavior of Steel-Concrete Composite Beams with U-Shaped Steel Girders and Angle Connectors. Eng. Struct. 2017, 131, 492–502. [Google Scholar] [CrossRef]
  13. ASTM A370-22; Standard Test Methods and Definitions for Mechanical Testing of Steel Products. ASTM International: West Conshohocken, PA, USA, 2017.
  14. AC495; Cold-Formed STEEL Structural Beams with Steel Angle Anchors Acting Compositely with Cast-in-Place Concrete Slabs. ICC Evaluation Service: Country Club Hills, IL, USA, 2018.
  15. ABAQUS. Abaqus User’s Manual Version 2019; Dassault Systèmes Simulia Corp.: Providence, RI, USA, 2019. [Google Scholar]
  16. Rabbat, B.G.; Russell, H.G. Friction Coefficient of Steel on Concrete or Grout. J. Struct. Eng. 1985, 111, 505–515. [Google Scholar] [CrossRef]
  17. Jankowiak, T.; Lodygowski, T. Identification of Parameters of Concrete Damage Plasticity Constitutive Model. Found. Civ. Environ. Eng. 2005, 6, 53–69. [Google Scholar]
  18. Nagy, N.; Eltehawy, E.; Elhanafy, H.; Eldesouky, A. Numerical Modeling of Geometrical Analysis for Underground Structures. Int. Conf. Aerosp. Sci. Aviat. Technol. 2009, 13, 1–13. [Google Scholar] [CrossRef]
  19. ACI Committee. ACI 318-14 Building Code Requirements for Structural Concrete and Commentary; American Concrete Institute: Farmington Hills, MI, USA, 2014; ISBN 9780870319303. [Google Scholar]
  20. Kent, D.; Park, R. Flexural members with confined concrete. J. Struct. Div. 1971, 97, 1969–1990. [Google Scholar] [CrossRef]
  21. Hognestad, E. A Study of Combined Bending and Axial Load in Reinforced Concrete Members; Bulleting Series No. 399; University of Illinois: Chicago, IL, USA, 1951. [Google Scholar]
Figure 1. Detailed view of the specimen. (a) Specimen cross-section. (b) Specimen perspective view. (c) Detailed installation of shear connectors.
Buildings 13 02221 g001
Figure 2. Test set-up.
Buildings 13 02221 g002
Figure 3. Load–deflection curve of test results.
Buildings 13 02221 g003
Figure 4. Failure modes of the specimens. (a) Concrete crushing of the loading point. (b) Side view of specimen.
Buildings 13 02221 g004
Figure 5. Plastic stress distribution.
Buildings 13 02221 g005
Figure 6. Modeling of the analysis model.
Buildings 13 02221 g006
Figure 7. Proposed stress–strain relationship [21].
Buildings 13 02221 g007
Figure 8. Load–deflection curve of FEA results.
Buildings 13 02221 g008
Figure 9. Strain distribution of CB-21.
Buildings 13 02221 g009
Figure 10. Comparison of failure modes. (a) Representative failure mode of the test specimen. (b) Tensile crack pattern in the computational analysis.
Buildings 13 02221 g010
Figure 11. Load–deflection curve of variable analysis.
Buildings 13 02221 g011
Table 1. Parameters of the composite beam specimens.
No. SteelConcrete
Specimen *Spacing between AnglesNumber of AnglesBeam LengthBeam DepthWeb
Height
Web
Thickness
Top Flange WidthBottom
Flange Width
Flange ThicknessWidthThickness
(mm) (mm)(mm)(mm)(mm)(mm)(mm)(mm)(mm)(mm)
1CB-214002180808246004200340121000200
2CF-1360013
3CF-910009
* CB-Stud numbers.
Table 2. Material test results.
Materialt F y F u Elongation
(mm)(MPa)(MPa)(%)
A364.0361.25454.5033.01
6.0356.75430.7938.11
A57212.0383.21554.8231.83
Concrete f c k = 21.57 MPa
Concrete design compression strength = 24 MPa
Table 3. Test results.
No.Specimen P y
(kN)
P m a x
(kN)
y
(mm)
u
(mm)
u / y
1CB-211165.721382.0933.92124.313.67
2CB-131135.511353.7436.00132.73.69
3CB-91121.331346.9534.73121.763.51
Table 4. Theoretical analysis results for specimens.
No.Specimen P m a x
(kN)
P T h e o r y
(kN)
P m a x / P T h e o r y
1CB-211382.091182.141.17
2CB-131353.741.15
3CB-91346.951153.861.17
Table 5. Material properties of concrete.
Concrete Compressive BehaviorConcrete Compression Damage
Yield Stress (MPa)Inelastic StrainDamage ParameterInelastic Strain
9.59000
10.504.97 × 10−504.97 × 10⁻⁵
13.862.50 × 10−402.50 × 10⁻⁴
16.744.50 × 10−404.50 × 10⁻⁴
19.146.50 × 10−406.50 × 10⁻⁴
21.068.50 × 10−408.50 × 10⁻⁴
22.501.05 × 10−301.05 × 10⁻³
23.461.25 × 10−301.25 × 10⁻³
23.941.45 × 10−301.45 × 10⁻³
24.001.55 × 10−301.55 × 10⁻³
20.403.35 × 10−30.23.35 × 10−3
Concrete Tensile BehaviorConcrete Tension Damage
Yield Stress (MPa)Cracking StrainDamage ParameterCracking Strain
2.4000
0.059.38 × 10−40.979166679.38 × 10−4
Table 6. Summary of variable analysis.
No.SpecimenSpacing between Studs
(mm)
Number of Studs
(EA)
1CB-2140021
2CB-1360013
3CB-910009
4CB-713007
5CB-519505
6CB-339003
7CB-0-0
Table 7. Results of analysis for existing specimens.
No.Specimen P m a x
(kN)
P F E A
(kN)
P m a x / P F E A
1CB-211382.091359.281.02
2CB-131353.741335.491.01
3CB-91346.951287.891.05
Table 8. Results of variable analysis.
No.Specimen P F E A
(kN)
P T h o e r y
(kN)
P F E A / P T h e o r y
1CB-211359.281182.141.15
2CB-131335.491176.821.13
3CB-91287.891100.121.17
4CB-71231.491021.731.20
5CB-51133.44947.361.19
6CB-31005.17831.571.20
7CB-0952.81706.251.37
Disclaimer/Publisher’s Note: The statements, opinions and data contained in all publications are solely those of the individual author(s) and contributor(s) and not of MDPI and/or the editor(s). MDPI and/or the editor(s) disclaim responsibility for any injury to people or property resulting from any ideas, methods, instructions or products referred to in the content.

