Article

Research on the Industrial Heritage Community Retrofitting Design Based on Space Network Model of Carbon

1
School of Architecture and Urban Planning, Shandong Jianzhu University, Jinan 250101, China
2
China Shanghai Architectural Design & Research Institute Co., Ltd., Shanghai 200333, China
*
Author to whom correspondence should be addressed.
Buildings 2023, 13(9), 2202; https://doi.org/10.3390/buildings13092202
Submission received: 29 June 2023 / Revised: 25 August 2023 / Accepted: 27 August 2023 / Published: 30 August 2023

Abstract

:
The low-carbon retrofitting of industrial heritage communities is an important issue for reducing urban carbon emissions. Previous research on the judgment of heritage elements and carbon emission factors of industrial heritage communities lacked the construction of elements within the space, and the value judgment of conservation and the determination of low-carbon factors lacked a systematic network analysis. Carbon spatial networks as a systematic approach can systematically harmonize the contradictions between “conservation–transformation–low carbon” while considering the spatial and temporal carbon emissions of nodes. This research uses hierarchical analysis to analyze the value of heritage elements and locate them in space, then combine the elements that affect carbon activities in space to form carbon space nodes integrated with heritage conservation elements, and analyze the links between nodes to form a carbon space network. Then, this research uses a carbon spatial network to dissect the structure of carbon emissions, calculate the carbon activity at nodes, and reflect it into a parameterized platform to guide designers. After that, this research selected 16 industrial heritage communities in the severe cold region for the carbon activity measurement of carbon spatial network node elements in the operation stage and conducted a correlation analysis to obtain a correlation matrix model of node elements and carbon activities. Within the constraints of heritage element protection, the results show that the volume ratio, green area ratio, and building density of the carbon spatial network model have the greatest influence on its carbon performance, followed by porosity and road density. Through case simulation verification, the floor area ratio of industrial heritage communities should be controlled between 2.1–2.5, the number of residential building floors should be 7–14, the road network density should be 4.16–4.50%, the green space ratio should be 20–35%, and the porosity should be 35–45%. Taking the three major power road communities in Harbin as an example, retrofit measures were decided by reference to relevant parameter control intervals, resulting in a 21.1% reduction in energy consumption, an approximate 32.7% reduction in carbon emissions, and a 7.3% reduction in the annual percentage of hours in extreme hot and cold environments.

1. Introduction

Today, the main cause of global warming is the emission of GHGs (e.g., CO2, CH4, etc.), and its reduction has become an urgent issue. The heat island effect and deteriorating air quality in urban areas are having a serious impact on human habitat, and the public health of people in urban areas is being seriously affected. With urbanization, about 55% of the world’s population currently lives in urban areas [1], and the number of urban dwellers is expected to grow to 68% by 2050 [2]. Industrial heritage communities with high population densities and building density will continue to be a significant contributor to global GHG emissions, accounting for approximately 50–60% of total GHG emissions and approximately 71–76% of total energy use [3,4] (Figure 1). Currently, urban development is shifting to stock development, and industrial heritage communities, as the basic units that make up the city, contain people’s productive lives and show all aspects of carbon activities. Industrial heritage communities are both residential living areas for urban residents and symbols of the city’s industrial civilization. In order to achieve industrial culture preservation and enhance the living environment, it is necessary to improve their energy efficiency in order to achieve the carbon neutral construction goals set by the government.
According to preliminary statistics, nearly 160,000 old communities exist in China [3], and 39,000 old communities will be retrofitted by 2025, with plans to achieve the full retrofitting of old communities by 2025 [3,4], with industrial heritage communities accounting for 1/4 of the target. The energy consumption and carbon emissions of industrial heritage communities are about 23% higher than those of new communities, so it is important to clarify the carbon activities of industrial heritage communities to reduce energy consumption and carbon emissions. Industrial heritage communities often consume large amounts of energy and produce large carbon emissions due to their inefficient and high-emitting heating, ventilation, and air-conditioning (HVAC) systems, making it more difficult to properly retrofit old buildings than new ones [5,6,7]. Today’s low-carbon retrofit upgrades are merely superficial piles of new technologies and ideas, such as retrofitting landscapes, adding rainwater harvesting systems, and other green retrofit technologies [8,9]. However, these approaches do not dig deeper into the carbon activities of the community and do not systematically consider the elements on the nodes of the carbon space network. At the same time, the specificity of industrial heritage communities represents a myriad of retrofitting constraints, with fixed energy use, the nature of the site, and the difficulty of changing the building form. In the retrofitting process, it has to adapt to the needs of living and production, meet the requirements of heritage conservation, and, at the same time, adapt to the direction of low-carbon development, which makes the low-carbon improvement process challenging [10,11].
Therefore, the main purpose of this paper is to combine heritage conservation and low-carbon retrofitting, integrate these two elements into a carbon spatial network of industrial heritage communities, and then measure the basic values of the carbon spatial network elements, consider the optimization of human settlements, and reconcile the contradictions between heritage conservation and low-carbon renovation, so as to guide the conservation and low-carbon retrofitting efforts. In a carbon spatial network, nodes of elements are interconnected, and these elements act as information points in the network system, driving conservation and low-carbon retrofitting actions along the network connectivity, and are control points for retrofitting in industrial heritage communities. Conservation and low carbon are the broad framework of the whole system, and these control points connect the decision points of designers and parameterized platforms—the whole carbon space network. Low carbon and conservation decisions flow repeatedly, multiple times, and in multiple cascades along the network node linkages, and, when this cascade of flows and interconnected information feedback loops are combined, a complete carbon spatial network is formed [12,13]. The carbon space network will, therefore, revolutionize the preservation and transformation of industrial heritage communities.
In the harsh cold regions of China (Figure 2), the long cold winters and high heating demand have led to particularly high energy consumption and high carbon emissions, and the existing low-carbon retrofit studies have ignored the situational and networked characteristics of carbon activities. In the carbon space network, the overall carbon activities of the community can be considered in a contextualized and systematic perspective, defining carbon activities into space, optimizing the nodal elements of the carbon space network, and considering the interrelationship between nodes to achieve carbon reduction in industrial heritage communities. At the same time, the analytic hierarchy process is used to analyze the conservation and utilization elements of industrial heritage communities, and, on this basis, the carbon space network is combined to determine reasonable transformation measures to achieve the goal of sustainable development while preserving the historical heritage and ecological environment.
The UN IPCC and international institutions such as the World Bank have pointed out in their studies that CO2 emissions come from seven main areas: energy, transportation, buildings, industry, agriculture, forestry, and waste disposal. Among them, the five main elements of the carbon cycle system affecting the community are energy, transportation, buildings, production, and consumers [14]. Industrial heritage communities are an important type of industrial heritage with high historical, artistic, scientific, social, and cultural values, as well as being an important element of urban cultural identity and a part of contemporary urban life. The keyword search of the relevant literature review in recent years is shown with Figure 3.
In terms of industrial heritage community conservation, Liu Lihua et al. [15] selected the workers’ village in Tiexi District, Shenyang, as a research object to analyze the mutual influence of urban industrial heritage and community memory sites, to explore the means of revitalizing urban industrial heritage buildings, and to strongly protect the community memory sites so that they can become community public activity sites and realize urban space regeneration. In the FAW industrial heritage community regeneration project in Changchun, Liu et al., (2019) [16] proposed a design method based on context-aware weighted multi-criteria decision making. The study focused on the analysis and application of quantitative indicators while considering factors such as historical and cultural heritage preservation, environmental protection, and social development to achieve sustainable industrial heritage community regeneration. However, these approaches are vaguer and have not been analyzed quantitatively.
Zhao et al. [17,18,19,20,21] explored the strategies and methods of the green transformation of industrial heritage communities, and proposed a sustainable green transformation model including, for example, building energy conservation, environmental protection, and landscape greening. These approaches are more mature and actual cases exist, but they do not think deeply about the community’s microclimate environment and carbon network, and they think less about the nature of carbon activities. The common practice of certifications and standards for energy efficiency and emission reduction in buildings (such as the European Union’s Near Zero Energy Building Standard) is to optimize energy use in isolation, without considering the urban environment or interaction with the surrounding environment. The carbon networks of communities are often complex and poorly understood, so it is particularly important to understand the carbon fabric in communities. Jin, Shi, Sun, and Tan et al. [22,23] used an integrated approach including a combination of data collection, statistical analysis, and modeling techniques to study multiple medium variables including carbon emissions, land use intensity, urbanization level, population density, industrial structure, and economic development. These studies used various statistical methods such as correlation analysis, principal component analysis, and regression analysis, and found that carbon emissions were positively correlated with land use intensity. This indicates that a higher land use intensity is associated with higher carbon emissions, and economic development and industrial structure are also found to have significant effects on carbon emissions. RD. et al. [24] in 2019 sorted out and summarized the research results about the sustainability of industrial heritage regeneration in recent years, and analyzed and reviewed them from multiple perspectives. The study focused on sustainability, urban planning, cultural heritage preservation, and socio-economic aspects, and summarized the main results and problems of the research. However, previous studies only summarized and analyzed the research on the sustainability of industrial heritage regeneration in recent years, but did not discuss the experience and application results of specific practices in depth. From the review of the literature, previous studies have placed the regeneration element indices in a relatively single way and have not formed a systematic theory and method.
Network science and system dynamics have become powerful frameworks for understanding and analyzing complex systems in a variety of fields. Havlin S. et al. explore the challenges faced in diverse fields including infrastructure, climate, social systems, applied network science, and economics. These challenges include modeling dynamic interactions in multilayer networks, predicting cascading failures and system resilience, and incorporating real-time data to improve decision making [25]. This is also a challenge for the low-carbon retrofitting of industrial heritage communities. Industrial heritage communities are complex systems that require a network approach to thinking about conservation and retrofitting. Labanca N. et al. delve into the connections between complex systems theory and social practices, exploring how the combination of the two can provide innovative and effective decarbonization strategies. Research has shown that complex systems theory, with its emphasis on interconnections and non-linear interactions within systems, can explain low-carbon strategies under the influence of social norms and cultural factors and can understand the role of user behaviors and habits in technological change, as well as develop a range of practical pathways [26]. The complex dynamics of communities in networks have been studied in depth by Porter M A. et al. By exploring the underlying structure of networks, they have revealed the emergence and characterization of communities, providing valuable insights into the complex interactions between the components of networks. In the process of the low-carbon transformation of industrial heritage communities, the conservation and low-carbon elements can be better guided by dissecting them through the idea of a system network [27]. However, most of today’s research is directed at theory and not put into practice. In other words, the existing practice and research only consider the information points in the network, but not the control points and decision points. Therefore, one of the aims of this paper is to construct a complete carbon spatial network of industrial heritage communities, which can be used to guide subsequent research and practice.
The green regeneration of industrial heritage communities is the embodiment of sustainable development, which can promote the cultural and economic development of the city while preserving the historical and cultural heritage, as well as maintaining the ecological balance. Constructing a heritage conservation value judgment system, carbon space network model, renewal theoretical framework, and method for industrial heritage communities will greatly contribute to the resilient and low-carbon development of cities. The innovative aspects of this study are as follows:
1. The conservation and low-carbon retrofitting of industrial heritage communities are considered from a network perspective. The elements of conservation and low-carbon retrofit are connected to form a carbon space network to systematically guide the conservation and renewal of existing industrial heritage communities, and to meet the basic needs of heritage conservation, low-carbon, and human settlements.
2. We combine theory and practice: we integrate the information points, control points, and decision-making points in the network to better promote the research and practice of heritage community retrofitting.
3. We build a carbon space network from a spatial perspective, combining the living space, green space, and road space in the community, which is conducive to clarifying the carbon activity texture of the community, and then targeted retrofitting.

2. Materials and Methods

2.1. Research Subjects

In the Nizhny Tagil Charter for Industrial Heritage, it is clearly stated that the value of industrial heritage communities, which include places for social activities related to industry such as housing, should be recognized and preserved through appropriate means, and that residential amenities are usually expressed as industrial heritage communities, which generally refer to those containing industrial heritage surrounded by amenities that meet the needs of employees and surrounding residents for housing, living, interaction, and leisure. These community spaces contain artistic values, cultural values, and strong use functions, and are tools for improving the image of the city and generating a stronger identity, as well as being a catalyst for urban regeneration and contributing to the local community and economy [28]. In China, it refers to the communities built and managed by large industrial enterprises after the founding of the country, during the First Five-Year Plan and Second Five-Year Plan (1949–1962), and subsequent developments, to meet the needs of employees and their families in terms of housing, living, interaction, and leisure. Within this category, communities with rich historical remains, intact life forms, and complete spatial structures, and belonging to historic areas are collectively referred to as industrial heritage communities [29,30]. Currently, the land use of industrial heritage communities is no longer in line with the needs of the times; many hidden carbon sinks are not utilized, and there are problems such as poor habitat, low energy efficiency, high carbon emissions, and poor climate resilience [31]. The distribution of industrial heritage communities in the harsh regions of China selected for this paper is shown in Figure 4, with data from provincial government plans, Google satellite maps, GIS data, and field research.
It is important to note that, in the vast majority of cases, clearly defined boundaries of a community are generally the administrative boundaries that are accepted by residents and often used by public agencies for planning, zoning, and data collection [32]. Within the industrial heritage community, there are two kinds of scopes that need to be protected and those that do not need to be protected. Based on China’s cultural relics protection law and related regulations, this study divides the industrial heritage community into the scope of ontological protection, style co-ordination zone, and modern living zone, using the boundary of morphological zoning, roads, and landmark building nodes as the dividing line, which is used to further clarify the boundary conditions for protection and renewal, so as to facilitate further retrofitting and renewal.

2.2. Research Methodology

In a study in Famagusta, Cyprus, Ozarisoy B. et al. identified relationships between different relevant variables based on residential patterns and household habit adaptation behaviors on household energy performance, which will deepen our understanding of these relative impacts and predict the interactions between these variables, which can ultimately be calibrated for certain groups of people’s energy consumption [33]. These variables include households with different social and demographic characteristics, energy efficiency methods based on household awareness, heating and cooling systems, different modes of energy use, and household energy use, which reflect the low-carbon elements of the system network perspective and are a necessary starting point for realizing low-carbon retrofits. In other studies on the impact of settlement layout on energy consumption, Deng Q. et al. considered the impact of building layout on energy consumption and explored the impact of enclosed layout, staggered layout, and orientation on energy consumption [34], but another important piece of data that affects energy consumption and carbon emission in settlements is land use, which should be considered systematically. It is worth emphasizing that the above studies consider the real energy performance and the interconnections between some of the elements, which can be a guide for related low-carbon retrofit studies. Therefore, in this study, based on the measurement of real energy performance, carbon activities in time and space as well as the main elements affecting carbon activities in industrial heritage communities were considered to further guide the low-carbon retrofit of industrial heritage communities. It is also important to note that the carbon spatial network is a scenario-based projection of carbon-saving potential for the future based on the current situation. The root principle is to improve the overall carbon-saving potential through the transformation of elements with high relevance to carbon emission elements and the improvement of the linkage of information points, decision points, etc., in order to achieve the purpose of carbon reduction.
This study aims to provide theoretical support and tools for the implementation of industrial heritage community renewal in practice based on the carbon space network. First, establish a value assessment and protection system to determine the boundary conditions for retrofitting, with heritage value judgment and community livability as the preconditions; second, on the basis of climate change, as well as community microclimates, construct a carbon space network model, considering situational and networked community carbon emissions, and construct a community carbon space network to address low-carbon community issues at the system level; thirdly, based on the element data of 16 industrial heritage communities, a correlation analysis was conducted to determine the relationship between the elements of community carbon space network nodes and carbon emissions on the basis of carbon space network, and we apply it to the retrofitting method (Figure 5). Therefore, this study applies not only to the cold regions of China, but also to parts of the European Union and other countries and regions with similar continental climates that are also in cold regions.

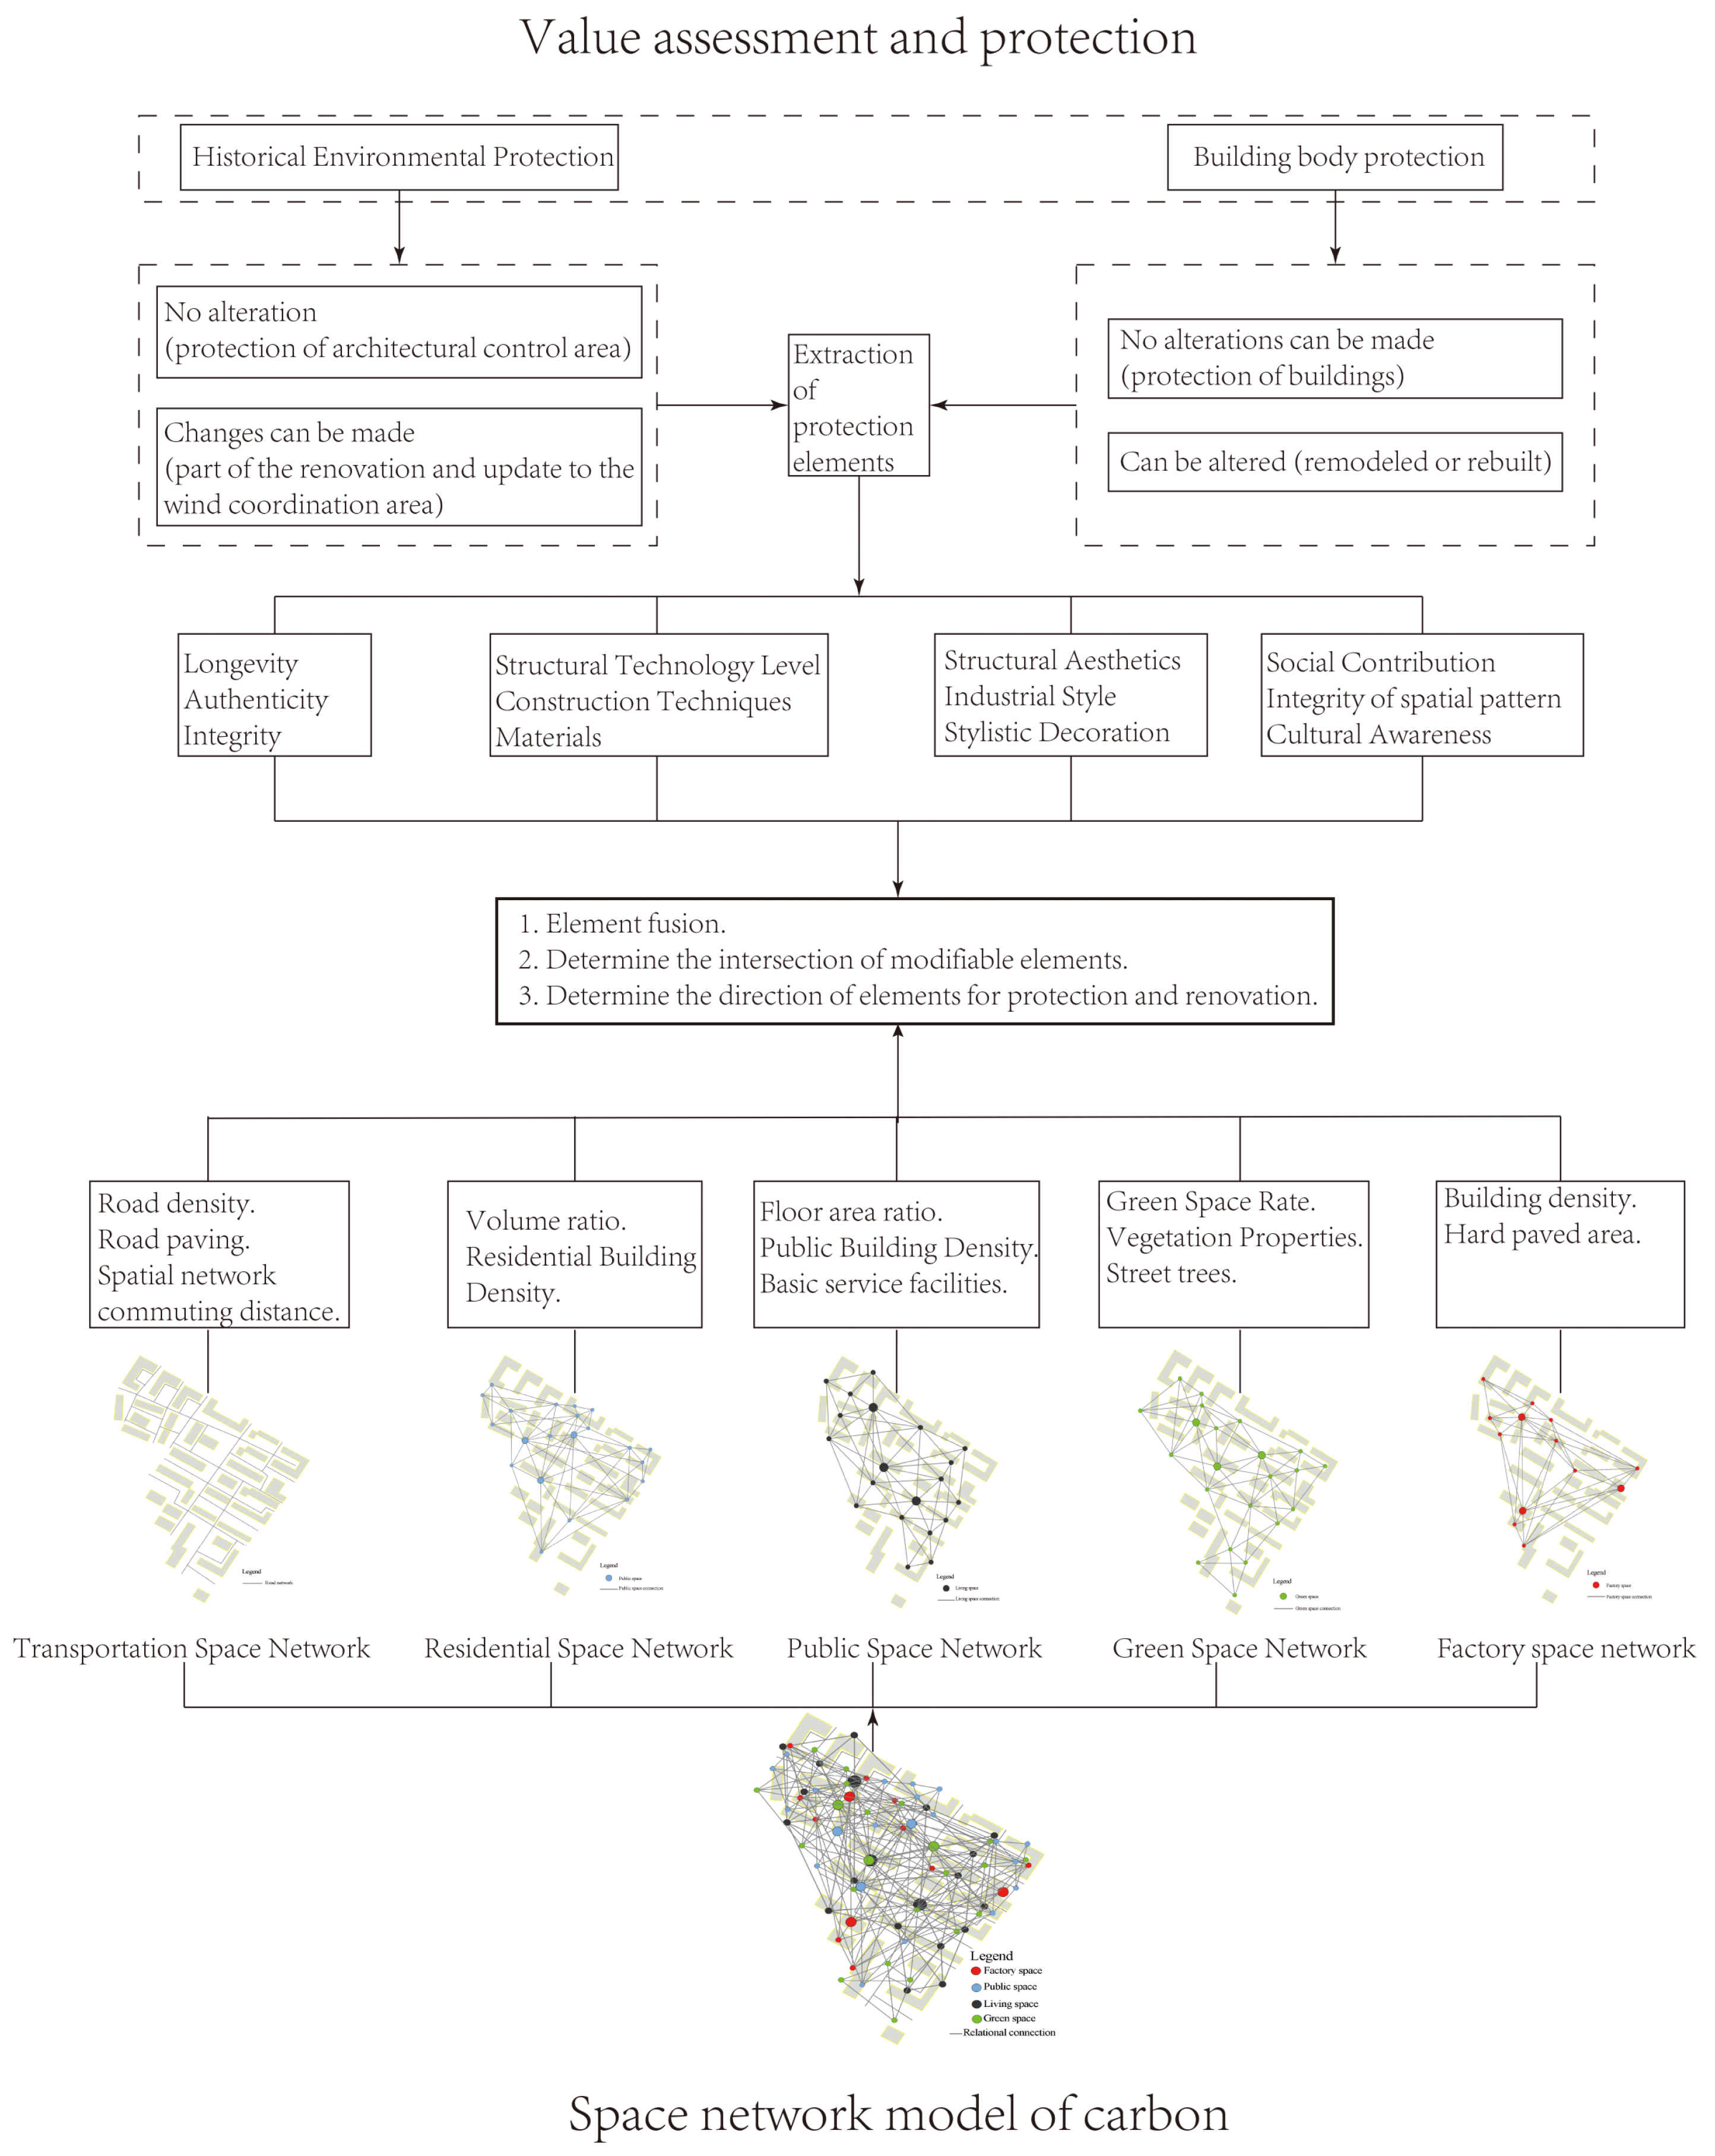
2.2.1. AHP-Based Value Assessment

Usually, listed industrial heritage communities are only listed to some extent to meet heritage regulations—the aim is for them to be properly maintained and protected, which usually means keeping the façade of the building and changing other parts. The problem with this approach, however, is not only the loss of the valuable design of the building itself, but also the loss of the specific sense of place that the former industrial area must provide [35,36]. In previous conceptions, the retrofitting of historically significant communities was seen as a cultural risk, and, therefore, local legislation placed restrictions on the retrofitting that might apply; i.e., the higher the relevance or uniqueness of the heritage asset of the building or environment, the more restrictive the conditions for regenerative design. Analytic hierarchy process (AHP) is a quantitative analysis method that decomposes the elements related to decision making into various levels such as objectives, criteria, and options, and calculates a comprehensive index by determining the weights of each element [37]. The specific process is shown in Figure 6.
In the context of stock planning, value determination of industrial heritage communities is a crucial part of conservation and development [38]. When assessing the value of industrial heritage, people tend to focus on the structural form, material, and space of the building itself, while underestimating the living environment and urban value of the heritage. Based on the existing research, we applied the method of spatial morphological zoning to carry out an overall morphological zoning of the community. Moreover, this study uses the existing community roads and other obvious boundaries as the boundary of morphological zoning, and takes into account the similarity of functions and different stages of historical development to further form “morphological areas with obvious spatial morphological characteristics”. Finally, AHP was used to make value judgments on different morphological partitions of the community.
In order to make a relatively objective value judgment of morphological subdivisions, a sub-objective evaluation system for morphological subdivisions is first established, which mainly includes the content of the index system, weights, and scoring system for the evaluation of material elements of the community [38]. In this study, morphological zoning is considered as an overall unit, and the heritage value of industrial heritage communities is divided into six A-level indicators based on the evaluation criteria of heritage guidelines, research, and expert opinions, combined with the typical characteristics of communities, and 15 B-level indicators are established on this basis as primary evaluation indicators (Table 1). The evaluation index system is not only applicable to the evaluation of the whole industrial heritage plant area, but also applicable to the evaluation of the industrial heritage individual units and even structures, facilities, and equipment. After that, the judgment matrix was established by two-by-two comparison, and each evaluation index at the same level was compared two-by-two, and the evaluation index m was assigned with n for importance comparison (Table 2), after which the results were obtained by two-by-two comparison of the industrial heritage community A-level indices after integrating the questionnaires from experts.

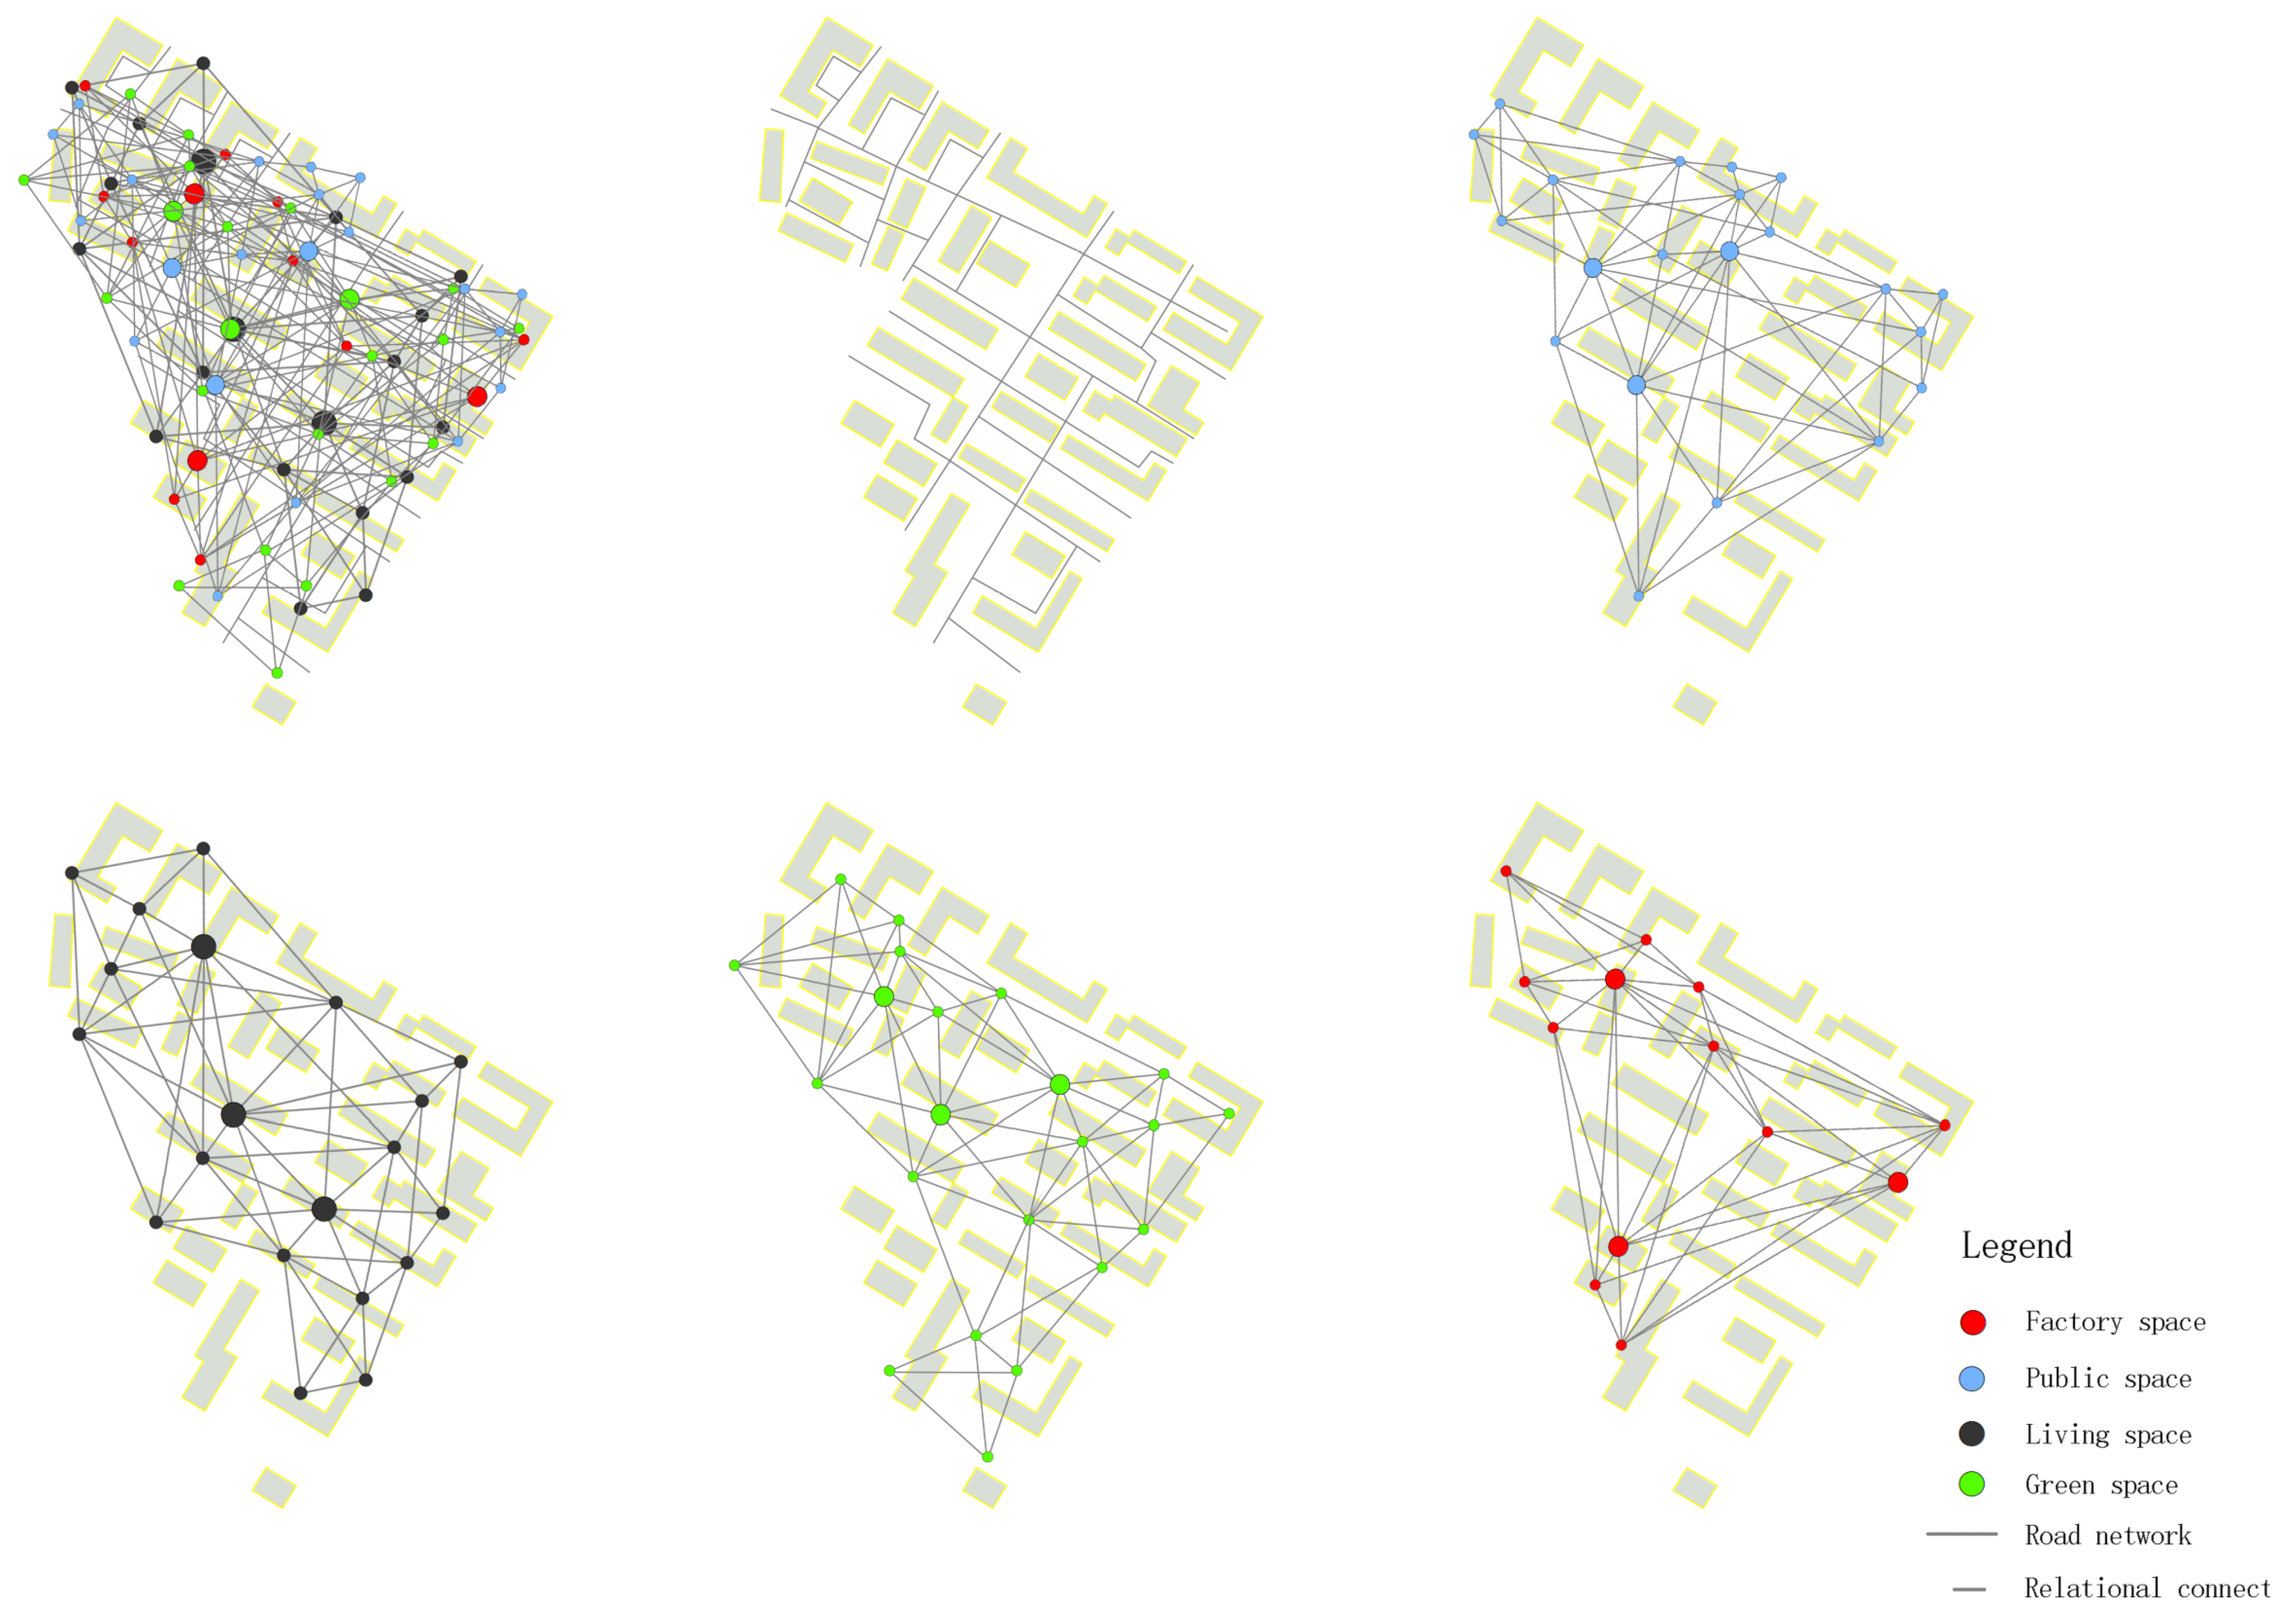
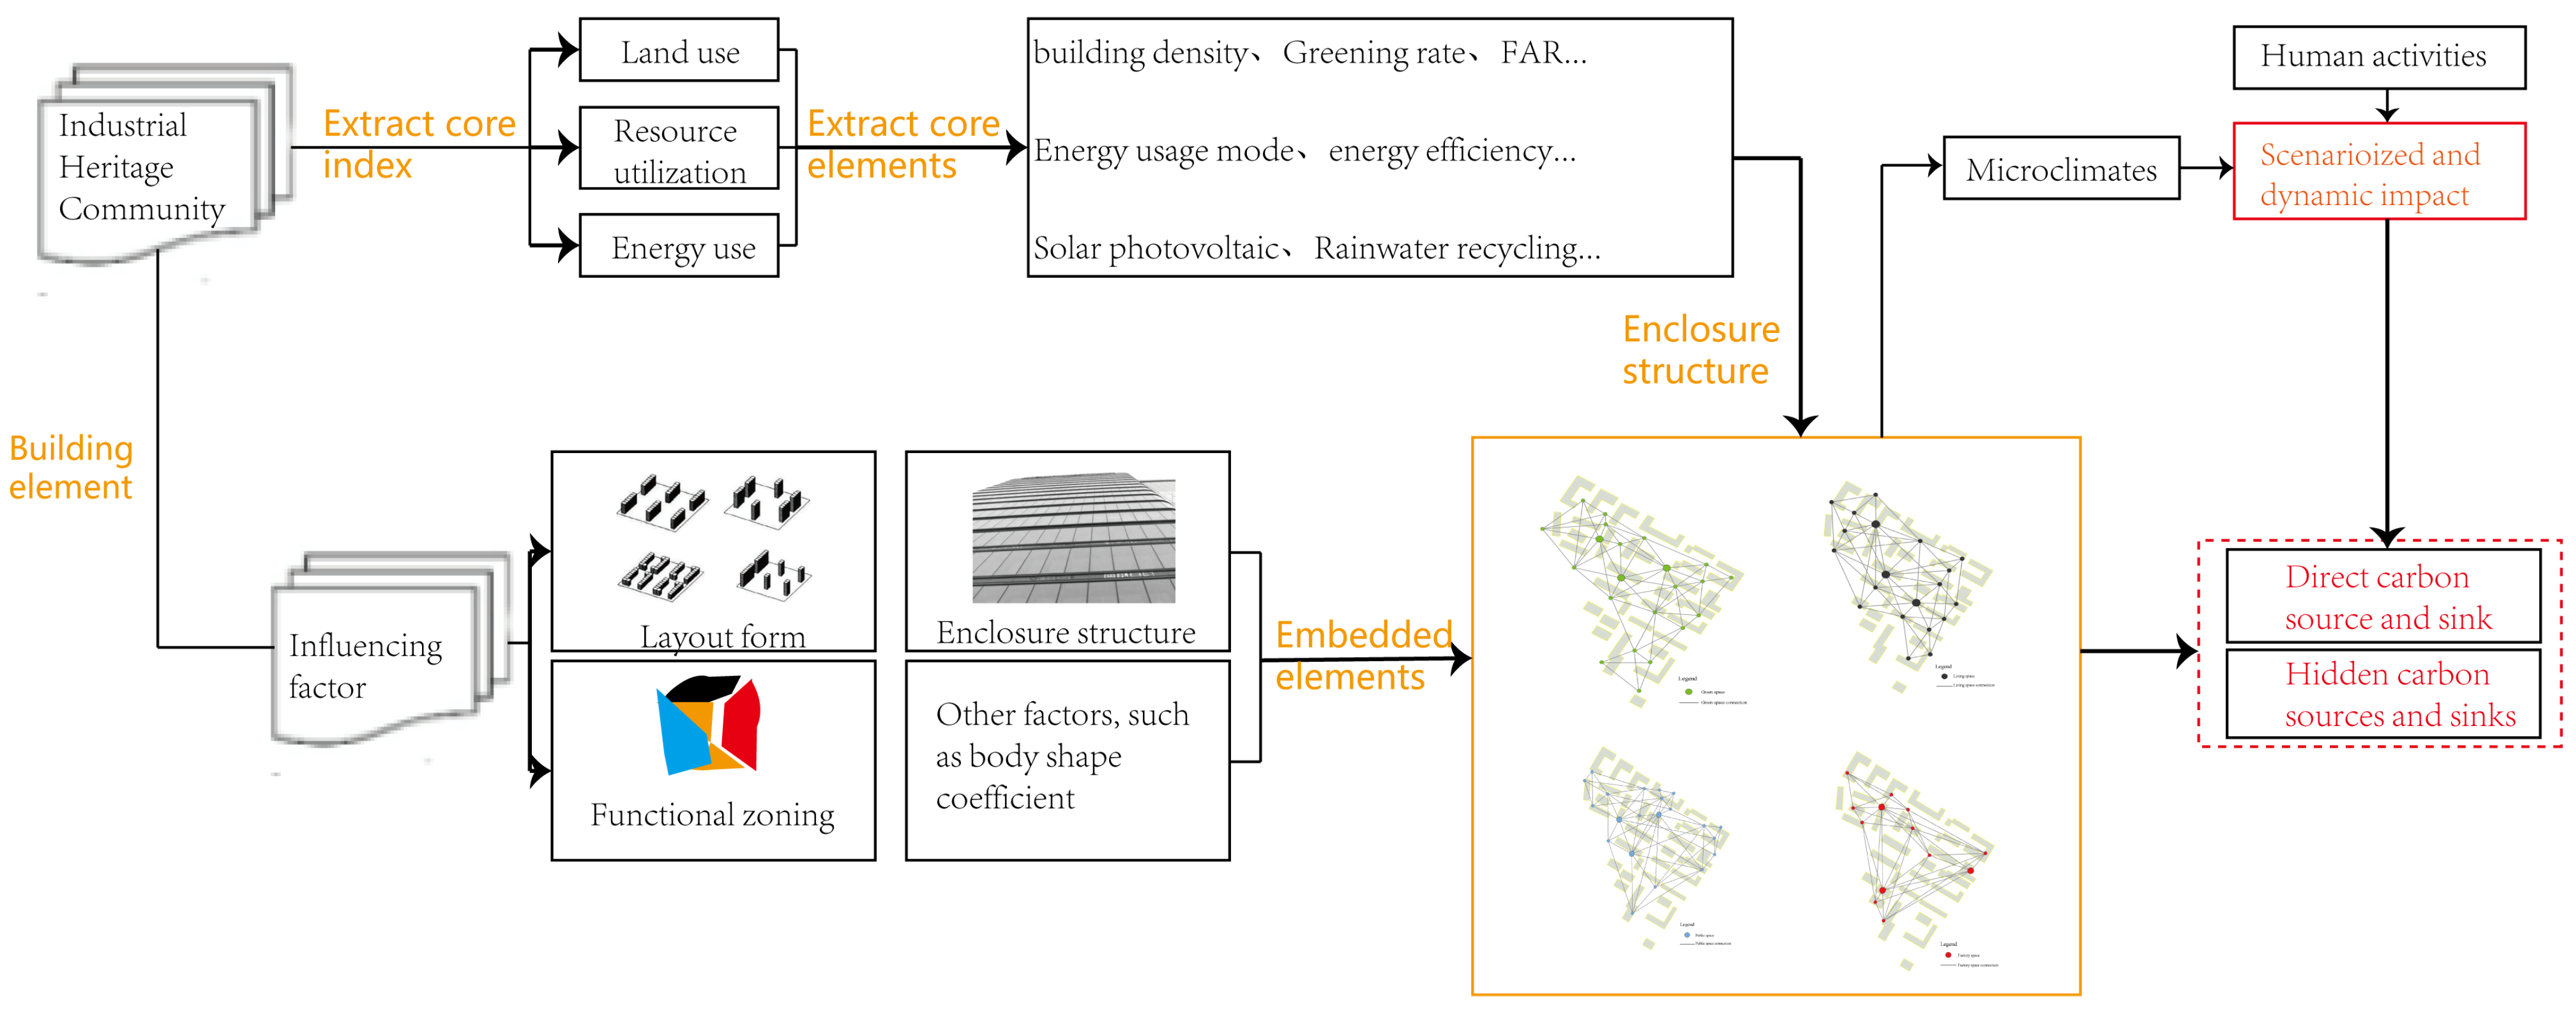
2.2.2. Carbon Space Network Construction

The relationship between humans, communities, buildings, urban microclimate, and global climate is complex. Therefore, in this study, microclimate is the basis for sorting out the texture of carbon activity. Climate—especially microclimate—affects a community’s carbon emissions, energy efficiency, and outdoor comfort. Oke identified three main causes of changes in urban microclimate: (1) interception of short- and long-wave radiation by buildings, (2) reduction of long-wave thermal radiation due to reduced sky visibility, and (3) increased sensible heat storage in buildings [39]. These elements influence the nodal elements in the carbon space network and have a large impact on various properties of the communities.
In the carbon space network of industrial heritage communities, we divided them into residential space network, transportation space network, factory space network, public space network, and green space network based on human behavior, spatial morphological zoning, and functional elements (Table 3, Figure 7). These spatial network node elements partially overlap with the heritage value assessment elements and complement each other for conservation and transformation. The advantage of considering carbon emissions in a scenario is that the fixed, mobile, and hidden carbon activities can be considered using the closest realistic approach, and these elements are integrated in the carbon spatial network of the industrial heritage community, with the nodal elements shown in Figure 8. The carbon activities influenced by these elements mainly include direct and hidden carbon sources, with direct carbon sources being carbon generated from activities such as fossil fuel consumption, transportation fuel consumption, and waste disposal. The hidden carbon sources include mainly the microclimate impact on green vegetation and, thus, the difference in the activity of carbon sources and sinks, but also the carbon-saving potential of solar photovoltaic panels, etc. and the impact of heat exchange between the external environment and the building. Hidden carbon sources also include indirect carbon sinks from the influence of the overall community form, such as the impact of community building porosity and volume ratio on light, ventilation, and heat production. These elements, as carbon space network nodes, are central to the conservation and renewal of the community, and, together, they have an impact on community carbon activities.
In this paper, the sample selection of carbon space network node elements is carried out through 16 representative industrial heritage communities. The 16 samples were chosen for this reason [40,41,42,43]:
1. They were built in the same era.
2. The overall size of the community is similar and the land use intensity of the residential buildings is similar.
3. The aging of the building envelope, public facilities, etc. is similar.
4. The master plans are similar and they are in the same climatic zone, so their microclimates are also relatively similar.
5. Their existing methods of renovation are also relatively close, especially under the general rules of heritage conservation.
And, because the other samples were not columnarly additive to the 16 samples selected for this study, we ultimately chose these 16 industrial heritage communities for our sample pool.

2.2.3. Application of Network Model

The process of regeneration of industrial heritage communities aims to optimize the existing retrofitting framework, address climate change, optimize the habitat, and balance heritage preservation with carbon emission reduction. At the community scale, the layout form, land use, and land cover are key to the thermal environment, overall energy consumption, and carbon emissions [18]. This study is based on the idea of system network, dissecting the key node elements of the network, integrating these elements into each step of the retrofit design process, and improving the efficiency and accuracy of the retrofit design (Figure 9). In the model application, we simulated close to realistic scenarios and combined them with real scenario measurements to achieve the closest-scenario-based understanding of the carbon activity texture.
Microclimate is the basis for the conservation and renewal of industrial heritage communities, and, in order to obtain accurate ground simulation data, the Indra urban future weather algorithm based on the Indra urban future weather algorithm was used in this paper to generate future weather files, which combines historical weather data with the output of climate change models (global and regional climate models) to create files with near-realistic future weather [44]. However, due to the problems inherent in the algorithm, the method can only generate future weather files for typical cities, which may partially deviate from reality to some extent. Therefore, this study uses an average distribution of historical weather data samples to generate future weather files and uses the algorithm to generate more stable future EnergyPlus/ESP-r weather (EPW) files.
For microclimate, the grasshopper-based dragonfly urban weather generator (UWG) was used to generate accurate community microclimate data. UWG can be used as data pre-processing alone or in combination with existing programs to build joint simulation methods. It uses several key geometric and physical variables (building height, roads, roofs, maintenance structures, etc.) to construct the data files [45]. They provide the basic model and weather files for the subsequent performance simulation and optimization of the retrofit process, and are the original database for the entire retrofit process. On the other hand, due to the dynamic nature of the urban environment, the outdoor thermal environment depends on many relevant factors: the characteristics of the conditions inside and outside the building, the relationship between materials and energy use, global climate change, and local microclimate. Also, relevant factors include temperature, solar radiation, wind distribution and velocity, absolute and relative humidity, building density, height, etc. The above complex elements require us to use the universal thermal climate index (UTCI) to model the outdoor thermal environment simulation. In the study, the grasshopper-based ladybug plug-in was used for outdoor wind, light, and thermal environment simulations.
Carbon emissions and energy consumption are a key part of retrofitting industrial heritage communities. For carbon emissions and energy consumption from building operations, this study uses the UMI plug-in developed by MIT Labs to assess the environmental quality and performance of the community. In the measurement process, we also consider the impact of building form, envelope materials, window-to-wall ratio, and other factors on carbon emissions and energy consumption. Compared to other carbon and energy simulation plug-ins, UMI runs faster and produces more accurate results.
The carbon sink in the community mainly includes greenfield carbon sink and soil carbon sink, and the carbon sink is measured by i-Tree method. i-Tree is an urban forestry analysis and eco-efficiency evaluation model developed by the U.S. Forest Service in 2006. For community green space carbon sink estimation, this study uses i-Tree Streets and i-Tree Eco for measurement. i-Tree Streets is a street tree-specific analysis tool for urban forest managers that quantifies the structure, function, and value of annual tree benefits using tree single data, and i-Tree Eco quantifies annual tree benefits based on field data, local hourly air pollution, and meteorological data on urban forest structure, environmental impacts, and community values; both models measure the storage and sequestration of CO2 by the study population, and also include the impact of the study population on building energy consumption and indirect reductions in CO2 emissions and air pollution removal [46].

3. Simulation Process and Data Analysis

3.1. Parameter Settings for Community Simulation

In order to facilitate the control of variables in the numerical simulation process and reduce the interference of other factors to the data, three benchmark data of land use intensity, resource use, and energy use are selected in the simulation of the relationship between core community indicators and carbon activities.
The intensity of land use in a community is the extent to which land is used for various purposes within that community. It can also refer to the extent to which human activities and development occur on land in a given area. It is a measure of the intensity with which land is developed or used for different activities, such as residential, commercial, industrial, agricultural, or open-space purposes [47]. The intensity of land use can be assessed by factors such as floor area, number of buildings or structures, population density, floor area ratio (FAR), and the proportion of land designated for different uses [30,47]. In order to strike a balance between land use intensity, community needs, environmental sustainability, and other relevant factors, the following elements were considered along with the setting of the above parameters: (1) Land Use Types: Define the different land use types in the community, such as residential, commercial, industrial, agricultural, recreational, etc. Assign a specific intensity value to each land use type based on the level of activity or development associated with it. (2) Density: Set the population density of a residential area. This parameter determines the number of people living in a given land area and can influence the intensity of land use. (3) Environmental factors: Consider environmental restrictions and conservation goals. For example, if there are sensitive ecological areas or protected targets, further adjust the intensity of land use in these areas. (4) Porosity represents the ability to ventilate and collect light in an area, and refers specifically to the rate of scenic passage over a barrier formed by the enclosure of buildings, structures, trees, etc. This factor is a reflection of both land use intensity and community form, and has a greater impact on community carbon activity.
When setting the parameters of resource utilization and energy use settings at the same time, we consider the following elements: (1) Population: Determine the size and growth rate of the simulated population. This will affect the demand for resources, such as housing, transportation, water, and energy. (2) Land Use: Define the allocation of land for different uses, such as residential, commercial, industrial, and open space. Consider the intensity of land use required and the proportion dedicated to each type of land. (3) Resource Demand: Estimate the consumption patterns and resource demands of the simulated population. This includes energy use, water consumption, waste generation, and transportation needs. (4) Building Energy Efficiency: Define the energy efficiency standards for buildings in the community. This includes the envelope, HVAC system efficiency, lighting standards, and electrical energy ratings. (5) Environmental Factors: Consider environmental factors such as the renewable energy potential, availability of natural resources, and vulnerability to the effects of climate change. These factors can guide decisions on how resources are allocated and utilized. (6) Climate and Weather: Consider the climate and weather patterns of the community. Different climatic conditions can affect energy consumption for heating, cooling, and other uses. Considering the impact of seasonal variations and extreme weather events on energy use, we primarily consider community energy consumption and carbon emissions in winter due to climate conditions in harsh regions.
For the purpose of a correlation analysis, a data set was created in this study. This data set includes the values of carbon emissions and land use intensity of different communities in four provinces in the severe cold areas of China (Appendix A); also included are different forms of building layouts, which include homes, as well as other public buildings within the neighborhood. Among them, in this paper, energy consumption and carbon emissions are simulated for a period of 50 years and the basic units are kWh/m2 and kgCO2/m2. These elements play an important role in optimizing the performance of communities as nodal elements of the carbon spatial network. The correlation elements among these variables are shown in Figure 10.
The necessary data for the study came from a series of government announcements, research surveys and GIS, and simulation data that were consistent with the spatial and temporal scales of the analysis. In this study, the building performance was simulated for energy intensity and carbon emission according to local climatic conditions, green building design standards, and retrofitting constraints, and the residential geometric model was set to a 20% window-to-wall ratio in the east–west direction, 50% and 40% window-to-wall ratio in the north–south direction, and building floor height was set to 3 m [45,46]. The input parameters for the energy simulation are based on Chinese regulations on carbon emissions and energy use, assuming an annual radiant lighting rate of 600 kWh/m2 for exterior walls and 800 kWh/m2 for roofs, and heating from October to December and January to March. The heat transfer coefficient is U = 0.95 W/m2-K for exterior walls, U = 0.5 W/m2-K for roofs, and U = 5.5 W/m²-K for windows. Other public buildings are set according to the existing state, and the default window opening rate for plants is 10%.
To ensure accuracy and consistency, missing values, outliers, and inconsistencies in the data were handled centrally. Pearson’s correlation coefficient in SPSS was used to calculate the correlation coefficient between land use intensity and carbon emissions, ranging from −1 (strong negative correlation) to +1 (strong positive correlation), with 0 indicating no correlation. A positive correlation indicates that carbon emissions tend to increase as land use intensity increases, while a negative correlation indicates the opposite. The strength of the correlation is indicated by the absolute value of the correlation coefficient, with values closer to 1 indicating a stronger relationship.

3.2. Correlation Analysis of Carbon Emissions and Land Use Intensity

Land use intensity provides insights into the spatial organization of communities, guiding the creation of sustainable, efficient, and livable community environments, and is an important part of the carbon space network [47]. Determine the floor area ratio and land cover to represent the land use intensity, and land cover using the green space ratio, building density, and road density. Use energy consumption and industrial activities as carbon emission indicators to calculate carbon emissions for each community in the data set.
Because carbon space networks contain multiple elements that influence community carbon emissions, the mechanisms of influence among networks are complex. For example, the species of trees and the species of soil micro-organisms vary in each community. On the basis of meeting basic usage needs, livability, and inter-network complexity, this study carefully considered this complex mechanism and came up with more accurate correlation analysis results. As shown by the correlation analysis (Figure 11), there is a positive relationship between carbon emissions and land use intensity. Areas with a higher land use intensity tend to have higher carbon emissions due to increased industrial activity and energy consumption. Among them, communities with a higher floor area ratio and road density have high carbon emissions and show a significant positive correlation. It should be noted that vegetation cover, bare land area, and carbon emissions showed a negative correlation, indicating the potential role of green plants and soil micro-organisms in reducing carbon emissions. Porosity, as an important indicator of the community landscape’s thermal environment, also correlates with the community morphology at the same time. The greater the porosity, the higher the ventilation and light capacity of the community, which can affect the scenic environment of the community, so porosity is also one of the important factors affecting potential carbon sources.
Based on the measured simulation data and analysis results, and based on the statistics in Appendix A, we believe that the floor area ratio of the industrial heritage community should be controlled between 2.1 and 2.5; building density between 35–40% except for industrial buildings; the number of floors of residential buildings between 7–14, and this limitation of the number of floors is conducive to the preservation of the style of heritage buildings; and the road network density between 4.16–4.50%, and the roads should be mostly permeable paving. This approach could lead to an increase in the area of bare land and, thus, the development of potential carbon sinks. Porosity should be 35–45%; the green space ratio should be 20–35%; and street trees are not counted in this part.

3.3. Correlation Analysis of Communities’ Form and Carbon Emissions under the Influence of Land Use Intensity

The building layout form of a community not only directly affects aspects such as the ventilation of residential interiors and the comfort of outdoor public spaces, but also determines the energy consumption of the building [48,49]. To further understand the impact of community form on carbon emissions, the building frontal spacing and side spacing were clarified with reference to the <<Urban Residential Area Planning and Design Standards>> (GB50180-2018) and the <<Technical Regulations on Urban and Rural Planning Management of various regions>>, taking into account the differences of multi-story, mid-rise, and high-rise buildings, and mainly considering the impact of the three layout forms on community carbon emissions, as well as livability.
We measured the impact on carbon activity caused by three types of layout patterns—the enclosed layout, row layout, and staggered layout—within each community. The enclosed layout and staggered layout have less impact on carbon emissions, which is because this layout can improve the internal scenery and heat environment, reducing the heat exchange between indoor and outdoor, so that the hidden carbon sources and sinks can be developed to achieve the purpose of reducing carbon emissions. We further considered the potential carbon sinks of the three layouts, such as the potential carbon reduction from solar photovoltaic panels, and this study concluded that buildings with staggered layouts could receive more daylight and, thus, have greater carbon reduction potential (Figure 12).

4. Design Case Validation for the Renewal of an Industrial Heritage Community in a Severe Cold Region

4.1. Conservation Component of Industrial Heritage Communities

This research verifies the impact of each element in the carbon space network on carbon activities, and focuses on the land use intensity and layout pattern of the community. The aim is that designers can retrofit industrial heritage communities with a network perspective. In the renewal design of the industrial heritage community, the morphological zoning and value assessment of the architectural heritage in the community were carried out first. Using the existing heritage protection area and obvious boundaries such as community roads as the boundaries of morphological zoning, the entire community was divided into seven morphological zoning areas for protection according to the similarity of functions and the different stages of historical development (Figure 13). The other areas are the landscape protection areas and modern development areas. For the morphological partitioning results, AHP is used to split the overall objective of comprehensive value judgment into primary and secondary index systems, after which we perform a comprehensive evaluation score and weighted decision analysis according to the different levels.
According to the methodology identified in Section 3.1, we compared m with n in a two-by-two comparison, and, after combining the questionnaires from experts, we tallied the results of the two-by-two comparison of A-level indicators for heritage buildings in industrial heritage communities, as shown in Table 4.
After that, the judgment matrix is normalized to obtain the weight vector of each index (this research adopts the root method). The process of calculating the weight of each indicator of industrial heritage is as follows:
In the first step, the elements of each row of the judgment matrix are multiplied together, as M1 = 1 × 2.083 × 2.1 × 2.7 × 3.933 × 3.725 = 173.030. Similarly, M2 = 2.116, M3 = 2.071, M4 = 0.446, M5 = 0.047, and M6 = 0.064.
In the second step, the product of these products is divided five times, such as w1 = 2.803. Similarly, w2 = 1.162, w3 = 1.151, w4 = 0.851, w5 = 0.542, and w6 = 0.578.
In the third step, vector normalization is performed to derive the A-level indicator weights wi = w 1 j = 1 n w j , w1 = 0.164, w2 = 0.164, w3 = 0.162, w4 = 0.120, w5 = 0.076, and w6 = 0.082.
The maximum characteristic roots of the industrial heritage value index system were obtained and tested for consistency. Maximum characteristic root λMAX = 1 n i = 1 n A w i w i = 6.050. Afterwards, the consistency index is calculated for CI = λ M A X 1 n 1 = 0.01 < 0.1. Since this matrix is a sixth-order matrix, it needs to be substituted into the consistency index RI = 1.24, and we obtain C I R I = 0.008 < 0.1. The judgment matrix meets the consistency requirement.
For the B-level indicators, weights were calculated in the same way as for the A-level indicators, and the results were [0.272, 0.358, 0.370], [0.692, 0.308], [0.752, 0.248], [0.476, 0.223, 0.301], [0.551, 0.266, 0.183], and [0.732, 0.268]. By calculation, the weights of the indicators of the three major power road industrial heritage communities at each level are summarized in Table 5.
Each indicator of the assessment object is assigned a score, and the indicator assignment is multiplied by its weight to obtain a comprehensive evaluation index by aggregating the scores of each indicator. We judge the industrial heritage grade according to the comprehensive evaluation index and determine the renewal method. Industrial heritage with comprehensive evaluation indices above 80 points has the greatest industrial heritage value and belongs to the first-class industrial architectural heritage (immovable cultural relics level), which should be protected in a comprehensive way. Industrial heritage with a comprehensive evaluation index between 60 and 80 points has a greater value and belongs to the second level of industrial heritage (historical building level), and it is appropriate to adopt the means of “protection as the main focus and renovation as a supplement” for renewal. Industrial heritage with a comprehensive evaluation index between 40 and 60 points has a fair value and belongs to the third level of industrial architectural heritage (higher value industrial heritage level), whose reuse should adhere to the principle of “transformation as the main focus and protection as a supplement”. Industrial heritage with a comprehensive evaluation index between 0–40 points has a very low industrial heritage value and belongs to the fourth level of industrial architectural heritage (general industrial heritage level), which can be dismantled and rebuilt as needed, while other parts of modern forms can be dismantled and rebuilt according to the situation.

4.2. Retrofitting and Renewal of Industrial Heritage Communities

In order to better explore the livability and various performances within the community, we selected morphological zoning V-2 and its surrounding buildings for performance simulation (Figure 14). In order to improve the performance of the community’s environment and, thus, improve the comfort of the community, based on the principles of heritage preservation and morphological zoning, the community has a total area ratio of 2.10, a building density of 42%, a porosity ratio of 40%, and a green ratio of 35%. The density of permeable pavement road is 4.47%, and the area of impervious hard pavement road accounts for 15% of the total road area, which is mostly the hard pavement of urban roads and factories. According to the plan, the area where solar photovoltaic panels can be laid is 30% (Figure 15). The building spacing and orientation are implemented according to the Urban Residential Planning and Design Standards and the General Urban Design Rules. Other parameters are shown in the Appendix B.
The performance of a community’s energy and carbon activities involves many aspects, including the form of the building layout, the floor area ratio, and the building envelope. The study considered energy performance and carbon emissions at the urban design level, and the results are shown in Figure 16. We also simulated the community elements before the retrofit, which resulted in a 16.1% reduction in energy consumption and an approximately 29.9% reduction in carbon emissions compared to the pre-retrofit period. The reason for this phenomenon is the change in the form of the community, i.e., the change in the form of the layout of the building from an incomplete enclosed first floor to a double enclosed form, which allows the current building layout to significantly reduce the heat loss caused by unstable airflow. The other side of the reason is the change in land use intensity and land cover form. For example, the increase in green space area and the reduction in the hard impervious road pavement area also significantly improve the carbon space network nodes, thus reducing energy consumption and carbon emissions. In order to adapt to climate change, we also projected the future carbon emissions and energy consumption of the community, which increased with climate change, increasing population, and aging of the envelope, but with smaller changes.
The community has a green space ratio of 35%, and, including street trees, 11.3% of the total community area is bare land. According to the field research and simulation data, we counted the condition of greenery and the area of bare land for different specifications, and the specific parameters are shown in Table 6.
Based on the calculations of the i-Tree model, we calculated the carbon sink capacity of the relevant carbon activities, as shown in Table 7, the air pollution removal potential of the project site vegetation >1 m and >30 mm diameter is estimated to be about 16,000 g, which can reduce the average temperature inside the community by about 1.22 degrees Celsius.
In conducting the livability assessment, we measured using seven criteria within the scope of the retrofit, as shown in Figure 17, which represents a schematic representation of outdoor comfort in four extreme environments: with wind and daylight, daylight and no wind, wind and no daylight, and no wind and daylight. It can be seen that the extreme hot and cold environments of the four retrofitted environments were significantly reduced, with a significant increase in comfort and being better suited for improving the community environment. According to the comparative analysis of chromatographic extraction, the extreme hot and cold environments were all reduced by 5.3% compared to the pre-retrofit situation. One of the reasons for this phenomenon is that the building layout and building height have affected the wind environment within the site, accelerating the exchange of hot and cold air and allowing the site to receive more reasonable sunlight. At the same time, the reduction of hard paving and the increase in the amount of greenery in the site have also led to changes in the outdoor thermal environment.
The layout pattern of the community can have a significant impact on the carbon activity as well as the scenic thermal environment. As shown in Figure 18, the wind environment is explored for the pedestrian height of the community (1.5 m) and the southwest wind direction. Due to the change in the form of the building layout, the wind distribution within the site has also changed significantly. The interior of the renovated site is free of uncomfortable areas of intense air movement and narrow ventilation corridors. It can be seen that the long façade of the building accelerates the horizontal vortex airflow at the edges, thus increasing the efficiency of the convective exchange of hot air at low altitude and cold air at high altitude, reducing unnecessary heat exchange and obtaining a pleasant wind environment and thermal comfort at the pedestrian level.

5. Discussion

In the process of retrofitting industrial heritage communities, designers should pay attention to improving the environmental form of the community, providing residents with a good living environment, and addressing the issue of balancing heritage preservation and reducing carbon emissions on the basis of addressing climate change. In order to balance heritage conservation and the low-carbon retrofit, this paper first uses AHP to analyze the value of heritage elements and locate them in space. Then, the elements affecting carbon activities in space are integrated to form carbon space nodes combined with heritage conservation elements, and the links between the nodes are analyzed to form a carbon space network. At the same time, this paper uses a combination of qualitative and quantitative methods to analyze and research the elements affecting community carbon emissions in these aspects: appropriate land use intensity, resource and energy use, and spatial morphology on the basis of heritage conservation.

5.1. Recommendations for Conservation in Industrial Heritage Communities

In terms of protection based on morphological subdivisions, we suggest that, on the basis of the above scope, sufficient space should be allowed for morphological subdivisions that require protection to facilitate further morphological protection. Based on the hierarchical analysis method, this study adopts a step-by-step approach to protect the scope of architectural ontology protection and the scope of geomorphology protection within the industrial heritage community in the following ways [51,52]:
1. Classify and score according to the first- and second-degree indices to confirm the degree of importance of the different morphological subdivisions.
2. Calculate the weighting values of the indices, and divide the community as a whole into four grades of morphological subdivisions.
3. Adopt the corresponding protection and renovation measures: a. Being immovable, for comprehensive protection; b. Having protection as the focus, supplemented by transformation; c. Having transformation as the focus, supplemented by protection; d. Dismantling and rebuilding as needed, but paying attention to the overall morphology zoning style.

5.2. Proposals for Decarbonizing Industrial Heritage Communities

Through case simulation verification, for the renewal of industrial heritage communities, this research recommends that the floor area ratio of industrial heritage communities should be controlled between 2.1–2.5, the number of residential building floors should be 7–14, the road network density should be 4.16–4.50%, building density of 35–40%, and the green space ratio should be 30–35%. In terms of the layout form of the community, this paper recommends the adoption of more enclosed and staggered layouts on the basis of ensuring livability [53,54]. This will make the space within the community have better scenic and thermal conditions, which will enable the community to develop more potential carbon sinks.

6. Conclusions

Existing industrial heritage community retrofitting lacks systematic network thinking, aiming only to increase the intensity of land use and the profitability of real estate development, and low-carbonization retrofitting is also limited to the surface stacking of technology. This study integrates various elements that affect carbon emissions into a network, considers the interconnections between the elements, quantifies the carbon activities of the community, and elucidates the relationship between the network elements and carbon activities. For industrial heritage communities, the most important point is to combine conservation with low carbon to build a network of “heritage conservation—low carbon renovation—habitat enhancement—climate change response”, which is academically important for the conservation of industrial heritage, control of community heating energy consumption and carbon emissions, and mitigation of global climate change. This study utilizes a carbon spatial network to retrofit industrial heritage communities based on a range of data measured in cold regions of China and other similar climatic zones, which can result in a 21.1% reduction in energy consumption, an approximate 32.7% reduction in carbon emissions, and a 7.3% reduction in the proportion of time spent in extreme heat and cold environments per year for similarly sized communities. This avoids the unnecessary energy consumption and carbon emissions associated with some other retrofitting approaches and results in a significant improvement in the quality of the habitat. The final part of the paper builds on this research to propose strategies for the conservation and low-carbon retrofitting of communities that have practical implications for the conservation and retrofitting of such communities.
But the correlation analysis in this research may not capture all of the complex factors that influence carbon emissions and land use intensity. Factors such as transportation infrastructure, energy sources, policy interventions, and socioeconomic factors can also play an important role. Follow-up studies consider incorporating additional variables into the analysis or conducting regression analyses to account for the effects of complex factors.

Author Contributions

Conceptualization, F.Z. and R.Z.; funding acquisition, J.L.; methodology, Y.W. and R.Z.; writing—original draft, Y.W., R.Z. and C.W.; writing—review and editing, J.L. and C.W. All authors have read and agreed to the published version of the manuscript.

Funding

This research was funded by the “Study on hierarchical protection of rural settlement units based on GIS spatial analysis technology”, grant number ZR2020ME213. This research was funded by the general program of Shandong Natural Science Foundation, grant number ZR2020ME213.

Data Availability Statement

Not applicable.

Conflicts of Interest

The authors declare no conflict of interest.

Appendix A. Industrial Heritage Community Data Sheet

Test PointsFARGSRPRBDRDPOPACarbon SourceEADASAAAPOSP
Baotou First Thermal Power Plant Family Area2.1925%83%34%3.80%12%30.0356%28%16%29%
Baotou Textile General Factory Textile District2.8522%72%41%5.28%8%41.3225%68%7%31%
Dandong District 204 Road North Community2.60 31%78%32%6.14%9%40.7378%14%6%23%
Dandong District 204 Road South Community2.4528%74%33%4.30%13%37.6373%18%9%24%
Harbin Electric Factory Community2.7730%85%38%4.15%11%39.6623%21%66%22%
Harbin Boiler Plant Community2.2825%79%42%4.20%14%35.6117%71%12%30%
Inner Mongolia Liberty Road No.1 and No.2 Neighborhood Community2.5227%82%36%5.11%12%33.3372%18%10%31%
Haqi Community2.3432%89%34%5.43%28%36.90 82%18%55%27%
Starlight Family Community2.6726%84%37%3.91%13%38.4153%32%15%30%
Sandaizi Workers Community2.2935%86%27%5.31%26%35.2948%21%31%19%
Dalian Shipyard Workers Community2.9527%73%41%6.01%7%45.7143%47%10%38%
Changchun Diesel Engine Plant Community 12.4728%64%38%5.21%14%36.4613%78%9%31%
Changchun Diesel Engine Plant Community 22.5231%82%39%4.39%78%36.7711%6%83%29%
Changchun FAW 3 Block2.2435%71%34%4.61%17%33.6341%12%47%25%
Changchun FAW 6 Block2.6636%86%33%3.72%8%38.9572%16%12%26%
Changchun FAW 8 Block1.9538%83%31%3.65%12%28.6365%21%14%16%
FAR: Floor area ratio; GSR: Green space ratio; PR: Porosity rate; BD: Building density; RD: Road density; POPA: Percentage of plant area; EA: Proportion of enclosed area; DA: Proportion of determinant area; SA: Proportion of staggered area; AAPOSP: Area and proportion of solar panels that can be laid.

Appendix B. Envelope Parameters

a. Non-transparent envelope parameters
SettingValueUnits
Conductivity0.9W/mK
Cost0
Density2500kg/m3
Embodied carbon5.06kgCO2/kg
Embodied energy96.1MJ/kg
Substitution rate pattern0.2
Substitution timestep50
Transportation carbon0.067kgCO2/kg/km
Transportation distance500km
Transportation energy0.94MJ/kg/km
Dirt factor1
Back-side IR emissivity0.84
Front-side IR emissivity0.84
IR transmittance0.01
Back-side Solar reflectance0.43
Front-side Solar reflectance0.27
Solar transmittance0.11
Back-side visible reflectance0.35
Front-side visible reflectance0.31
Visible transmittance0.14
b. Transparent envelope parameters
SettingValueUnits
Conductivity1.75W/mK
Cost0
Density2400kg/m3
Embodied carbon0.24kgCO2/kg
Embodied energy2.12MJ/kg
Substitution rate pattern1
Substitution timestep100
Transportation carbon0.067kgCO2/kg/km
Transportation distance500km
Transportation energy0.94MJ/kg/km
Moisture diffusion resistance50
RoughnessRough
Solar absorptance0.7
Specific heat840
Thermal emittance0.9
Visible absorptance0.7

References

  1. UN-Habitat Economy. Available online: https://unhabitat.org/topic/urban-economy-and-finance (accessed on 28 June 2023).
  2. United Nations. World Urbanization Prospects. Available online: https://www.un.org/development/desa/pd/ (accessed on 28 June 2023).
  3. UN-Habitat. Energy. Available online: https://unhabitat.org/topic/energy (accessed on 28 June 2023).
  4. UN-Habitat. Climate Change. Available online: https://unhabitat.org/topic/climate-change (accessed on 28 June 2023).
  5. Säynäjoki, A.; Heinonen, J.; Junnila, S. A scenario analysis of the life cycle greenhouse gas emissions of a new residential area. Environ. Res. Lett. 2012, 7, 34–37. [Google Scholar] [CrossRef]
  6. Hui, E.C.; Liang, C.; Yip, T.L. Impact of semi-obnoxious facilities and urban renewal strategy on subdivided units. Appl. Geogr. 2018, 91, 144–155. [Google Scholar] [CrossRef]
  7. Zou, Q.; Xue, B.; Li, Z.; Ye, X. Correlation analysis of carbon emissions and land use intensity in China’s provinces. Ecol. Indic. 2016, 67, 278–287. [Google Scholar]
  8. Deng, X.; Jiang, Y.; Zhao, X.; Li, X. Correlation analysis of carbon emissions and land use intensity: A case study of 32 Chinese cities. J. Clean. Prod. 2017, 148, 581–588. [Google Scholar]
  9. Hui, E.C.-M.; Chen, T.; Lang, W.; Ou, Y. Urban community regeneration and community vitality revitalization through participatory planning in China. Cities 2021, 110, 103072. [Google Scholar] [CrossRef]
  10. Luo, X.; Ren, M.; Zhao, J.; Wang, Z.; Ge, J.; Gao, W. Life cycle assessment for carbon emission impact analysis for the renovation of old residential areas. J. Clean. Prod. 2022, 367, 1329. [Google Scholar] [CrossRef]
  11. Peng, L.; Li, X.; Xu, Y.; Li, Z. Correlation analysis of carbon emissions and land use intensity in the Pearl River Delta region, China. J. Clean. Prod. 2017, 141, 42–53. [Google Scholar]
  12. Forrester, J.W. Policies, decisions and information sources for modeling. Eur. J. Oper. Res. 1992, 59, 42–63. [Google Scholar] [CrossRef]
  13. Forrester, J.W. System dynamics—The next fifty years. Syst. Dyn. Rev. 2007, 23, 359–370. [Google Scholar] [CrossRef]
  14. Sun, S.; Xu, S.; Aoki, X. Research on Heritage Community Identity in Industrial Land Transformation. Chin. Cult. Herit. 2022, 41–48. [Google Scholar]
  15. Liu, L. Research on the activation of the memory places of urban industrial heritage communities—A case study of Workers’ Village in Tiexi District, Shenyang. J. Shenyang Norm. Univ. 2022, 46, 99–106. [Google Scholar] [CrossRef]
  16. Liu, L. Research on Path dependence and Path Innovation of Urban Industrial Heritage Community Protection. Mod. City Res. 2015, 11, 41–46. [Google Scholar] [CrossRef]
  17. Girvan, M.; Newman, M.E.J. Community structure in social and biological networks. Proc. Natl. Acad. Sci. USA 2002, 99, 7821–7826. [Google Scholar] [CrossRef] [PubMed]
  18. Huang, L.; Krigsvoll, G.; Johansen, F.; Liu, Y.; Zhang, X. Carbon emission of global construction sector. Renew. Sustain. Energy Rev. 2018, 81, 1906–1916. [Google Scholar] [CrossRef]
  19. Cigola, M. Digital tools for Urban and Architectural heritage. In Geospatial Research: Concepts, Methodologies, Tools, and Applications; IGI Global: Hershey, PA, USA, 2016; pp. 743–764. [Google Scholar]
  20. Landorf, C. A framework for sustainable heritage management: A study of UK industrial heritage sites. Int. J. Heritage Stud. 2009, 15, 494–510. [Google Scholar] [CrossRef]
  21. Zhao, X.; Qiu, S.; Sun, J. Research on the Green Transformation Strategy of Industrial Heritage Communitie—Taking Mianshan Dormitory in Tianjin as an Example. Build. Energy Conserv. 2019, 47, 77–80. [Google Scholar]
  22. Jin, H.; Shi, J.; Sun, G. Correlation analysis of carbon emissions and land use intensity in the Yangtze River Delta region, China. J. Environ. Plan. Manag. 2020, 63, 1196–1215. [Google Scholar]
  23. Tan, S.; Chen, S.; Liu, Z.; Wang, Y.; Zhao, D. Correlation analysis of carbon emissions and land use intensity in different urban areas: A case study of Beijing. Sustainability 2020, 12, 4016. [Google Scholar]
  24. Rodwell, D. Urban heritage, communities, and environmental sustainability. In Securing Urban Heritage; Routledge: Abingdon, UK, 2019; pp. 62–79. [Google Scholar]
  25. Havlin, S.; Kenett, D.Y.; Ben-Jacob, E.; Bunde, A.; Cohen, R.; Hermann, H.; Kantelhardt, J.W.; Kertész, J.; Kirkpatrick, S.; Kurths, J.; et al. Challenges in network science: Applications to infrastructures, climate, social systems and economics. Eur. Phys. J. Spéc. Top. 2012, 214, 273–293. [Google Scholar] [CrossRef]
  26. Labanca, N.; Pereira, G.; Watson, M.; Krieger, K.; Padovan, D.; Watts, L.; Moezzi, M.; Wallenborn, G.; Wright, R.; Laes, E.; et al. Transforming innovation for decarbonisation? Insights from combining complex systems and social practice perspectives. Energy Res. Soc. Sci. 2020, 65, 101452. [Google Scholar] [CrossRef]
  27. Porter, M.A.; Onnela, J.P.; Mucha, P.J. Communities in Networks. arXiv 2009, arXiv:0902.3788. [Google Scholar]
  28. Douet, J. Industrial Heritage Re-Tooled: The TICCIH Guide to Industrial Heritage Conservation; Routledge: Abingdon, UK, 2016. [Google Scholar]
  29. Wang, X.; Zhang, J.; Cenci, J.; Becue, V. Spatial distribution characteristics and influencing factors of the world architectural heritage. Heritage 2021, 4, 2942–2959. [Google Scholar] [CrossRef]
  30. Wang, J.; Lu, C. Research on the Development and Practice of Digital Technology in Architectural Heritage. In Proceedings of the 2022 International Conference on Culture-Oriented Science and Technology (CoST), Lanzhou, China, 18–21 August 2022; pp. 146–150. [Google Scholar]
  31. Lu, N.; Liu, M.; Wang, R. Reproducing the discourse on industrial heritage in China: Reflections on the evolution of values, policies and practices. Int. J. Herit. Stud. 2020, 26, 498–518. [Google Scholar] [CrossRef]
  32. Guerra, P.; Meira, W., Jr.; Cardie, C.; Kleinberg, R. A measure of polarization on social media networks based on community boundaries. In Proceedings of the International AAAI Conference on Web and Social Media, Cambridge, MA, USA, 8–11 July 2013; Volume 7, pp. 215–224. [Google Scholar]
  33. Ozarisoy, B.; Altan, H. Significance of occupancy patterns and habitual household adaptive behaviour on home-energy performance of post-war social-housing estate in the South-eastern Mediterranean climate: Energy policy design. Energy 2022, 244, 122904. [Google Scholar] [CrossRef]
  34. Deng, Q.; Wang, G.; Wang, Y.; Zhou, H.; Ma, L. A quantitative analysis of the impact of residential cluster layout on building heating energy consumption in cold IIB regions of China. Energy Build. 2021, 253, 111515. [Google Scholar] [CrossRef]
  35. Zhang, J.; Cenci, J.; Becue, V.; Koutra, S.; Liao, C. Stewardship of Industrial Heritage Protection in Typical Western European and Chinese Regions: Values and Dilemmas. Land 2022, 11, 772. [Google Scholar] [CrossRef]
  36. Alfrey, J.; Putnam, T. The Industrial Heritage: Managing Resources and Uses; Routledge: Abingdon, UK, 2003. [Google Scholar]
  37. Russo, R.d.F.S.M.; Camanho, R. Criteria in AHP: A systematic review of literature. Procedia Comput. Sci. 2015, 55, 1123–1132. [Google Scholar] [CrossRef]
  38. Liu, F.; Zhao, Q.; Yang, Y. An approach to assess the value of industrial heritage based on Dempster—Shafer theory. J. Cult. Herit. 2018, 32, 210–220. [Google Scholar] [CrossRef]
  39. Oke, T.R. Boundary Layer Climates; Routledge: Abingdon, UK, 2002. [Google Scholar]
  40. Dong, L.; Wang, Y.; Lin, J.; Zhu, E. The Community Renewal of Shantytown Transformation in Old Industrial Cities: Evidence from Tiexi Worker Village in Shenyang, China. Chin. Geogr. Sci. 2020, 30, 1022–1038. [Google Scholar] [CrossRef]
  41. Wang, S.-H.; Huang, S.-L.; Huang, P.-J. Can spatial planning really mitigate carbon dioxide emissions in urban areas? A case study in Taipei, Taiwan. Landsc. Urban Plan. 2018, 169, 22–36. [Google Scholar] [CrossRef]
  42. Mazmanian, D.A.; Kraft, M.E. (Eds.) Toward Sustainable Communities: Transition and Transformations in Environmental Policy; MIT Press: Cambridge, MA, USA, 2009. [Google Scholar]
  43. Gu, T.; Hao, E.; Ma, L.; Liu, X.; Wang, L. Exploring the determinants of residents’ behavior towards participating in the Sponge-Style old community renewal of china: Extending the theory of planned behavior. Land 2022, 11, 1160. [Google Scholar] [CrossRef]
  44. Rastogi, P.; Andersen, M. Embedding Stochasticity in Building Simulation through Synthetic Weather Files. In Proceedings of the BS2015: 14th Conference of International Building Performance Simulation Association, Hyderabad, India, 7–9 December 2015. [Google Scholar]
  45. Kamal, A.; Abidi, S.M.H.; Mahfouz, A.; Kadam, S.; Rahman, A.; Hassan, I.G.; Wang, L.L. Impact of urban morphology on urban microclimate and building energy loads. Energy Build. 2021, 253, 111499. [Google Scholar] [CrossRef]
  46. Nowak, D.J.; Maco, S.; Binkley, M. i-Tree: Global tools to assess tree benefits and risks to improve forest management. Arboric. Consult. 2018, 51, 10–13. [Google Scholar]
  47. Erb, K.-H.; Haberl, H.; Jepsen, M.R.; Kuemmerle, T.; Lindner, M.; Müller, D.; Verburg, P.H.; Reenberg, A. A conceptual framework for analysing and measuring land-use intensity. Curr. Opin. Environ. Sustain. 2013, 5, 464–470. [Google Scholar] [CrossRef]
  48. Energy Efficiency Design Standards for Residential Buildings in Severe Cold and Cold Regions. JGJ26-2010. 2010-03-18. Available online: https://kns-cnki-net-443.webvpn.sdjzu.edu.cn/kcms/detail/detail.aspxFileName=SCSD000005978883&DbName=SCSD (accessed on 28 June 2023).
  49. Sonta, T.R.A.; Dougherty, R.K.; Jain, R.K. Data-driven optimization of building layouts for energy efficiency. Energy Build. 2021, 238, 110815. [Google Scholar] [CrossRef]
  50. Lin, C.; Thomson, G.; Popescu, S.C. An IPCC-compliant technique for forest carbon stock assessment using airborne LiDAR-derived tree metrics and competition index. Remote Sens. 2016, 8, 528. [Google Scholar] [CrossRef]
  51. Fragner, B. Adaptive re-use. In Industrial Heritage Re-Tooled; Routledge: Abingdon, UK, 2016; pp. 110–117. [Google Scholar]
  52. Mo, C.; Wang, L.; Rao, F. Typology, preservation, and regeneration of the post-1949 industrial heritage in China: A case study of Shanghai. Land 2022, 11, 1527. [Google Scholar] [CrossRef]
  53. Baiocchi, G.; Creutzig, F.; Minx, J.; Pichler, P.P. A spatial typology of human settlements and their CO2 emissions in England. Glob. Environ. Change 2015, 34, 13–21. [Google Scholar] [CrossRef]
  54. Makido, Y.; Dhakal, S.; Yamagata, Y. Relationship between urban form and CO2 emissions: Evidence from fifty Japanese cities. Urban Clim. 2012, 2, 55–67. [Google Scholar] [CrossRef]
Figure 1. Energy consumption and carbon emission share of industrial heritage communities.
Buildings 13 02202 g001
Figure 2. Thermal design zoning of buildings in China.
Buildings 13 02202 g002
Figure 3. Schematic diagram of keyword search for related literature review.
Buildings 13 02202 g003
Figure 4. Distribution of industrial heritage communities.
Buildings 13 02202 g004
Figure 5. A framework for renovating and renewing industrial heritage communities based on carbon space networks.
Buildings 13 02202 g005
Figure 6. The specific process of analytic hierarchy process.
Buildings 13 02202 g006
Figure 7. Composition of industrial heritage community network.
Buildings 13 02202 g007
Figure 8. Carbon space network model of industrial heritage communities.
Buildings 13 02202 g008
Figure 9. Parameterization-based transformation process.
Buildings 13 02202 g009
Figure 10. Correlation analysis of each element.
Buildings 13 02202 g010
Figure 11. Correlation analysis of land use intensity and carbon emissions.
Buildings 13 02202 g011
Figure 12. Correlation analysis of community form and carbon emissions.
Buildings 13 02202 g012
Figure 13. Case scope and morphological zoning.
Buildings 13 02202 g013
Figure 14. Morphological subzone V-2 and its surrounding buildings.
Buildings 13 02202 g014
Figure 15. Direct sun hours (a) and indoor light environment (b).
Buildings 13 02202 g015
Figure 16. Energy and carbon emissions of research subjects.
Buildings 13 02202 g016
Figure 17. Outdoor thermal comfort labeling map of the study area.
Buildings 13 02202 g017
Figure 18. Comparison of the wind environment before and after the retrofitting.
Buildings 13 02202 g018
Table 1. Industrial heritage community value indicator system.
A-Level IndicatorsB-Level Indicators
Historical value A1Longevity B1
Historical events B2
Relationship with the development of industrial culture B3
Value of science and technology A2Industry pioneering B4
Engineering technology B5
Architectural artistic value A3Architectural engineering aesthetics B6
Industry style characteristics B7
Landscape integrity B8
Social and cultural value A4Social emotion B9
Industrial culture B10
Economic utilization value A5Structure utilization B11
Space utilization B12
Reasonableness of current use B13
Environmental location value A6Distance from other historic buildings B14
Degree of integration with the surrounding environment B15
Table 2. Schematic of the 1–9 level scale method.
ScaleMeaning
1m is as important as n
3m is slightly more important than n
5m is significantly more important than n
7m is strongly more important than n
9m is definitely more important than n
2,4,6,8Intermediate values in the judgment
Table 3. Composition of industrial heritage community network.
Composition of Industrial Heritage Community Network
Residential space networkBuildings 13 02202 i001Buildings 13 02202 i002
DwellingHotel
Traffic space networkBuildings 13 02202 i003Buildings 13 02202 i004
RoadwaySidewalk
Public space networkBuildings 13 02202 i005Buildings 13 02202 i006
Public buildingSquare
Greening space networkBuildings 13 02202 i007Buildings 13 02202 i008
ParkGreen space beside street
Factory space networkBuildings 13 02202 i009Buildings 13 02202 i010
WorkshopFactory Square
Table 4. Industrial heritage community A-level indicator judgment matrix expert statistics.
AssignA1A2A3A4A5A6
A11.0002.0832.1002.7003.9333.725
A20.4801.0001.0081.2961.8881.788
A30.4760.9921.0001.2861.8731.774
A40.3700.7710.7781.0001.4571.380
A50.2540.5290.5340.6861.0000.947
A60.2680.5590.5640.7251.0561.000
Table 5. Industrial heritage community value evaluation index weights.
A-level IndicatorsWeightsB-Level IndicatorsWeights
A10.396B1
B2
B3
0.108
0.142
0.146
A20.164B4
B5
0.113
0.051
A30.162B6
B7
0.122
0.040
A40.120B8
B9
B10
0.057
0.027
0.036
A50.076B11
B12
B13
0.042
0.020
0.014
A60.082B14
B15
0.060
0.022
Table 6. Greening conditions of the study area.
Vegetation ElementsTotal Shrub and Tree AreaGrassland AreaTotal
i-Tree: Ground trees: Vegetation > 1 m and 30 mm or above DBH 17400 --8500
Online Carbon Calculator: Height of shrubs/trees > 1 m, or <30 mm DBH--410410
Soil carbon 224,00062,00087,000
Subsurface carbon in the root mass of trees < 20 mm110--110
Total 96,000
Note 1: Some shrubs and trees contain ground cover; Note 2: The figures in columns 2 and 3 calculate soil carbon using Thomason’s (2011) [50] conversion factors of 6.93 kgC/m2 and 5.43 kgC/m2, respectively. All figures are rounded.
Table 7. Estimated carbon sink capacity according to the i-Tree model.
NumberCategoryExisting and Potential Carbon Stocks (kg)
1Existing carbon content of shrubs and trees, and all soil carbon including root biomass.102,680
2Above-ground carbon potential of 8728 square meters.2200
3Additional soil carbon from shrubs/trees in original grassland.14,290
4New root biomass carbon in new tree areas.2380
Realizable potential (2–4).38,670
Disclaimer/Publisher’s Note: The statements, opinions and data contained in all publications are solely those of the individual author(s) and contributor(s) and not of MDPI and/or the editor(s). MDPI and/or the editor(s) disclaim responsibility for any injury to people or property resulting from any ideas, methods, instructions or products referred to in the content.

