
Modeling of Safe Evacuation Conditions at the Construction Site for Building Type “I”
Abstract
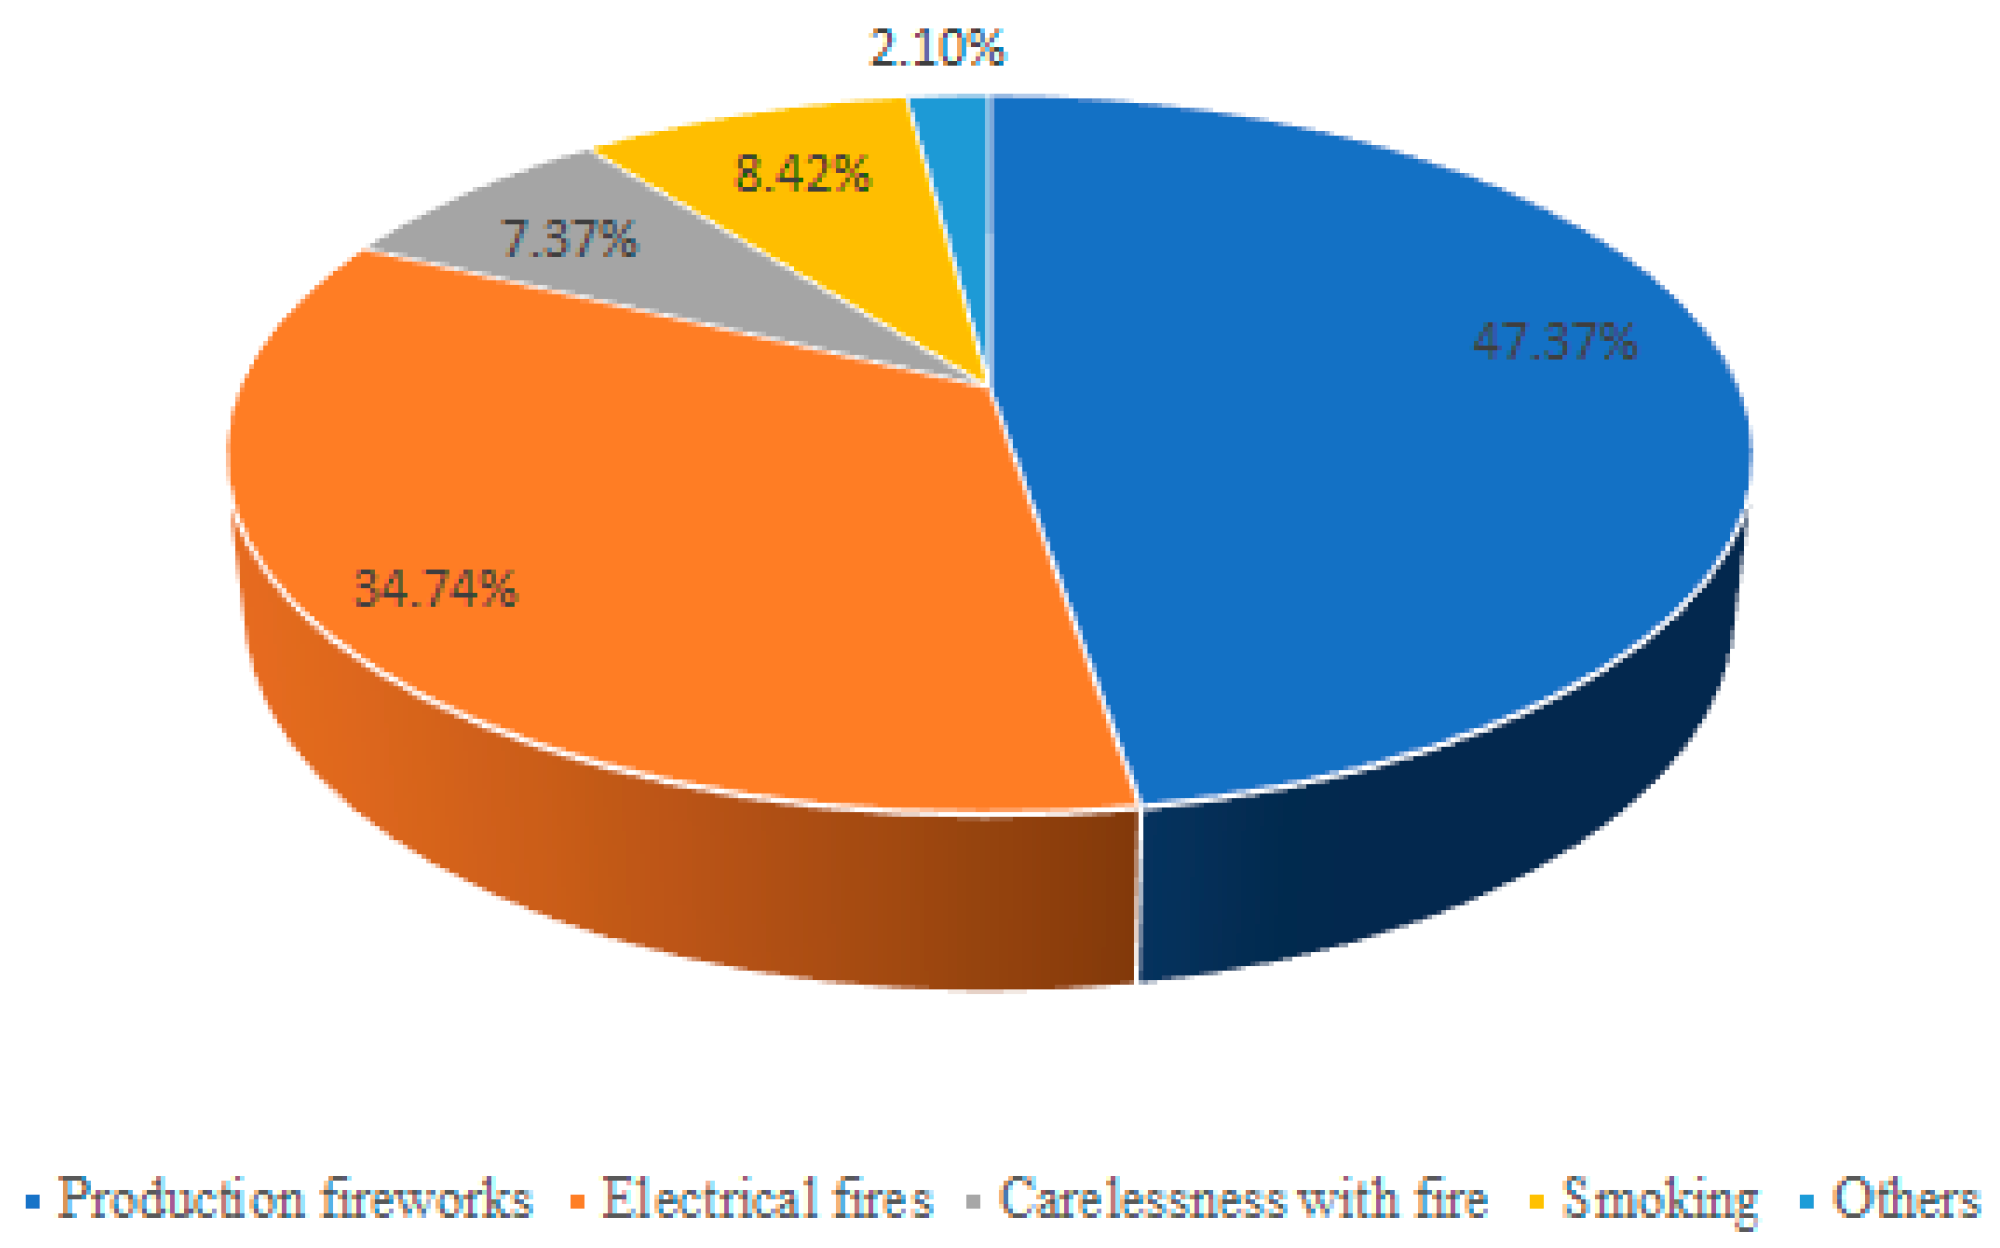
:1. Introduction
2. Fire Simulation Analysis
2.1. Building Overview
2.2. Fire Simulation Model Construction
2.2.1. PyroSim Model Building
2.2.2. Multiple Fire Scenario Design
2.3. Analysis of Fire Products
2.3.1. Temperature Simulation Analysis
2.3.2. Analysis of CO Concentrations
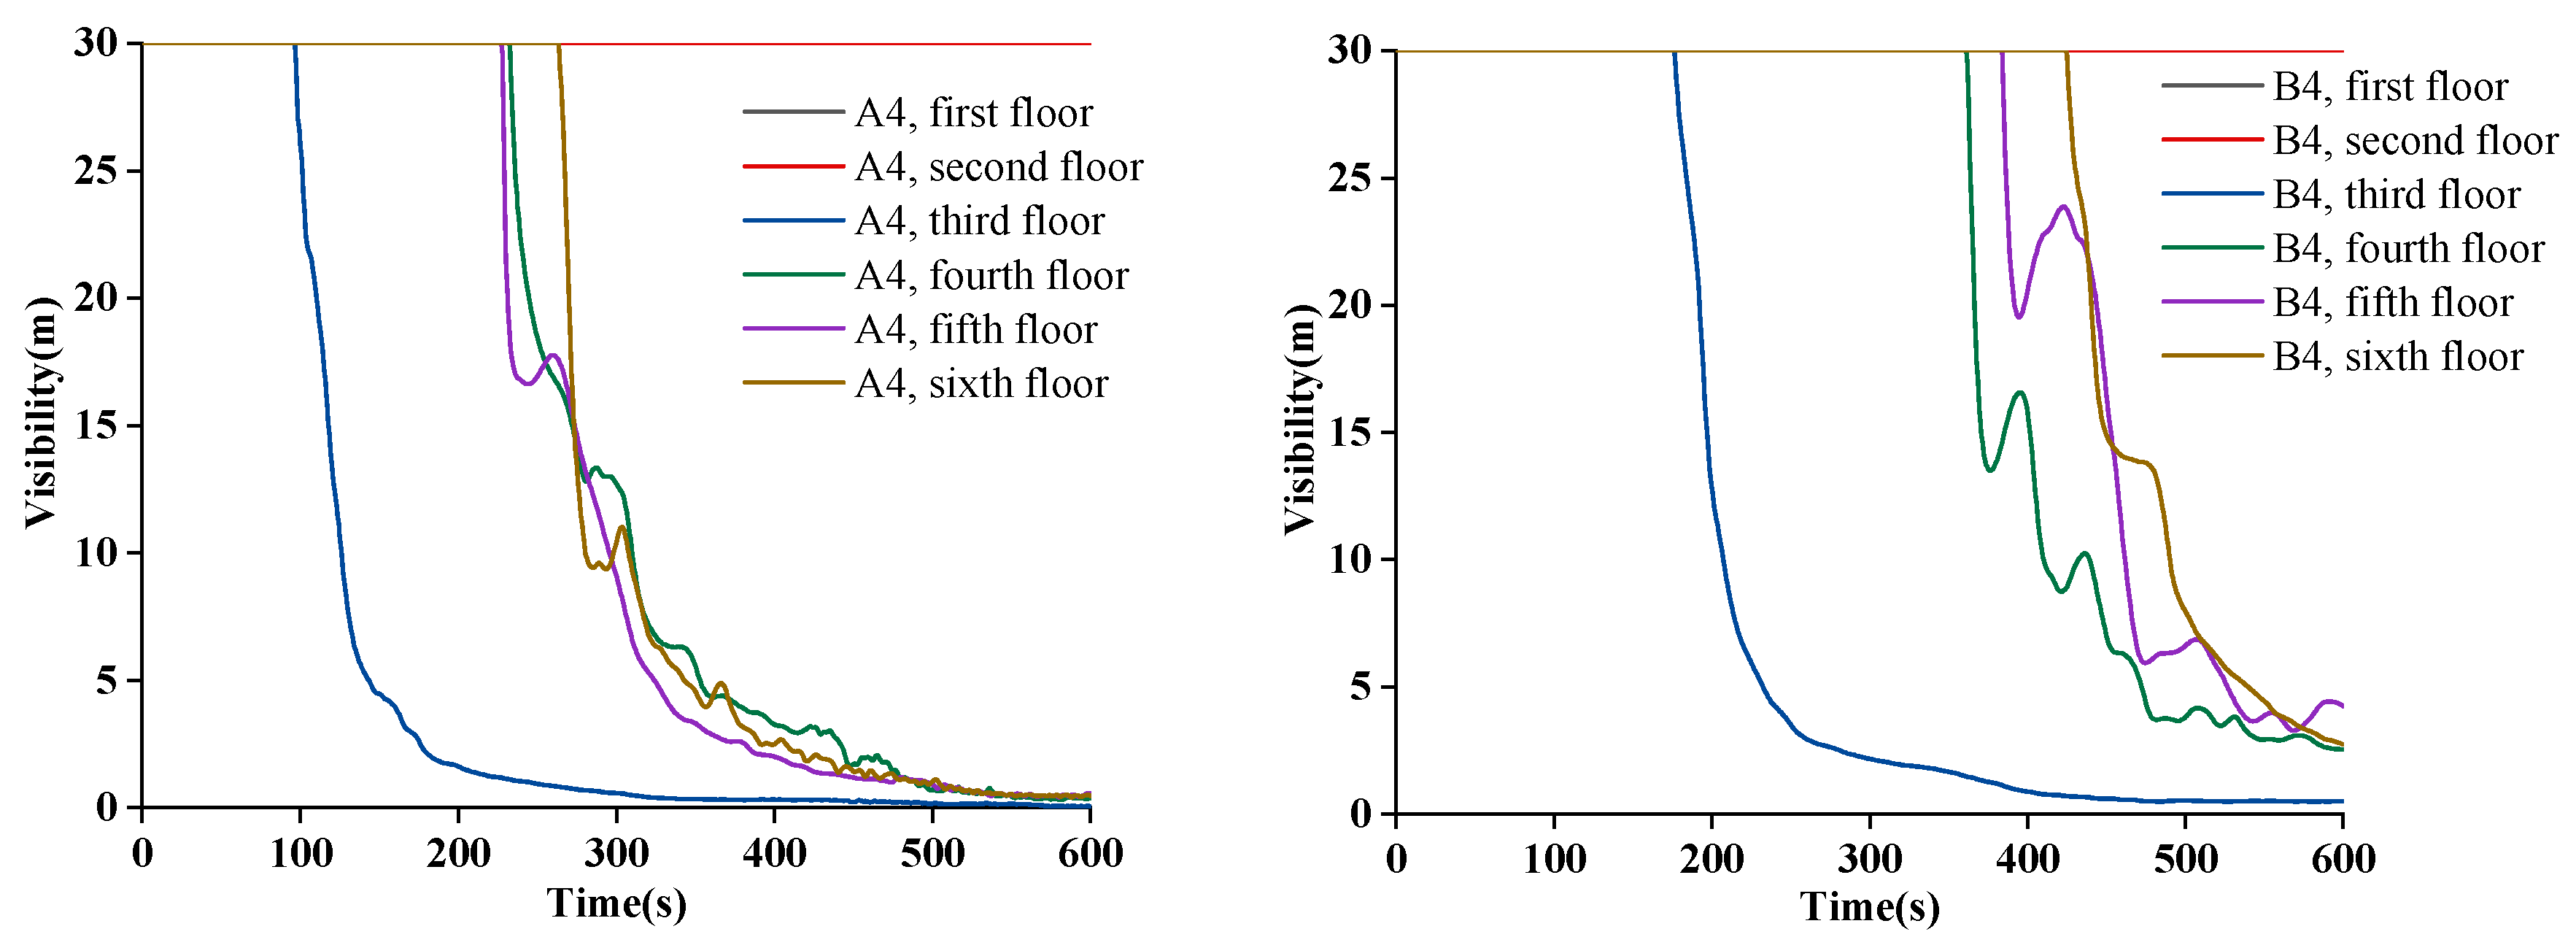
2.3.3. Visibility Analysis
3. Personnel Evacuation Simulation Analysis
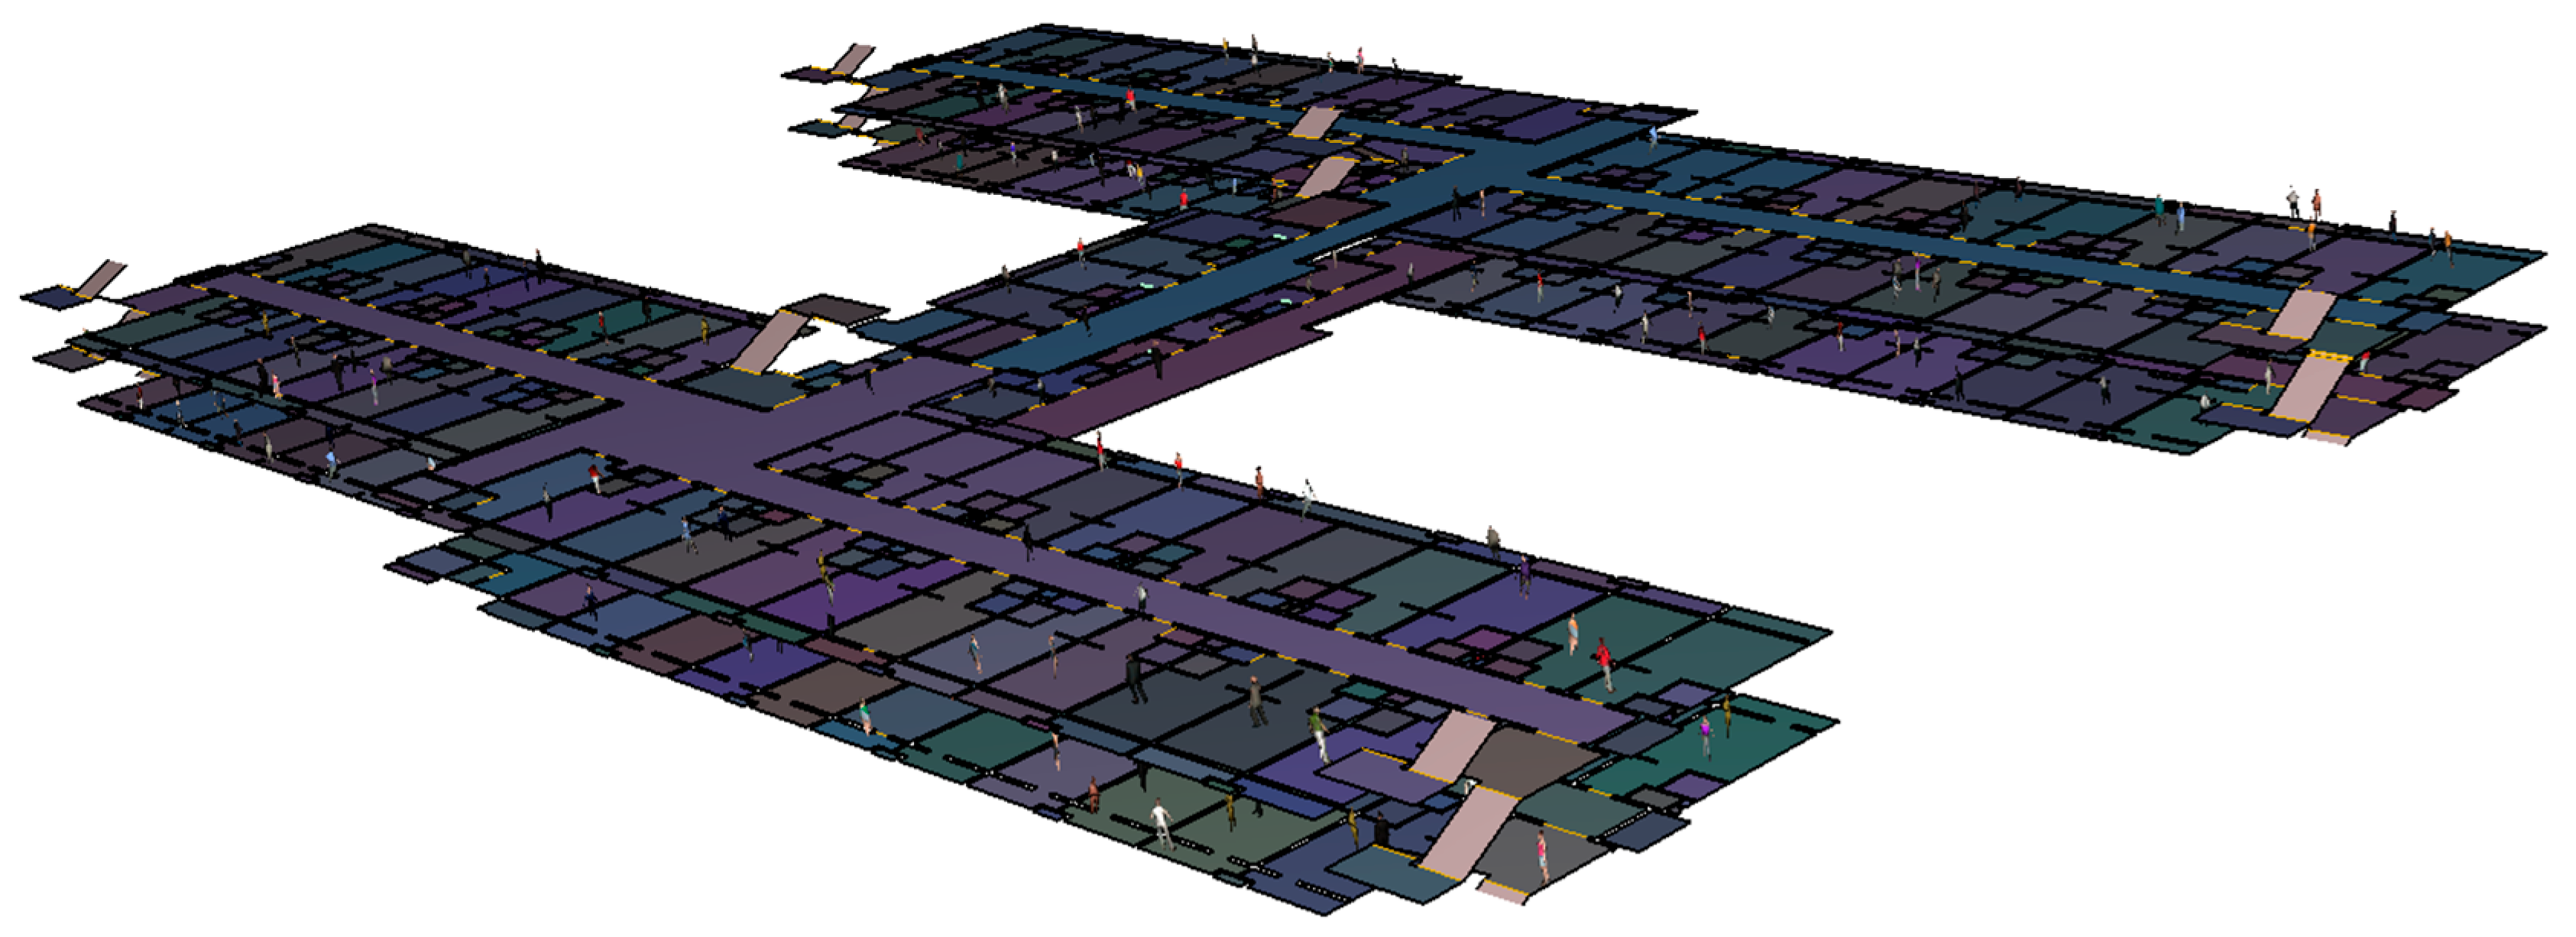
3.1. Personnel Evacuation Model Construction
3.2. Analysis of Evacuation Safety
4. Conclusions
- The peak temperature in Scenario 1 and the dispersion area for high CO concentrations are greater than in Scenario 3. Burning decorative materials in open spaces is a greater hazard than in small spaces, so avoid large accumulations of flammable materials in open spaces;
- During the simulation, the visibility and temperature-affected areas in Scenario 3 and Scenario 2 are roughly the same. Still, the CO output in Scenario 3 is much higher than that in Scenario 2, and too high a CO concentration will cause harm to the human body. Compared with the main construction stage, the decoration stage is more dangerous, so the management of the decoration stage should be strengthened;
- Through the coupling simulation test of fire and personnel evacuation, personnel behavior in the evacuation is analyzed, and the safety of Scenario 1 and Scenario 2 evacuation is insufficient. Optimize safety exit passage rates and reduce personnel on the construction site to 200. After optimization, the required safety evacuation time is 267 s, smaller than 314 s in Scenario 1, and 313 s in Scenario 2, and all Scenarios meet the safe evacuation standard;
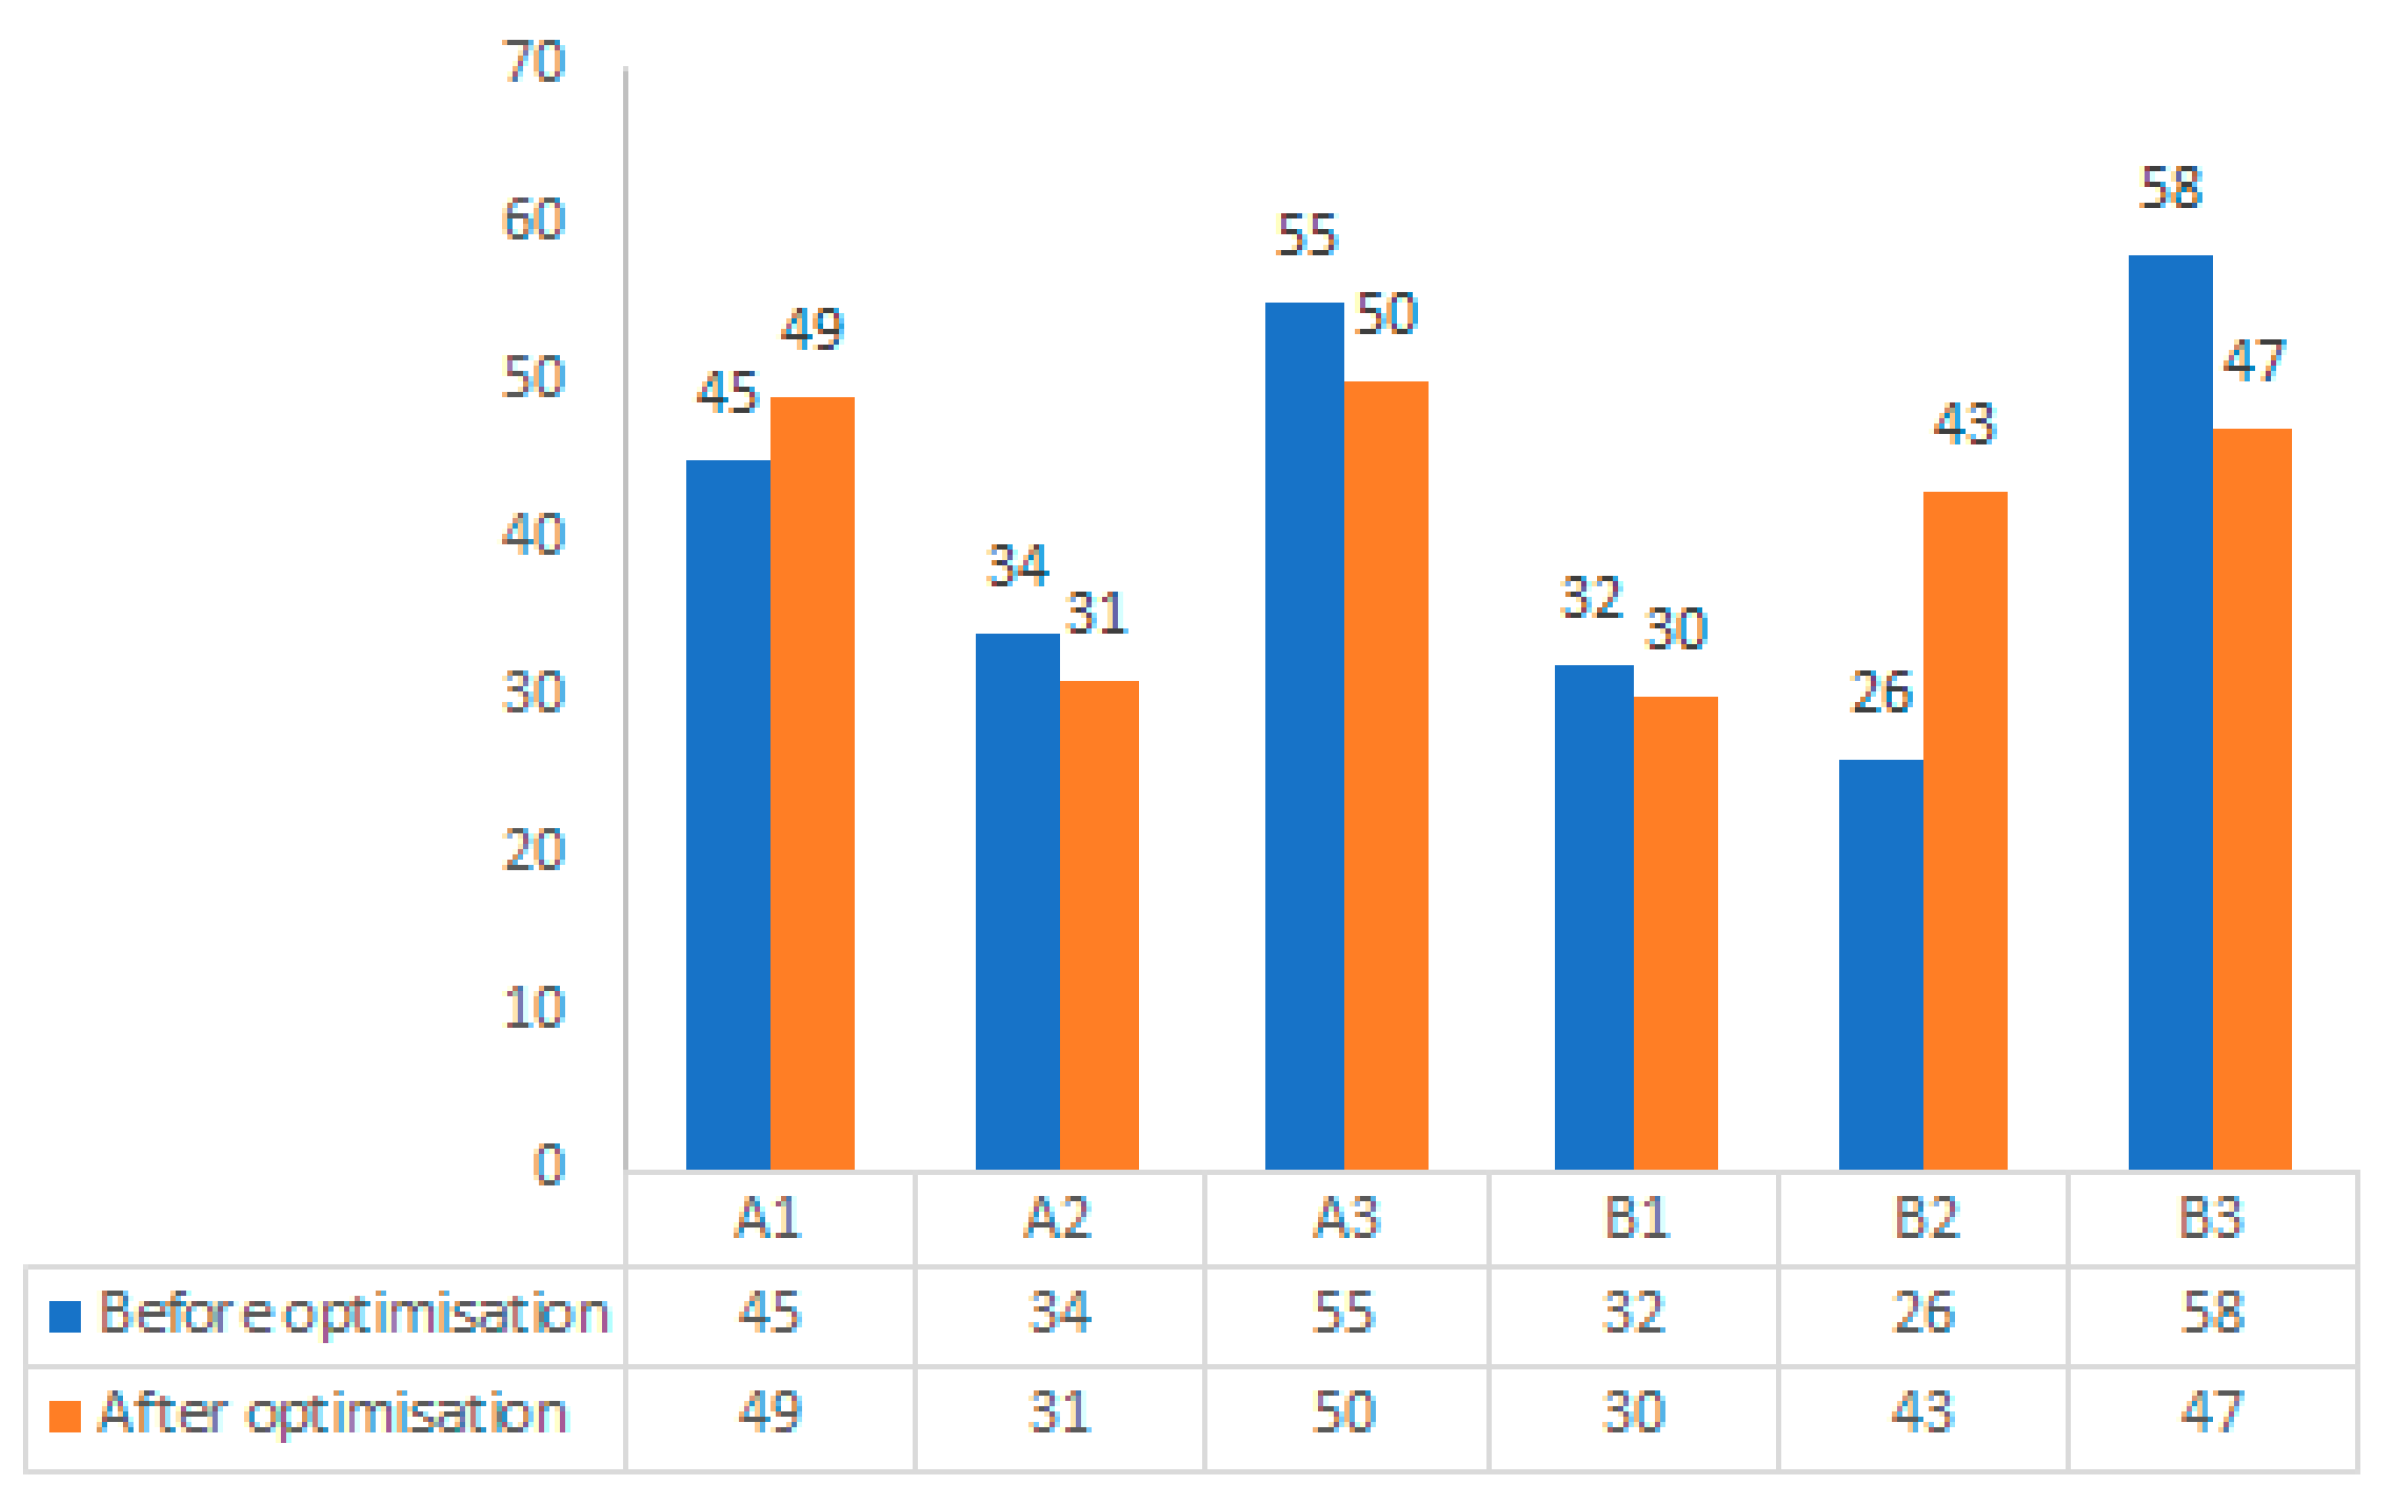
- Analysis of the evacuation paths of people before optimization shows that exits A3 and B3 are highly utilized, while exits A1, B1, A2, and B2 are less utilized. It is recommended to improve evacuation guidance factors and increase diversion management, for example, by adding clear signage and increasing the management of guides. There is a low evacuation speed for construction sites with complex traffic planes; Therefore, the construction company must not increase the number of laborers indefinitely to speed up the construction period. Construction workers may be unable to complete a safe evacuation within the required time if a hazard occurs. And in the construction site management, it is necessary to reasonably plan the stacking position of materials, equipment, and other items, reduce the load of the construction plane, and ensure the smooth evacuation stairs;
- In this paper, when studying the change law of the fire environment factors in the construction site, the “I” type buildings which are frequently used in China are selected. As China’s construction industry continues to grow, there will be many construction sites of different structural types. Therefore, the evacuation of people from different structure types of construction under different fire conditions can be further investigated, and this study can also serve as a basis for further research.
Author Contributions
Funding
Data Availability Statement
Conflicts of Interest
References
- China Construction Industry Association. Statistical analysis of construction industry development in 2022. J. Eng. Manag. 2023, 1, 1–6. [Google Scholar]
- Fire Bureau of the Ministry of Public Security. China Firefighting Yearbook; Yunnan Publishing House: Kunming, China, 2017.
- Wang, G. Exploration and Countermeasures of Intelligent Construction site and digital Construction based on the concept of green housing. Fresenius Environ. Bull. 2022, 3, 2527–2535. [Google Scholar]
- Yang, Y.; Sun, Y.; Chen, M.; Zhou, Y.; Wang, R.; Liu, Z. Platform Development of BIM-Based Fire Safety Management System Considering the Construction Site. Buildings 2022, 8, 1268. [Google Scholar] [CrossRef]
- Su, Y.; Mao, C.; Jiang, R.; Liu, G.; Wang, J. Data-Driven Fire Safety Management at Building Construction Sites: Leveraging CNN. J. Manag. Eng. 2021, 2, 04020108. [Google Scholar] [CrossRef]
- Liu, H.; Wang, Y.; Sun, S.; Sun, B. Study on Safety Assessment of Fire Hazard for the Construction Site. Procedia Eng. 2012, 43, 369–373. [Google Scholar]
- Marzouk, M.; Al Daour, I. Planning labor evacuation for construction sites using BIM and agent-based simulation. Saf. Sci. 2018, 109, 174–185. [Google Scholar] [CrossRef]
- Jae-Kwon, S.; Yoonseok, S. Development of Accident Cases-based Fire Risk Assessment Checklist for Active Response on Construction Sites. J. Korea Inst. Build. Constr. 2021, 1, 79–86. [Google Scholar]
- Li, W.; Li, H.; Liu, Y.; Wang, S.; Pei, X.; Li, Q. Fire risk assessment of high-rise buildings under construction based on unascertained measure theory. PLoS ONE 2020, 9, e0239166. [Google Scholar] [CrossRef]
- Xie, X. Development and application of fire risk assessment model for civil buildings under construction. Fire Sci. Technol. 2020, 8, 1100–1103. [Google Scholar]
- Wang, Z.; Zhu, Q.; Zhang, Z. Research on fire simulation and emergency evacuation simulation of a university office building. J. N. China Univ. Sci. Technol. 2020, 2, 109–118. [Google Scholar]
- Sujatmiko, W.; Dipojono, H.K.; Soelami, F.N. Performance-based fire safety evacuation in high-rise building flats in Indonesia—A case study in Bandung. Proc. Environ. Sci. 2014, 20, 116–125. [Google Scholar] [CrossRef]
- Ye, C.H.; Liu, Y.C.; Sun, C. Risk Assessment of Pedestrian Evacuation under the Influence of Fire Products. Discret. Dyn. Nat. Soc. 2020, 2020, 9540942. [Google Scholar] [CrossRef]
- Sun, C.; Liu, Y.; Wang, B.; Jiang, Y. Numerical simulation of fire spreading and evacuation in teaching building. J. Harbin Univ. Sci. Technol. 2018, 5, 106–112. [Google Scholar]
- Qin, J.; Liu, C.; Huang, Q. Simulation on Fire Emergency Evacuation in Special Subway Station Based on Pathfinder. Case Stud. Therm. Eng. 2020, 21, 100677. [Google Scholar] [CrossRef]
- Abadi, S.T.S.; Tokmehdash, N.M.; Hosny, A.; Nik-Bakht, M. BIM-Based Co-Simulation of Fire and Occupants’ Behavior for Safe Construction Rehabilitation Planning. Fire 2021, 4, 67. [Google Scholar] [CrossRef]
- Li, Q.; Li, S.C.; Wang, Z.H. Research on Smoke Exhaust Effect at Different Installation Height of Mechanical Exhaust Port in Ring Corridor of High-rise Building. Procedia Eng. 2016, 135, 324–335. [Google Scholar] [CrossRef]
- Xiao, M.; Zhou, X.; Bai, G.; Wang, J.; Pan, X. Research on safe emergency evacuation of prefabricated building construction based on Pathfinder. China Sci. Technol. Saf. Prod. 2021, 7, 124–129. [Google Scholar]
- Kirik, E.; Bogdanov, A.; Sushkova, O.; Gravit, M.; Shabunina, D.; Rozov, A.; Vitova, T.; Lazarev, Y. Fire Safety in Museums: Simulation of Fire Scenarios for Development of Control Evacuation Schemes from the Winter Palace of the Hermitage. Buildings 2022, 12, 1546. [Google Scholar] [CrossRef]
- Zou, X.; Samuhaer, B.; Hao, M.; Pang, Q. Personnel evacuation safety simulation analysis in university student dormitory fire based on PyroSim and Pathfinder. Saf. Environ. Eng. 2020, 4. [Google Scholar] [CrossRef]
- Andr, K.; Nilsson, D.; Eriksson, J. Evacuation experiments in a virtual reality high-rise building: Exit choice and waiting time for evacuation elevators. Fire Mater. 2015, 40, 554–567. [Google Scholar] [CrossRef]
- Soltanzadeh, A.; Alaghmandan, M.; Soltanzadeh, H. Performance evaluation of refuge floors in combination with egress components in high-rise buildings. J. Build. Eng. 2018, 19, 519–529. [Google Scholar] [CrossRef]
- Chen, J.; Wang, J.Y.; Wang, B.B.; Liu, R.; Wang, Q.S. An experimental study of visibility effect on evacuation speed on stairs. Fire Saf. J. 2018, 96, 189–202. [Google Scholar] [CrossRef]
- Deere, S.; Xie, H.; Galea, E.R.; Cooney, D.; Lawrence, P.J. An evacuation model validation data-set for high-rise construction sites. Fire Saf. J. 2021, 120, 103118. [Google Scholar] [CrossRef]
- Abir, I.M.; Ibrahim, A.M.; Toha, S.F.; Shafie, A.A. A review on the hospital evacuation simulation models. Int. J. Disaster Risk Reduct. 2022, 77, 103083. [Google Scholar] [CrossRef]
- Ahn, C.; Kim, H.; Choi, I.; Rie, D. A Study on the Safety Evaluation of Escape Routes for Vulnerable Populations in Residential Facilities. Sustainability 2022, 14, 5998. [Google Scholar] [CrossRef]
- Choi, S.-H.; Darkhanbat, K.; Heo, I.; Jeong, H.; Kim, K.S. Egress Safety Criteria for Nursing Hospitals. Buildings 2022, 12, 409. [Google Scholar] [CrossRef]
- Choi, S.-H.; Darkhanbat, K.; Heo, I.; Kim, K.S. Evaluation on Egress Safety of Nursing Hospital Considering the Smoke Exhaust System. Fire 2022, 5, 120. [Google Scholar] [CrossRef]
- Huang, Y.-H. Using Fire Dynamics Simulator to reconstruct a fire scene in a hospital-based long-term care facility. J. Loss Prev. Process Ind. 2022, 80, 104863. [Google Scholar] [CrossRef]
- Cuesta, A.; Gwynne, S.M.V. The collection and compilation of school evacuation data for model use. Saf. Sci. 2016, 84, 24–36. [Google Scholar] [CrossRef]
- Wong, L.T.; Cheung, T.F. Evaluating probable risk of evacuees in institutional buildings. Saf. Sci. 2006, 44, 169–181. [Google Scholar] [CrossRef]
- Capote, J.A.; Alvear, D.; Abreu, O.V.; Lazaro, M.; Espina, P. Scale Tests of Smoke Filling in Large Atria. Fire Technol. 2009, 45, 201–220. [Google Scholar] [CrossRef]
- Wang, N.; Gao, Y.; Li, C.-Y.; Gai, W.-M. Integrated agent-based simulation and evacuation risk-assessment model for underground building fire: A case study. J. Build. Eng. 2021, 40, 102609. [Google Scholar] [CrossRef]
- Kang, J.-G.; Seo, J.; Yang, J.-H. Research on the Enhancement of Escape Safety of Small Nursing Homes. J. Asian Archit. Build. Eng. 2011, 10, 271–278. [Google Scholar] [CrossRef]
- Lim, H.; Lee, H.; Hwang, J.-H. Multi-Agent Simulation on Staff Evacuation Behavior in Elderly Nursing Home Fire Emergencies. Buildings 2023, 13, 400. [Google Scholar] [CrossRef]
- Lee, E. Fire Performance Design for Buildings; Chemical Industry Press: Beijing, China, 2005. [Google Scholar]
- Yang, X. Research on the Smoke Spread Law of High-Rise Building Fires; North Central University: Taiyuan, China, 2015. [Google Scholar]
- Liu, F.; Liao, S. Fire Performance Design of Buildings; Chongqing University Press: Chongqing, China, 2006; pp. 94–95. [Google Scholar]
- Chen, Z. Study on the Law of Smoke Spread and Personnel Evacuation in the Fire of Super High-Rise Buildings under Construction; Xi’an University of Architecture and Technology: Xi’an, China, 2020. [Google Scholar]
- Liu, Q.; Zhao, D.; Yang, H.; Sun, K.; Zeng, M.; Yang, L. Research on emergency evacuation of workshop based on PyroSim and Pathfinder. Fire Sci. Technol. 2020, 39, 927–930. [Google Scholar]
- Shi, C.L.; Zhong, M.H.; He, L.; Fu, T.R.; Tu, X.W. Train Fire Smoke Control in Deep Buried Island Metro Station. In The 2008 International Symposium on Safety Science and Technology; Science Press Beijing: Beijing, China, 2008; pp. 844–850. [Google Scholar]
- GB 51251-2017; Technical Standard for Building Smoke Prevention and Exhaust System. China Planning Press: Beijing, China, 2017.
- Mcgrattan, K.; Hostikka, S.; Mcdermott, R.; Floyd, J.; Weinschenk, C.; Overholt, K. Fire Dynamics Simulator User’s Guide; National Institute of Standards and Technology: Gaithersburg, MD, USA, 2018. [Google Scholar]
- Yu, H.; Wang, Y.; Qiu, P.; Chen, J. Study on the Feasibility of Downward Evacuation in a Metro Station when the Station Hall Catch Fire. Int. J. Intell. Transp. Syst. Res. 2019, 18, 195–203. [Google Scholar] [CrossRef]
- Zhao, P.; Chen, Z.; Yang, Y. Numerical simulation analysis of fire in constructed high-rise under construction. Fire Sci. Technol. 2018, 37, 1638–1641. [Google Scholar]
- Yang, Y.; Zhao, P. Numerical simulation of fire flashover in building under-construction. J. Civ. Environ. Eng. 2019, 41, 159–166. [Google Scholar]
- Wei, J. Numerical Simulation Analysis of Fire in Multi-Storey Buildings under Construction; Xi’an University of Architecture and Technology: Xi’an, China, 2017. [Google Scholar]
- Hurley, M.J.; Gottuk, D.T.; Hall, J.R., Jr.; Harada, K.; Kuligowski, E.D.; Puchovsky, M.; Watts, J.M., Jr.; Wieczorek, C.J. (Eds.) SFPE Handbook of Fire Protection Engineering; Springer: Berlin/Heidelberg, Germany, 2015. [Google Scholar]
- Purser, D.A. ASET And RSET: Addressing Some Issues in Relation to Occupant Behaviour and Tenability. Fire Saf. Sci. 2003, 7, 91–102. [Google Scholar] [CrossRef]
- Xiao, M.; Zhou, X.; Pan, X.; Wang, Y.; Wang, J.; Li, X.; Sun, Y.; Wang, Y. Simulation of emergency evacuation from construction site of prefabricated buildings. Sci. Rep. 2022, 12, 2732. [Google Scholar] [CrossRef]


| Ambient Temperature/°C | Humidity | Time of Human Endurance/min |
|---|---|---|
| <60 | Well-hydrated | >30 |
| 60 | Moisture content < 1% | 12 |
| 100 | Moisture content < 1% | 1 |
| Degree of Hazard | |
|---|---|
| 0.01 | Little effect on the human body for a few hours |
| 0.05 | Little impact on the human body within one h |
| 0.1 | Headache, discomfort, and vomiting after one h |
| 0.5 | Causes severe headache, life-threatening after about 20–30 min |
| 1.0 | Loss of consciousness after several breaths, possible death after 1–2 min |
| Human Tolerance Limit Factors | Hazard Threshold |
|---|---|
| CO concentration (%) | 0.04 |
| Temperature (°C) | 60 |
| Visibility (m) | 10 |
| Fire Scenario | Construction Stage | Location of Combustibles | Name of Fire Source Location and Type of Combustible Material | Fire Source Parameters |
|---|---|---|---|---|
| 1 | Decoration stage | Fire point No. 1 | Open area on the third floor connecting corridor Combustibles: Thermal insulation decoration materials | |
| 2 | Main structure phase | Fire point No. 2 | Inside the third-floor room of connecting corridor Combustibles: formwork (wood) | |
| 3 | Decoration stage | Fire point No.2 | In a room on the side of the third floor connecting corridor, Combustibles: Thermal insulation decoration materials |
| Personnel Category | Young Men | Young Women | Middle-Aged Men | Middle-Aged Women |
|---|---|---|---|---|
| Shoulder width (mm) | 41 | 38 | 41.9 | 39.5 |
| Height (mm) | 169.7 | 158.0 | 167.1 | 155.8 |
| Plane speed (m/s) | 1.95 | 1.79 | 1.84 | 1.68 |
| Stair surface speed (m/s) | 1.25 | 1.09 | 1.19 | 1.03 |
| Proportion (%) | 29.5 | 18.5 | 40.7 | 11.3 |
| Scenarios | Region | ASET/s | RSET/s | Security |
|---|---|---|---|---|
| One | A | 314 | 318.5 | Unsafe |
| B | - | 318.5 | Safe | |
| Two | A | 474 | 318.5 | Safe |
| B | 313 | 318.5 | Unsafe | |
| Three | A | 400 | 318.5 | Safe |
| B | 335 | 318.5 | Safe |
Disclaimer/Publisher’s Note: The statements, opinions and data contained in all publications are solely those of the individual author(s) and contributor(s) and not of MDPI and/or the editor(s). MDPI and/or the editor(s) disclaim responsibility for any injury to people or property resulting from any ideas, methods, instructions or products referred to in the content. |
© 2023 by the authors. Licensee MDPI, Basel, Switzerland. This article is an open access article distributed under the terms and conditions of the Creative Commons Attribution (CC BY) license (https://creativecommons.org/licenses/by/4.0/).
Share and Cite
Lei, M.; Zhang, W.; Zhang, J.; Wang, D.; Yang, M.; Li, X. Modeling of Safe Evacuation Conditions at the Construction Site for Building Type “I”. Buildings 2023, 13, 2121. https://doi.org/10.3390/buildings13082121
Lei M, Zhang W, Zhang J, Wang D, Yang M, Li X. Modeling of Safe Evacuation Conditions at the Construction Site for Building Type “I”. Buildings. 2023; 13(8):2121. https://doi.org/10.3390/buildings13082121
Chicago/Turabian StyleLei, Ming, Wei Zhang, Jicheng Zhang, Dandan Wang, Min Yang, and Xinhua Li. 2023. "Modeling of Safe Evacuation Conditions at the Construction Site for Building Type “I”" Buildings 13, no. 8: 2121. https://doi.org/10.3390/buildings13082121