
Optimal Sizing and Management of Hybrid Renewable Energy System for DC-Powered Commercial Building

 and
and
Abstract
:1. Introduction
- ✓
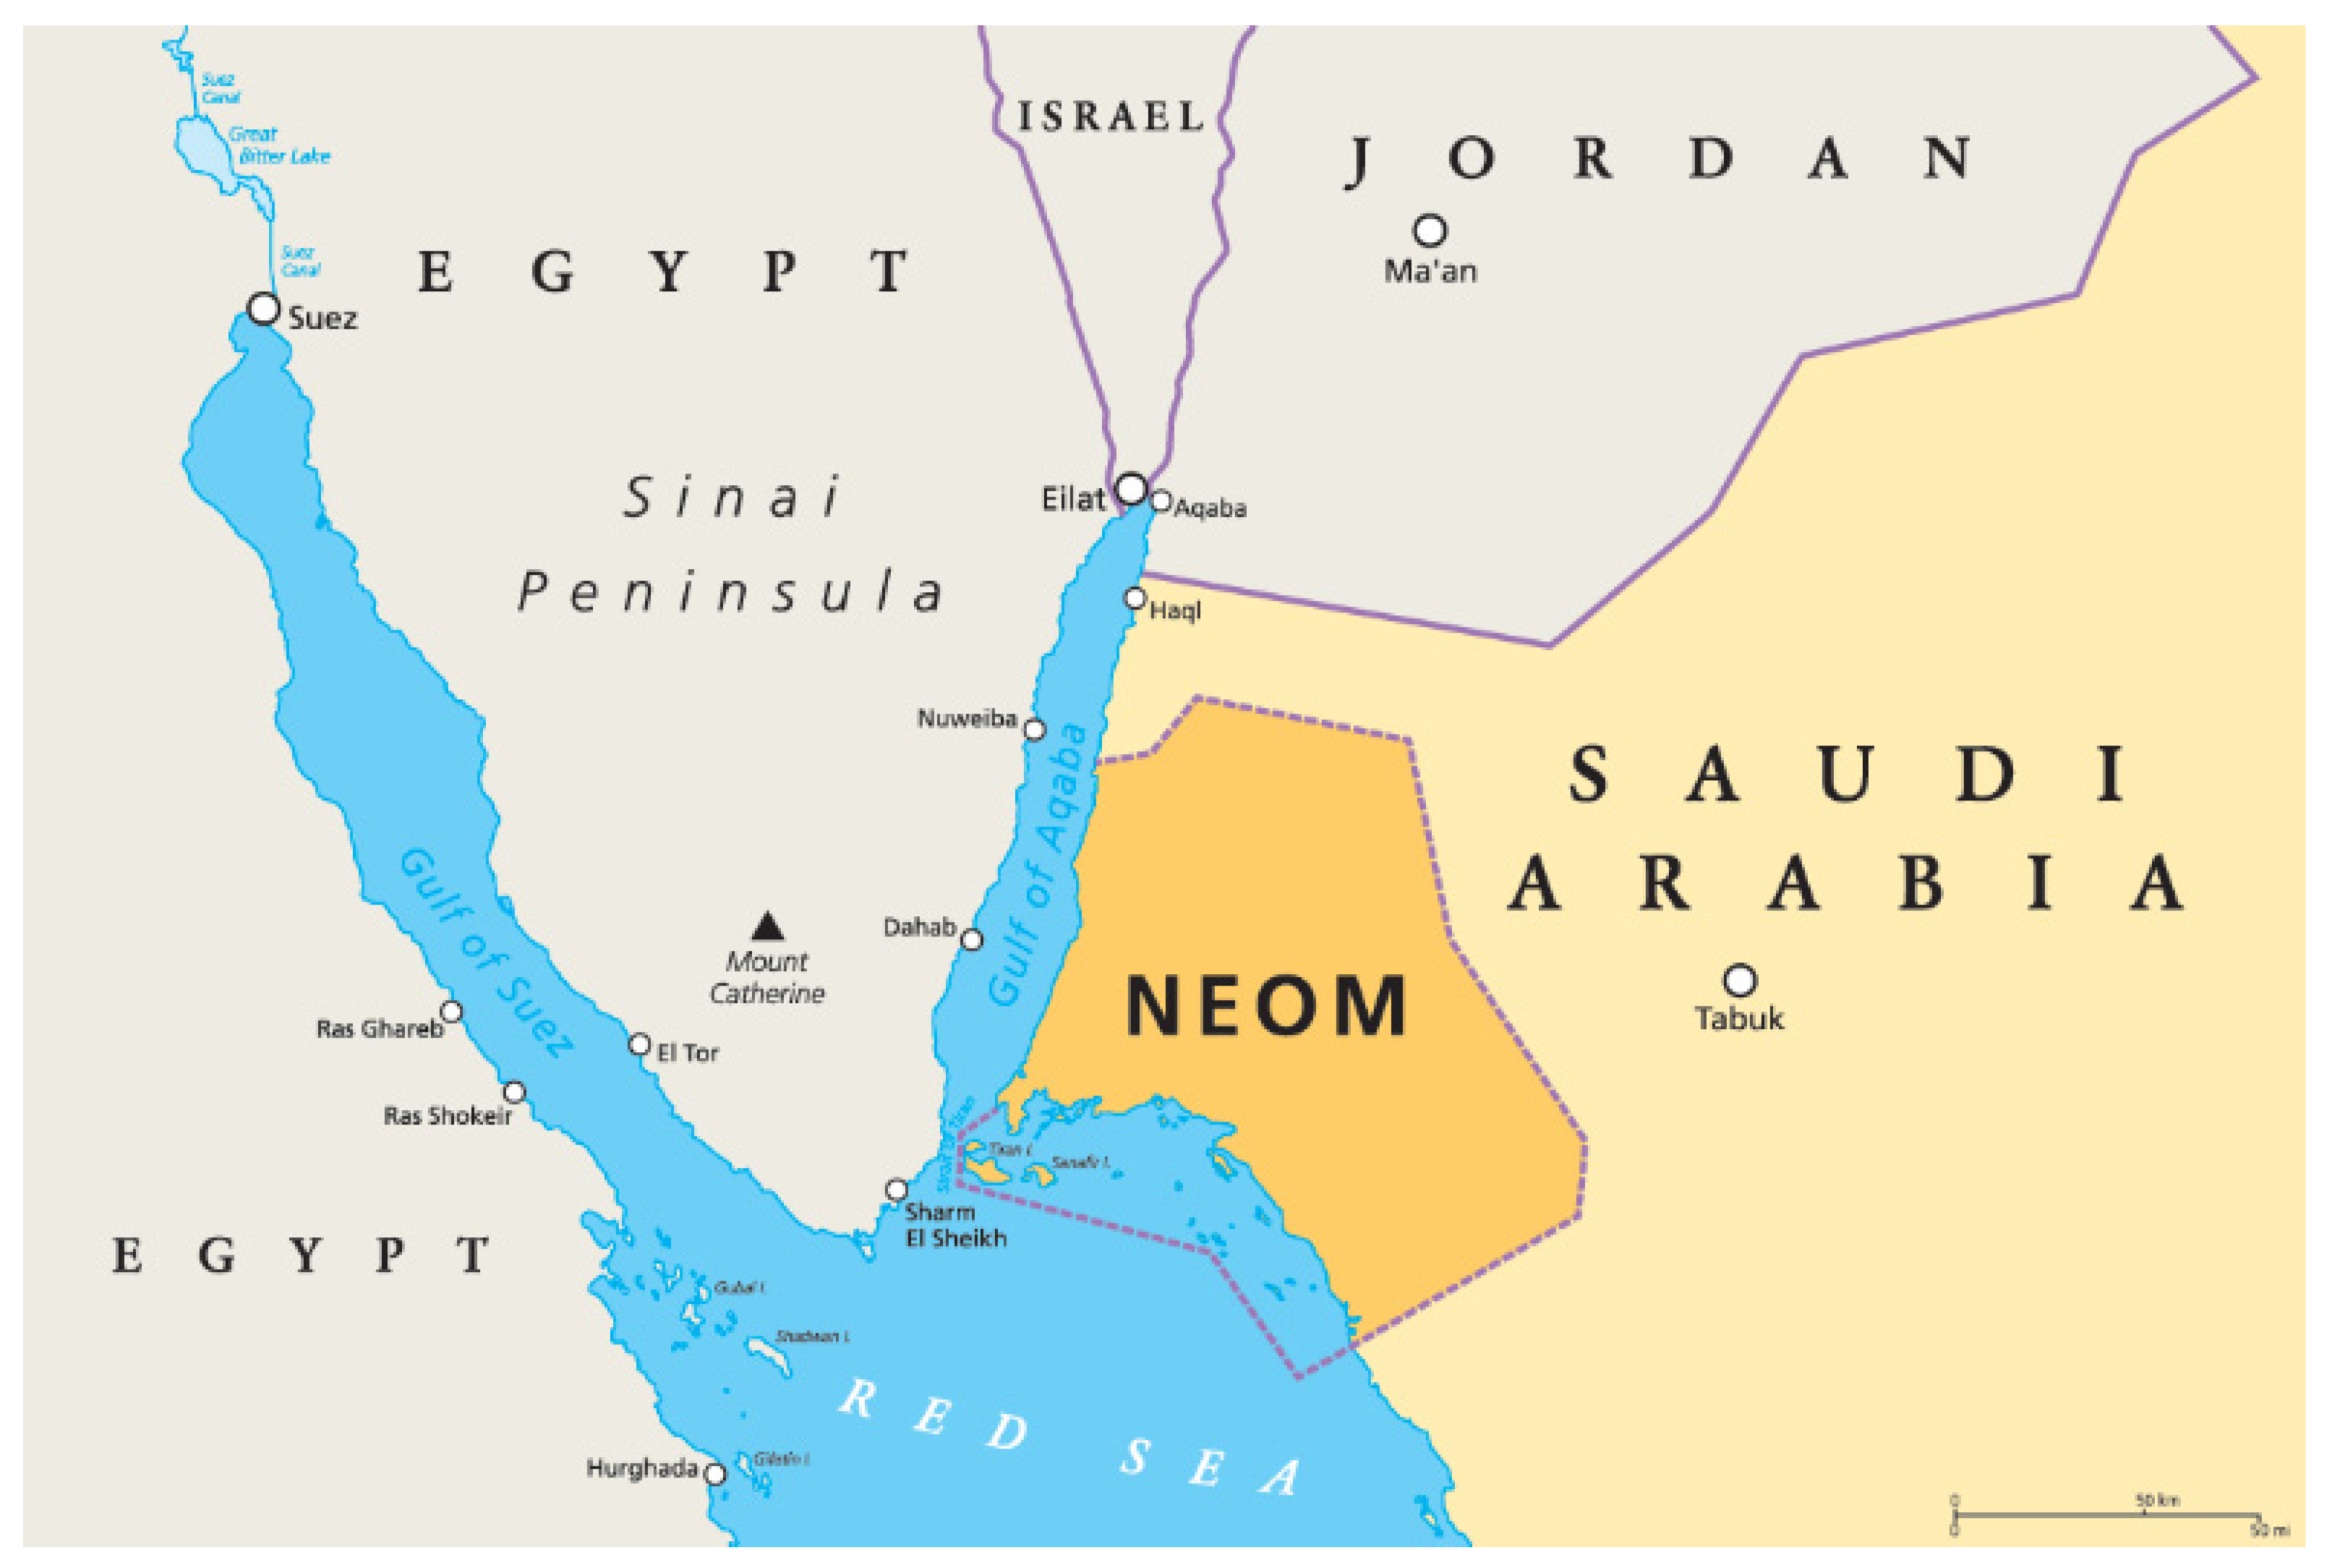
- The optimal design and size of the PV/PEMFC system to provide DC power to a specific commercial load in NEOM city is proposed;
- ✓
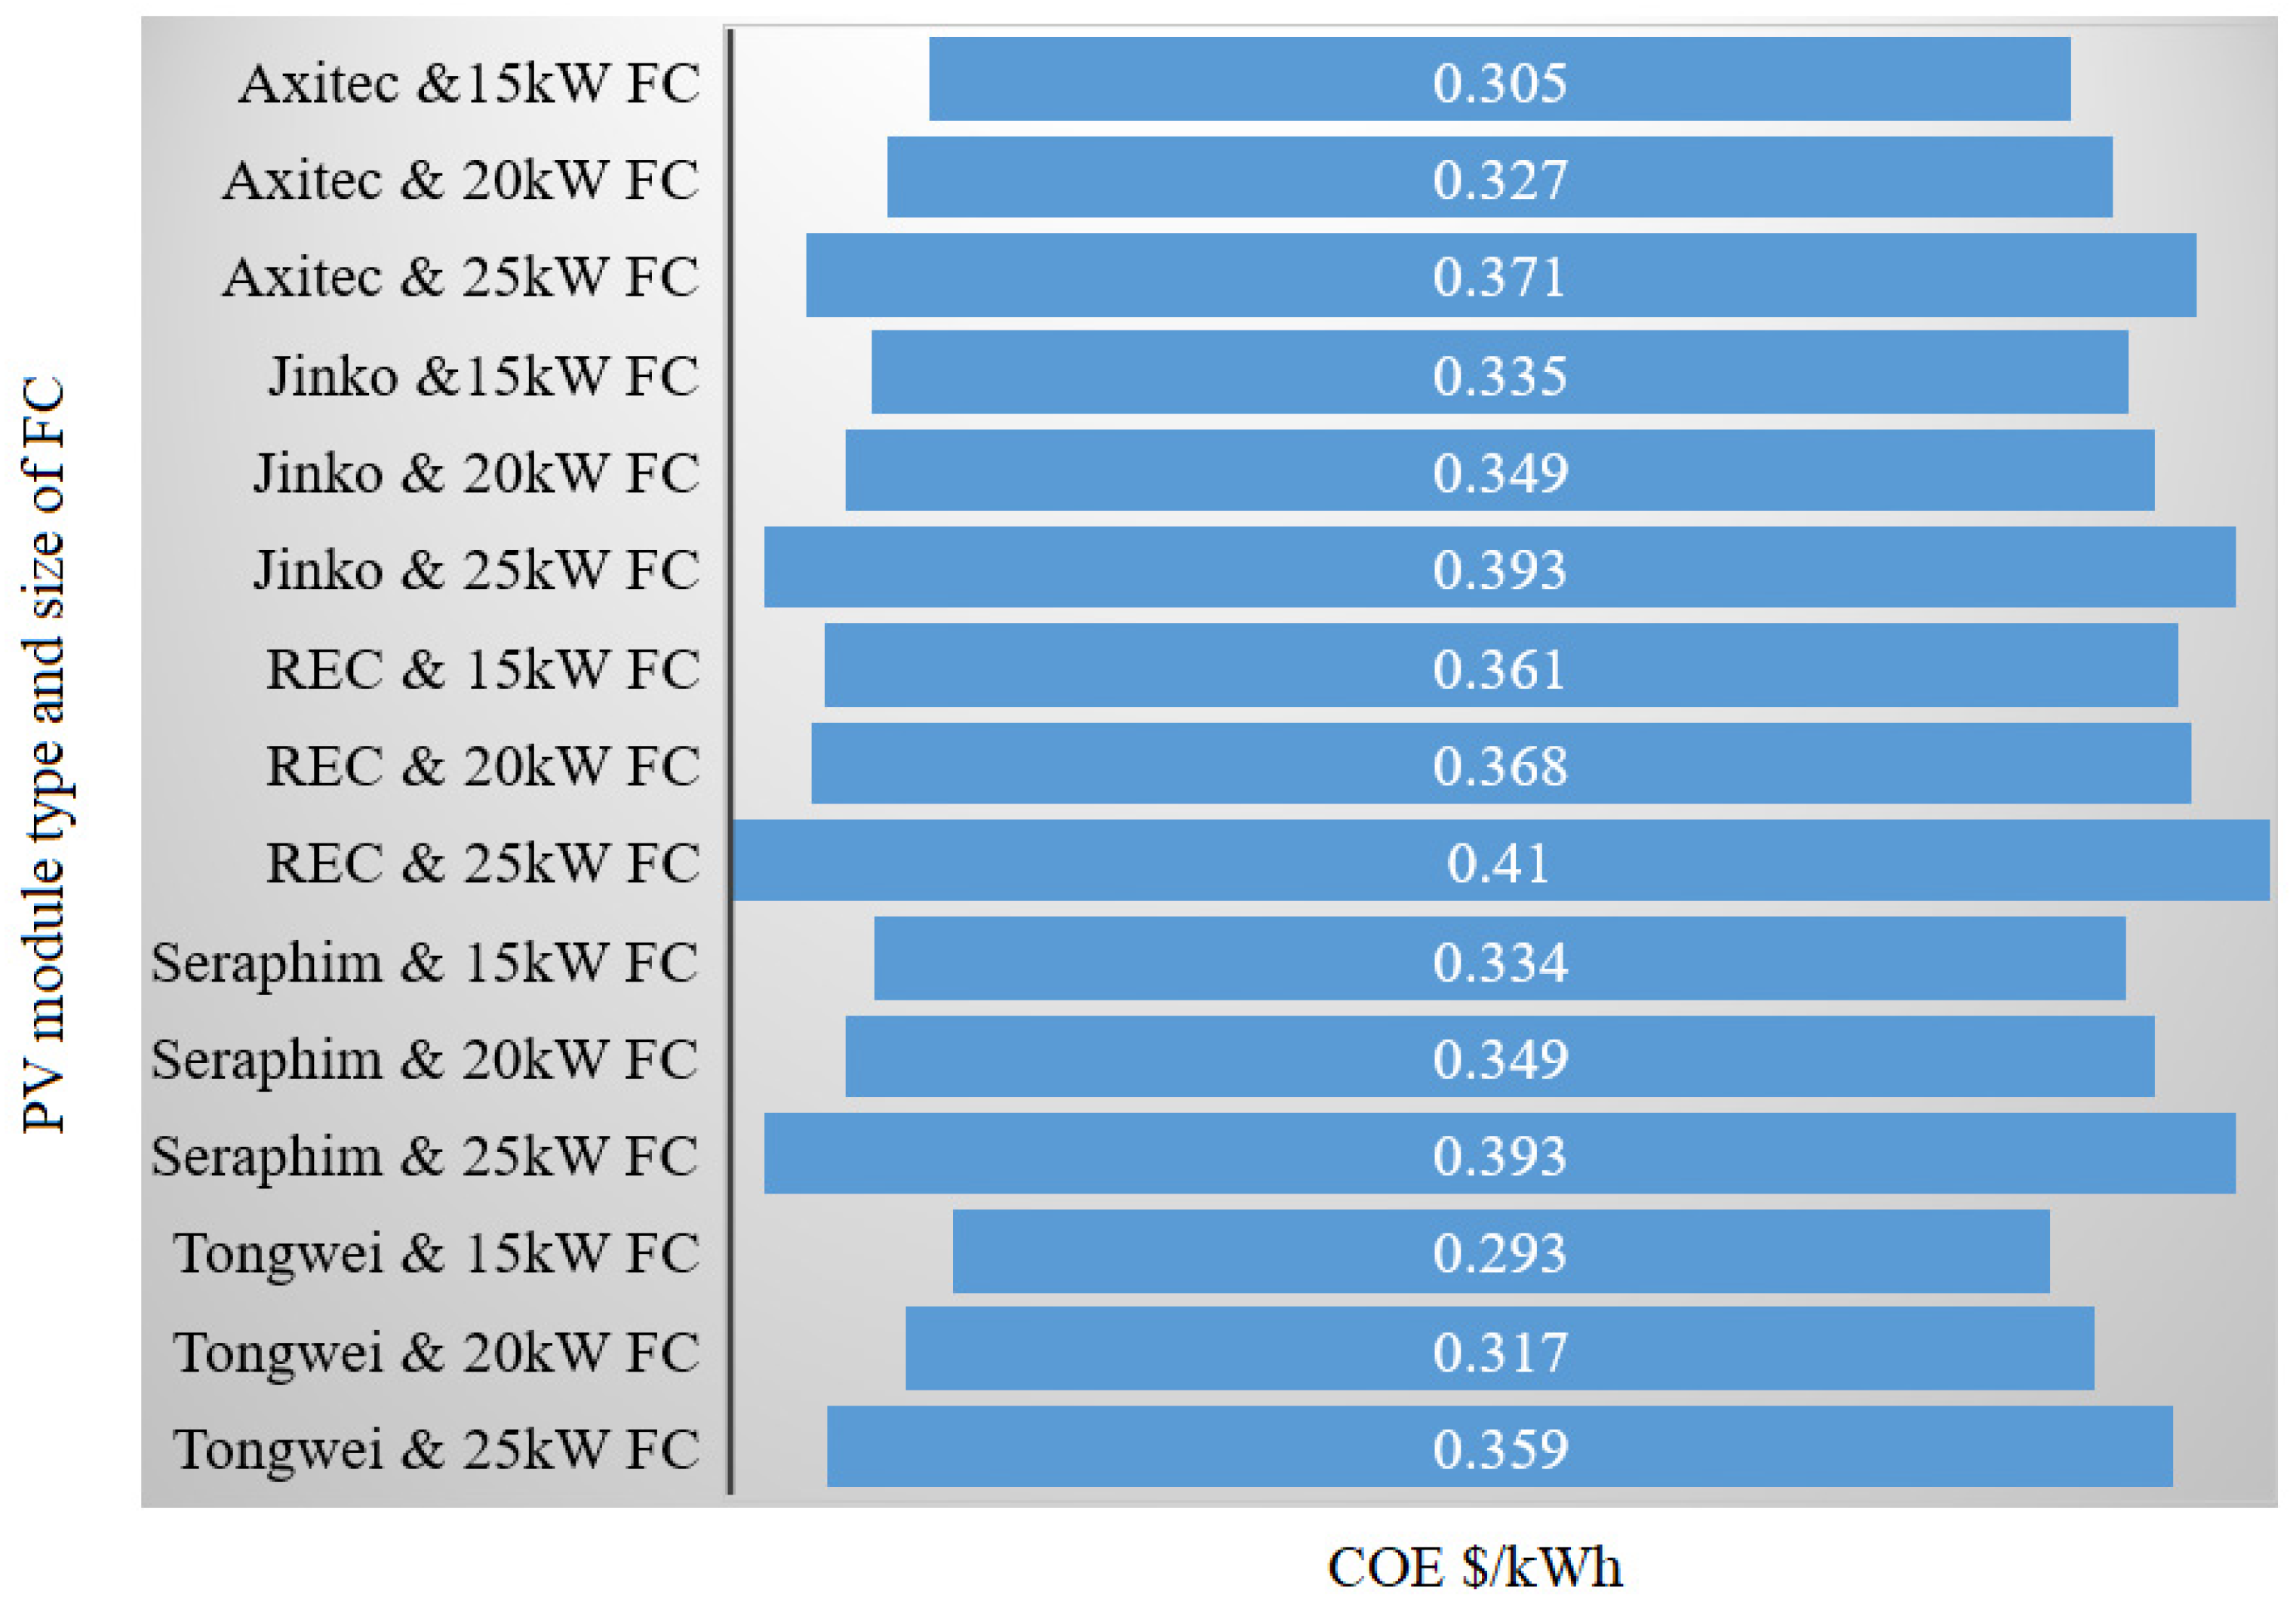
- Different types of PV modules are considered to reduce the COE;
- ✓
- Techno-economy and feasibility study of the proposed system is presented.
2. Location and Load Profile
3. System Description
3.1. Photovoltaic System
- ▪
- is the rated capacity of the PV array;
- ▪
- R is solar irradiance, Tc is the temperature of solar cells, and Tstc is the reference temperature;
- ▪
- fpv is the derating factor.
3.2. PEM Fuel Cell
3.3. Electrolyze
- Anode reaction
- Cathode reaction
3.4. Hydrogen Tank
4. Evaluation Criterion
5. Results and Discussion
6. Conclusions
Author Contributions
Funding
Data Availability Statement
Acknowledgments
Conflicts of Interest
References
- Jaysawal, R.K.; Chakraborty, S.; Elangovan, D.; Padmanaban, S. Concept of net zero energy buildings (NZEB)—A literature review. Clean. Eng. Technol. 2022, 11, 100582. [Google Scholar] [CrossRef]
- Oh, J.; Hong, T.; Kim, H.; An, J.; Jeong, K.; Koo, C. Advanced Strategies for Net-Zero Energy Building: Focused on the Early Phase and Usage Phase of a Building’s Life Cycle. Sustainability 2017, 9, 2272. [Google Scholar] [CrossRef]
- Wilberforce, T.; Olabi, A.G.; Sayed, E.T.; Elsaid, K.; Maghrabie, H.M.; Abdelkareem, M.A. A review on zero energy buildings—Pros and cons. Energy Built Environ. 2023, 4, 25–38. [Google Scholar] [CrossRef]
- Tirelli, D.; Besana, D. Moving toward Net Zero Carbon Buildings to Face Global Warming: A Narrative Review. Buildings 2023, 13, 684. [Google Scholar] [CrossRef]
- Ismaeil, E.M.H.; Sobaih, A.E.E. Heuristic Approach for Net-Zero Energy Residential Buildings in Arid Region Using Dual Renewable Energy Sources. Buildings 2023, 13, 796. [Google Scholar] [CrossRef]
- Debrah, C.; Chan, A.P.C.; Darko, A. Artificial intelligence in green building. Autom. Constr. 2022, 137, 104192. [Google Scholar] [CrossRef]
- Vijayan, D.S.; Mohan, A.; Revathy, J.; Parthiban, D.; Varatharajan, R. Evaluation of the impact of thermal performance on various building bricks and blocks: A review. Environ. Technol. Innov. 2021, 23, 101577. [Google Scholar] [CrossRef]
- Basher, M.K.; Nur-E-Alam, M.; Rahman, M.M.; Alameh, K.; Hinckley, S. Aesthetically Appealing Building Integrated Photovoltaic Systems for Net-Zero Energy Buildings. Current Status, Challenges, and Future Developments—A Review. Buildings 2023, 13, 863. [Google Scholar] [CrossRef]
- Dagdougui, H.; Minciardi, R.; Ouammi, A.; Robba, M.; Sacile, R. Modeling and optimization of a hybrid system for the energy supply of a “Green” building. Energy Convers. Manag. 2012, 64, 351–363. [Google Scholar] [CrossRef]
- Chadly, A.; Rajeevkumar Urs, R.; Wei, M.; Maalouf, M.; Mayyas, A. Techno-economic assessment of energy storage systems in green buildings while considering demand uncertainty. Energy Build. 2023, 291, 113130. [Google Scholar] [CrossRef]
- Wang, S. Making buildings smarter, grid-friendly, and responsive to smart grids. Sci. Technol. Built Environ. 2016, 22, 629–632. [Google Scholar] [CrossRef]
- Woo, J.-H.; Menassa, C. Virtual Retrofit Model for aging commercial buildings in a smart grid environment. Energy Build. 2014, 80, 424–435. [Google Scholar] [CrossRef]
- Jakub, S.; Adrian, L.; Mieczysław, B.; Ewelina, B.; Katarzyna, Z. Life cycle assessment study on the public transport bus fleet electrification in the context of sustainable urban development strategy. Sci. Total Environ. 2022, 824, 153872. [Google Scholar] [CrossRef] [PubMed]
- Nijkamp, P.; Perrels, A. Sustainable Cities in Europe; Routledge: Abingdon, UK, 2014. [Google Scholar]
- Akcay, E.C. Barriers to Undertaking Green Building Projects in Developing Countries: A Turkish Perspective. Buildings 2023, 13, 841. [Google Scholar] [CrossRef]
- Vossos, V.; Gerber, D.; Bennani, Y.; Brown, R.; Marnay, C. Techno-economic analysis of DC power distribution in commercial buildings. Appl. Energy 2018, 230, 663–678. [Google Scholar] [CrossRef]
- Vossos, V.; Gerber, D.L.; Gaillet-Tournier, M.; Nordman, B.; Brown, R.; Bernal Heredia, W.; Ghatpande, O.; Saha, A.; Arnold, G.; Frank, S.M. Adoption Pathways for DC Power Distribution in Buildings. Energies 2022, 15, 786. [Google Scholar] [CrossRef]
- Zhao, C.; Trento, B.; Jiang, L.; Jones, E.A.; Liu, B.; Zhang, Z.; Costinett, D.; Wang, F.F.; Tolbert, L.M.; Jansen, J.F.; et al. Design and Implementation of a GaN-Based, 100-kHz, 102-W/in3 Single-Phase Inverter. IEEE J. Emerg. Sel. Top. Power Electron. 2016, 4, 824–840. [Google Scholar] [CrossRef]
- Sayed, E.T.; Olabi, A.G.; Alami, A.H.; Radwan, A.; Mdallal, A.; Rezk, A.; Abdelkareem, M.A. Renewable Energy and Energy Storage Systems. Energies 2023, 16, 1415. [Google Scholar] [CrossRef]
- Ould Amrouche, S.; Rekioua, D.; Rekioua, T.; Bacha, S. Overview of energy storage in renewable energy systems. Int. J. Hydrogen Energy 2016, 41, 20914–20927. [Google Scholar] [CrossRef]
- Falama, R.Z.; Saidi, A.S.; Soulouknga, M.H.; Salah, C.B. A techno-economic comparative study of renewable energy systems based different storage devices. Energy 2023, 266, 126411. [Google Scholar] [CrossRef]
- Andújar, J.M.; Segura, F.; Rey, J.; Vivas, F.J. Batteries and Hydrogen Storage: Technical Analysis and Commercial Revision to Select the Best Option. Energies 2022, 15, 6196. [Google Scholar] [CrossRef]
- Singh, A.; Baredar, P.; Gupta, B. Techno-economic feasibility analysis of hydrogen fuel cell and solar photovoltaic hybrid renewable energy system for academic research building. Energy Convers. Manag. 2017, 145, 398–414. [Google Scholar] [CrossRef]
- Khemariya, M.; Mittal, A.; Baredar, P.; Singh, A. Cost and size optimization of solar photovoltaic and fuel cell based integrated energy system for un-electrified village. J. Energy Storage 2017, 14, 62–70. [Google Scholar] [CrossRef]
- Salameh, T.; Abdelkareem, M.A.; Olabi, A.G.; Sayed, E.T.; Al-Chaderchi, M.; Rezk, H. Integrated standalone hybrid solar PV, fuel cell and diesel generator power system for battery or supercapacitor storage systems in Khorfakkan, United Arab Emirates. Int. J. Hydrogen Energy 2021, 46, 6014–6027. [Google Scholar] [CrossRef]
- Chadly, A.; Azar, E.; Maalouf, M.; Mayyas, A. Techno-economic analysis of energy storage systems using reversible fuel cells and rechargeable batteries in green buildings. Energy 2022, 247, 123466. [Google Scholar] [CrossRef]
- NEOM. Available online: https://www.neom.com/en-us (accessed on 30 June 2023).
- TRADE ZONE (Solar Panels). Available online: https://www.tradezone.com.au/catalog/category/view/id/69/?limit=80 (accessed on 30 June 2023).


| Parameter | PV Module Type | ||||
|---|---|---|---|---|---|
| Axitec 450 Watt | Jinko 415 Watt | REC Solar 410 Watt | Seraphim 310 Watt | Tongwei 415 Watt | |
| Maximum power, Pmax, (W) | 450 | 415 | 410 | 310 | 415 |
| Voltage at maximum power (V) | 41.60 | 30.79 | 49.4 | 33.2 | 31.49 |
| Current at maximum power (A) | 10.82 | 13.48 | 8.30 | 9.34 | 13.18 |
| Open-circuit voltage, Voc, (V) | 49.40 | 37.31 | 59.2 | 40.4 | 38.08 |
| Short-circuit current, Isc, (A) | 11.52 | 14.01 | 8.81 | 9.69 | 13.87 |
| Efficiency (%) | 20.70 | 21.25 | 21.2 | 18.85 | 21.3 |
| No. of cells | 144 | 108 | - | 60 | 108 |
| Nominal operating cell temperature | 45 °C | 45 °C | 44 °C | 45 °C | 45 °C |
| Temperature coefficients of Pmax (%/°C) | −0.35 | −0.35 | −0.26 | −0.36 | −0.341 |
| Temperature coefficients of Voc (%/°C) | −0.27 | −0.28 | −0.24 | −0.28 | −0.262 |
| Temperature coefficients of Isc (%/°C) | 0.048 | 0.048 | 0.04 | 0.05 | 0.054 |
| Price (USD) | 266 | 310 | 372 | 190 | 200 |
| PV | FC | Electrolyzer (kg) | H2 Tank (kg) | NPC (USD) | COE (USD/kWh) | O&M (USD/yr) | Capital Cost (USD) | Fuel (Kg/yr) |
|---|---|---|---|---|---|---|---|---|
| PV module type: Axitec 450 Watt | ||||||||
| 276 | 15 | 60 | 20 | 520,938 | 0.305 | 17,982 | 237,671 | 1649 |
| 201 | 20 | 60 | 110 | 557,916 | 0.327 | 20,371 | 237,030 | 1771 |
| 196 | 25 | 60 | 130 | 632,960 | 0.371 | 24,068 | 253,836 | 1789 |
| PV module type: Jinko 415 Watt | ||||||||
| 268 | 15 | 60 | 40 | 571,530 | 0.335 | 18,389 | 281,186 | 1660 |
| 193 | 20 | 60 | 130 | 594,525 | 0.349 | 20,637 | 269,451 | 1781 |
| 201 | 25 | 40 | 170 | 666,637 | 0.393 | 23,790 | 291,896 | 1741 |
| PV module type: REC Solar 410 Watt | ||||||||
| 268 | 15 | 60 | 40 | 615,634 | 0.361 | 18,458 | 324,869 | 1659 |
| 193 | 20 | 60 | 130 | 626,030 | 0.368 | 20,675 | 300,348 | 1780 |
| 169 | 25 | 60 | 200 | 696,791 | 0.41 | 24,166 | 316,120 | 1832 |
| PV module type: Seraphim 310 Watt | ||||||||
| 268 | 15 | 60 | 40 | 570,050 | 0.334 | 20,578 | 245,899 | 1660 |
| 193 | 20 | 60 | 130 | 593,462 | 0.349 | 22,209 | 243,612 | 1781 |
| 202 | 25 | 40 | 170 | 666,826 | 0.393 | 25,465 | 265,698 | 1740 |
| PV module type: Tongwei 415 Watt | ||||||||
| 276 | 15 | 60 | 20 | 498,984 | 0.293 | 18,502 | 207,532 | 1649 |
| 214 | 20 | 60 | 80 | 540,903 | 0.317 | 20,949 | 210,912 | 1755 |
| 217 | 25 | 60 | 80 | 615,151 | 0.359 | 24,749 | 225,294 | 1763 |
| Component | Capital | Replacement | O&M | Salvage | Total |
|---|---|---|---|---|---|
| Axitec 450 Watt | |||||
| Electrolyzer | USD 30,000.00 | USD 16,847.52 | USD 0.00 | (USD 3822.59) | USD 43,024.93 |
| Fuel Cell | USD 163,171.30 | USD 0.00 | USD 96,629.29 | USD 0.00 | USD 259,800.58 |
| H2 Tank | USD 37,500.00 | USD 52,415.44 | USD 128,185.13 | (USD 6988.17) | USD 211,112.40 |
| PV | USD 7000.00 | USD 0.00 | USD 0.00 | USD 0.00 | USD 7000.00 |
| System | USD 237,671.30 | USD 69,262.95 | USD 224,814.41 | (USD 10,810.76) | USD 520,937.90 |
| Jinko 415 Watt | |||||
| Electrolyzer | USD 30,000.00 | USD 16,847.52 | USD 0.00 | (USD 3822.59) | USD 43,024.93 |
| Fuel Cell | USD 37,500.00 | USD 52,583.66 | USD 128,988.50 | (USD 6744.48) | USD 212,327.68 |
| H2 Tank | USD 14,000.00 | USD 0.00 | USD 0.00 | USD 0.00 | USD 14,000.00 |
| PV | USD 200,363.96 | USD 0.00 | USD 101,813.31 | USD 0.00 | USD 302,177.26 |
| System | USD 281,863.96 | USD 69,431.18 | USD 230,801.81 | (USD 10,567.07) | USD 571,529.87 |
| REC Solar 410 Watt | |||||
| Electrolyzer | USD 30,000.00 | USD 16,847.52 | USD 0.00 | (USD 3822.59) | USD 43,024.93 |
| Fuel Cell | USD 37,500.00 | USD 52,563.04 | USD 128,893.99 | (USD 6773.15) | USD 212,183.88 |
| H2 Tank | USD 14,000.00 | USD 0.00 | USD 0.00 | USD 0.00 | USD 14,000.00 |
| PV | USD 243,368.90 | USD 0.00 | USD 103,054.93 | USD 0.00 | USD 346,423.84 |
| System | USD 324,868.90 | USD 69,410.56 | USD 231,948.92 | (USD 10,595.74) | USD 615,632.64 |
| Seraphim 310 Watt | |||||
| Electrolyzer | USD 30,000.00 | USD 16,847.52 | USD 0.00 | (USD 3822.59) | USD 43,024.93 |
| Fuel Cell | USD 37,500.00 | USD 52,583.66 | USD 128,988.50 | (USD 6744.48) | USD 212,327.68 |
| H2 Tank | USD 14,000.00 | USD 0.00 | USD 0.00 | USD 0.00 | USD 14,000.00 |
| PV | USD 164,398.52 | USD 0.00 | USD 136,298.46 | USD 0.00 | USD 300,696.98 |
| System | USD 245,898.52 | USD 69,431.18 | USD 265,286.96 | (USD 10,567.07) | USD 570,049.59 |
| Tongwei 415 Watt | |||||
| Electrolyzer | USD 30,000.00 | USD 16,847.52 | USD 0.00 | (USD 3822.59) | USD 43,024.93 |
| Fuel Cell | USD 37,500.00 | USD 52,420.41 | USD 128,208.76 | (USD 6981.00) | USD 211,148.16 |
| H2 Tank | USD 7000.00 | USD 0.00 | USD 0.00 | USD 0.00 | USD 7000.00 |
| PV | USD 133,032.13 | USD 0.00 | USD 104,778.74 | USD 0.00 | USD 237,810.87 |
| System | USD 207,532.13 | USD 69,267.92 | USD 232,987.50 | (USD 10,803.59) | USD 498,983.96 |
| Axitec 450 Watt | Jinko 415 Watt | REC Solar 410 Watt | Seraphim 310 Watt | Tongwei 415 Watt | |
|---|---|---|---|---|---|
| Electrical production | |||||
| Annual photovoltaic power, kWh | 352,043 (92.8%) | 342,216 (92.5%) | 347,674 (92.6%) | 341,058 (92.5%) | 352,704 (92.8%) |
| Annual PEMFC power, kWh | 27,476 (7.24%) | 27,664 (7.48%) | 27,655 (7.37%) | 27,665 (7.5%) | 27,475 (7.23%) |
| Annual total power, kWh | 379,519 (100%) | 369,880 (100%) | 375,329 (100%) | 368,723 (100%) | 380,180 (100%) |
| Electrical consumption | |||||
| DC load, kWh year | 108,296 (58.5%) | 108,318 (58.1%) | 108,311 (58.1%) | 108,317 (58.1%) | 108,295 (58.5%) |
| Annual electrolyzer power, kWh | 76,910 (41.5%) | 78,185 (41.9%) | 78,156 (41.9%) | 78,186 (41.9%) | 76,907 (41.5%) |
| Total, kWh/yr | 185,206 (100%) | 186,503 (100%) | 186,467 (100%) | 186,503 (100%) | 185,203 (100%) |
| PV array | |||||
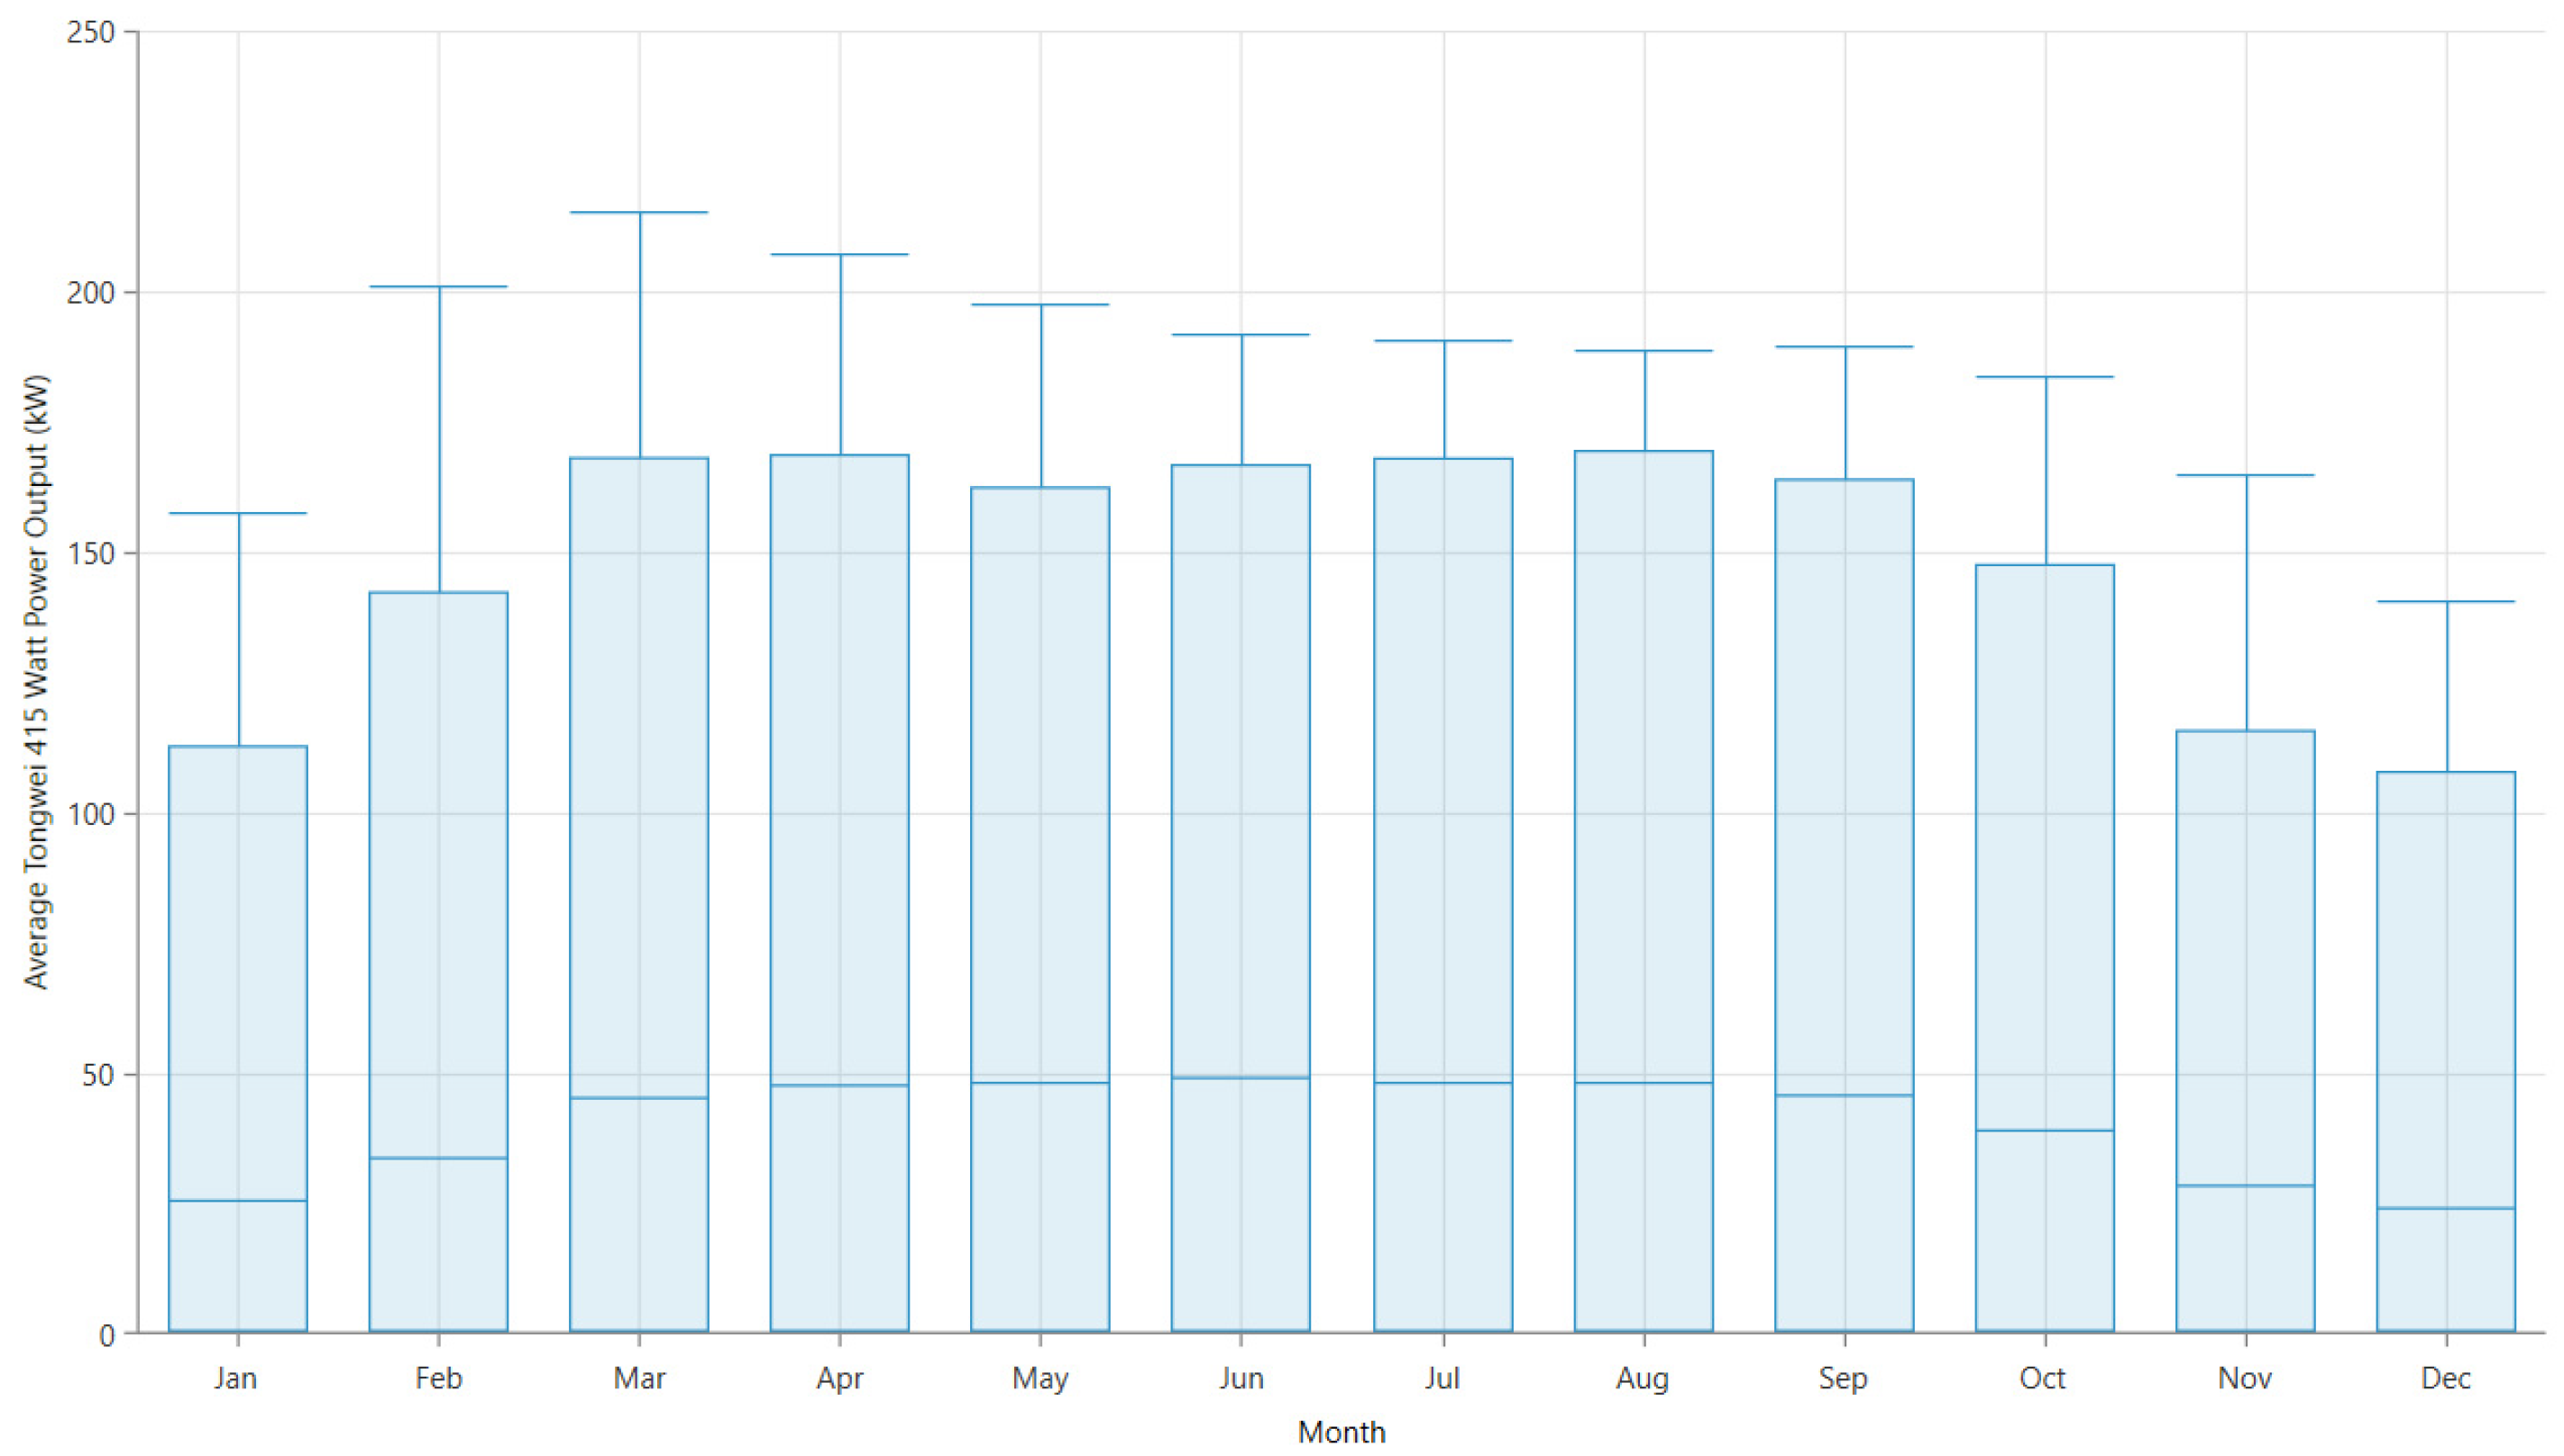
| Mean output, kW | 40.2 | 39.1 | 39.7 | 38.9 | 40.3 |
| Mean output, kWh/d | 965 | 938 | 953 | 934 | 966 |
| Capacity factor, % | 14.6 | 14.6 | 14.8 | 14.5 | 14.6 |
| Maximum output, kW | 215 | 209 | 318 | 208 | 216 |
| PV penetration | 322% | 313% | 255% | 311% | 322% |
| Hours of operation, hrs/yr | 4277 | 4277 | 4277 | 4277 | 4277 |
| Levelized cost, USD/kWh | 0.0468 | 0.0561 | 0.0633 | 0.0560 | 0.0428 |
| Fuel cell | |||||
| Hours of operation, hrs/yr | 5425 | 5459 | 5455 | 5459 | 5426 |
| Number of starts, starts/yr | 405 | 407 | 405 | 407 | 406 |
| Operational life, yr | 7.37 | 7.33 | 7.33 | 7.33 | 7.37 |
| Capacity factor,% | 20.9 | 21.1 | 21.0 | 21.1 | 20.9 |
| Mean electrical output, kW | 5.06 | 5.07 | 5.07 | 5.07 | 5.06 |
| Maximum output, kW | 15 | 15 | 15 | 15 | 15 |
| Electrolyzer | |||||
| Mean input, kW | 8.78 | 8.93 | 8.92 | 8.93 | 8.78 |
| Maximum input, kW | 60 | 60 | 60 | 60 | 60 |
| Capacity factor,% | 14.6 | 14.9 | 14.9 | 14.9 | 14.6 |
| Total production, kg/yr | 2826 | 1685 | 1684 | 1685 | 1657 |
| Specific consumption, kWh/kg | 46.4 | 46.4 | 46.4 | 46.4 | 46.6 |
| Hours of operation, hr/ys | 1855 | 1897 | |||
| Hydrogen tank | |||||
| Levelized COH, USD/kg | 20.0 | 21.5 | 23.2 | 21.5 | 19.1 |
| Energy storage capacity, kWh | 667 | 1333 | 1333 | 1333 | 667 |
| Tank autonomy, hr | 53.3 | 107 | 107 | 107 | 53.3 |
Disclaimer/Publisher’s Note: The statements, opinions and data contained in all publications are solely those of the individual author(s) and contributor(s) and not of MDPI and/or the editor(s). MDPI and/or the editor(s) disclaim responsibility for any injury to people or property resulting from any ideas, methods, instructions or products referred to in the content. |
© 2023 by the authors. Licensee MDPI, Basel, Switzerland. This article is an open access article distributed under the terms and conditions of the Creative Commons Attribution (CC BY) license (https://creativecommons.org/licenses/by/4.0/).
Share and Cite
Olabi, A.G.; Ghoniem, R.M.; Alami, A.H.; Abdelkareem, M.A. Optimal Sizing and Management of Hybrid Renewable Energy System for DC-Powered Commercial Building. Buildings 2023, 13, 2109. https://doi.org/10.3390/buildings13082109
Olabi AG, Ghoniem RM, Alami AH, Abdelkareem MA. Optimal Sizing and Management of Hybrid Renewable Energy System for DC-Powered Commercial Building. Buildings. 2023; 13(8):2109. https://doi.org/10.3390/buildings13082109
Chicago/Turabian StyleOlabi, Abdul Ghani, Rania M. Ghoniem, Abdul Hai Alami, and Mohammad Ali Abdelkareem. 2023. "Optimal Sizing and Management of Hybrid Renewable Energy System for DC-Powered Commercial Building" Buildings 13, no. 8: 2109. https://doi.org/10.3390/buildings13082109