Article

Static Modulus of Deformation of Uncemented Layers of the Railway Substructure—Comparison of Values and Determination of Correlation Dependence According to the Test Procedure of the Slovak Railways and Deutsche Bahn A.G.

1
Department of Railway Engineering and Track Management, University of Žilina, Univerzitná 8215/1, 010 26 Žilina, Slovakia
2
Department of Structural Mechanics and Applied Mathematics, University of Žilina, Univerzitná 8215/1, 010 26 Žilina, Slovakia
*
Author to whom correspondence should be addressed.
Buildings 2023, 13(8), 2016; https://doi.org/10.3390/buildings13082016
Submission received: 6 July 2023 / Revised: 25 July 2023 / Accepted: 4 August 2023 / Published: 8 August 2023

Abstract

:
The paper focuses on the analysis of the values of the static modulus of deformation obtained by the application of the test procedure specified in the methodology for the diagnostics of the sub-ballast layers used for German railways (DIN 18 134) and the Railways of the Slovak Republic (Regulation TS4). The purpose of the study was to determine the correlation between the measured values of the static modulus of deformation according to the above-mentioned methodologies based on a series of experimental measurements on an experimental field built at a scale of 1:1. It also aimed to develop a numerical model characterising the behaviour of the loaded environment during the experimental measurements using the finite element method, which can subsequently be used for the design of the structural composition of the sub-ballast layers. For the purpose of the experimental measurements, a sub-ballast layer of 0/31.5 mm crushed aggregate of different design thicknesses was applied to the sub-ballast layers. A polynomial dependence with a high value of the reliability coefficient can be found between the results of the static modulus of deformation obtained using the mentioned measurement methodologies during the quality inspection of the implemented construction works. This dependence is valid for the specific boundary conditions of the experimental measurements performed (subsoil of clay with gravel admixture and the sub-ballast crushed aggregate layer of 0/31.5 mm dolomitic gravel). In the future, establishing correlation dependencies for other boundary conditions and structural material compositions can be considered.

1. Introduction

The unification of the European area has increased mobility and competition between the different transport systems, challenging the railways to meet higher quality and quantity requirements. For several decades now, rail transport has been characterised by its ability to provide transport links reliably, safely, and, moreover, with better environmental compatibility and less land use, especially compared with the ubiquitous and environmentally damaging road transport. For these reasons, rail transport is enjoying another renaissance. New high-speed connections are being built and existing railway lines and transport corridors are being upgraded. Improving the quality of railway lines, as well as the safety and reliability of rail transport and the interoperability of the railway area, characterise the basic pillars of the emerging European railway interconnected area.
Continuous technical progress, the invention and application of new materials and constructions in various sectors of civil engineering, and novel approaches in the design and implementation of construction works act in parallel with the need to ensure more efficient diagnostics and subsequent maintenance with appropriate technological procedures using modern construction or track machinery and equipment. As the Slovak Republic is part of the European Union, and thus also part of the European integrated railway area, a considerable adjustment of legislative documents has recently been implemented. The aim of these modifications is to unify the requirements imposed on newly built, modernized, or reconstructed railway lines, and at the same time to extend the possibilities of their design and diagnostics. The importance of meeting this objective lies in the fact that a train in transit passing through the territory of the Slovak Republic must have comparable quality conditions for its ride, not only in terms of signalling and safety equipment or structure gauge but the actual railway superstructure and substructure must be sufficiently safe and comfortable for the passenger. Therefore, the setting of the required values for the track layout and geometry of the superstructure and the deformation resistance of the substructure plays a fundamental role in making the train ride safe and comfortable.
In the case of the modernisation of trans-European corridor lines crossing the territory of the Slovak Republic, it was necessary, within the framework of introducing new approaches to their implementation and diagnostics, to pay considerable attention to the issue of transition zones between the earthwork and the structures of sub-ballast layers (bridges, tunnels, underpasses, culverts, etc.) or between the conventional railway superstructure (ballast superstructure) and the unconventional railway superstructure (slab track). The subject of the presented article is the clarification of some issues related to the amendment of the Railway Regulation TS 4 [1], namely Annex No. 6, dealing with the method of determining the deformation resistance of the sub-ballast layers. In the regulation and the annex in question, the possibility of determining the deformation resistance of the sub-ballast layers was also added by the test procedure used on the German Railways DB A.G. [2]. The legislation is based on the fact that the German railways are among the highest quality ones in the European area, and it is the aim not only of the Railway Infrastructure Administration but also of all the neighbouring railway administrations to approach their quality.
Therefore, the design organisation VALBEK SK, involved in preparing the project modernising the corridor lines of the Slovak Railways (SR) and the General Directorate of the Slovak Railways (GD SR) as an investor of the infrastructure modernisation, approached the Department of Railway Engineering and Track Management of the Faculty of Civil Engineering of the University of Žilina (DRETM, FCI, UNIZA) to carry out a relevant set of measurements according to both test procedures, to compare them and to determine the correlation between the deformation resistance values determined by the SR test procedure (ŽSR TS4) and the DB A.G. test procedure (DIN 18 134).
It is also possible to verify numerically the behaviour of the modelled space in the deformation and especially in the stress state. Using a suitable computational system and relevant input data, it is possible to obtain the response of the whole area of the measured points and thus also generate theoretical data to verify the test methods.

1.1. Global State of Art

  • Research in the field of diagnostics and measurement of mechanical properties of structural layers of linear structures has been carried out by several research teams worldwide. Many computational models have been developed to solve static and dynamic problems of railway line construction, in which specific mechanical properties—rheological properties of materials—are attributed to the track bed. The most commonly used is the rheological model of Hooke’s elastic substance, introduced into the following basic computational models of continuous media:
  • surface computational subgrade models—elastic subgrade (E. Winkler [3], P. L. Pasternak);
  • elastic half-space—elastic half-plane (V. J. Boussinesq [4]);
  • elastic layered half-space (N. Oedomark [5], G. I. Pokrovskii [6]).
The progression of stresses in layered half-space and the derivation of simplified computational approaches have been further addressed by e.g., Burmister [7], Witczak [8], Rappoport [9], Johnson [10], Kandaurov [11], Kezdi [12], and others. In addition to elastic layered half-space, more complex physical models of elastic-plastic, bond-elastic, and semi-plastic layered half-spaces have also been developed [13]. These models do not have significant application in construction practice due to the complexity of calculation and the difficulty of determining the input parameters. However, they are the basis for software applications based on the principle of numerical methods. Modern designs use numerical approaches based on the finite element method (FEM). It is mainly possible due to their variability and general theoretical foundations for solving continuum mechanics boundary value problems. The first simplified numerical models for layered half-space were applied in their research by Kulhawy, Duncan, and Seed [14] and later by e.g., Komvopoulos [15], Tian and Saka [16]. Elements of 3D and applications of nonlinear analysis can be found in the research by Bode, Hirschauer, and Savidis [17], Li, Ekh, and Nielsen [18], Adam, Pflanz, and Schmid [19], Sun, Cai, and Xu [20], Fu and Zheng [21], Sayeed and Shahin [22], and Wattanapanalai [23]. Obtaining relevant outputs from numerical modelling is only possible if good quality numerical modelling input parameters are available, so a highly significant role is played by experimental measurements.
Diagnostics or control measurements of the mechanical properties of the structural layers of linear buildings are generally carried out in Central Europe by means of static load tests. Experimental measurements based on the implementation of static load tests on the subgrade and sub-ballast layer of linear structures have been addressed by Pospisil and Zednik [24], Shirvani and Shooshpasha [25], Ismael [26], Wyroslak [27], Oh and Vanapalli [28], Kim and Park [29], Neupane, Han, and Parsons [30], and Pospisil, Horníček, and Lojda [31].

1.2. Research Background of the Study

A high-quality, reliable and, above all, safe carriageway can only be achieved if all its structural and material components are designed with regard to the possible traffic (static and dynamic loads) and non-traffic (climatic) loads. Therefore, the DRETM research tasks have long been focused on monitoring individual types of loads, diagnosing the structural or design parameters of the railway line, and studying the impact of incorporating innovative construction materials into the structural layout of the railway line. After relocating the Faculty of Civil Engineering to the central campus of the University of Žilina, it was decided to build an experimental workplace, the so-called DRETM test stand (Figure 1), which serves to implement and meet the objectives of the research tasks of the department.
DRETM research activities were initially focused on monitoring non-traffic loads, characterised by the effects of climatic factors (water, snow, frost). Based on a dense network of embedded Pt1000 temperature sensors [32] and the non-destructive moisture measurement method TDR [33], information on the freezing of the railway track structure was obtained. On the basis of cooperation with the Slovak Hydrometeorological Institute (SHMI), and the Department of Road Construction and Environmental Engineering (DRCEE) [34], the design map of air frost indices for the territory of the Slovak Republic was also modified [35]. Experimentally determined parameters and data obtained from SHMI were also used in the numerical modelling of the railway track design, where the influence of more unfavourable climatic factors [36], and the influence of different railway track designs [37], were subsequently monitored.
Significant progress in the research activities occurred after the decision to apply and subsequently monitor the influence of various innovative thermal insulation building materials (extruded polystyrene, liapor, liaporconcrete, composite foam concrete and foamed glass) on the structural composition of the railway sub-ballast layers. Each measurement profile in Figure 1 characterises a different structural or material arrangement of the sub-ballast layers. Dimensional nomograms have also been developed for the majority of the innovative thermal insulation building materials incorporated, even for areas with significantly more unfavourable climatic conditions (areas with higher frost index values) than those achieved in the Slovak Republic territory. On the basis of the research results, several adjustments were made to the methodology of dimensioning the sub-ballast layers in terms of the effect of non-traffic loads on the needs of Slovak Railways.
The area of interest of the DRETM research was subsequently extended to monitoring the static component of the traffic load and assessing the above-mentioned innovative materials in terms of a possible increase in the deformation resistance of the railway sub-ballast layers. From the subject point of view, the application of the composite foam-concrete layer in the sub-ballast layers was the most significant one after starting the cooperation with Europe [38]. On the basis of joint research with other departments of the Faculty of Civil Engineering of the University of Žilina (FCI, UNIZA), the possibility of applying the composite foam concrete layer also in road construction [39] or in various geotechnical applications [40,41] was subsequently confirmed. Attention has also been paid to the testing of the subgrade, especially for the case when it is composed of fine-grained soils [42,43,44], or the possibilities of improving the subgrade properties [45].
The present research focuses on monitoring and designing modifications of the transition zones between the structures of the sub-ballast layers and the earthwork [46,47]. We also address the issue of building test sections in the railway line due to monitoring the dynamic load transferred to the sub-ballast layers from the train rides, which has been so far only numerically modelled in cooperation with the Faculty of Mechanical Engineering of UNIZA [48,49].
The final research objective is to provide a comprehensive overview of the loads acting on the railway line and to incorporate the possibilities of applying new innovative materials and structural elements in the design of the railway line structure to achieve its optimal structural arrangement in terms of the required gradation of stiffness between the softer structure of the railway line on the earthwork and the stiffer railway line when the railway superstructure is placed, e.g., on a bridge structure, in a tunnel, or over an underpass. It is a transition between conventional and unconventional superstructures.
Incorporating new knowledge and updating legal documents dealing with the design of the structural composition of the railway line introduce the necessity of implementing changes in the diagnostics of the designed structures. One of the regulations that has been recently updated is the Railway Regulation TS 4 [1]. Among the changes implemented in the regulation is the possibility to assess the deformation resistance of the structural layers of the trackbed, by the test procedure by the German railways DB A.G., adopted from DIN 18 134 [2], besides the test procedure used by the Slovak Railways Administration.
Since the values of the static modulus of deformation determined according to the respective test measurement procedures differ, a request from practice was addressed to the DRETM research team regarding determining of the correlation between them. Experimental measurements concerning the comparison of the test procedures for determining the deformation resistance of the sub-ballast layers were conducted in Sector B of the DRETM test stand (Figure 1). The measured results and their comparison, as well as the development of 3D models of the tested structures, are the subject of further chapters of this article.

2. Characteristics of the Methods and Experimental Field

This part of the article characterises the test procedures used for determining the deformation resistance of the sub-ballast layers (test procedure of DB A.G. and SR), their theoretical background, the method of implementing the experimental measurements, and the construction and material composition of the experimental field.

2.1. Theoretical Background of Applied Test Methods

The procedure for assessing the deformation resistance of the structural layers of the trackbed according to the Slovak Railways Administration TS 4 [1] or DIN 18 134 [2] is based on Boussinesq’s theory of elastic half-space [4]. The calculation is carried out in a cylindrical coordinate system (R, β, z, Figure 2), and the obtained results are transformed into a Cartesian coordinate system (x, y, z).
After considering the assumptions of a continuous environment and defining the model conditions, the following equation was used to calculate the progression of stresses in the subgrade:
σ r = A ·   cos β R 2 ,
where A is a constant determined from the equilibrium condition of the sum of the vertical components of the radial stress σr cosβ over a hemispherical area of radius R and the applied force P. For loading a half-space by a single lone force P (Figure 2), the following relation holds according to the above theory:
σ r = 3   ·   P   ·   cos β 2   ·   π   ·   R 2 ,
By decomposing the radial stress into a coordinate prism, the normal and tangential stresses at a given point M are then determined. For the vertical normal stress at the investigated point, the relation then holds:
σ z = 3   ·   P   ·   z 3 2   ·   π   ·   R 5 .
The magnitude of the vertical stress at depth z below the centre of a rigid circular surface of radius r loaded with a uniform vertical load p is characterised by the relation:
σ z = p   · 1 cos 3 γ = p p 1 + r z 2 3 2 ,
where for γ the following holds:
γ = t g 1   · r z .
Relations (3) and (4) indicate that the deformation of this idealised model does not depend on the material elastic constants of the half-space E and ν but only on the position of the investigated point with respect to the load and the magnitude of the given load. Consequently, only the magnitude of the remodelling of the environment depends on the material constants. The drop of a rigid circular plate loaded with a uniform pressure p is determined from the relationship:
y = f ·   p   ·   r E   · ( 1 ν 2 ) .
where:
y: drop in the centre of the load plate (m),
f: stress distribution factor (-),
ν: Poisson’s ratio for the soil material (-),
E: soil material’s modulus of elasticity (Pa),
P: average loading pressure on the plate) (N∙m−2),
r: radius of the loading plate (m).
The stress distribution factor f from Equation (6) depends on the assumed stress distribution in the soil. Generally, the values of the f factor given in Table 1 are considered. The value of the considered stress distribution factor f, and therefore the assumed method of stress distribution in the soil, is one of the differences between the DB A.G. test procedure and the SR test procedure. In the case of the German Railways test procedure [2], for coarse-grained soils, the value of the stress distribution factor f = 2 and the value of the Poisson’s ratio ν = 0.50 where the material is not drained or ν = 0.35 where the material is drained are considered [50].
We can then modify relation (6) to the form:
E = 2   ·   p   · r y   · 1 0.5 2 = 3 2   ·   p   ·   r y .
The deformation modulus of the material Edef can be calculated as the secant modulus according to the elastic half-space theory. The secant is determined from the points P1 (0.3 ∙ σ0max; s1) and P2 (0.7 ∙ σ0max; ss) of the quadratic parabola (Figure 3).
The static deformation modulus Edef can then be calculated from the relation:
E d e f = 3 2   · r   ·   σ y = 1.5   · r   ·   σ 2 σ 1 y 2 y 1 .
After completing and modifying the relation (a detailed derivation of the relation can be found in Annex B of DIN 18 134 [2]), the final relation for the calculation of the deformation modulus is obtained:
E d e f = 1.5   · r   ·   1 a 1 + a 2   ·   σ 0 ,     m a x .
In relation (9), the magnitude of the maximum stress acting on the load plate σ0,max is considered from the first cycle of the static load test. The parameters a1 and a2 can be determined by solving the normal equations (detailed in Annex B of the standard [2]) resulting from the equation:
y = a 0 + a 1 ·   σ 0 + a 2 ·   σ 0 2 .
In the case of the SR test procedure [1], for the case of coarse-grained soils, the value of the stress distribution factor f = π 2 . By modifying Equation (6), the relation for the calculation of the static modulus of deformation is obtained in the form:
E d e f = π 2   ·   p   ·   r y   · ( 1 ν 2 ) .
The final relation for the calculation of the static modulus of deformation is obtained after the addition of the value ν = 0.21 expressing the regularities and processes to be considered in the case of a layer loaded by a rigid circular plate and has the form:
E d e f = 1.5   ·   p   ·   r y .

2.1.1. DB A.G. Test Procedure

The determination of the deformation resistance of the sub-ballast layers according to [2] is conducted by means of a static load assembly (Figure 4). Within the framework of experimental measurements, specifically of the static modulus of deformation, a rigid circular load plate with a diameter of 300 mm was used since the grain size of the material embedded in the structural layers of the structure of the experimental field did not exceed a quarter of the diameter of the plate in question. To ensure close contact between the load plate and the test material, a thin layer of medium-grained sand was formed between them.
The required pressure acting on the circular load plate shall be derived using a hydraulic assembly, ensuring that the minimum distance between the load plate and the contact surface of the counterweight is at least 0.75 m. This condition was met in the experimental measurements, as the counterweight was a steel frame with a movable cross beam (see Figure 1). A FRÖWAG hydraulic rig with a range of up to 0.8 MN∙m−2 and measurement accuracy of 0.01 MN∙m−2 was applied. Settling measurement could be performed using a cup-beam gauge, a deformation gauge, or an alternative measuring system with a maximum permissible measurement error of 0.04 mm in a measuring range of up to 10 mm. A MITUTOYO digital deflectometer with a measuring range of up to 25.4 mm and measuring accuracy of 0.01 mm was used. The displacement sensor could be placed directly on the circular plate or a support frame working on the principle of a weighting beam, with a leverage ratio not exceeding 2.0. For the experimental measurements, a beam with a leverage ratio of 2.0 was used.
Before the start of the measurement, the circular plate was loaded for a minimum of 30 s with a preliminary load corresponding to 0.01 MN∙m−2 (valid for a 300 mm diameter plate). After the force gauge was reset and the reading on the deformation gauge was recorded, the actual measurement could begin. The static load test was carried out in two load cycles, or a third so-called check load cycle could be conducted.
In the first loading cycle, maximum normal-bearing stress acting under the circular plate of 0.5 MN∙m−2 was considered. When a settlement of the measured layer of 5 mm was reached first, the maximum stress was considered to be the normal stress measured at this stage. The load was applied to the circular plate in at least six stages in approximately equal steps (0.08; 0.16; 0.25; 0.33; 0.42, and 0.50 MN∙m−2) until the required maximum stress was reached. Each load change (from step to step) was conducted within one minute. The load was released in three stages at 50, 25 and approximately 2% of the maximum load. After relief, a second load cycle was performed, in which the load only increased to the penultimate stage of the first cycle (not to reach full load). The transition to the next stage of loading could be made after 120 s while the load had to be maintained constant. At the end of each loading or unloading stage, a reading was recorded on the deformation (drop) sensor. The curve of the dependence of the settlement of the measured layer on the applied load is depicted in Figure 3. The relationship for calculating the static modulus of deformation is characterised by Equation (9) where the final value of the deformation resistance of the measured structural layer is the value determined in the second loading cycle.

2.1.2. Test Procedure of the Slovak Railways

To implement static load tests according to the methodology described in [1], the identical static load set-up described in Section 2.1.1 was used. The primary differences between the examined test procedures lie in the methods of loading/relieving the measured structural layer, recording the reading from the deformation (drop) sensor and calculating the final deformation resistance of the structural layer.
The maximum value of the normal stress acting under a rigid circular loading plate of 300 mm diameter is 0.2 MN∙m−2 for assessing the deformation resistance of the sub-ballast layers. The preliminary load on the circular plate prior to the actual start of the measurement shall not exceed 20% of the maximum load value and shall be applied for 10 s. The static load test is performed in two load cycles with four loading and unloading stages of the same step (0.05; 0.10; 0.15, and 0.20 MN∙m−2). At each loading and relieving stage, it is necessary to wait until the deformation of the measured layer stabilised. The indentation of the circular plate into the measured layer material shall be considered steady if the change in deformation in 1 min does not exceed 0.02 mm. The calculated value from the second loading cycle, based on the relation (12), is considered the final value of the deformation resistance of the measured structural layer.

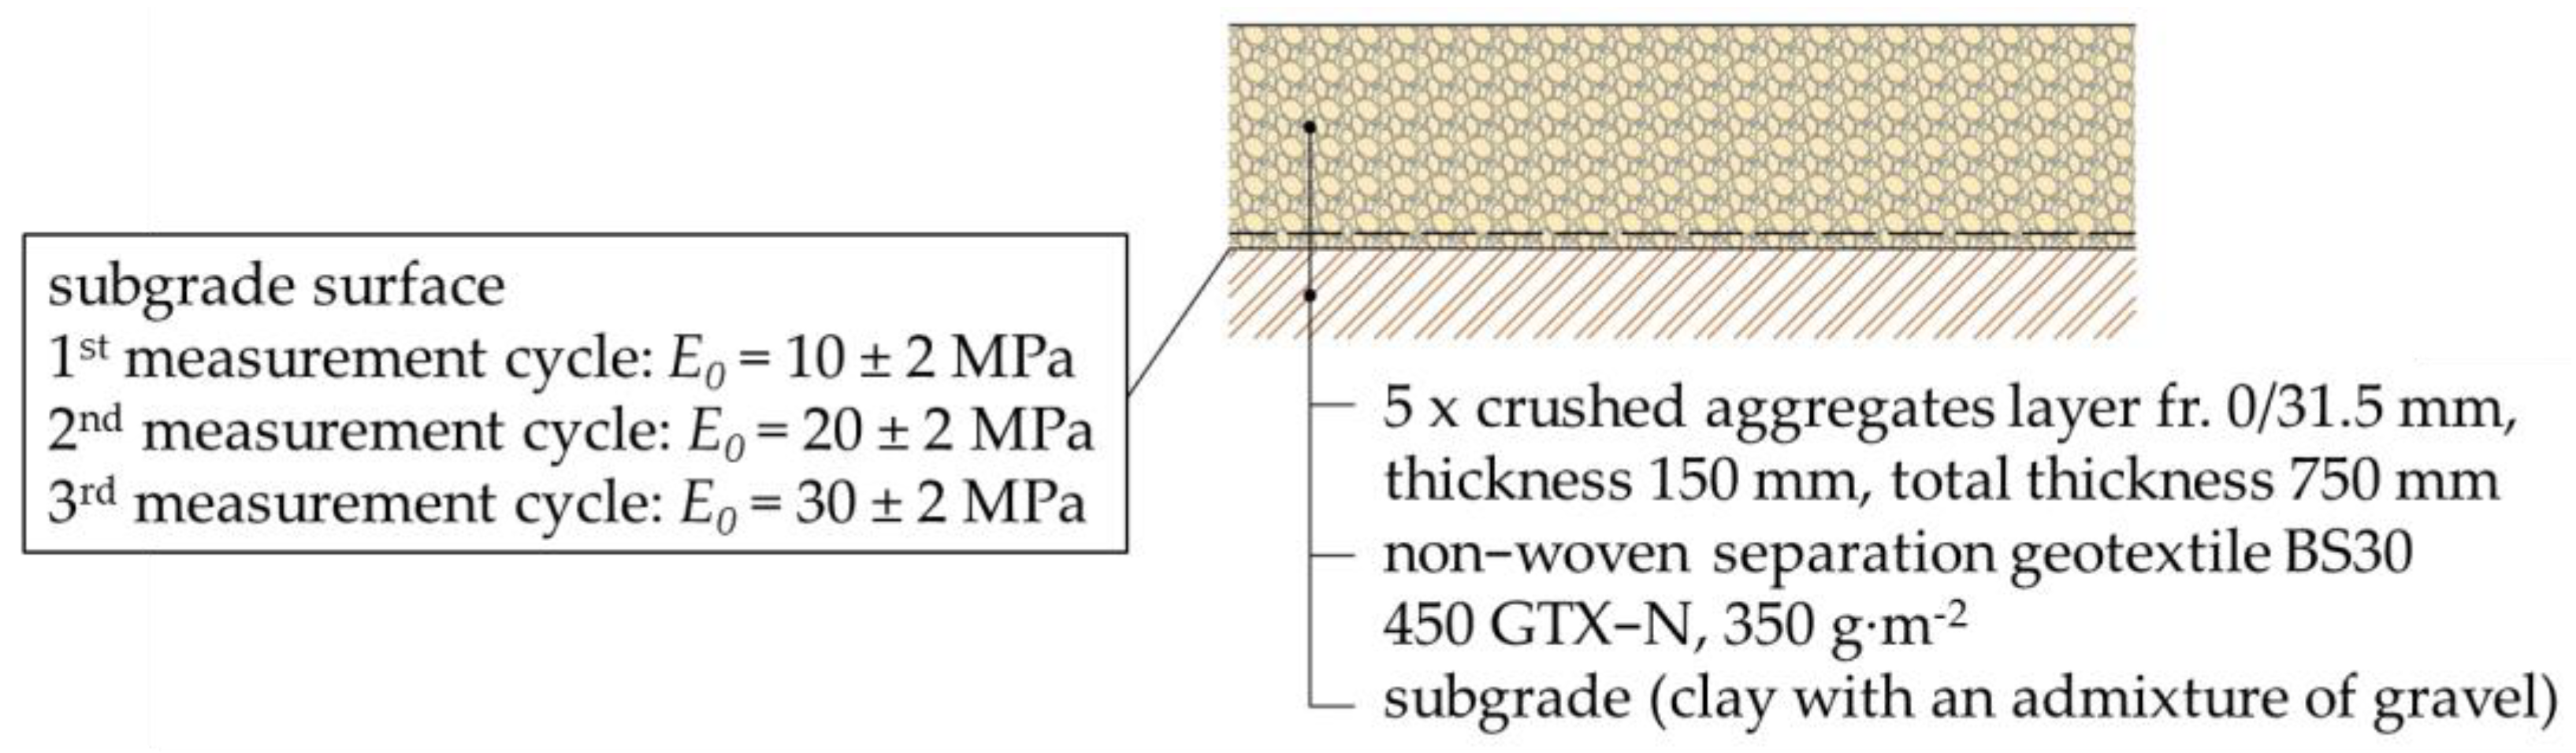
2.2. Characteristics of the Experimental Field and Method of Experimental Measurements

The experimental field that serves to compare test procedures for determining the deformation resistance of sub-ballast layers used on German and Slovak railways is a part of the Experimental Workplace—the DRETM Test Stand, described in Section 1.2. The experimental field (Figure 5: plan, Figure 6: cross-section AA’) was built in sector B of the Experimental Workplace. It also contains a steel frame with a movable crossbar serving as a counterweight for the actual implementation of the experimental measurements—static load tests. The dimensions in Figure 5 are provided in mm.
Figure 5 displays the geometrical arrangement of the experimental field and the locations of the experimental measurements (static load tests). To obtain a sufficient set of measurements for their statistical evaluation, a total of 20 static load tests (10 according to the DB A.G. test procedure and 10 according to the SR test procedure) were carried out on the surface of one structural layer. The experimental field consisted of a subgrade made of uniformly mixed clay and river gravel (soil characterised as gravelly clay—CG) on which a non-woven separating geotextile and a sub-ballast layer of crushed aggregate fr. 0/31.5 mm were subsequently placed. The sub-ballast layer of total thickness 750 mm was formed successively from 150 mm thick partial layers (five partial layers in total) to observe the influence of the thickness of the structural layer on the increase in the deformation resistance of the structure under study in the framework of the comparison of the examined measurement procedures. The sufficient thickness of the sub-ballast layer ensures the required deformation resistance of the railway substructure. According to [1], the minimum required deformation resistance of the structural sub-ballast layers (structural layers under the ballast bed layer, fr. 31.5/63 mm) at the sub-ballast upper surface level ranges from 30 MPa to 100 MPa depending on the speed zone of the designed railway line and the type of construction (new construction, reconstruction, or modernisation on the original sub-ballast layers). A total of the measurement cycles were carried out. The individual measurement cycles differed from each other in terms of the deformation resistance at the level of the subgrade surface. The deformation resistance values for the measurement cycles are specified in Figure 6. The scatter of the values of the deformation resistance of the subgrade surface ±2 MPa was determined by the authors of the paper and maintained throughout all experimental measurements. Thus, 120 static load tests were carried out in one measurement cycle, and a total of 360 static load tests were carried out in all three measurement cycles (60 were carried out on the subgrade surface and 300 on the surface of the individual partial structural layers of the crushed aggregate of fr. 0/31.5 mm). The classification of the subgrade material and its basic characteristics can be seen in Table 2.
The classification of the subgrade material (Figure 7) was carried out according to STN 72 1001 [53], and the evaluation of the consistency according to [54,55]. The subgrade sampling from the experimental field was conducted using the roller test (Figure 8). The determined subgrade characteristics listed in Table 2 were the moisture content of the material w, the bulk density of the material in the wet state ρ, the curvature number Cc, the non-uniformity number Cu, the soil moisture content at the inter-fluidity wL, the soil moisture content at the inter-plasticity wP, the soil plasticity index Ip and the soil consistency degree Ic. The material of the sub-ballast layer of crushed aggregate with a grain size of 0/31.5 mm (dolomitic gravel) was transported from a quarry located near the village of Veľká Čierna (approx. 25 km from the university campus) directly from the quarry stone crusher (Figure 9, left), due to the guarantee of a suitable grain-size curve of the material.
The basic material characteristics were determined for the sub-ballast layer and sub-grade material. The sample for determining the characteristics was extracted using the pit test (Figure 9, right) from the last structural layer of the experimental field after the completion of the first measurement cycle. The material of the sub-ballast layer was evaluated following the procedure described in [1,56], and its grain size curve is specified in Figure 10.
The red dashed curves characterise the desired lower and upper grain size limits for the crushed aggregate fr. 0/31.5 mm and the blue curve is the grain size curve for the material applied in the experimental measurements. The classification of the sub-ballast layer material and its characteristics are provided in Table 2.

3. Results and Discussion

This part of the article presents the results of the experimental and numerical analysis aimed at establishing the correlation between the values of the static modulus of deformation determined according to the DB A.G. and SR test procedures and the design of a numerical model characterizing the situations under which the experimental measurements were carried out. The examined test procedures are described in Section 2.1.1 and Section 2.1.2 and the material characteristics of the experimental field with a detailed specification of the implementation of the experimental measurements are provided in Section 2.1.2. Since the set of measured values of the static modulus of deformation is large (see Section 2.1.2 for more details), their statistical assessment was conducted.
As part of the statistical assessment, the value of the arithmetic mean of the experimentally measured values was first determined according to Equation:
E d e f ¯ = 1 N   ·   i = 1 N E d e f ,   i .
The standard deviation was then calculated according to the relationship:
σ = 1 N   ·   i = 1 N   ( E d e f ,   i E d e f ¯ ) 2 .
Erroneous values that were subsequently excluded and not used in the further evaluation of the data were values outside the interval:
( E d e f ¯ 2 σ ;   E d e f ¯ + 2 σ ) .
The correlation coefficient was calculated as the ratio of the value of the arithmetic mean of the values determined according to the SR test procedure E d e f ,   S R ¯ and the value of the arithmetic mean of the values determined according to the DB A.G. test procedure E d e f ,   D B ¯ by the relation:
K k = E d e f ,   S R ¯ E d e f ,   D B ¯ .

3.1. Correlation Dependence between the Values of the Static Modulus of Deformation Determined According to the Examined Test Procedures

After the statistical assessment and the exclusion of measurements according to the relations given in the introduction of this section, a graphical dependence of the increase in the deformation resistance of the sub-ballast layers on the increasing thickness of the sub-ballast layer was first constructed separately for the two test procedures under consideration (Figure 11—SR test procedure, and Figure 12—DB A.G. test procedure).
It should be noted that the blue curve in Figure 11 and Figure 12 characterises the first measurement cycle with the deformation resistance of the subgrade surface E0 = 10 ± 2 MPa; the red curve characterises the second measurement cycle with the deformation resistance of the subgrade surface E0 = 20 ± 2 MPa; and the green curve characterises the third measurement cycle characterised by the deformation resistance of the subgrade surface E0 = 30 ± 2 MPa.
Figure 11 indicates a linear dependence with a high coefficient of determination between the values of the static modulus of deformation within the measurement cycles determined by the test procedure of the Slovak Railways on the surface of the partial structural layers of the crushed aggregate of 0/31.5 mm.
Measurement uncertainty for each partial design layer of 0/31.5 mm crushed aggregate ranged from ±1.336 MPa to ±8.118 MPa, with measurement uncertainty increasing with increasing design layer thickness. The highest values of measurement uncertainty were obtained for the first measurement cycle.
Figure 12 indicates a polynomial dependence with a high value of the coefficient of determination R2 between the values of the static modulus of deformation within the individual measurement cycles determined by the DB A.G. test procedure on the surface of the partial structural layers of crushed aggregate of 0/31.5 mm. In the case of partial structural thicknesses of crushed aggregate 150 mm and 300 mm, the maximum value of the normal stress acting under the load plate of 0.5 MN∙m−2 was not applied, but the value of the applied normal stress depended on the settlement of the load plate. The value of the normal stress when the settlement of the load plate was close to 5 mm was used. Measurement uncertainty for the individual partial structural layers of the crushed aggregate of 0/31.5 mm ranged from ±0.945 MPa to ±5.060 MPa, with the measurement uncertainty increasing with increasing structural layer thickness and the highest values of measurement uncertainty were obtained in the first measurement cycle.
The change in the value of the correlation coefficient from the growing value of the deformation resistance of the sub-ballast layers caused by the increase in the design thickness of the sub-ballast layer of crushed aggregate fr. 0/31.5 mm for all three measurement cycles can be seen in Figure 13.
Figure 13 indicates that the value of the static modulus of deformation Edef,SR = 25.11 MPa determined on the surface of the partial structural layer of crushed aggregate of thickness 150 mm fr. 0/31.5 mm in the first measurement cycle by the SR test procedure is approx. 1.14 times higher than the value of the static modulus of deformation for the identical partial structural layer by the DB A.G. test procedure. Figure 13 also reveals that the value of the correlation coefficient in all three measurement cycles gradually increases until a value of the static modulus of deformation of approx. Edef,SR = 70 MPa is reached and then starts to decrease again. In the case of a 750 mm thick structural layer of 0/31.5 mm crushed aggregate, the correlation coefficient is virtually equal to one, and thus the values of the static modulus of deformation measured by the two test procedures are nearly identical. After considering the values of the static modulus of deformation from all measurement cycles (first to third measurement cycle), it was finally possible to establish the final correlation dependence between the examined test procedures, depicted in Figure 14.
Figure 14 confirms that the coefficient of determination R2 reaches a high value, and the correlation dependence can thus be considered nearly perfect. The relationship presented in Figure 14 can therefore be used to convert the value of the static modulus of deformation of the layer made of a crushed aggregate of fr. 0/31.5 mm (for the case of dolomitic rocks) determined by the test procedure of SR to its value in the case of the application of the test procedure of DB A.G. or vice versa.

3.2. Numerical Verification of the Static Load Test Stand Situation

The computational model was developed to verify the experimentally measured data. Its further use is clearly defined by the possibility of variable modifying of individual inputs, thus generating predictive behaviour of the modelled section. In this case, it is a static analysis, where the response in the form of deformations and stresses on the numerical model is monitored from the moment of loading the modelled circular plate. The modelled region, as well as the material parameters, were adopted from Section 2 for this purpose. The modelled element was a boundary layer whose properties are described in Table 2. The geometrical parameters were considered as indicated in Figure 5 and Figure 6. The subgrade surface was modelled in the form of elastic support in the vertical direction for all unloaded boundary surfaces. The lateral boundary areas were also elastically supported in the perpendicular directions, with the value of unit stiffness per area reduced by approximately 20%, as is normally considered for a local-type model. Stress and strain response in the wider environment was therefore not monitored. Loads of the circular plates were successively applied to the computational model according to the two standardised methods presented in Section 2. The computational model and its networking can be seen in Figure 15. For the computational model, the elastic constants varied according to the results presented in Figure 11 and Figure 12 as part of the sensitivity analysis, which is the focus of this paper. The vertical strain values at the centres of the modelled circular plates were obtained successively, and these were correlated with the measured drop values of the real circular plates recorded in the experimental measurements of the modelled section. A 300 mm diameter circular plate with steel parameters was also modelled separately, and the contact was considered a frictionless interface since the aim was to embed vertical loads to the structure of the rail section during the tests.
The numerical simulation of the load test was based on the results of the numerical model. The model was created in the Visual FEA system [57,58]. The computing system used for the simulation is developed for static, dynamic and other special simulations in engineering. The core method for numerical computations in the software is Finite Element Method (FEM). The numerical model of the load test is created from standard 3D volume elements hexahedron and prism type. The modelled area has dimensions 10 m × 10 m with a square plane shape. The depth of the layer was 0.20 m and 5.0 m. Layer 1 parameters are: modulus of elasticity E1 = 350 MPa; Poisson’s ratio ν1 = 0.3; unit mass ρ1 = 2050 kg∙m−3. The colour of the Layer 1 is blue in Figure 15. Modelled Layer 2 parameters are E2 = 25–120 MPa; Poisson’s ratio ν2 = 0.35; unit mass ρ2 = 2050 kg∙m−3. The colour of Layer 2 is green in Figure 15. Connection between the Layer 1 and Layer 2 systems allows a model with a special FEM element Surface Interface. These elements can take shear flow into account in geotechnical simulations.
The numerical model was constructed from 17,520 six-node hexahedron volume elements. The machine time on a standard PC was approximately 30 s for one nonlinear computational iteration. However, this time increased proportionally with the number of varying parameters in the sensitivity analysis and with the variability of the change in position of the modelled load on the circular plate. Significant amounts of numerically calculated and experimentally measured data were compared.
Due to the scope of the comprehensive problem, a single loading stage for the basic positions of the circular plates with a load of 0.5 MN∙m−2 is depicted in a graphical form. Figure 16 presents the vertical deformation and the highest principal stress as surface isosurfaces. To compare the experiment with numerics, 60 stages of calculation (10 load positions × 6-values of continuous load intensities) were performed for the DB A.G. test procedure and 40 calculation stages (10 load positions × 4-values of continuous load intensities) for the SR test procedure. The main comparison criterion was the values of measured and calculated vertical deflections wmax.
The Visual FEA calculation system was effective as it allowed using both nonlinear analysis and a database of materials for geotechnical calculations. The main advantage of this system is the relativity simple modelling of the geometry using a wide range of modelling utilities. Detailed information about the system with practical examples can be found in the literature [57,58].

4. Conclusions

The aim of the article was to compare the achieved values of the static modulus of deformation using two test (DB A.G. and SR) procedures based on a series of experimental measurements on constructed sub-ballast layers of the railway track (Figure 5 and Figure 6) and the subsequent development of FEM numerical models. From the literature review and the results of experimental measurements and numerical modelling, it was possible to draw the following conclusions:
  • The test procedures rely on an identical theoretical background (Boussinesq’s elastic half-space theory). As can be seen from Section 2.1, the difference starts from relation (6), where different values of the stress distribution factor f are considered in the different test procedures and then a different procedure is applied to determine the settlement of the load plate under different values of the maximum normal stress.
  • Based on the test procedures presented in Section 2.1.1 and Section 2.1.2, the main differences between both test procedures (DB A.G. versus the SR procedure) include the magnitude of the applied maximum stress acting on the circular load plate (0.5 MN∙m−2 versus 0.2 MN∙m−2), the method of recording the load plate drop (in a regular time step of 120 s versus after the plate drop has stabilized, max. 0.02 mm/1 min) and the method of calculating the value of the static modulus of deformation (relation (9) versus relation (12)).
  • In the case of the application of the SR test procedure, it is possible to establish a linear dependence between the values of the static modulus of deformation determined for different design thicknesses of the sub-ballast layer of crushed aggregate 0/31.5 mm with a high value of determination R2 (Figure 11). In the case of the application of the DB A.G. test procedure, the application of a polynomial dependence is preferable (Figure 12), which is probably due to the application of a different value of the maximum stress acting on the rigid circular load plate. For structural crushed aggregate layers of thickness tCA ≤ 300 mm, the maximum stress acting on the circular plate was determined based on the maximum allowable settlement of the circular plate of 5 mm).
  • In the case of application of a large structural thickness of the crushed aggregate layer (tCA approx. 750 mm), a correlation coefficient between the values of the static modulus of deformation determined by the test procedure of the German Railways and the test procedure of the Slovak Railways (Figure 13) equal to one can be considered. In this case, it is no longer assumed that the determined value of the static modulus of deformation is influenced by the deformation resistance of the subgrade surface. The highest value of the correlation coefficient (approx. 1.5, see Figure 13) was obtained for values of the static modulus of deformation of approx. 70 MPa (value determined in the case of a tCA of approx. 350–400 mm of the design thickness of the sub-ballast layer of crushed aggregate using the SR test procedure, see Figure 11). In this case, it is assumed that the deformation resistance of the subgrade surface is nearly unaffected by the static tests carried out according to the SR test procedure, in contrast to the static tests conducted according to the DB A.G. test procedure (application of 2.5 times the maximum stress on the surface of the rigid circular load plate).
  • A statistical evaluation of 300 measured values of the static modulus of deformation (150 values using the SR test procedure and 150 values using the DB A.G. test procedure) for 3 different cases of the deformation resistance of the subgrade surface (E0 = 10 ± 2 MPa, E0 = 20 ± 2 MPa and E0 = 30 ± 2 MPa) has produced the final relationship between the static moduli of deformation determined by both test procedures, which can be seen in Figure 14. However, the validity of this relationship needs to be verified for other fractions (0/45, 0/63, 0/90 and 0/125 mm) or types (rock origin) of crushed aggregate and subgrade.
  • In the framework of the dimensioning of railway lines on the territory of the Slovak Republic, the static modulus of deformation is currently applied. The department’s future research will assess the possibility of applying the dynamic deformation modulus in the framework of railway line dimensioning.
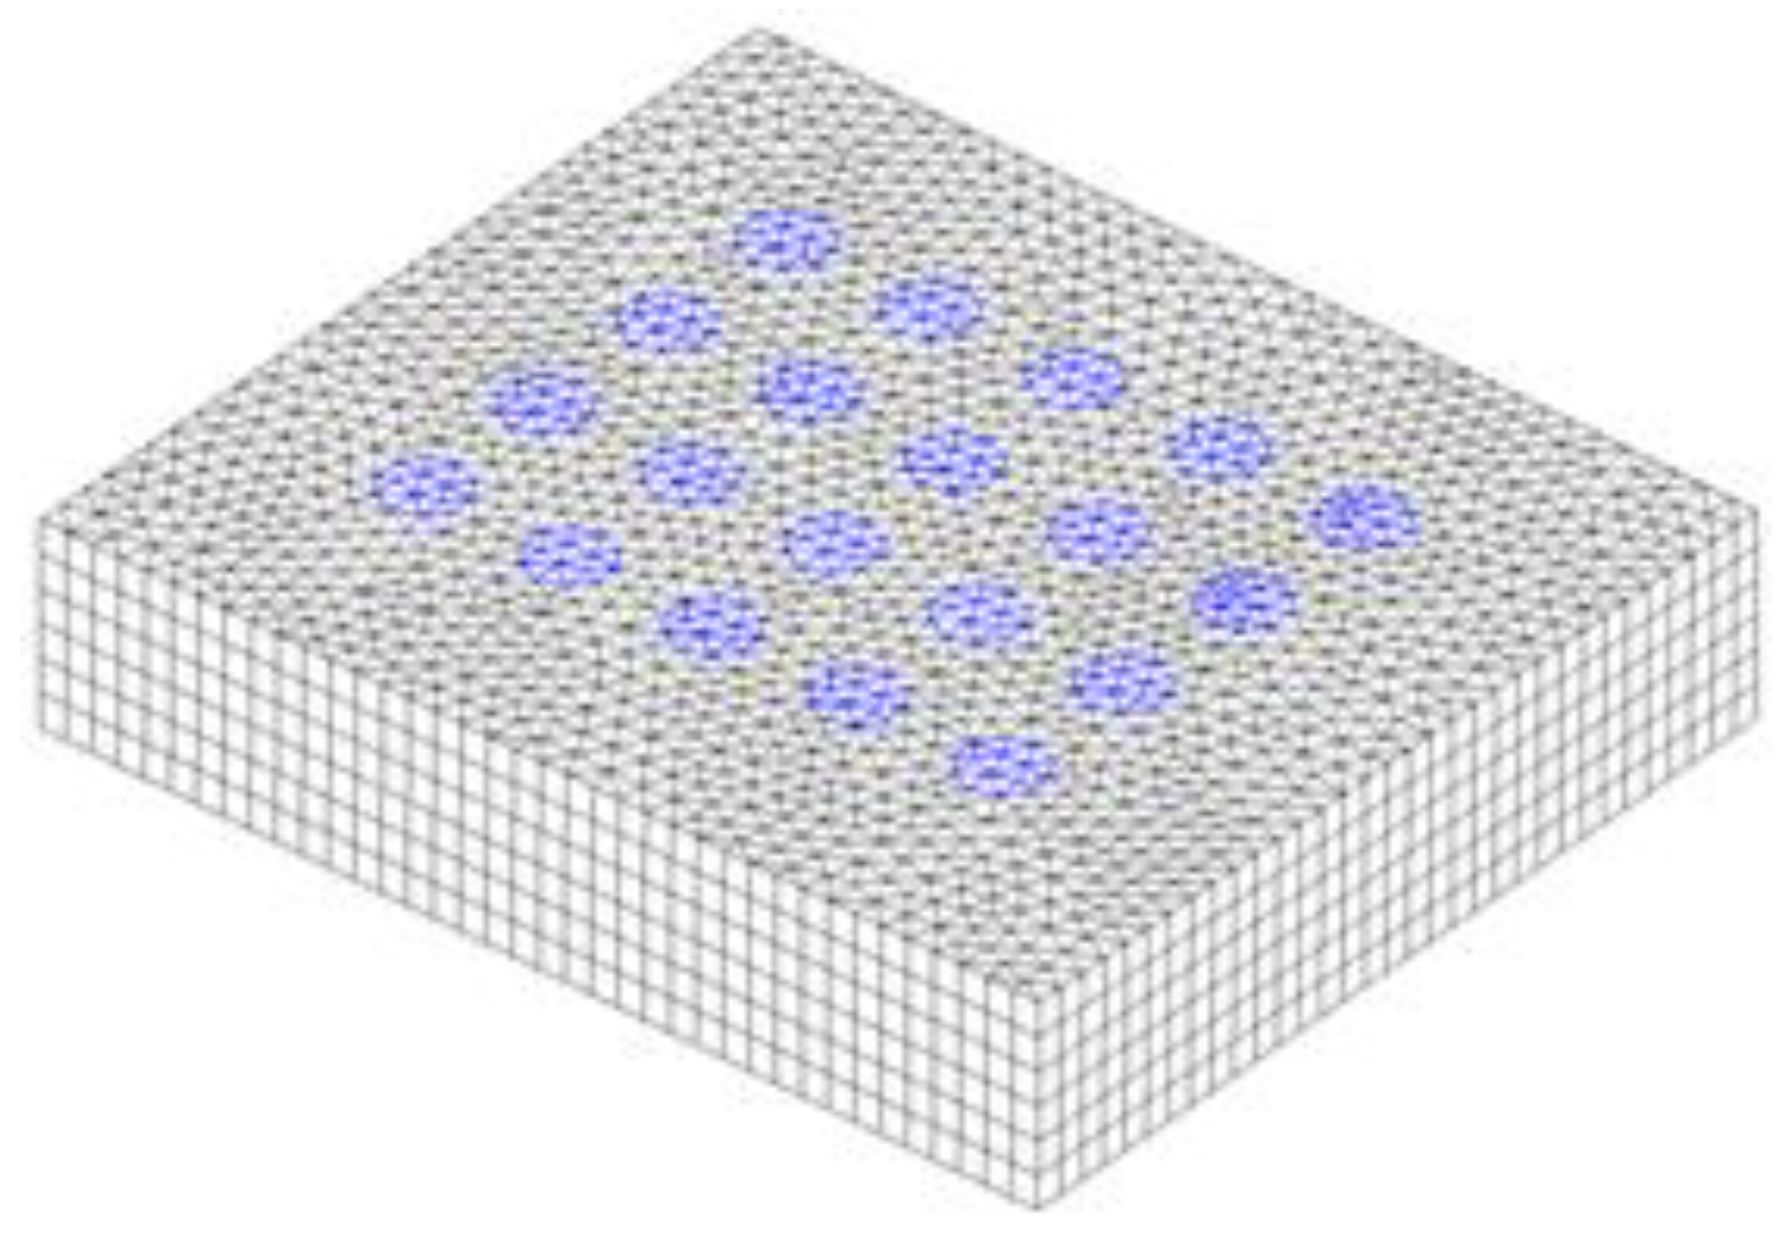
  • Considering the results of the FEM calculations, where the values of the deformation modulus of the modelled layer and its thickness varied, it can be concluded that the higher agreement between the measured and calculated data is an application of the DB A.G. test procedure. By applying the test procedure of the Slovak Railways, the linearised response is due to a relatively lower maximum load and lower number of load stages. From the nature of the changing geometric parameter, it analytically follows that it should be a non-linear response. The higher differences for the Slovak Railways methodology are influenced by the participation of a higher measurement error in the lower response values. Similar results have been presented in studies [59,60].

Author Contributions

Conceptualization, P.D., M.M. and L.I.; methodology, P.D. and M.M.; software, D.P. and P.D.; validation, L.I., P.D. and D.P.; formal analysis, P.D. and D.P.; investigation, L.I.; resources, L.I.; data curation, P.D. and M.M.; writing—original draft preparation, P.D., M.M. and D.P.; writing—review and editing, L.I.; visualization, P.D. and D.P.; supervision, L.I.; project administration, L.I.; funding acquisition, L.I. All authors have read and agreed to the published version of the manuscript.

Funding

This paper was supported under the project of Operational Programme Integrated Infrastructure: Application of innovative technologies focused on the interaction of engineering constructions of transport infrastructure and the geological environment, ITMS2014+ code 313011BWS1. The project is co-funded by the European Regional Development Fund.

Informed Consent Statement

Not applicable.

Data Availability Statement

The data presented in this paper are available on request from the corresponding author. At the time the project was carried out, there was no obligation to make the data publicly available.

Conflicts of Interest

The authors declare no conflict of interest. The funders had no role in the design of the study; in the collection, analysis, or interpretation of data; in the writing of the manuscript; or in the decision to publish the results.

References

  1. Slovak Railway Regulation TS4. Track Substructure—Appendix 6; Directorate General of the Railways of the Slovak Republic: Bratislava, Slovakia, 2018. (In Slovak)
  2. German Standard DIN 18 134; Soil—Testing Procedures and Testing Equipment—Plate Load Test, English Translation. German Institute for Standardization: Berlin, Germany, 2012.
  3. Gorbunov-Posadov, M.I. Calculation of Constructions on a Flexible Base (Rasčet Konstrukcij na Uprogom Osnovanii); SNTL: Praha, Czech Republic, 1957. (In Russian) [Google Scholar]
  4. Boussinesq, M.J. Application des Potentials a L’etude de Deterequilibreet du Mouvements de Solids Elastiques; Gaythier-Villars: Paris, France, 1885. [Google Scholar]
  5. Odemark, N. Investigations as to the Elastic Properties of Soils and Design of Pavements according to the Theory of elasticity. Engineering 1949. [Google Scholar]
  6. Babkov, V.F.; Bykovskij, N.I.; Gerburt-Gejbovič, A.J. Soil Science and Soil Mechanics (Gruntovedenie i Mechanika Gruntov); SNTL: Praha, Czech Republic, 1950. (In Russian) [Google Scholar]
  7. Burmister, D.M. The general theory of stresses and displacements in layered soil systems. III. J. Appl. Phys. 1945, 16, 296–302. [Google Scholar] [CrossRef]
  8. Yoder, E.J.; Witczak, M.W. Principles of Pavement Design; John Wiley & Sons: Hoboken, NJ, USA, 1991. [Google Scholar]
  9. Rappoport, R.M. Approximate Methods for Determining Stresses and Strains in Layered Rock Foundations. In Proceedings of the 2nd ISRM Congress, Belgrade, Yugoslavia, 21–26 September 1970. [Google Scholar]
  10. Johnson, K.L. Contact Mechanics; Cambridge University Press: Cambridge, UK, 1985. [Google Scholar]
  11. Kandaurov, I.I. Mechanics of Granular Media and Its Application in Civil Engineering: Geotechnika—Selected Translations of Russian Geotechnical Literature 6, 1st ed.; Routledge: London, UK, 1991. [Google Scholar] [CrossRef]
  12. Kézdi, Á. Handbook of Soil Mechanics; Elsevier: Amsterdam, The Netherlands, 1974. [Google Scholar]
  13. Novotný, B.; Hanuška, A. Layered Half-Space Theory (Teória Vrstevnatého Polopriesotru); Veda: Bratislava, Slovakia, 1983. [Google Scholar]
  14. Kulhawy, F.H.; Duncan, J.M.; Seed, H.B. Finite Element Analyses of Stresses and Movements in Embankments during Construction: A Report of an Investigation; Waterways Experiment Station: Vicksburg, MI, USA, 1969. [Google Scholar]
  15. Komvopoulos, K. Elastic-Plastic Finite Element Analysis of Indented Layered Media. J. Tribol. 1989, 111, 430–439. [Google Scholar] [CrossRef]
  16. Tian, H.; Saka, N. Finite Element Analysis of an Elastic-Plastic Two-Layer Half-Space: Normal Contact. Wear 1991, 148, 47–68. [Google Scholar] [CrossRef]
  17. Bode, C.; Hirschauer, R.; Savidis, S.A. Soil–structure interaction in the time domain using halfspace Green’s functions. Soil Dyn. Earthq. Eng. 2002, 22, 283–295. [Google Scholar] [CrossRef]
  18. Li, X.; Ekh, M.; Nielsen, J.C.O. Three-dimensional modelling of differential railway track settlement using a cycle domain constitutive model. Int. J. Numer. Anal. Methods Geomech. 2016, 40, 1758–1770. [Google Scholar] [CrossRef]
  19. Adam, M.; Pflanz, G.; Schmid, G. Two- and three-dimensional modelling of half-space and train-track embankment under dynamic loading. Soil Dyn. Earthq. Eng. 2000, 19, 559–573. [Google Scholar] [CrossRef]
  20. Sun, H.; Cai, Y.; Xu, C. Three-dimensional steady-state response of a railway system on layered half-space soil medium subjected to a moving train. Int. J. Numer. Anal. Methods Geomech. 2008, 33, 529–550. [Google Scholar] [CrossRef]
  21. Fu, Q.; Zheng, C. Three-Dimensional Dynamic Analyses of Track-Embankment-Ground System Subjected to High Speed Train Loads. Sci. World J. 2014, 2014, 924592. [Google Scholar] [CrossRef] [Green Version]
  22. Sayeed, M.A.; Shahin, M.A. Design of ballasted railway track foundations using numerical modelling. Part I: Development. Can. Geotech. J. 2018, 55, 353–368. [Google Scholar] [CrossRef] [Green Version]
  23. Wattanapanalai, T. A 3D Numerical Analysis of the Railway to Compare the Performance of the Granular and Asphalt Trackbeds. Master´s Thesis, University of Louisville, Louisville, KY, USA, 2018. [Google Scholar] [CrossRef]
  24. Pospisil, K.; Zednik, P. Geosynthetics Limitations for Bearing Capacity Increase. In Proceedings of the International Conferences on the Bearing Capacity of Roads, Railways and Airfields, Trondheim, Norway, 27–30 June 2005. [Google Scholar]
  25. Shirvani, R.A.; Shooshpasha, I. Experimental Study on Load-Settlement Behaviour of Cement Stabilised Footing with Different Dimensions on Sandy Soil. Arab. J. Sci. Eng. 2015, 40, 397–406. [Google Scholar] [CrossRef] [Green Version]
  26. Ismael, N.F. Loading Tests on Circular and Ring Plates in Very Dense Cemented Sands. J. Geotech. Eng. 1996, 122, 281–287. [Google Scholar] [CrossRef]
  27. Wyroslak, M. Establishing Relationships between Parameters of the Controlled Compaction Soil by Using Various In-Situ Tests. IOP Conf. Ser. Mater. Sci. Eng. 2017, 245, 022041. [Google Scholar] [CrossRef] [Green Version]
  28. Oh, W.T.; Vanapalli, S.K. Scale Effects of Plate Load Tests in Unsaturated Soils. Int. J. GEOMATE 2013, 4, 585–594. [Google Scholar] [CrossRef]
  29. Kim, D.; Park, S. Relationship between the Subgrade Reaction Modulus and the Strain Modulus Obtained Using a Plate Loading Test. In Proceedings of the 9th World Congress on Railway Research, Lille, France, 22–26 May 2011. [Google Scholar]
  30. Neupane, M.; Han, J.; Parsons, R.L. Experimental and Analytical Evaluations of Mechanically-Stabilized Layers with Geogrid over Weak Subgrade under Static Loading. In Proceedings of the Geo-Congress 2020, Minneapolis, MN, USA, 25–28 February 2020. [Google Scholar] [CrossRef]
  31. Pospíšil, J.; Horníček, L.; Lojda, V. Experimental Analysis of Static Plate Load Test According to Czech, French and German Methodology. In Proceedings of the 19th Seminar of Track Management, Poprad, Slovakia, 13–14 October 2022. [Google Scholar]
  32. Ižvolt, L.; Dobeš, P.; Hodás, S. Experimental Monitoring and Numerical Modeling of the Thermal Regime of Selected Track Substructures. Transp. Probl. 2019, 14, 89–100. [Google Scholar] [CrossRef] [Green Version]
  33. Pieš, J.; Môcová, L. Application of TDR Test Probe for Determination of Moisture Changes of Railway Substructure Materials. In Proceedings of the 13th International Scientific Conference on Sustainable, Modern and Safe Transport, Nový Smokovec, Slovakia, 29–31 May 2019. [Google Scholar] [CrossRef]
  34. Decky, M.; Papanova, Z.; Juhas, M.; Kudelcikova, M. Evaluation of the Effect of Average Annual Temperatures in Slovakia between 1971 and 2020 on Stresses in Rigid Pavements. Land 2022, 11, 764. [Google Scholar] [CrossRef]
  35. Ižvolt, L.; Dobeš, P.; Pieš, J. Updating the Design Map of Frost Indexes as a Prerequisite for Relevant Assessment of Track Substructure for Non-Traffic Load. Civ. Environ. Eng. 2018, 14, 116–123. [Google Scholar] [CrossRef] [Green Version]
  36. Hodás, S.; Pultznerová, A. Modelling of Railway Track Temperature Regime with Real Heat-Technical Values for Different Climatic Characteristics. Civ. Environ. Eng. 2017, 13, 134–142. [Google Scholar] [CrossRef] [Green Version]
  37. Hodás, S.; Pultznerová, A. Freezing of the Subballast Layers of the Railway Formation—High Embankment and Double Track. Civ. Environ. Eng. 2019, 15, 5–12. [Google Scholar] [CrossRef] [Green Version]
  38. Izvolt, L.; Dobes, P.; Drusa, M.; Kadela, M.; Holesova, M. Experimental and Numerical Verification of the Railway Track Substructure with Innovative Thermal Insulation Materials. Materials 2021, 15, 160. [Google Scholar] [CrossRef]
  39. Decky, M.; Hodasova, K.; Papanova, Z.; Remisova, E. Sustainable Adaptive Cycle Pavements Using Composite Foam Concrete at High Altitudes in Central Europe. Sustainability 2022, 14, 9034. [Google Scholar] [CrossRef]
  40. Drusa, M.; Vlček, J.; Scherfel, W.; Sedlář, B. Testing of foam concrete for definition of layer interacting with subsoil in geotechnical applications. Int. J. GEOMATE 2019, 17, 115–120. [Google Scholar] [CrossRef]
  41. Valaskova, V.; Vlcek, J. Determination of the deformation characteristics of the foam concrete as a sub-base. J. Vibroeng. 2021, 23, 156–166. [Google Scholar] [CrossRef]
  42. Gago, F.; Valletta, A.; Mužík, J. Formulation of a Basic Constitutive Model for Fine—Grained Soils Using the Hypoplastic Framework. Civ. Environ. Eng. 2021, 17, 450–455. [Google Scholar] [CrossRef]
  43. Bulko, R.; Gago, F. Deformation parameters of soils determined by the cone penetration test. In Proceedings of the 26th Russian-Polish–Slovak Seminar 2017: Theoretical Foundation of Civil Engineering, Warsaw, Poland, 21–25 August 2017. [Google Scholar] [CrossRef]
  44. Gago, F.; Vlcek, J.; Valaskova, V.; Florkova, Z. Laboratory Testing of Kinetic Sand as a Reference Material for Physical Modelling of Cone Penetration Test with the Possibility of Artificial Neural Network Application. Materials 2022, 15, 3285. [Google Scholar] [CrossRef] [PubMed]
  45. Bulko, R.; Masarovičová, S. Effect of Lime Filling on the Compactibility of Clay Soils. Civ. Environ. Eng. 2022, 18, 501–506. [Google Scholar] [CrossRef]
  46. Hodas, S.; Izvoltova, J.; Chromcak, J.; Bacova, D. Monitoring the Geometric Position of Transition Zones to Increase the Quality and Safety of Railway Lines. Appl. Sci. 2022, 12, 6038. [Google Scholar] [CrossRef]
  47. Hodas, S.; Pultznerova, A.; Izvoltova, J. Protection of Structural Layers of Transitions Zones on Railways against Freezing, Using Materials with a Low Coefficient of Thermal Conductivity. Buildings 2022, 12, 821. [Google Scholar] [CrossRef]
  48. Dižo, J.; Blatnický, M.; Harušinec, J.; Suchánek, A. Assessment of Dynamics of a Rail Vehicle in Terms of Running Properties While Moving on a Real Track Model. Symmetry 2022, 14, 536. [Google Scholar] [CrossRef]
  49. Dižo, J.; Blatnický, M. Influence of stiffness characteristics of a railway track on output parameters in a multibody model. In Proceedings of the 7th International Conference of Materials and Manufacturing Engineering, Thessaloniki, Greece, 2–3 July 2020. [Google Scholar] [CrossRef]
  50. Briaud, J.L. Geotechnical Engineering: Unsaturated and Saturated Soils, 1st ed.; John Wiley & Sons: Hoboken, NJ, USA, 2013. [Google Scholar]
  51. Andresdottir, H. Plate Load Testing. Effects of in Situ Conditions, Test Procedure and Calculation Method. Master’s Thesis, Norwegian University of Science and Technology, Trondheim, Norwegian, 2019. [Google Scholar]
  52. Plate Load Test. Geo Eksperts. Available online: https://www.geoeksperts.lv/services/plate-load-test/ (accessed on 14 December 2022).
  53. Slovak Technical Standard STN 72 1001; Classification of Soil and Rock. Slovak Office of Standards, Metrology and Testing: Bratislava, Slovakia, 2010. (In Slovak)
  54. Slovak Technical Standard STN 72 1014; Laboratory Determination of Liquid Limit—Casagrande Method. Slovak Office of Standards, Metrology and Testing: Bratislava, Slovakia, 2013. (In Slovak)
  55. Slovak Technical Standard STN EN ISO 17892-12; Geotechnical Investigation and Testing—Laboratory Testing of Soil—Part 12: Determination of Liquid and Plastic Limits. Slovak Office of Standards, Metrology and Testing: Bratislava, Slovakia, 2019. (In Slovak)
  56. Slovak Technical Standard STN EN 933-1; Tests for Geometrical Properties of Aggregates—Part 1: Determination of Particle Size Distribution—Sieving Method. Slovak Office of Standards, Metrology and Testing: Bratislava, Slovakia, 2012. (In Slovak)
  57. Lee, J.Y.; Ryu, H.-R. Interactive simulation of eigenmodes for instruction of finite element behavior. Comput. Appl. Eng. Educ. 2015, 23, 872–886. [Google Scholar] [CrossRef]
  58. Cook, R.D.; Intuition Software. VisualFEA and General User Manual; John Wiley and Sons Inc.: Hoboken, NJ, USA, 2001. [Google Scholar]
  59. Mackiewicz, P.; Krawczyk, B. Identification of Parameters and Fatigue Life Assessment of the Road Pavement Lower Construction Layers under Heavy Construction Traffic. Materials 2022, 15, 5646. [Google Scholar] [CrossRef] [PubMed]
  60. Gong, J.; Han, E.-S.; Park, S.-K.; Cho, D. Evaluation of Long-Term Performance for Bonded Natural Stone Pavement Using Accelerated Pavement Test [Part II: Skid Resistance, Response of Deflection and FEM Analysis]. Appl. Sci. 2020, 10, 879. [Google Scholar] [CrossRef] [Green Version]
Figure 1. Test stand DRETM.
Buildings 13 02016 g001
Figure 2. Loading of a half-space by a lone force [4].
Buildings 13 02016 g002
Figure 3. Load settlement curve [2]. Legend: 1: Line connecting point (0.01 MN∙m−2; 0 mm) and the first point from the first loading cycle; 2: First point from the first loading cycle; 3: Secant between 0.3 ∙ σ0max and 0.7 ∙ σ0max; 4: Quadratic parabola between the first and the last point from the first loading cycle; 5: Quadratic parabola between the first and the last point from the second loading cycle; 6: First point from the second loading cycle; s: Settlement in mm; σ0: Normal stress in MN∙m−2; ◦: Measurement points from the first loading cycle; □: Measurement points from the unloading cycle; ∆: Measurement points from the second loading cycle.
Buildings 13 02016 g003
Figure 4. Static load assembly [52].
Buildings 13 02016 g004
Figure 5. Experimental field—plan and method of implementing experimental measurements.
Buildings 13 02016 g005
Figure 6. Experimental field—cross section AA’.
Buildings 13 02016 g006
Figure 7. Grain-size curve of the subgrade material.
Buildings 13 02016 g007
Figure 8. Subgrade sampling from the experimental field—roller test.
Buildings 13 02016 g008
Figure 9. Preparation of the sub-ballast material in the quarry (left), sampling and implementation of the pit test (right).
Buildings 13 02016 g009
Figure 10. Grain-size curve of the sub-ballast material (crushed aggregate fr. 0/31.5 mm).
Buildings 13 02016 g010
Figure 11. Dependence of the increase in deformation resistance of the sub-ballast layers on the thickness of the sub-ballast layer of crushed aggregate 0/31.5 mm—SR test procedure.
Buildings 13 02016 g011
Figure 12. Dependence of the increase in deformation resistance of the sub-ballast layers on the thickness of the sub-ballast layer of crushed aggregate 0/31.5 mm—test procedure of DB A.G.
Buildings 13 02016 g012
Figure 13. Dependence of the correlation coefficient.
Buildings 13 02016 g013
Figure 14. Final correlation dependence between the values of static modulus of deformation determined by the test procedure of the German Railways and the test procedure of the Slovak Railways.
Buildings 13 02016 g014
Figure 15. The FEM model of the load test with mesh.
Buildings 13 02016 g015
Figure 16. The FEM model results for variable load stages position.
Buildings 13 02016 g016
Table 1. Values of the stress distribution factor f used for the calculation of the modulus of elasticity of the soil in the implementation of the static load plate test [51].
Assumed Stress DistributionStress Distribution Factor f
Uniform distribution2
Load distributed through a rigid plate π 2
Parabolic distribution in coarse-grained soils 8 3
Parabolic distribution in fine-grained soils 4 3
Table 2. Classification and basic characteristics of subgrade and the sub-ballast layer.
Soil Typew
(%)
ρ
(kg∙m−3)
Cc
(-)
Cu
(-)
wL
(%)
wP
(%)
Ip
(-)
Ic
(-)
Gravelly clay16.321140.14114.9839.018.820.21.12
Gravel2.62176-23.86----
Disclaimer/Publisher’s Note: The statements, opinions and data contained in all publications are solely those of the individual author(s) and contributor(s) and not of MDPI and/or the editor(s). MDPI and/or the editor(s) disclaim responsibility for any injury to people or property resulting from any ideas, methods, instructions or products referred to in the content.

