

Post-Handover Housing Quality Management and Standards in Korea


Abstract
:1. Introduction
2. Literature Study
2.1. Definition of Housing Quality
2.2. Quality Control Chart
2.3. Quality Failure
2.4. Quality Issue
3. Materials and Methods
3.1. Data Collection
3.2. Cost Value Adjustment
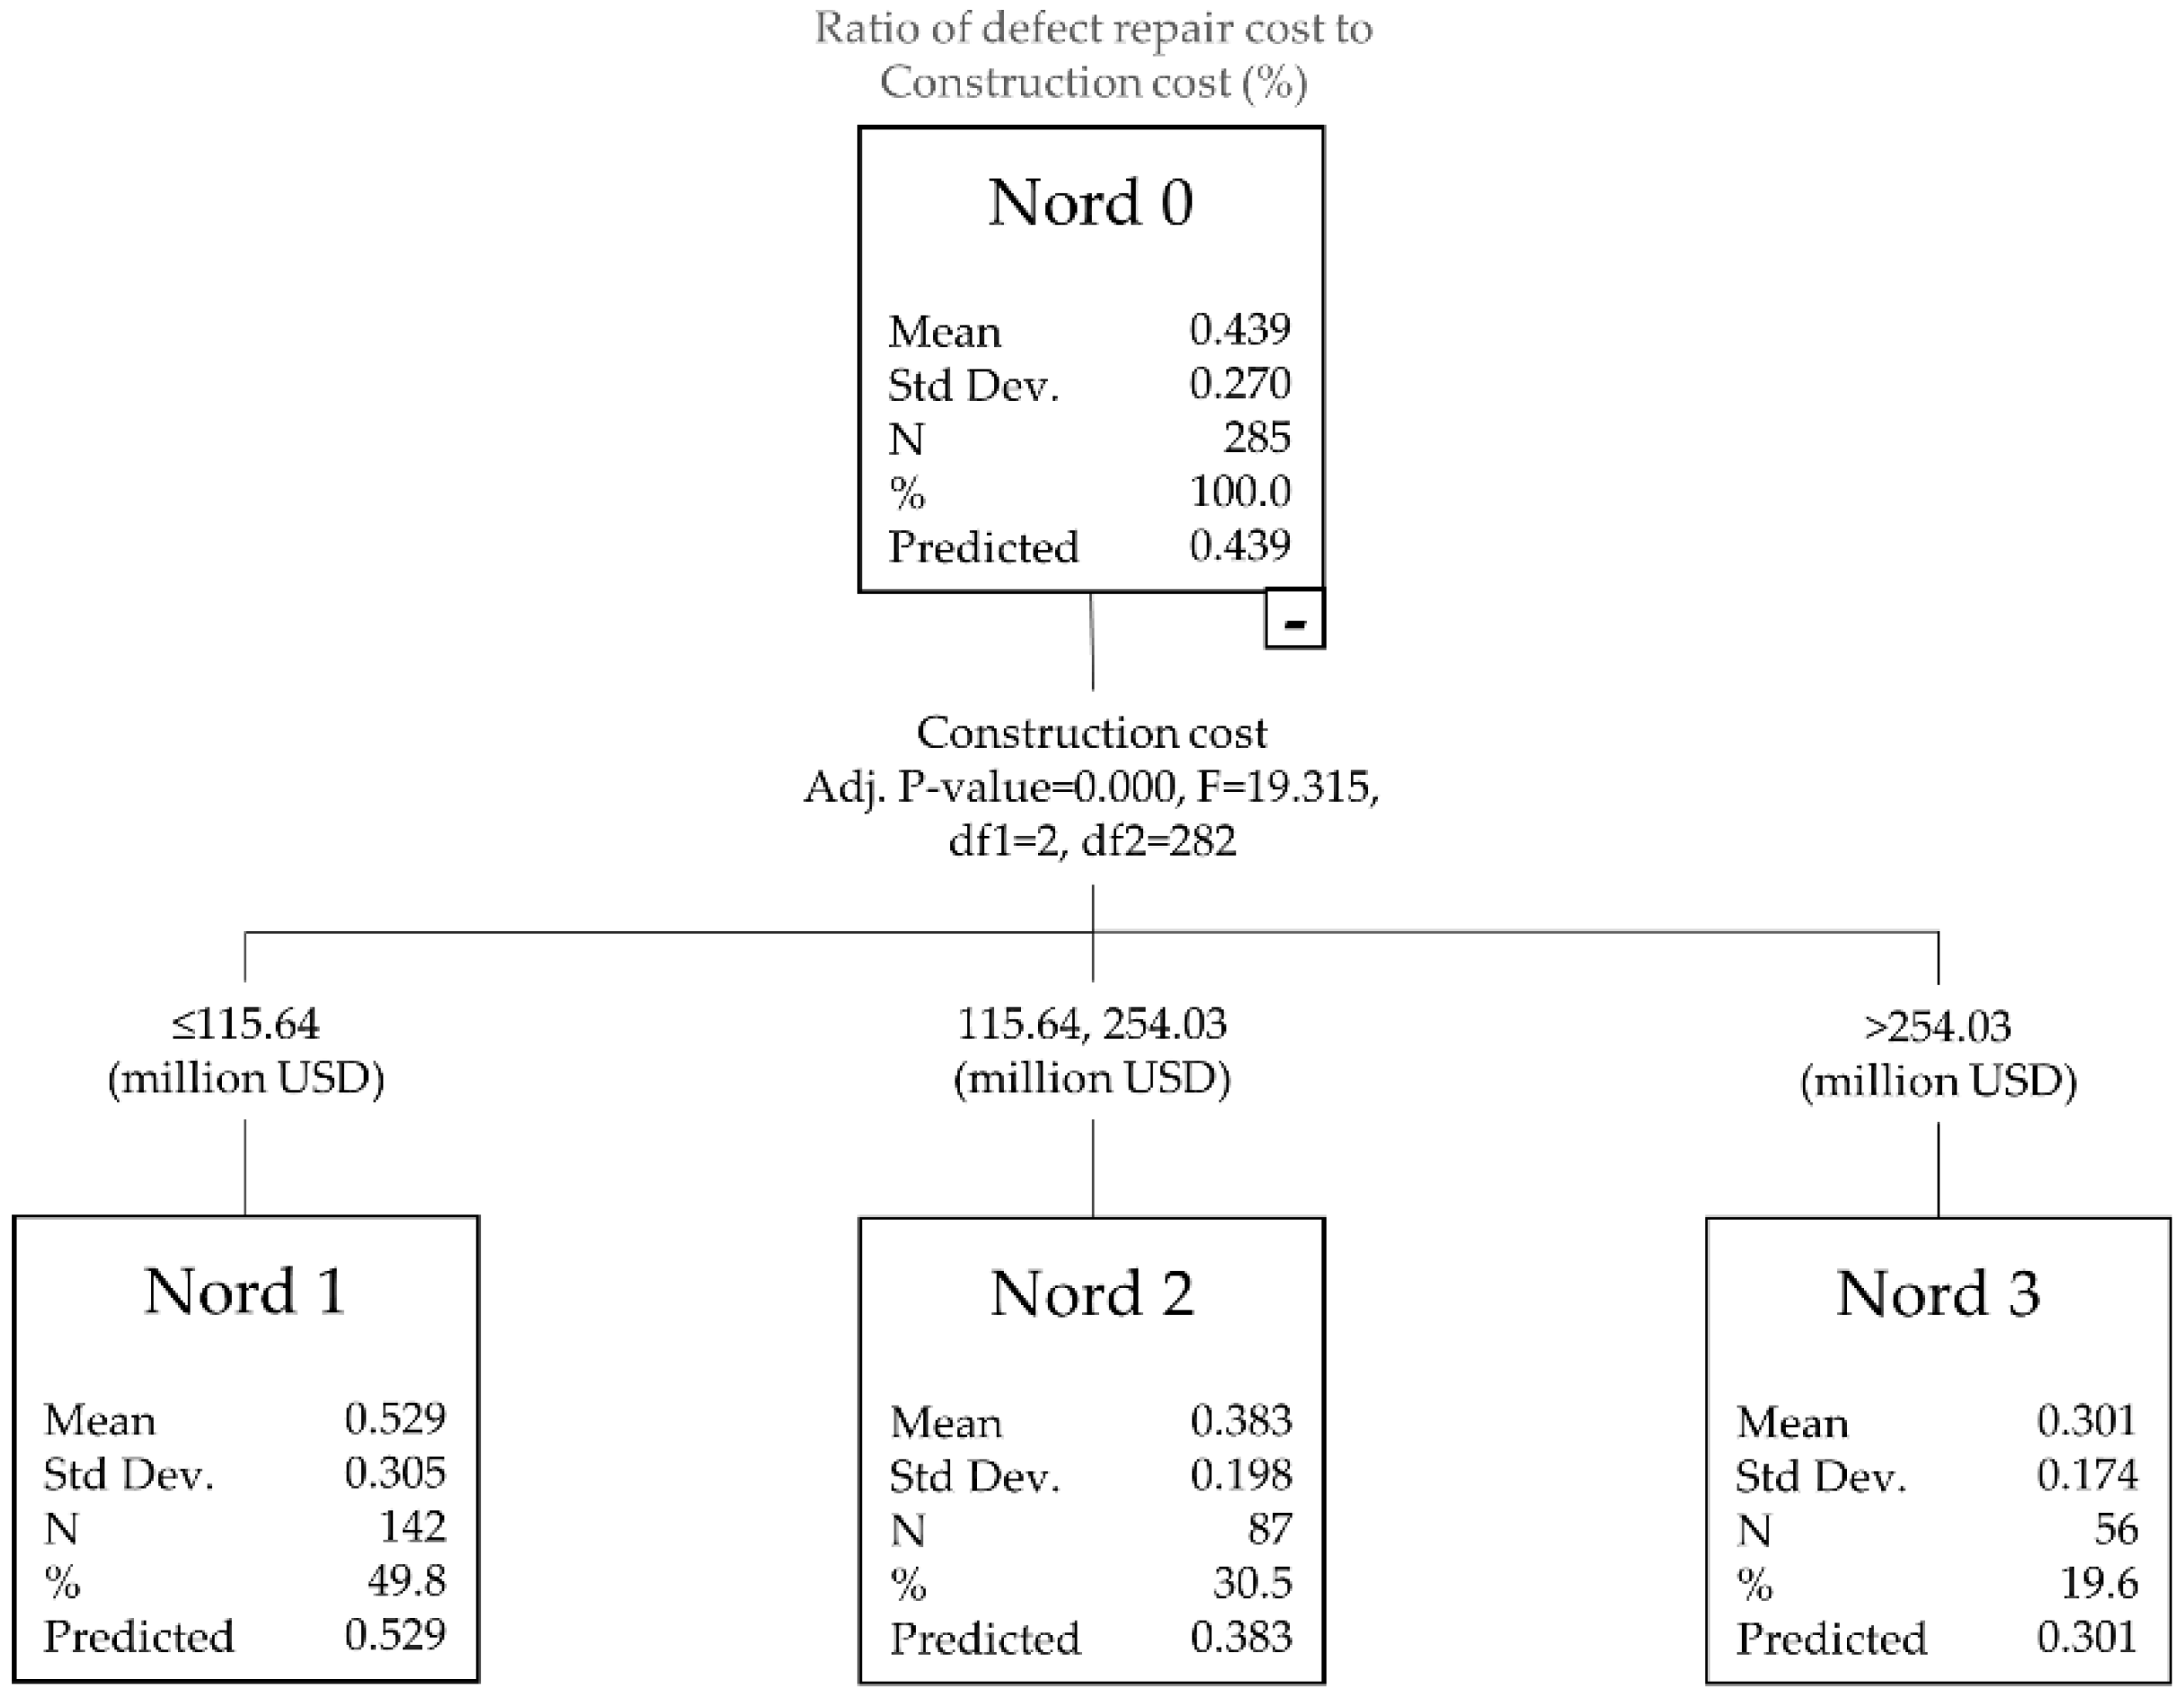
3.3. Classification to Groups
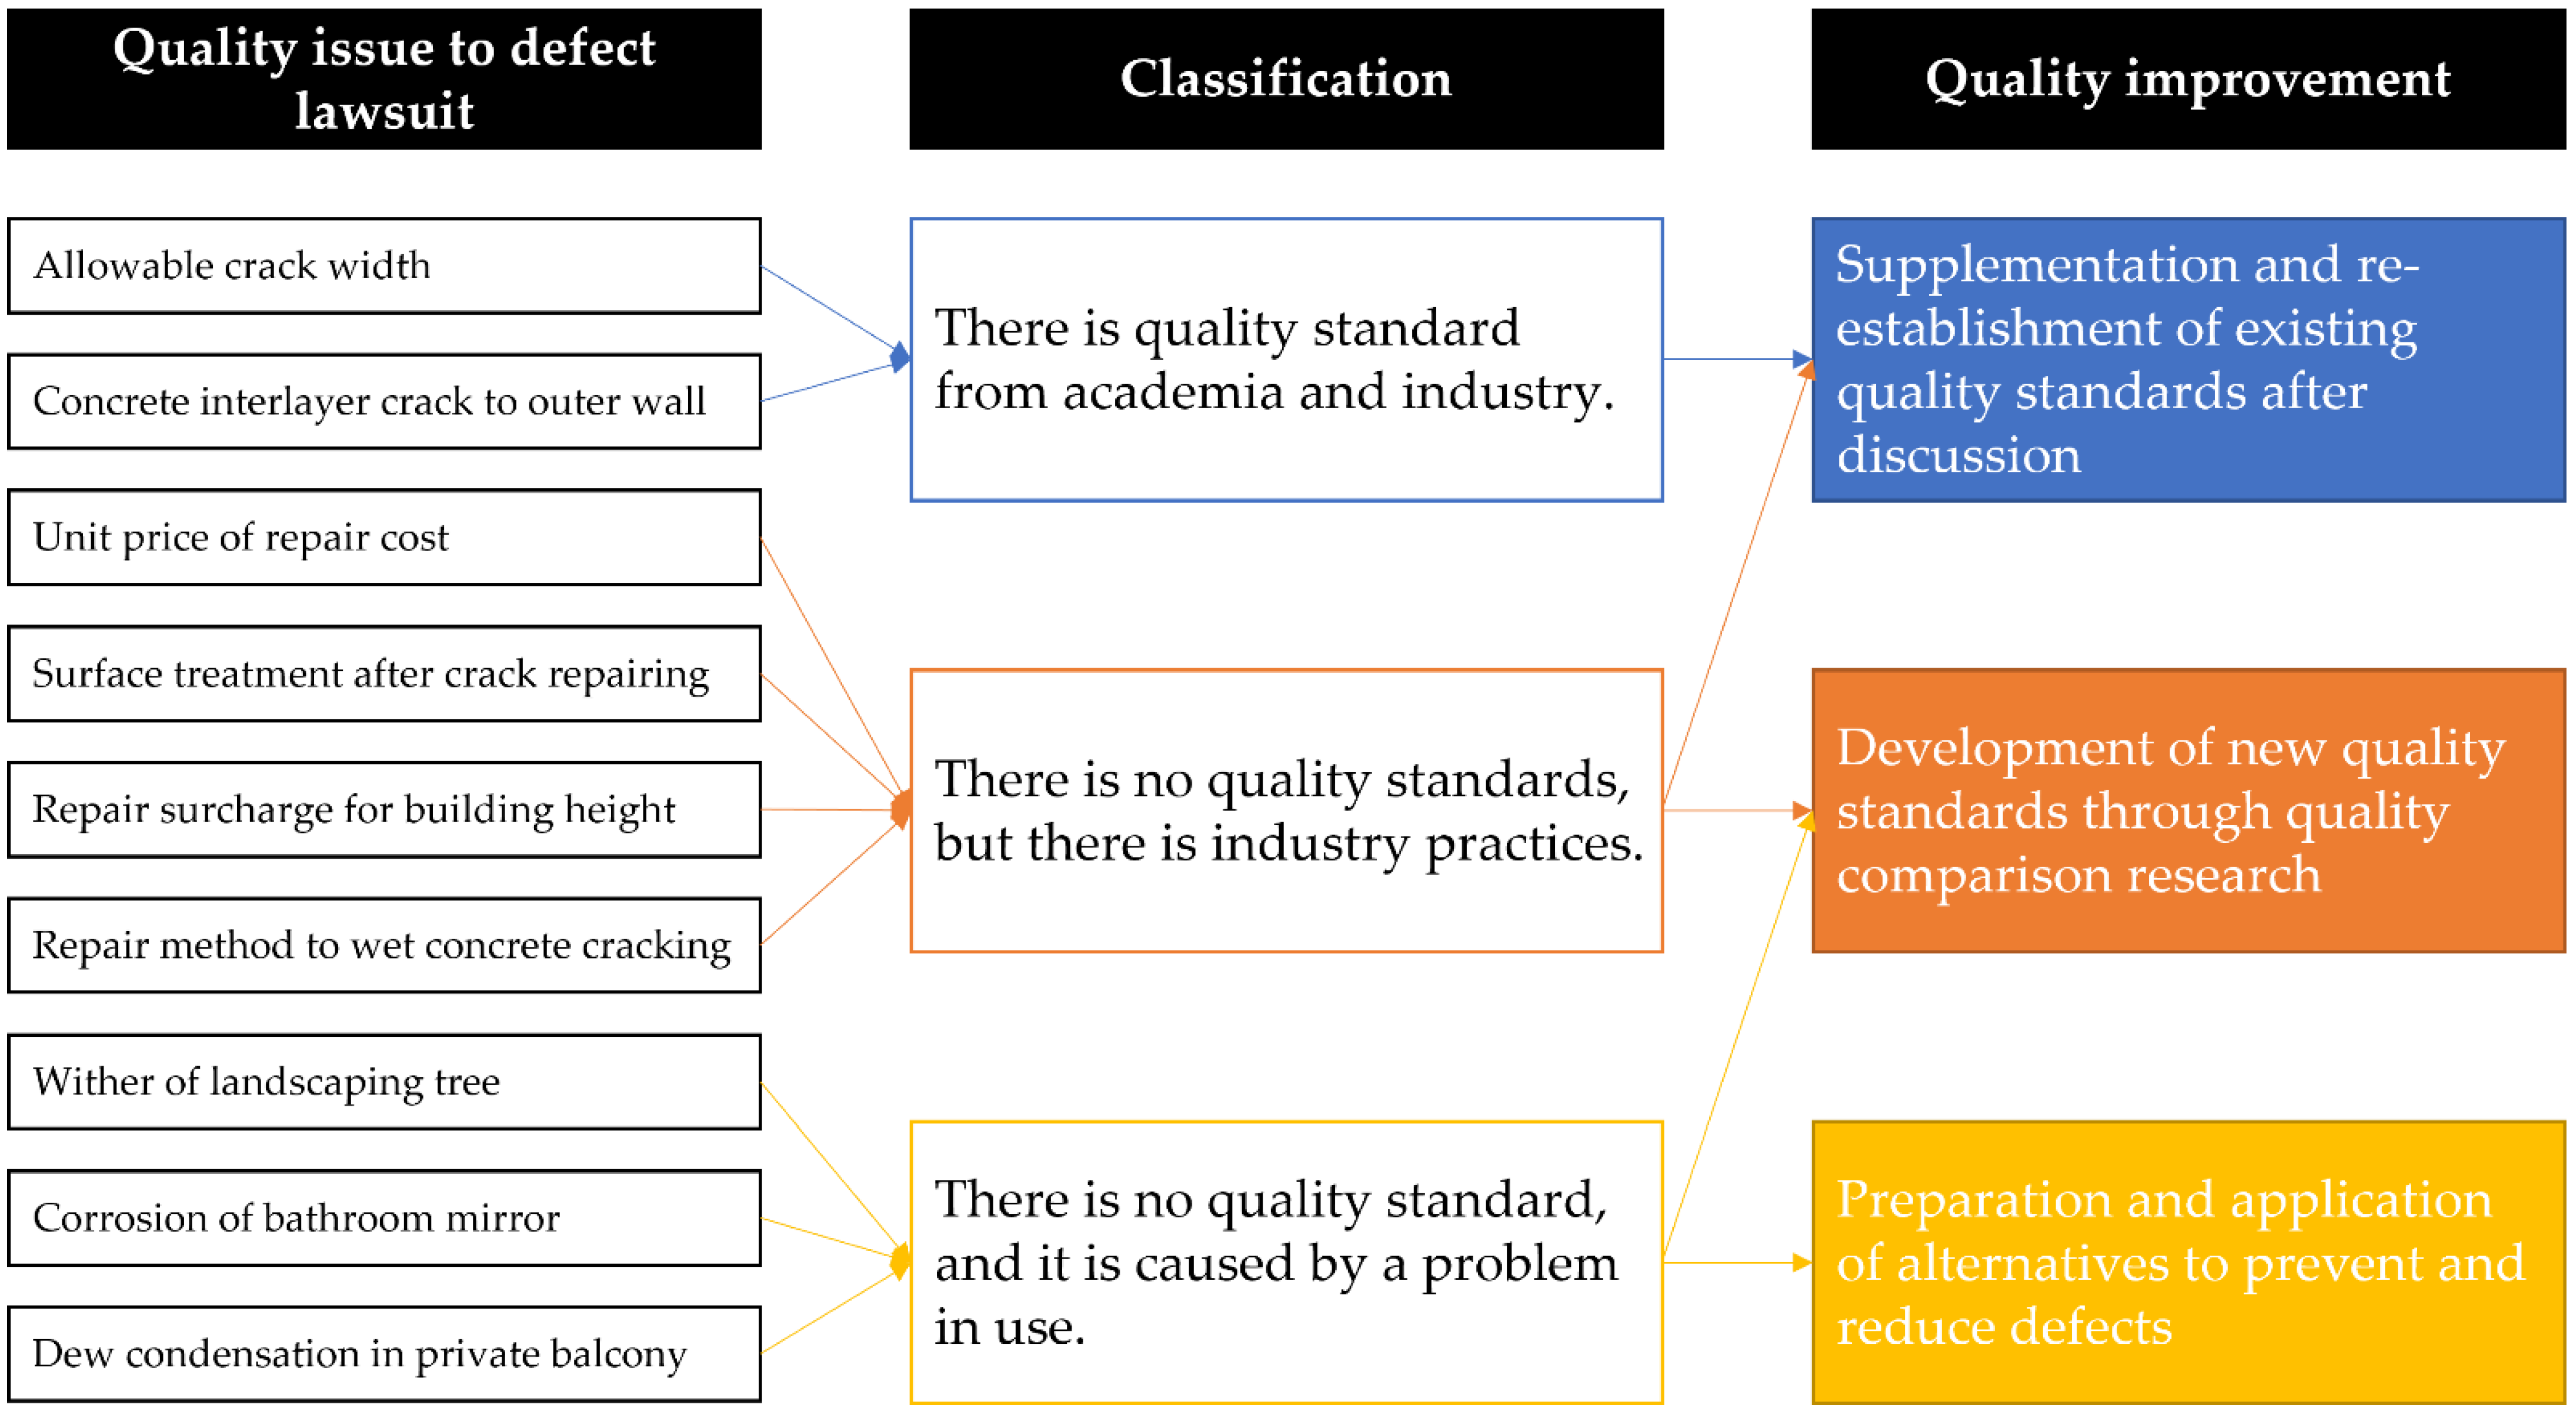
3.4. Review on Quality Issue
4. Results
4.1. Comparison of Quality
4.2. Quality Issue to Failure
4.2.1. Concrete Cracks
- (1)
- Should the allowable crack width be recognized as a criterion for determining defects?
- (2)
- Should a concrete interlayer crack to the outer wall be recognized as a defect?
- (3)
- What should be recognized as the unit price of repair cost?
- (4)
- Is surface treatment after crack repair necessary?
- (5)
- Should a repair surcharge for building height be applied to crack repair work?
- (6)
- Which one should be applied as a repair method to wet concrete cracks?
4.2.2. Other Issues
- (1)
- Wither of trees:
- (2)
- Corrosion of bathroom mirror:
- (3)
- Dew condensation on private balconies.
4.3. Review Results of Technical Dispute
5. Discussion
5.1. Housing Quality Management
5.2. Consumer-Centered Housing Quality Standard
6. Conclusions
Author Contributions
Funding
Institutional Review Board Statement
Informed Consent Statement
Data Availability Statement
Conflicts of Interest
References
- OECD Directorate of Employment, Labour and Social Affairs—Social Policy Division. HC1.4. Satisfaction with Housing; Organization for Economic Cooperation and Development: Paris, France, 2021; Available online: https://www.oecd.org/social/HC1-4-Satisfaction-with-Housing.pdf (accessed on 31 January 2023).
- Sinha, C.; Sarkar, S.; Mandal, N. An Overview of Key Indicators and Evaluation Tools for Assessing Housing Quality: A Literature Review. J. Hous. Built Environ. 2017, 98, 337–347. [Google Scholar] [CrossRef]
- Sheppard, C.; Pattni, N.; Gunasegaran, T.; Austen, A.; Hitzig, S. Housing Satisfaction Among Older Adults Living in Low-Income Seniors’ Housing. J. Gerontol. Soc. Work. 2022, 66, 134–151. [Google Scholar] [CrossRef] [PubMed]
- Perez-Bezos, S.; Grijalba, O.; Hernandez-Minguillon, R. Multifactorial Approach to Indoor Environmental Quality Perception of Social Housing Residents in Northern Spain. Build. Res. Inf. 2022, 51, 392–410. [Google Scholar] [CrossRef]
- Kuo, K.; Sun, J. Ambient Vibration Measurements and Seismic Evaluation of Historical Japanese-style Wooden Offices in Taiwan. J. Asian Archit. Build. Eng. 2018, 16, 349–356. [Google Scholar] [CrossRef] [Green Version]
- Hartung, A. Does Housing Market Segmentation Ensure Families a Rental Price Benefit? The example of Frankfurt, Germany. Hous. Stud. 2022. [Google Scholar] [CrossRef]
- Kumar, T. The Housing Quality, Income, and Human Capital Effects of Subsidized Homes in Urban India. J. Dev. Econ. 2021, 153, 102738. [Google Scholar] [CrossRef]
- The National Association of Home Builders of the United States. Best of 55+ Housing Awards. Available online: https://www.nahb.org/nahb-community/awards/best-of-55-plus-housing-awards (accessed on 31 January 2023).
- Florian, M.C. French Architect Renée Gailhoustet Receives the 2022 Royal Academy Architecture Prize; ArchDaily: Santa Barbara, CA, USA, 2022; Available online: https://www.archdaily.com/982903/french-architect-renee-gailhoustet-receives-the-2022-royal-academy-architecture-prize (accessed on 19 April 2023).
- Rightmove. House Prices in The City. Available online: https://www.rightmove.co.uk/house-prices/the-city.html (accessed on 19 April 2023).
- Build Method Construction. How Much Does It Cost to Build a House in Los Angeles? Available online: https://buildmethodconstruction.com/cost-to-build-a-house-in-los-angeles/#:~:text=Cost%20Per%20Square%20Foot%20To%20Build%20A%20House%20in%20Los%20Angeles&text=Presently%2C%20the%20cost%20of%20constructing,%24150%20to%20%24350%20in%202022 (accessed on 19 April 2023).
- Money today. Apartment Prices in Seoul Rise Again. Available online: https://news.mt.co.kr/mtview.php?no=2023041720553788231#:~:text=3%EC%9B%94%20%EA%B8%B0%EC%A4%80%203.3%E3%8E%A1%EB%8B%B9%203062%EB%A7%8C%EC%9B%90&text=17%EC%9D%BC%20%EC%A3%BC%ED%83%9D%EB%8F%84%EC%8B%9C%EB%B3%B4%EC%A6%9D,8200%EC%9B%90%20%EB%8D%94%20%EB%B9%84%EC%8B%B8%EC%A1%8C%EB%8B%A4 (accessed on 19 April 2023).
- Helgesen, M.; Arvesen, P. Policies to Reduce Child Poverty in Norway: Can Municipalities Ensure Positive Functionings for Children through Housing Policies? Societies 2022, 12, 25. [Google Scholar] [CrossRef]
- Gurmu, A.; Krezel, A.; Ongkowijoyo, C. Fuzzy Stochastic Model to Assess Defects in Low-rise Residential Buildings. J. Build. Eng. 2021, 40, 102318. [Google Scholar] [CrossRef]
- Plebankiewicz, E.; Malara, J. Analysis of Defects in Residential Buildings reported During the Warranty Period. Appl. Sci. 2020, 10, 6123. [Google Scholar] [CrossRef]
- Balouchi, M.; Gholhaki, M. Reworks Causes and related Costs in Construction: Case of Parand Mass Housing Project in Iran. Int. J. Qual. Reliab. Manag. 2019, 36, 1392–1408. [Google Scholar] [CrossRef]
- Home Builders Federation. National New Home Customer Satisfaction Survey; Home Builders Federation: London, UK, 2023; Available online: https://www.hbf.co.uk/documents/12362/18th_Survey_CSS_2023_Completions_October_2021_-_September_2022.pdf (accessed on 19 April 2023).
- Pan, W.; Thomas, R. Defects and Their Influencing Factors of Post-handover New-build Homes. J. Perform. Constr. Facil. 2015, 29, 04014119. [Google Scholar] [CrossRef]
- Korea Productivity Center. Current Status to NCSI of Housing Construction Company. Available online: http://www.ncsi.or.kr/score/company.asp?sector=&industry=N0401&sYear=1998&eYear=2022 (accessed on 19 April 2023).
- Apartment Defect Dispute Mediation Committee. Case status. Available online: https://www.adc.go.kr/adms/portal/com/movePage.do (accessed on 31 January 2023).
- Hwang, B.; Thomas, S.; Haas, C.; Caldas, C. Measuring the Impact of Rework on Construction Cost Performance. J. Constr. Eng. Manag. 2009, 135, 187–198. [Google Scholar] [CrossRef]
- Mills, A.; Love, P.; Williams, P. Defect Costs in Residential Construction. J. Constr. Eng. Manag. 2009, 135, 12–16. [Google Scholar] [CrossRef]
- Forcada, N.; Gangolells, M.; Casals, M. Factors Affecting Rework Costs in Construction. J. Constr. Eng. Manag. 2017, 20, 445–465. [Google Scholar] [CrossRef] [Green Version]
- Liu, Q.; Ye, G.; Feng, Y.; Wang, C.; Peng, Y. Case-based Insights into Rework Costs of Residential Building Projects in China. Int. J. Constr. Manag. 2020, 20, 347–355. [Google Scholar] [CrossRef]
- Park, J.; Seo, D. Defect Repair Cost and Home Warranty Deposit, Korea. Buildings 2022, 12, 1027. [Google Scholar] [CrossRef]
- Forcada, N.; Macarulla, M.; Gangolells, M.; Casals, M. Handover Defects: Comparison of Construction and Post-handover Housing Defects. Build. Res. Inf. 2016, 44, 279–288. [Google Scholar] [CrossRef] [Green Version]
- Chisholm, E.; Keall, M.; Bennett, J.; Marshall, A.; Telfar-Barnard, L.; Thornley, L.; Howden-Chapman, P. Why don’t Owners Improve Their Homes? Results from a Survey Following a Housing Warrant-offitness Assessment for Health and Safety. Aust. N. Zeal. J. Public Health 2019, 43, 221–227. [Google Scholar] [CrossRef] [Green Version]
- Park, J.; Seo, D. Defect Index of Timberwork in House, Korea. Forests 2021, 12, 896. [Google Scholar] [CrossRef]
- Schultz, C.; Jørgensen, K.; Bonke, S.; Rasmussen, G. Building Defects in Danish Construction: Project Characteristics Influencing the Occurrence of Defects at Handover. Archit. Eng. Des. Manag. 2015, 11, 423–439. [Google Scholar] [CrossRef]
- Vásquez-Hernández, A.; Botero, L. Standardizing System of Post Handover Defects for the Construction Sector in Colombia. J. Archit. Eng. 2019, 25, 05019004. [Google Scholar] [CrossRef]
- Sandanayake, M.; Yang, W.; Chhibba, N.; Vrcelj, Z. Residential Building Defects Investigation and Mitigation—A Comparative Review in Victoria, Australia, for Understanding the Way Forward. Eng. Constr. Archit. Manag. 2022, 29, 3689–3711. [Google Scholar] [CrossRef]
- Love, P.; Li, H. Quantifying the Causes and Costs of Rework in Construction. Constr. Manag. Econ. 2000, 18, 479–490. [Google Scholar] [CrossRef]
- Milion, R.; Alves, T.; Paliari, J.; Liboni, L. CBA-Based Evaluation Method of the Impact of Defects in Residential Buildings: Assessing Risks towards Making Sustainable Decisions on Continuous Improvement Activities. Sustainability 2021, 13, 6597. [Google Scholar] [CrossRef]
- Park, J.; Seo, D. Post-handover Quality Management Index of Electric Housing Work. Adv. Civ. Eng. 2022, 2022, 4690073. [Google Scholar] [CrossRef]
- Kang, Y. Statistical Quality Control Using Image Intelligence: A Sparse Learning Approach. Nav. Res. Logist. 2022, 69, 996–1008. [Google Scholar] [CrossRef]
- Shewhart, W. Some Applications of Statistical Methods to the Analysis of Physical and Engineering Data. Bell Syst. Tech. J. 1924, 3, 43–87. [Google Scholar] [CrossRef]
- Aslam, M.; Rao, G.; Ahmad, L.; Jun, C. A New Control Chart Using GINI CPK. Commun. Stat.—Theory Methods 2020, 51, 197–211. [Google Scholar] [CrossRef]
- Chen, K.; Chang, T.; Wang, K.; Huang, C. Developing Control Charts in Monitoring Service Quality based on the Number of Customer Complaints. Total Qual. Manag. 2015, 26, 675–689. [Google Scholar] [CrossRef]
- Hosseinian, A.; Baradaran, V. A Two-phase Approach for Solving the Multi-skill Resource Constrained Multi-Project Scheduling Problem: A Case Study in Construction Industry. Eng. Constr. Archit. Manag. 2021, 30, 321–363. [Google Scholar] [CrossRef]
- Nguyen, H.; Nadi, A.; Tran, K.; Castagliola, P.; Celano, G.; Tran, K. The Shewhart-type RZ Control Chart for Monitoring the Ratio of Autocorrelated Variables. Int. J. Prod. Res. 2022. [Google Scholar] [CrossRef]
- Woodall, W. The Use of Control Chart in Healthcare and Public Health Surveillance. J. Qual. Technol. 2006, 38, 89–104. [Google Scholar] [CrossRef]
- Wan, Q.; Chen, L.; Zhu, M. A Reliability-oriented Integration Model of Production Control, Adaptive Quality Control Policy and Maintenance Planning for Continuous Flow Processes. Comput. Ind. Eng. 2023, 176, 108985. [Google Scholar] [CrossRef]
- Becker, C.; Glascoff, M. Process Measures: A Leadership Tool for Management. TQM J. 2014, 26, 50–62. [Google Scholar] [CrossRef]
- John, B. A Control Chart Pattern Recognition Methodology for Controlling Information Technology-enabled Service (ITeS) Process Customer Complaints. Int. J. Product. Perform. Manag. 2021, 71, 3826–3848. [Google Scholar] [CrossRef]
- Choi, J.; Park, J.; Seo, D.; Jo, J.; Park, K.; Kim, O. A Study on Legal Issues about Defect Repair Claim on Apartment Building. J. Archit. Inst. Korea 2009, 25, 145–153. [Google Scholar]
- Park, J.; Kim, O.; Kim, J. Revitalization of the Conciliation System for Defect Disputes Related to Apartment Buildings: On the Technical Issue. J. Korea Inst. Build. Constr. 2011, 11, 208–220. [Google Scholar] [CrossRef]
- Kim, B.; Park, J.; Choi, J.; Seo, D.; Kim, O. Comparative Analysis on Repairing Cost of Lawsuit on Concrete Crack Defect in Apartment Building. Korean J. Constr. Eng. Manag. 2011, 12, 142–150. [Google Scholar] [CrossRef] [Green Version]
- Park, J.; Seo, D.; Choi, J.; Kim, O.; Park, K.; Jo, J. Analysis on Legal Issue of Lawsuits and Subjective Judgment on Defects in Apartment Building. J. Korea Inst. Build. Constr. 2012, 12, 42–53. [Google Scholar] [CrossRef] [Green Version]
- Bae, I. A Study on the Problems with the Revision of the Laws on Defect Liabilities for Apartments and Their Solutions. Master Theory, Kwangwoon University, Seoul, Republic of Korea, 2014. [Google Scholar]
- Ryu, J. A Study on the Improvement of the Defects Liability System in Collective Housing. Ph.D. Dissertation, Joongbu University, Geumsan, Republic of Korea, 2016. [Google Scholar]
- Choi, J. Evaluation of Defect Repairing Bond Ratio through Defect Lawsuit Case Study in Apartment Building. Ph.D. Dissertation, Chungbuk National University, Cheongju, Republic of Korea, 2017. [Google Scholar]
- Society for Construction Lawsuit in Seoul Central District Court. Construction Appraisal Practice, 3rd ed.; Society for Construction Lawsuit in Seoul Central District Court: Seoul, Republic of Korea, 2016. [Google Scholar]
- Korean Law Information Center. Enforcement Decree of the Act on House Construction Standard. Available online: https://www.law.go.kr/admRulSc.do?menuId=5&subMenuId=41&tabMenuId=183&query=%EC%A3%BC%ED%83%9D%EC%9D%98%20%EC%84%A4%EA%B3%84%EB%8F%84%EC%84%9C%20%EC%9E%91%EC%84%B1%EA%B8%B0%EC%A4%80#liBgcolor0 (accessed on 27 April 2023).
- Park, J.; Seo, D. Defect Repair Deposit and Insurance Premium for a New Home Warranty in Korea. Buildings 2023, 13, 815. [Google Scholar] [CrossRef]
- Seo, D.; Park, J. Analysis of Consulting Reports on Defect Disputes in Apartment Building. J. Korea Inst. Build. Constr. 2013, 13, 498–505. [Google Scholar] [CrossRef] [Green Version]
- Chen, M. Predicting Corporate Financial Distress based on Integration of Decision Tree Classification and Logistic Regression. Expert Syst. Appl. 2011, 38, 11261–11272. [Google Scholar] [CrossRef]
- Yang, J.; Han, S. Study on the Application of Decision Trees for Personalization based on e-CRM. J. Korea Saf. Manag. Sci. 2003, 5, 107–119. [Google Scholar]


| Cost | N | Sum (Million USD) | Mean (Million USD) | Std Dev. |
|---|---|---|---|---|
| Construction cost | 285 | 48,237 | 169 | 164 |
| Defect repair cost | 285 | 176 | 0.62 | 0.67 |
| Group | Cases | Mean (%) | Std Dev. (%) | Max (%) | Min (%) |
|---|---|---|---|---|---|
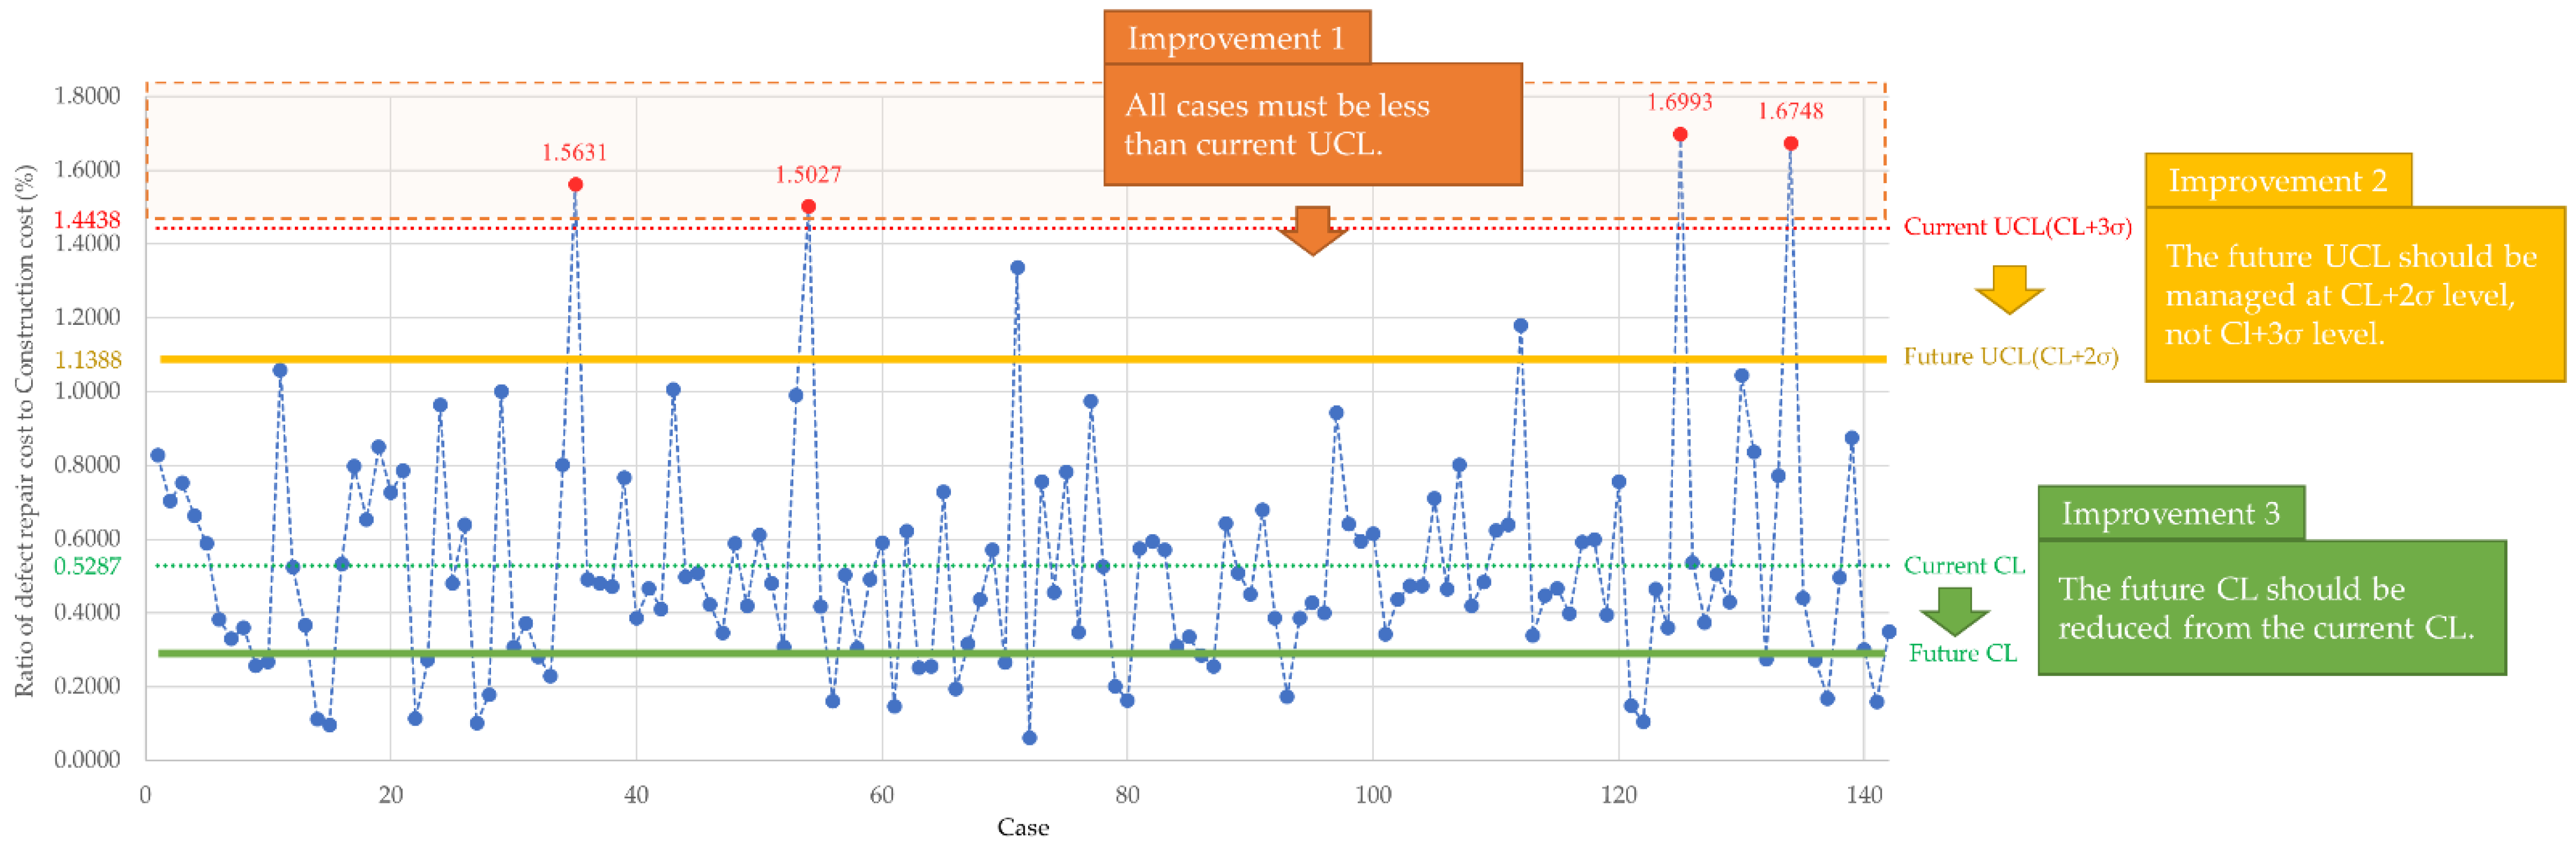
| A | 142 | 0.5287 | 0.3051 | 1.6993 | 0.0623 |
| B | 87 | 0.3831 | 0.1977 | 1.1424 | 0.0842 |
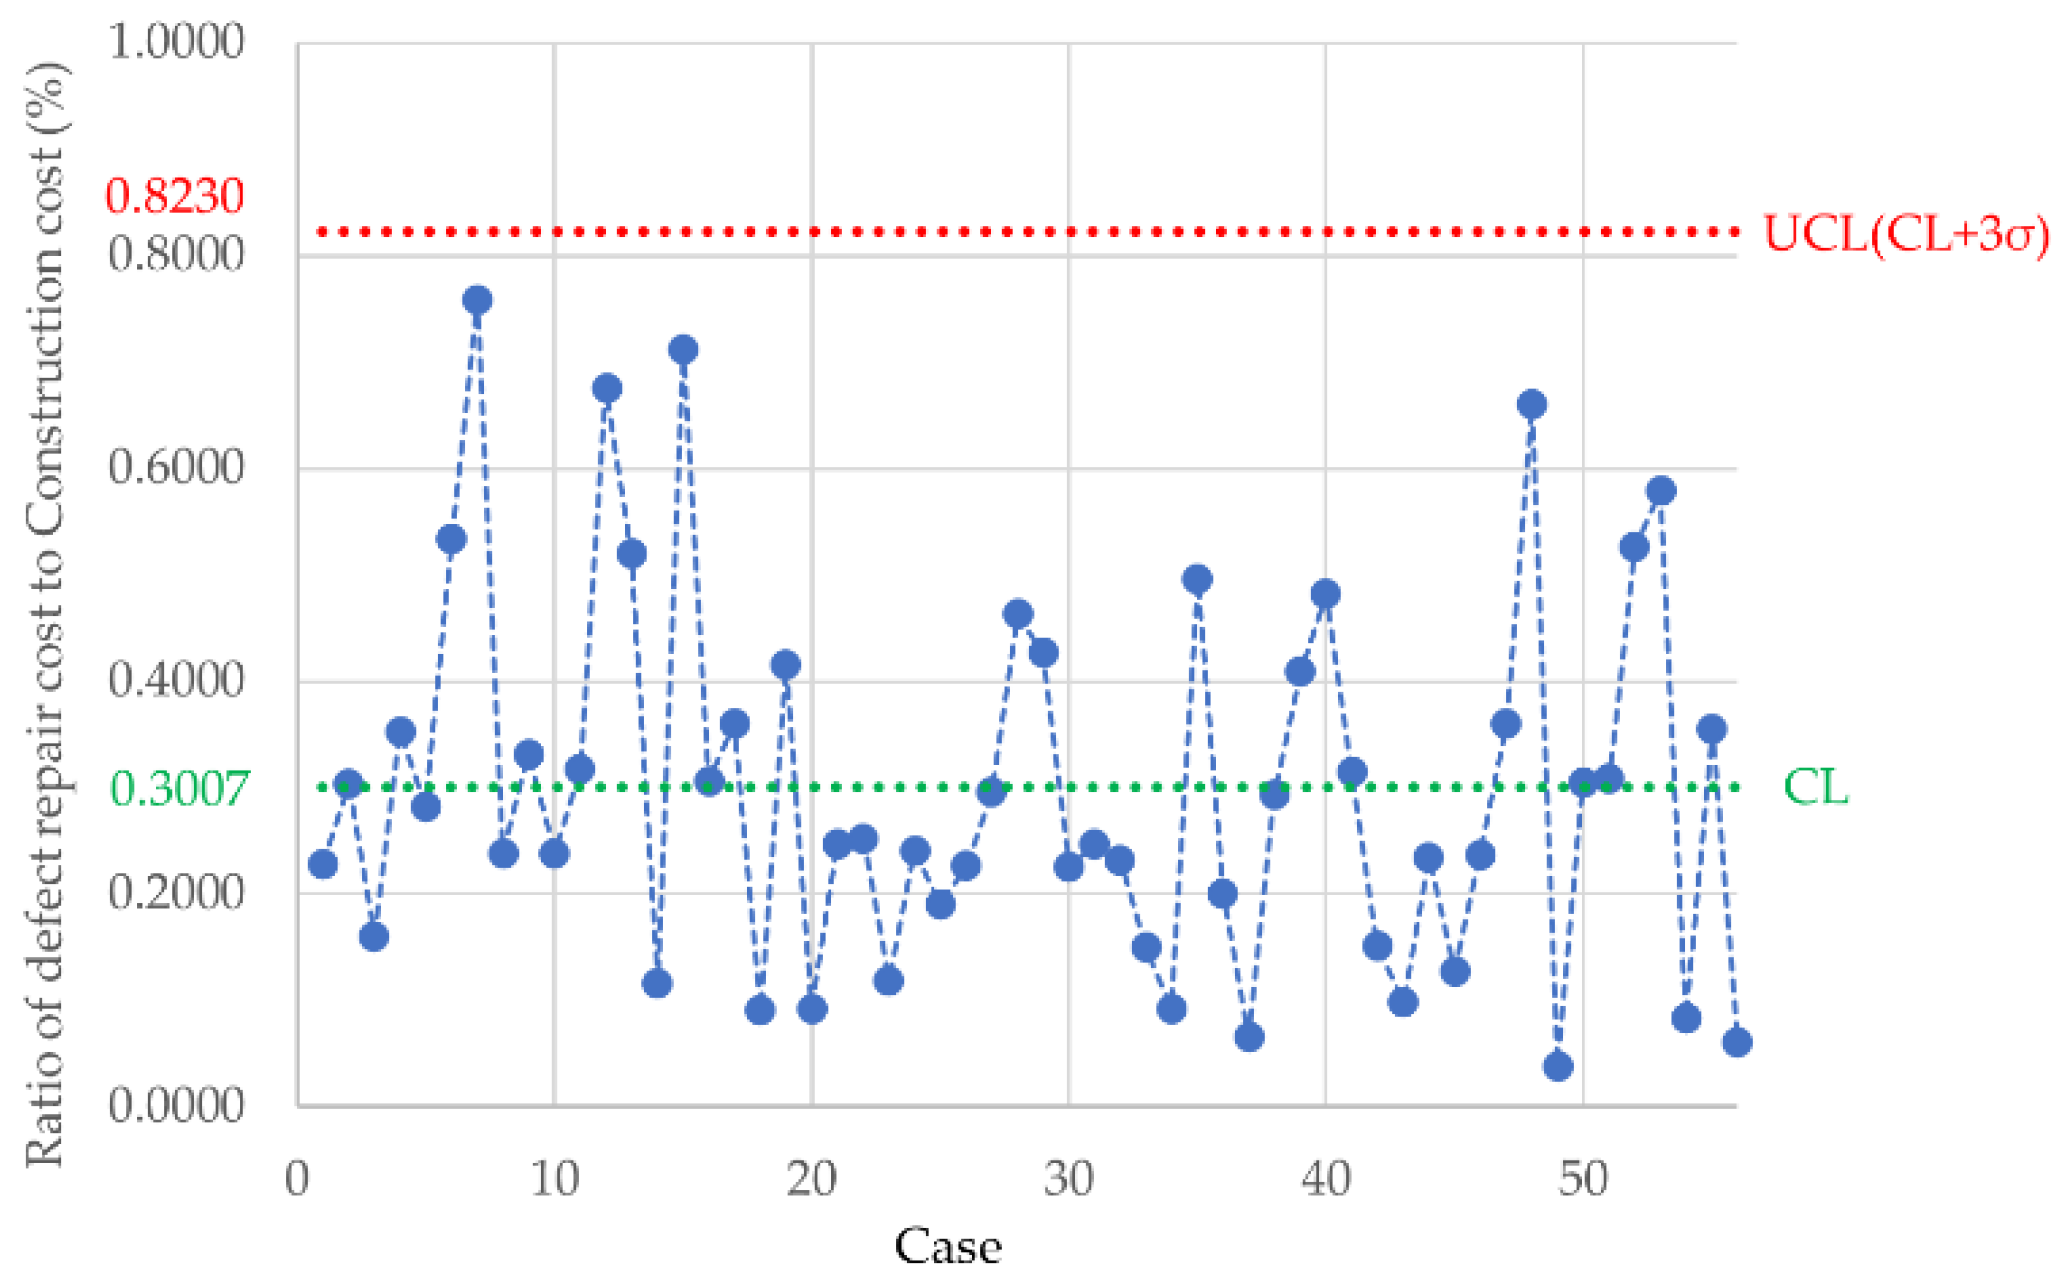
| C | 56 | 0.3007 | 0.1741 | 0.7587 | 0.0388 |
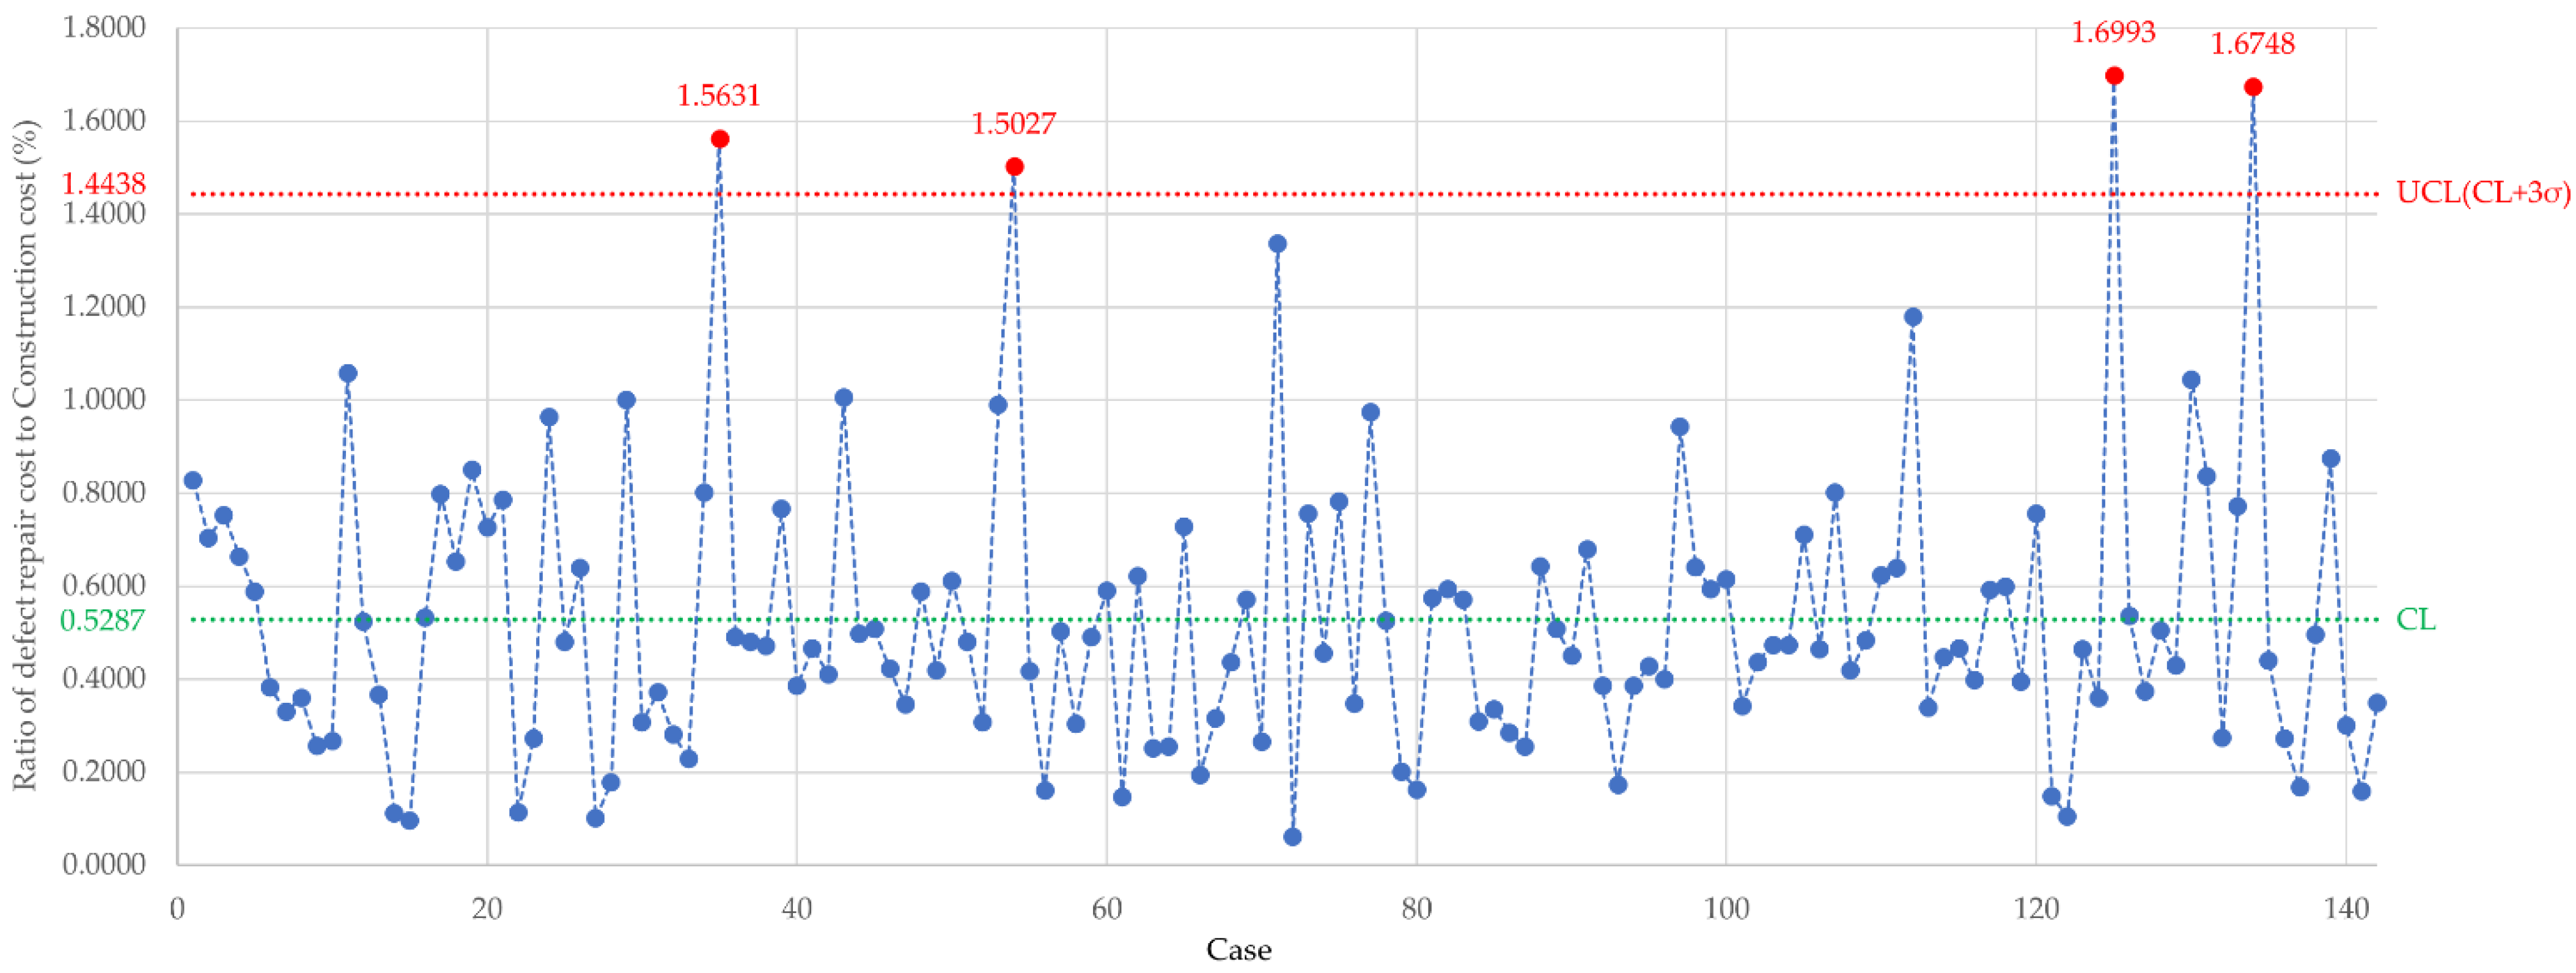
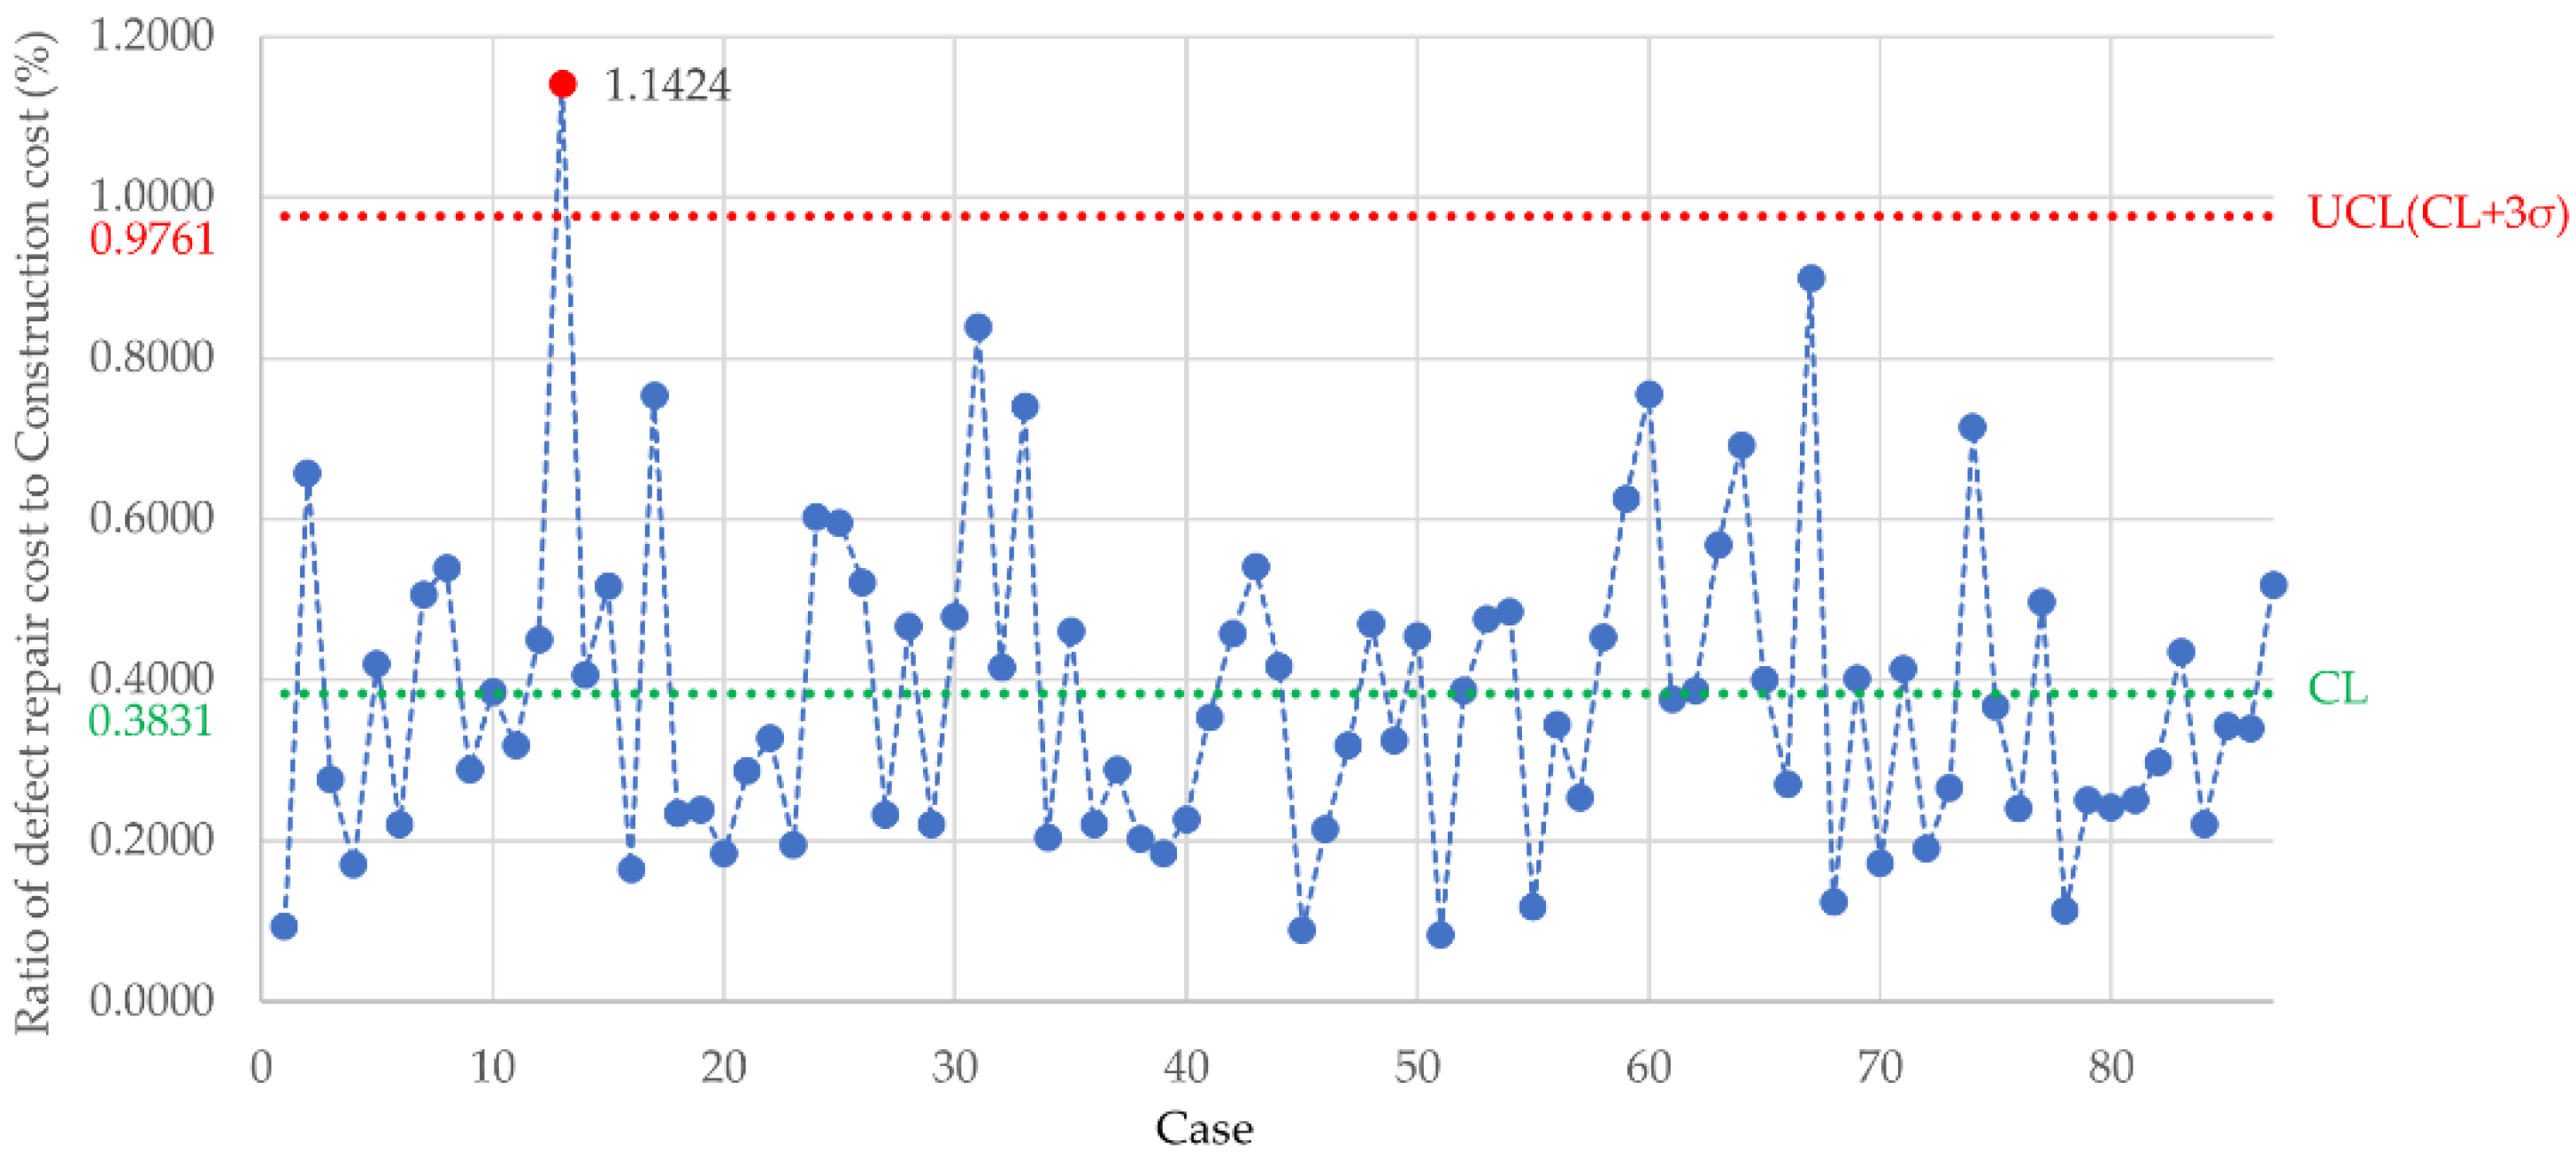
| Group | Cases | CL (%) | UCL (%) | Quantities of Failure | Percent of Failure (%) |
|---|---|---|---|---|---|
| A | 142 | 0.5287 | 1.4438 | 4 | 2.82 |
| B | 87 | 0.3831 | 0.9761 | 1 | 1.15 |
| C | 56 | 0.3007 | 0.8230 | 0 | 0.00 |
| Case | 1 | 2 | 3 | 4 | 5 |
|---|---|---|---|---|---|
| Group | A | A | A | A | B |
| Household | 2182 | 208 | 236 | 429 | 1196 |
| Total floor area (m2) | 366,425.4 | 30,547.7 | 34,978.6 | 38,095.1 | 157,227.9 |
| Construction cost (million USD) | 112.2 | 15.49 | 36.65 | 21.39 | 138.99 |
| Defect repair cost (million USD) | 1.88 | 0.26 | 0.57 | 0.32 | 1.59 |
| Ratio of DRCCC (%) | 1.6748 | 1.6993 | 1.5631 | 1.5027 | 1.1424 |
| CL (mean, %) | 0.5287 | 0.5287 | 0.5287 | 0.5287 | 0.3831 |
| Std. Dev (%) | 0.3051 | 0.3051 | 0.3051 | 0.3051 | 0.1977 |
| UCL (CL + 3σ, %) | 1.4438 | 1.4438 | 1.4438 | 1.4438 | 0.9762 |
| DRCCC to CL | 3.17 | 3.21 | 2.96 | 2.84 | 2.98 |
| Exceed to UCL | Yes | Yes | Yes | Yes | Yes |
| Object or Work | Technical Issue and Defect Type | Failure Case | ||||
|---|---|---|---|---|---|---|
| 1 | 2 | 3 | 4 | 5 | ||
| Concrete crack | Allowable crack width | O | O | |||
| Concrete interlayer crack to the outer wall | O | |||||
| The unit price of repair cost | O | |||||
| Surface treatment after crack repairing | O | |||||
| Repair surcharge for building height | O | O | ||||
| Repair method to wet concrete cracking | O | |||||
| Landscaping tree | Wither of trees | O | ||||
| Sanitary apparatus | Corrosion of bathroom mirror | O | O | |||
| Dew condensation | Dew condensation on a private balcony | O | ||||
| Detailed Issue and Defect Type | Quality Standard | Industry Practice | Problem in Use |
|---|---|---|---|
| Allowable crack width | O | ||
| Concrete interlayer crack to the outer wall | O | ||
| Unit price of repair cost | O | ||
| Surface treatment after crack repairing | O | ||
| Repair surcharge for building height | O | ||
| Repair method to wet concrete cracking | O | ||
| Wither of tree | O | ||
| Corrosion of bathroom mirror | O | ||
| Dew condensation on the private balcony | O |
Disclaimer/Publisher’s Note: The statements, opinions and data contained in all publications are solely those of the individual author(s) and contributor(s) and not of MDPI and/or the editor(s). MDPI and/or the editor(s) disclaim responsibility for any injury to people or property resulting from any ideas, methods, instructions or products referred to in the content. |
© 2023 by the authors. Licensee MDPI, Basel, Switzerland. This article is an open access article distributed under the terms and conditions of the Creative Commons Attribution (CC BY) license (https://creativecommons.org/licenses/by/4.0/).
Share and Cite
Park, J.; Seo, D. Post-Handover Housing Quality Management and Standards in Korea. Buildings 2023, 13, 1921. https://doi.org/10.3390/buildings13081921
Park J, Seo D. Post-Handover Housing Quality Management and Standards in Korea. Buildings. 2023; 13(8):1921. https://doi.org/10.3390/buildings13081921
Chicago/Turabian StylePark, Junmo, and Deokseok Seo. 2023. "Post-Handover Housing Quality Management and Standards in Korea" Buildings 13, no. 8: 1921. https://doi.org/10.3390/buildings13081921