Article

Estimation of Durability of HC-550 Floor Slabs Based on Electrochemical Tests of Corrosion Rate of Reinforcement Strings in Concrete

1
Department of Building Structures, Faculty of Civil Engineering, Silesian University of Technology, 44-100 Gliwice, Poland
2
Smart Solutions, Measurement Center 3D, 03-046 Warszawa, Poland
*
Author to whom correspondence should be addressed.
Buildings 2023, 13(7), 1855; https://doi.org/10.3390/buildings13071855
Submission received: 31 May 2023 / Revised: 17 July 2023 / Accepted: 19 July 2023 / Published: 21 July 2023
(This article belongs to the Special Issue Sustainable Cement-Based Materials)

Abstract

:
The consequences of the loss of the load-bearing capacity due to the corrosion of prestressing steel can be much more dangerous than in the case of reinforced concrete structures, since failure can occur quite rapidly and without warning. A very important issue, therefore, is to determine the factors affecting the durability of prestressed structures exposed to aggressive agents, especially chloride ions. The aim of this study was to verify the protective properties of concrete of prefabricated HC-type prestressed concrete slabs in order to evaluate the possibility of their application in the ceilings of multilevel garages. In this paper, the corrosion rate of rebar steel in HC-550 floor slabs at a width of 1200 mm was estimated with nondestructive electrochemical methods: linear polarization and impedance spectroscopy. The general and mechanical properties of concrete prepared according to a formula in a laboratory and analogous concrete cut directly from the analyzed floor slabs were also studied. The porosity of concrete from these slabs was determined using X-ray-computed tomography for pore-related characterization. The values of the diffusion coefficient of chloride ions determined in previous works and the previously proposed model for the overexposure of the durability of floor slabs in chloride-containing environments were used to determine the durability of these slabs. Based on the empirical correlations adopted from the literature presenting the relationship of durability/adhesion over time and the corrosion parameters studied, a safe service life was determined at the nominal class of concrete equal to Δtcor.red = 30.48 years. In addition, in the case of discontinuities in the concrete structure, there may be a dangerous reduction in the time of corrosion initiation and a subsequent reduction in service life due to the loss of the adhesion of strut strands for up to 10.68 years of service life.

1. Introduction

In recent times, the problem of designing buildings in regard to their reliability and design safety has become a fundamental issue due to economic and humanitarian aspects. Recent failures of building structures and prestressed concrete structures, the cause of which was either failure to take into account or insufficient estimation of the impact of an aggressive environment containing chloride ions at the stage of the facility’s design, should be the impetus for the verification of the principles of their design and maintenance [1,2]. In the literature, there is a fairly limited number of corrosion fatigue models used to predict the life of reinforced or prestressed concrete structures. There are a number of different approaches to estimating the remaining service life of structures, including Palmgren’s and Miner’s law of cumulative damage, as well as Goodman, Gerber and Soderberg mean fatigue diagrams [3].
For a more accurate estimation of the remaining service life of reinforced or prestressed concrete infrastructure, the basic principles of a structural reliability analysis are usually applied without actively monitoring the condition of existing structures with sensors reporting on the state of the corrosion. Analyzing the load-bearing capacity of the structure, the synergistic effects of fatigue and corrosion lead to the degradation of the prestressed structure. Pitting corrosion results in local cavities in steel reinforcing strut strands and is more dangerous than continuous corrosion, as under repeated dynamic loading it can lead to the failure of the reinforcing strut strands. Pitting corrosion is difficult to detect, including locally, and causes the appearance of a local increase in stress in the rebar [4,5].
Corrosion damage is more dangerous in prestressed concrete than in reinforced concrete structures. The rate of strand corrosion can be accelerated by the capillary attraction of liquid containing chloride ions along the strand wires of the prestressing strut strand. High stresses in the strut strands of reinforcements under prestressing can lead to cracks in the concrete cover, even with little corrosion. Concrete cracking due to corrosion has a greater impact on reducing the allowable load in prestressed structures than in reinforced concrete structures. This loss becomes more significant as the cover increases and the concrete’s tensile strength decreases, but shows no significant change as the band diameter and expansion coefficient of corrosion products increase. The model proposed in [6] considered three stages: microcrack formation, cover crack initiation and crack width growth. The relationships between the stress concentration factor and the corrosion period have been formulated for round (λr), oval (λo) and triangular (λt) corrosion pits, respectively: λr = 1.045 + 0.00335 (t1–t0), λo = 1.039 + 0.00313(t1–t0) and λt = 1.095 + 0.00234(t1–t0), where t0 is the corrosion period and t1 is the service life of the bridge (in years) [7]. Based on the experimental studies presented in the paper [8], two linear relationships were defined between the yield stress (py) and ultimate strength (pu) depending on the percentage of corrosion (η): py = 38.53–25.68·η and pu = 40.18–27.86·η. The following loss factors were introduced in the calculation of yield stress and failure loads at different stages of corrosion: Y = py/py and U = pu/pu, where py is the yield stress at the current value of η, py is the yield strength in the absence of corrosion, pu is the ultimate load at the current value of η and py is the yield strength in the absence of corrosion.
In a number of works [9,10,11], a series of studies on the weakening of fatigue strength of steel under the influence of corrosion have been presented. On the basis of experimental studies, the following relationship was formulated, taking into account the effect of corrosion on fatigue strength: log(N) + (3.154–2.73 η)·log(S) = 13.929–11 η for the stress range S ≥ 360 (Mpa) and log(N) + (19.2461–96.16 η)·log(S) = 13.929–11 η for the stress range S < 360 (Mpa), where N is the number of cycles, S is the stress range and η is the corrosion percentage of steel wires.
Most of the empirical and theoretical models of changes in steel adhesion caused by steel corrosion described in the literature apply to reinforcing bars. In paper [12], the experimental results were compared with predictions of existing empirical models proposed by Jiang et al. [13], Lee et al. [14], Stanish et al. [15] and Cabrera [16] for corroded steel bar, as well as the model proposed by Wang et al. [17] for corroded steel strands. The theoretical models proposed by the researchers Li and Yuan [18] were also compared with the research results. Statistical indicators were calculated in all models, including the average absolute error (AAE), mean square error (MSE) and standard deviation (SD). In this comparison, the models of Jiang et al. [13] and Li and Yuan [18] obtained the best parameters.
The aim of this study was to evaluate the durability of HC-550 floor slabs based on electrochemical studies of the corrosion rate of reinforcing strings in concrete. Corrosion rate studies were performed using nondestructive electrochemical methods: linear polarization (LPR) and impedance spectroscopy (EIS). The initiation of corrosion processes was accelerated by charging with an electric field during the migration of chloride ions into tubes containing fragments of compressed strings directly cut from the test plates. The general (early shrinkage, drying shrinkage, crack resistance, depth of pressurized water penetration, frost resistance and resistance to negative temperatures with deicing salts) and mechanical (compressive strength, tensile strength and modulus of elasticity) properties of concrete determined according to the formula provided by the manufacturer were also examined. Some characteristics of concrete (depth of penetration of pressurized water and compressive strength of concrete) determined according to this formula were also checked directly in the manufacturing plant by performing tests on samples cut directly from the analyzed floor slabs. The porosity of the concrete of these floors was determined using X-ray-computed tomography for pore-related characterization and the weight method using a hydrostatic balance. Determined in previous works [19,20,21], values of the diffusion coefficient of chloride ions and the previously proposed [22] model for predicting the durability of floor slabs in a chloride-containing environment to determine the durability of these slabs were used.

Significance and Novelty

The precise determination of the safe service life of prestressed structures is a very important issue at present. The consequences of the loss of the load-bearing capacity due to the corrosion of prestressing steel can be much more dangerous than in the case of reinforced concrete structures. In the case of prestressed structures, failure can occur quite abruptly and without warning in the form of an excessive deflection of the structure. There are quite a few studies determining the effect of the loss of the adhesion of reinforcing steel and reduction in the active section due to corrosion. These studies mostly apply to reinforced concrete structures. The aim of this study was to investigate the effect of corrosion on prestressing strings caused by chloride ions on the durability of prestressed structures.
The prediction of the construction time was determined based on the model proposed earlier, but this time including actual measurements of the corrosion rate caused by the presence of chloride ions in concrete. Tests were carried out using two nondestructive methods (LPR and EIS) and then the advancement of the corrosion processes of the reinforcement strings tested was visually assessed. In order to further evaluate the speed of corrosion processes, the surface of the applied reinforcement strings was defined with the use of 3D scanning. The penetration of chloride ions into the concrete was accelerated by an electric field while the corrosion processes occurred naturally. The value of the concentration of chloride ions at the surface of the strings at the onset of the corrosion processes was also determined. The model used the value of the diffusion coefficient determined from the thermodynamic migration model since, as shown in an earlier study, the coefficient determined with this method best determined the diffusion properties of concrete.
It was also noted that the durability of prestressed structures was greatly affected by the quality and plastic properties of the concrete, since any discontinuities arising at the stage of execution occurring in the concrete cover could result in a tremendous acceleration of the process of the penetration of chloride ions into the concrete, entailing a significant acceleration of the corrosion processes. A novelty presented in the paper was the comprehensive study of both the properties of the concrete mix used to produce the HC-500 floor slabs and the elements directly cut from these slabs created in the factory. These are an important contribution to the planned follow-up studies of prestressed concrete elements placed under different temperature and humidity conditions.

2. Materials Section

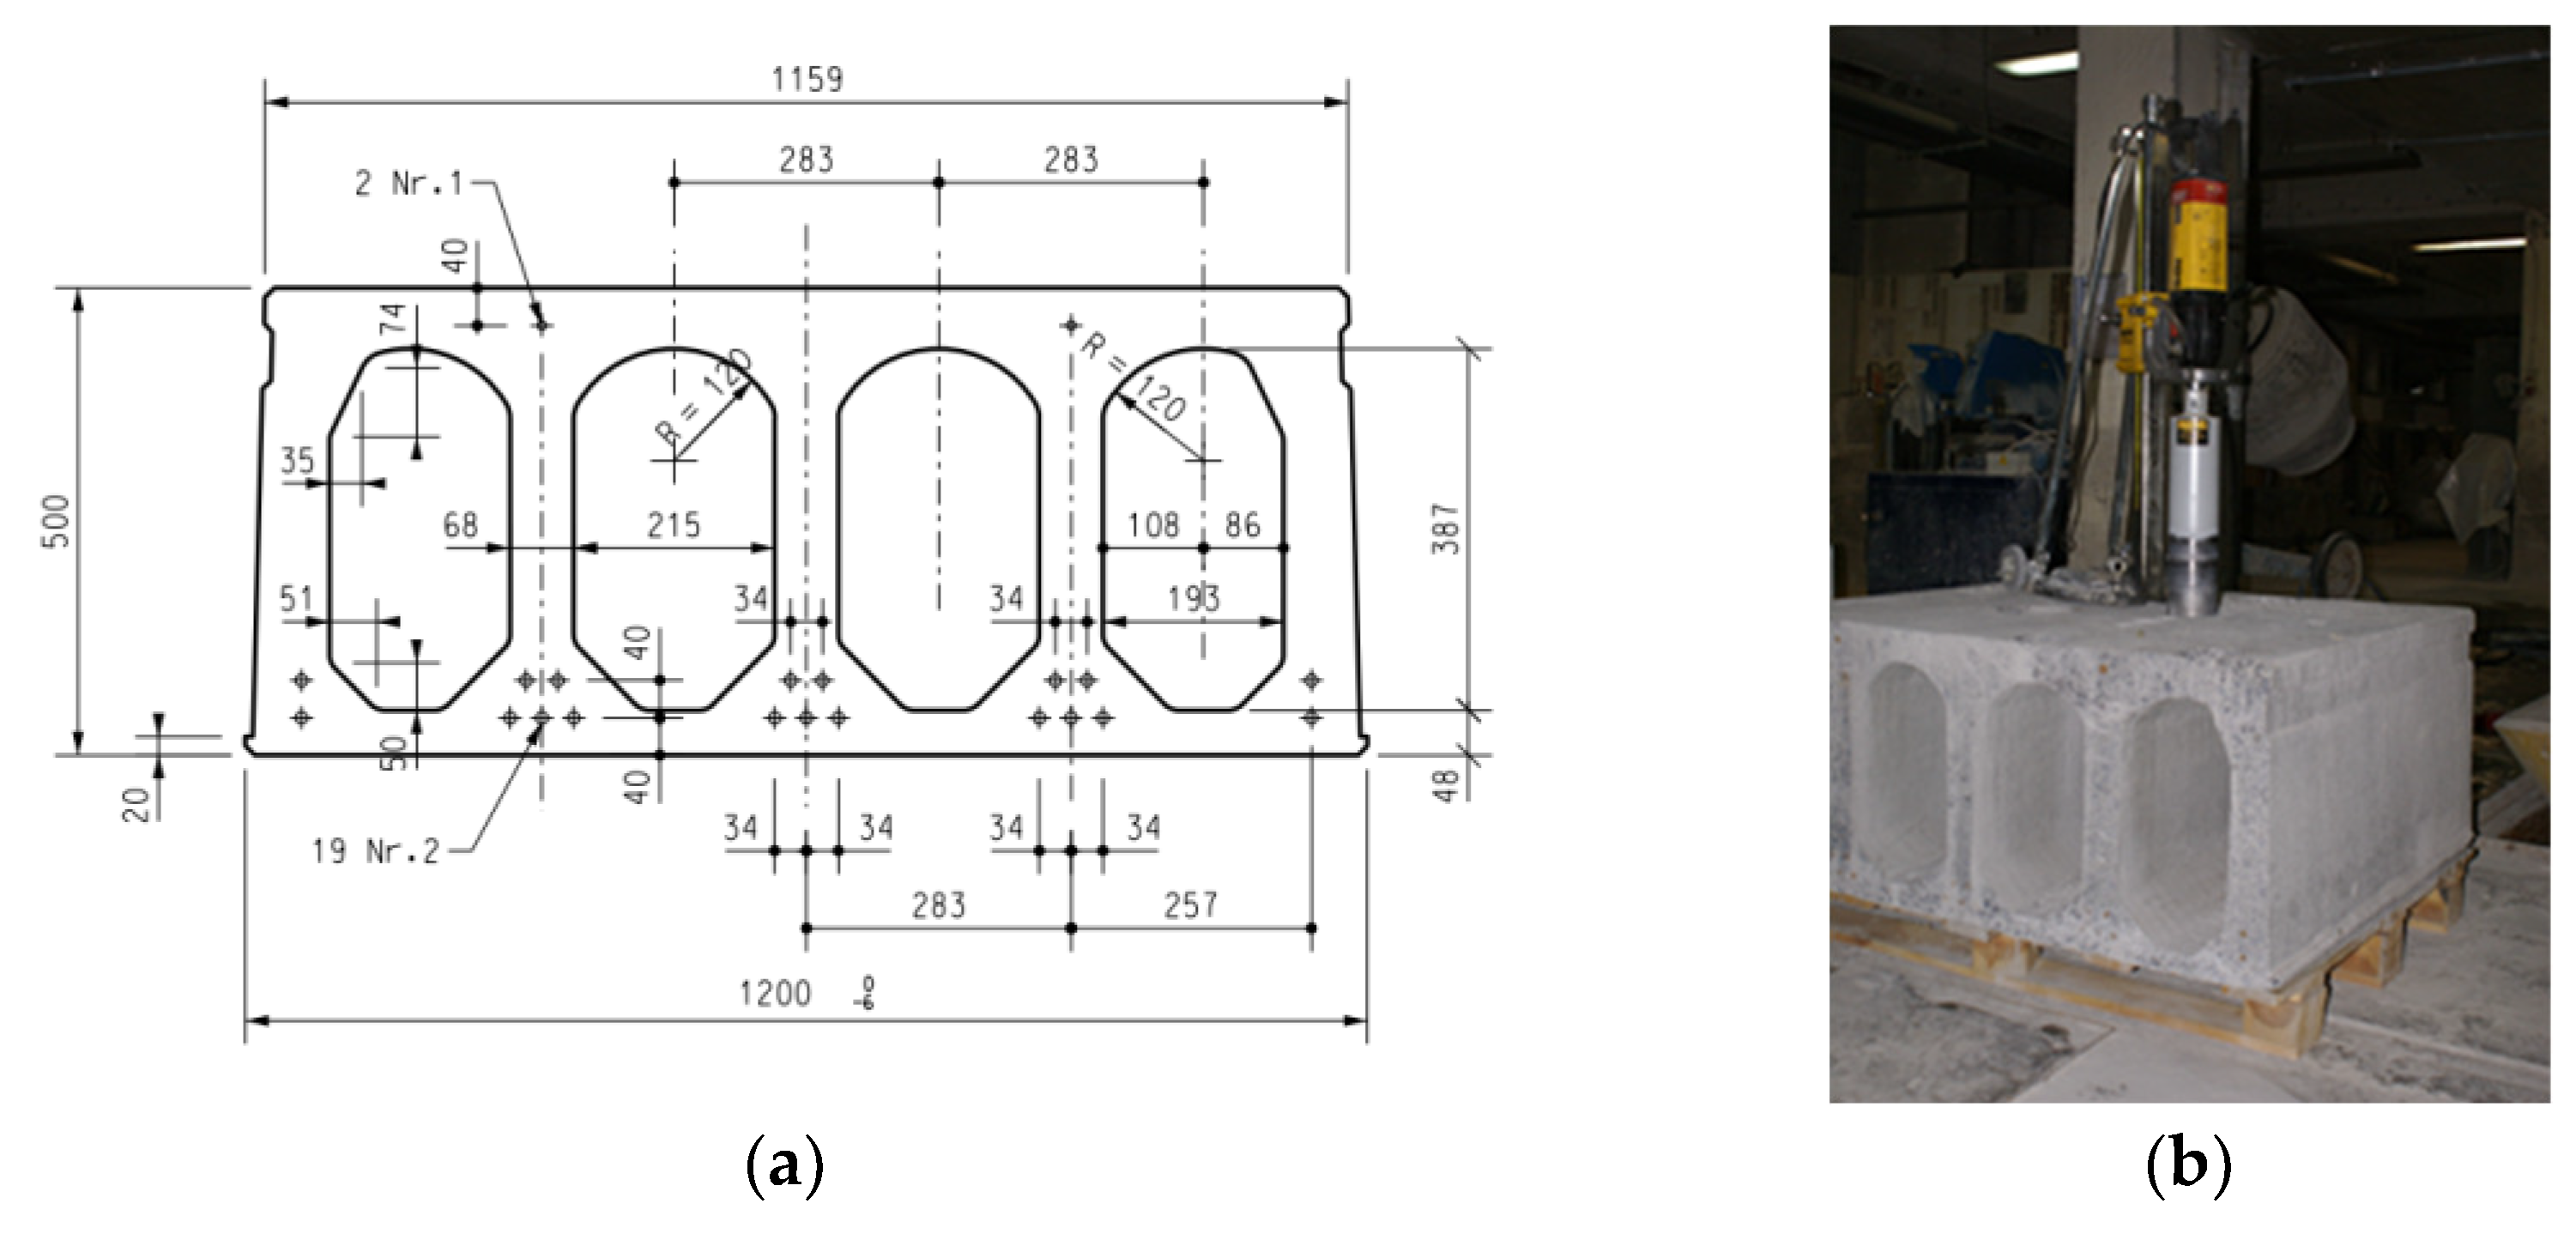
2.1. Typical Plates HC500-19/R120

The object of the study was one-meter panel sections cut from typical HC500-19/R120 plates at a length of L = 13 m. Plates of this type have a width of 1200 mm, and the range of commercial lengths ranges from 6.0 m to 20.1 m. In the cross-section of the plate, four holes were created to shape five ribs. The bottom of the three central ribs used five seven-strand strut strands with a nominal diameter of 12.5 mm, composed of Y 1860 steel, at 2 relaxation classes. In the extreme ribs, two prestressing strut strands of the same diameter were used. The tensile force of the lower rods was P1 = 19 × 93 = 1767 kN. In the upper parts of the ribs, the prestressing reinforcement consisted of two seven-strand strut strands with a nominal diameter of 9.3 mm, composed of steel of the same mark. The tensile force of the upper rods was P2 = 2 × 51 = 102 kN. Concrete of the nominal class was used to create the C50/60 slabs, the composition of which is given in Table 1.
Figure 1 shows the following test elements: (a) the shape and dimensions of the basic elements of the floor slabs; (b) a view of a tested element.

2.2. Test Items Created According to the Manufacturer’s Formula in the Construction Laboratory of the Silesian University of Technology

For testing the compressive strength of the concrete, 15 cubic samples were created in the laboratory according to the recipe provided by the manufacturer (Table 1). The cubic samples with sides measuring 150 mm, after 24 h of storage in molds, were cured in water at a temperature of 20 °C.
For the flexural tensile strength test, 15 cuboid samples with dimensions of 100 × 100 × 500 mm were created.
For the early and drying shrinkage tests, 19 concrete beams with dimensions of 100 × 100 × 500 mm were created.
For the determination of the depth of the penetration of water under pressure, 3 cubic samples created in the laboratory with sides measuring 150 mm were used.
Water penetration tests were additionally carried out on 3 cylinders with a diameter of 150 mm drilled from fragments of prestressed slabs.

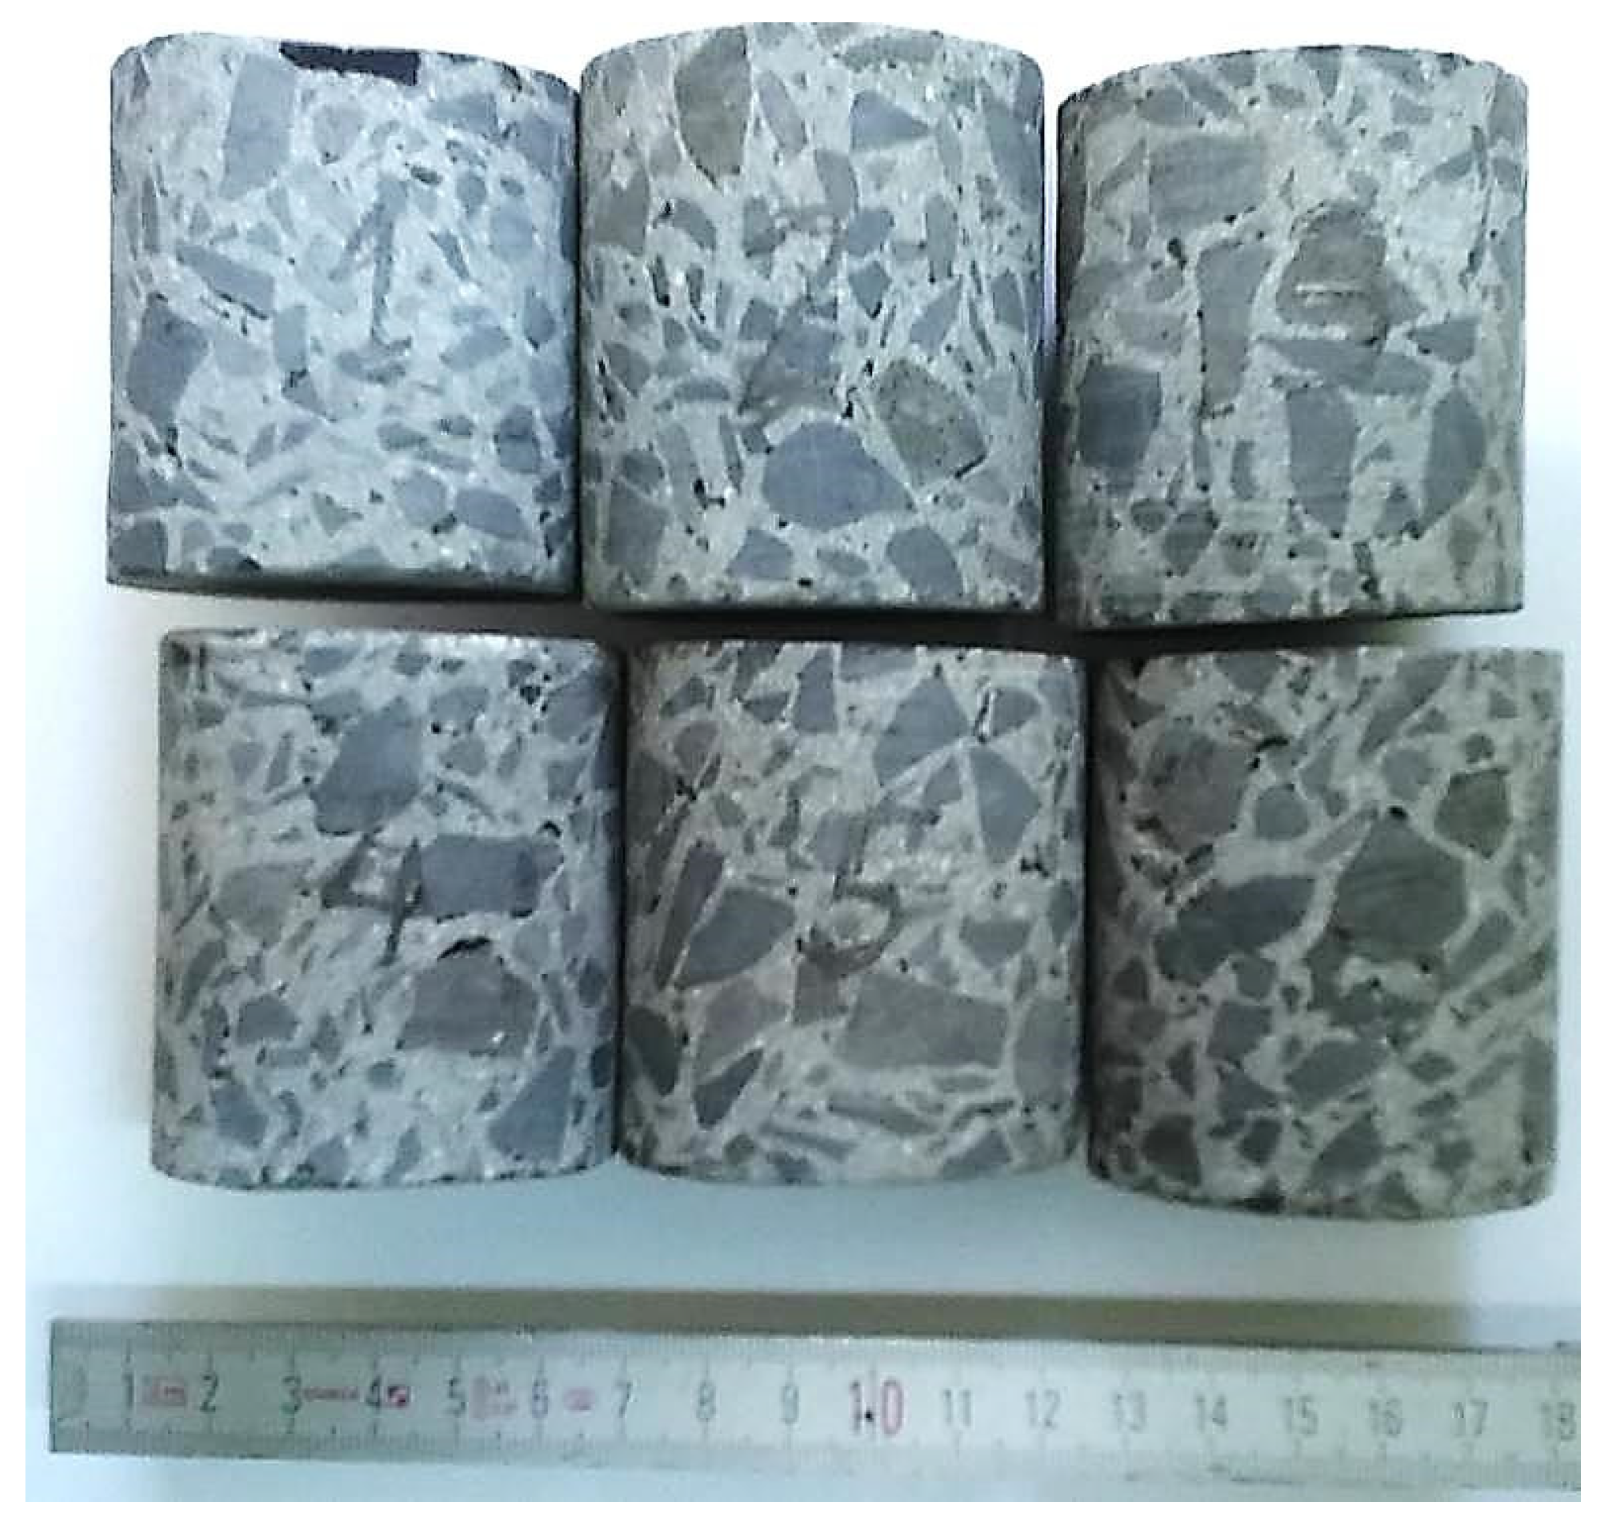
2.3. Components Cut Directly from HC-500 Slabs

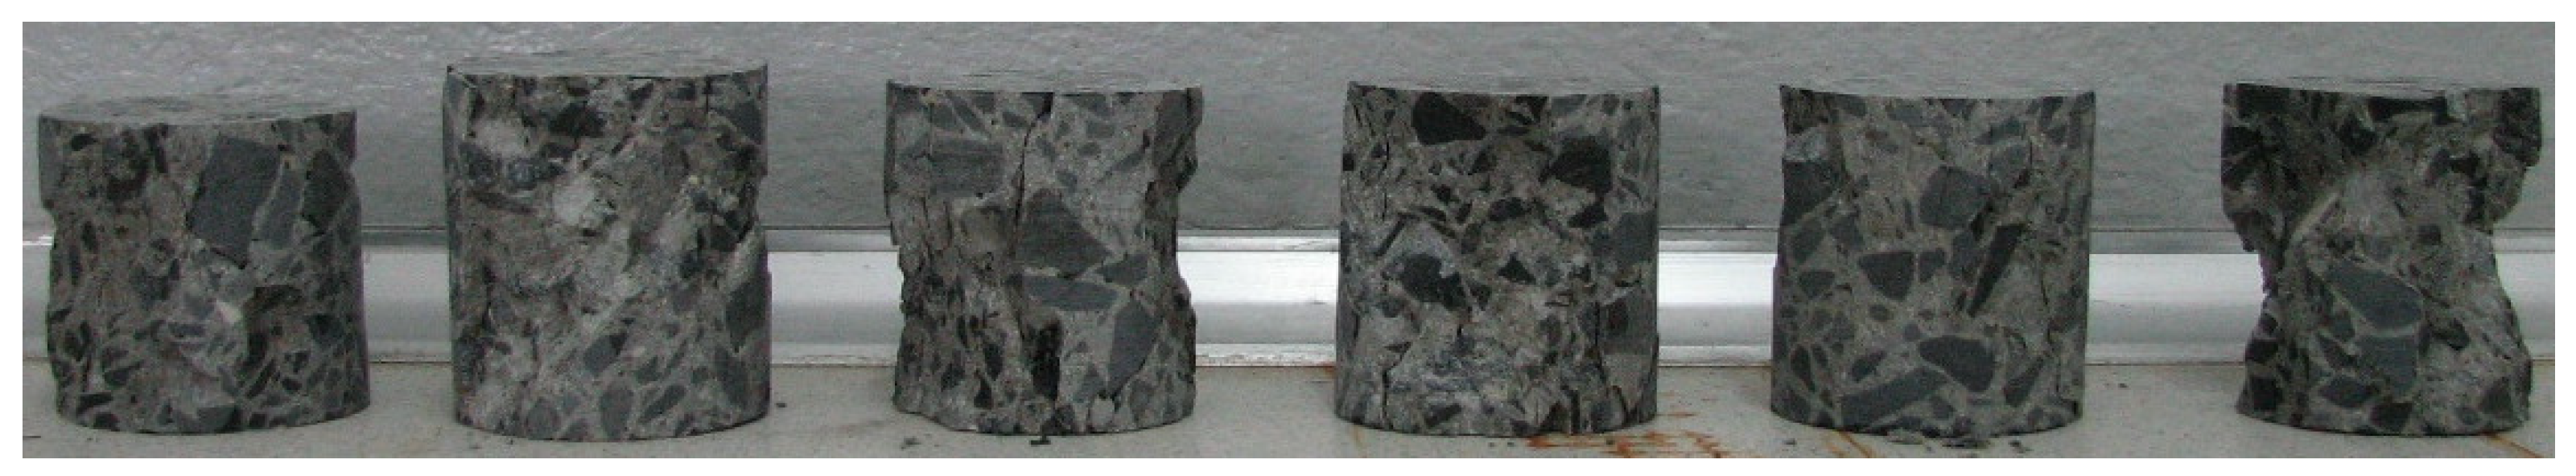
2.3.1. Preparation of Research Elements for Strength Tests

Six cores of approximately 55 mm in diameter and approximately 70 mm long were taken from the fragments of concrete slabs. The samples were taken using a core drill in accordance with the standard PN-EN 12504-1:2001 [23], according to which the subsequent sample preparation was carried out. A photographic inventory of samples cut from the structure is shown in Figure 2.

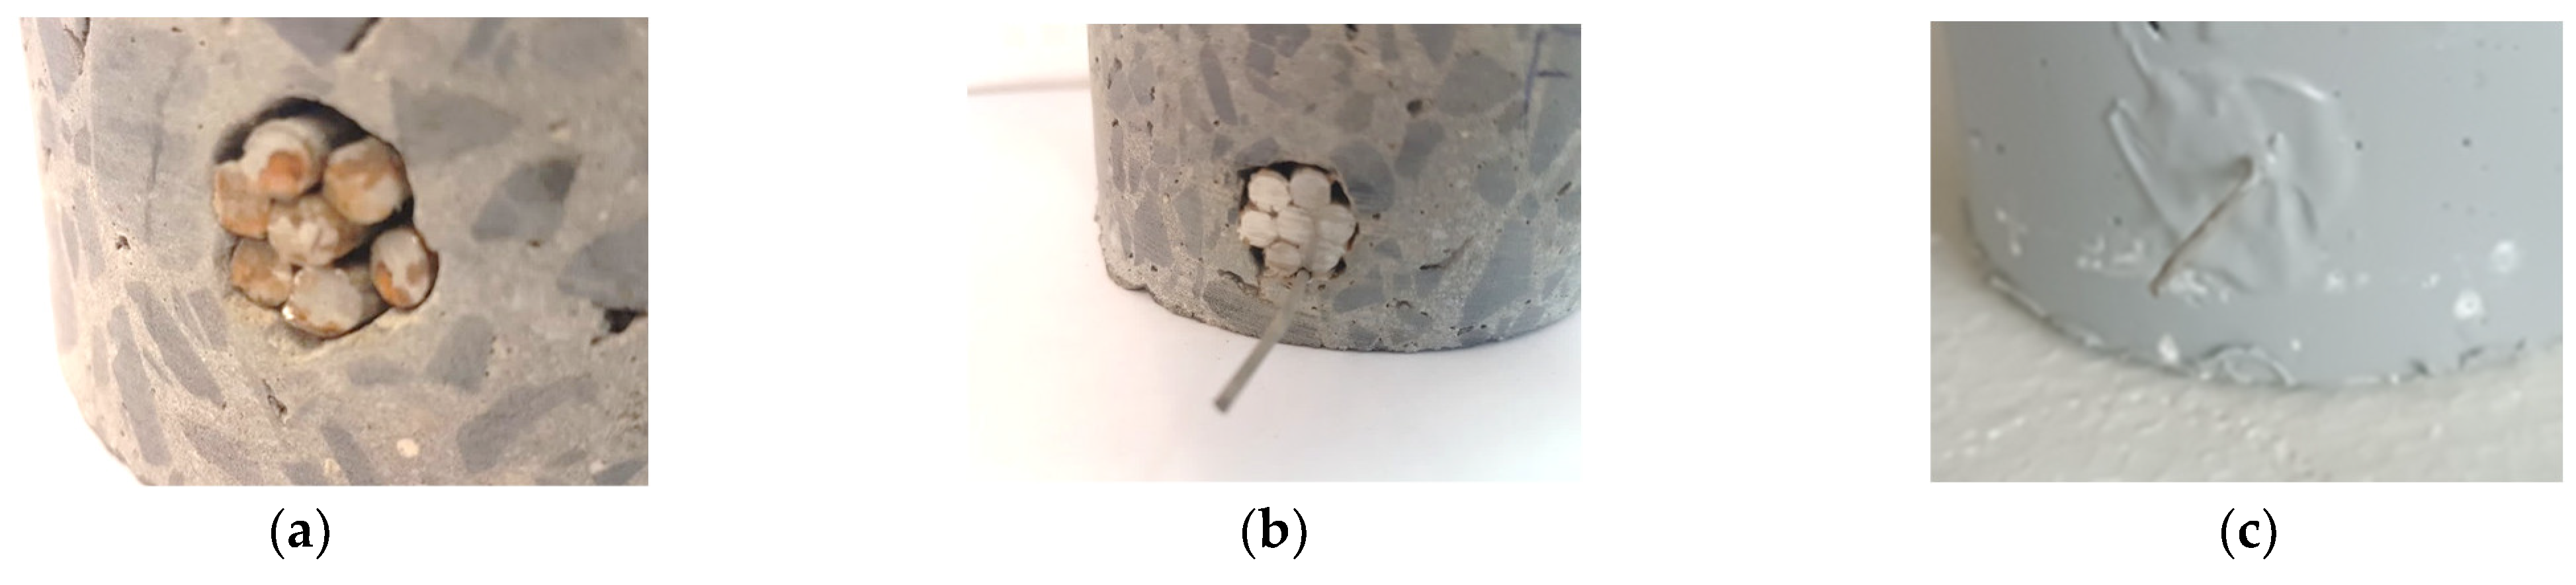
2.3.2. Preparation of Research Elements for Corrosion Tests Carried out Using the Potential Method

The tests were carried out on 12 test elements with a diameter of 96 mm and a height of approx. 50 ÷ 60 mm, cut out of prestressed concrete slabs in places where the reinforcement strings were located. As a result of cutting with a diamond crown drill and the insufficient filling of the surface at the string–concrete interface, the steel strings loosened in some samples. Figure 3a shows the loosening of the strings with visible voids around the strings. The relaxation of the strings presented in Figure 3a is of great importance in electrochemical studies, where the key is the electrical contact between the surface of the strings and the concrete and the electrical contact between the individual strings. Electrical contact between the strings was achieved using a conductive adhesive based on silver powder, as shown in Figure 3b. The side of the samples was painted with insulating paint, which ensured the unidirectional migration of chloride ions through the concrete—Figure 3c.

3. Test Methods

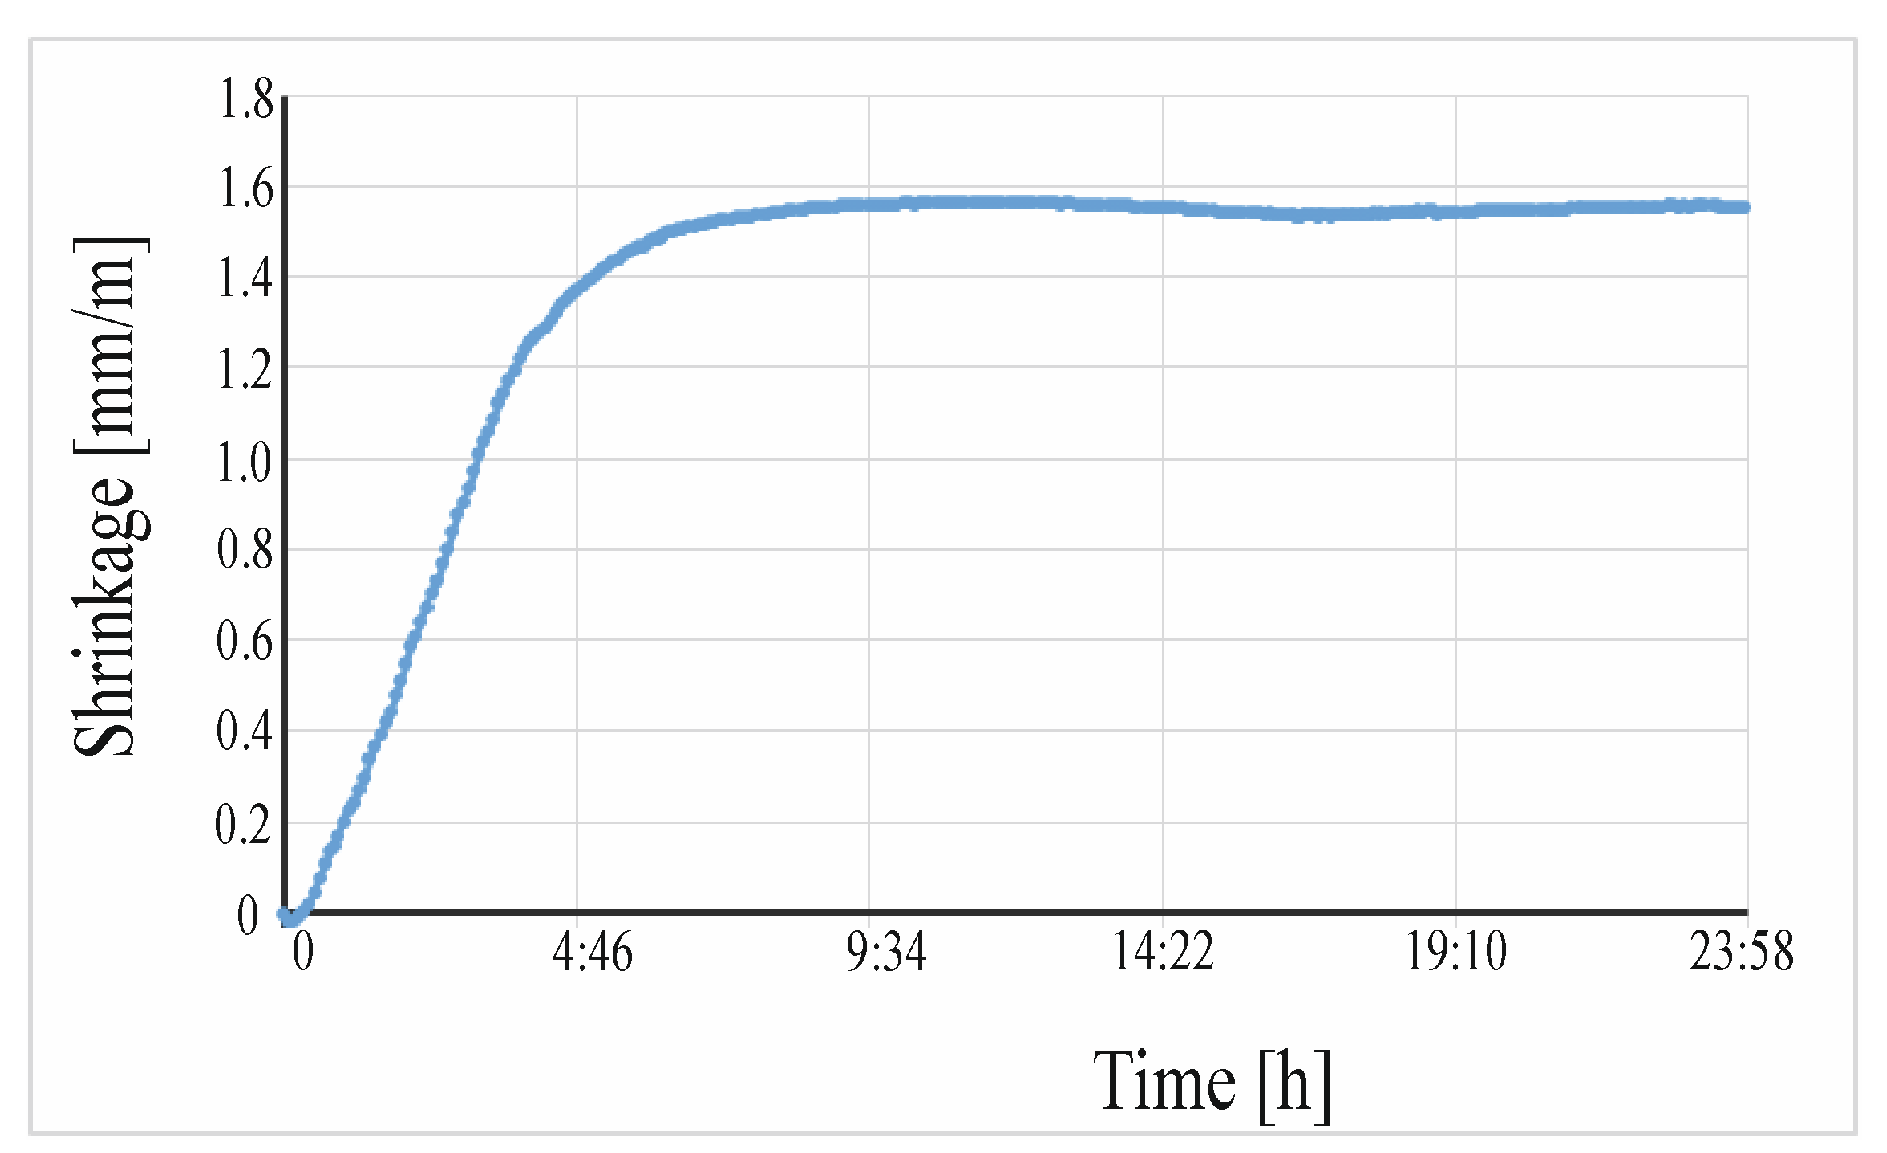
3.1. Measurement of the Early Shrinkage from the Moment of Forming

The test was based on a laser measurement of the displacements of benchmarks placed in a concrete beam [24]. The beam had a freedom of deformation, thanks to which it was possible to measure changes in the length caused by shrinkage from the moment of forming. Compressible polypropylene foam allowed for the potential expansion, while the foil reduced friction, thus, limiting the volume changes the least. The changing dimensions of the element were relayed to the reflectors of laser beams through M8 × 40 mm mix screws anchored in the concrete, which were screwed into the metal fittings on each end of the beam. After the shrinkage test, the metal fittings and reflectors could be removed; however, the anchored screws remained in the beam. The protruding fragments of the screws were used as benchmarks for measuring the drying shrinkage using Amsler’s method. The test was carried out in a climatic chamber, ensuring constant test conditions (a temperature of 20 °C and relative air humidity of 60%).

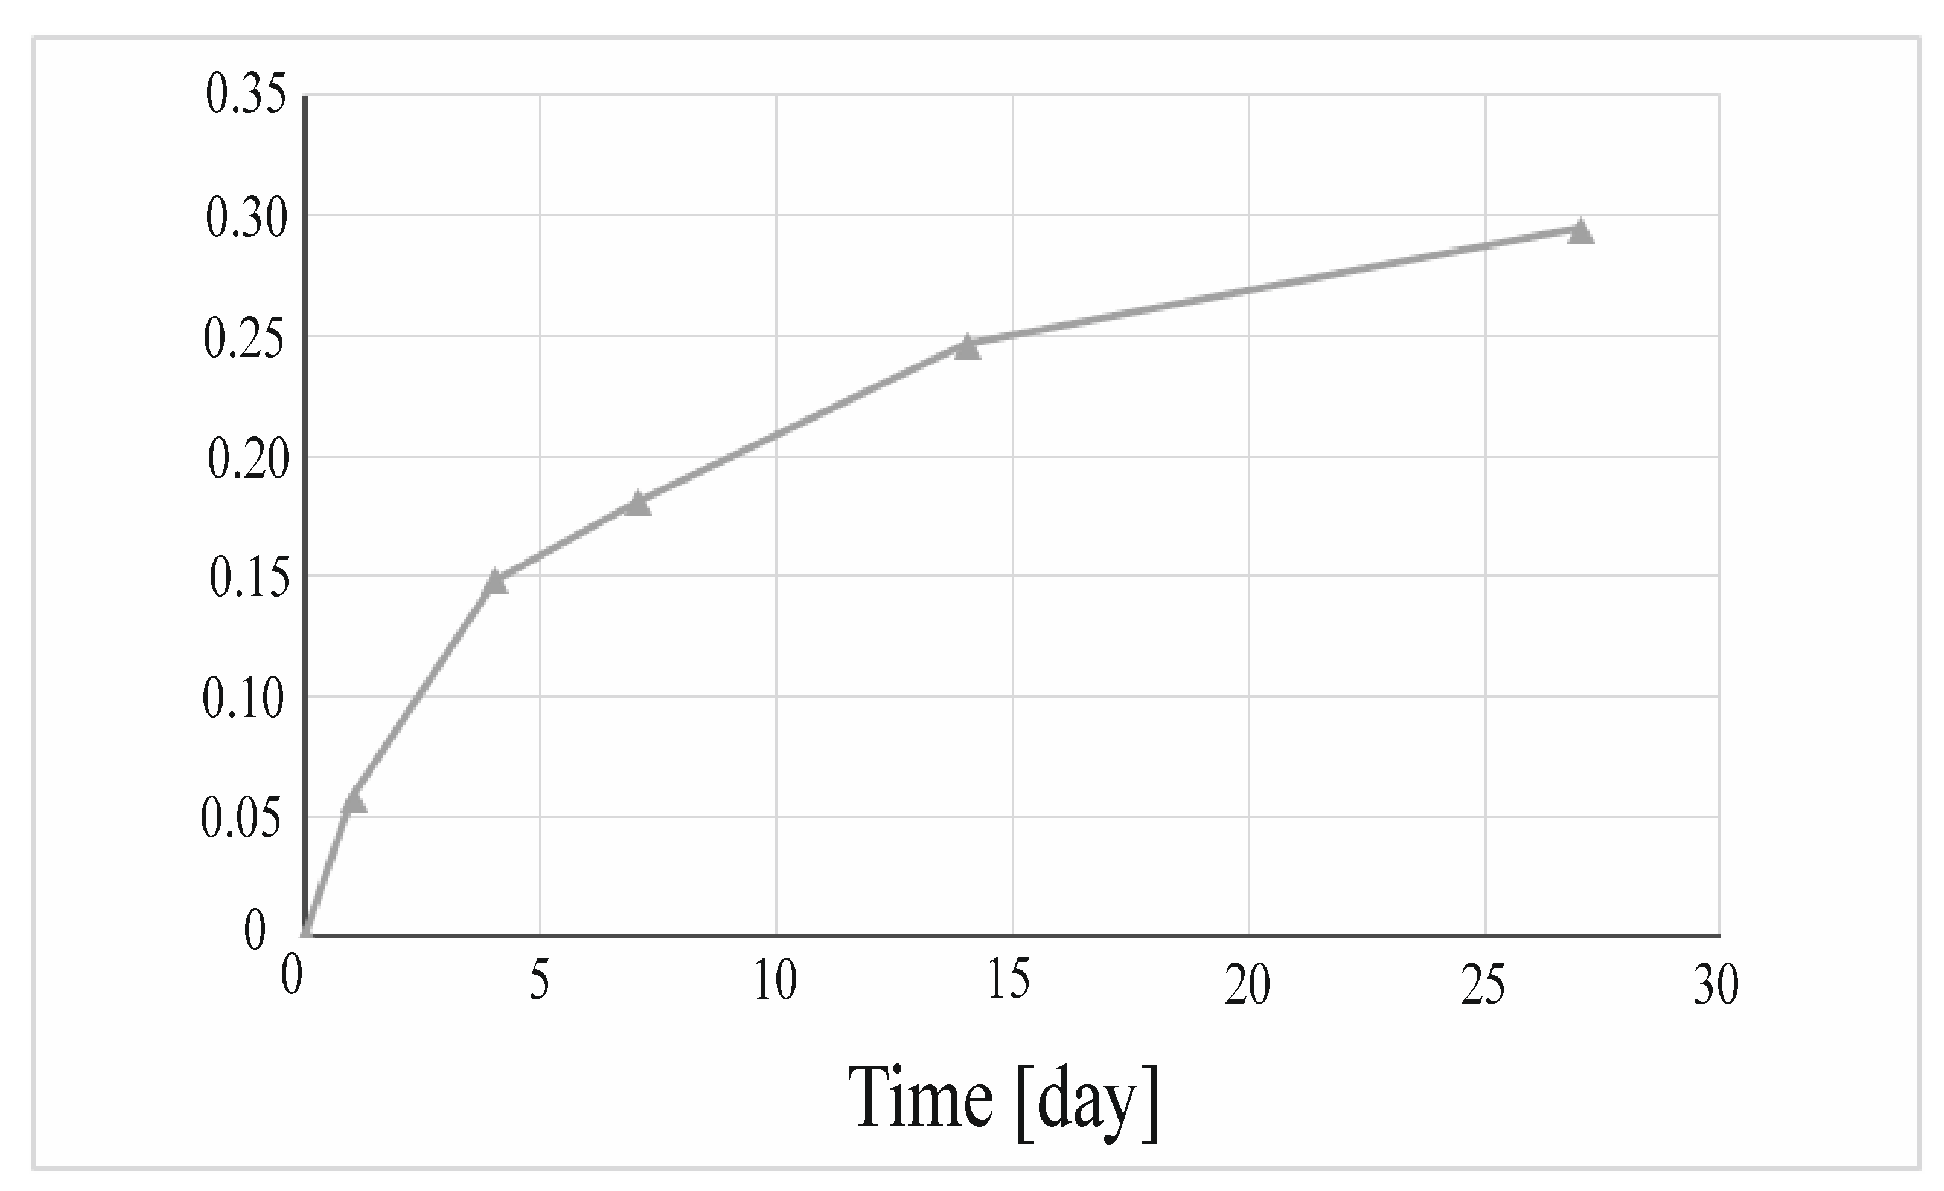
3.2. Research Drying Shrinkage

The shrinkage was tested at a temperature of 20 °C and a relative air humidity of 60%. We measured the shrinkage of the concrete beams by means of displacement sensor clocks with an accuracy of 0.001 mm.

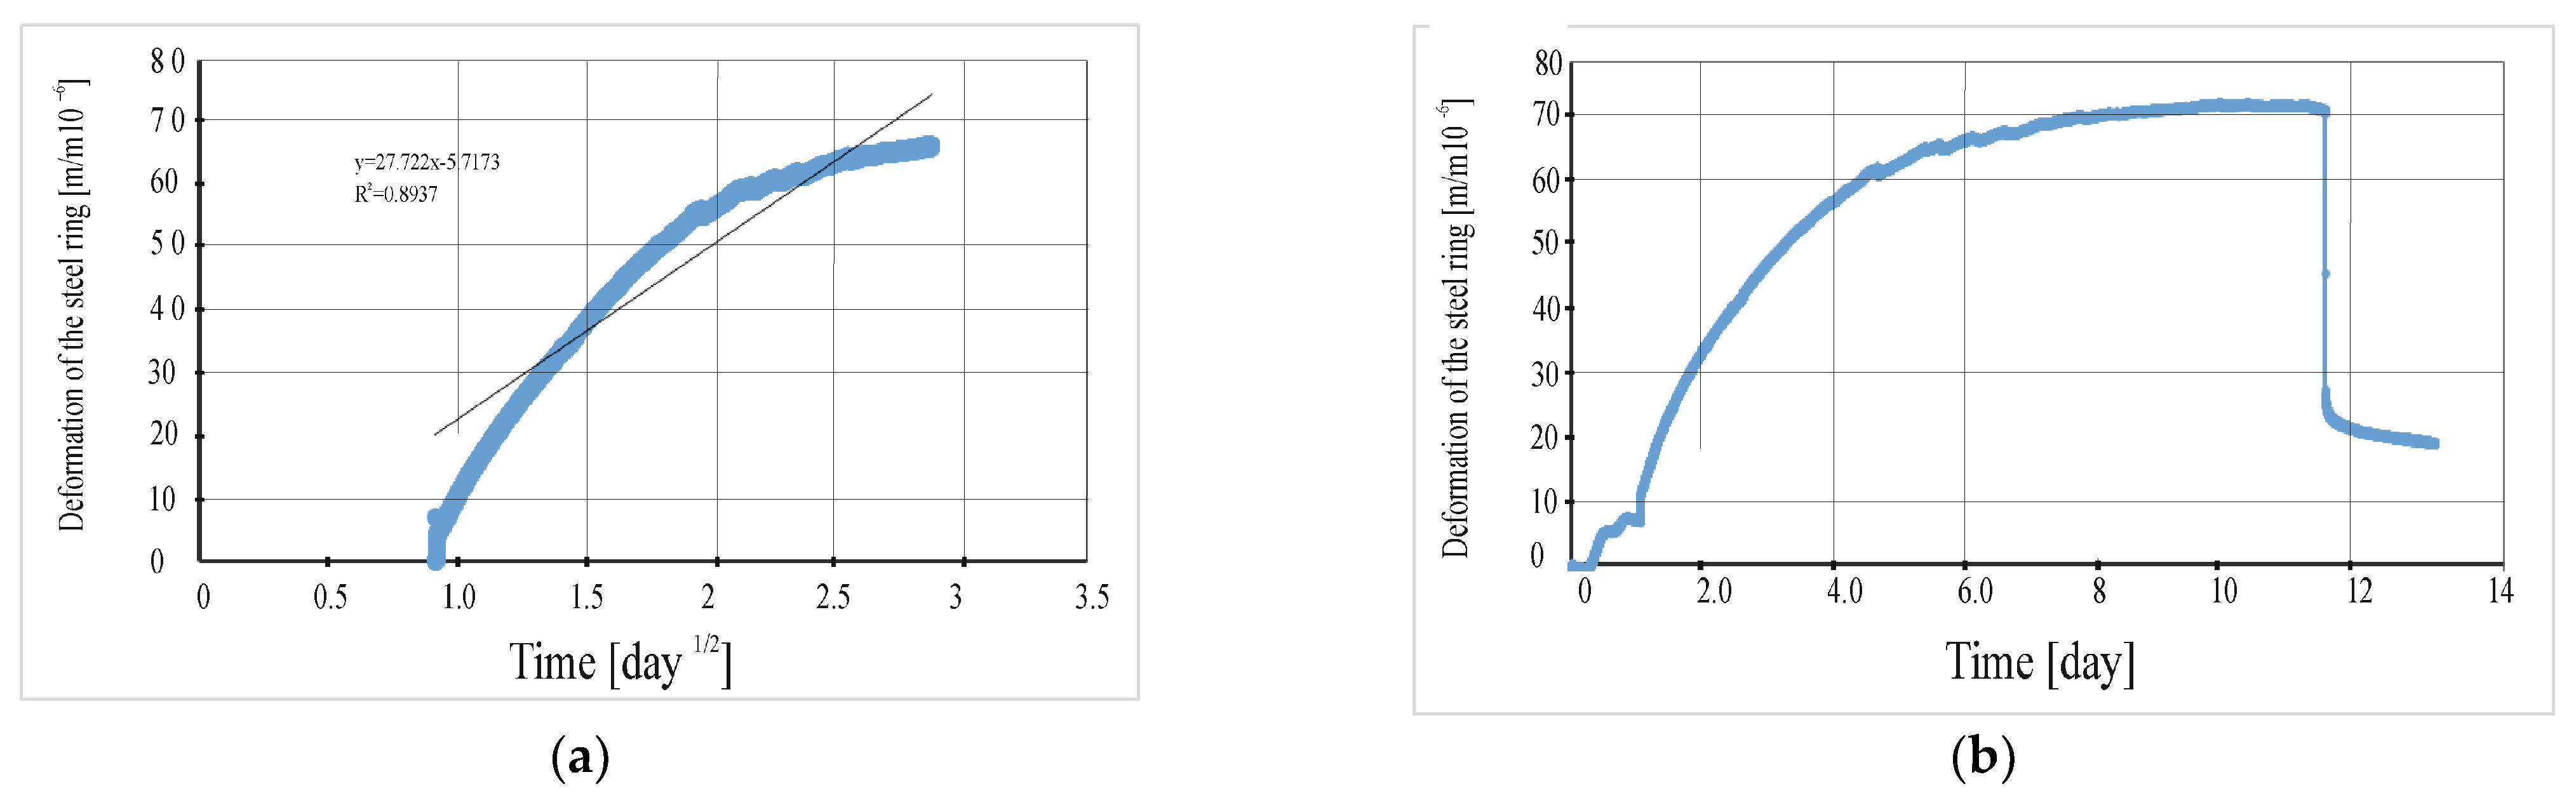
3.3. Shrinkage Ring Test

The study was conducted according to the procedures contained in the standard ASTM C1581-04, “Standard test method for determining age at cracking and induced tensile stress characteristics of mortar and concrete under restrained shrinkage” [25]. The test principle was based on the measurement of the deformation of a steel ring surrounded by a concrete ring. Deformations in the steel ring were the result of the shrinkage of the concrete. Deformation measurements were carried out for 28 days to find out if the concrete ring became scratched or not. Concrete cracking was signaled by a rapid reduction in the deformation of the steel ring. The data obtained in this study allowed us to determine the stress increment index in the steel ring q. It also allowed us to determine the susceptibility of the tested concrete to scratching caused by shrinkage. The stress increment factor q was calculated according to the formula taken from the standard [25]:
q = G 2 t
where: q—stress increment index (MPa/Day); G—Young’s modulus inner steel ring G = 72.2 Gpa; α—steel ring deformation rate increment ((m/m)/day1/2); t—the time in which the test was completed; α—strain increment ratio was the slope of the regression line used to approximate the relationship between the ring deformation and the elemental time over which deformation took place.

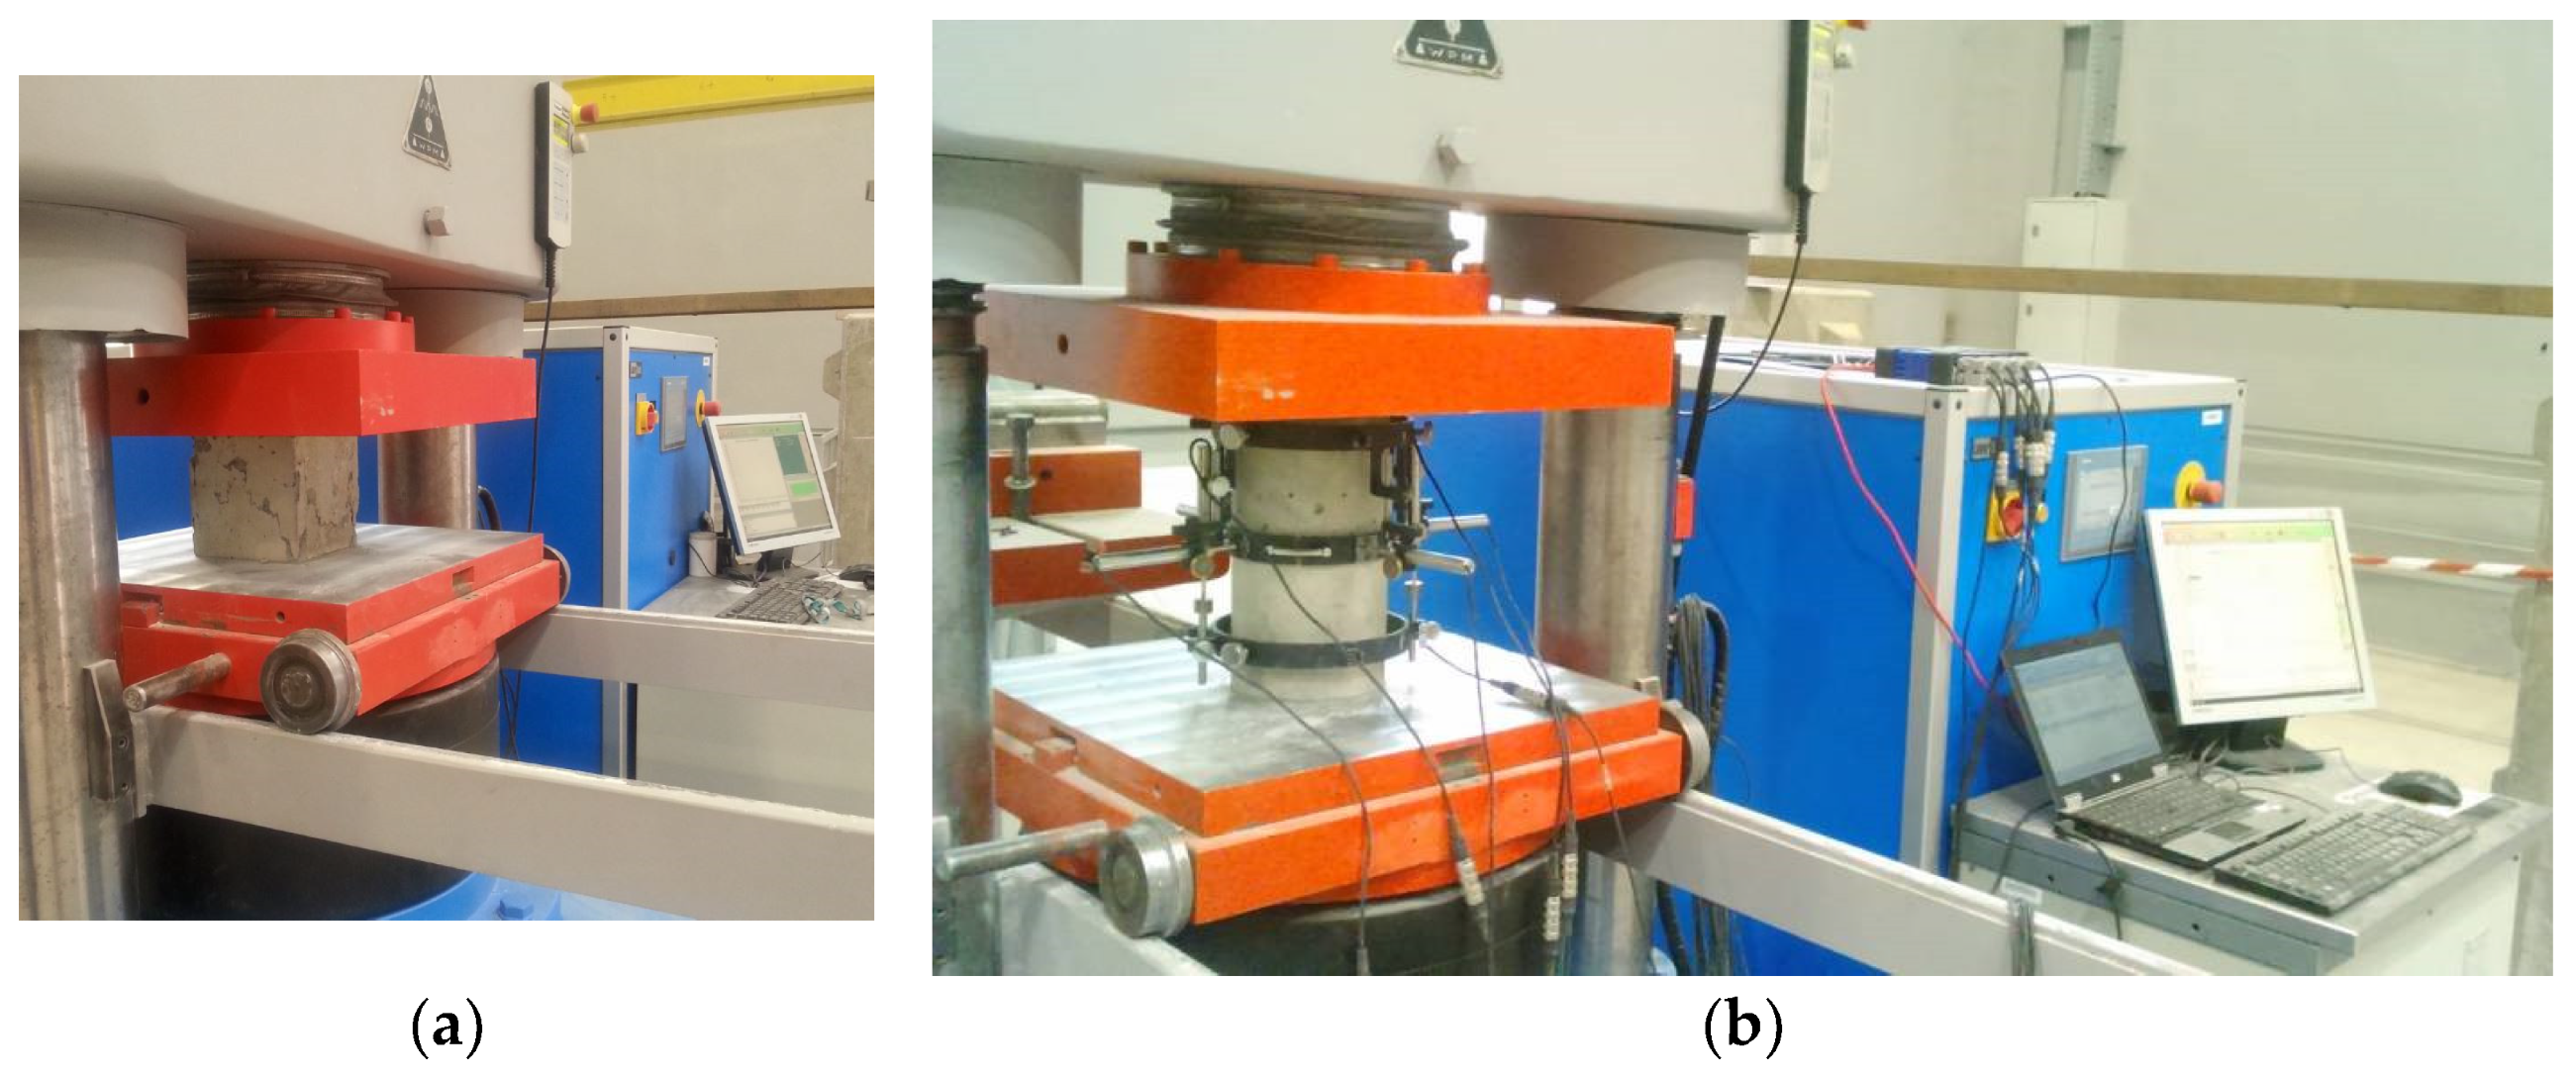
3.4. Test of Compressive Strength of Concrete after 1, 2, 7, 28 and 90 Days of Maturation

The tests were performed in accordance with the standard PN-EN 12390-3 [26]. The concrete was poured into molds and was tempered so as to not have any voids. After 24 h, the molds were removed and the test specimens were put in water for curing. The top surface of these specimen needed to be even and smooth. This was performed by placing the cement paste and spreading it smoothly on the whole area of the specimen. These specimens were tested in a compression testing machine after one, two, seven, twenty eight and ninety days of curing. The load was applied gradually at a rate of 140 kg/cm2 per minute till the specimens failed. A test of the compressive strength of the concrete after 1, 2, 7, 28 and 90 days of maturation was performed for three samples every time (Figure 4a).

3.5. Flexural Tensile Strength Test after 1, 2, 7, 28 and 90 Days of Maturation

The tests were performed in accordance with the standard PN-EN 12390-5 Concrete tests—Part 5: Bending strength of test specimens [27]. The cuboid samples were tested using the three-point bending method. The spacing of the supports was 400 mm.

3.6. Examination of the Modulus of Elasticity of Concrete after 2, 28 and 90 Days of Maturation

The modulus of elasticity was determined on cylindrical samples. The compressed surfaces of the samples were leveled by grinding. The sample deformations were measured in the longitudinal and transverse directions using inductive displacement sensors (Figure 4b).

3.7. Determination of the Depth of Penetration of Water under Pressure

The tests were carried out in accordance with the PN-EN 12390-8 standard Concrete tests—Part 8: Penetration depth of water under pressure [28]. The specimens were cubic, with dimensions of 150 × 150 × 150 mm, created in the laboratory. Immediately after the specimen was demolded, the surface was roughened with a wire brush to expose it to water pressure, and was then cured under water. The test started when the specimen was 28 days old. The specimen was placed in the apparatus and a water pressure of (500 ± 50) kPa was applied for (72 ± 2) h. During the test, the appearance of the surfaces of the test specimen not exposed to the water pressure was observed periodically.

3.8. Frost Resistance of Concrete

The frost resistance test was performed according to the PN-88/B-06250 ordinary concrete standard [29]. After 28 days, the concrete samples (150 × 150 × 150 mm) were frozen for three hours in temp. of −20 °C and then thawed for 4 h in water at 20 °C. Four cycles per day were performed. After 100 freeze–thaw cycles, the compressive strength and mass decrease of the concrete specimens were tested. According to this norm, concrete is frost-resistant when its decrease in compressive strength is lower than 20% after n cycles and weight loss is lower than five.

3.9. Test of Resistance to Subzero Temperatures with the Use of Deicing Salts

The study was conducted in accordance with PKN-CEN/TS 12390-9:2007 Testing hardened concrete—Part 9: Freeze–thaw resistance—Scaling [30]. The test consists of subjecting the sample to 28 cycles of freezing/thawing with the surface covered with a 3 mm layer of a 3% NaCl aqueous solution. The concrete’s resistance was assessed on the basis of the total mass of the exfoliated material in relation to the surface unit after a certain number of freeze–thaw cycles.

3.10. Compressive Strength Test of Concrete Taken Directly from HC-500 Plates

The aim of the tests was to determine the current class of concrete based on the measurements of the characteristic compressive strength in order to compare it with the manufacturer’s specifications. Compressive strength tests were carried out using the direct method in accordance with the current standard PN-EN 13791:2008 [31].
On the basis of a visual inspection of the cut samples, it was found that crushed basalt aggregate of a maximum size of no more than 16 mm was found in all samples, and no crayfish, caverns, voids and scratches were found. As a treatment to ensure the flatness of the upper and lower bases of the samples, wet grinding was performed using a corundum shield. After chamfering and grinding, the lengths and diameters of the holes in the samples were measured. The length was measured along the peripheral surface of the four sections, the diameter at the upper and lower bases and at half the height of the sample. The average measurement results are presented in Table A6, Appendix A.
Then, the samples were dried to dryness in a climate chamber at a temperature of 105 °C. The test results are presented in Table A6, Appendix A.
The tests were performed on nonstandard core samples, as recommended by the standard PN-EN 13791:2008 [31]. Relationships (2) taken from this standard were used to convert the compressive strength, taking into account both the proportions of the dimensions of the samples h/d and the volume:
f c f c , c u b e = 0.56 + 0.697 V 152 h d + h d f c , c u b e = f c 0.56 + 0.697 V 152 h d + h d
where V is the volume of the sample, h is the height of the sample and d is the dimension of the smallest side of the sample.
In accordance with the purpose of the tests, which was to determine the strength class of the concrete after 28 days of hardening, it was necessary to convert the strength obtained after t = 106 days into 28-day strength (according to point 4.3.1 of the PN-EN 206-1:2003 standard [32]). The recommendations of the PN-EN 1992-1-1:2008 standard [33] were used, according to which the compressive strength after time t depended on the type of cement, temperature and curing conditions.
f c m t = β c c t f c m f c m = f c m t / β c c t
β c c t = e x p s 1 28 t
where f c m t —average compressive strength of concrete at the age of t days; f c m —average compressive strength after 28 days; β c m t —coefficient depending on the age of concrete; t—age of concrete in days; s = 0.2—coefficient depending on the type of cement. After assuming the value of the coefficient s = 0.2 (cement CEM 52.5 R), the values of the coefficient β c m t were determined and then the strength after 28 days of curing was determined. The calculation results obtained are presented in Table A6, Appendix A.
Then, in accordance with the requirements of the PN-EN 13791:2008 standard [31], with the number of core samples being n = 6, the criteria corresponding to case B were used when qualifying concrete to a given class. The characteristic compressive strength of the concrete in the structure was the lower of the values determined from the relationship for k = 7.
f c k , i s = f m n , i s k = 78.0 7.0 = 71.0   N / mm 2 ,   or  
f c k , i s = f i s , l o w e s t + 4 = 71.4 + 4 = 75.4     N / mm 2  

3.11. Determination of the Migration and Diffusion Coefficient of Chloride Ions

The rate of chloride ion penetration into wet concrete is described by diffusion coefficients. Therefore, a very important issue, especially in the case of prestressed concrete structures, is to precisely determine the value of the diffusion coefficient. Currently, there are many valid standard methods for determining the value of the diffusion or migration coefficient. Since different test conditions apply to each method (concentration of the source solution of chlorides, type of target solution and different duration of the test; in migration tests—the value of the applied voltage), the results of the diffusion or migration coefficients obtained using different standard tests differed from each other.
The chloride permeability test through concrete was carried out using the electric field adopted as a standard test in the standard ASTM C1202-97 [34]. The electric charge passing through the given samples was measured and, on this basis, the chloride permeability through the concrete was assessed. The permeability of concrete was determined depending on the load Q flowing through the sample. The value of the flowing load was obtained for each of the three samples. Based on the determined charge, the value of the diffusion coefficient was also calculated using the Nernst–Einstein equation:
D N E = R T z 2 F 2 t i C i γ i ρ B R ,         ρ B R = 100 σ ,       σ = Q L V t A ,
where D N E is the diffusion coefficient (m2/s), R is the universal gas constant (J/Kmol), T is the absolute temperature (K), z is the valence of the ions (-), F is the Faradays constant (C/mol), t i is one transport number of chloride ions (-), γ i is one activity coefficient of chloride ions (-), C i is the concentration of chloride ions (mol/m3), ρ B R is the volumetric resistivity (Ωm), σ is the conductivity (Ωm−1), L is the sample thickness (m), V is the electrical potential (V), A is the cross-sectional area of a sample (m2) and t is time (s).
Another method used was described in the Norwegian NT standard BUILD 492 [35]. Concrete discs with a thickness of 50 mm and a diameter of 100 mm were used for the tests. The samples were soaked with lime water under vacuum conditions. After the test, one of the three tested discs was divided into two parts along its axis and then sprayed with a 0.1 M solution of silver nitrate AgNO3; after approximately 15 min, the depth of the chloride penetration x d was measured using the colorimetric method (based on a visually determined color change at the edge of the concrete samples). Following the NT BUILD 492 [33] standard, the D M   migration coefficient was calculated.
The test was carried out following the standard ASTM C 1556-03 [36]. Concrete discs with a thickness of 50 mm and a diameter of 100 mm were used for the tests. All surfaces of the samples were insulated with resin, except for the top surface. Then, the samples were placed in lime water until completely saturated and then stored in a closed container immersed in 16.5% NaCl solution for 5 weeks (35 days). The concentration level of chloride ions in the water extract obtained from the fragmented concrete collected in layers was determined using a Profile Grinding Kit device with a diamond drill and an attachment, enabling the collection of concrete layers with a thickness of 2 mm to a depth of 20 mm. The value of the D coefficient according to the methods included in the American ASTM 1556 [36] was determined by adjusting the chloride concentration graph. This graph was obtained by calculating the distribution of the chloride ion concentration expressed in the cement mass according to the solution of the diffusion equation with the concentrations of these ions determined in the test.
Modified tests were carried out on the test stand shown in Figure 5. Plastic tanks filled with a 3% NaCl solution were tightly attached to the upper surface of the cylindrical samples with the sides protected with epoxy resin. In tank (1), there was a cathode (2) composed of stainless steel and adjusted in size to the cross-section of the tested element (3). The elements (3) were placed on a damp sponge (4), under which a platinum-coated titanium mesh anode (5), immersed in water, was placed. Then, the samples were subjected to an electric field U = 18 V, inducing the migration of chloride ions. The test was conducted in two time intervals: t1 = 24 h and t2 = 48 h. After the chloride migration tests were completed, the elements were dried for 72 h under laboratory conditions. The layered grinding of concrete was carried out with a specialized device called the Profile Grinding Kit by Germann Instruments using the method described [37].
Based on the mass density of chloride ions determined on the thickness of the concrete cover at two different test times for the migration of chloride ions in the concrete, the values of the diffusion coefficient were determined. The method was described in detail in reference [37].
The purpose of the durability tests was to determine the value of the coefficient of migration and the diffusion of concrete chlorides taken directly from prefabricated prestressed concrete slabs of the HC-500 type according to standard methods and on the basis of a thermodynamic migration model and using an inverse methodology. Methods of determining these coefficients and test results were described in detail in the papers [20,21,38].
In this study, the concrete resistivity was additionally calculated on the basis of directly measured concrete resistivity according to the standard ASTM C1760 [37]. The samples directly cut from the upper surface of the HC-500 floor slabs were stored in saturated lime water until the concrete pores were completely saturated before testing the resistivity according to ASTM C1760 [39]. Then, the concrete resistance was measured using a special device for measuring the resistance of concrete—CMT Instruments Resistivity Meter—shown in Figure 6.
The diffusion coefficients were calculated using the Nernst–Einstein equation, Equation (7).

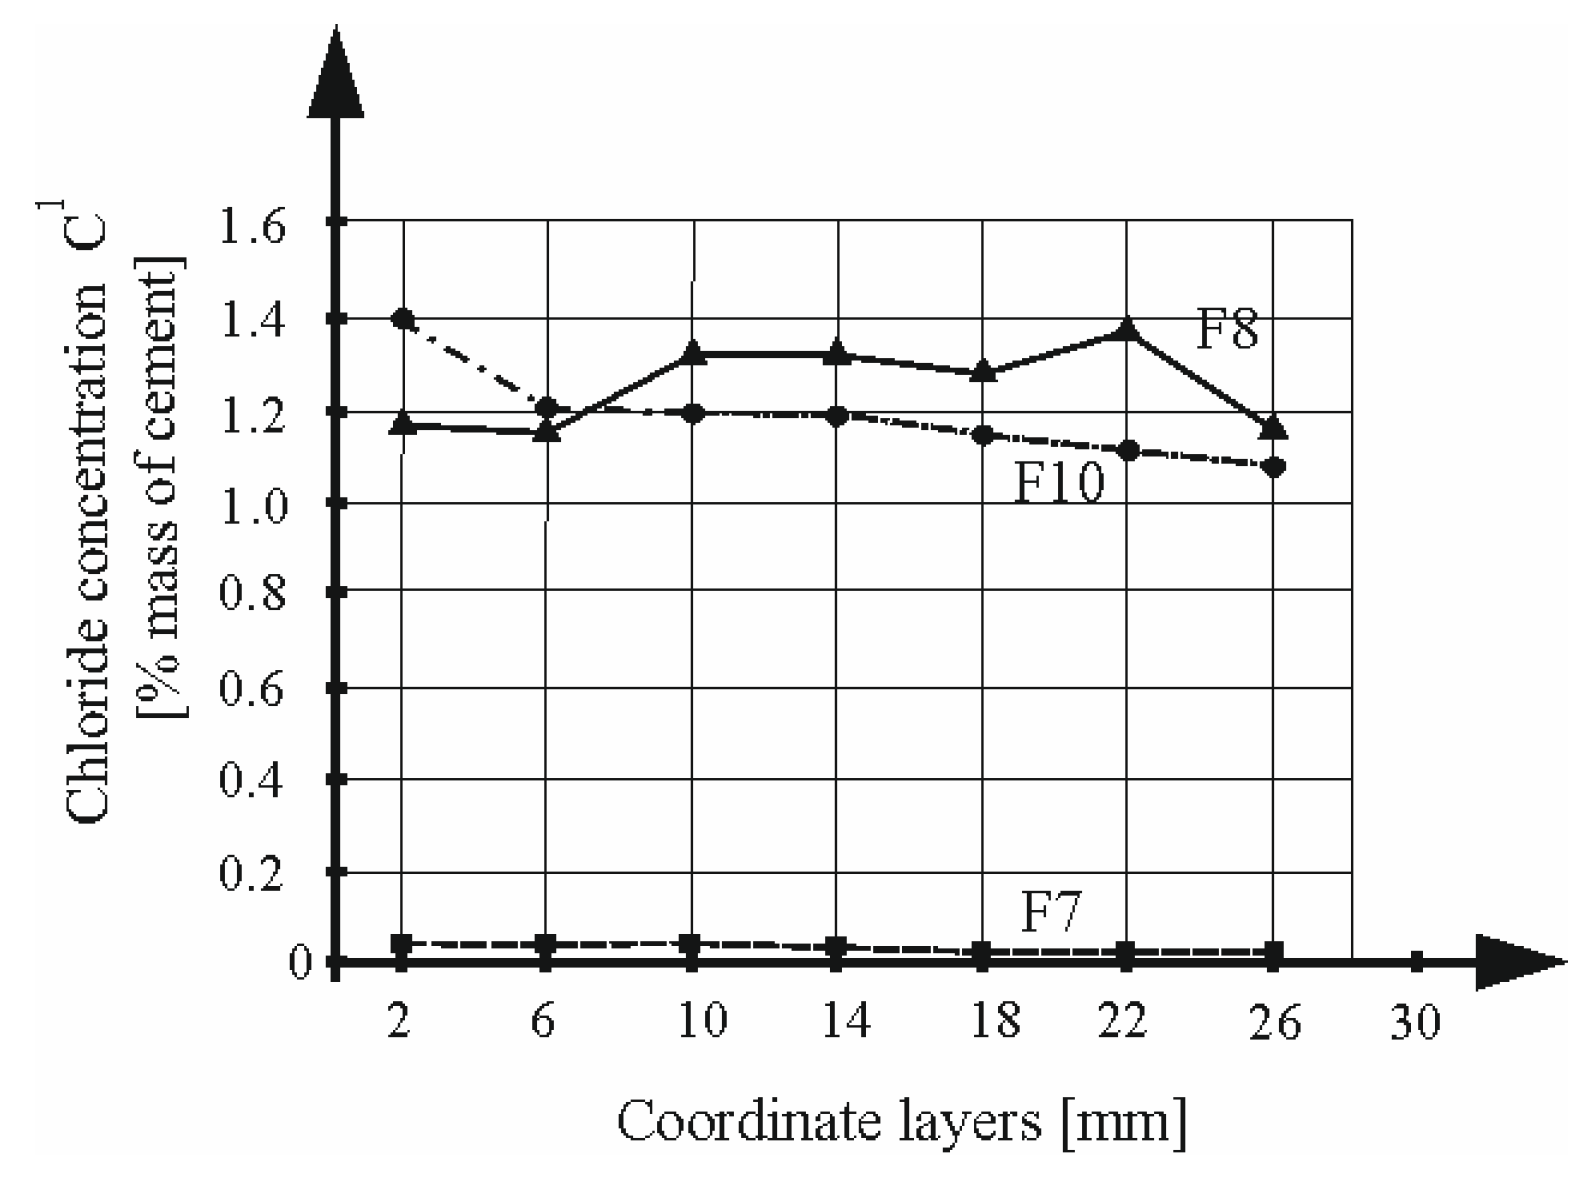
3.12. Accelerated Ingress of Chloride Ions to Cause Corrosion

In order to accelerate the very long diffusion time of chlorides in the concrete, the accelerated electromigration of chloride ions was used (Figure 7), while the corrosion processes caused by the threshold content of chlorides in the concrete occurred naturally. This process was described in detail in works [40,41]. Prior to the start of the accelerated migration of chlorides into the concrete, control polarization tests were performed using the EIS and LPR methods.
Electrodiffusion was completed after 21 days. After this period of time, further polarization studies were performed using the EIS and LPR methods. Then, in three selected samples (F7, F8 and F10), the chloride profiles were determined on the thickness of the cover. The Profile Grinding Kit from Germann Instruments was used to crush the concrete in seven levels in layers at a thickness of 4 mm. The exact process of preparing the solutions was described in [37]. Twenty-one aqueous extracts were prepared, modelling concrete pore water. The aqueous extracts were subjected to a chemical analysis to determine the concentration of chloride ions in the pore water with the use of the multifunctional multimeter CX-701 by Elmetron, using an ion-selective electrode to determine the concentration of chloride ions. Taking into account the density values of the concrete—2493 kg/m3—and the cement content in the concrete—480 kg/m3—the concentration of chloride ions expressed in percentage was calculated with reference to the cement mass in the concrete. Work [37] presents a set of formulas that were used to determine the concentration of chloride ions in relation to the mass of the cement.

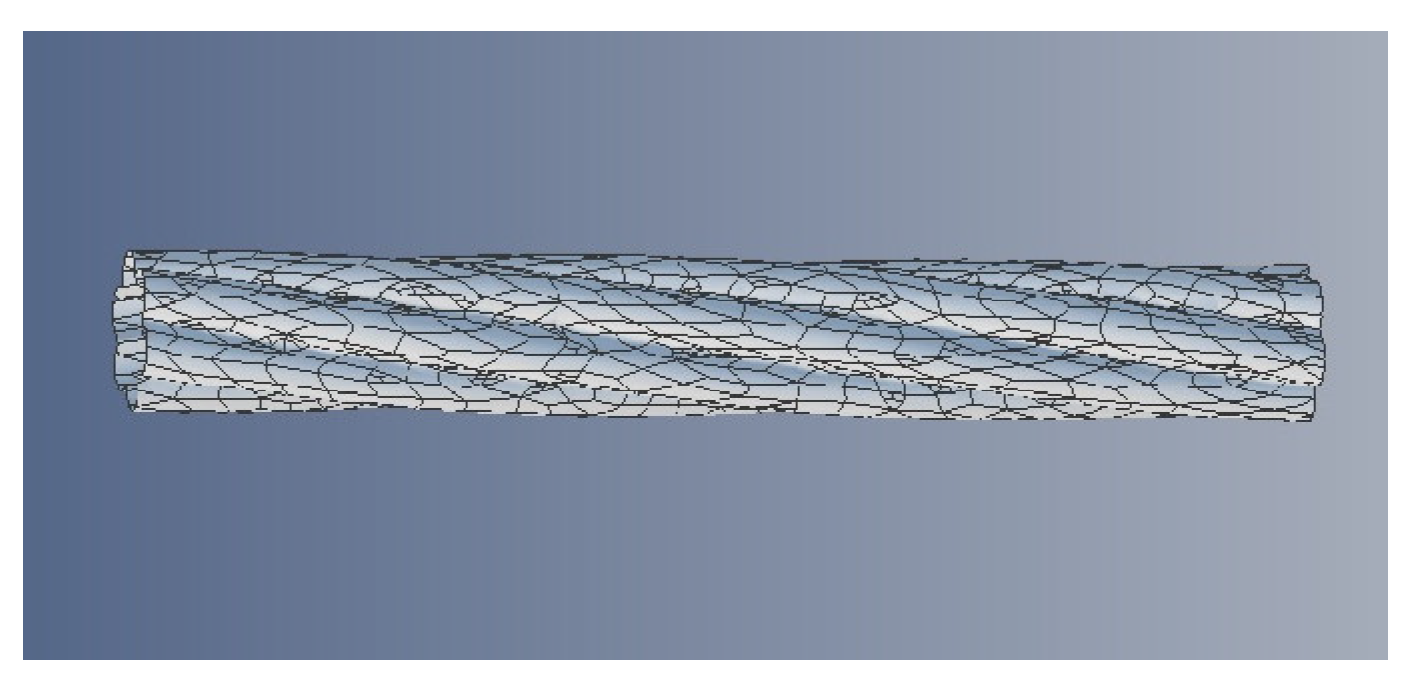
3.13. Determining the Surface of Reinforcing Strings with the Use 3D Scanning

The surface area of the reinforcing strut strands used in the HC-500 plates was determined using the laser scanner Model Maker MMDx100 from the Nikon Metrology company (Leuven, Belgium). The operation of the MMDx100 scanning head using ESP3 technology was based on the emission of a 100 mm wide laser beam with a declared accuracy of 20 µm. The scanning of the steel reinforcement strut strands was performed using the Nikon Metrology seven-axis MCAx20 measuring arm (Leuven, Belgium), with a measuring range of 2.0 m, a point accuracy of 0.023 mm and a spatial accuracy of 0.033 mm.

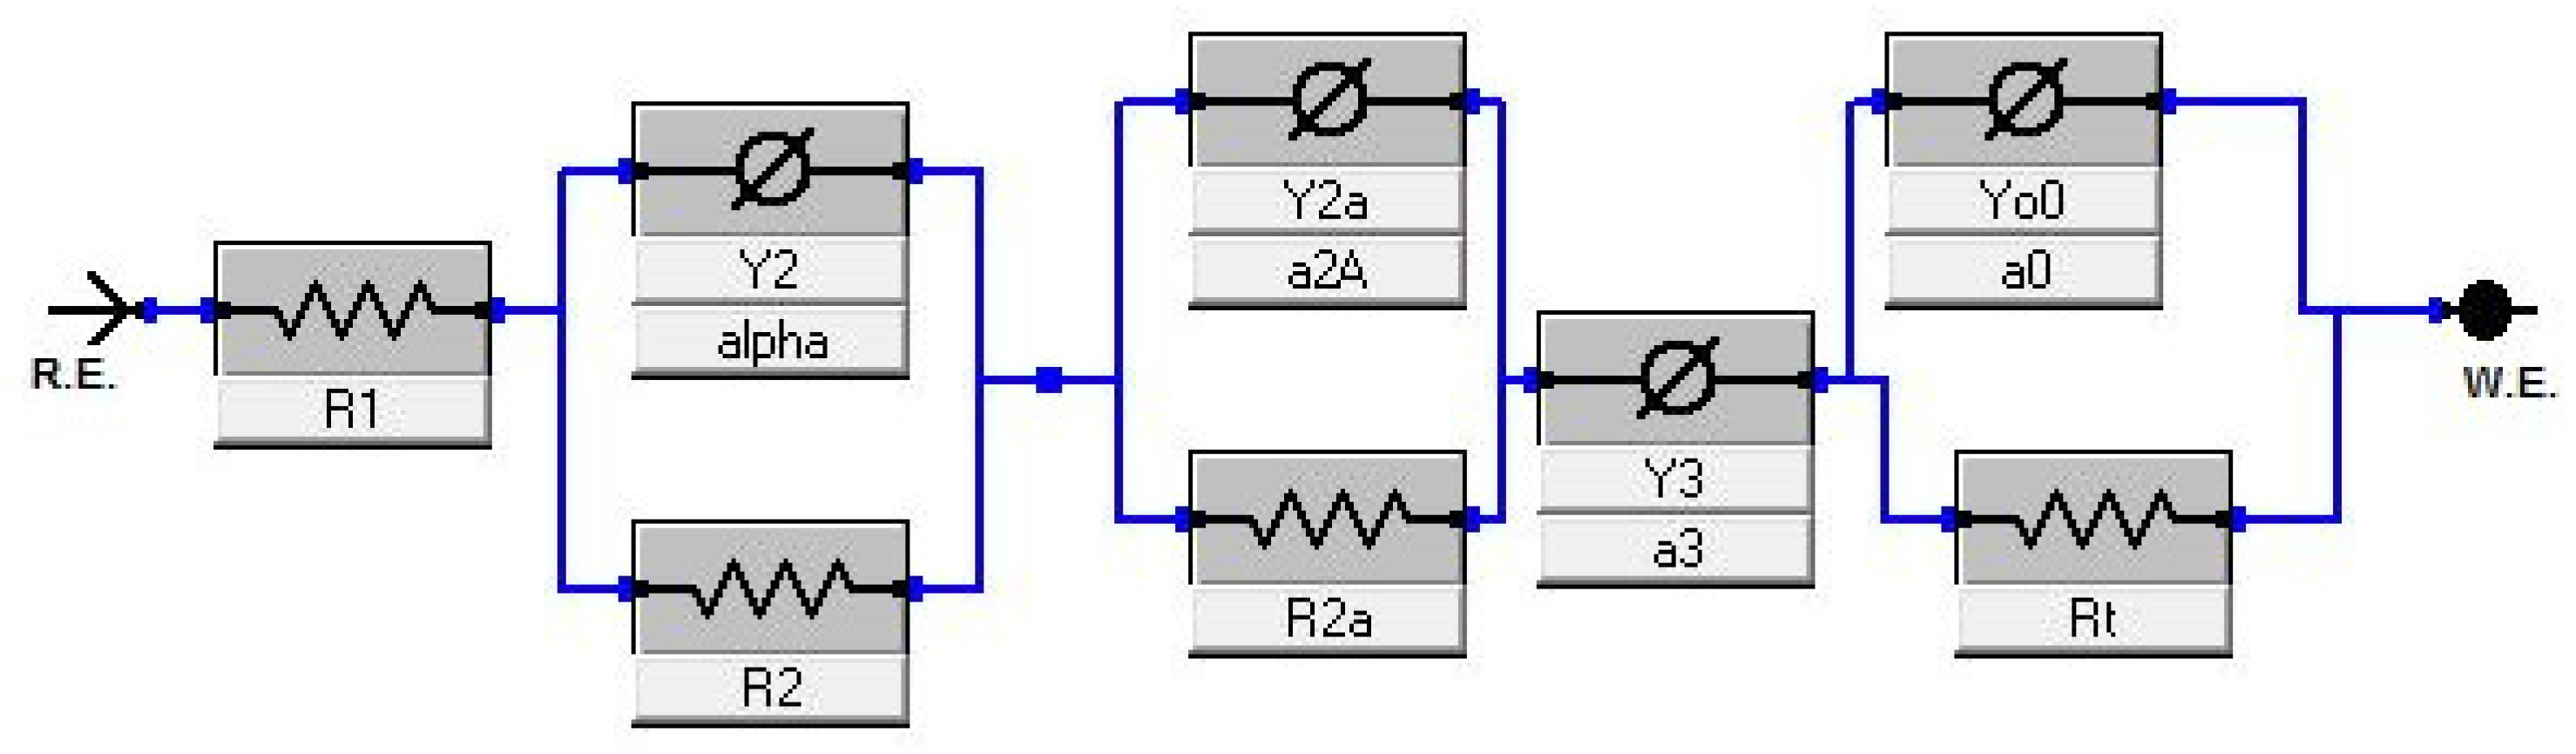
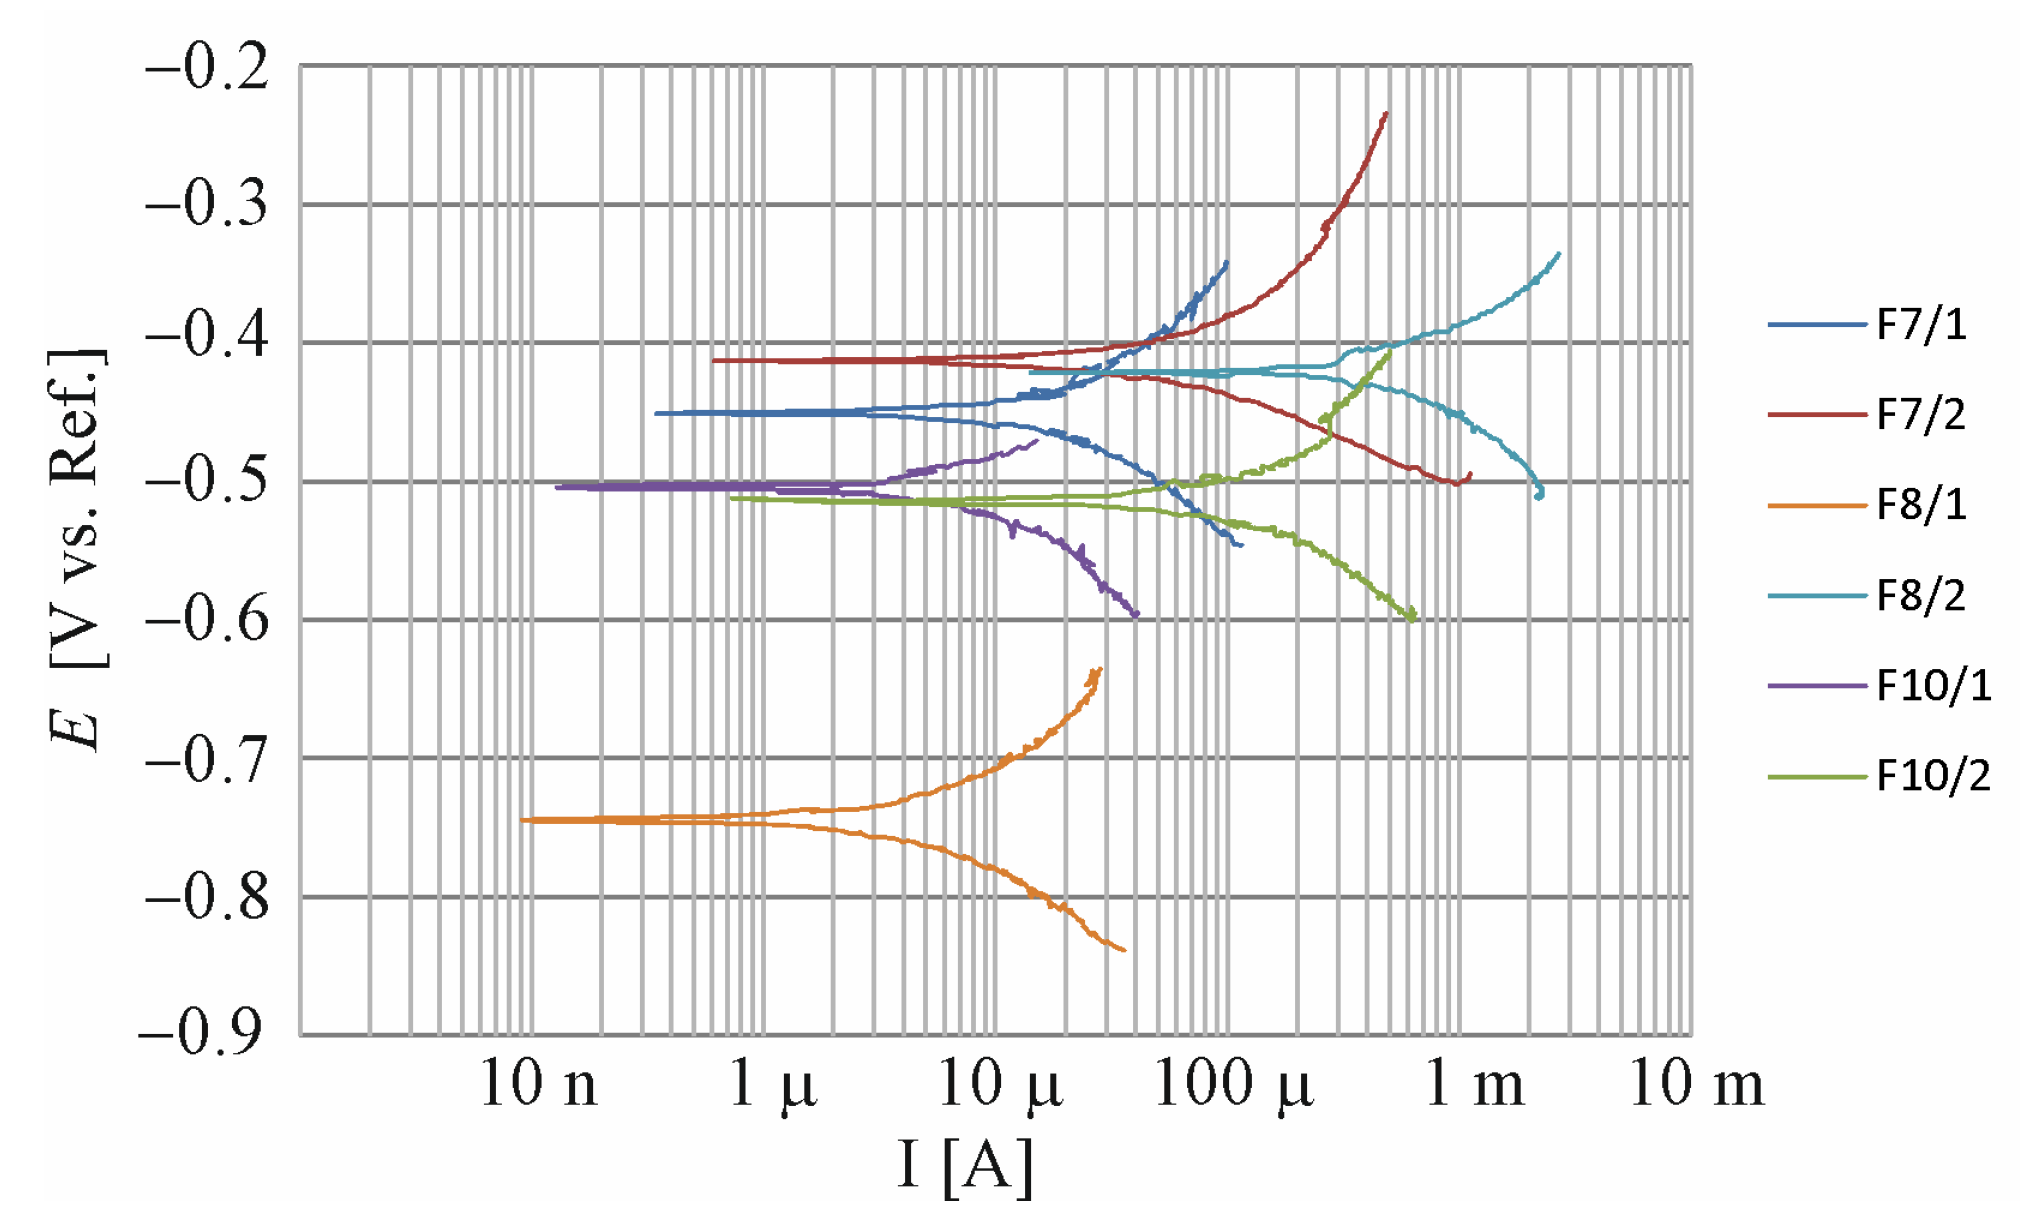
3.14. Measurements of Linear Polarization Resistance (LPR) and Electrochemical Impedance Spectroscopy (EIS)

Measurements of the linear polarization resistance (LPR) consisted of bringing the tested electrode 1 (reinforcing strand) out of the equilibrium state by means of the applied potential difference linearly varying in the accepted range. Potential changes measured with reference electrode (Cl/AgCl, Ag) 5 were caused by the auxiliary electrode 3 connected to the current source in the potentiostat (Gamry Reference 600) 2. By registering the potential changes as a function of the system response expressed as the current density, a polarization curve was obtained (the current density was the quotient of the current intensity I and the active surface area of the electrode A). The semilogarithmic polarization curve was the basis for the graphical determination of the corrosion current density. Figure 8 shows a scheme and view of this experimental study.
The results of such tests were the corrosive current densities, clearly defining the corrosion rate of the reinforcement. The corrosion current (Icorr) could be calculated via the polarization resistance (Rp) obtained through a LPR measurement according to the Stern–Geary equation after determining the values of coefficients b a and b c , which were the constants of the anodic and cathodic reactions, respectively,
I c o r r   =   b a b c 2.303 b a + b c R p
The corrosion current density (icorr = Icorr/A) was related to the linear corrosion rate CR (mm/year) determined using the following equation:
CR = 0.011 icorr
The CR coefficient determined the average loss of the bar cross-section along the circumference in mm, which occurred for 1 year of service life of the structure.
The electrochemical impedance spectroscopy (EIS) method was carried out with the same measurement system, as shown in Figure 7, while the interaction with the test electrode (reinforcement) was carried out with an alternating current of small potential amplitude over a wide frequency range. As a result of the sinusoidal disruption of the potential of the test electrode, an impedance spectrum was obtained that characterized the response of the corrosion system (reinforcement in concrete). The measured impedance determined the apparent resistance of the electrode (reinforcement) to the flowing alternating current. The corrosion system behaved similarly to an electrical system composed of a suitable combination of electrical elements (resistor, capacitor and coil). Therefore, the analysis of the measurement results was carried out using an appropriately selected electrical equivalent scheme, the individual elements of which characterized the electrical and electrochemical properties of the system under study—reinforcing steel in concrete.
To analyze the impedance spectra obtained on the reinforcement of cut concrete cores, the electrical equivalent scheme shown in Figure 9 was adopted [42].
In the above diagrams R1 was identified with the resistance of the liquid phase, while R2 and R2a characterized the resistance of the double layer at the interface between the liquid and solid phases of the concrete, whose capacitance was described by the parameters Y2, α2, Y2a and α2a of the solid-phase elements—CPE. The electrochemical properties of the steel–concrete transition zone were described using CPE with parameters Y3 and α3. Meanwhile, the double layer at the interface between the pore liquid and the reinforcing steel was described using CPE with parameters Y0, α0 with a parallel-connected charge transfer resistance Rt. The parameter Rt with some simplifying assumptions could be equated to the polarization resistance Rp and, when inserted into Equation (8), the corrosion current density icorr could be calculated.
In order to confirm the results obtained in the electrochemical tests, fragments of the reinforcement tested in the electrochemical measurements were removed from the samples (F7, F8 and F10).

3.15. Examination of Concrete Porosity

The examination of the concrete porosity was conducted using X-ray-computed microtomography. The test was carried out for a concrete core with a diameter of approx. 3.8 cm and a height of 5 cm cut from the HC-500 plates. The tomographic analysis of the research material was carried out using the Nikon Corporation Industrial Metrology Business Unit, Tokyo, Japan, XT H 225 ST industrial, with a reflective lamp, which, with the maximum approximation of small samples, allowed us to obtain a resolution of 3 µ. The magnification in the computed tomography was a geometric magnification, so the closer the examined object was to the radiation source, the higher the resolution was of the output data. The purpose of the tomographic analysis was to detect the smallest possible pores in the concrete, which was why the smallest research elements were scanned. However, in the case of the concrete samples, in order to be able to X-ray the material, a compromise had to be found between the desire to detect the smallest possible porosity and the power needed to X-ray a material with these parameters. Thanks to the higher power, it was possible to X-ray denser materials; however, with its increase, the final resolution of the obtained data decreased, losing their sharpness. It was established that, in this case, the optimal resolution would be 10 µ, which gave reliable results and allowed for the samples to be scanned without any problems. The resulting images were then reconstructed in the same way for each core using Nikon’s CTPro 3D sixth-generation software. After the reconstruction, data preparation and the entire analysis were performed using dedicated tools available in the VGStudio MAX 3.1 software. Before the defectoscopy was performed, an area with a diameter of 38 mm and a height of 40 mm, slightly smaller than the scanned area, was extracted from each of the scanned cores. Trimming was required due to artifacts and imperfections in the tomographic image created during scanning, which, if not removed, would have had a negative impact on the results of the analysis. Only such prepared data were analyzed for porosity.
In addition, the open porosity was also determined according to the method described in the works [38,41].

4. Results

4.1. Result of Determining the Early Shrinkage from the Moment of Forming

On the basis of the tests performed, a shrinkage of 1.55 mm/m was obtained in 24 h. However, the maximum contraction occurred after 13 h 30’, and was equal to 1.56 mm/m—Figure 10.
It should be emphasized that the beam was free to deform; the friction in this case was minimized. This was one of the reasons why the amount of shrinkage after 24 h was large, although not the largest, taking into account the results obtained during the implementation of other research programs [24].

4.2. Result of Determining the Drying Shrinkage

The dynamics of the changes in the lengths of the elements were particularly high during the first 7 days of maturation. It was advisable to carry out a careful care process during this period. This was to minimize the risk of scratching due to shrinkage (Figure 11). The results are presented in Table A1, Appendix A.

4.3. Result of Determining the Shrinkage Ring Test

Due to the fact that the concrete ring was scratched on day 9 (between 7 and 14 days) and the stress increase index was 0.32 MPa/day (it was between 0.17 and 0.34 MPa/day) (Figure 12b), according to guidelines contained in the standard ASTM C1581-04 [25], the concrete should have been considered to have a medium–high susceptibility to scratching induced by contraction.

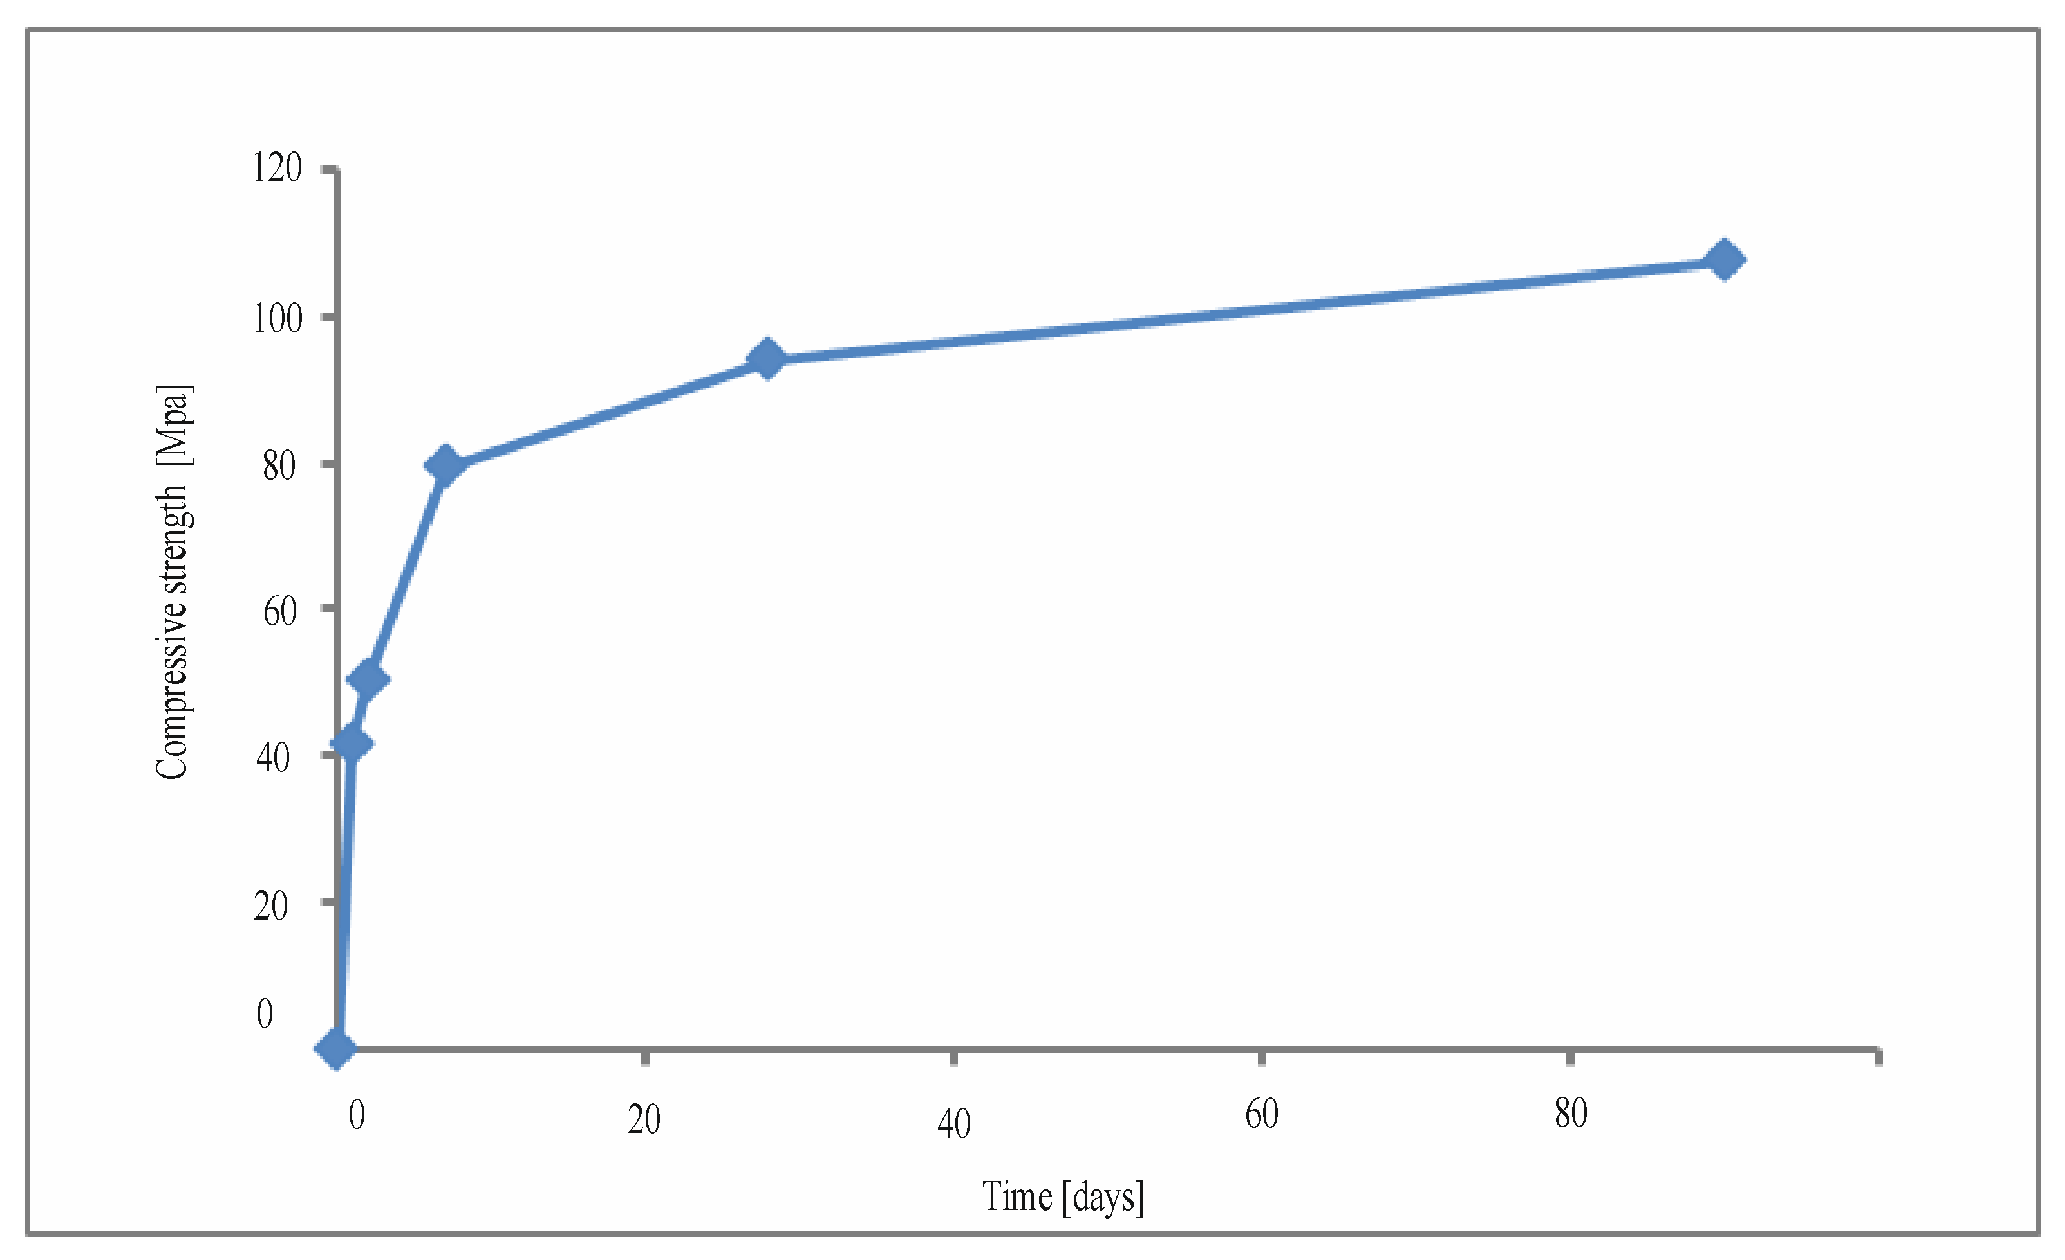
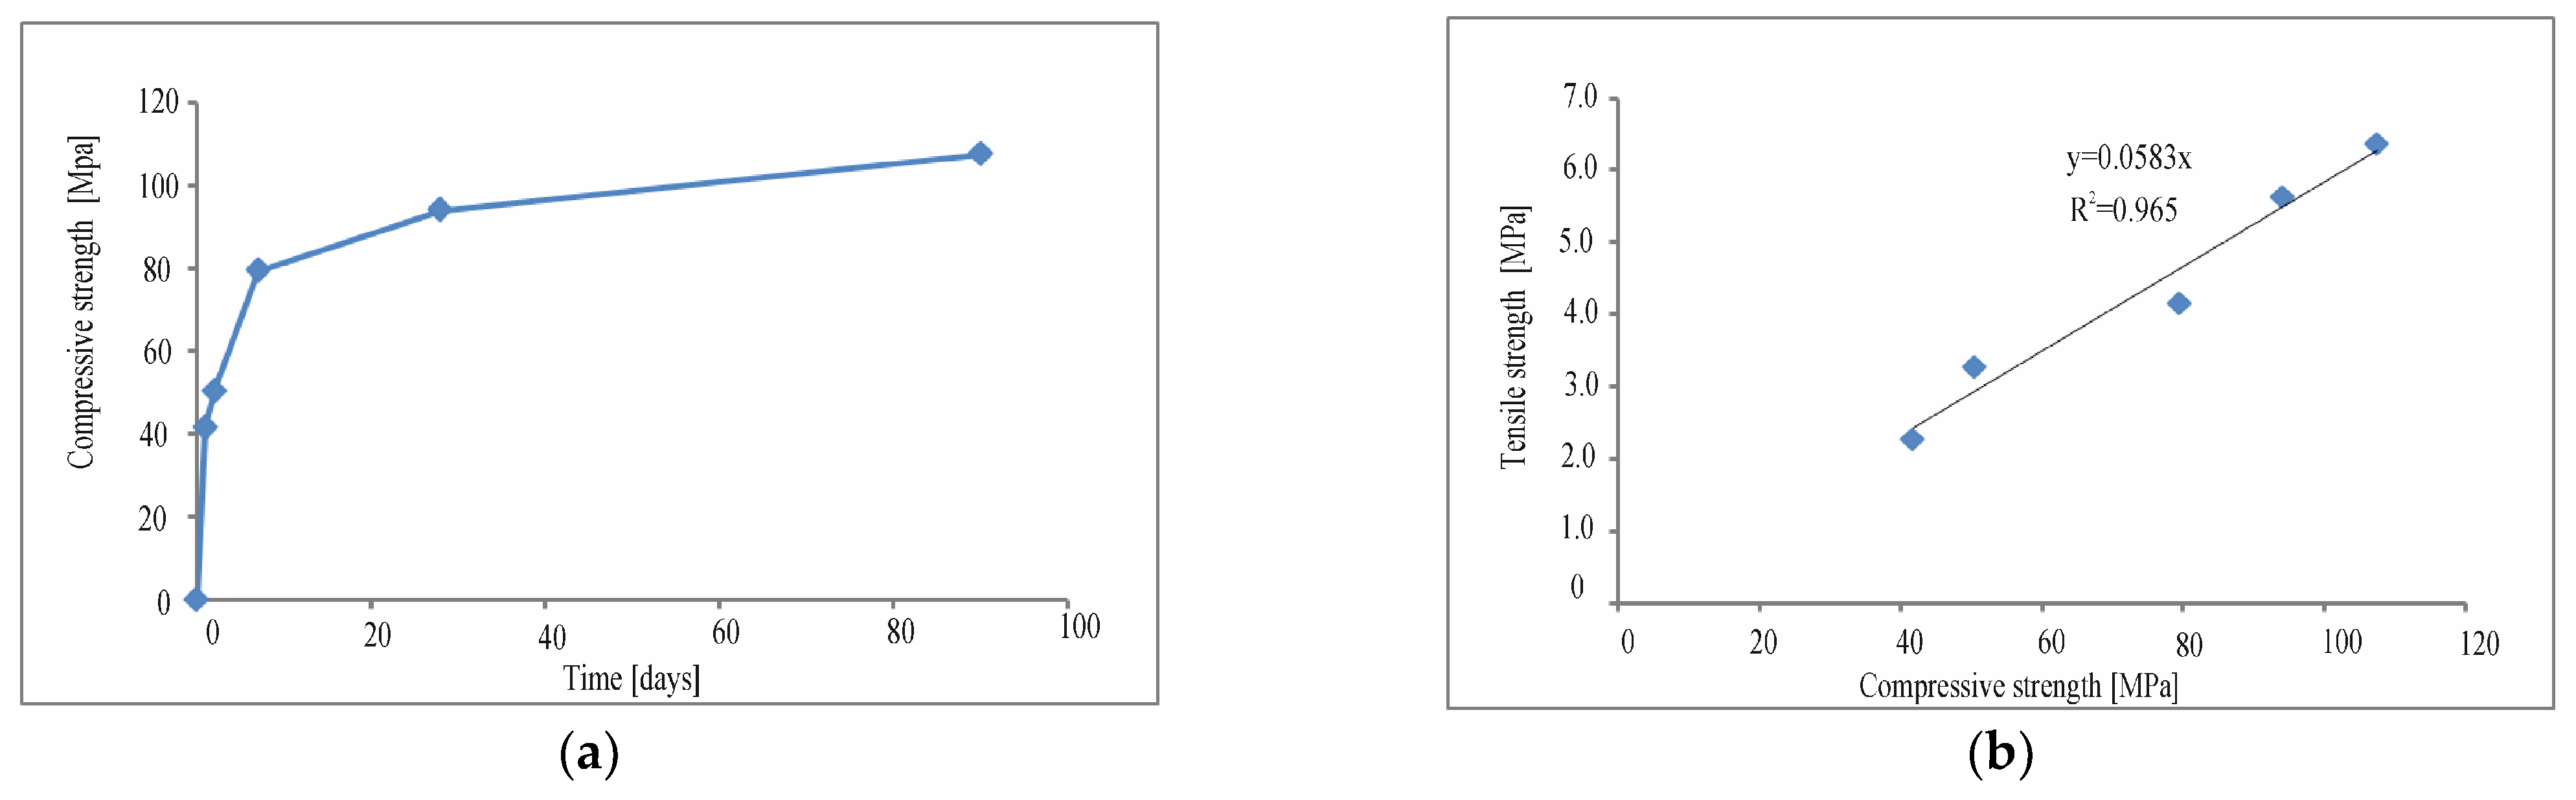
4.4. Result of Determining the Compressive Strength of Concrete

Figure 13 shows the compressive strength of the tested concrete.
The compressive strength of concrete was 41.6 Mpa; this was sufficient for the production technology of prestressed elements. The 90-day endurance increased in relation to the 28-day endurance by approx. 14% (Figure 13). The results are presented in Table A2, Appendix A.

4.5. Result of Determining the Flexural Tensile Strength Test after 1, 2, 7, 28 and 90 Days of Maturation

The bending tensile strength was approx. 6% of the compressive strength (Figure 14); this was in line with the literature data. The results are presented in Table A3, Appendix A.

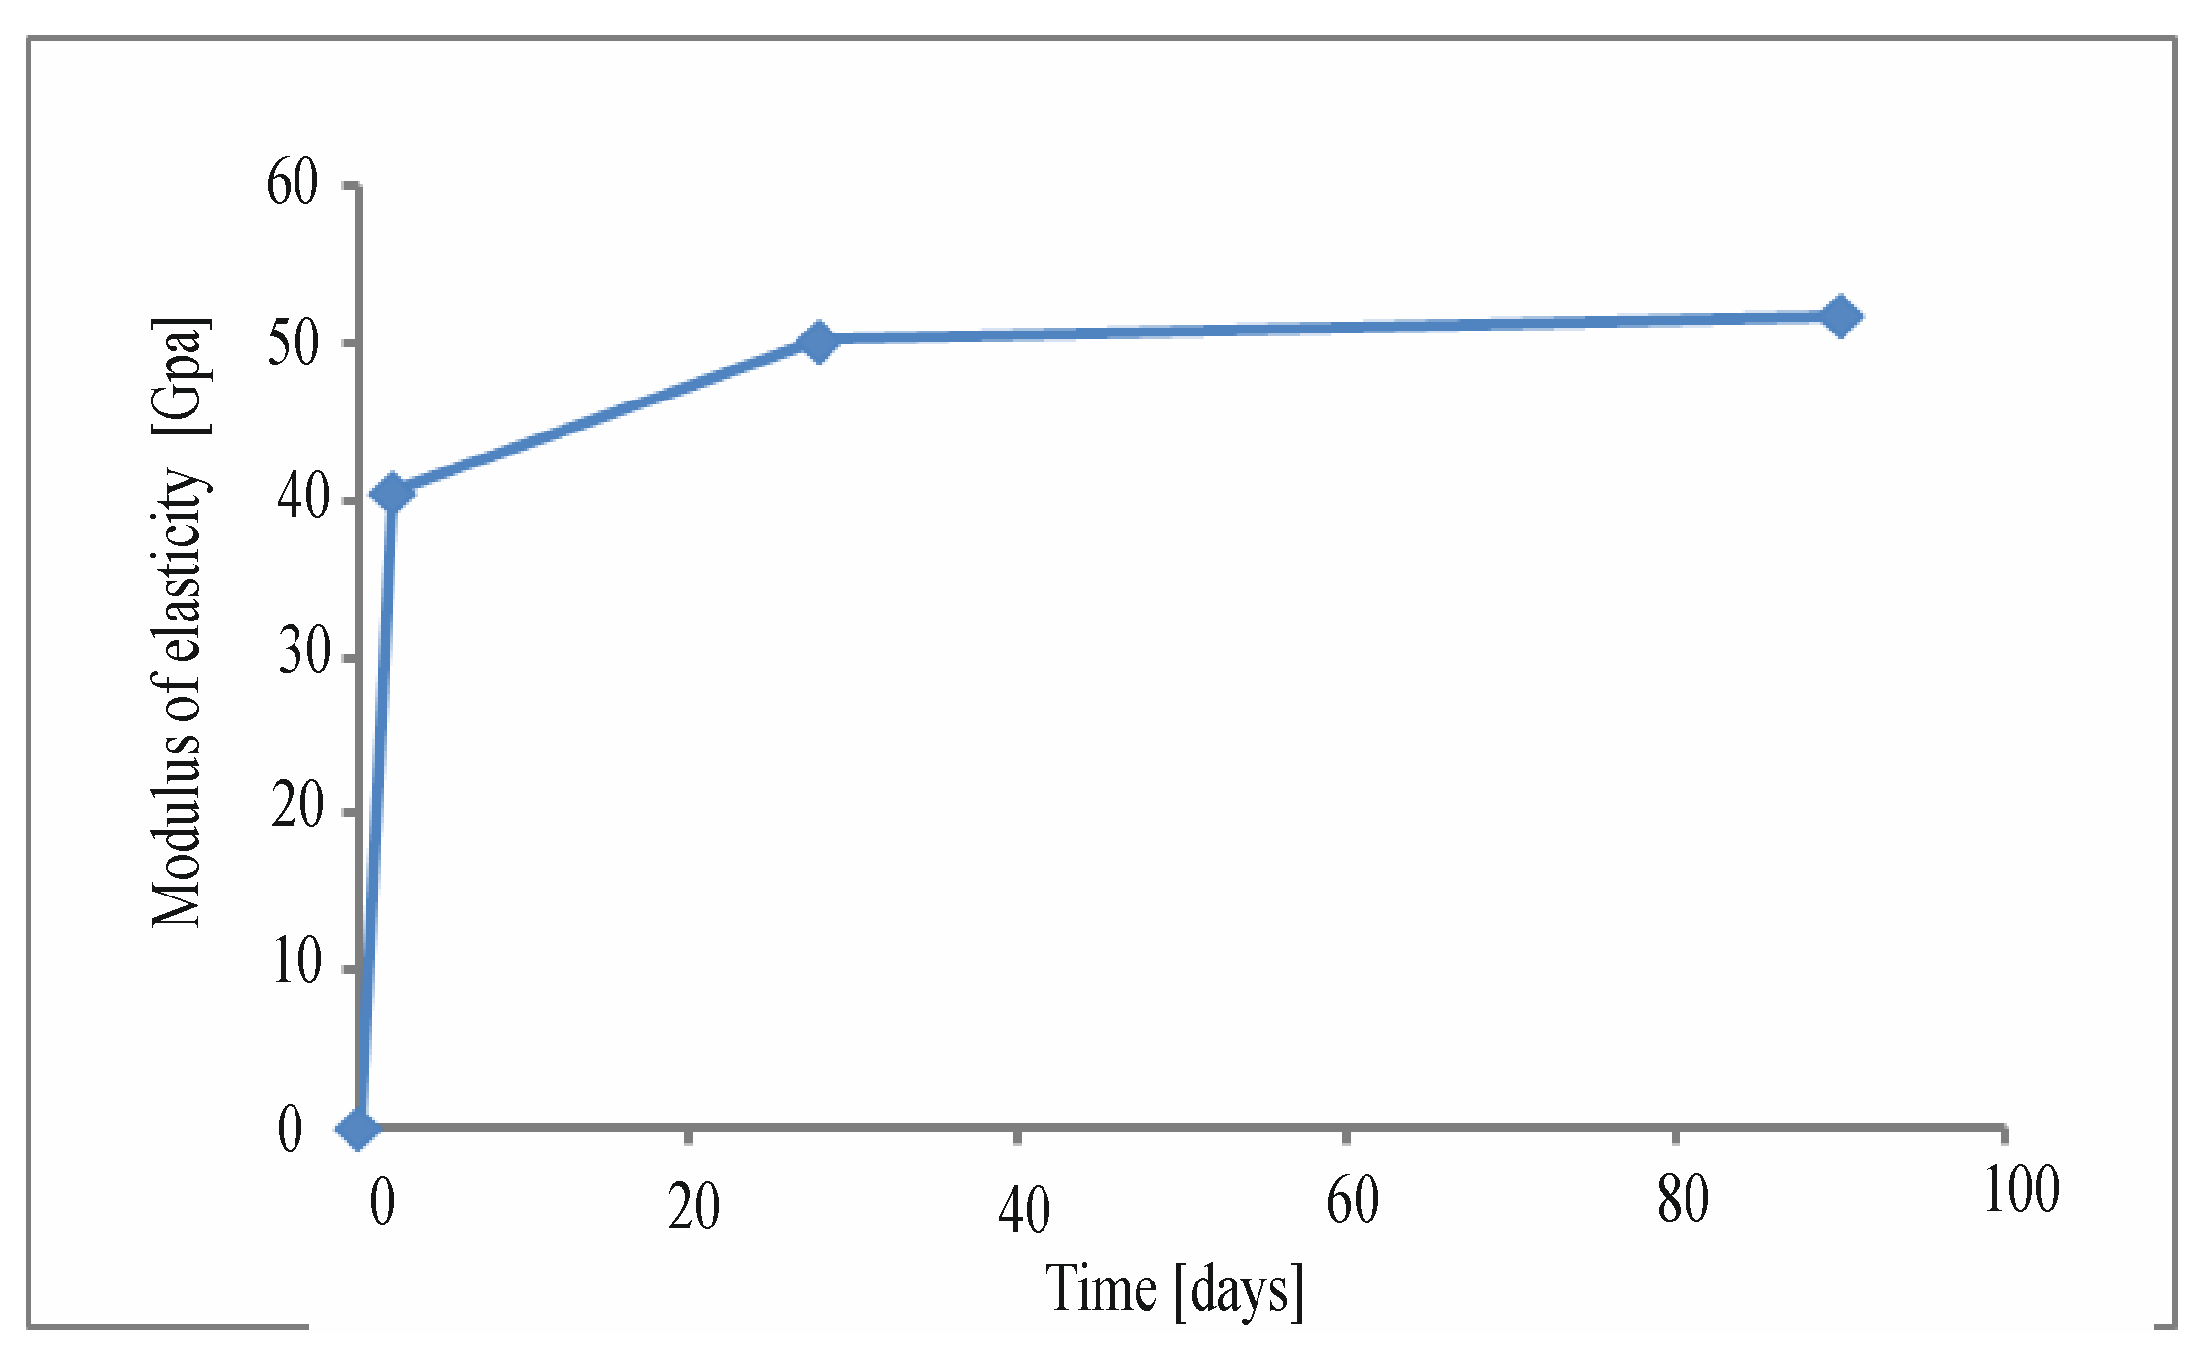
4.6. Result of Determining the Modulus of Elasticity

The modulus of elasticity after 2 days of maturation accounted for approximately 81% of the value after 28 days of aging and 79% of the elastic modulus determined in the 90 days of maturation (Figure 15). The results are presented in Table A4, Appendix A.

4.7. Result of Determination of the Depth of Penetration of Water under Pressure

The samples created in the laboratory were subjected to water pressure equal to 5 kPa for 72 h. Due to the fact that the samples after 28 days of maturing turned out to be resistant to water penetration, the test after 56 days of maturing was not performed (Figure 16a–c). The depth of the penetration of the water determined on the drilled samples (Figure 16d–f) was greater (34 to 10 mm), but it still allowed the concrete to qualify as a concrete of high hardness to the penetration of water under pressure.
Table 2 summarizes the depth of the penetration of water under pressure, as determined using the method outlined in the standard PN-EN 12390-8 [28], in three samples created in laboratory (FB1, FB2 and FB3) and drilled from prestressed slab (F1, F2 and F3).

4.8. Result Obtained in Tests of Frost Resistance of Concrete

The samples were subjected to 100 cycles of freezing and thawing. The test results are presented in Table A5, Appendix A.
The criteria for evaluating the resistance to cyclic freezing and thawing assumed a reduction in the compression strength and weight of the frozen samples relative to samples untreated with freezing. For concrete to be considered frost resistant, the decrease in its strength had to not exceed 20%, and the weight loss had to not exceed 10%. The test specimens showed no weight loss or decrease in strength due to the 100 freeze–thaw cycles. The concrete was frost resistant, at least for F 100. The test results are presented in Table A6, Appendix A.

4.9. Result of the Test of Resistance to Subzero Temperatures with the Use of Deicing Salts

The samples were 32 days old at the start of the test. The total mass of the exfoliated material collected after 28 cycles from the area of six samples was 1.49 g. The area of brine exposure and negative temperatures was equal to 0.0866 m2. The weight loss after 28 cycles was 0.017 kg/m2. The concrete met the requirements of category FT 2, for which the permissible peeling after 28 cycles could not exceed 0.5 kg/m2.

4.10. Result of Compressive Strength Test of Concrete Taken Directly from HC-500 Plates

Each sample was inspected after the tests (Figure 17), stating the correct method of destruction.
The assumed characteristic strength determined on the basis of the tests was equal to 71.0 N/mm2. Based on Table 1 of the PN-EN 13791:2008 [31] standard (which took into account the fact that the ratio of the characteristic strength of concrete determined in situ to that determined on standard samples was 0.85), the tested concrete could be classified as strength class C60/65 (fck,is,cube = 64 N/mm2). The test results are presented in Table A7, Appendix A.

4.11. Result of Determination of the Migration and Diffusion Coefficient of Chloride Ions

Values of the diffusion and migration coefficients determined according to the standards [34,35,36,39] and the thermodiffusion model described in detail in work [37] are presented in Table 3.

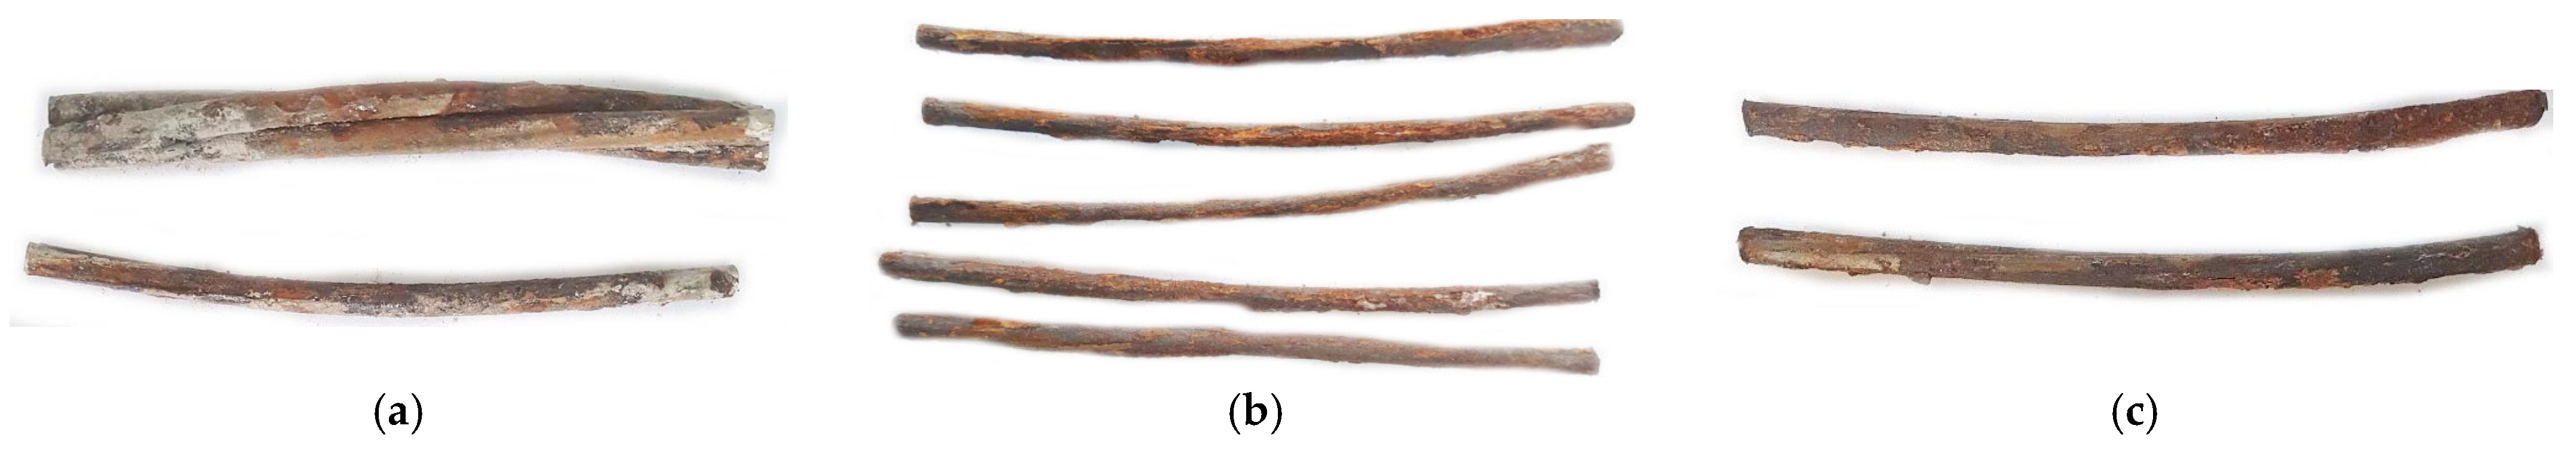
4.12. Result of Determining the Surface of Reinforcing Strings with the Use of 3D Scanning

Figure 18 shows a three-dimensional image of a fragment of a seven-strand rebar with a nominal diameter of 9.3 mm used in the tested samples cut directly from the upper surfaces of the HC-500 plates. The fragment of the reinforcement was scanned with the Model Maker MMDx100 scanner from the Nikon Metrology company as described in Section 3.13. The obtained point cloud data were processed with Focus software from the Nikon Metrology company; views of the surface area were dumped from the CAD Geomagic Design program. The surface of a seven-strand rebar was calculated using the three-dimensional scanning. The view of the surface area was dumped from the CAD Geomagic Design program. The calculated surface area of the ribbed rebar at the interface between the reinforcing steel and the concrete specimen over a distance of 96 mm was equal to 22.74 cm2.

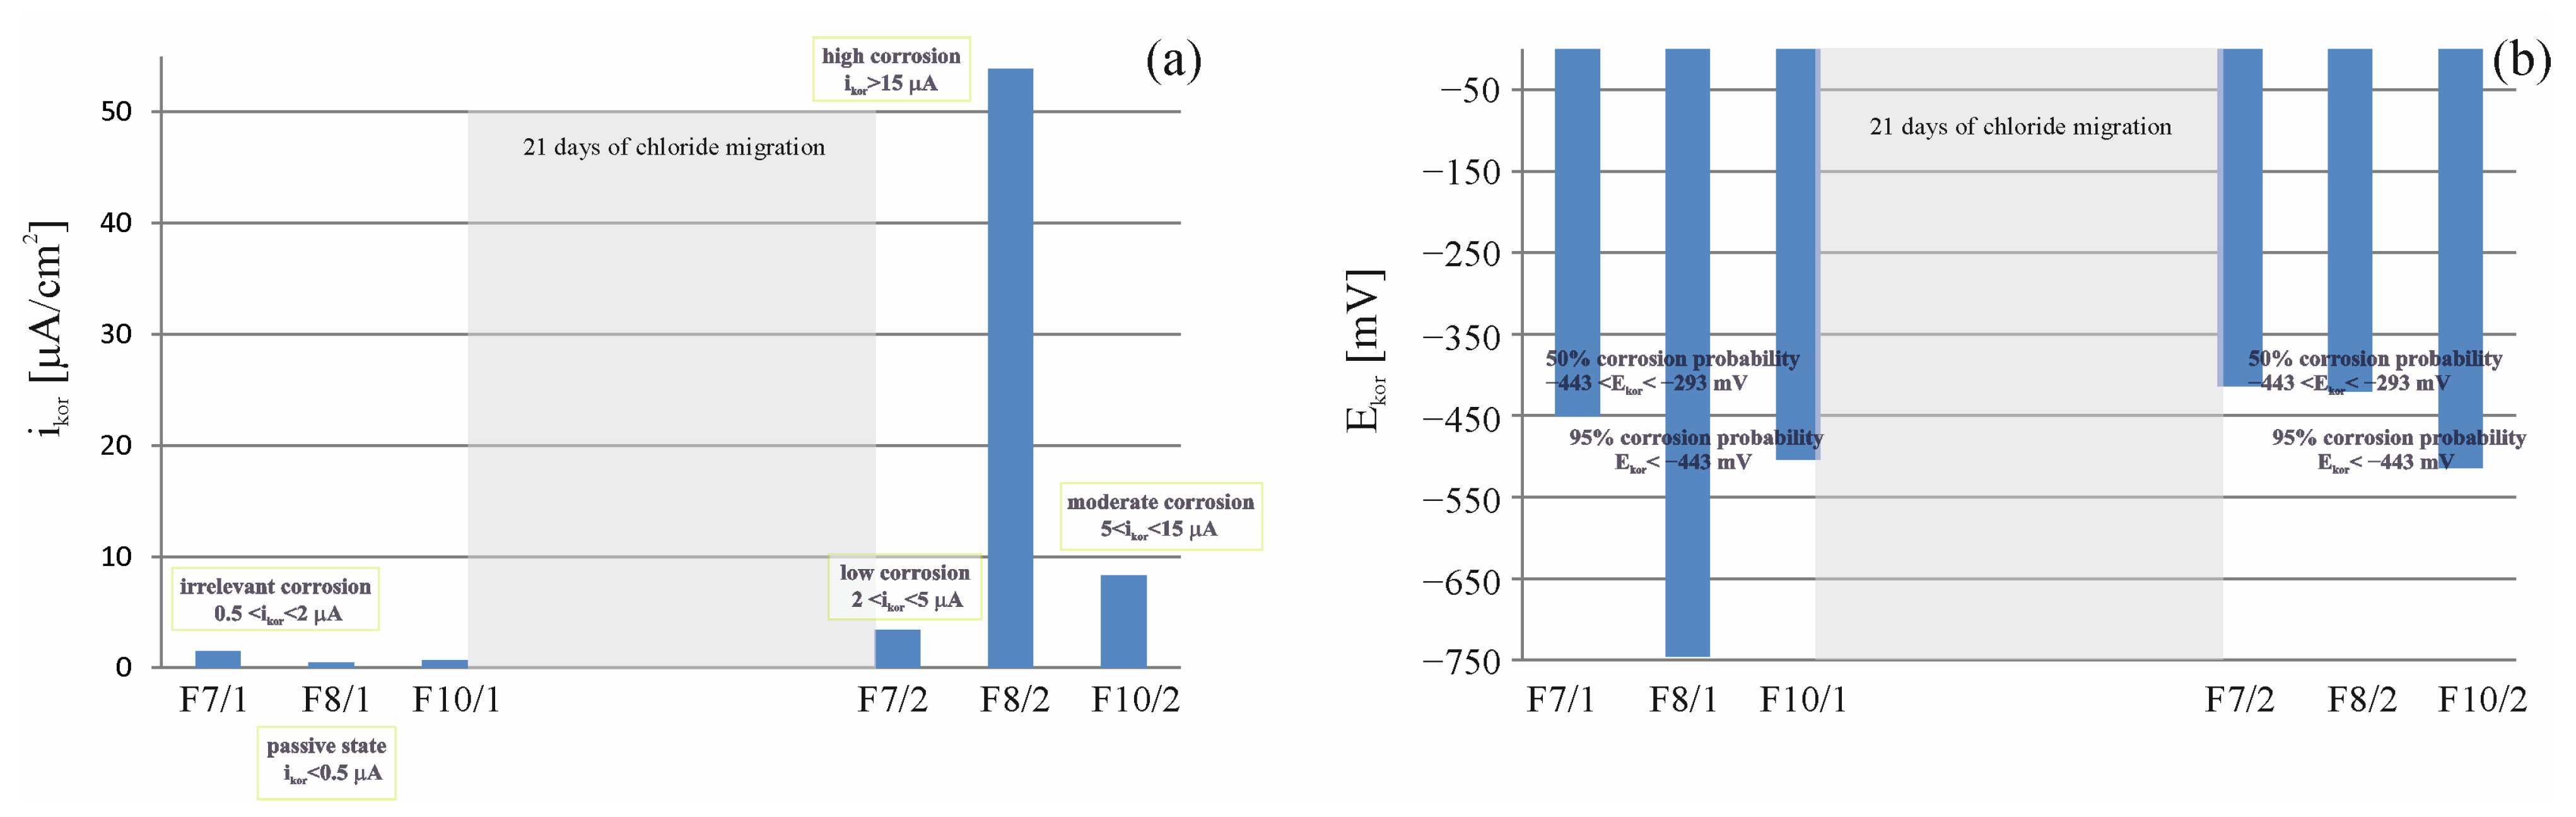
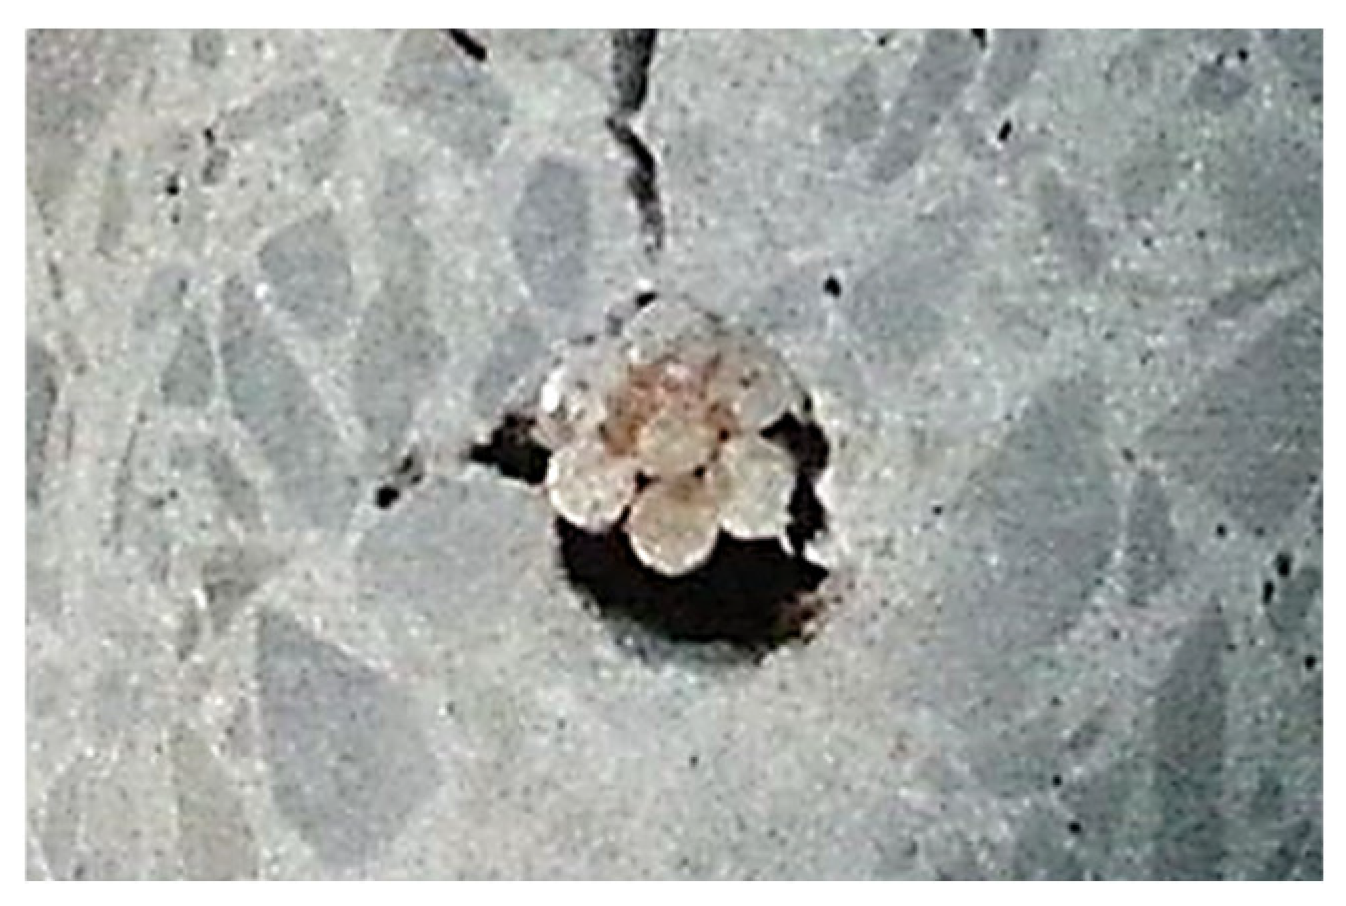
4.13. Result of Accelerated Ingress of Chloride Ions to Cause Corrosion

A graphical presentation of the calculated concentrations is shown in Figure 19.
In this way, the critical concentration of the CK of chloride ions at the surface of the reinforcement string strands causing the corrosion processes of the reinforcement was determined in individual samples and compared with the standards criteria. In the case of the FK7 sample, corrosion initiation was observed already at a concentration value of 0.03% of the cement weight, i.e., at an even lower value than recommended by the most restrictive American standard ACI 318M-02/318RM02 [43].

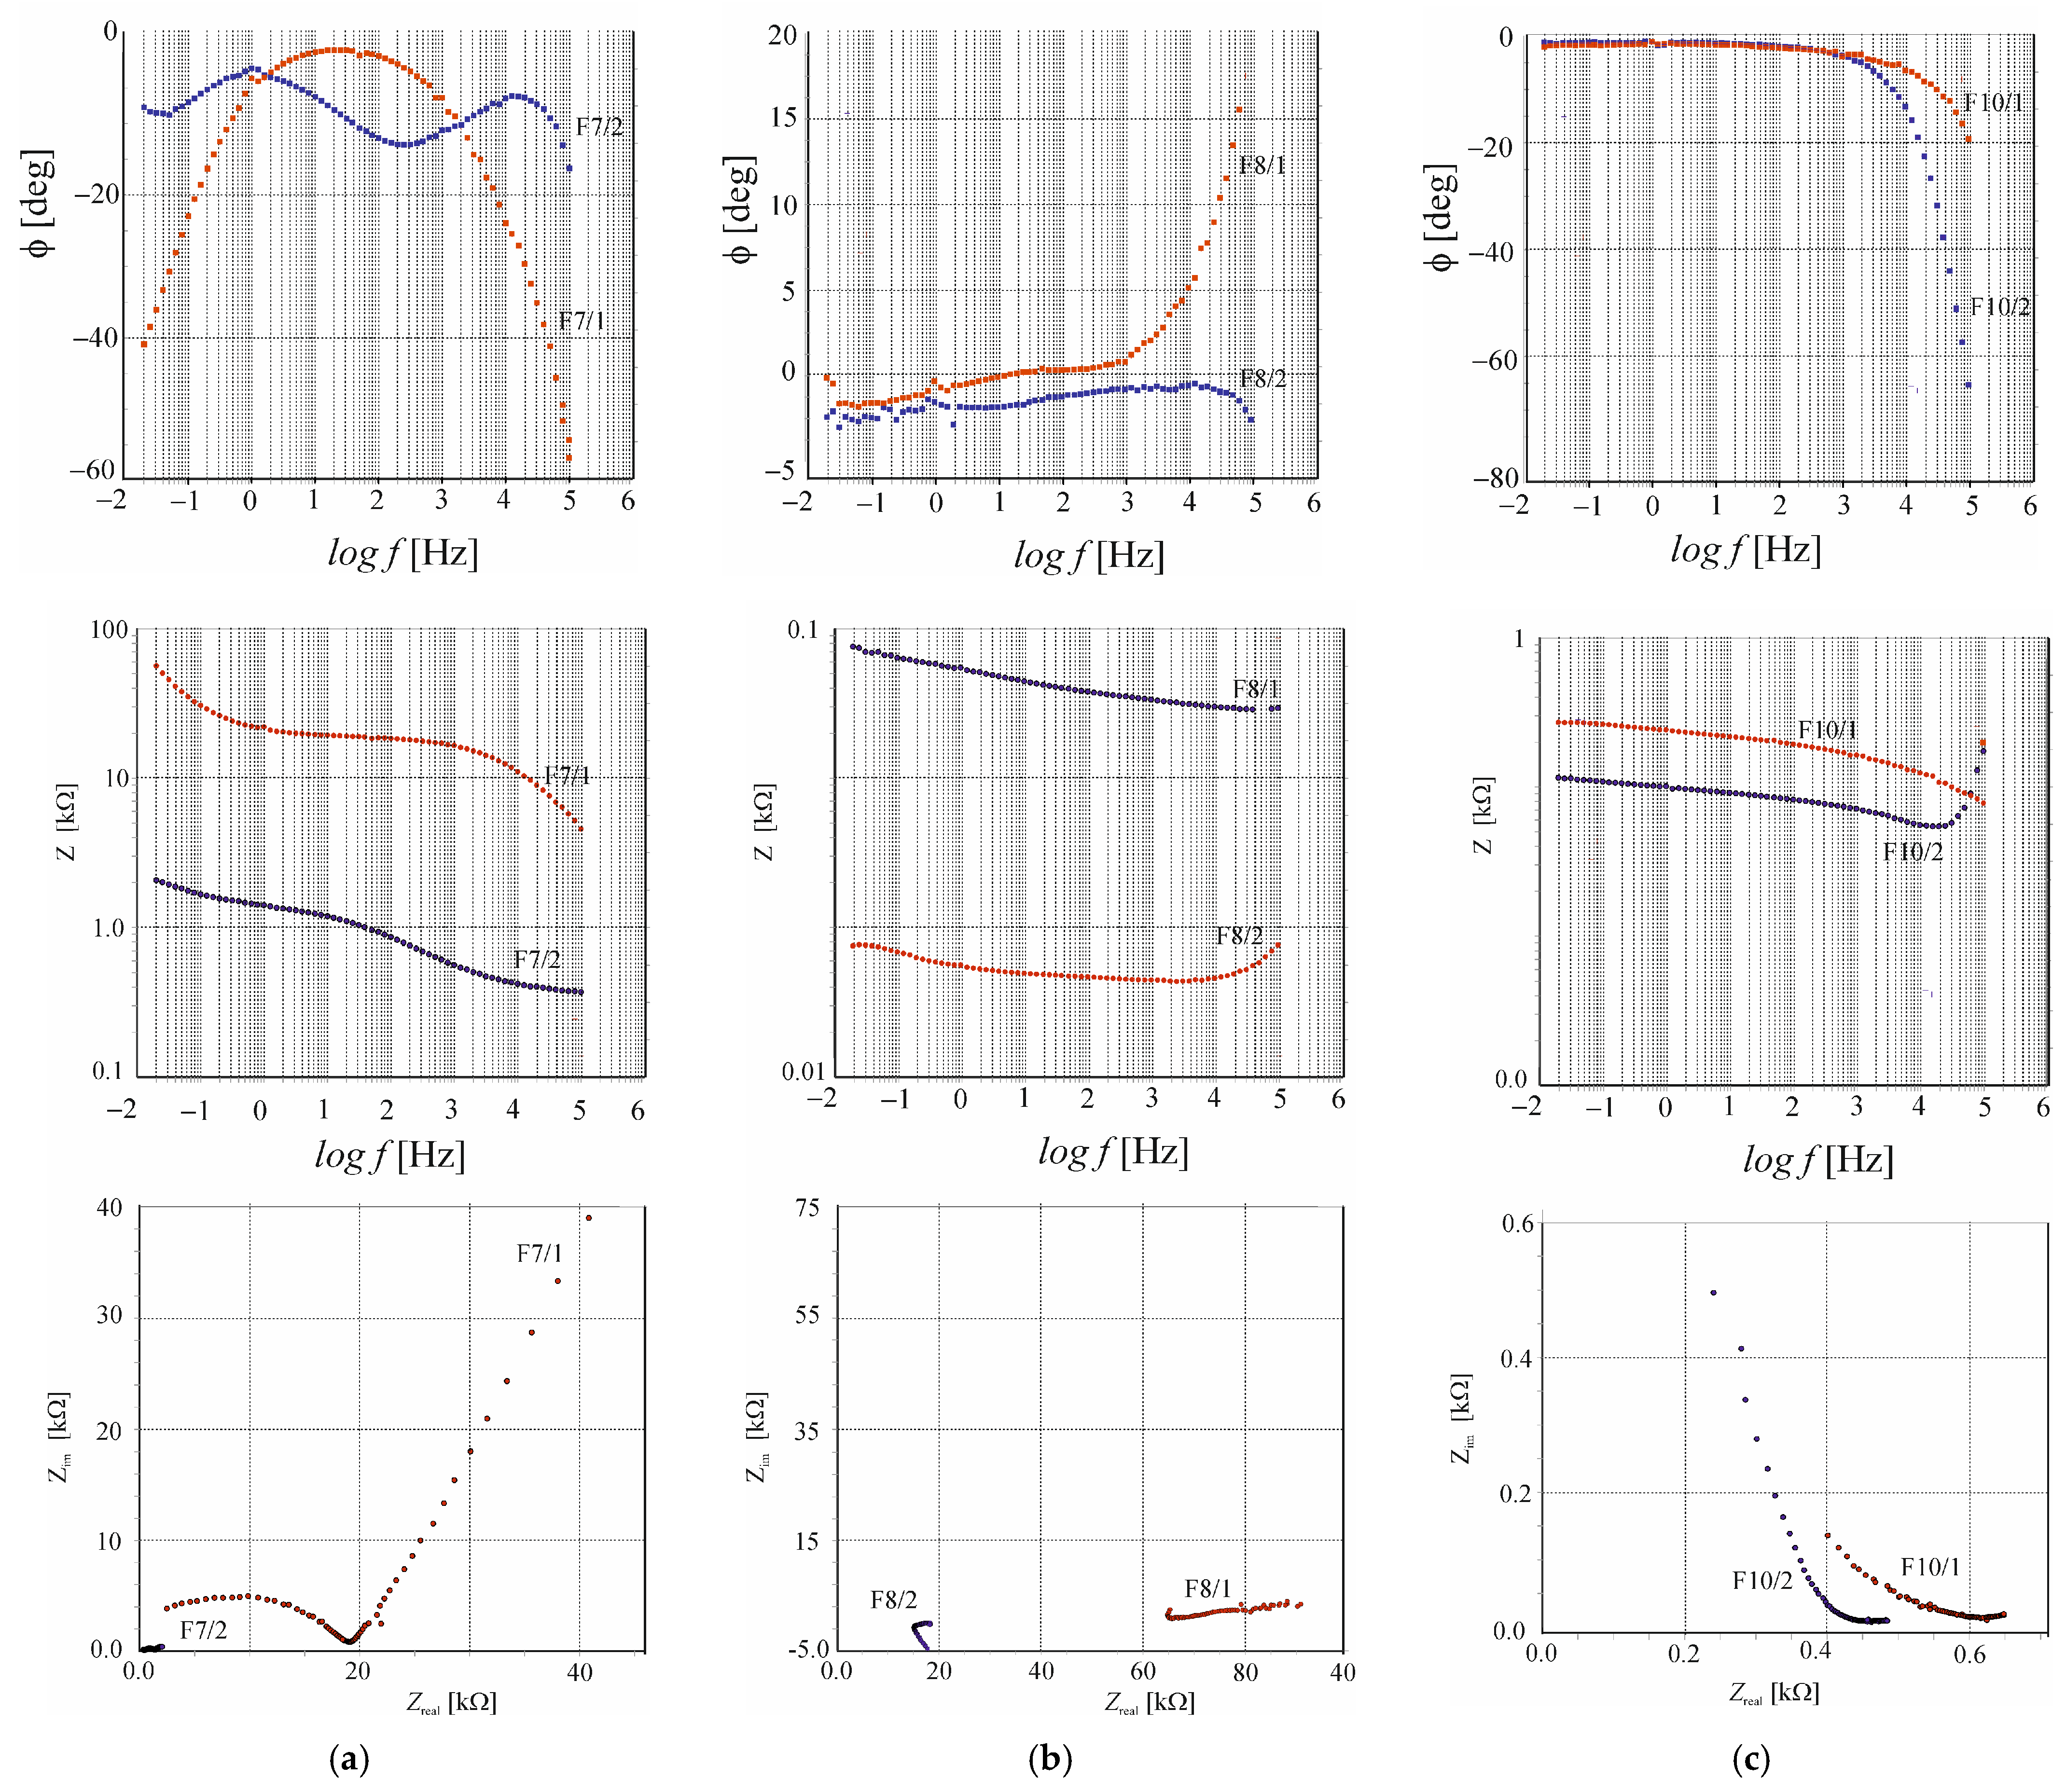
4.14. Result of Measurements of Linear Polarization Resistance (LPR) and Electrochemical Impedance Spectroscopy (EIS)

Figure 20 below shows the results of the electrochemical tests carried out using the LPR and EIS methods.
The results of the analysis of the polarization curves in a tabular form are presented in Table A8, Appendix B, containing the corrosion potential Ecorr measured against the silver chlorine electrode, the values of the Tafel coefficients (ba and bc), the polarization resistance Rp and the corrosive current density icorr, calculated on the basis of Equation (8).
Figure 21a presents a comparison of the results from two measurements of the corrosion current density (icorr) of the prestressed strands in concrete from three chosen test elements cut directly from the HC-550 floor slabs. Figure 21b shows a comparison of the results from two measurements of corrosion potential (Ecorr) of the prestressed strands in concrete from three chosen test elements cut directly from the HC-550 floor slabs.
The first reference measurement taken prior to migration indicated that the value of corrosion current intensity (F7/1 ( i c o r r = 1.48 µA); F10/1 ( i c o r r = 0.67 µA)) suggested irrelevant corrosion. In contrast, F8/1 ( i c o r r = 0.45 µA) suggested a passive state. Another measurement taken both after 21 days of chloride ion migration under the accelerated action of an electric field and 7 days after switching off the system indicated that the increase in the corrosion current rate was fastest (20-fold increase) in the F8 sample ( Δ i c o r r = 53.42 µA). A smaller increase occurred in the F10 sample ( Δ i c o r r = 7.61 µA), obtaining a value of average corrosion, and very slight increase in the F7 sample ( Δ i c o r r = 1.93 µA), obtaining a low corrosion value. By analyzing the results together with the values of chloride ion concentration at the surface of the rebar strings, we could see that the lowest value of corrosion current in sample F7 corresponded to the lowest value of chloride ion concentration C p = 0.03%, whereas in samples F8 and F10, the value of the concentration at the surface of the string was approximately C p = 1.2%, significantly exceeding the normal value of the critical concentration C K = 0.4% for the norm [31].
Figure 22 shows the impedance spectra obtained on the steel strings of the samples tested before and after the process of the electrical migration of chloride ions through the cover. In the case of the strings in the canals, the contact area was not known (due to the inadequate filling of the canals with cement grout), but the surface area of the side of the strings equaled 22.7 cm2, as measured through the use of 3D scanning, and was used for the calculations.
The results of the analysis of impedance spectra, which are described in the section Characteristics of concrete and reinforcing steel are given in Table A8, Appendix B.
Values of the corrosion current density i c o r r obtained with impedance spectroscopy did not exactly match the values determined with the linear polarization resistance measurement method. The first reference measurement taken prior to migration indicated that the value of corrosion current intensity F8/1 ( i c o r r = 6.36 µA) suggested moderate corrosion, while measurement F10/1 ( i c o r r = 2.66 µA) suggested low corrosion. In contrast, F7/1 ( i c o r r = 0.0 µA) suggested a passive state. However, the change that was observed with the next measurement taken after 21 days of chloride migration into the concrete was characterized by a huge increase in F8 ( Δ i c o r r = 1933 µA) and a slight increase in F7 ( Δ i c o r r = 0.98 µA) and F10 ( Δ i c o r r = 0.81 µA), similar to the results obtained using the linear polarization resistance method.
In order to confirm the results obtained in the measurements, a visual assessment of the degree of corrosion of the tested rebar strings was carried out.
Figure 23 presents fragments of reinforcement removed from the samples (F7, F8 Fand 10) after testing for the electrochemical measurements.
Fragments of reinforcement strings taken from all the samples showed strong corrosion with very visible corrosion products on the entire surface of the strings. Particularly in the F8 sample, the bars’ individual strings, in addition to clear corrosion products on the surface, showed cross-sectional losses of up to 1 mm in diameter of the individual strings. A Visual assessment of the advancement of corrosion processes confirmed the results of the electrochemical tests, which showed very intense corrosion of the strings in the channels. The F7 sample, whose electrochemical test results showed slight corrosion, also showed surface corrosion of the steel, but without noticeable cross-sectional losses.
The obtained results may indicate good corrosion protection properties of the concrete used; however, discontinuities in the form of air voids and clearances around the strings that may have occurred in the samples (Figure 24) may have resulted in a several-times-faster diffusion of chloride ions in the crack and contributed to the faster formation of corrosion foci.

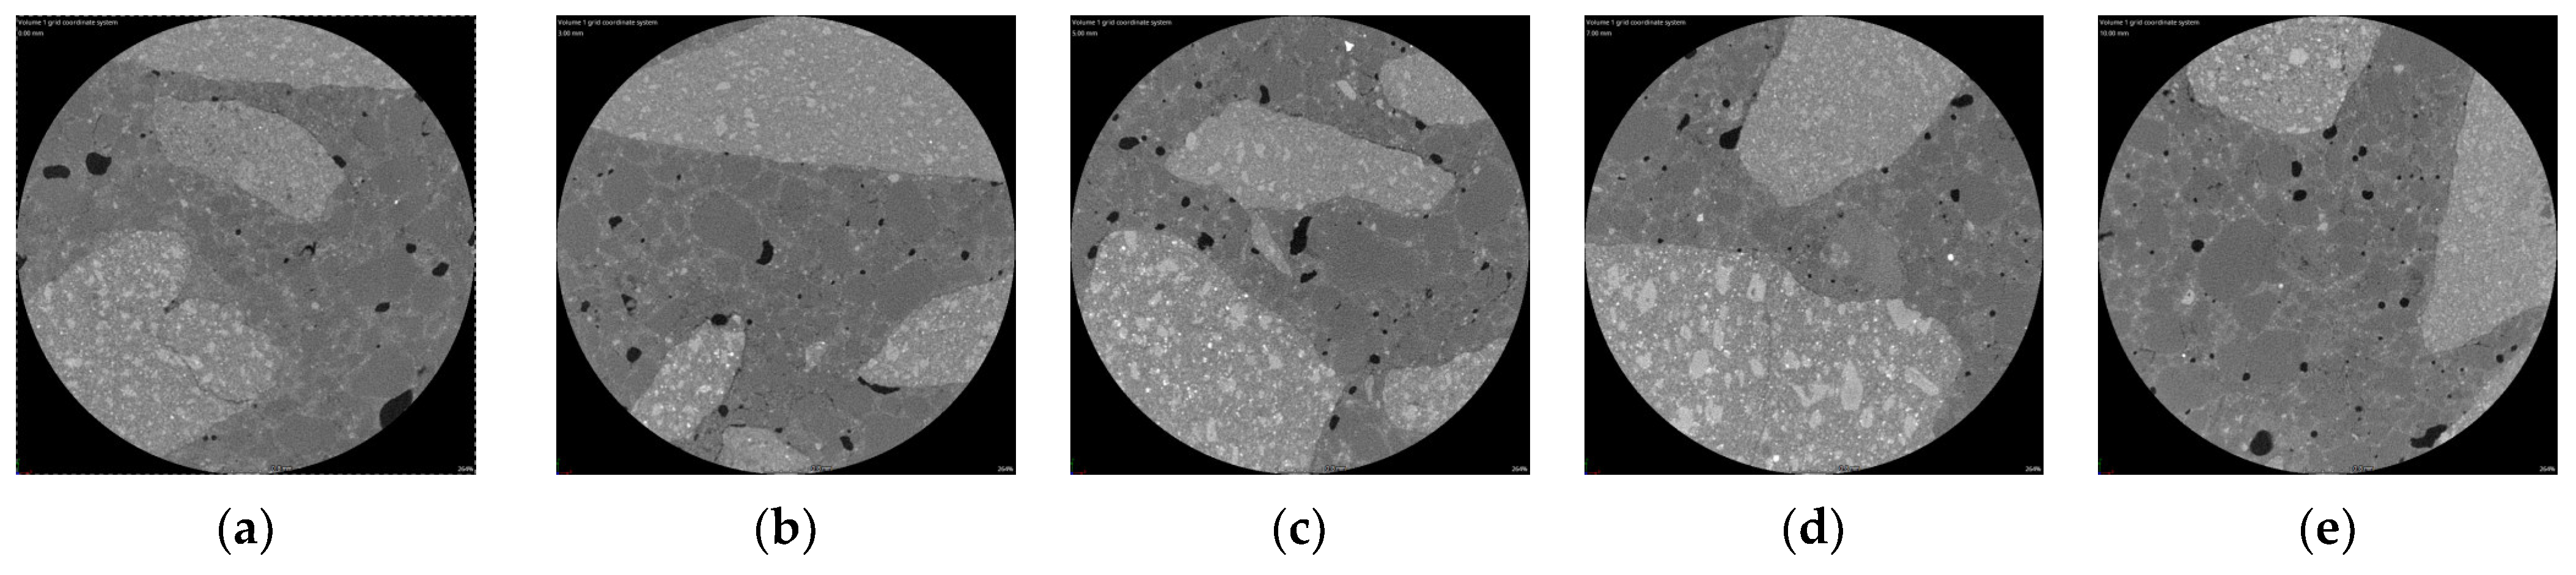
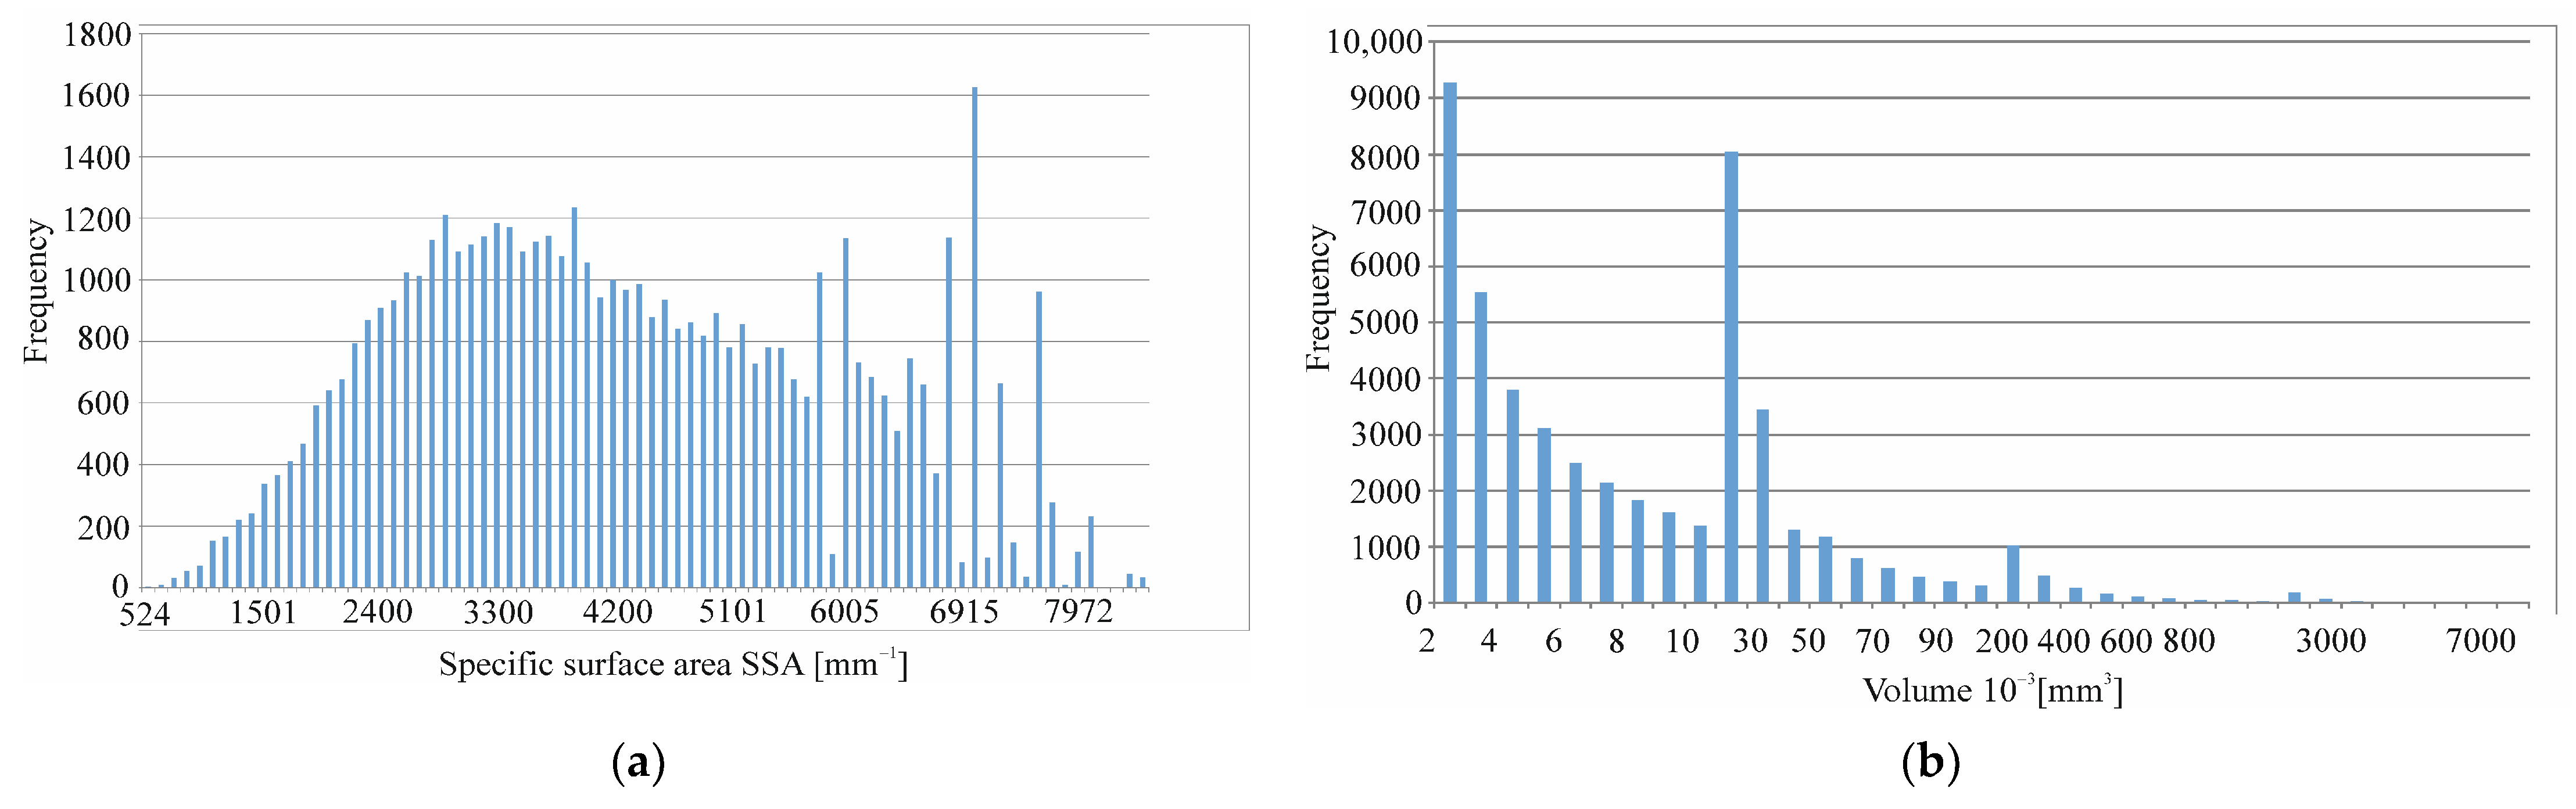
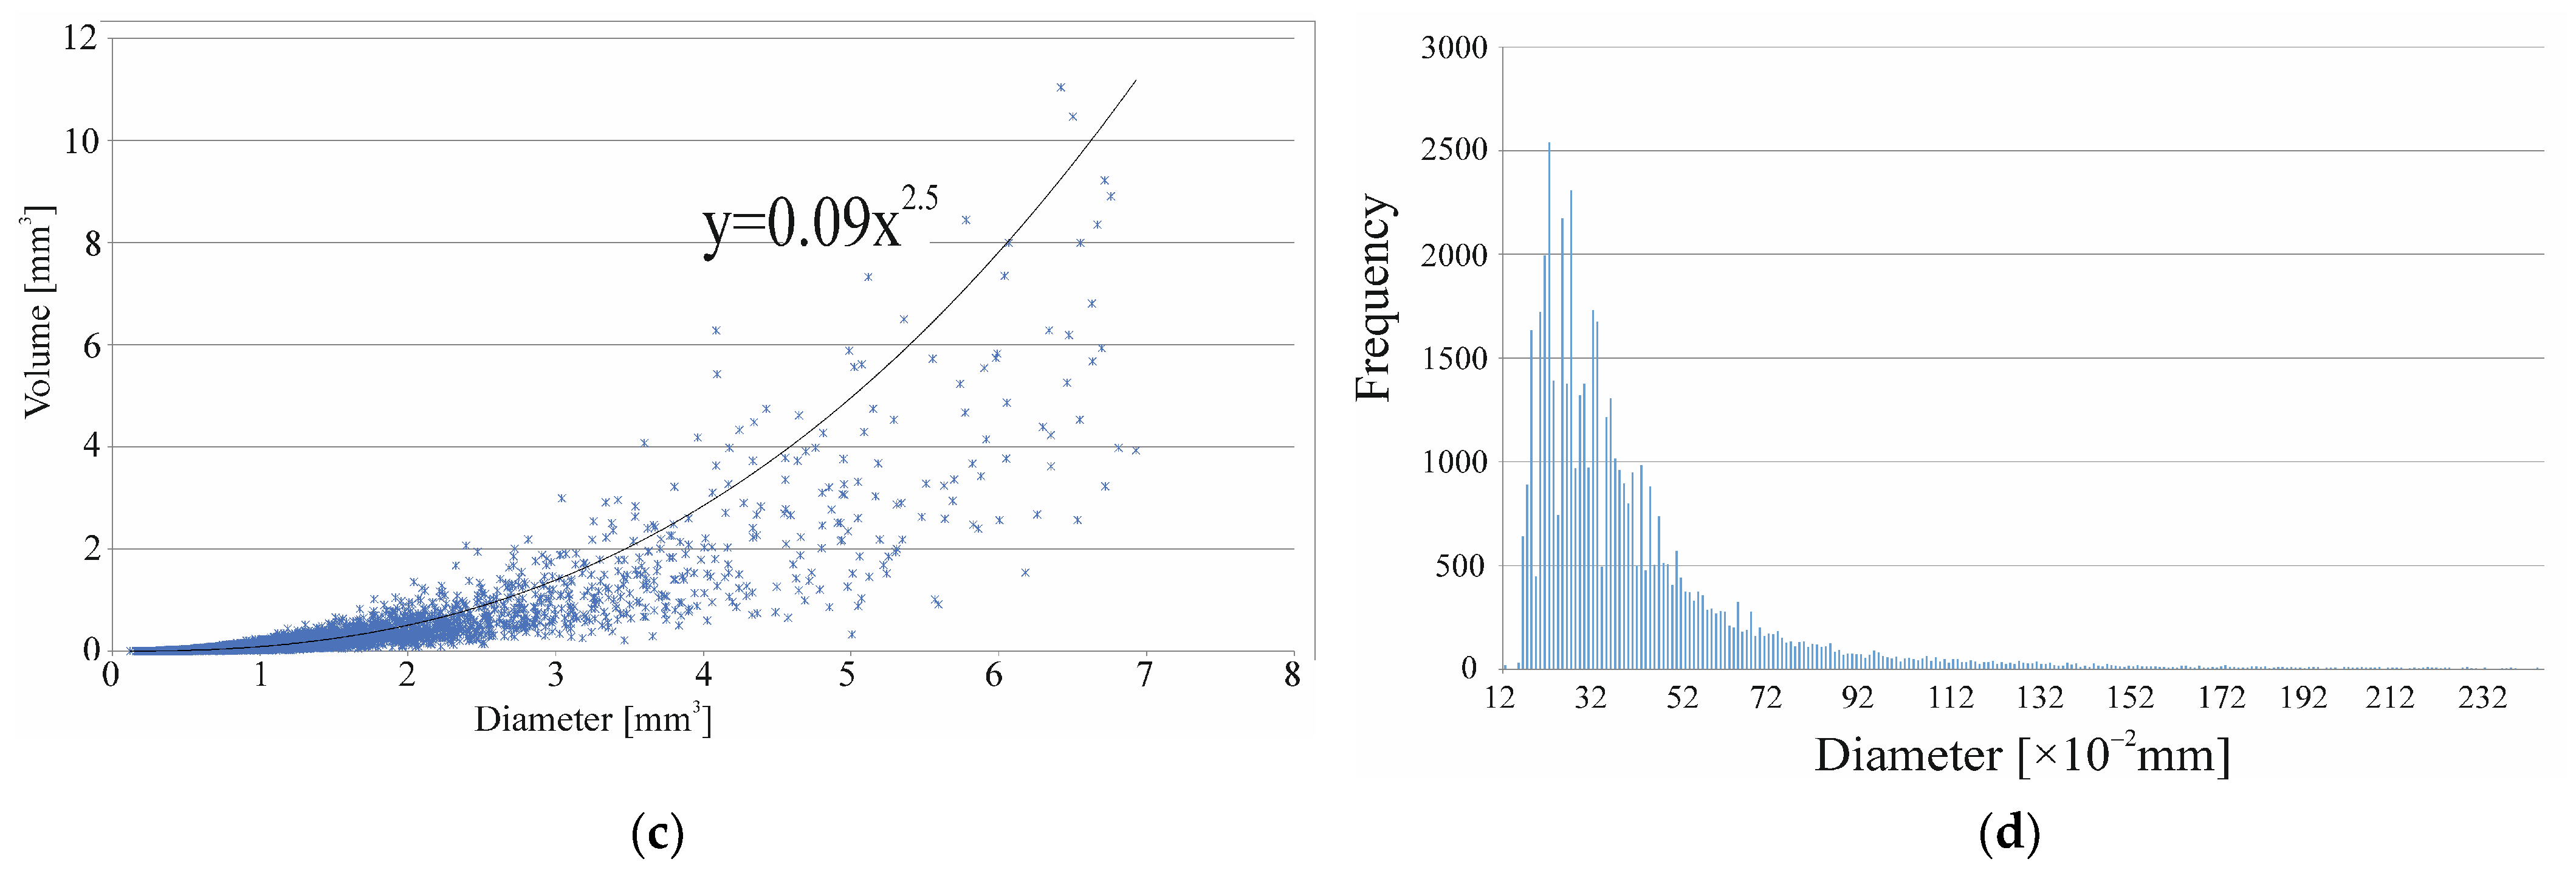
4.15. Results of Concrete Porosity Tests Using X-ray-Computed Microtomography

On the basis of tests using a tomograph, we obtained a histogram of voxel intensity. It represents the frequency or number of occurrences of voxels of certain intensity. By simply segmenting the image obtained from a grayscale file, we could obtain a black and white image by displaying all pixel values below the threshold value (approximately 80) and equal to zero in black and all values above the threshold value in white. In this way, it was easy for us to identify the pore space where the air voids were approximated through the overlapping distributions shown.
Figure 25 shows an exemplary 2D image obtained from the test of a sample at the intersection of the cylindrical sample with a plane parallel to the base of the cylinder, located in the middle of the height of the tested cylinder with dimensions of 28 mm in diameter and 30 mm in height. This cross-section showed air voids (shown in black) to which we limited ourselves in our porosity analysis, but also other elements that the tested concrete conglomerate consisted of, such as an aggregate and binder.
Figure 26 shows histograms showing parameters such as (a) the frequency of pores with a specific surface area, (b) frequency of pores with a certain volume, (c) dependence of the occurrence of pores of a given volume depending on the size of the maximum pore radius and (d) frequency of the occurrence of pores of a certain volume occurring in the analyzed concrete samples. As the maximum radius of the pores, the diameter of the sphere was defined here, which could be described on the considered pores of any shape. The specific surface area of a single pore was defined as the quotient of the area of the considered pore to its volume. Here, we only considered air pores with a volume greater than 0.001 mm3, which were separated using VGStudio MAX 3.1 software from images obtained using Nikon’s CTPro 3D software after X-raying the tested cylinder-shaped concrete samples using Nikon XT H 225 ST industrial microtomography for the segmentation of the air voids. The histogram (Figure 26c) illustrated the approximate overlapping intensity distributions of air void phases. The boundaries were set at voxel intensities where the overlap was a minimum and all voxels with intensities between the boundaries were assumed to be of the particular phase.
The internal total surface area for the analyzed sample was determined (14.92 mm2/mm3) on the basis of the quotient of the sum of the internal surface area of the pores contained in the sample 44,951.32 mm2 to the total volume of pores 3012.93 mm3. The content of pores with a diameter of less than 300 µm (12,055) among all pores diagnosed with tomography (51,316) was set to 0.92%.
On the basis of the pore volume of the post drill with a volume of 0.001 mm3 to 76.29 mm3, amounting to 3012.93 mm3, the percentage of the air content of 4.08% was determined on the basis of the volume of pores in the tested section of a cylinder with dimensions of 28 mm in diameter and 30 mm in height.
Table 4 presents the values of the weight of the sample determined with the gravimetric method using a hydrostatic balance.

4.16. Calculations of Prestressing Force Losses Taking into Account the Influence of Reinforcement Corrosion

The essence of prestressed concrete structures is the controlled transmission of compressive forces to the concrete. In prestressed concrete structures, in which forces are transmitted along the sides of the strut strands, the problem of the adhesion of the strut strands to the concrete becomes particularly important. Standard procedures do not provide any information on the impact of chloride penetration on both the properties of concrete and the possible mass loss of prestressing strut strands. In the course of the design, it was assumed that the design stresses on the sidewalls of the prestressing strut strands were lower than the design strength τpfbpt. For obvious reasons, the anchorage zone of the prestressing strut strands was checked, but in the relevant cross-sections, due to bending, it was assumed that adhesion would be ensured. Another important factor affecting the value of the prestressing force is the potential loss of the mass of the strut strands. In order to explain the effects of chloride interactions, a computational analysis of one type of HC-500 board was carried out. The calculations were carried out in accordance with the provisions of Eurocode 2 [32]. Taking into account the influence of chloride ions, the model presented in paper [22] was used. In this study, our own measurements of the corrosion current and corrosion rate of the reinforcement strings were used.
Reducing the adhesion of the concrete to the strut strands would reduce the force in the strut strands. Such a phenomenon would be included in the calculations as an additional delayed loss ΔPcor. The corrosion initiation time tini.cor = 22 years was assumed for the calculations of the ΔPcor component of prestressing force losses. After the corrosion initiation time, the adhesion stress was expressed with the following formula:
f b p t t > t i n i , c o r = f c t t 0.77 5.4 α V c o r r t 0 ,
where f c t is the compressive strength of the concrete after 28 days of maturation (N/mm2), ϕ0 is the initial diameter of the strut strand (mm), t is time (years), α = 3 is the coefficient expressing the difference between the even Px and pitting corrosion Ppit and Vcorr is the average loss of the strut strand diameter due to corrosion (μm/year).
The value of Vcorr,max = 180 μm/year corresponding to the limit of the maximum value of the corrosion current i c o r r = 15 µA was adopted. As can be seen from the tests carried out in Section 4.14, even higher values of corrosion current could be obtained at the value of chloride ion concentration near the prestressing strings exceeding the standard limits.
The decrease in the prestressing force would occur only when the tangential stresses on the sides of the prestressing strut strands became greater than the adhesion stresses, which would occur after a time tn in which chloride ions covered the entire group of strut strands.
Adhesion stresses were determined by the following equation:
fbpt (tmax) = ηp1η1 fctd(tmax) = 7.41 N/mm2
where ηp1 = 3.2 for three-wire and seven-wire strands (-), η1 = 1.0 under good adhesion conditions (-) and fctd(tmax) = 0.7αctfctm(t)/γC = 2.31 N/mm2 is the design tensile strength of concrete near the time of corrosion initiation.
The time tcor.red = 0.03 years (10.8 days), after which the reduction in adhesion stresses would be initiated by taking the left side of Equation (11) fbpt (tmax) = 7.41 N/mm2.
The total time after which adhesion degradation would begin was calculated as follows:
tn + tcor.red = 28.03 years
The time after which the adhesion stresses dropped to zero was determined using Equation (11), assuming the left side fbpt = 0 N/mm2, tn.0 = 2.45 years (882 days), was calculated.
The total time after which the adhesion stresses dropped to zero was calculated as follows:
Δtcor.red = tn + tcor.red + tn.0 = 30.48 years.
The period of time in which the decrease in compressive force would occur, calculated from the moment when the concentration of chloride ions at the steel surface reached a critical value, was calculated as follows:
tc = max (tn − tini.cor; tn.0tcor.red) = (6; 2.42) = 6 years.
In addition, if there was a discontinuity in the concrete structure, the sheer speed of the chloride ion penetration into the concrete could be accelerated tenfold, resulting in a dangerous shortening of the corrosion initiation time and entailing a reduction in time, after which the adhesion stresses would drop to zero in 10.68 years.

5. Discussion

Cracks in concrete can occur under the influence of shrinkage, which is an inherent property of concrete, even before the application of the service load. Cracks caused by shrinkage can significantly affect the durability of a reinforced concrete structure. Adverse and harmful substances such as chlorides, sulfates and carbonates can penetrate through cracks, leading to serious damage through the corrosion of the reinforcement [44].
Large shrinkage deformations occurring in the early phase are characteristic of high-performance concretes. Large amounts of binders and low w/c ratios make the share of chemical shrinkage and self-drying larger in global shrinkage deformations. This is why the shrinkage after 24 h was so large. It should not be overlooked that some of the observed changes in the length of the elements occurred when the concrete was in a plastic state, and it was rather unlikely that a crack would appear transverse to the route of the prestressing strut strands. On the other hand, a crack could appear above the prestressing strut strands associated with the plastic settlement of the mixture. The amount of deformation due to shrinkage in the first 24 h may affect the adhesion forces of the concrete to the prestressing strut strands. It is reasonable to limit it by using admixtures reducing shrinkage [45].
Since the greatest dynamics of element length changes were observed during the drying shrinkage tests during the first 5 days of concrete maturation, it is advisable to carry out careful concrete maintenance during this period to minimize the danger of scratching caused by shrinkage during drying.
The mutual relation between the tensile strength and the stresses caused by shrinkage, which depends on its size and the modulus of the elasticity of the concrete, determines the possibility of scratching caused by shrinkage. In the case of the tested concrete, the tensile stresses due to shrinkage at some point became greater than the tensile strength of the concrete. This was confirmed by a crack in the concrete ring in the shrinkage ring test.
On the basis of the tests of the compressive strength of concrete carried out on the test specimens cut from ready-made elements of prestressed HC-500 concrete slabs, it was concluded that the tested concrete could be classified in the strength class C60/65 (fck,is,cube = 64 N/mm2). However, the testing of the concrete mix prepared on the basis of the same recipe performed after 28 days allowed for the material to be considered as concrete class C70/85. The discrepancy was due to the technology of the mix production, which in laboratory conditions was carried out with great care in small samples subjected to the subsequent treatment. However, it is difficult to maintain the same conditions when making large-size elements in plants.
The corrosion rate of the steel strings in the concrete slabs in the absence of corrosive agents could be considered low. However, in the case of insufficient concrete wrapping the strings, the corrosion processes of the steel were able to begin, even related only to the increased moisture content of the concrete. The corrosion rate of the steel strings in the concrete slabs when chloride ions were present in the concrete could be considered high or very high. In the case where the chloride concentration was less than 0.1% by weight of cement (twice less than the limit specified in EC2 [32]), the corrosion rate was high and the visually determined condition of the steel surface showed that the corrosion processes of the steel were advanced.
Accounting for the very high corrosion rate, Vcorr,max = 180 μm/year assumed for the value of the measured corrosion current i c o r r = 15 µA resulted in a very significant reduction in time (10.68 years), after which the adhesion stresses dropped to zero.

6. Conclusions

The tested concrete was a high-value concrete with a 28-day strength that allowed it to be considered as a concrete of class C70/85. The high compressive strength determined a high level of other mechanical characteristics, which could also be considered appropriate for high-value concretes. The concrete was frost resistant, at least to the degree of F 100. It was resistant to deicing salts and negative temperatures, and met the requirements of category FT 2. Resistance to frost corrosion was achieved without aerating admixtures. The concrete was characterized by high resistance to pressurized water. In terms of susceptibility to shrinkage-induced cracking according to ASTM C1581-04, it should be considered a concrete with moderately high susceptibility to shrinkage-induced cracking. It seemed necessary to reduce the shrinkage deformation as well as the susceptibility to scratching caused by this deformation through the use of antishrinkage admixtures, with an acceptable reduction in the mechanical properties of the concrete.
The corrosion rate of the steel strings in the concrete slab when chloride ions were present in the concrete could be considered medium to very high. In the case where the chloride concentration was C p = 0.03% of cement mass (twice the limit specified by the standard [43]), the corrosion rate was average and the visually determined condition of the steel surface showed that the corrosion processes of the steel were advanced. In sample FK8, where the chloride concentration reached C p = 1.2% cement mass (three times higher than the limit recommended by the standard [32]), the corrosion rate determined with electrochemical methods was very high and the visually determined surface condition indicated the destruction of the steel, including a significant section loss.
Based on the empirical relationships adopted from the literature, presenting the strength/adhesion relationship over time and the corrosion parameters studied, a safe service life was determined at the nominal class of concrete equal to Δtcor.red = 30.48 lat. The calculated service life, which took into account the effects of chloride ions causing the corrosion of the rebar strings, was significantly shorter than that planned at the design stage, amounting to 50 years. In addition, in the event of discontinuities in the concrete structure, the corrosion initiation time may be dangerously shortened and the service life may be shortened due to the loss of the adhesion of strut strands for up to 10.68 years of service life of the structure.
Further research should focus on:
  • Selecting the amount of shrinkage-reducing admixtures to achieve the greatest possible shrinkage reduction with the least impact on mechanical and durability properties.
  • Determination of close correlations between adhesion and Cl- ion concentration at the surface of reinforcement strings.
  • Determination of changes in the surface area of strut strands caused by pitting corrosion.
  • Detailing the relationships that allow for the correct determination of prestressing losses caused by the loss of adhesion, changes in the elastic modulus of concrete and the formation of corrosion products.
  • Performing verification tests of changes in the adhesion of reinforcement in fragments of plates placed in an aggressive environment of varying temperature and humidity subjected to long-term stress.

Author Contributions

Conceptualization, Z.S.; methodology, Z.S. and D.C.; software, Z.S. and D.C.; validation, Z.S.; formal analysis, Z.S.; investigation, Z.S. and D.C.; resources, Z.S.; data curation, Z.S.; writing—original draft preparation, Z.S.; writing—review and editing, Z.S.; visualization, Z.S.; supervision, Z.S.; project administration, Z.S.; funding acquisition, Z.S. All authors have read and agreed to the published version of the manuscript.

Funding

The research was financed by the Silesian University of Technology (Poland) with the project BK-208/RB-2/2023 (03/020/BK_23/0147).

Data Availability Statement

The data presented in this study are available on request from the corresponding author.

Acknowledgments

The tests were carried out in the Laboratory of the Faculty of Civil Engineering and in Smart Solutions, Measurement Center 3D.

Conflicts of Interest

The authors declare no conflict of interest.

Abbreviations

HC500-19/R120Hollow-core slabs designed for constructing ceilings in skeletal buildings with reinforced concrete
F1-F16Concrete samples drilled directly from the HC-500 floor slabs
FB1-FB49Concrete samples created in laboratory according to the recipe provided by the manufacturer
Y 1860Steel, two relaxation classes
P1Tensile force of lower rods
P2Tensile force of upper rods
qStress increment index
GYoung’s modulus inner steel ring
αSteel ring deformation rate increment
tThe time in which the test was completed
VVolume of the sample drilled directly from the HC-500 floor slabs
hHeight of the sample drilled directly from the HC-500 floor slabs
dSmallest side dimension of the sample drilled directly from the HC-500 floor slabs
f c m t Average compressive strength of concrete at the age of t days
f c m Average compressive strength after 28 days
β c m t Coefficient depending on the age of concrete
sCoefficient depending on the type of cement
f c k , i s Characteristic compressive strength of concrete in structure
fck,is,cubeCompressive strength of concrete determined after time t (converted to strength test of cubic samples 150 × 150 × 150 mm)
R Universal gas constant
T Absolute temperature
z Valence of ions
F Faradays constant
t i Transport number of chloride ions
γ i Activity coefficient of chloride ions
C i Concentration of chloride ions
ρ B R Volumetric resistivity
σ Conductivity
LSample thickness
VElectrical potential
ACross-sectional area of a sample
IcorrCorrosion current
RpPolarization resistance
icorrCorrosion current density
b a ,   b c Constants of anodic and cathodic reactions, respectively
CRCoefficient determining the average loss of the bar cross-section
R1Resistance of the liquid phase
R2, R2aResistance of the double layer at the interface between the liquid and solid phases of concrete
Y2, α2, Y2a, α2aCapacitance of the double layer at the interface between the liquid and solid phases of concrete
Y3, α3Capacitance of the steel–concrete transition zone
Y0, α0Capacitance of the double layer at the interface between the pore liquid and the reinforcing steel
RtCharge transfer resistance
DDiffusion coefficient determined on the basis of the diffusion test
DMMigration coefficient determined on the basis of the migration test
C p Value of the concentration at the surface of the string
τpDesign stresses on the sidewalls of prestressing strut strands
fbptDesign strength
γ C Partial safety factor for concrete for the examined design state
αctCoefficient taking into account long-term effects on the tensile strength and of unfavorable effects, resulting from the way the load was applied
ΔPcor.Component of prestressing force losses
fbpt (t > tini,cor)Adhesion stress after the corrosion initiation time
f c t Compressive strength of concrete after 28 days of maturation
ϕ0Initial diameter of the strut strand
αCoefficient expressing the difference between the even Px and pitting corrosion Ppit
VcorrAverage loss of strut strand diameter due to corrosion
Vcorr,maxLoss of strut strand diameter due to corrosion corresponding to the limit of the maximum value of the corrosion current i c o r r = 15 µA
tnTime in which chloride ions will cover the entire group of strut strands
fbpt (tmax)Adhesion stresses
ηp1Coefficient assumed according to standard [32] for three-wire and seven-wire strands
ηp2Coefficient assumed according to standard [32] with good adhesion conditions
fctd (tmax)The design tensile strength of concrete at a time close to the time of corrosion initiation
fctm (t)Mean tensile strength of concrete
tcor.redTime after which the reduction in adhesion stresses was initiated
tn.0Time after which the adhesion stresses dropped to zero
tcPeriod of time in which the decrease in compressive force occurred
Δtcor.redTotal time after which adhesion stresses dropped to zero

Appendix A

Table A1. Concrete drying shrinkage.
Term
Research
Day
Reading from
Displacement
Sensors
Drying Shrinkage
mm/m
Average Drying
Shrinkage
mm/m
Deformation
FB1FB2FB3FB1FB2FB3
04.0003.0003.0000000.0000
13.9712.9682.9740.0580.0640.0520.05858
43.9282.9252.9240.1440.150.1520.149149
73.9132.9072.9080.1740.1860.1840.181181
143.8812.8742.8750.2380.2520.250.247247
273.8572.8492.8520.2860.3020.2960.295295
Table A2. Compressive strength of concrete after 1, 2, 7, 28 and 90 days of maturation.
Term
Research
Day
Sample
Weight
g
Density
kg/m3
Compressive Strength MPaThe Average Compressive Strength MPa
1FB4   8597254742.7341.6
FB5   8657256540.12
FB6   8448250341.93
2FB7   8437250050.5750.5
FB8   8440250151.01
FB9   8447250349.84
7FB10  8559253678.0779.4
FB11  8508252181.12
FB12  8457250679.1
28FB13  8607255095.694.1
FB14  8459250695.2
FB15  8480251391.4
90FB16  85932546109.4107.6
FB17  85812543107.0
FB18  86002548106.2
Table A3. Flexural tensile strength of concrete after 1, 2, 7, 28 and 90 days curing.
Test DateBreaking Force
(kN)
Flexural Tensile Strength (Mpa)Average Flexural Tensile Strength
(Mpa)
1FB19  7.442.232.28
FB20  7.742.32
2FB21  9.822.943.28
FB22  12.033.61
7FB23  14.674.404.16
FB24  13.063.92
28FB25  19.495.855.65
FB26  18.175.45
90FB27  21.816.546.38
FB28  20.746.22
Table A4. Concrete tensile strength after 1, 2, 7, 28 and 90 days maturation.
Term
Research
Day
Sample Weight gDensity kg/m3Compressive Strength
MPa
Average Compressive Strength MPaYoung’s Modulus E GPaAverage Young’s Modulus E GPaCoef. Poisson νAverage Coef. Poisson ν
213,492254545.143.641.540.60.180.16
13,424253243.840.00.11
13,471254141.940.10.18
2813,482254380.084.148.3950.30.210.17
13,448253787.551.620.13
13,413253084.750.750.15
9013,330251492.496.551.7351.80.300.25
13,3832524101.451.620.24
13,357252095.852.100.21
Table A5. Determination of frost resistance on the basis of weight loss of frozen samples.
Sample Weight
g
Weight of Sample after 100 Cycles of Freezing
g
The Relative Weight Loss
%
Average Relative Weight Loss
%
Frozen samples860685930.150.13
858685810.06
861586000.17
Witness samples849984990.000.0
84828483−0.01
85558556−0.01
Table A6. Compressive strength after freezing processes.
Compressive StrengthAverage Compressive Strength
MPa
Relative Reduction in Compressive Strength
%
Frozen samples96.997−4.31
94.3
99.2
Reference samples92.793
91.3
94.4
Table A7. Compressive strength test results of samples cut directly from the HC-500 plates.
Samplesh
mm
d
mm
h/dV
mm3
0.56 + 0.697 V 152 h d + h d F
kN
fc
N/mm2
fc,cube(t)
N/mm2
β c c t = e x p s 1 28 t f c , c u b e = f c , c u b e t β c c t
F154.154.80.99127,5991.11209.088.679.91.1072.5
F261.254.81.12144,3451.06218.492.687.51.1079.4
F358.454.81.07137,7411.08230.097.590.61.1082.2
F458.554.81.07137,9771.08227.696.589.71.1081.4
F553.654.80.98126,4201.11206.587.578.71.1071.4
F658.854.81.07138,6851.07226.696.189.41.1081.2

Appendix B

Table A8. Comparison of results from analyzing polarization curves of steel strut strand in concrete obtained for the three selected specimens F7, F8 and F10, measuring before and after chloride migration.
Specimen
No.
Ecorr
mV
ba
mV
bc
mV
Rp
RpA
kΩ cm2
icorr
μA/cm2
VR
µm/YEAR
F7/1−451149.965.61.0323.420.859
F7/2−414265650.296.643.4138
F8/1−7452151283.4077.320.455
F8/2−4201752480.040.8254.42599
F10/1−5051701542.3152.530.677
F10/2−5141771040.153.438.2891
Table A9. Parameters of the electrical equivalent circuit elements describing the EIS spectra of steel strut strands in concrete, obtained for the three selected specimens F7, F8 and F10, measuring before and after chloride migration.
Samplet
days
R1
Ω
R2
R2a
Y2
10−9 Fsα−1
α2Y2a
10−9 Fsα−1
α2aY3
10−3 Fsα−1
α3Rt
Y0
10−6 Fsα−1
α0icorr
μA/cm2
Vr
mm/year
F7/100.1318.639.321.980.87132.350.806177 × 10−30.82813191310.3870.00.0
F7/22174.170.2820.2812.141.012 × 1061.04.110.3591.01245.350.5030.9811
F8/1052.470.0060.00186.471.013 × 1060.9659170.0890.18335.32 × 1030.1156.3670
F8/2214.270.0030.000262 × 1060.601811 × 1030.99489.90.0000.0013.35 × 1060.382193921,332
F10/100.0030.3260.0282.370.9744.2 × 1090.19312.90.1110.22642.510.3882.6629
F10/2210.1850.0540.02651.07 × 1030.97913 × 1060.31442.60.2730.362446 × 10−61.1973.4743

References

  1. Li, F.; Yuan, Y.; Li, C.Q. Corrosion propagation of prestressing steel strands in concrete subject to chloride attack. Constr. Build. Mater. 2011, 25, 3878–3885. [Google Scholar] [CrossRef]
  2. Morgese, M.; Ansari, F.; Domaneschi, M.; Cimellaro, G.P. Post-collapse analysis of Morandi’s Polcevera viaduct in Genoa Italy. J. Civ. Struct. Health Monit. 2020, 10, 69–85. [Google Scholar] [CrossRef]
  3. Collop, A.C. Deformation and Fracture Mechanics of Engineering Materials. Eng. Struct. 1997, 19, 283. [Google Scholar] [CrossRef]
  4. Wu, Q.; Li, X.; Xu, J.; Wang, G.; Shi, W.; Wang, S. Size Distribution Model and Development Two Curing Methods. Materials 2019, 12, 1846. [Google Scholar] [CrossRef] [Green Version]
  5. Finozzi, I.; Saetta, A.; Budelmann, H. Structural response of reinforcing bars affected by pitting corrosion: Experimental evaluation. Constr. Build. Mater. 2018, 192, 478–488. [Google Scholar] [CrossRef]
  6. Dai, L.; Wang, L.; Zhang, J.; Zhang, X. A global model for corrosion-induced cracking in prestressed concrete structures. Eng. Fail. Anal. 2015, 62, 263–275. [Google Scholar] [CrossRef]
  7. Zhu, J.S.; Huang, F.M.; Guo, T.; Song, Y.H. Residual life evaluation of prestressed reinforced concrete highway bridges under coupled corrosion-fatigue actions. Adv. Steel Constr. 2015, 11, 372–382. [Google Scholar] [CrossRef] [Green Version]
  8. Xu, F.; Chen, Y.; Zheng, X.; Ma, R.; Tian, H. Experimental study on corrosion and mechanical behavior of Main Cable Wires Considering the effect of strain. Materials 2019, 12, 753. [Google Scholar] [CrossRef] [Green Version]
  9. Adasooriya, N.D.; Hemmingsen, T.; Pavlou, D. Fatigue strength degradation of metals in corrosive environments. IOP Conf. Ser. Mater. Sci. Eng. 2017, 276, 012039. [Google Scholar] [CrossRef]
  10. Lan, C.; Xu, Y.; Liu, C.; Li, H.; Spencer, B.F. Fatigue life prediction for parallel-wire stay cables considering corrosion effects. Int. J. Fatigue 2018, 114, 81–91. [Google Scholar] [CrossRef]
  11. Jiang, C.; Wu, C.; Jiang, X. Experimental study on fatigue performance of corroded high-strength steel wires used in bridges. Constr. Build. Mater. 2018, 187, 681–690. [Google Scholar] [CrossRef]
  12. Lu, Z.H.; Wu, S.Y.; Tang, Z.; Zhao, Y.G.; Li, W. Effect of chloride-induced corrosion on the bond behaviors between steel strands and concrete. Mater. Struct. 2021, 54, 129. [Google Scholar] [CrossRef]
  13. Jiang, C.; Wu, Y.; Dai, M. Virtual Special Issue Durability of Innovative Construction Materials and Structures Degradation of steel-to-concrete bond due to corrosion. Constr. Build. Mater. 2018, 158, 1073–1080. [Google Scholar] [CrossRef]
  14. Lee, H.; Noguchi, T.; Tomosawa, F. Evaluation of the bond properties between concrete and reinforcement as a function of the degree of reinforcement corrosion. Cem. Concr. Res. 2002, 32, 1313–1318. [Google Scholar] [CrossRef]
  15. Stanish, K. Corrosion Effect on Bond Strenght in Reinforced Concreteffects; National Library of Canada: Ottawa, ON, Canada, 1997. [Google Scholar]
  16. Cabrera, J.G. Deterioration of Concrete Due to Reinforcement Steel Corrosion. Cem. Concr. Compos. 1996, 9465, 47–59. [Google Scholar] [CrossRef]
  17. Wang, L.; Zhang, X.; Zhang, J.; Yi, J.; Liu, Y. Simplified model for corrosion-induced bond degradation between steel strand and concrete. J. Mater. Civ. Eng. 2016, 29, 4016257. [Google Scholar] [CrossRef]
  18. Li, F.; Yuan, Y. Effects of corrosion on bond behavior between steel strand and concrete. Constr. Build. Mater. 2013, 38, 413–422. [Google Scholar] [CrossRef]
  19. Szweda, Z.; Buliński, Z. Application of inverse methodology to estimation of chloride diffusion coefficient in concrete of prestressed precast slab. MATEC Web Conf. 2018, 174, 01008. [Google Scholar] [CrossRef] [Green Version]
  20. Szweda, Z. Analysis of protective features of concrete in precast prestressed floor slabs (HC type) against chloride penetration. MATEC Web Conf. 2018, 163, 05006. [Google Scholar] [CrossRef] [Green Version]
  21. Szweda, Z. Comparison of Diffusion and Migration Coefficients Determined from Tests on Concrete in Prestressed Floor Slabs HC-500. IOP Conf. Ser. Mater. Sci. Eng. 2019, 471, 052034. [Google Scholar] [CrossRef]
  22. Szweda, Z.; Jasinski, R. Static Analysis of Prestressed Floor Slabs HC500 with Changes in Tendon Adhesion to Concrete Induced by Penetration of Chloride Ions. IOP Conf. Ser. Mater. Sci. Eng. 2019, 471, 052035. [Google Scholar] [CrossRef]
  23. PN-EN 12504-1, 2001; Testing of Concrete in Structures. Part 1, Wells Core. Cutting, Assessment and Testing of Compressive Strength. Polish Committee for Standardization: Warsaw, Poland, 2001.
  24. Gołaszewski, J.; Ponikiewski, T.; Cygan, G.; Gołaszewska, M. Laser System for Testing Early Shrinkage of Concrete Elements in Conjuction with the Deterioration of the Setting Time; Transactions of the VŠB—Technical University of Ostrava, Civil Engineering Series; VŠB—Technical University of Ostrava: Ostrava, Czechia, 2016; Volume 16. [Google Scholar] [CrossRef] [Green Version]
  25. ASTM C1581-04; Standard Test Method for Determining Age at Cracking and Induced Tensile Stress Characteristics of Mortar and Concrete under Restrained Shrinkage. ASTM International: West Conshohocken, PA, USA, 2010.
  26. PN-EN 12390-3, 2002; Concrete Tests—Part 3, Compressive Strength of Samples for Examination. Polish Committee for Standardization: Warsaw, Poland, 2002.
  27. PN-EN 12390-5, 2019-08; Concrete Tests—Part 5, Flexural Strength of Test Specimens. Polish Committee for Standardization: Warsaw, Poland, 2019.
  28. PN-EN 12390-8, 2019-08; Standard Concrete Tests—Part 8, Penetration Depth of Water under Pressure. Polish Committee for Standardization: Warsaw, Poland, 2019.
  29. PN-88/B-06250, 1988; Ordinary Concrete. Polish Committee for Standardization: Warsaw, Poland, 1988.
  30. PKN-CEN/TS 12390-9, 2007; Testing Hardened Concrete—Part 9, Freeze-Thaw Resistance—Scaling. Polish Committee for Standardization: Warsaw, Poland, 1988.
  31. PN-EN 13791, 2008; Evaluation of Concrete Compressive Strength in Structures and Precast Concrete Products. Polish Committee for Standardization: Warsaw, Poland, 2008.
  32. PN-EN 206+A1, 2016-12; Concrete Specification, Performance, Production and Conformity. PKN/KT Polish Committee for Standardization: Warsaw, Poland, 2016.
  33. PN-EN 1992-1-1, 2008; Eurocode 2—Design of Concrete Structures—Part 1-1, General Rules and Rules for Buildings. British Standard Institution: London, UK, 2004.
  34. ASTM C1202; Electrical Indication of Concrete’s Ability to Resist Chloride Ion Penetration. ASTM International: West Conshohocken, PA, USA, 2000.
  35. NORDTEST. Concrete, Mortar and Cement-Based Repair Materials: Chloride Migration Coefficient from Non-Steady-State Migration Experiments; NT Build 492; NORDTEST: Espo, Finland, 1999; pp. 1–8. [Google Scholar]
  36. C1556-11a; Standard Test Method for Determining the Apparent Chloride Diffusion Coefficient of Cementitious Mixtures by Bulk Diffusion. ASTM: West Conshohocken, PA, USA, 2003; pp. 1–7.
  37. Szweda, Z.; Zybura, A. Theoretical model and experimental tests on chloride diffusion and migration processes in concrete. Procedia Eng. 2013, 57, 1121–1130. [Google Scholar] [CrossRef] [Green Version]
  38. Szweda, Z.; Gołaszewski, J.; Ghosh, P.; Lehner, P.; Konečný, P. Comparison of Standardized Methods for Determining the Diffusion Coefficient of Chloride in Concrete with Thermodynamic Model of Migration. Materials 2023, 16, 637. [Google Scholar] [CrossRef] [PubMed]
  39. ASTM C1760-12; Standard Test Method for Bulk Electrical Conductivity of Hardened Concrete (Withdrawn 2021). ASTM International: West Conshohocken, PA, USA, 2012.
  40. Szweda, Z.; Jaśniok, T.; Jaśniok, M. Evaluation of the effectiveness of electrochemical chloride extraction from concrete on the basis of testing reinforcement polarization and chloride concentration. Ochr. Przed Korozją 2018, 61, 3–9. [Google Scholar] [CrossRef]
  41. Szweda, Z. Evaluating the Impact of Concrete Design on the Effectiveness of the Electrochemical Chloride Extraction Process. Materials 2023, 16, 666. [Google Scholar] [CrossRef]
  42. Jaśniok, M. Method of Iterative Determination of the Polarized Area of Steel Reinforcement in Concrete Applied in the EIS Measurements. Materials 2022, 15, 3274. [Google Scholar] [CrossRef]
  43. ACI 318M-11; Building Code Requirements for Structural Concrete. American Concrete Institute: Farmington Hills, MI, USA, 2014.
  44. Otieno, M.B.; Alexander, M.G.; Beushausen, H.D. Corrosion in cracked and uncracked concrete–influence of crack width, concrete quality and crack reopening Mag. Concr. Res. 2010, 62, 393–404. [Google Scholar] [CrossRef]
  45. Afroz, S.; Nguyen, Q.D.; Zhang, Y.; Kim, T.; Caste, A. Cracking of limestone calcined clay blended concrete and mortar under restrained shrinkage. Constr. Build. Mater. 2023, 386, 131599. [Google Scholar] [CrossRef]
Figure 1. The test elements: (a) shape and dimensions of the basic elements of the floor slabs; (b) view of a tested element.
Buildings 13 01855 g001
Figure 2. View of samples taken from the floor slabs.
Buildings 13 01855 g002
Figure 3. Loosening at the joint between the string and concrete: (a) directly after cutting from the HC plate; (b) after covering the front of the strings with electrically conductive glue based on silver powder; (c) the side of the samples covered with insulating paint.
Buildings 13 01855 g003
Figure 4. Study of the (a) flexural tensile strength; (b) static modulus of elasticity.
Buildings 13 01855 g004
Figure 5. View of the test stand used in the experiment carried out according to the thermodynamic model of migration [37]: 1—plastic tanks filled with 3% NaCl solution; 2—cathode composed of stainless steel; 3—concrete element; 4—water; 5—platinum-coated titanium mesh anode.
Buildings 13 01855 g005
Figure 6. Value of read resistance of concrete expressed in kΩcm.
Buildings 13 01855 g006
Figure 7. The test stand for migration of chloride ions to concrete accelerated with the electric field: 1—concrete test specimen; 2—electric circuit of 18 V; 3—titanic anode coated with platinum; 4—tank with distilled water; 5—small plastic tanks with 3% NaCl; 6—stainless steel cathode.
Buildings 13 01855 g007
Figure 8. Test stand used in polarization research with LPR: (a) scheme: 1—seven-strand strut strands with a nominal diameter of 9.3 mm composed of Y 1860 steel (working electrode); 2—concrete test specimen; 3—auxiliary electrode; 4—(Cl/AgCl,Ag) electrode as the reference electrode; 5—Gamry Reference 600 potentiostat with a computer unit and DC 105 Gamry software; (b) view of the method.
Buildings 13 01855 g008
Figure 9. Electrical equivalent scheme adopted for analysis of impedance spectra.
Buildings 13 01855 g009
Figure 10. Early shrinkage of concrete measured in the first 24 h.
Buildings 13 01855 g010
Figure 11. Concrete drying shrinkage measured during the first 28 days of maturation.
Buildings 13 01855 g011
Figure 12. The dependence of the deformation of the steel ring caused by concrete shrinkage: (a) in the initial time; (b) for the entire study period.
Buildings 13 01855 g012
Figure 13. Development of the compressive strength of concrete after 1, 2, 7, 28 and 90 days of curing.
Buildings 13 01855 g013
Figure 14. (a) Development of flexural tensile strength of concrete after 1, 2, 7, 28 and 90 days of maturation; (b) relationship of the compressive strength of concrete and its flexural tensile strength after 1, 2, 7, 28 and 90 days of maturation.
Buildings 13 01855 g014
Figure 15. Change in the modulus of elasticity of concrete over time.
Buildings 13 01855 g015
Figure 16. Water penetration depth for: (ac) concrete created in the Construction Laboratory of the Silesian University of Technology; (df) concrete drilled from prestressed slabs.
Buildings 13 01855 g016
Figure 17. View of samples VII, VIII and IX after testing.
Buildings 13 01855 g017
Figure 18. Three-dimensional image of a fragment of a string composed of seven-strand strut strands with a nominal diameter of 9.3 mm, composed of steel, grade Y 1860, 2 relaxation classes, generated on the basis of a point cloud obtained after scanning with the Model Maker MMDx100 scanner.
Buildings 13 01855 g018
Figure 19. Distribution of chloride ion concentration on the thickness of the concrete cover determined at the moment of confirming the corrosion of the reinforcing prestressed strands in the samples F7, F8 and F10.
Buildings 13 01855 g019
Figure 20. Potentiodynamic polarization curves for steel strand strut strands in concrete from three selected specimens: F7/1, F8/1, F10/1 (first, before chloride migration) and F7/2, F8/2, F10/2 s (after 21 days of chloride migration) of measurements.
Buildings 13 01855 g020
Figure 21. Distributions of (a) the corrosion current densities and (b) the corrosion potential obtained for the selected specimens F7/1, F7/2, F8/1, F8/2, F10/1 and F10/2: 1—before chloride migration; 2—after 21 days of migration.
Buildings 13 01855 g021
Figure 22. Impedance spectra obtained on the steel strings of the samples tested before (F7/1; F8/1; F10/1) and after (F7/2; F8/2; F10/2) the process of electrical migration of chloride ions through the outline of the Bode plot and Nyquist plot in the samples: (a) F7; (b) F8; (c) F10.
Buildings 13 01855 g022
Figure 23. View of the reinforcement fragments removed from the concrete cores: (a) sample F7; (b) sample F8; (c) sample F10.
Buildings 13 01855 g023
Figure 24. Example of discontinuity of cover around prestressing strings and void located in concrete cover.
Buildings 13 01855 g024
Figure 25. Two-dimensional image obtained from a tomographic examination of a cylindrical sample with dimensions of 28 mm in diameter and 30 mm in height in planes parallel to the base of the cylinder, distant from this base by (a) 4 mm, (b) 12 mm, (c) 16 mm, (d) 20 mm and (e) 28 mm.
Buildings 13 01855 g025
Figure 26. Histograms showing parameters such as: (a) frequency of pores with a specific surface area, (b) frequency of pores with a certain volume, (c) dependence of the occurrence of pores of a volume depending on the size of the maximum pore radius, (d) frequency of the size of the maximum pore radius occurring in analyzed concrete samples.
Buildings 13 01855 g026aBuildings 13 01855 g026b
Table 1. Composition and properties of concrete mixtures.
Constituent/m3FB
Cement, kg480
Sand, kg580
Basalt 2–8, kg671
Basalt 8–16, kg633
Water, kg149
w/c0.31
Plasticizer, % m.c.1.29
Slump cone after 5 min, mm60
Slump cone after 60 min, mm0
Air content, %3.2
Volume weight γ b , kg/m32519
Table 2. Depth of water penetration determined under pressure.
ConcreteFB1FB2FB3F1F2F3
Depth of penetration (mm)12108323635
Average depth
(mm)
1034
Table 3. Values of determined diffusion and migration coefficients.
Basis of the StudyDiffusion Coefficients
D m2/s
Migration Coefficient
DM m2/s
ASTM C1202-97 [34]
Migration 6 h
0.91 × 10⁻¹²
NT BUILD 492 [35]
Migration 96 h
0.61 × 10⁻¹²
ASTM C1760 [39] 2.2 × 10⁻¹¹
ASTM C 1556-03 [36]
Diffusion 840 h
1.44 × 10⁻¹²
Thermodynamic model [37] Migration 24 h, 48 h(0.72 ÷ 1.45)
×10−12
-
Thermodynamic model [37]
Diffusion 120 days
1.22 × 10⁻¹²-
Table 4. Values of the weight of a sample taken from the HC-500 panel determined with the gravimetric method using a hydrostatic balance.
DrySaturatedWeight on aSample VolumeDensityPorosity
Hydrostatic Balance
WeightWeightgcm3g/cm3%
100.7104.664.240.42.4939.65
Disclaimer/Publisher’s Note: The statements, opinions and data contained in all publications are solely those of the individual author(s) and contributor(s) and not of MDPI and/or the editor(s). MDPI and/or the editor(s) disclaim responsibility for any injury to people or property resulting from any ideas, methods, instructions or products referred to in the content.

