
Experimental and Theoretical Investigation of Rotational Behavior of Straight Mortise-Tenon Joints Considering Local Compression Perpendicular to Grain

Abstract
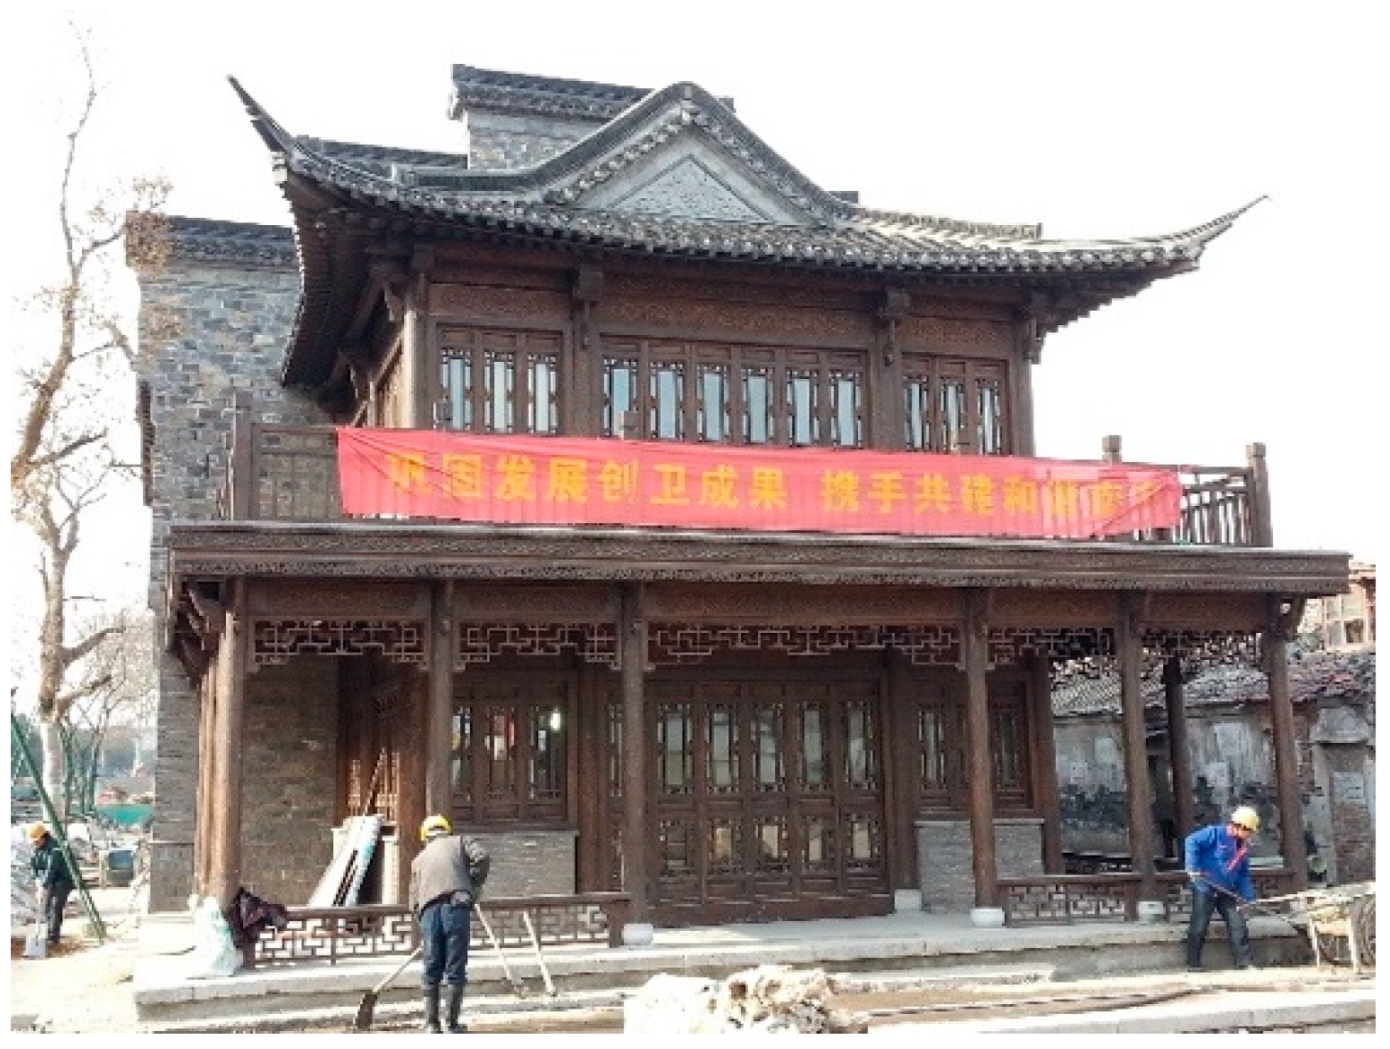
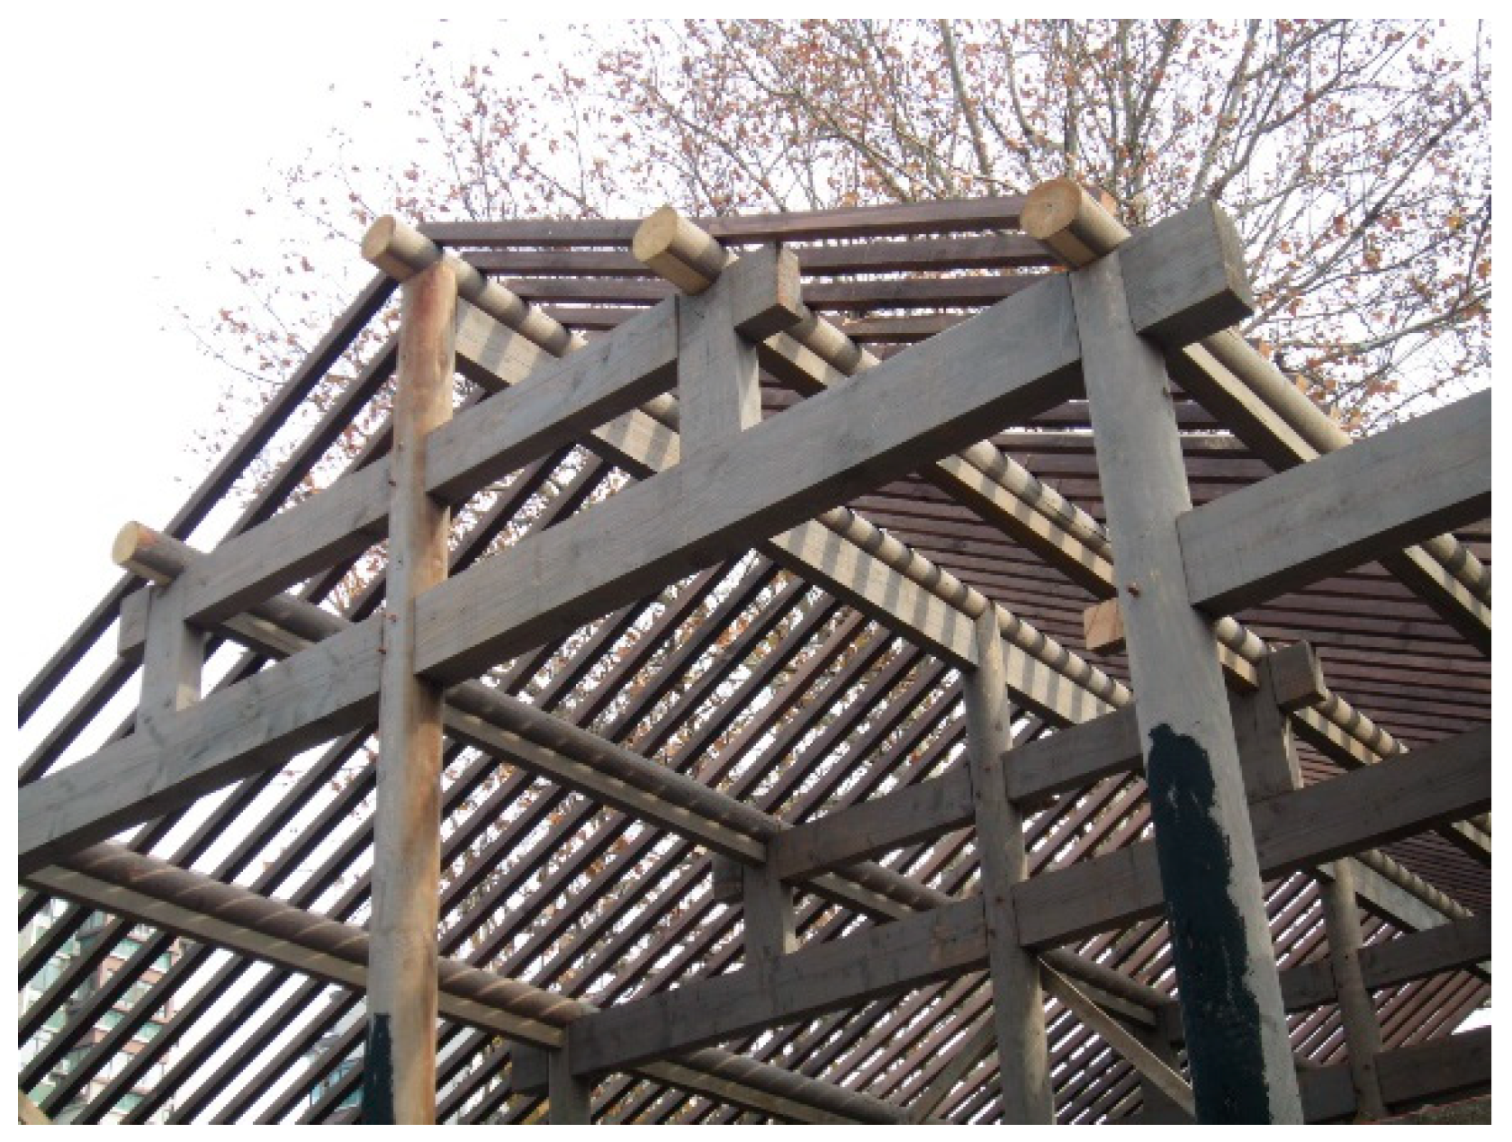
:1. Introduction
2. Compression Tests Perpendicular to Grain
2.1. Materials
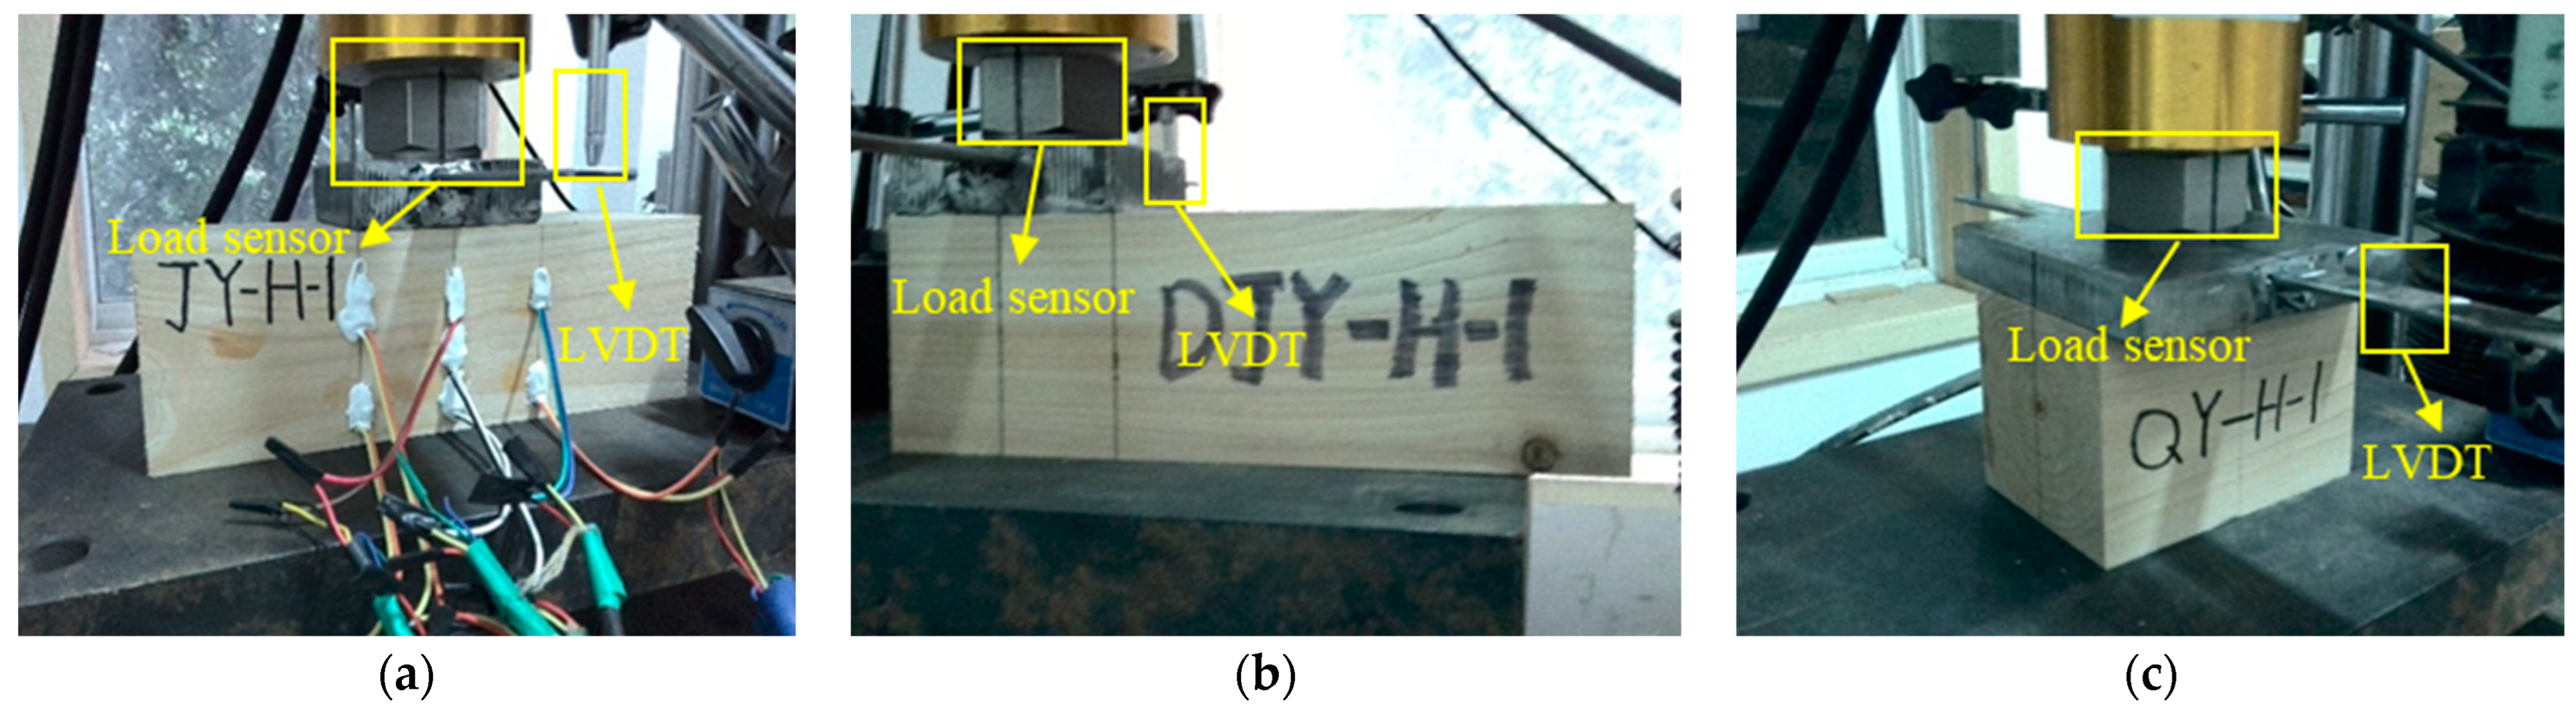
2.2. Test Setup
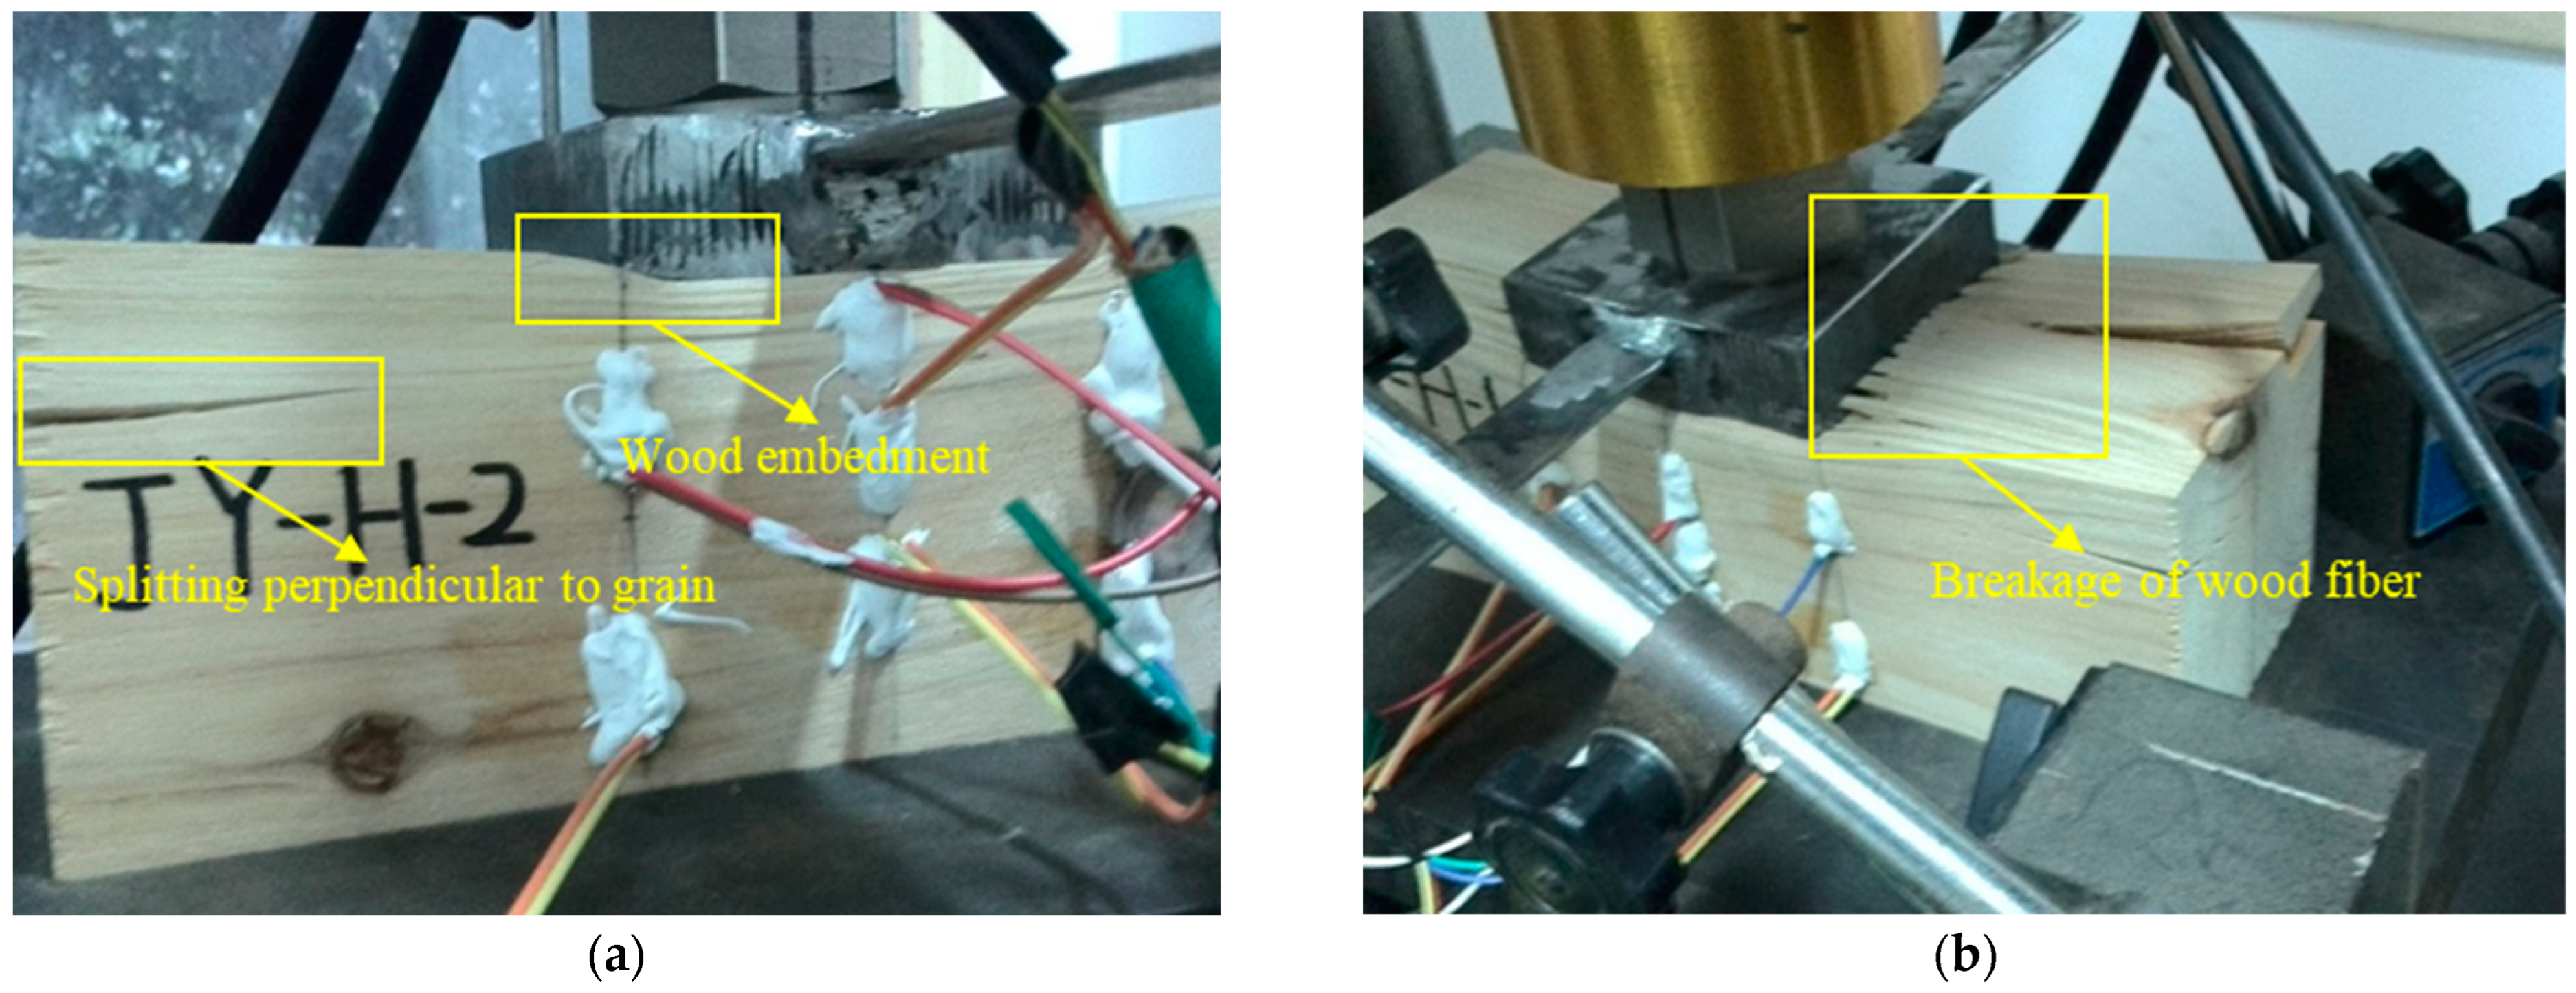
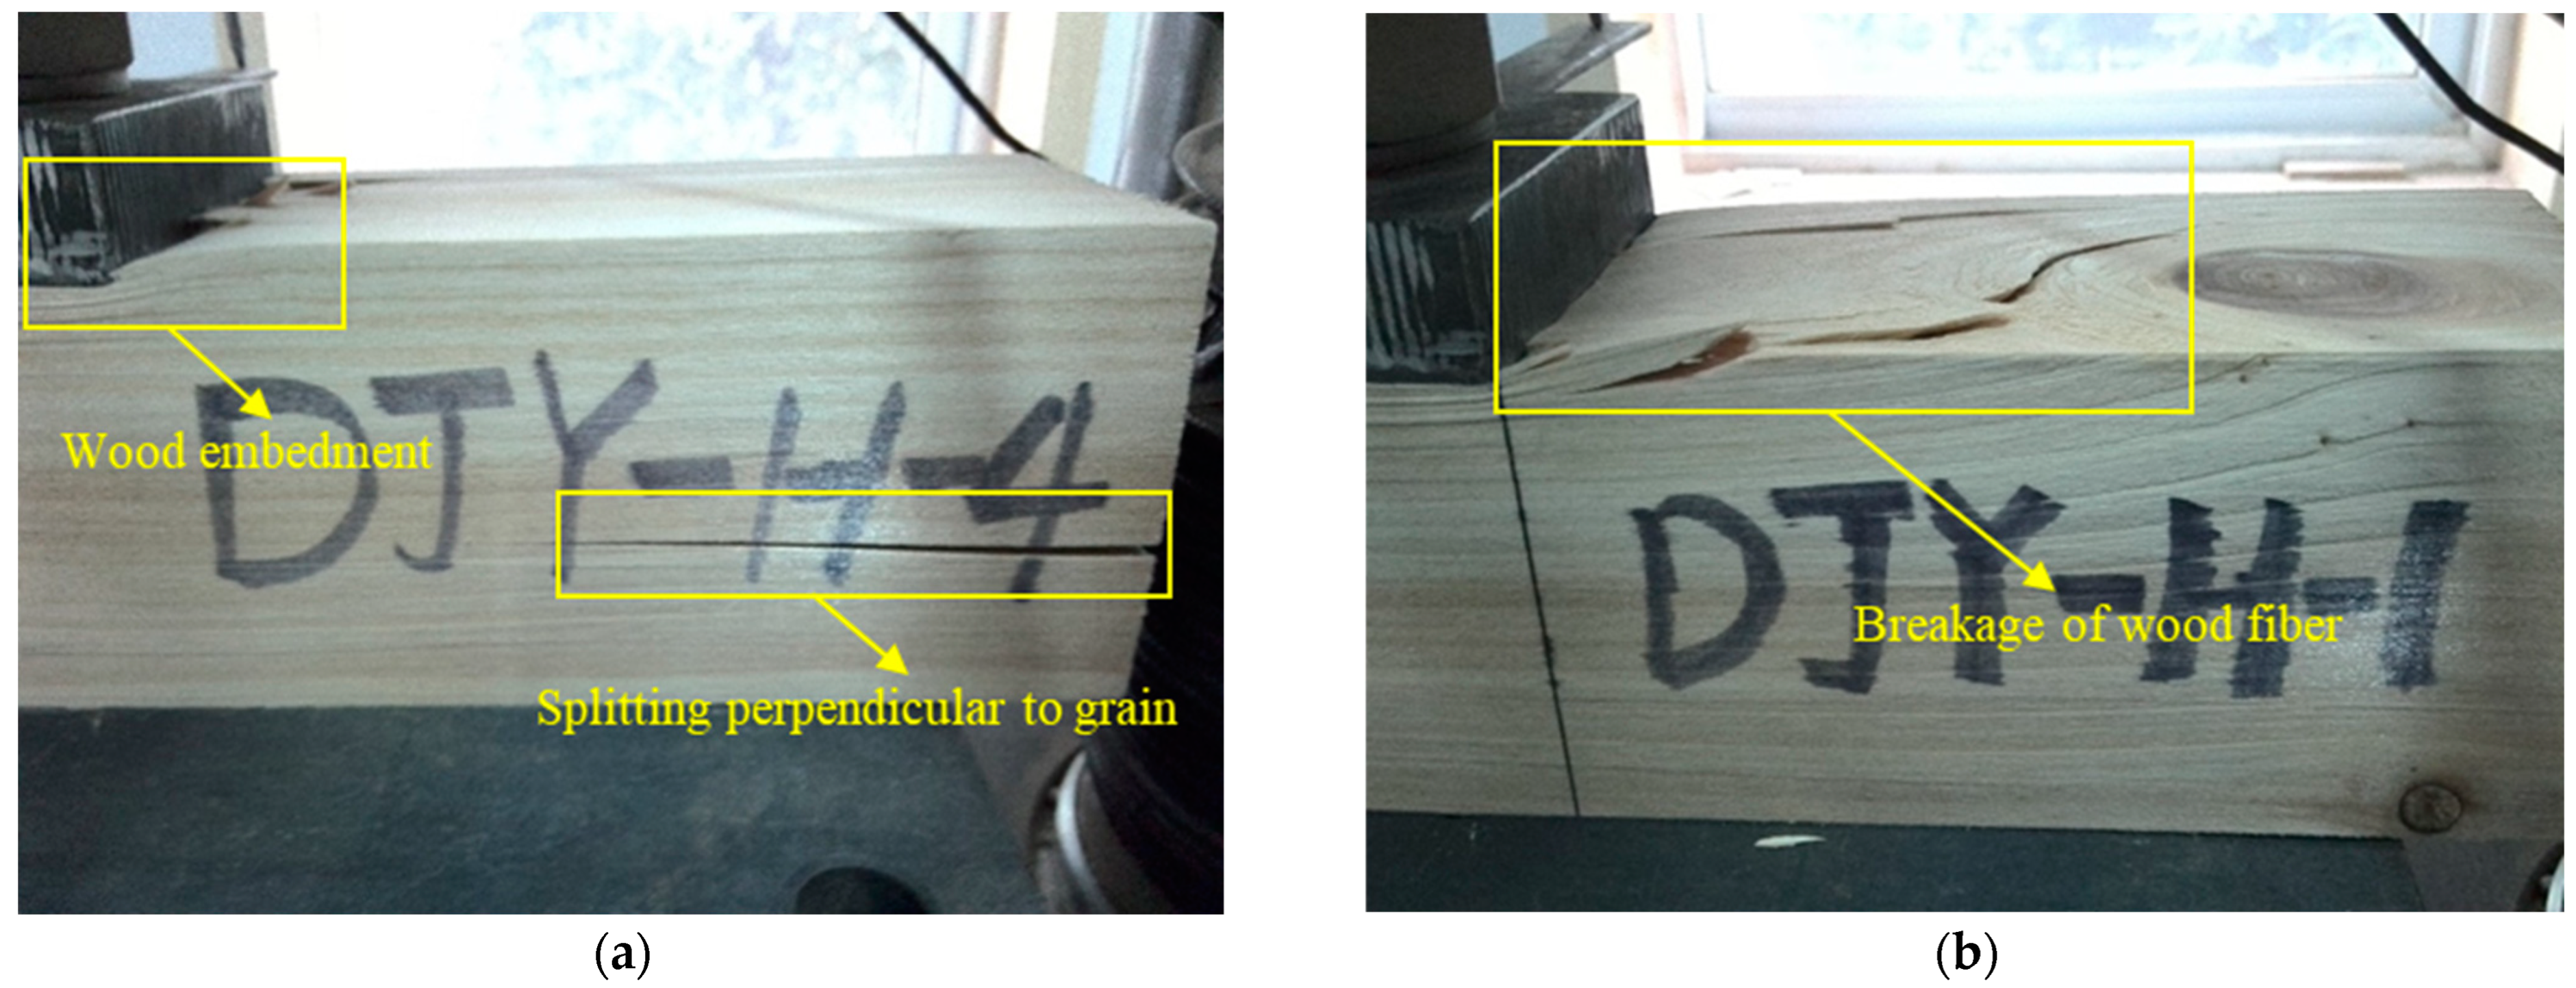
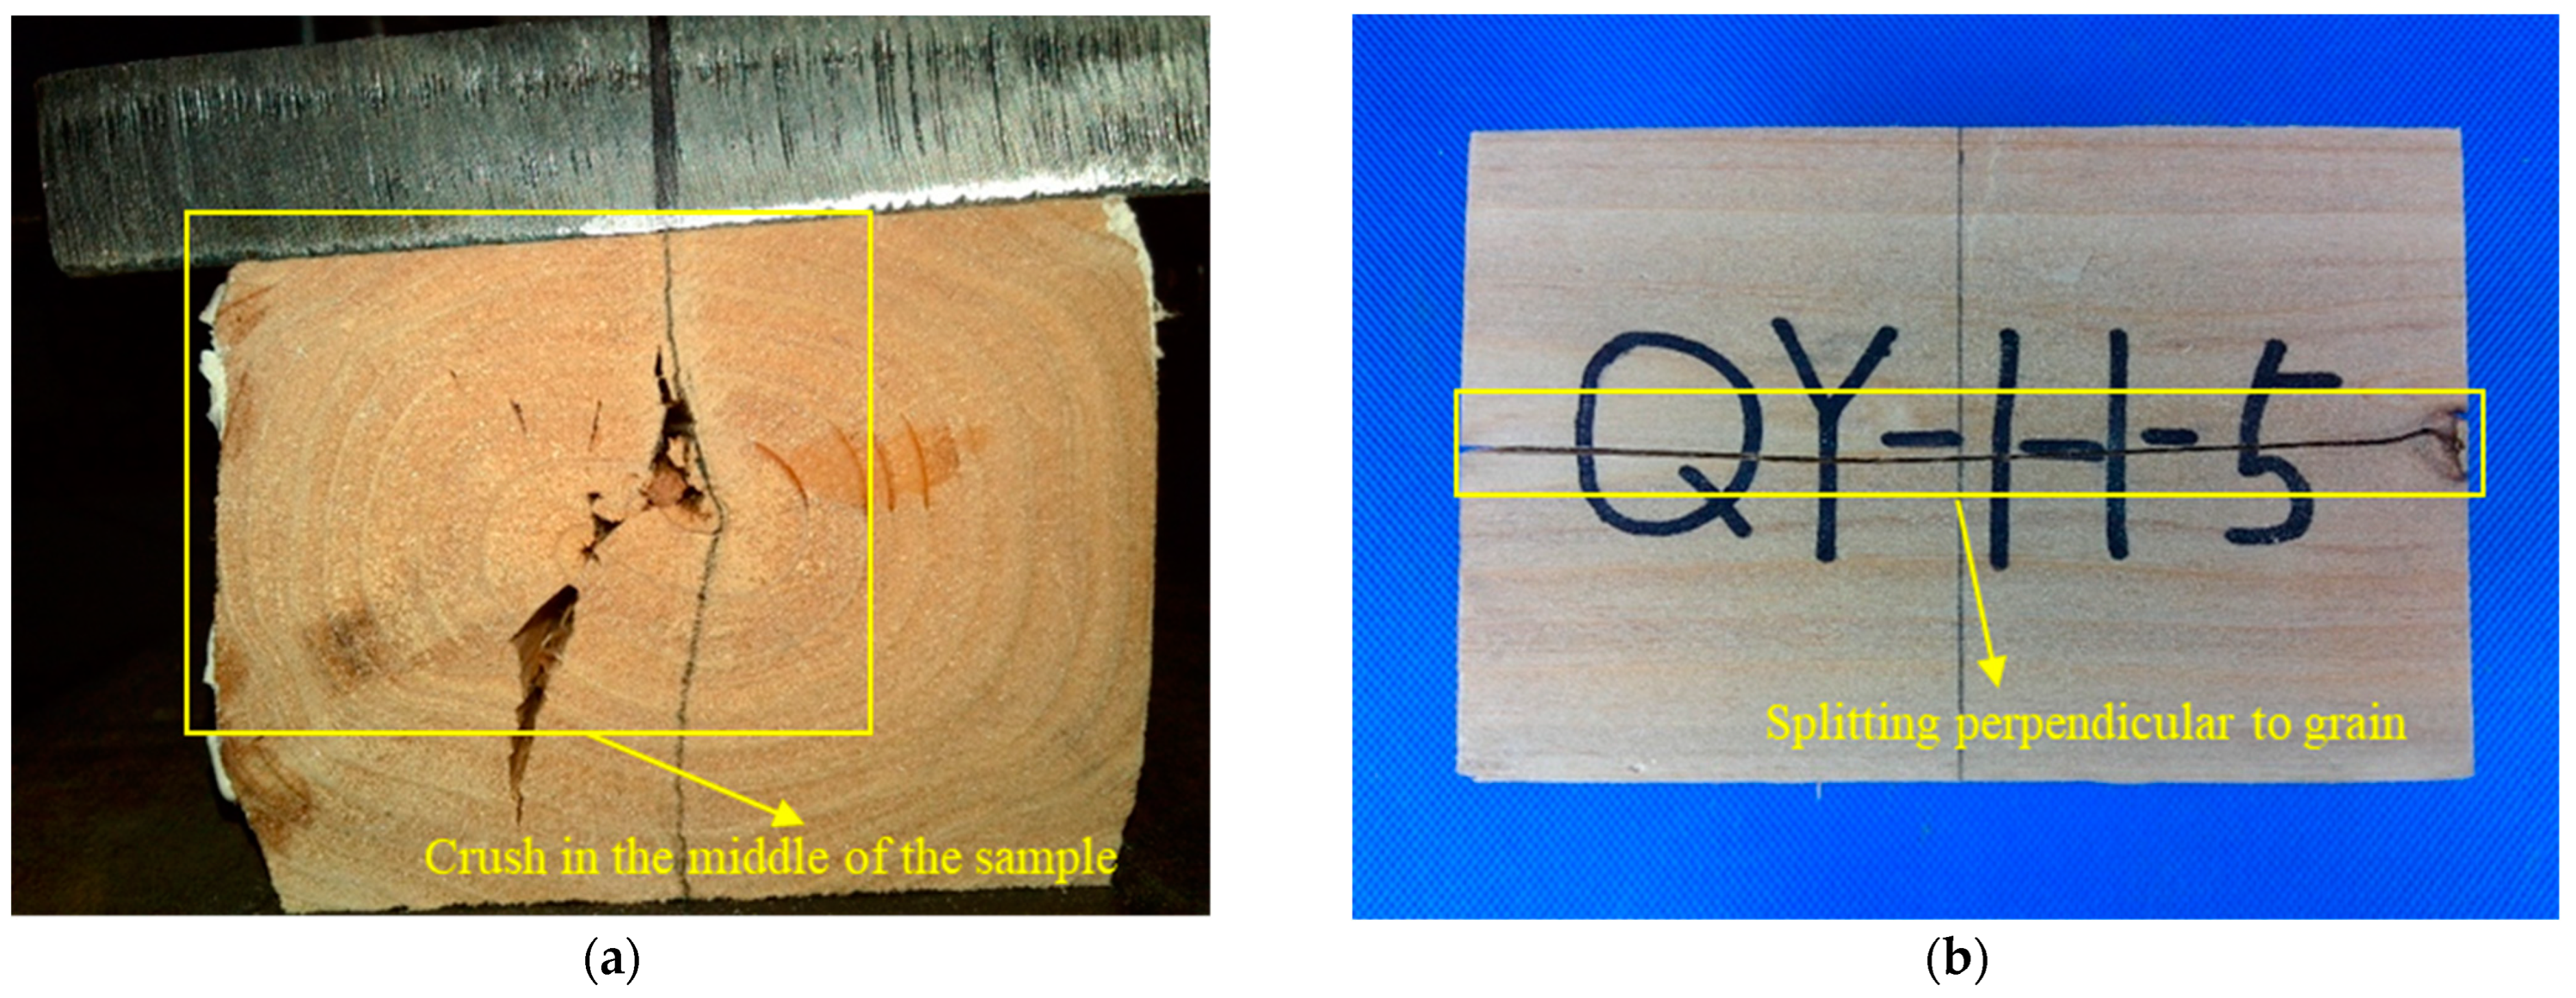
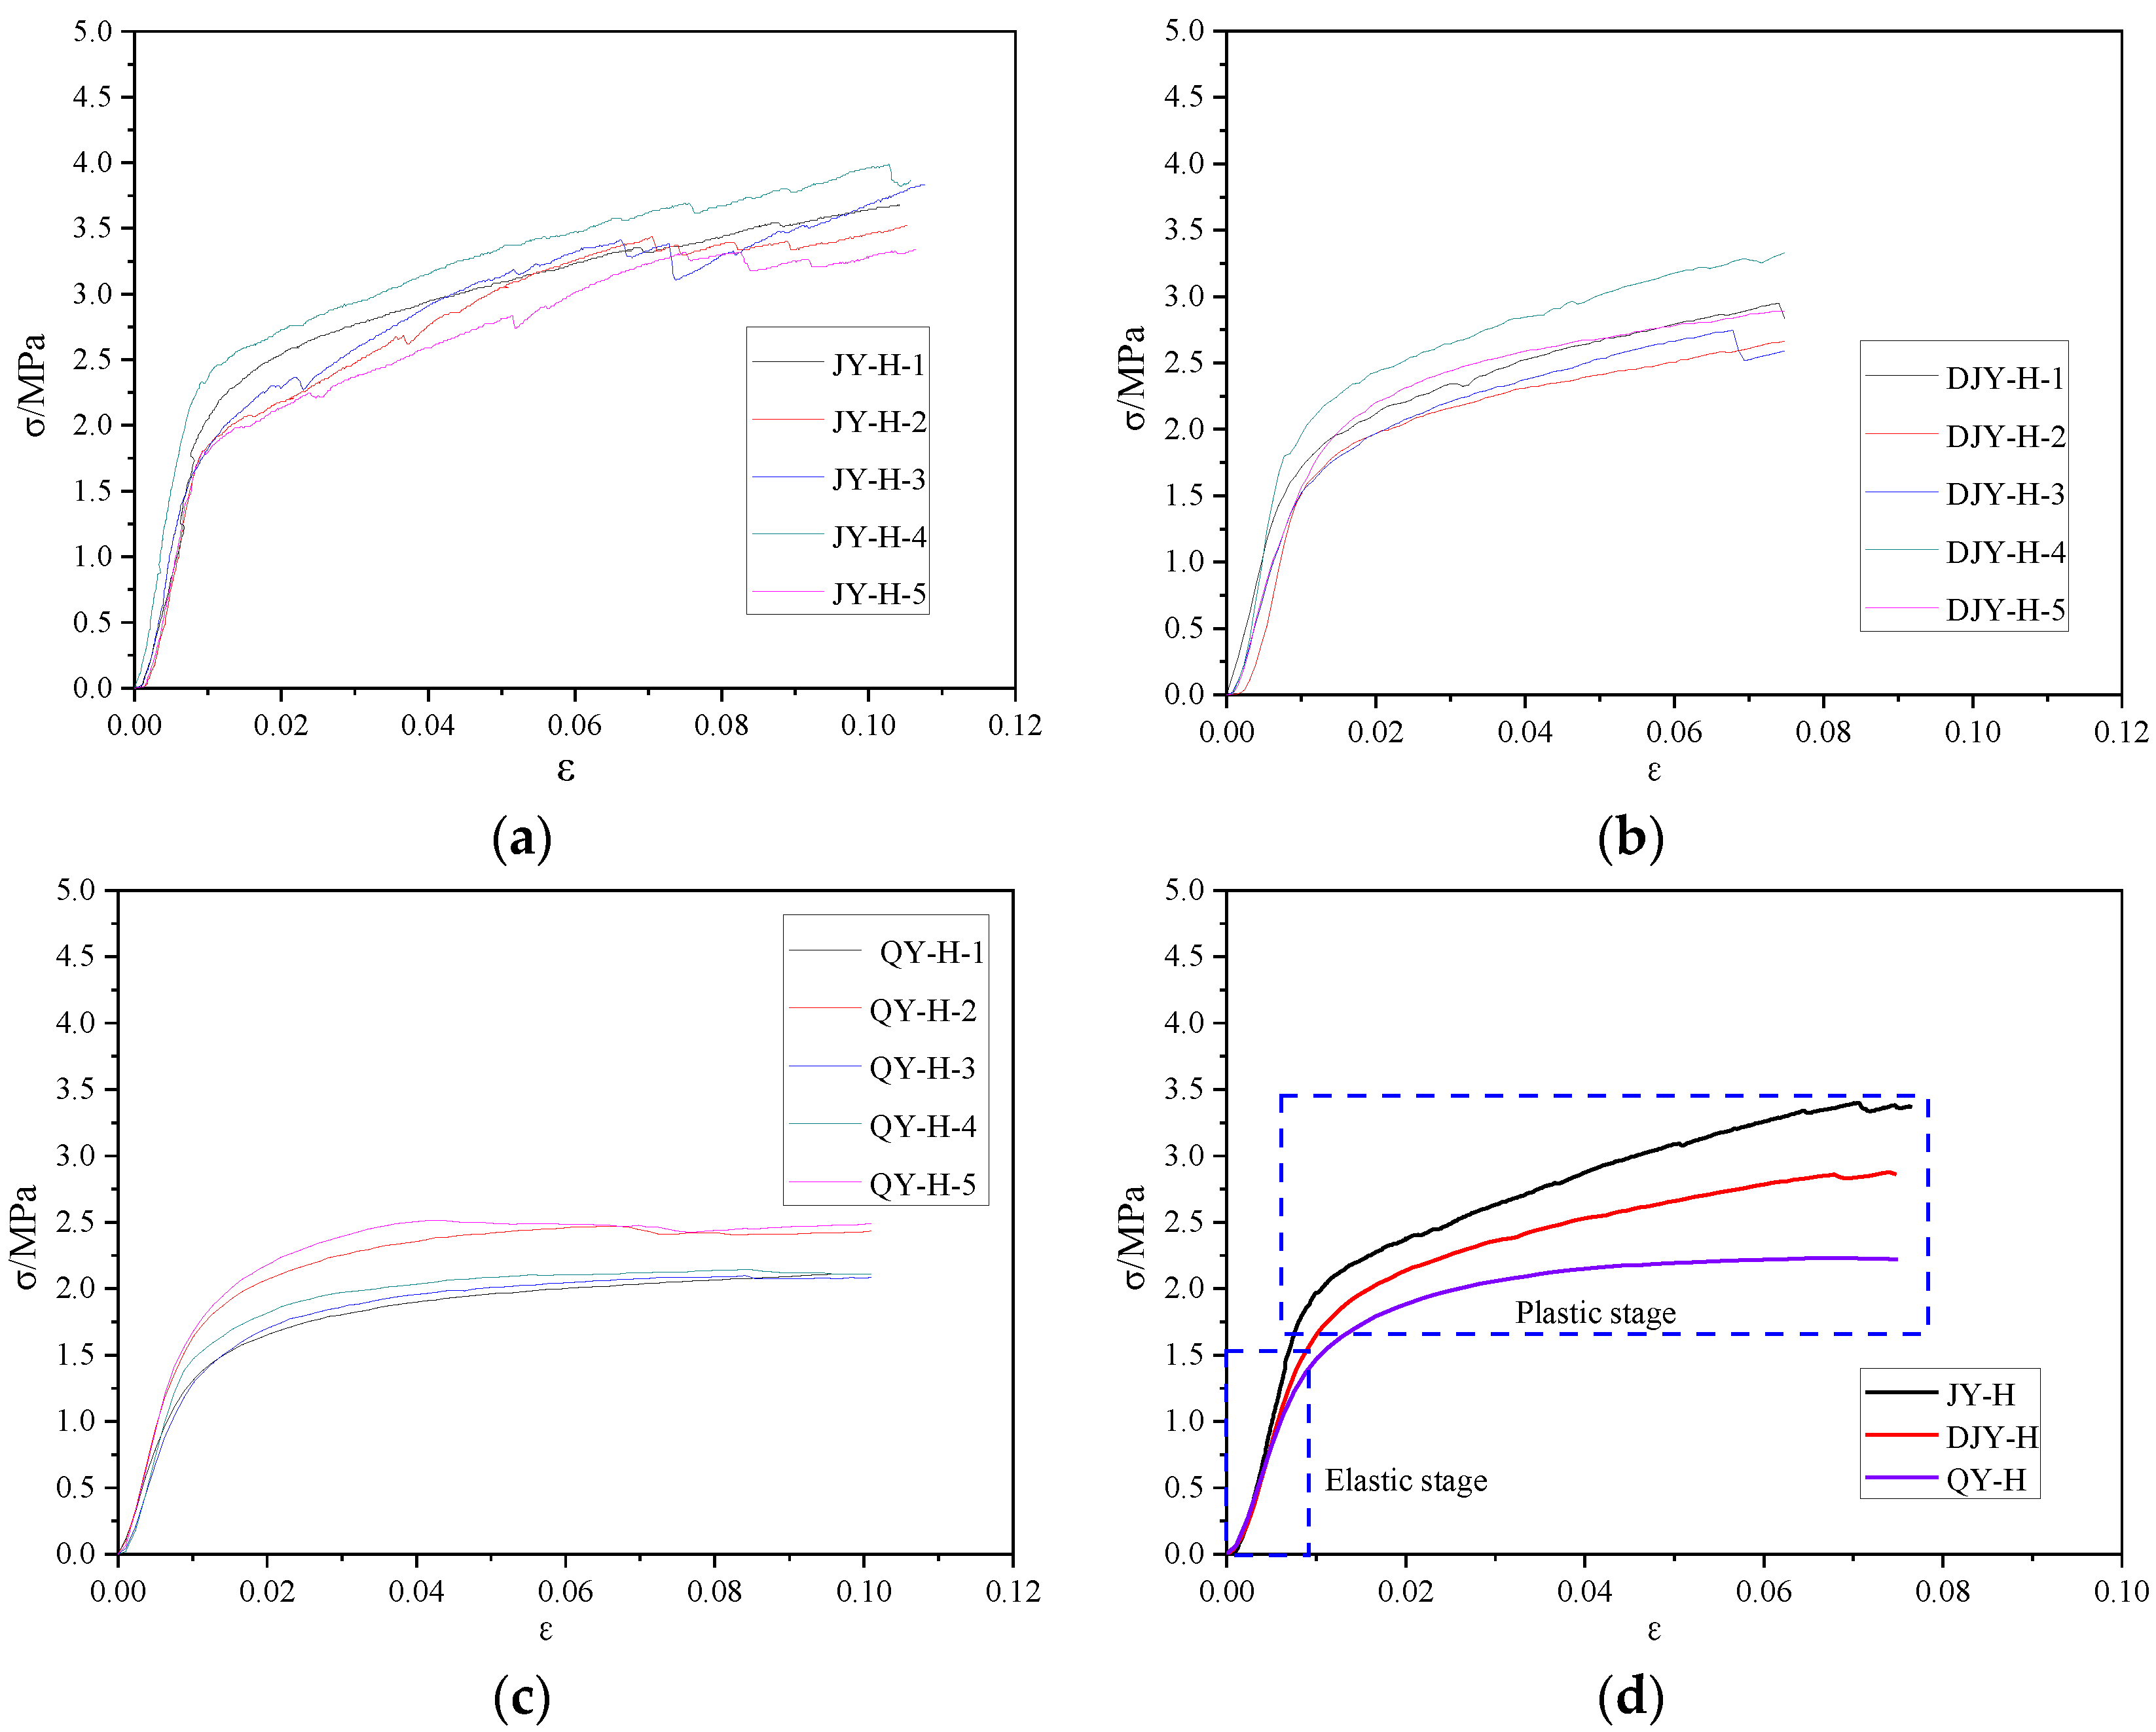
2.3. Experimental Results
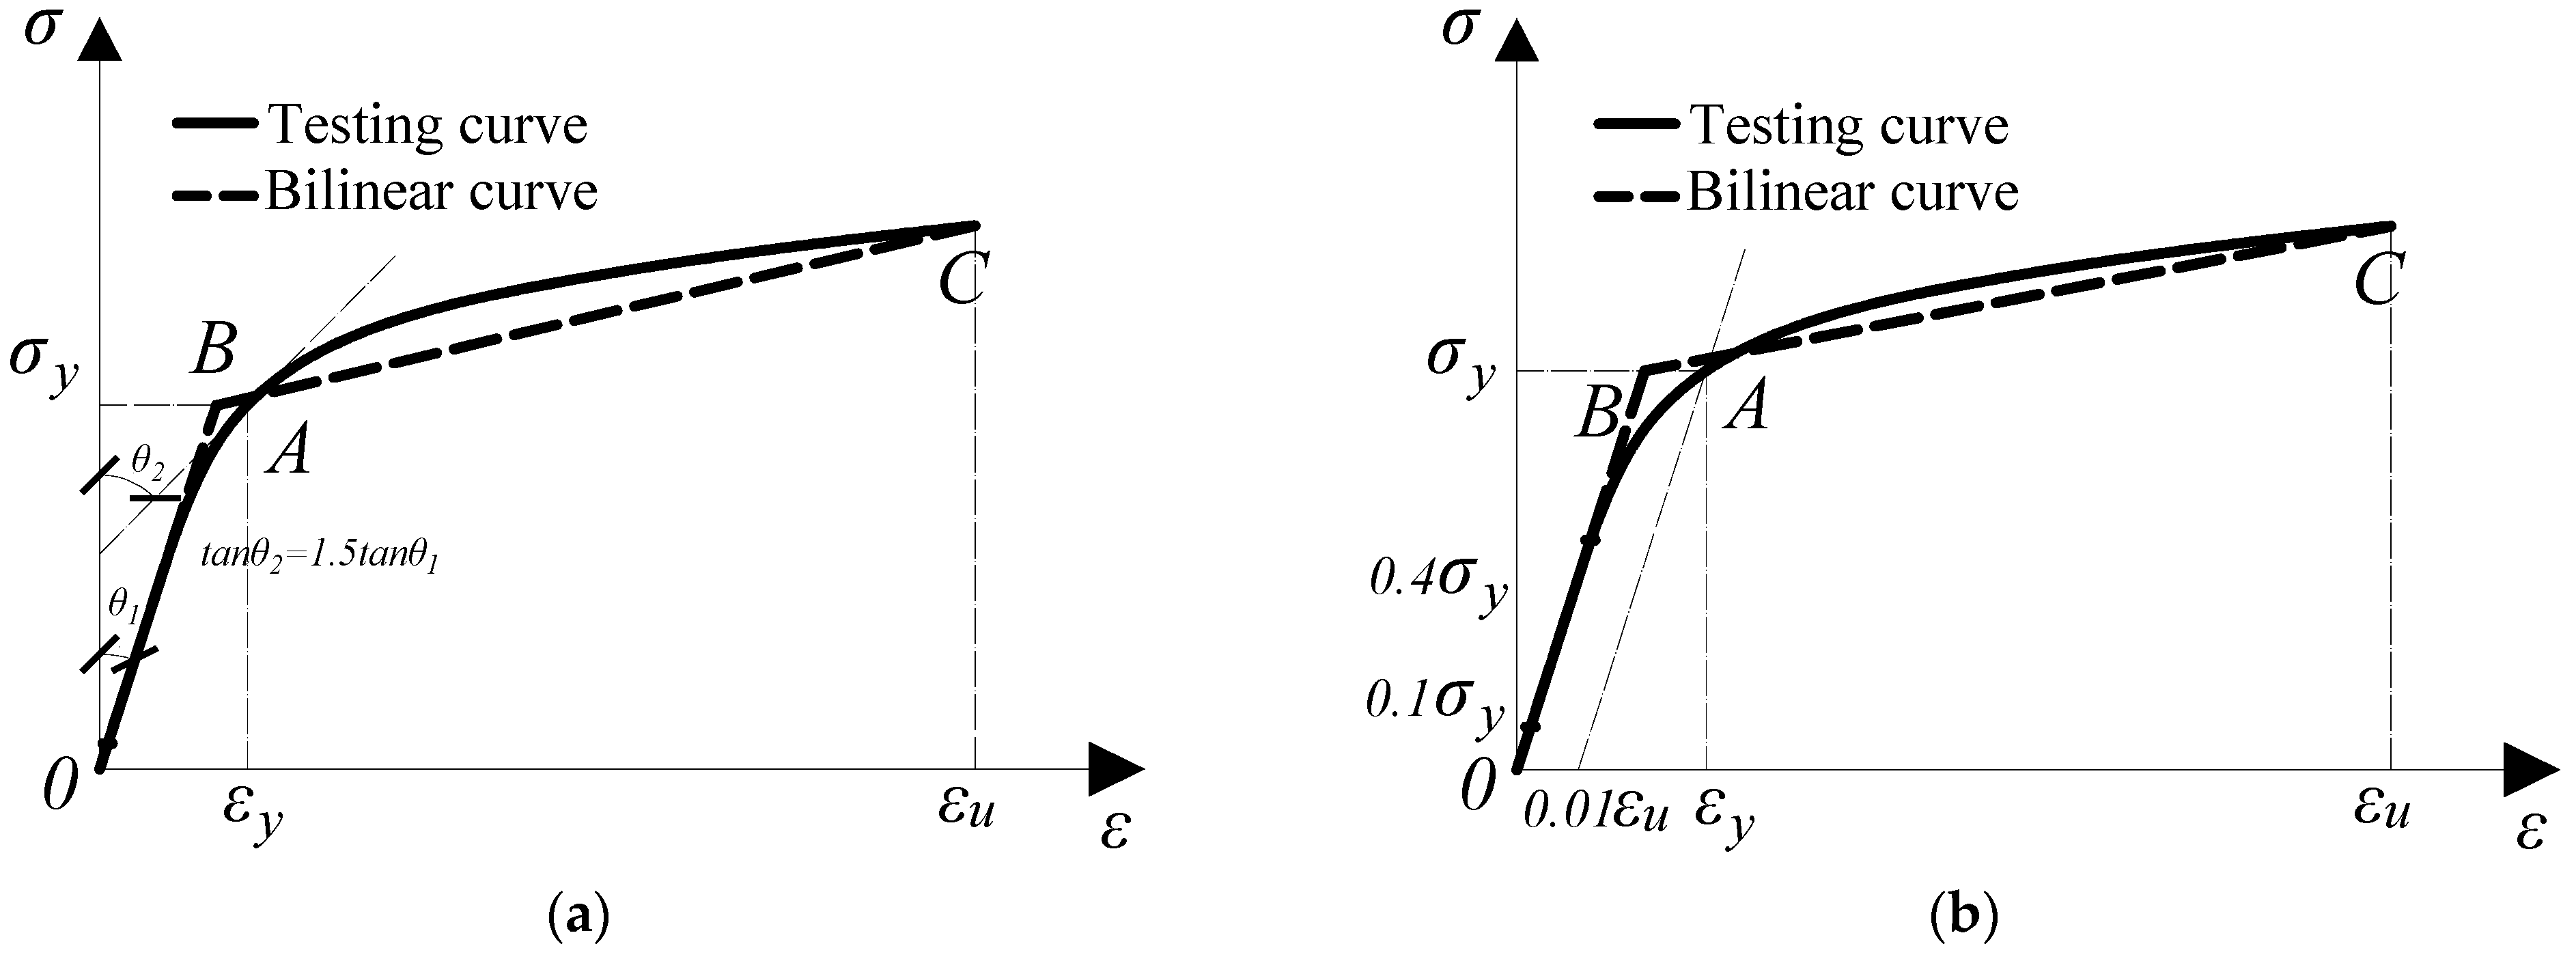
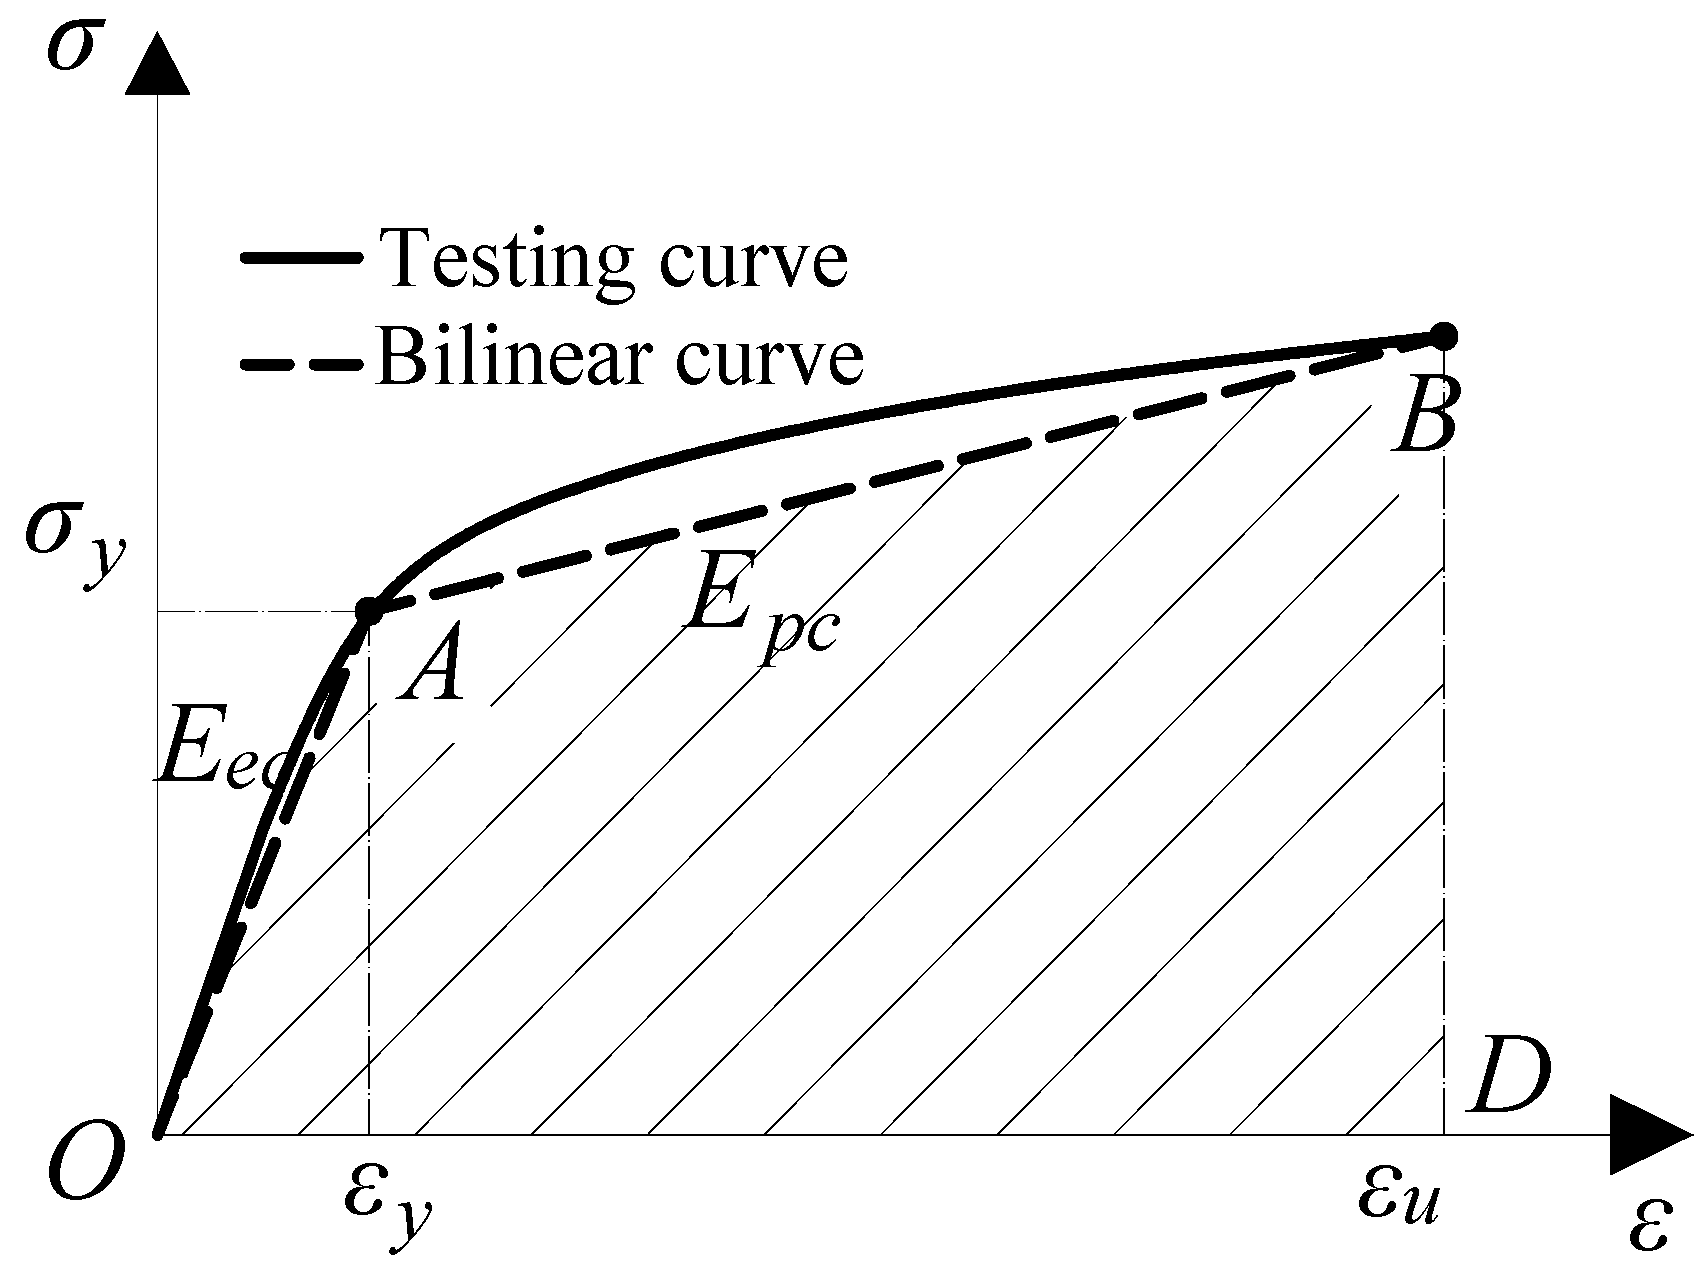
2.4. Constitutive Model for Wood Perpendicular to Grain
3. Cyclic Loading Tests
3.1. Testing Specimens
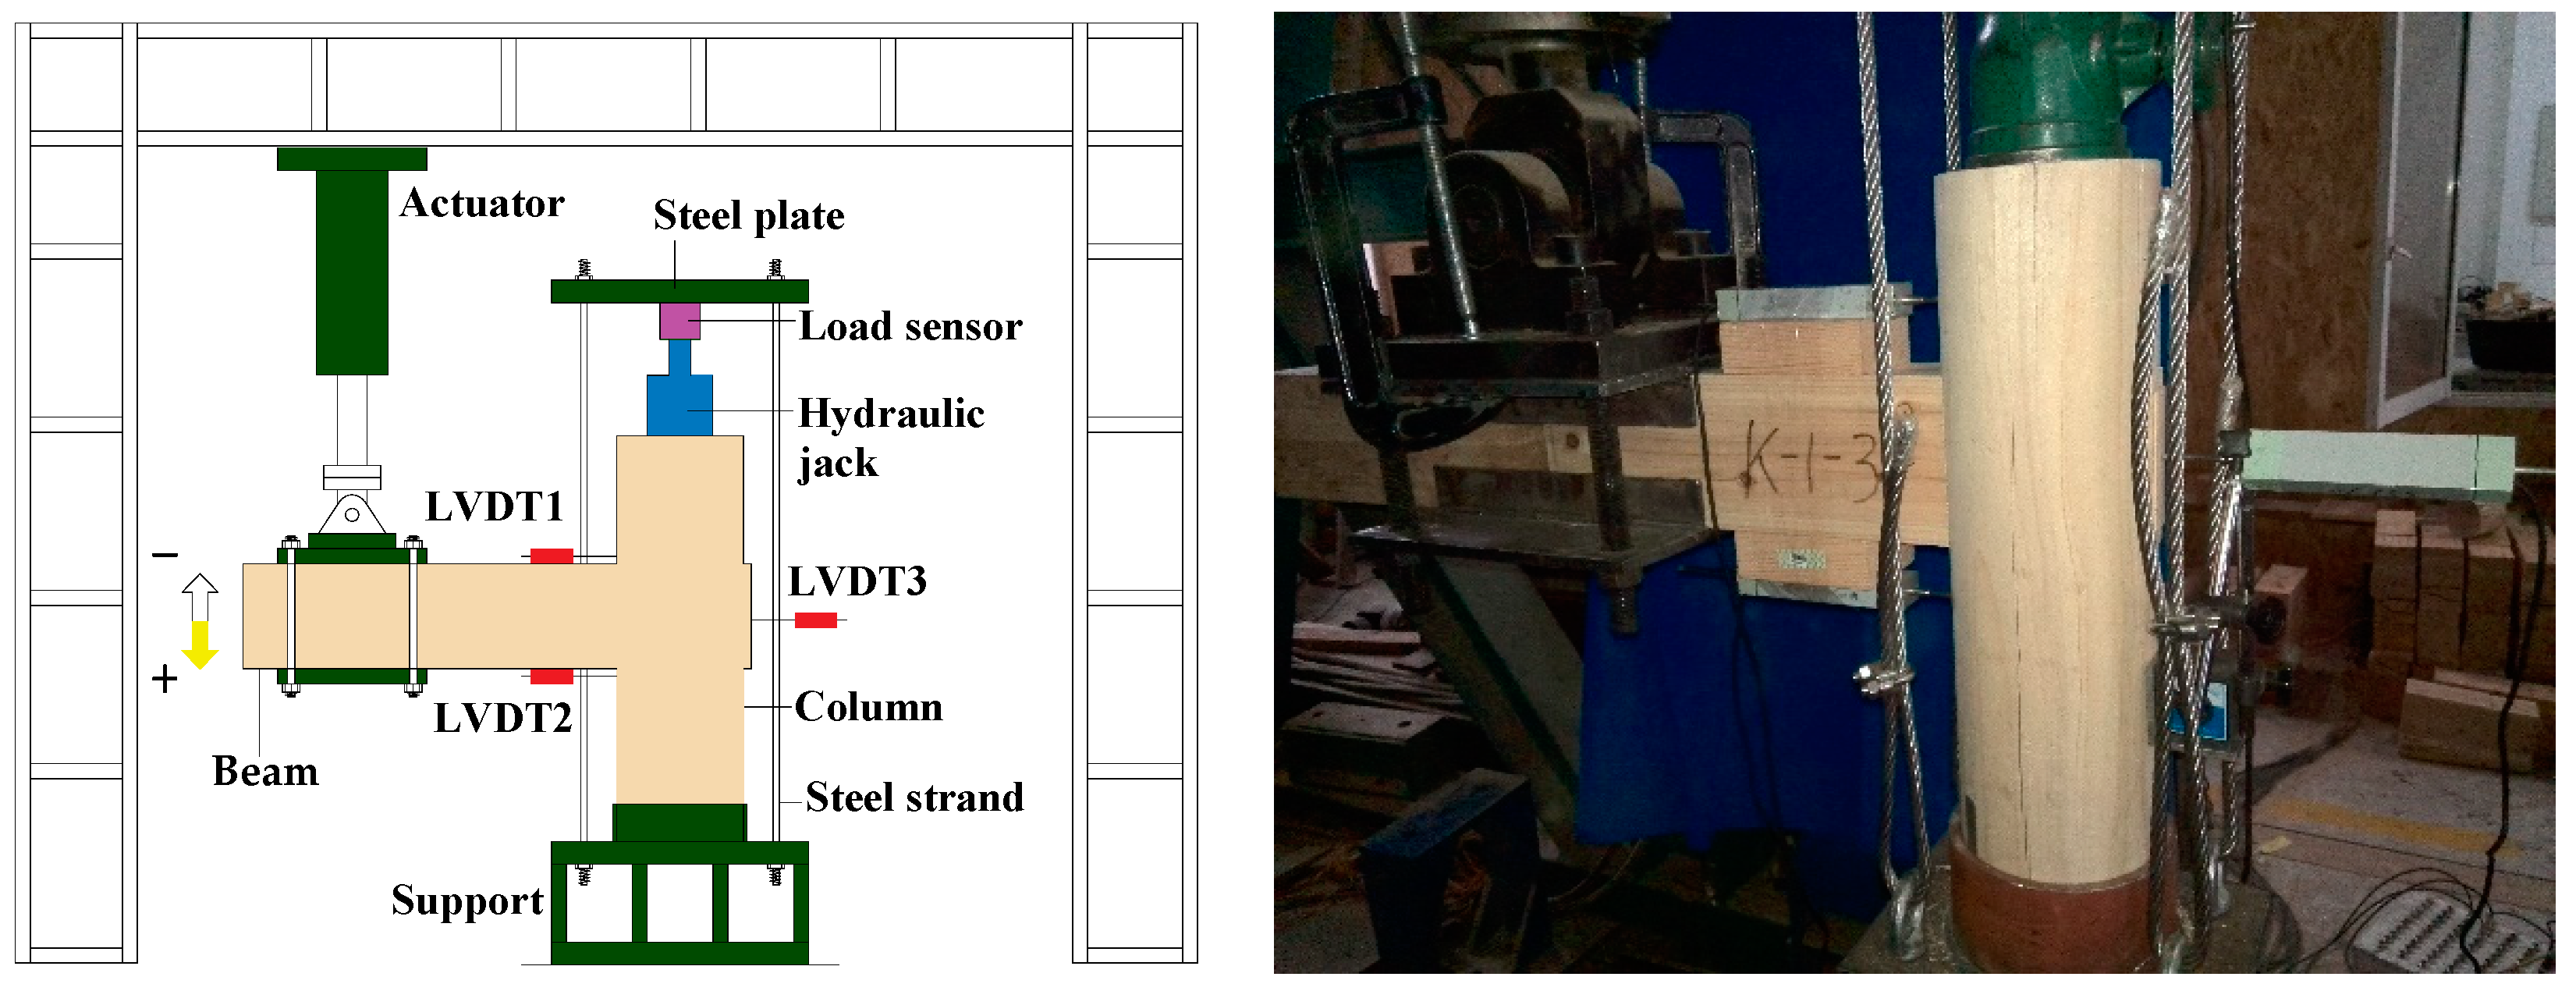
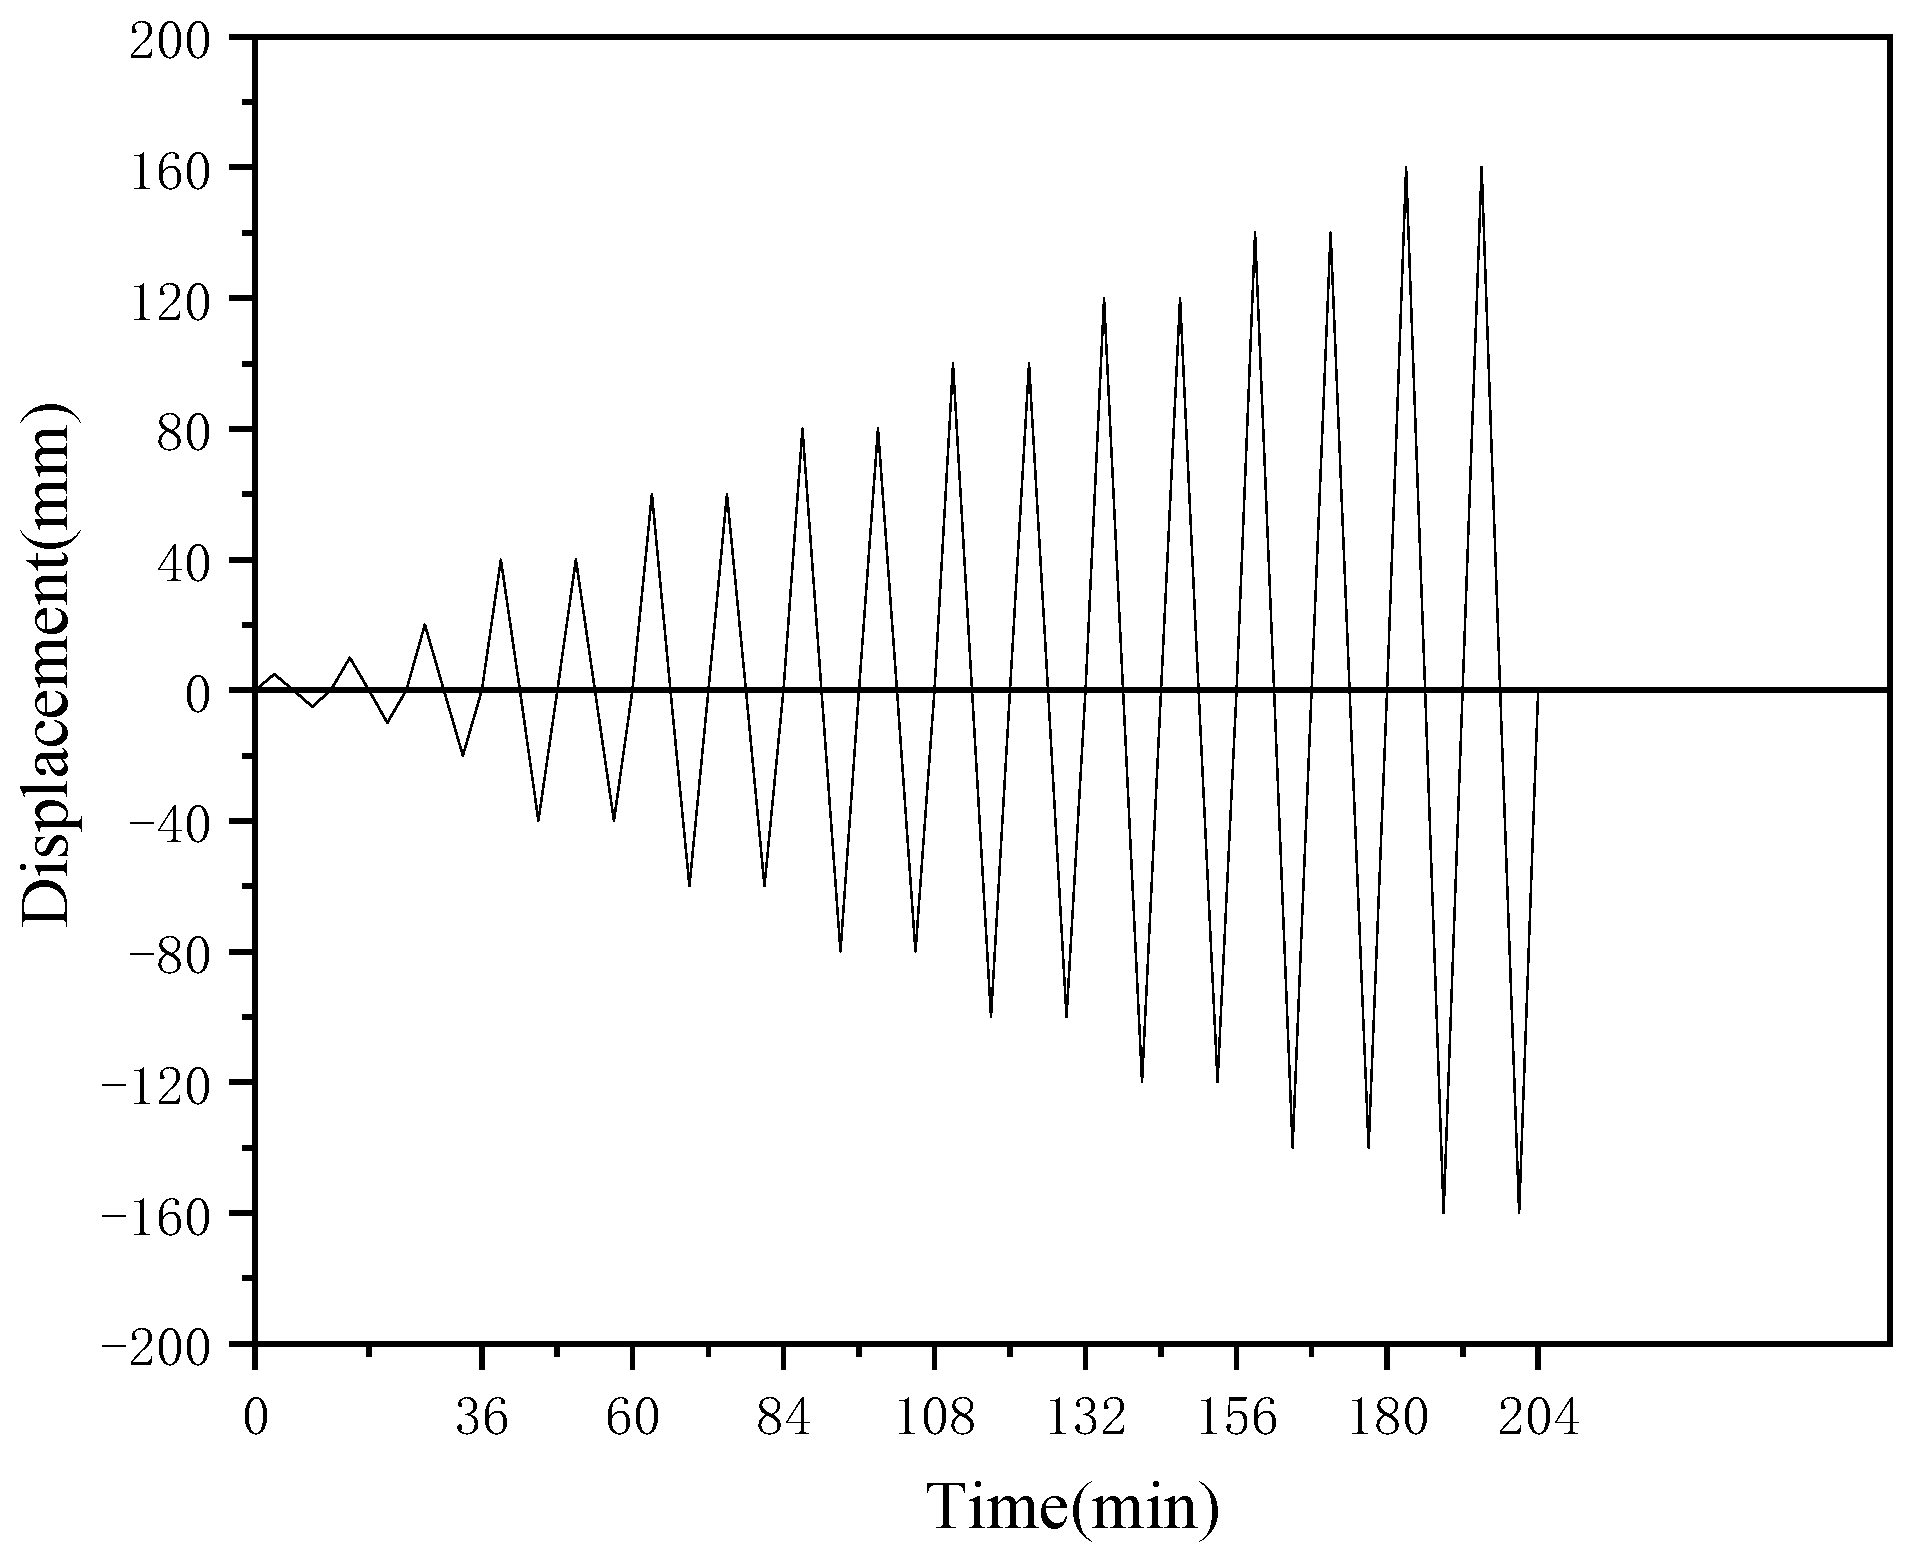
3.2. Test Setup and Loading Protocol
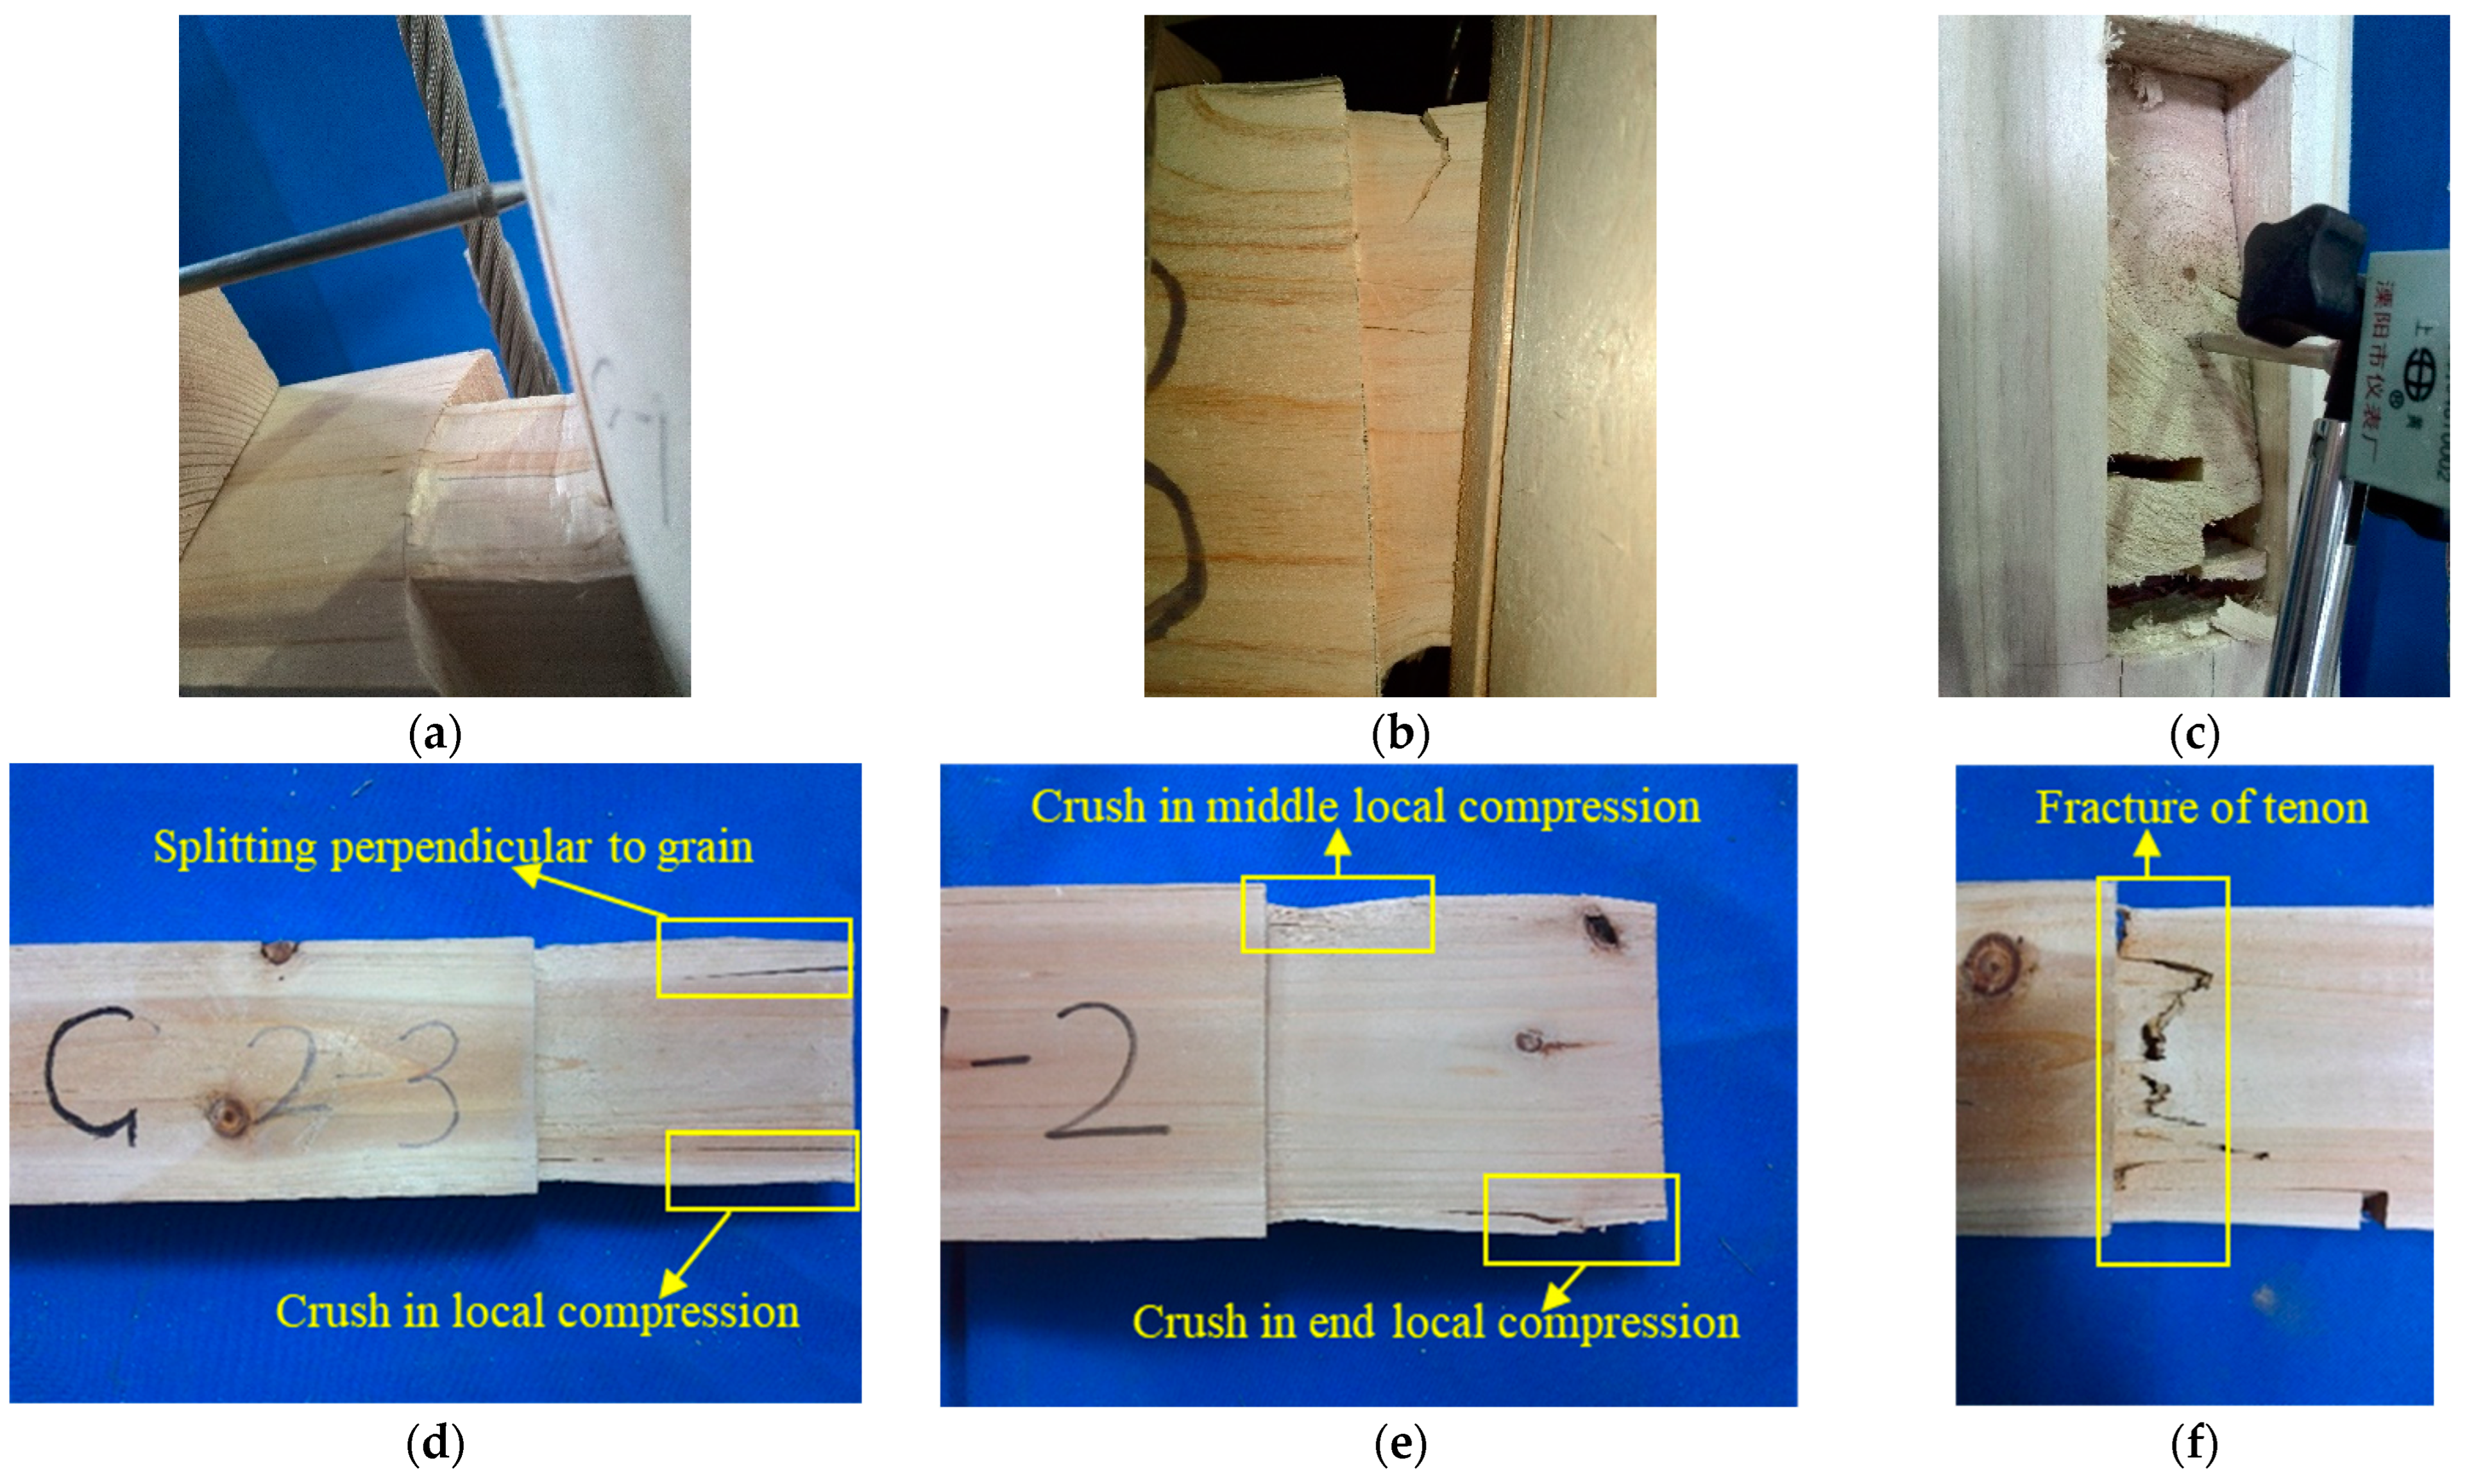
3.3. Typical Failure Modes
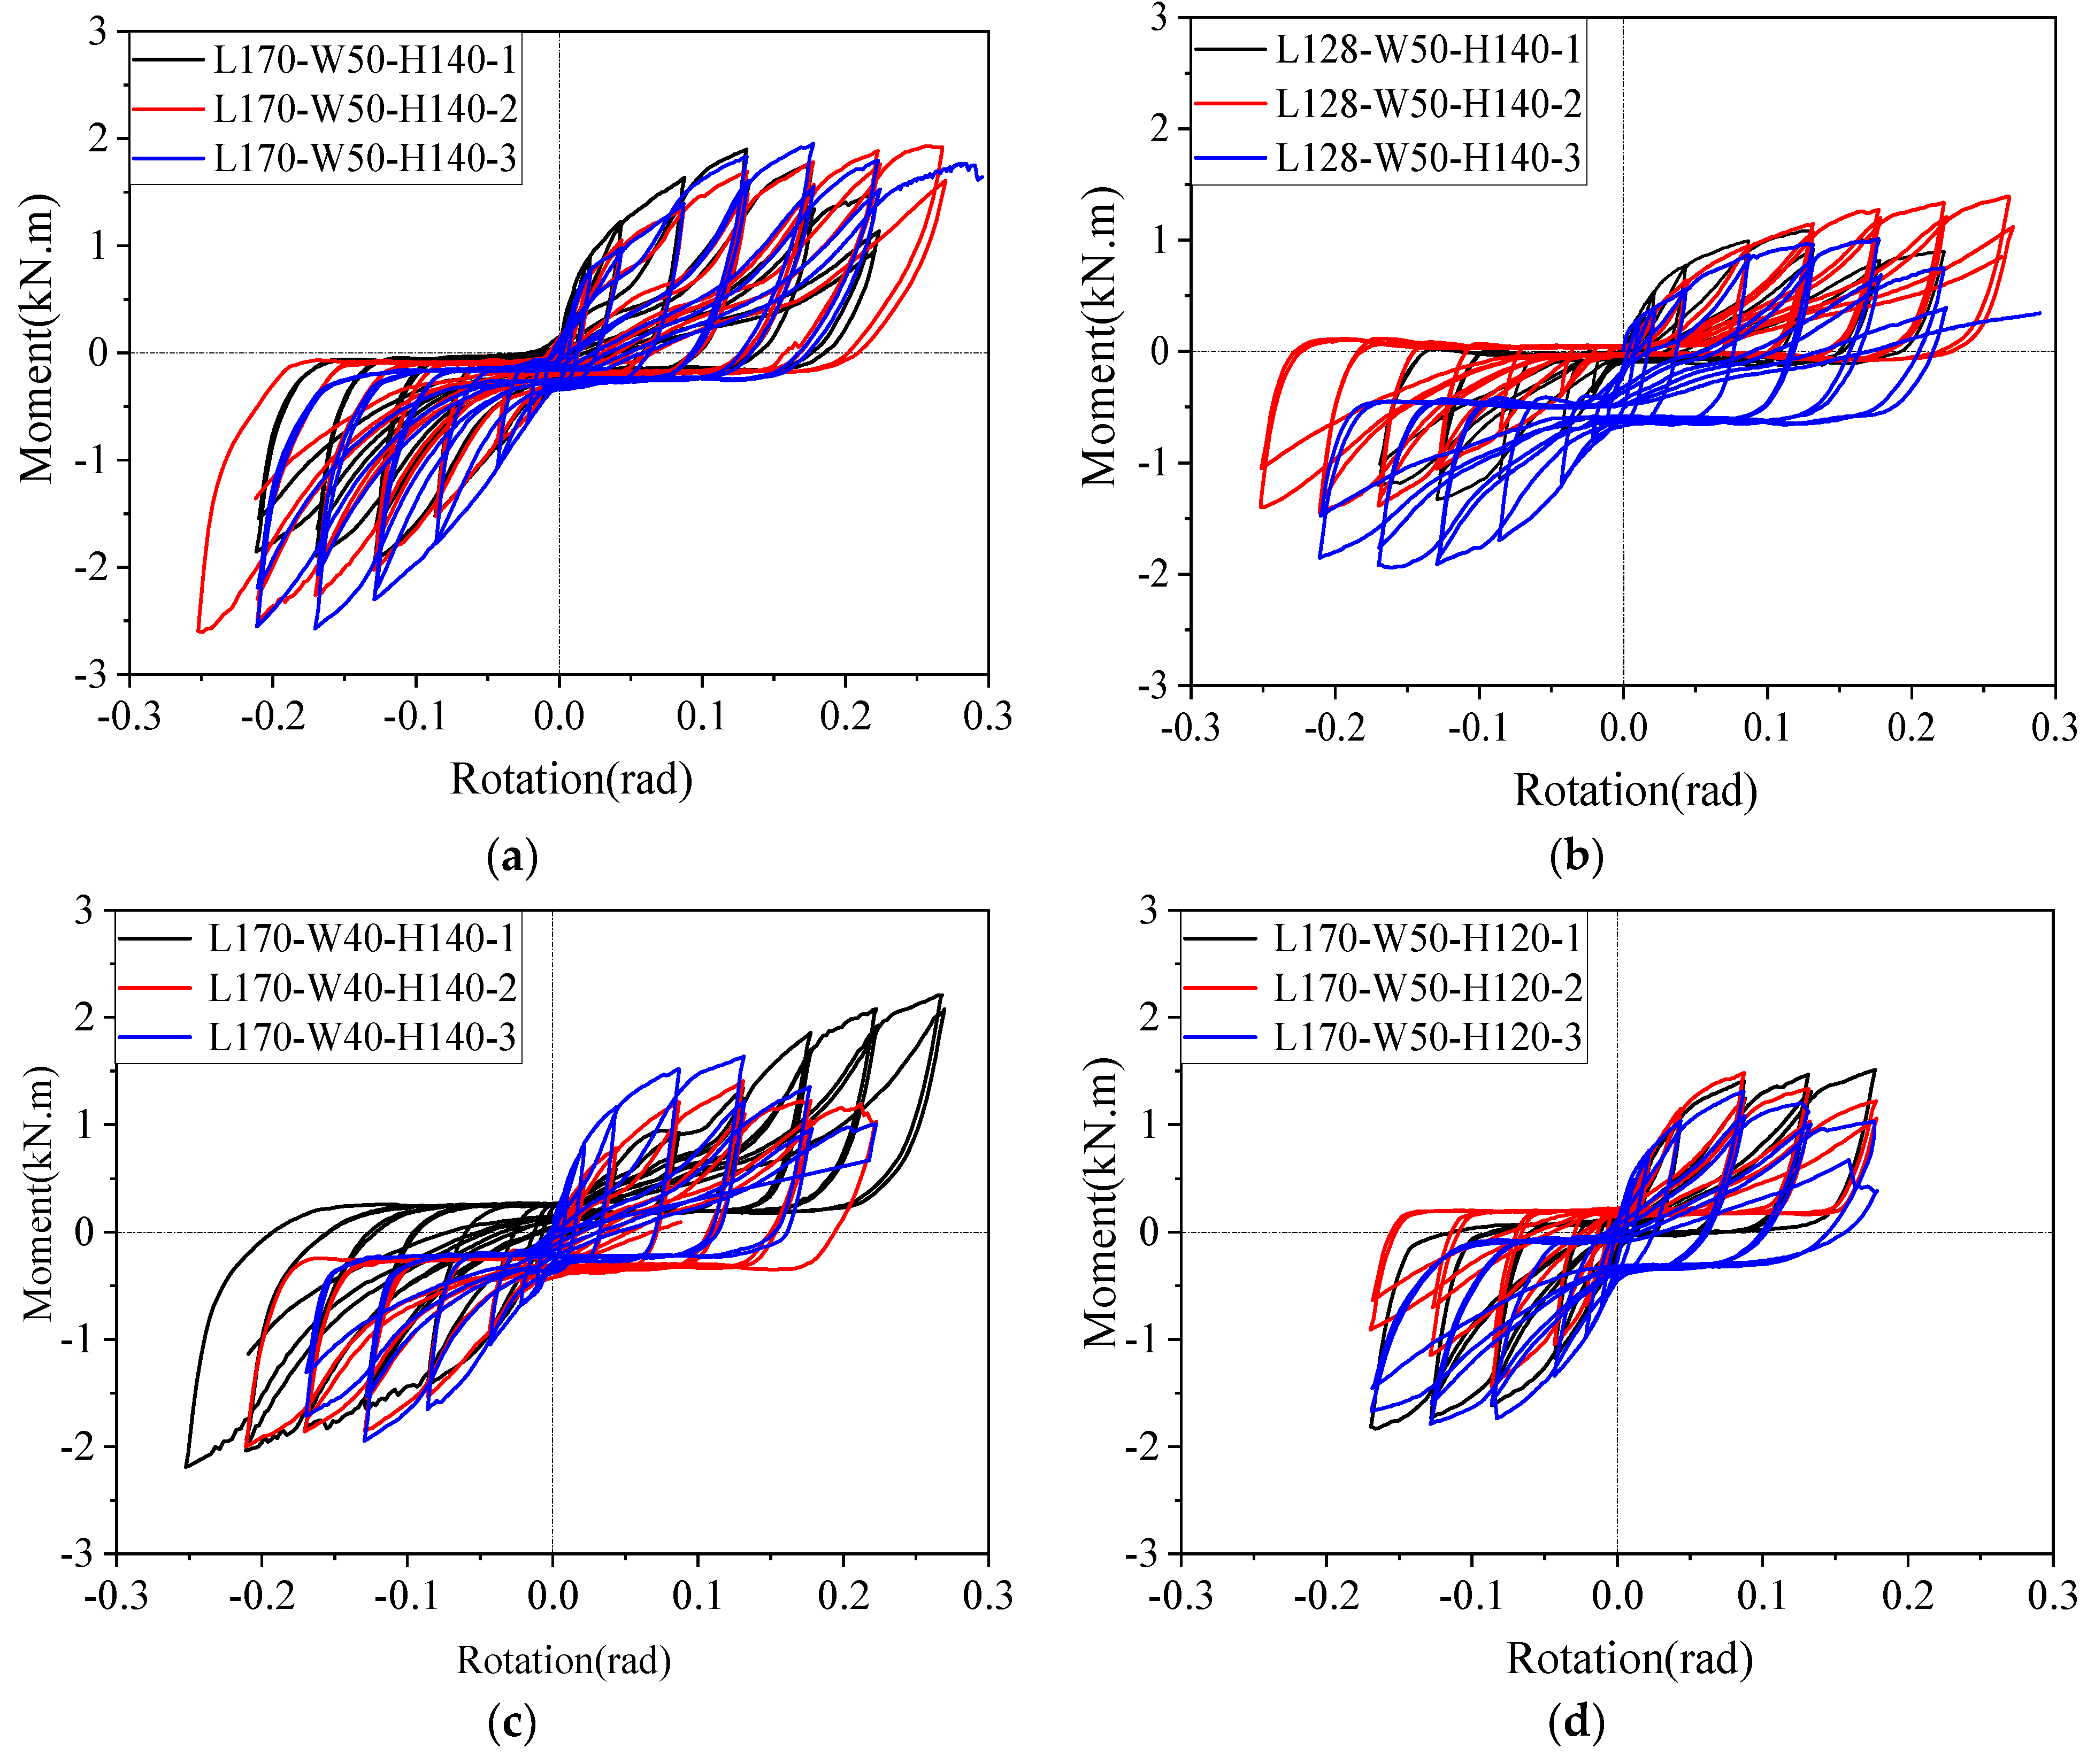
3.4. Hysteresis Curves
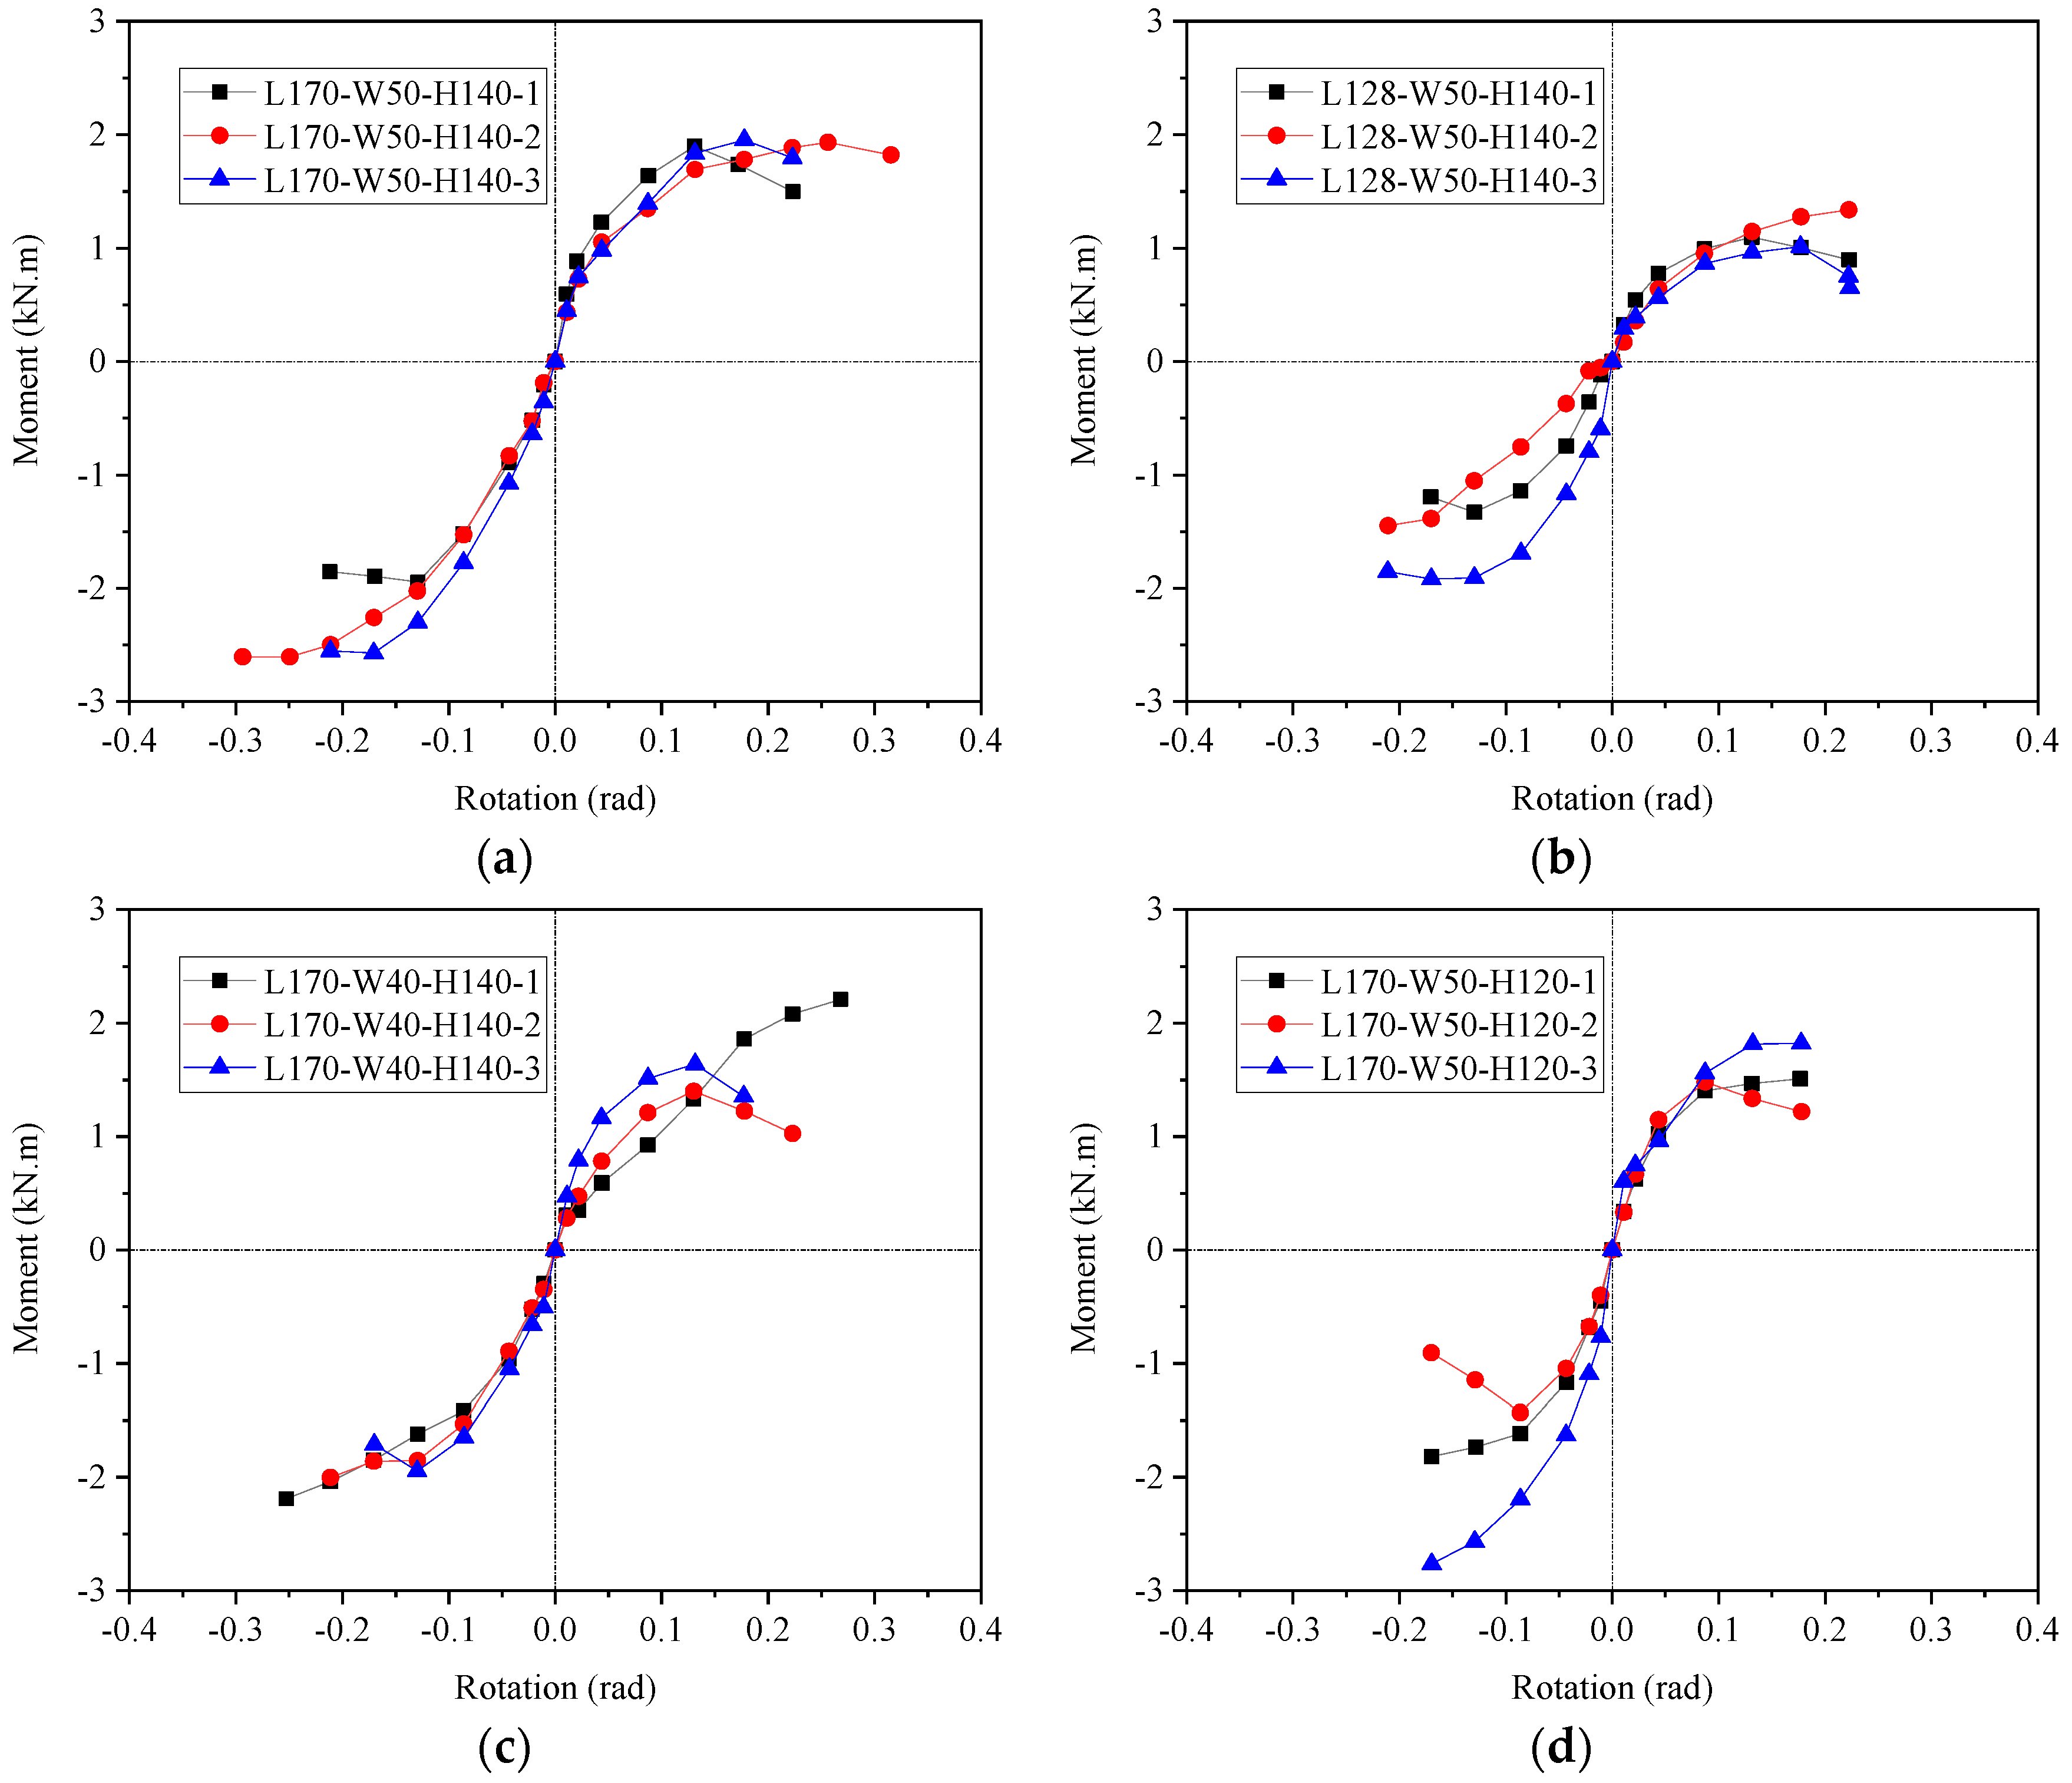
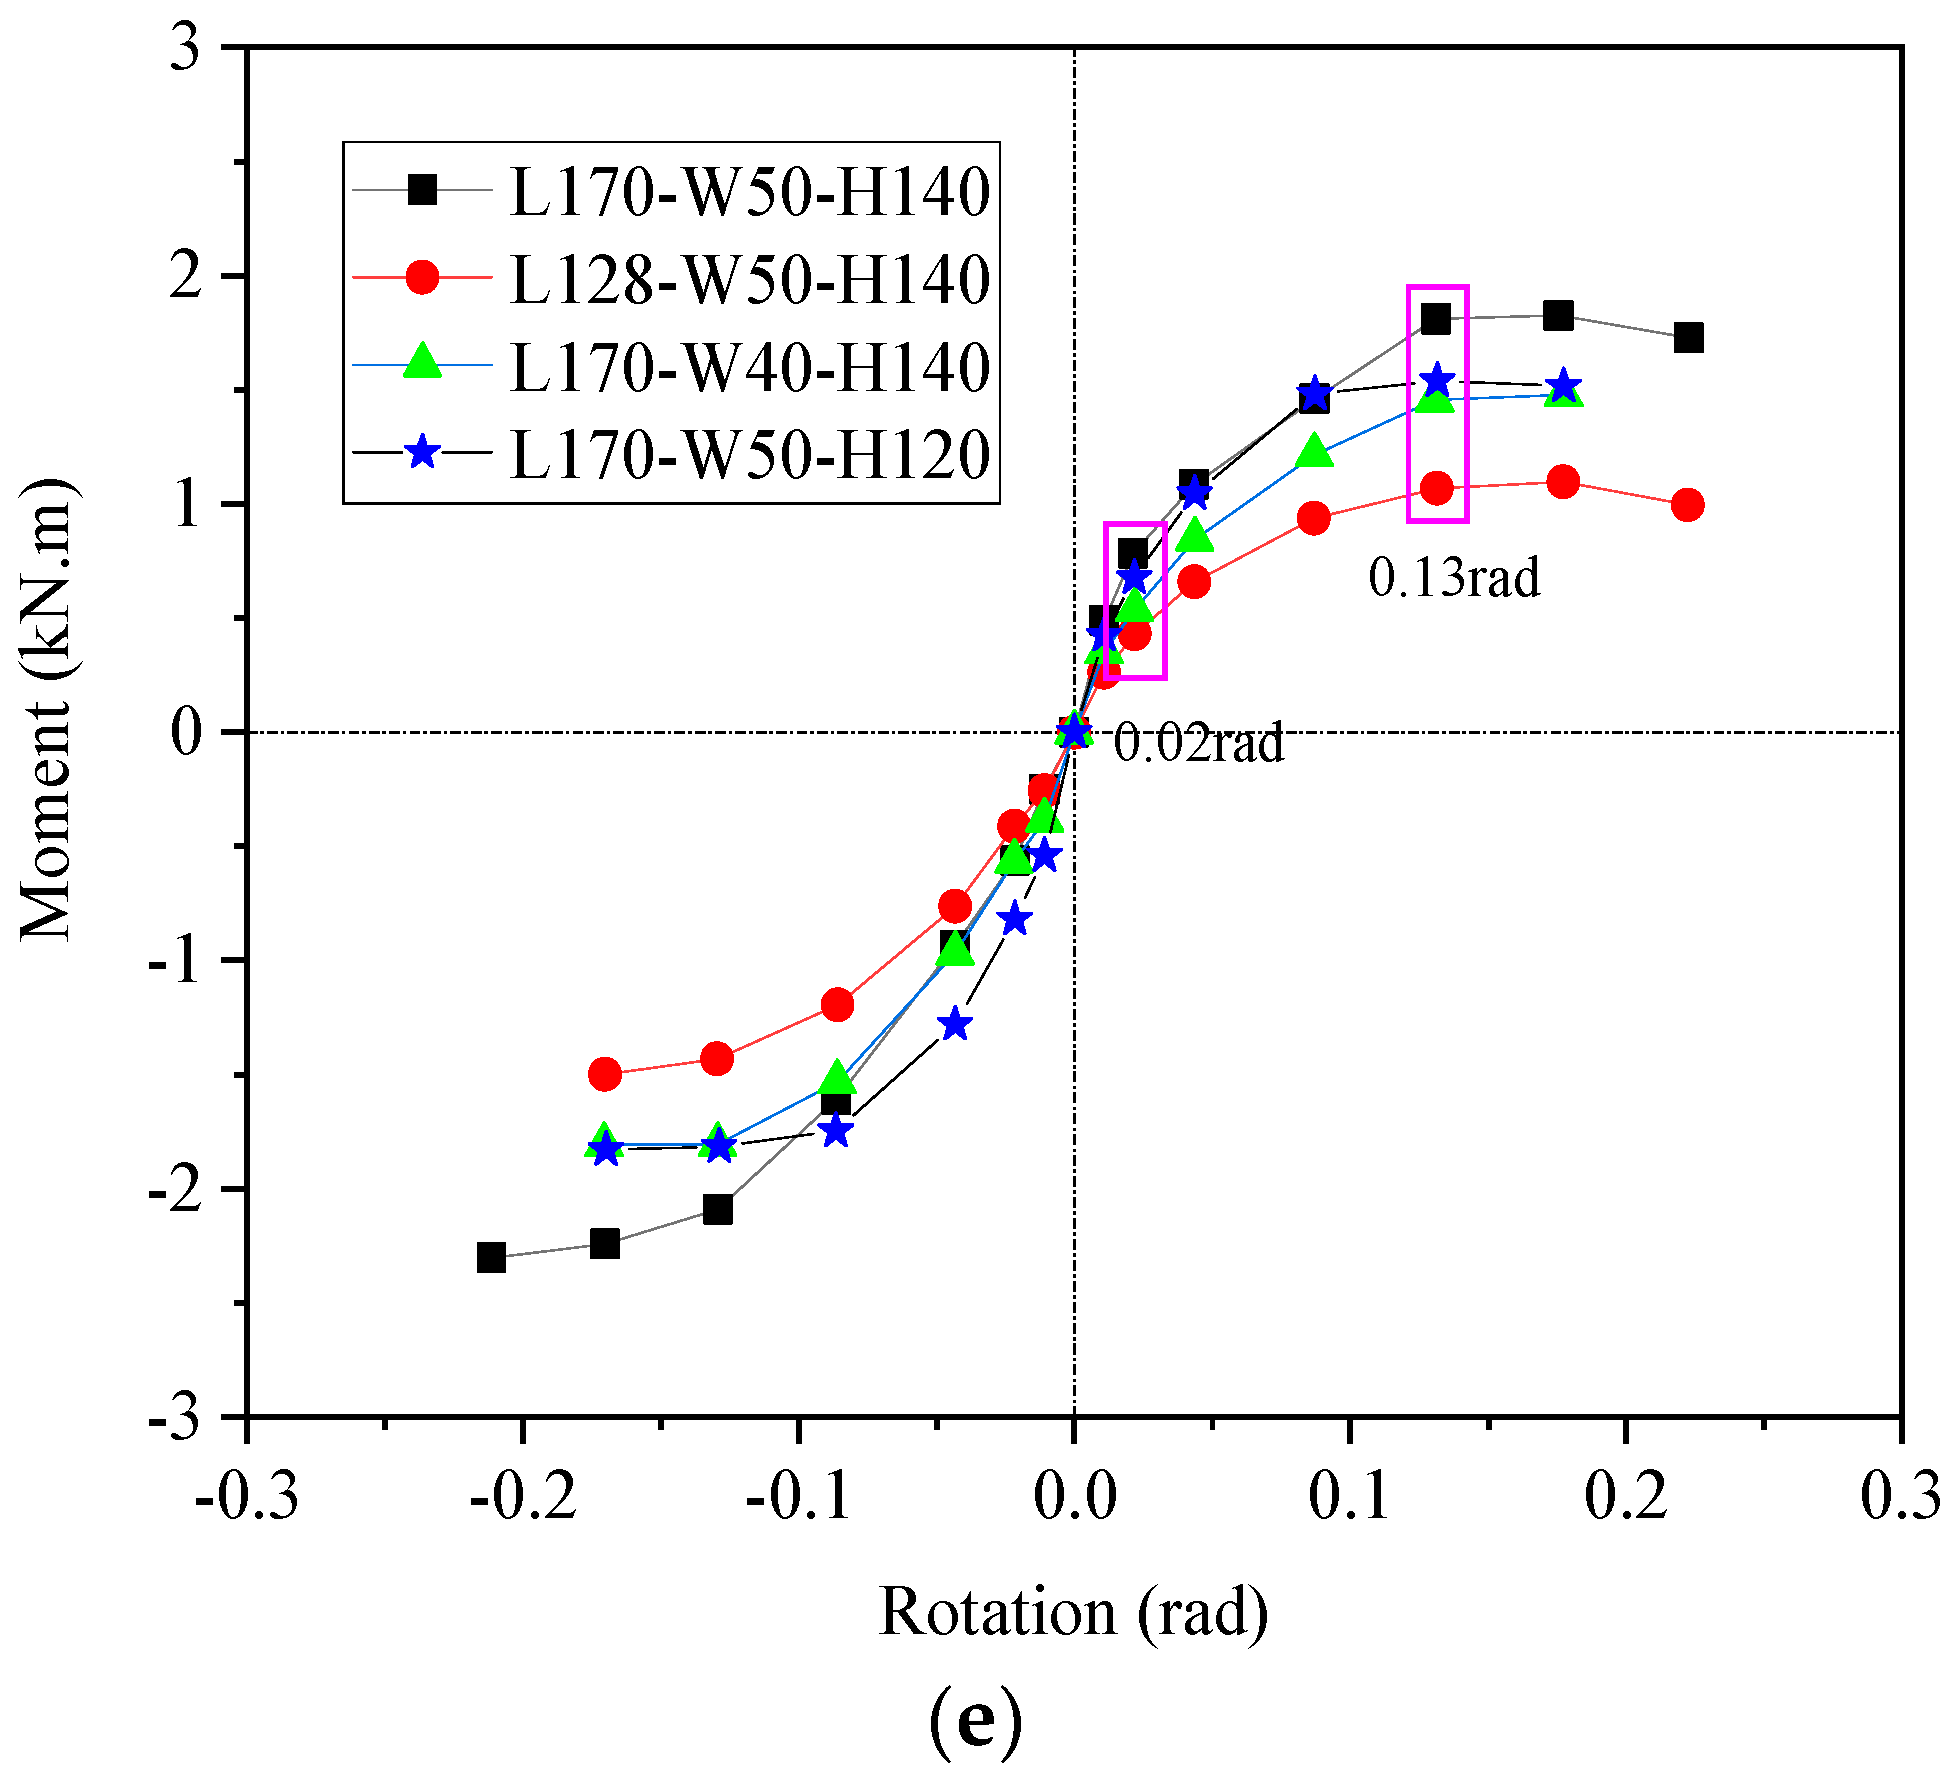
3.5. Skeleton Curves
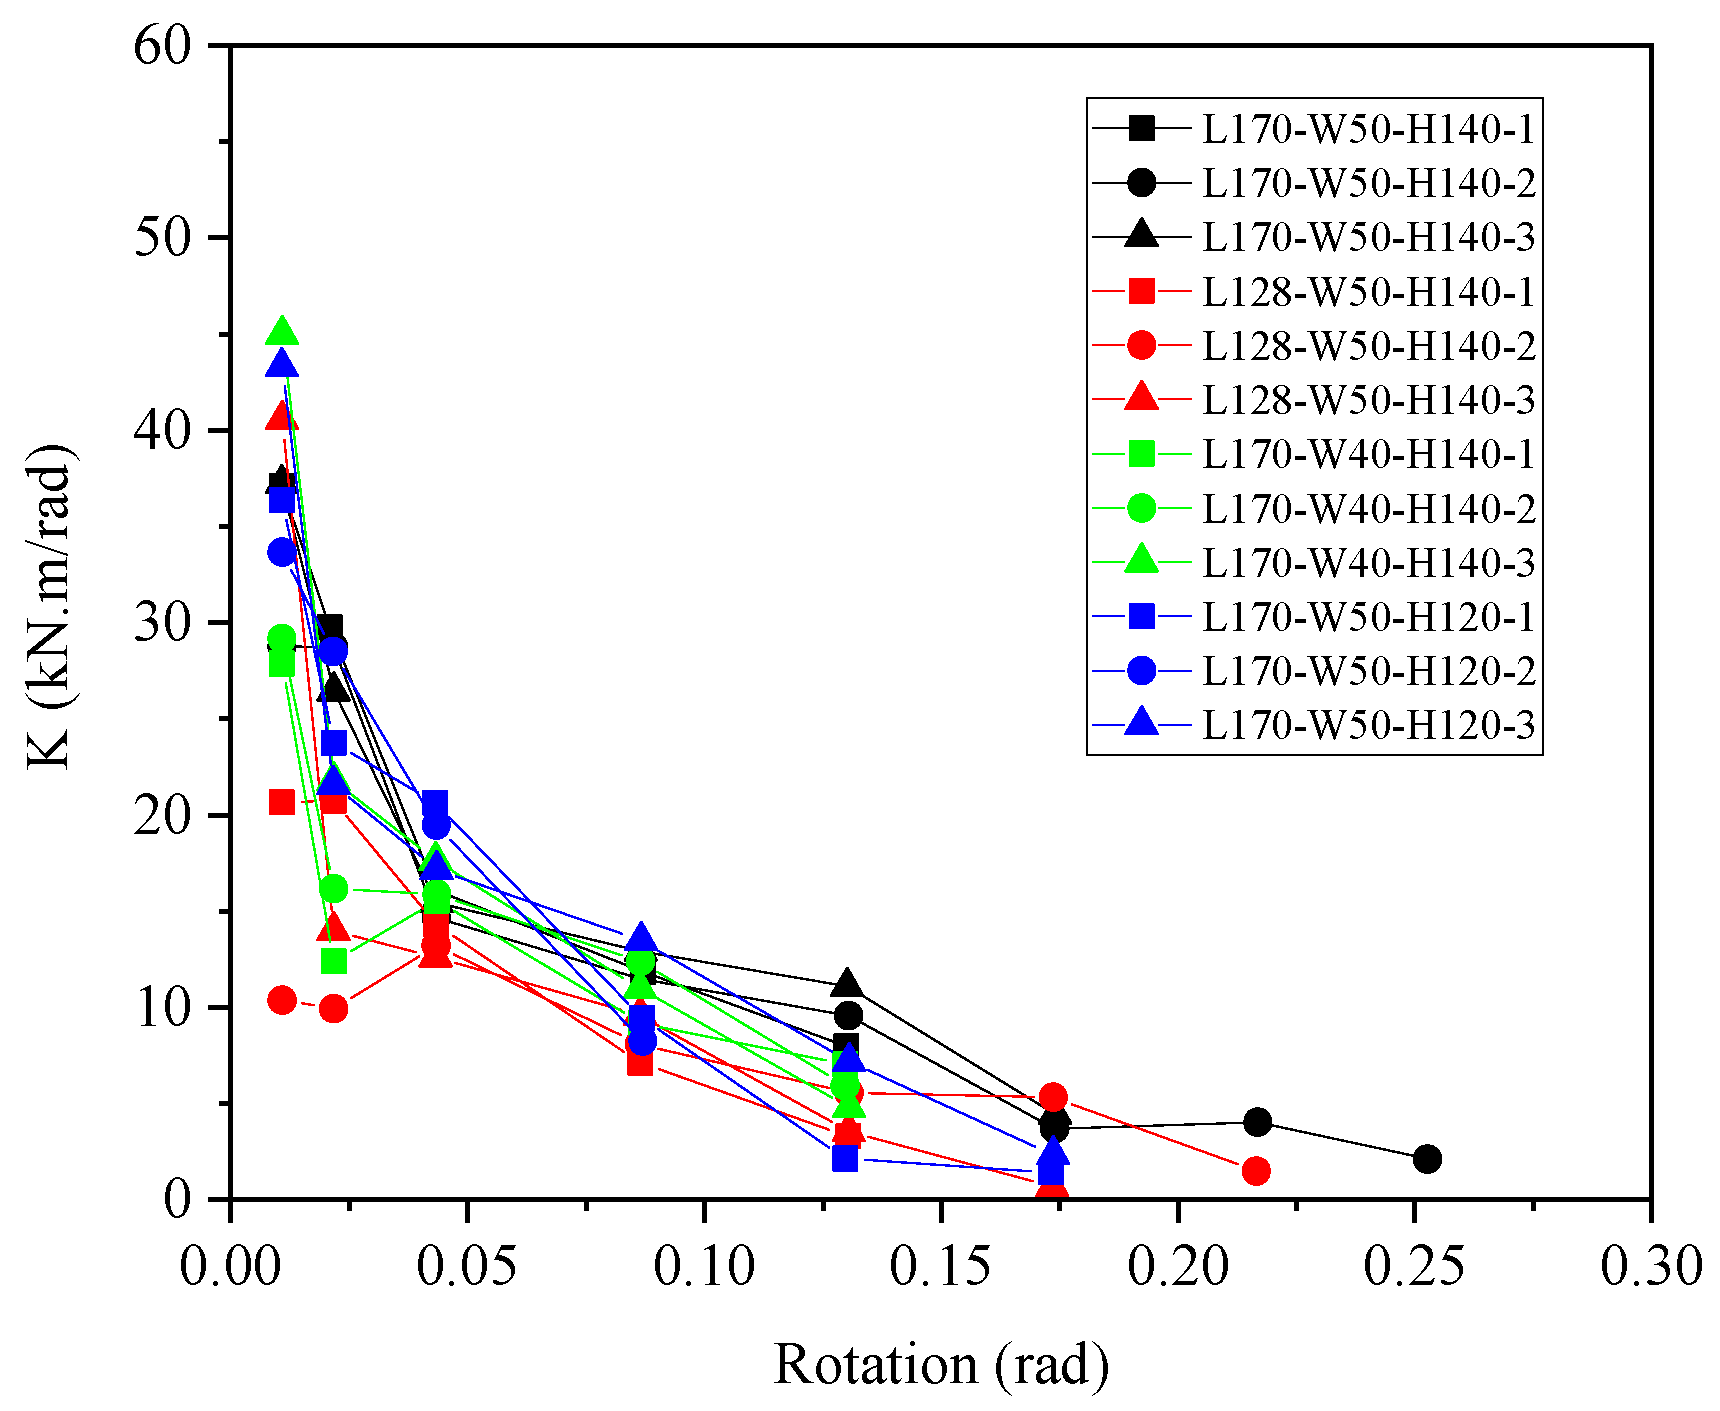
3.6. Stiffness Degradation
4. Theoretical Predictions
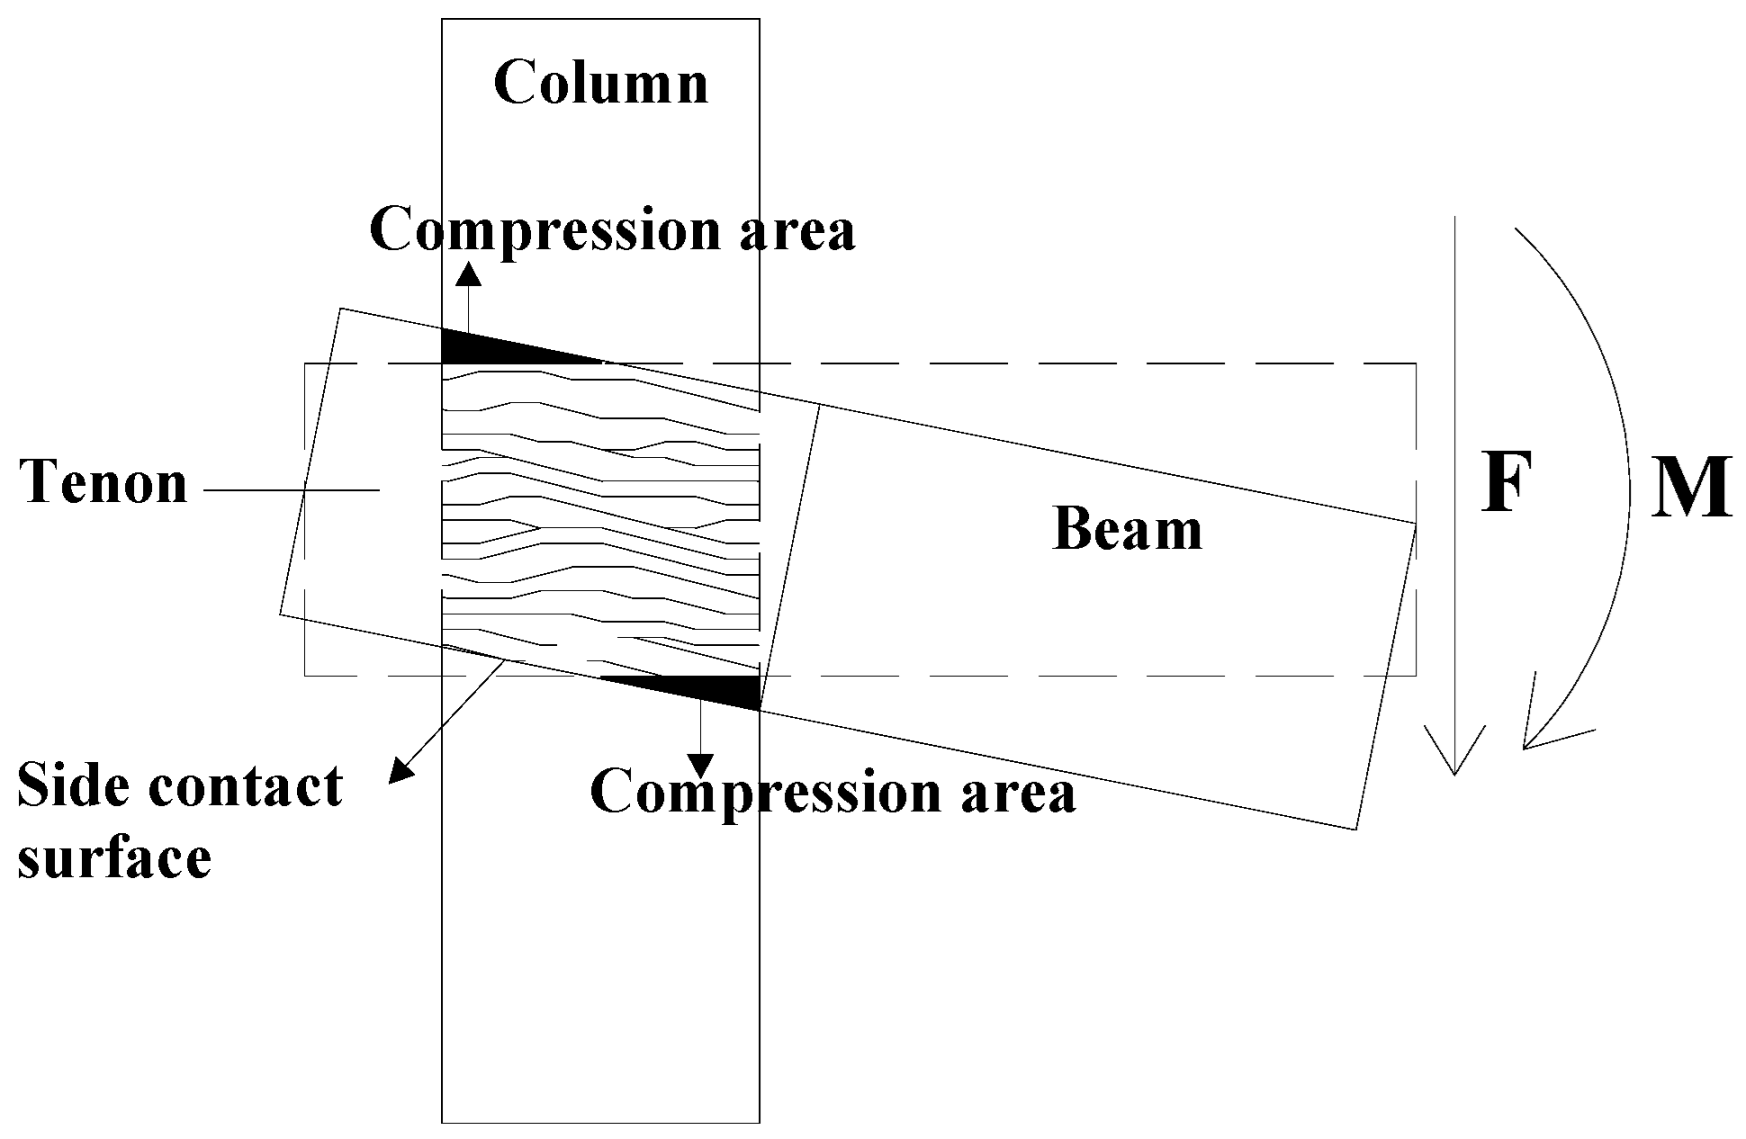
4.1. Basic Assumptions
- (1)
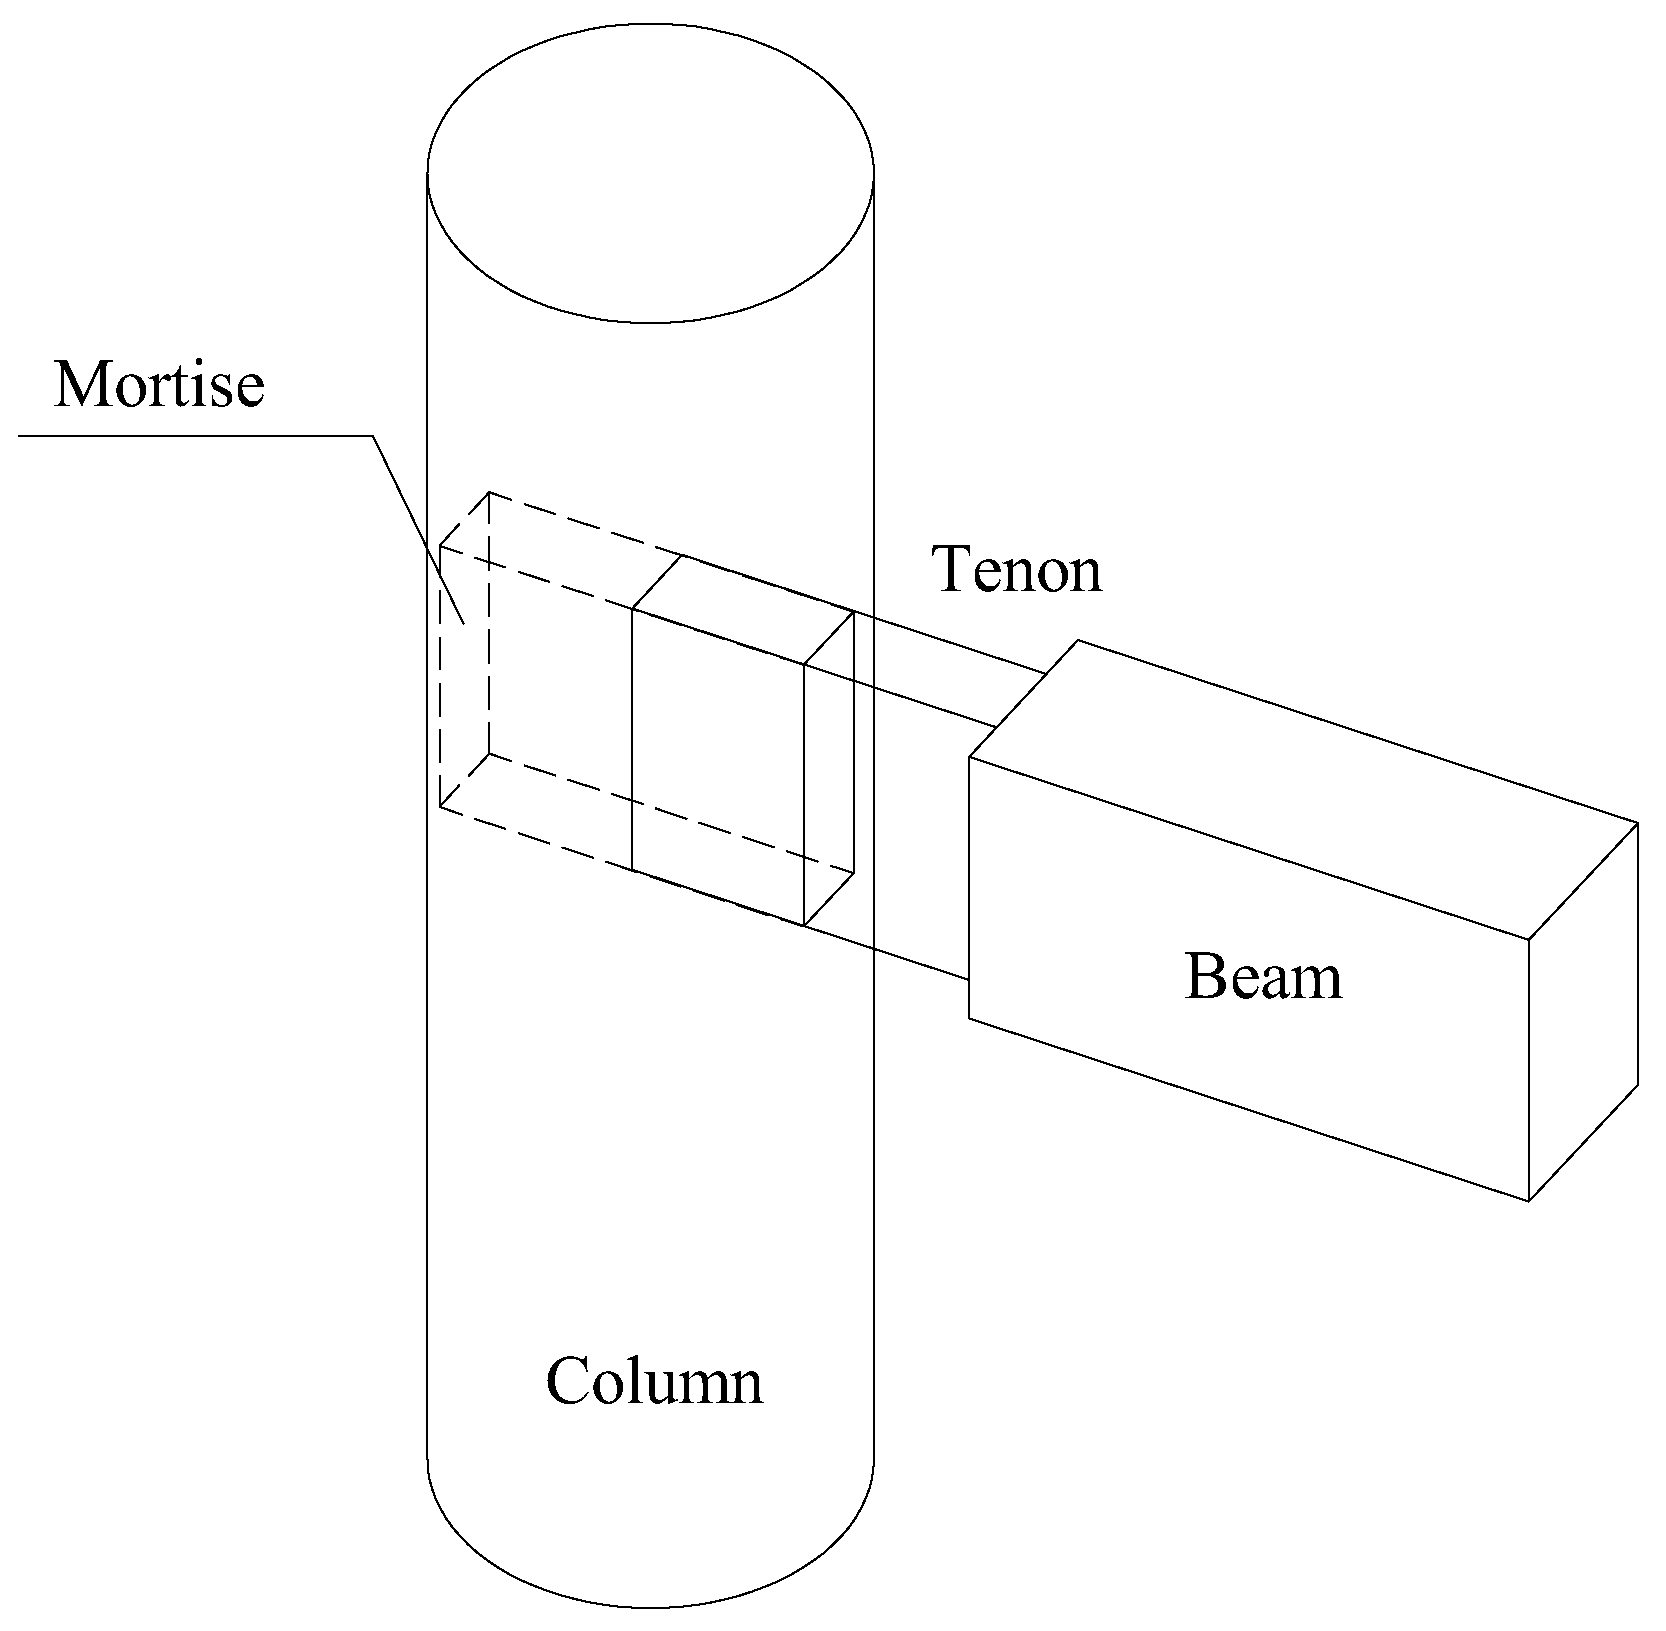
- The local extrusion deformation in the mortise was neglected. This is because the mortise is in compression parallel to the grain, so the local extrusion deformation is far less than that of the timber perpendicular to the grain.
- (2)
- The bi-linear local compression model proposed in this paper is used to simulate the mechanical behavior of wood in different compressive modes perpendicular to the grain.
- (3)
- The friction between the side surfaces of the mortise and the tenon was neglected.
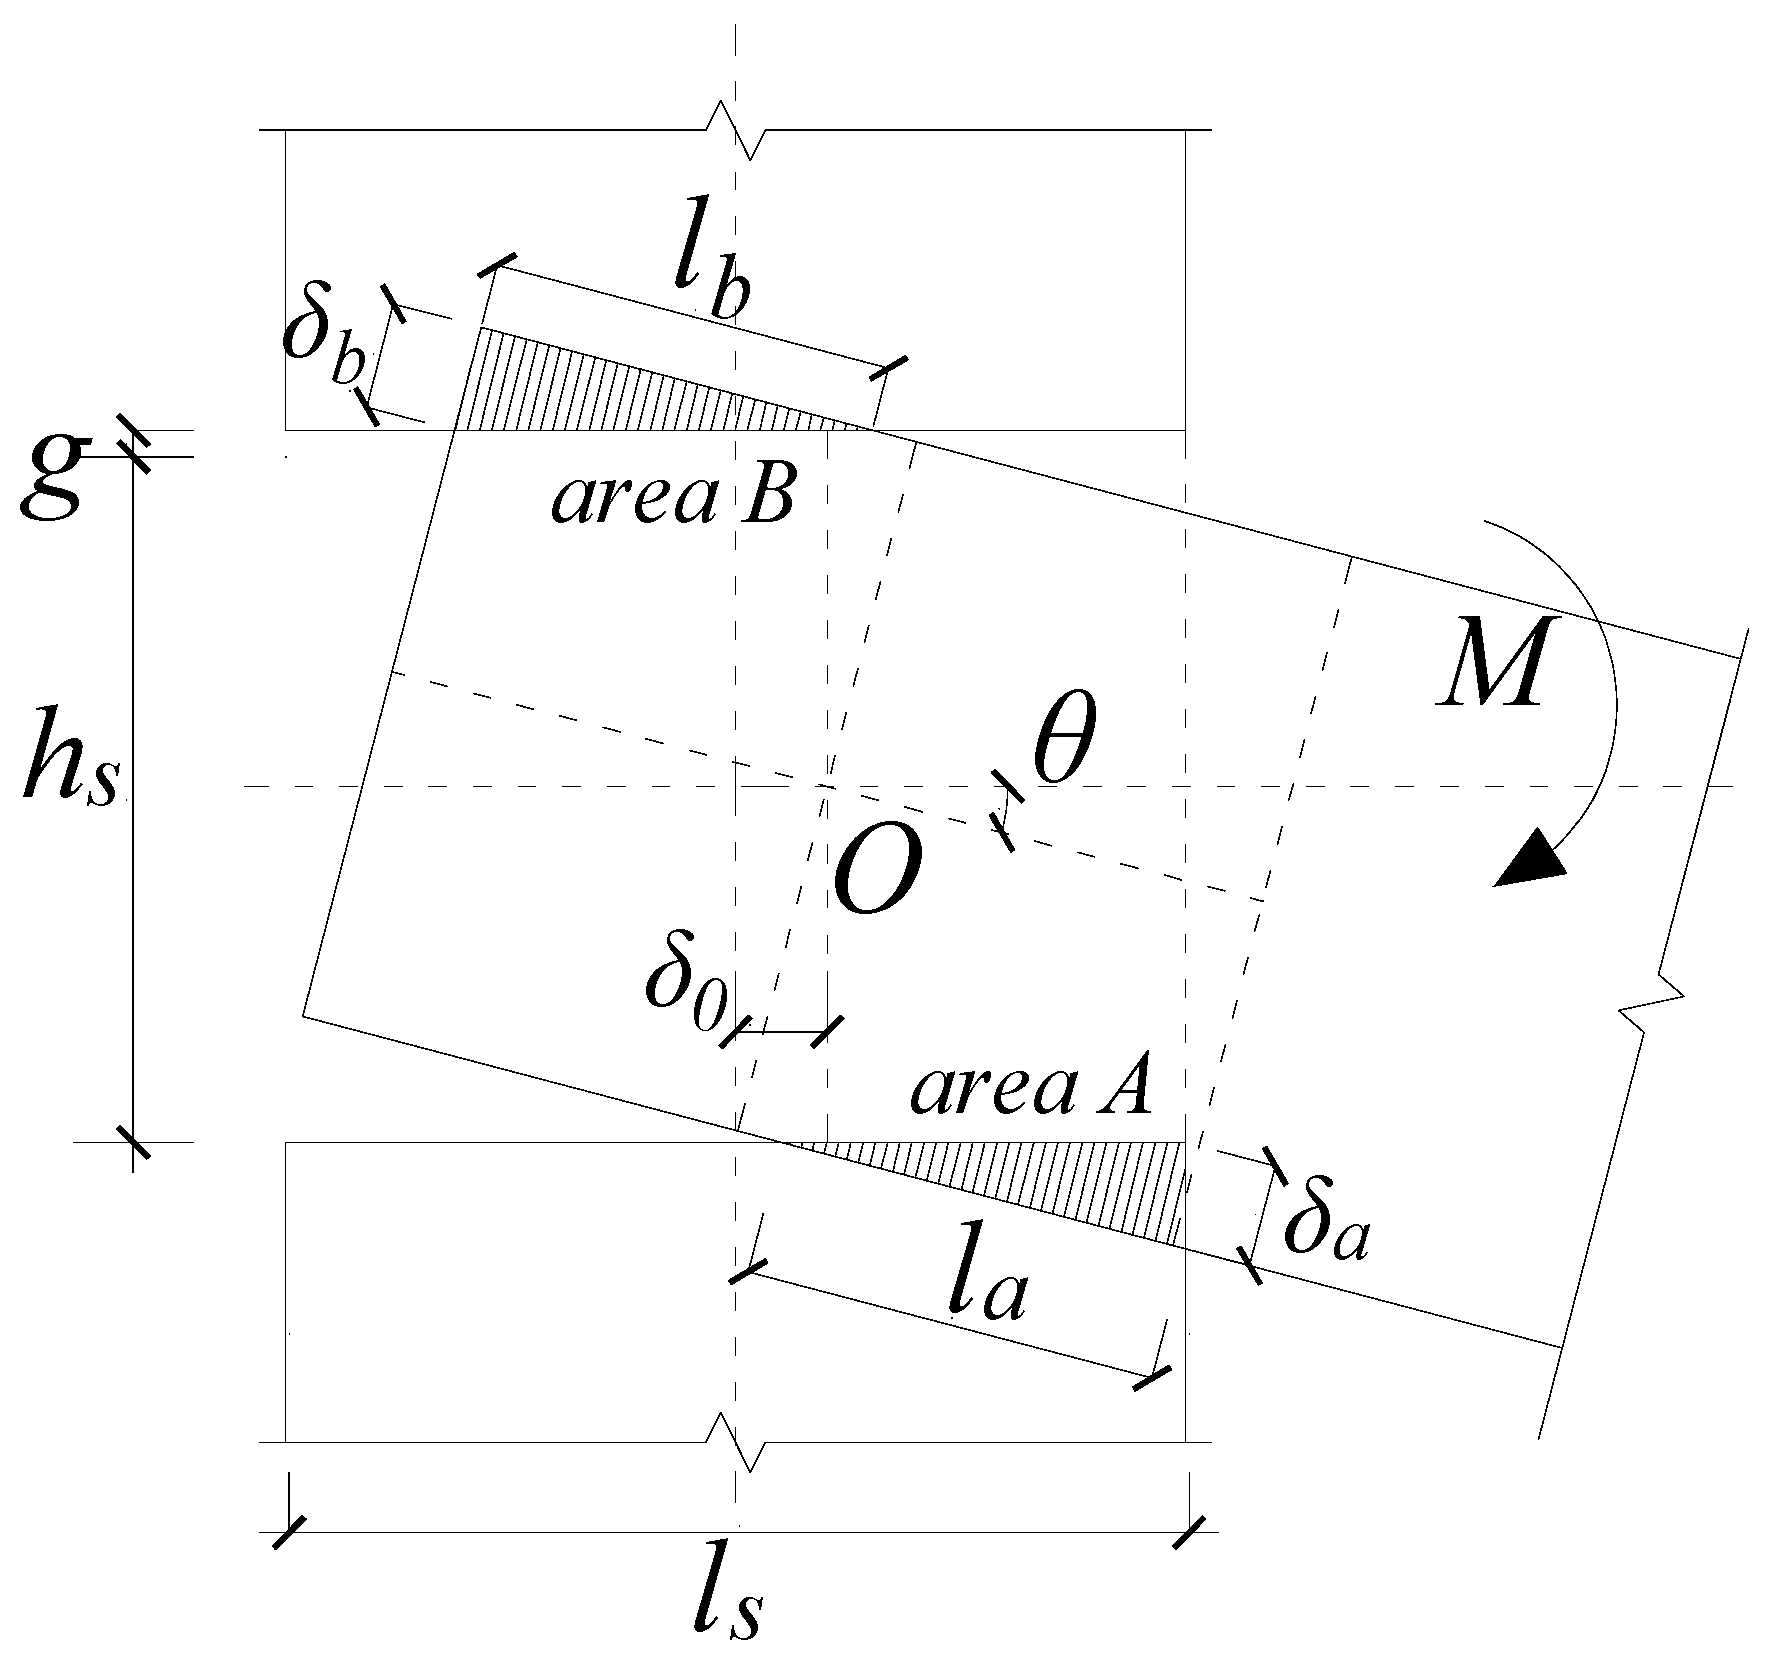
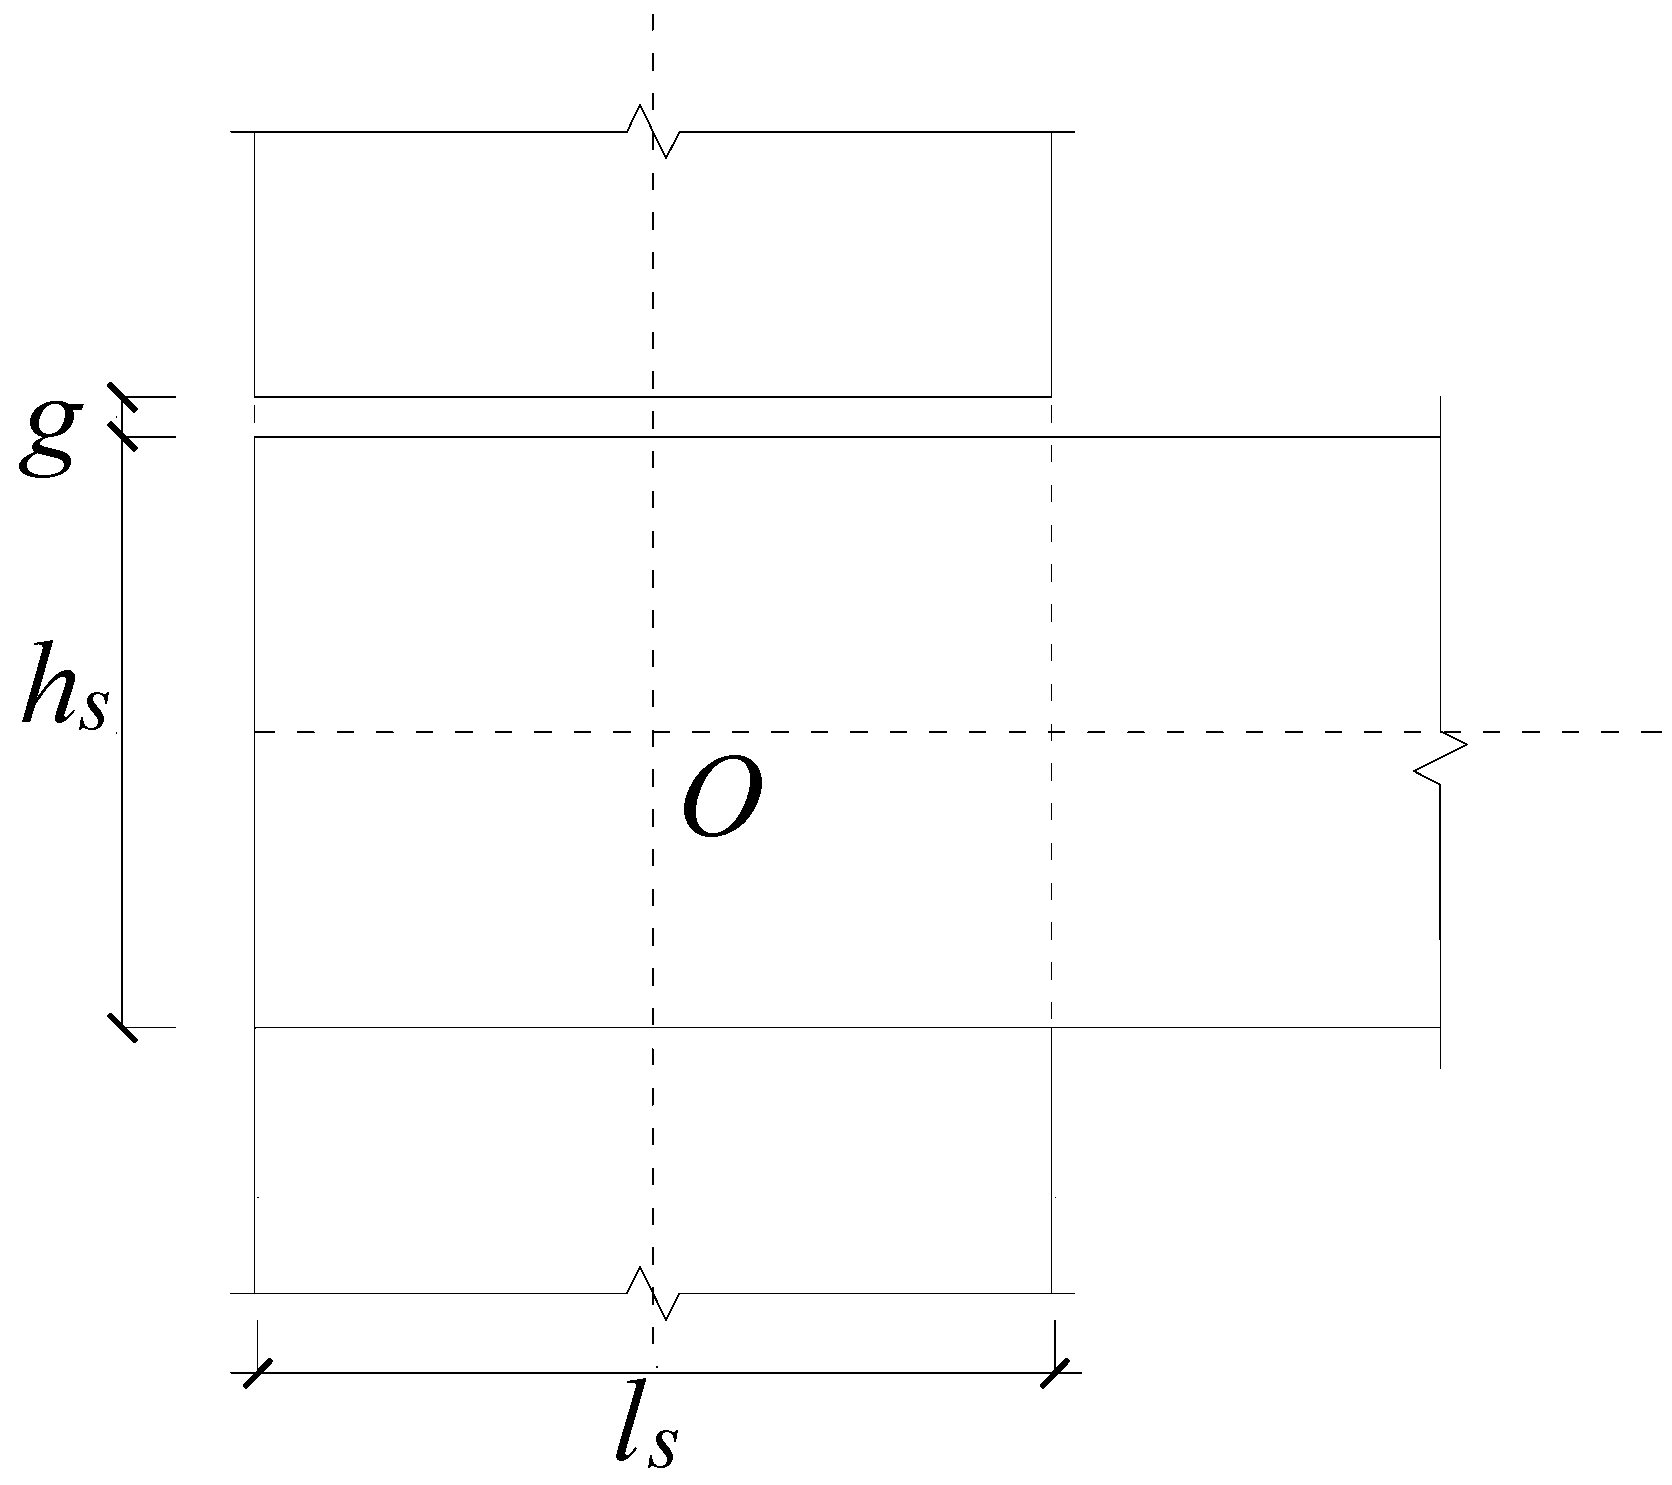
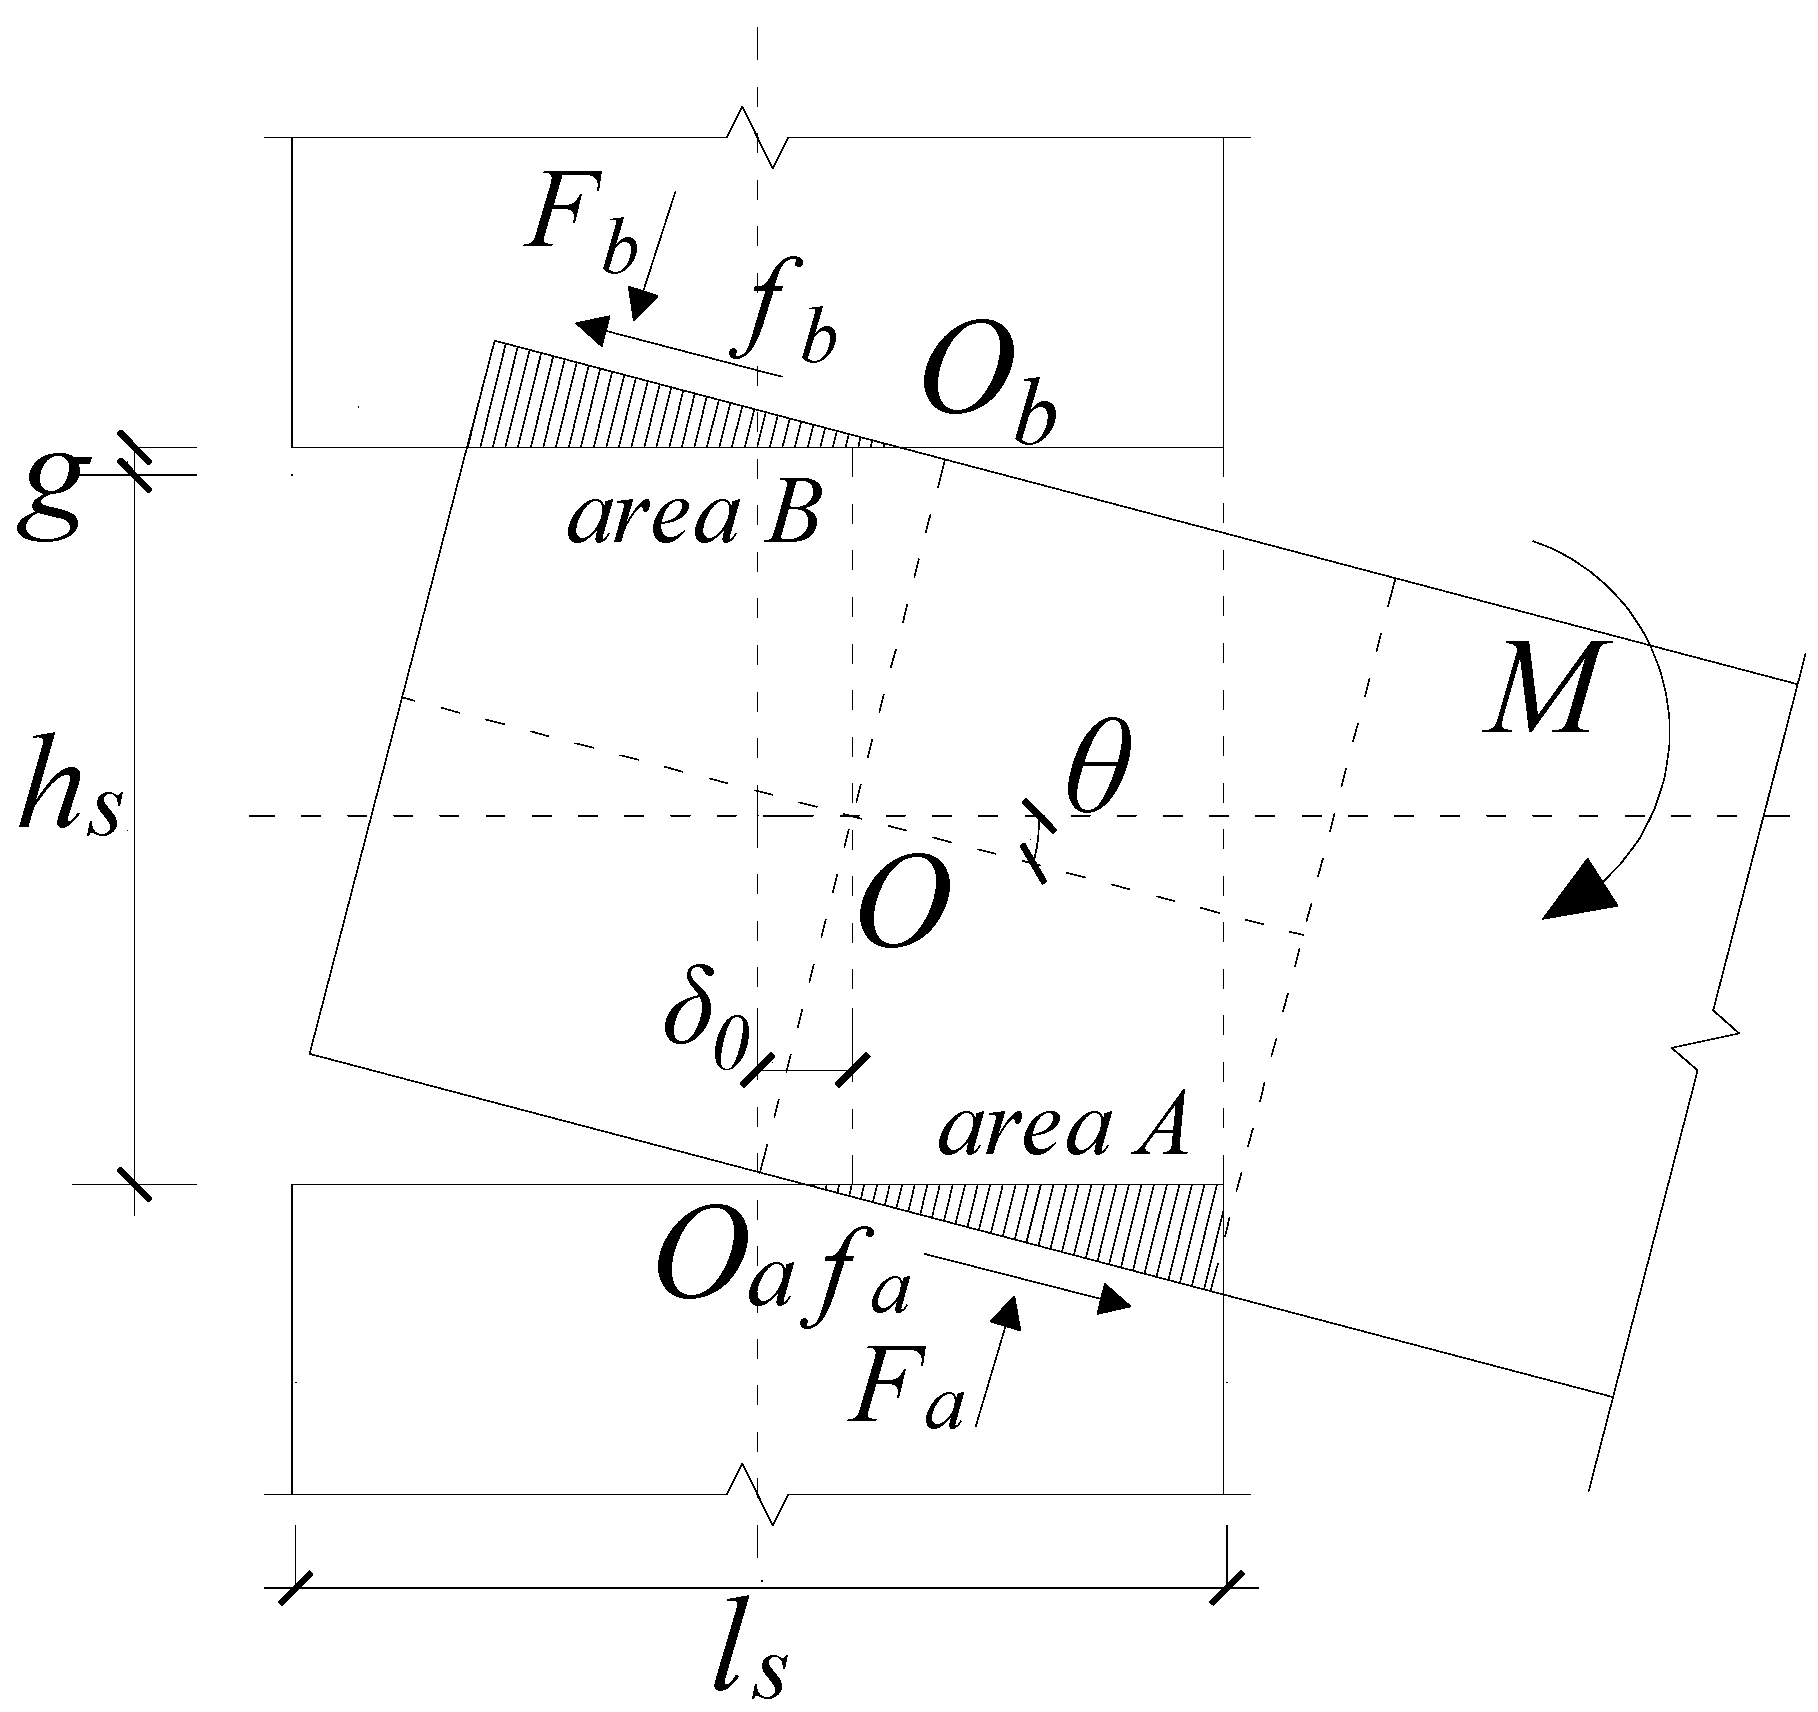
4.2. Geometrical and Physical Condition
4.3. Theoretical Derivations
4.3.1. Sliding Stage
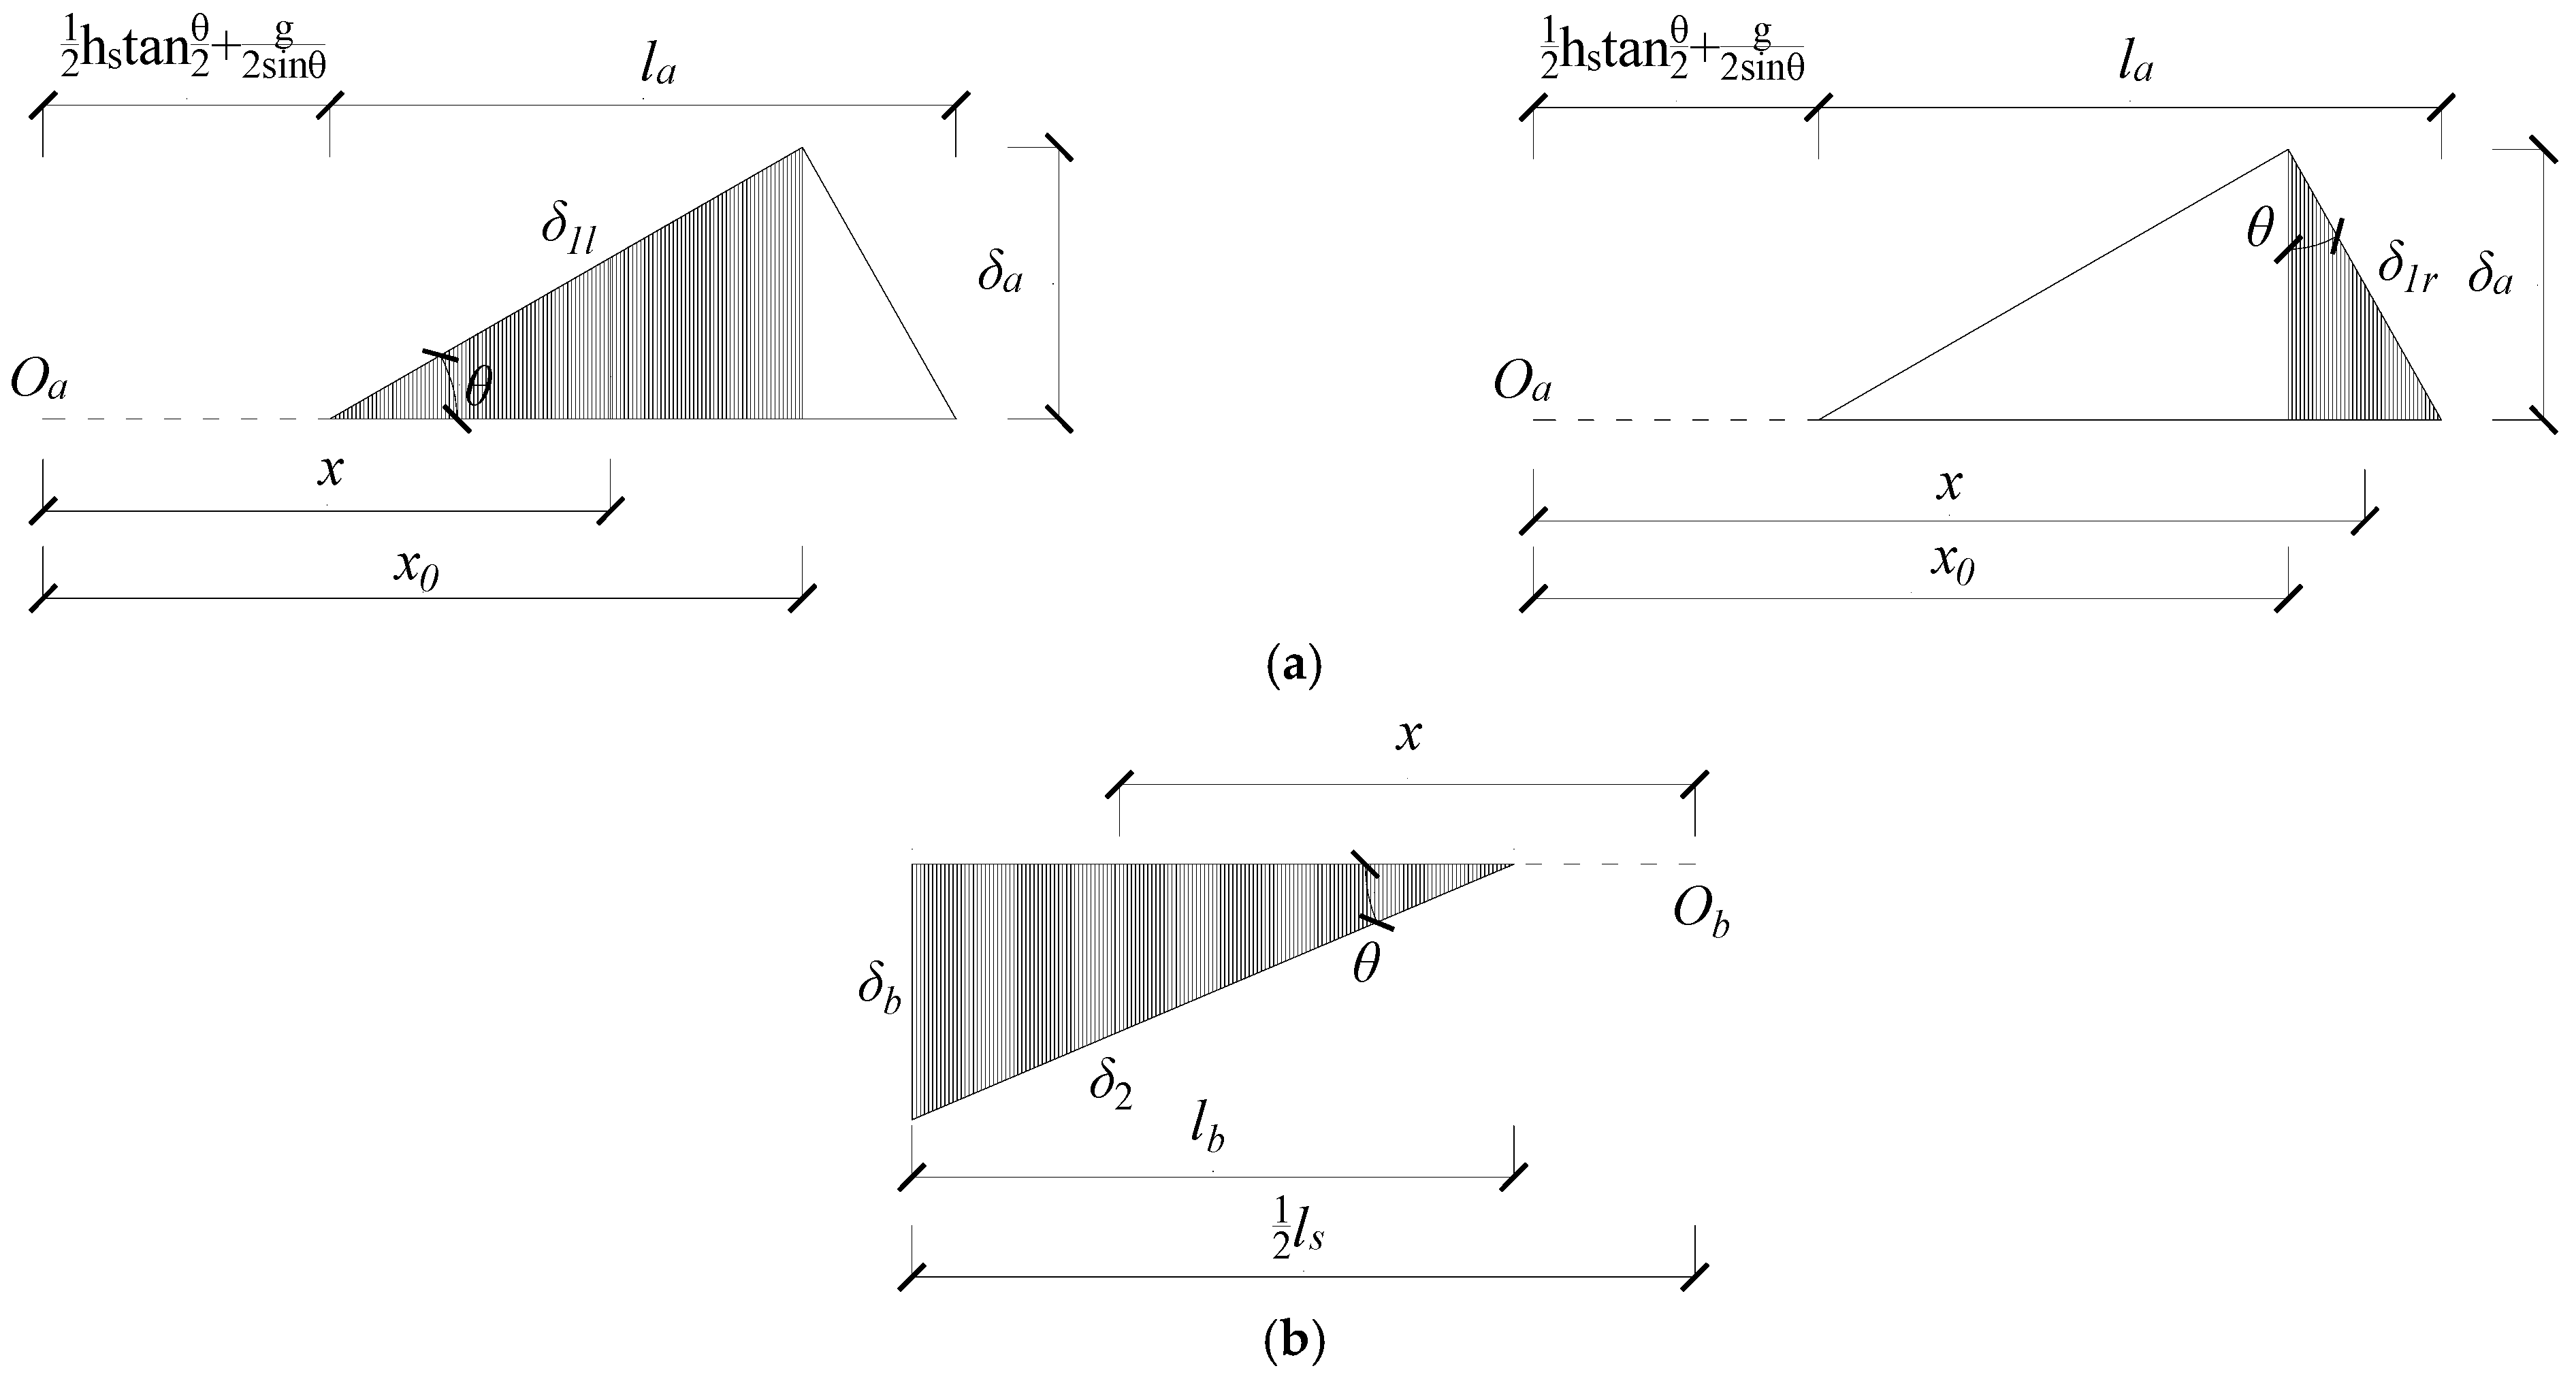
4.3.2. Elastic Stage
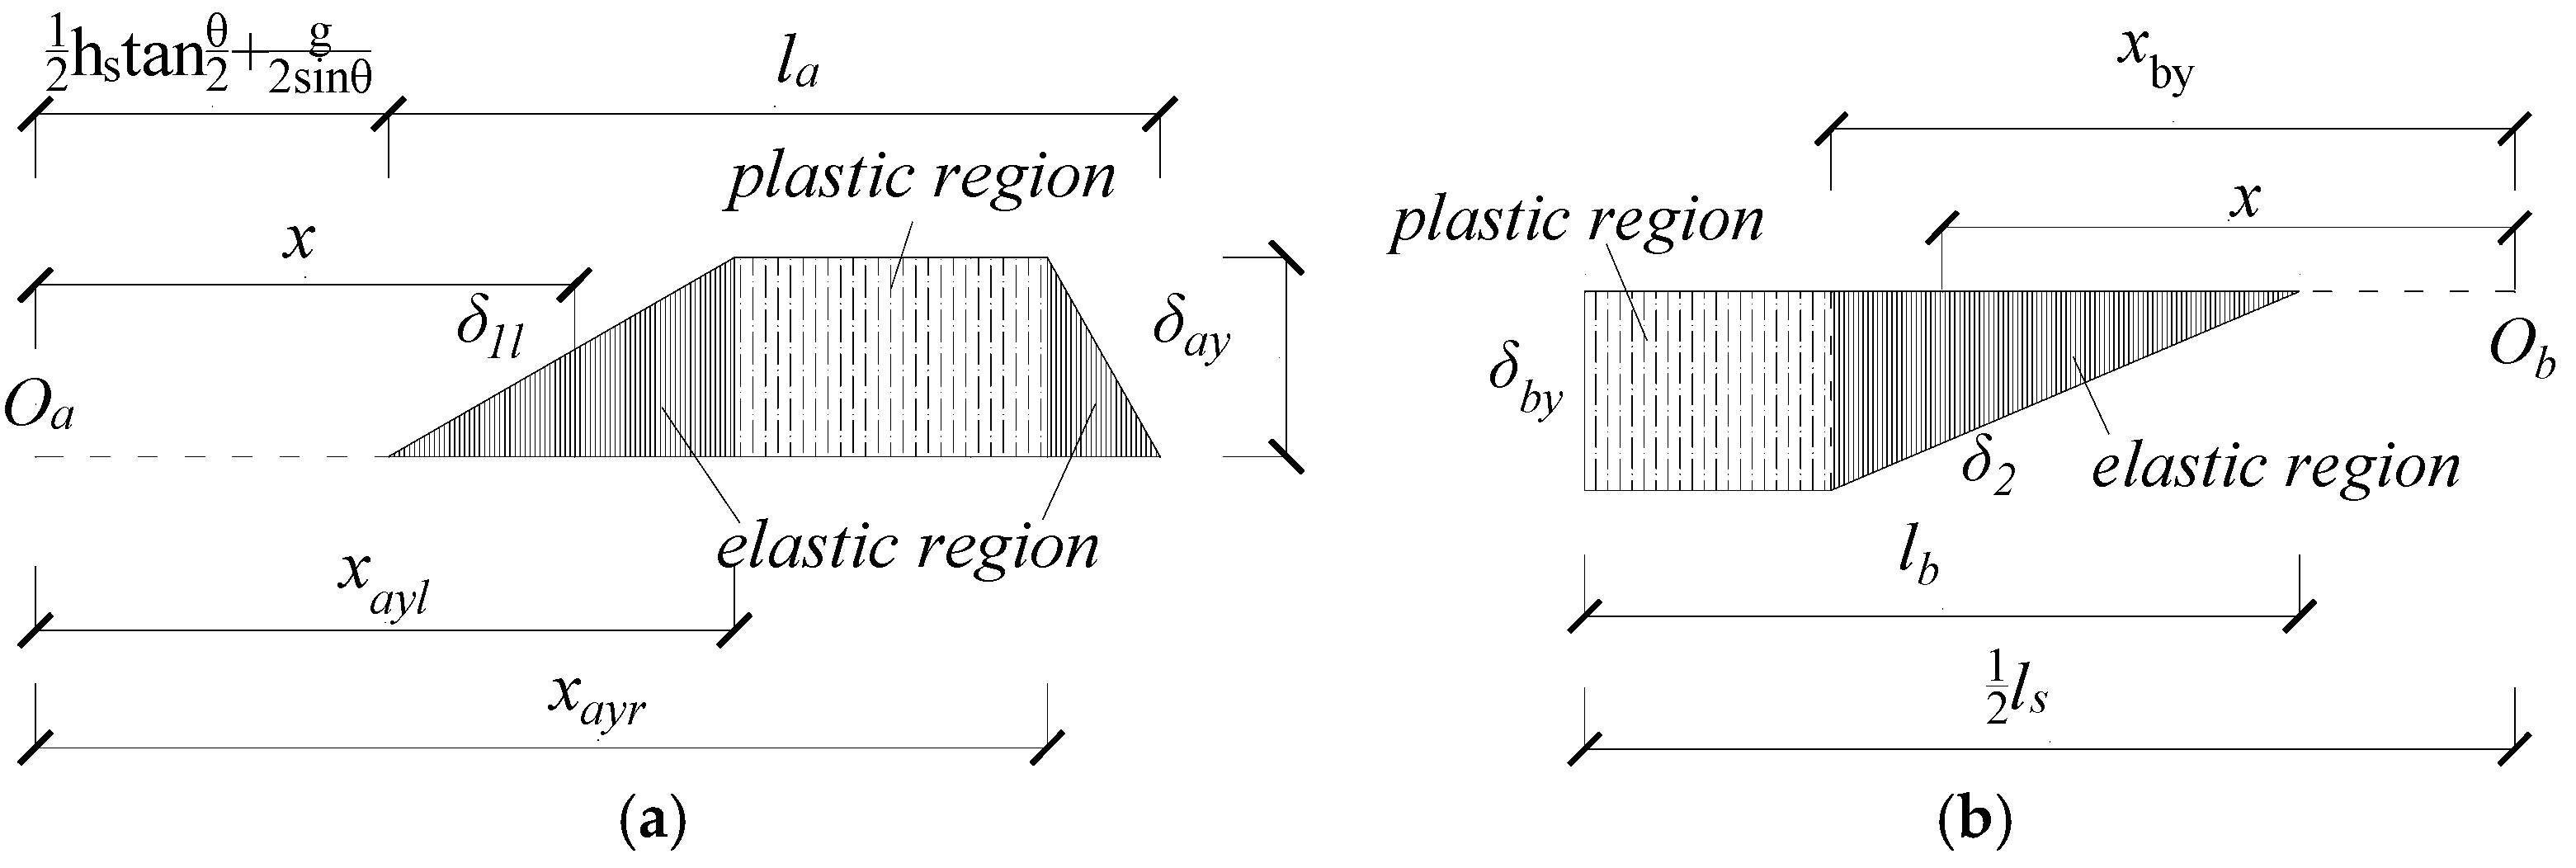
4.3.3. Plastic Stage
4.3.4. - Curve
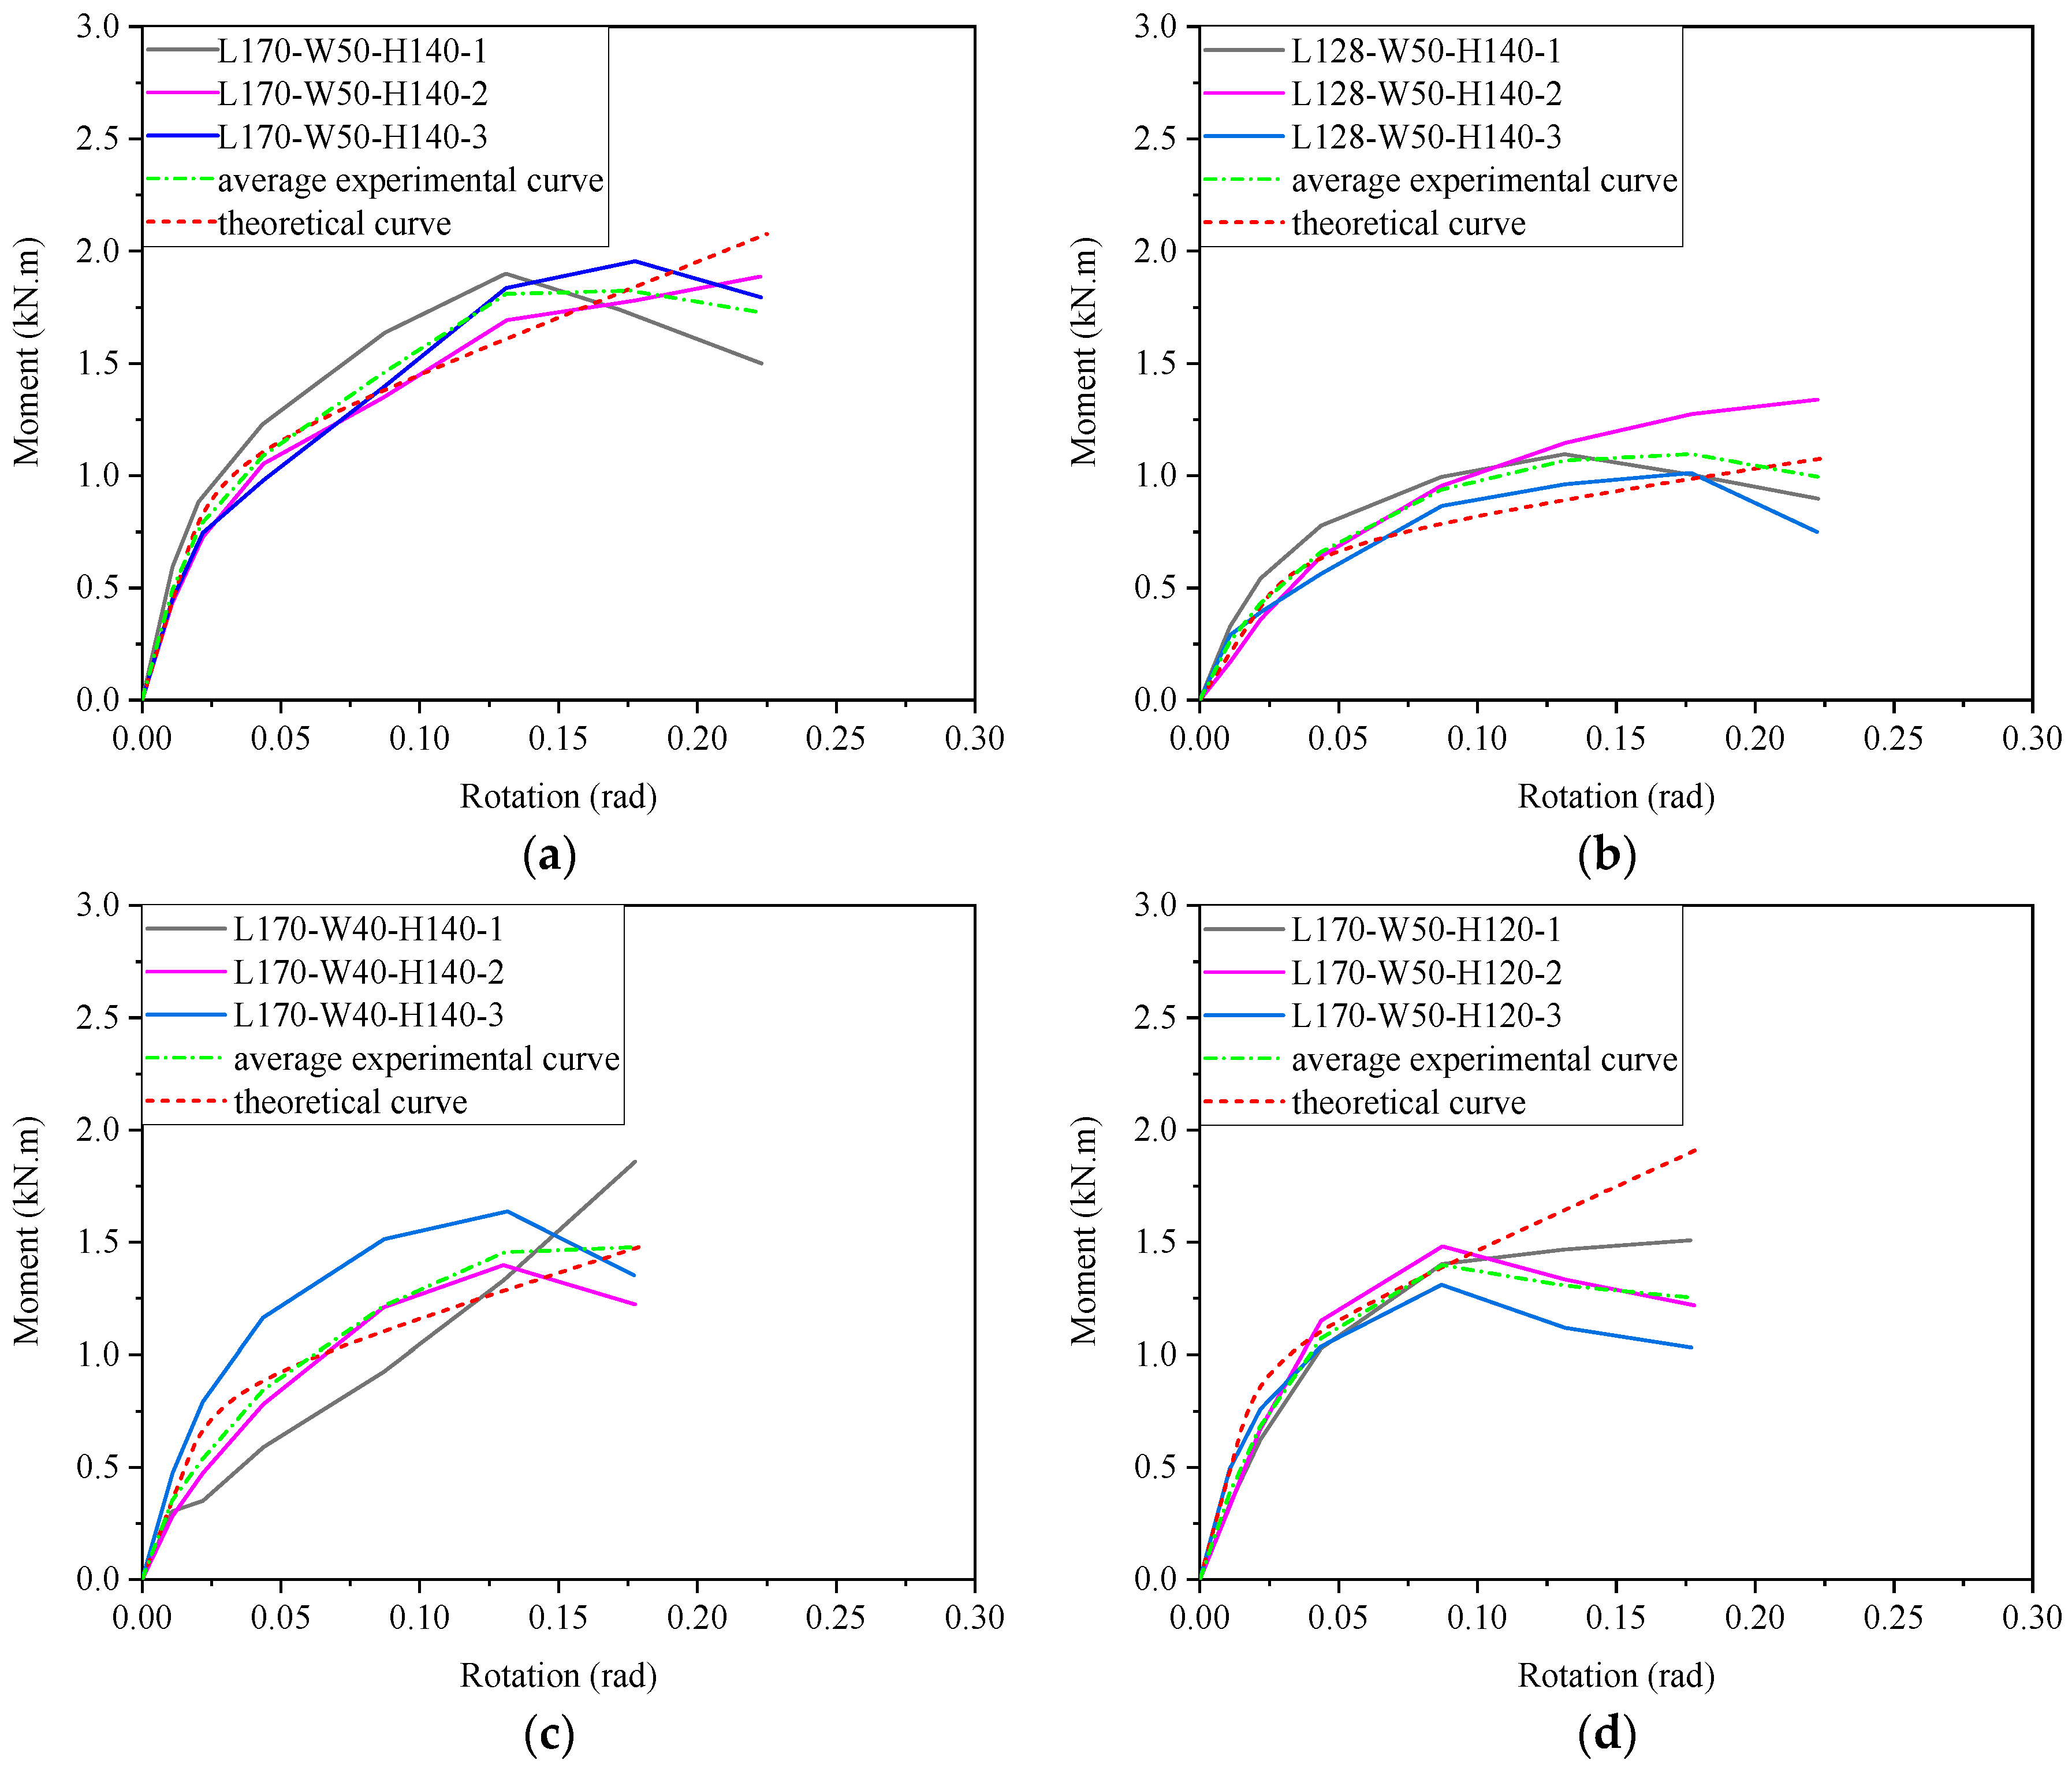
4.4. Validation of Theoretical Results
5. Conclusions
- (1)
- The results of the compression tests perpendicular to grain indicated that the yield stress, elastic modulus, and plastic modulus in local compression perpendicular to grain are greater than that in the end local compression and full compression perpendicular to grain. A most approximate area method was used to estimate the yield point of the strain-stress curve, which is good at estimating the theoretical yield point.
- (2)
- The cyclic loading tests showed that the mortise-tenon joints mainly failed by tenon pull-out, crush in local compression, splitting perpendicular to grain and breakage of the tenon. The hysteresis curves of the tested specimens generally exhibit a “Z” shape, which indicates a typical pinching effect. As a result, the moment and initial rotation stiffness of the joint both decrease with the reduction of the tenon length (L), width (W), and height (H). The parameter tenon length and width have a more significant influence on the mechanical behavior of the joints because the mechanical behavior is mainly determined by the compression area formed with tenon length and width.
- (3)
- A theoretical model based on physical and geometric parameters of the mortise-tenon joints was proposed to predict the mechanical behavior, considering middle local compression in the neck of the tenon and end local compression at the end of the tenon. By comparing the theoretical M-θ curves with the experimental M-θ curves, it was found that the theoretical model proposed is reasonable and feasible in predicting the elastic and plastic mechanical behavior of mortise-tenon joints but needs to be improved in predicting the failure mechanical behavior.
Author Contributions
Funding
Data Availability Statement
Conflicts of Interest
References
- Liang, S. Construction Technology of Chinese Ancient Timber Structures; Tsinghua University Press: Beijing, China, 2007. [Google Scholar]
- Ma, B. Construction Technology of Chinese Ancient Timber Structures; Science Press: Beijing, China, 2003. [Google Scholar]
- Chang, W.; Hsu, M.F.; Komatsu, K. Rotational performance of traditional Nuki joints with gap I: Theory and verification. J. Wood Sci. 2006, 52, 58–62. [Google Scholar] [CrossRef]
- Yue, Z. Traditional Chinese wood structure joints with an experiment considering regional differences. Int. J. Arch. Herit. 2014, 8, 224–246. [Google Scholar] [CrossRef]
- Feio, A.; Lourenço, P.; Machado, J. Testing and modeling of a traditional timber mortise and tenon joint. Mater. Struct. 2014, 47, 213–225. [Google Scholar] [CrossRef] [Green Version]
- Xie, Q.; Zhang, L.; Li, S.; Zhou, W.; Wang, L. Cyclic behavior of Chinese ancient wooden frame with mortise-tenon joints: Friction constitutive model and finite element modelling. J. Wood Sci. 2018, 64, 40–51. [Google Scholar] [CrossRef] [Green Version]
- Xie, Q.; Zhang, L.; Wang, L.; Zhou, W.; Zhou, T. Lateral performance of traditional Chinese timber frames: Experiments and analytical model. Eng. Struct. 2019, 186, 446–455. [Google Scholar] [CrossRef]
- Xie, Q.; Wang, L.; Zheng, P.; Zhang, L.; Hu, W. Rotational behavior of degraded traditional mortise-tenon joints: Experimental tests and hysteretic model. Int. J. Archit. Herit. 2018, 12, 125–136. [Google Scholar] [CrossRef]
- Guan, Z.; Kitamori, A.; Komatsu, K. Experimental study and finite element modelling of Japanese “Nuki” joints: Part one: Elastic stress states subjected to different wedge configurations. Eng. Struct. 2008, 30, 2032–2040. [Google Scholar] [CrossRef]
- Guan, Z.; Kitamori, A.; Komatsu, K. Experimental study and finite element modelling of Japanese “Nuki” joints: Part two: Racking resistance subjected to different wedge configurations. Eng. Struct. 2008, 30, 2032–2040. [Google Scholar] [CrossRef]
- Xu, M. Study of Aseismatic Behavior of Mortise-Tenon Joints in Chinese Ancient Timber Buildings. Ph.D. Thesis, Southeast University, Nanjing, China, 2011. [Google Scholar]
- Chen, L.K.; Li, S.C.; Zhao, K.P.; Chen, Z.Y.; Song, T.; Zhang, L.; Jang, Z.J. Experimental and numerical investigation on seismic performance of one-way straight mortise-tenon joints based on a novel method to simulate damage of deteriorated ancient Chinese timber buildings. J. Perform. Constr. Facil. 2020, 34, 04019119. [Google Scholar] [CrossRef]
- Panoutsopoulou, L.; Mouzakis, C. Experimental investigation of the behavior of traditional timber mortise-tenon T-joints under monotonic and cyclic loading. Constr. Build. Mater. 2022, 348, 128655. [Google Scholar] [CrossRef]
- Keita, O.; Yasutoshi, S.; Mariko, Y. Theoretical estimation of the mechanical performance of traditional mortise–tenon joint involving a gap. J. Wood Sci. 2016, 62, 242–250. [Google Scholar]
- Yang, Q.; Pan, Y.; Law, S. Load resisting mechanism of the mortise-tenon connection with gaps under in-plane forces and bending moments. Eng. Struct. 2020, 219, 110755. [Google Scholar] [CrossRef]
- Yang, Q.; Gao, C.; Wang, J.; Ren, K.; Yang, N. Probability distribution of gaps between tenon and mortise of traditional timber structures. Eur. J. Wood Wood Prod. 2020, 78, 27–39. [Google Scholar] [CrossRef]
- Ma, L.; Xue, J.; Dai, W.; Zhang, X.; Zhao, X. Bending moment-rotation relationship of mortise-tenon connections in historic timber structures. Constr. Build. Mater. 2020, 232, 117285. [Google Scholar] [CrossRef]
- Zhang, B.; Xie, Q.; Li, S.; Zhang, L.; Wu, Y. Effects of gaps on the rotational performance of traditional straight mortise-tenon joints. Eng. Struct. 2022, 260, 114231. [Google Scholar] [CrossRef]
- He, J.; Yu, P.; Wang, J.; Yang, Q.; Han, M.; Xie, L. Theoretical model of bending moment for the penetrated mortise-tenon joint involving gaps in traditional timber structure. J. Build. Eng. 2021, 42, 103102. [Google Scholar] [CrossRef]
- Inayama, M. Embedment Theory of Timber and Its Application. Ph.D. Thesis, The University of Tokyo, Tokyo, Japan, 1991. [Google Scholar]
- Leijten, A. A general bearing deformation model for timber Compression perpendicular to grain. Constr. Build. Mater. 2018, 165, 707–716. [Google Scholar] [CrossRef]
- Leijten, A.; Jorissen, A.; De Leijer, B. The local bearing capacity perpendicular to grain of structural timber elements. Constr. Build. Mater. 2012, 27, 54–59. [Google Scholar] [CrossRef] [Green Version]
- Moseng, M.; Hagle, D. The Capacity of Wood for Compression Perpendicular to the Grain; Institute for Matematiske Realfag og Teknologi NMBU: Oslo, Norway, 2012. [Google Scholar]
- GB/T 1927.13-2022; Test Methods for Physical and Mechanical Properties of Small Clear Wood Specimens—Part 13: Determination of the Modulus of Elastic in Compression Perpendicular to Grain. Standardization Administration of China Press: Beijing, China, 2022.
- GB/T 1927.11-2022; Test Methods for Physical and Mechanical Properties of Small Clear Wood Specimens—Part 11: Determination of Ultimate Stress in Compression Parallel to Grain. Standardization Administration of China Press: Beijing, China, 2022.
- GB/T 1927.14-2022; Test Methods for Physical and Mechanical Properties of Small Clear Wood Specimens—Part 14: Determination of Tensile Strength Parallel to Grain. Standardization Administration of China Press: Beijing, China, 2022.
- GB/T 1927.16-2022; Test Methods for Physical and Mechanical Properties of Small Clear Wood Specimens—Part 16: Methods of Testing in Shearing Strength Parallel to Grain of Wood. Standardization Administration of China Press: Beijing, China, 2022.
- B/T 50329-2012; Standard for Test Methods of Timber Structures. Standardization Administration of China Press: Beijing, China, 2012.
- Li, S.; Zhou, Z.; Luo, H.; Milani, G. Behavior of traditional Chinese mortise-tenon joints: Experimental and numerical insight for coupled vertical and reversed horizontal loads. J. Build. Eng. 2020, 30, 101257. [Google Scholar] [CrossRef]
- Ling, Z.; Xiang, Z.; Liu, W.; Yang, H.; Tang, J. Load-slip behaviour of glue laminated timber connections with glued-in steel rod parallel to grain. Constr. Build. Mater. 2019, 227, 117028. [Google Scholar] [CrossRef]
- Ling, Z.; Zhang, H.; Mu, Q.; Xiang, Z.; Zhang, L.; Zheng, W. Shear performance of assembled shear connectors for timber–concrete composite beams. Constr. Build. Mater. 2022, 329, 127158. [Google Scholar] [CrossRef]
- Feng, P.; Cheng, S.; Bai, Y.; Ye, L. Mechanical behavior of concrete-filled square steel tube with FRP-confined concrete core subjected to axial compression. Compos. Struct. 2015, 123, 312–324. [Google Scholar] [CrossRef]
- ISO 13061-5; Physical and Mechanical Properties of Wood—Test Methods for Small Clear Wood Specimens—Part 5: Determination of Strength in Compression Perpendicular to Grain. International Organization for Standardization: Geneva, Switzerland, 2020.
- BS EN 408; Timber Structures—Structural Timber and Glued Laminated Timber—Determination of Some Physical and Mechanical Propertie. British Standards Institution: London, UK, 2010.
- JGJ 159-2008; Code for Construction and Acceptance of Ancient Chinese Architecture Engineering. China Architecture and Building Press: Beijing, China, 2008.
- Liu, K. Experimental Study on Mechanical Characteristics of Mortise and Tenon Joints Considering the Local Compression. Master’s Thesis, Nanjing Tech University, Nanjing, China, 2016. [Google Scholar]
- Lu, W.; Xu, F.; Liu, K.; Zhang, K.; Liu, X.; Liu, W. Mechanical properties of mortise-tenon joints considering local compression effect. J. Build. Struct. 2019, 40, 37–44. (In Chinese) [Google Scholar]


| Properties | Values (MPa) |
|---|---|
| Elastic modules parallel to grain Ep | 6400 |
| Compressive strength parallel to grain fc | 35.3 |
| Tensile strength parallel to grain ft | 67.2 |
| Shear strength parallel to grain fv | 5.6 |
| Sample Group Code | Compression Pattern | Length/mm | Width/mm | Height/mm | Number of Replicates |
|---|---|---|---|---|---|
| JY-H | Middle local compression | 240 | 80 | 80 | 5 |
| DJY-H | End local compression | 240 | 80 | 80 | 5 |
| QY-H | Full compression | 120 | 80 | 80 | 5 |
| Group of Samples | Yie1d Stress σy (MPa) | Yield Strain εy | Elastic Modulus Perpendicular to Grain Eec (MPa) | Plastic Modulus Perpendicular to Grain Epc (MPa) |
|---|---|---|---|---|
| JY-H | 1.96 | 0.010 | 199.3 | 25.3 |
| DJY-H | 1.72 | 0.011 | 159.3 | 19.9 |
| QY-H | 1.48 | 0.010 | 146.0 | 12.8 |
| Specimen Code | Dimensions of the Tenon (mm) | Number of Replicates | ||
|---|---|---|---|---|
| L | W | H | ||
| L170-W50-H140 | 170 | 50 | 140 | 3 |
| L128-W50-H140 | 128 | 50 | 140 | 3 |
| L170-W40-H140 | 170 | 40 | 140 | 3 |
| L170-W50-H120 | 170 | 50 | 120 | 3 |
| Specimen | My (kN.m) | K (kN.m/rad) | ||||
|---|---|---|---|---|---|---|
| Avg. Exp. | Theo. | Dev. | Avg. Exp. | Theo. | Dev. | |
| L170-W50-H140 | 0.78 | 0.83 | 6.41% | 36.83 | 37.91 | 2.94% |
| L128-W50-H140 | 0.43 | 0.42 | −2.33% | 19.74 | 18.98 | −3.85% |
| L170-W40-H140 | 0.63 | 0.66 | 4.76% | 28.97 | 30.33 | 4.71% |
| L170-W50-H120 | 0.70 | 0.82 | 17.14% | 33.33 | 39.00 | 17.01% |
Disclaimer/Publisher’s Note: The statements, opinions and data contained in all publications are solely those of the individual author(s) and contributor(s) and not of MDPI and/or the editor(s). MDPI and/or the editor(s) disclaim responsibility for any injury to people or property resulting from any ideas, methods, instructions or products referred to in the content. |
© 2023 by the authors. Licensee MDPI, Basel, Switzerland. This article is an open access article distributed under the terms and conditions of the Creative Commons Attribution (CC BY) license (https://creativecommons.org/licenses/by/4.0/).
Share and Cite
Liu, X.; Lu, W.; Liu, K.; Xu, F.; Ling, Z.; Yue, K. Experimental and Theoretical Investigation of Rotational Behavior of Straight Mortise-Tenon Joints Considering Local Compression Perpendicular to Grain. Buildings 2023, 13, 1839. https://doi.org/10.3390/buildings13071839
Liu X, Lu W, Liu K, Xu F, Ling Z, Yue K. Experimental and Theoretical Investigation of Rotational Behavior of Straight Mortise-Tenon Joints Considering Local Compression Perpendicular to Grain. Buildings. 2023; 13(7):1839. https://doi.org/10.3390/buildings13071839
Chicago/Turabian StyleLiu, Xingxing, Weidong Lu, Kaifeng Liu, Fengyan Xu, Zhibin Ling, and Kong Yue. 2023. "Experimental and Theoretical Investigation of Rotational Behavior of Straight Mortise-Tenon Joints Considering Local Compression Perpendicular to Grain" Buildings 13, no. 7: 1839. https://doi.org/10.3390/buildings13071839