Article

Evaluation of Urban Resilience Based on Trio Spaces: An Empirical Study in Northeast China

1
School of Civil Engineering, Harbin Institute of Technology, Harbin 150090, China
2
Key Lab of Structures Dynamic Behavior and Control of the Ministry of Education, Harbin Institute of Technology, Harbin 150090, China
3
Key Lab of Smart Prevention and Mitigation of Civil Engineering Disasters of the Ministry of Industry and Information Technology, Harbin Institute of Technology, Harbin 150090, China
*
Author to whom correspondence should be addressed.
Buildings 2023, 13(7), 1695; https://doi.org/10.3390/buildings13071695
Submission received: 30 May 2023 / Revised: 28 June 2023 / Accepted: 28 June 2023 / Published: 2 July 2023
(This article belongs to the Special Issue New Trends in the Built Environment and Urban Development)

Abstract

:
Realizing the building of urban resilience and improving urban resilience has become important contents of urban development. In view of this phenomenon, relying on the framework of trio spaces, which includes physical space, societal space, and cyberspace, the evaluation index system of urban resilience is established. The evaluation model of urban resilience is constructed by using CRITIC-entropy weight and the cloud evaluation method. Four sub-provincial cities in Northeast China, Harbin, Changchun, Shenyang, and Dalian, are selected as the analysis objects, and the resilience of each city is comprehensively evaluated and spatially evaluated. From the urban resilience comprehensive evaluation, this paper found the cities with the highest resilience levels in 2014, from 2015 to 2018, and from 2019 to 2020 are Dalian, Changchun, and Shenyang, respectively. The city with the lowest resilience level is Harbin. Although there are differences in resilience evaluation values of four cities, the resilience levels of these cities are all “qualified”. From the urban resilience sub-space evaluation, this paper explored the shortcomings of the resilience of physical space, societal space, and cyberspace of each city through the comparison. Then, some suggestions about highlighting the enhancement of cyberspace resilience, emphasizing resilience-building balance, conducting resilience evaluation, and monitoring regularly, and local government policy support are proposed to help to promote urban resilience from the concept of trio spaces.

1. Introduction

The urbanization rate of the resident population in mainland China has reached 65.22% in 2022 [1]. Although population migration to cities can provide sufficient manpower, expand the urban scale, and prosper the urban economy, cities are required to develop rapidly and sustainably to adapt to the influx of a large number of people and the rapidly increasing urbanization rate [2]. However, rapid urban development may not mean high-quality urban development, and even various potential crises in the process of rapid urban development may be encountered [3,4]. These crises do not only come from natural disasters, such as the extremely heavy rainstorms and the catastrophic hurricane events [5,6] but also come from man-made disasters, such as accidental disasters, public health events, and terrorist attacks [7,8,9]. The occurrence of these crises can disrupt the orderly operation of urban systems and, in severe cases, even destroy systems. Therefore, the idea of building “resilient” cities has emerged [10].
Resilience refers to the ability of a system to absorb and resist disturbances and maintain or restore the original system in the presence of external disturbances [11]. From this concept, it is clear that resilience is a measurable ability. If this ability is stronger, the more it can absorb and resist external disturbance and maintain or repair the original system. If the external disturbance exceeds the upper limit of the ability, it will destroy the system. Therefore, the greater the resilience is, the greater the system’s resistance to interference, and the more stable the system will be [12]. It means that “resilient” cities have a better ability to maintain system stability or rapid recovery. Therefore, academics have begun to explore how to promote “urban resilience” [13]. Urban resilience represents the ability of cities to resist, maintain and recover from various crises, and the degree of this ability determines the health, stability, and development of urban systems [14].
As a complex system, any city has a certain ability to maintain the dynamic stability of the system structure and function. It means any city has a certain degree of “resilience” [15]. The urban resilience will gradually adjust with the development of the city [16]. Urban resilience is both a comprehensive representation of the resilience degree of each subsystem in a city and a measurable urban capacity value that changes with time dimension [17]. Through evaluating urban resilience, it is possible to determine the ability of existing cities to resist crises and maintain and recover urban systems. It can also identify which parts of the urban system are not resilient enough so as to promote urban resilience [18].
This paper attempts to address how to evaluate urban resilience from the perspective of comprehensive evaluation and sub-space evaluation. Based on the sub-space evaluation results, this paper also wants to identify the reasons for the insufficient urban comprehensive resilience and propose appropriate suggestions for improving urban resilience. Therefore, this paper will propose the evaluation index system and evaluation method of urban resilience with reference to the concept of “trio spaces“, using the CRITIC-entropy method and the cloud evaluation model. Taking four sub-provincial cities in Northeast China as examples, we analyze the resilience of each city from 2014 to 2020 and propose suggestions to improve urban resilience according to the shortcomings of urban resilience building.
This paper is divided into five sections. Section 1 is the introduction of this paper. Section 2 reviews the literature on the connotation and evaluation of urban resilience. Section 3 describes the theory and method of this paper. Section 4 evaluates the urban resilience in four sub-provincial cities in Northeast China and gives the results of urban resilience comprehensive and sub-space evaluation. Section 5 discusses the results and concludes the study.

2. Literature Review

2.1. Connotation of Urban Resilience

Resilience was first applied in the fields of mechanics and materials science [19]. With the expansion of cognition of resilience, the use of “resilience” has gradually spread to psychology, sociology, urban economics, and other disciplines [20,21,22], and “urban resilience” has gradually developed [23]. Although the connotation of urban resilience may vary from multiple disciplines, the core functions of urban resilience are roughly the same. The core functions mainly include the abilities of resistance, self-recovery, and learning when facing disasters [24,25].
Resistance is the urban ability to withstand interference, which refers to the maximum degree of damage that can be endured [26]. Resistance is mainly reflected in the robustness of urban structure and basic functions. Self-recovery is the urban coping to recover to its pre-disturbance state after encountering interference and exceeding the maximum degree of damage [24]. The faster the self-recovery is, and the more the resources are, the greater the resilience of the system is. Therefore, the speed and resource adequacy of self-recovery is generally an important indicator of the degree of resilience [27,28]. Some studies about resilience explore how to ensure urban system’s recovery speed [24,27]. In fact, urban learning ability plays an important role in the recovery of urban resilience [25]. Learning ability is not only the urban ability to recover to its original state after being disturbed and destroyed but also to help the cities to achieve higher resilience. Through learning, cities can better resist similar disturbances or efficiently resolve disasters in the future [29]. Therefore, learning ability also reflects urban adaptation when facing interference. Some studies have pointed out that preparing multiple solutions could help effectively solve problems, even if one of them fails [30]. This is actually a manifestation of the redundancy of multiple solutions when cities solve problems [31]. To better determine the resistance, self-recovery, and learning ability of urban systems, some studies have begun to evaluate urban resilience to make sure the current status of urban resilience [32,33].

2.2. Evaluation of Urban Resilience

Some studies on urban resilience evaluation have focused on the establishment of evaluation index systems and the proposal of evaluation methods [34,35]. Due to the complex composition of a city, it is often necessary to establish an evaluation index system for urban resilience from different perspectives or dimensions during the evaluation process [18,32,36]. From the components of the urban system, the resilience evaluation index system was established from the dimensions of infrastructure, economy, society, and ecology [32]. From the perspective of landscape ecology, the resilience evaluation index system was established from the aspects of urban scale, density, and morphology [18]. From the perspective of an effective response to risk and disaster, the resilience evaluation index system was established from the aspects of redundancy, resourcefulness, flexibility, restructuring ability, and learning ability [28,36,37,38].
Although qualitative evaluation methods can also be used to evaluate the high, medium, and low levels of urban resilience, it is difficult to compare the resilience level of different cities within the same level [39]. Therefore, the common methods for evaluating resilience still rely mainly on quantitative evaluation methods [40,41,42]. In addition to the fuzzy comprehensive evaluation method, the multi-objective weighting function method to calculate the urban resilience indicators is used [40]. The data envelopment analysis (DEA) model is used to evaluate urban resilience [41]. The urban resilience can be evaluated by using the system dynamics model (SDM). This method could evaluate urban resilience and identify the mutual interdependences among the considered urban variables [42]. In addition, the existing study pointed out that the cloud evaluation model as a computer simulation method can be used for evaluating urban resilience in the aspect of natural disasters [34].
Overall, there are some studies on the concept of urban resilience, evaluation index system, and methods of urban resilience; however, there are still shortcomings in existing studies. First, in the process of establishing an urban resilience evaluation index system, there is a lack of a theoretical model and evaluation index system that combines urban characteristics with resilience. Second, although some studies proposed that a cloud evaluation model can be used to evaluate resilience, studies about urban resilience are still insufficient. Therefore, this paper will establish an evaluation index system of urban resilience based on the theoretical framework of trio spaces. The cloud evaluation model for urban resilience will be proposed with the CRITIC-entropy weight method. Then, an empirical study is conducted on four cities in Northeast China to explore the current situation and shortcomings of urban resilience, and some suggestions to improve urban resilience will be proposed.

3. Materials and Methods

3.1. Trio Spaces of Urban Resilience

Urban is not simply a collection of buildings but includes human activities, information flow, and other important components. Previous studies often analyzed urban resilience from the perspective of urban system composition. Urban resilience was analyzed from five sub-systems, including social system, economic system, natural system, institution system, and infrastructure system [43]. However, this system division does not take into account the communication and flow of information resources between these five sub-systems. Therefore, some studies suggest that urban issues can be analyzed from the perspective of the trio spaces of the city [44].
Urban can be seen as a “trio space” consisting of physical space, societal space, and cyberspace [45]. Physical space is a spatial form composed of physical entities, including natural environment, infrastructure, buildings, and other natural or artificial objects. Physical space is visible and accessible in the real world and is the foundation of urban construction [46]. Societal space refers to various human activities generated to achieve human interaction and accelerate the process of urbanization, including economic, cultural, educational, medical, and other human activities. Societal space is the driving force of urban development [45]. Cyberspace includes various resources such as data, information technology, and networks [47]. Cyberspace is also an important carrier for promoting the intelligence and informatization of physical space and societal space [45]. Therefore, there are both differences and similarities between trio spaces and urban systems. Physical space contains all visible and tangible substances in the urban system [46]. Societal space includes various activities of human survival and life that cannot be seen or touched. The social system, economic system, and organizational system in the urban system belong to societal space [44]. Compared to urban systems, cyberspace is internalized into other sub-systems. The trio spaces emphasize the importance of cyberspace and separate it from others. The cyberspace is also invisible and intangible, but it is not a human activity and is a variety of data and technological resources [46]. In fact, after entering the 21st century, the impact of technology has become crucial for urban development, and the importance of intelligence is also being emphasized in urban resilience. Therefore, evaluating the resilience of urban cyberspace helps to evaluate the comprehensive resilience of cities from the perspectives of information, intelligence, and data. In summary, this paper explores urban resilience from the perspective of trio spaces.
For urban resilience, any space of trio spaces that is “attacked” and damaged will lead to poor urban resilience. Therefore, trio spaces in a city need to have a certain degree of resilience. This paper does not explore urban resilience specific to a particular risk but rather explores comprehensive resilience, which refers to the overall ability of cities to resist various risks (including natural, economic, and social risks). From the concept of urban resilience and the literature review, the resilience of each sub-space should have the abilities of resistance, self-recovery, and learning, which are reflected by the characteristics of “robustness”, “efficiency”, “resourcefulness”, “redundancy”, and “adaptation” [24,28,31,48,49,50].
First, when facing crisis, cities with a certain degree of “resilience” have the ability to resist external shocks, and this characteristic can be attributed to “robustness”. If the external shocks exceed the level of “robustness” of the city, the operation of some parts of the city system will be affected to a certain extent then the city will resist internally [24]. The shorter the reaction time of this resistance is, the faster the solution to the shocks is found and implemented, the faster the recovery of the city system can be ensured. This characteristic can be summarized as “efficiency” [28]. Existence of resources that can be rapidly displaced to respond to disruptions and the risks’ effects. The more sufficient resources are, the more conducive the city system is to recovery. This characteristic can be summarized as “resourcefulness” [49,50]. In addition, cities often have alternative solutions to a crisis for better recovery. The characteristic can be attributed to “redundancy” [31]. Finally, after a crisis is largely resolved, cities can learn from their experiences to be prepared for the next crisis. The characteristic can be attributed to “adaptation” [48]. The theoretical relationship between urban resilience and trio spaces is shown in Figure 1.

3.2. Evaluation Index System Establishment

According to the theoretical relationship analysis, referring to the relevant literature and combining the suggestions of industry experts, the urban resilience evaluation index system in “physical-societal-cyber” space was finally established with 29 indicators, as shown in Table 1. This paper does not consider the impact of policy factors on urban resilience. The main reasons include the following: first, many aspects related to policy factors, such as elderly care, healthcare, economic growth, etc., have been internalized into relevant indicators, and the policy factor effect can be demonstrated through changes in relevant indicators. Second, urban resilience building in China is still in the exploratory stage. Although some cities in China have released local government documents on urban resilience building, local government documents are still mainly based on central government documents. Therefore, the urban resilience building in various regions can still be seen as guided by the central government, which means that there is not much difference in local policies for the resilience building of each city.

3.3. Evaluation Model of Urban Resilience Based on Trio Spaces

3.3.1. Determination of Indicator Weights

Considering that the weights obtained by subjective assignment methods such as AHP are highly subjective and easily affected by the limitations of the knowledge of the assignor, this paper chose the objective assignment method of CRITIC-entropy to obtain the weights. The CRITIC method calculates the weights by the important criterion of inter-layer correlation, and this method is suitable for data with certain correlations between indicators [57]. This method also considers the influence of data fluctuation on the calculation of weights. The main idea of CRITIC method is to use the contrast strength of indicators and the conflict between indicators to determine the weights [58]. The contrast strength of indicators refers to the size of the variability of the values of the same indicator, which is generally measured by the standard deviation. The conflict between indicators refers to the size of the correlation between the indicators. If there is a strong positive correlation between two indicators, it means that the conflict between the two indicators is low. The entropy method is calculated to determine the degree of variation of a certain indicator [33]. When the degree of variation of an indicator is greater, the more informative the indicator is, and the greater the indicator weight is [59]. The combination of the two methods can highlight the characteristics of the data and attenuate the extreme values of the data. In this paper, the weights are obtained by CRITIC method and entropy method, respectively, and then the final weights are obtained by averaging. Considering the existence of positive and negative indicators, this paper selected the extreme difference standardization method to process the data. The CRITIC method calculates the indicator weights, which are shown in Equations (1) and (2).
C j = σ j i = 1 m 1 r i j
w j C = C j j = 1 n C j
where C j represents the amount of information contained in the jth indicator;
σ j represents the contrast strength, which is the standard deviation;
r i j represents the correlation between indicator i and indicator j;
w j C represents the weight of indicator j obtained under the CRITIC method.
The entropy method calculates the indicator weights, which are shown in Equations (3) and (4).
E j = x j x j σ j + k
w j E = E j j = 1 n E j
where x j and x j represent the value of the jth indicator and its mean, respectively;
σ j represents the standard deviation;
k represents the translation shift, generally between [−5, 5];
E j represents the standardized value after translation;
w j E represents the weight of indicator j obtained under the entropy method.
The weight of indicator j ( w j ) is shown in Equation (5).
w j = w j C + w j E 2

3.3.2. Evaluation Model Establishment

In this paper, the cloud evaluation model is used to evaluate the urban resilience. The comprehensive evaluation can obtain a high or low level of overall urban resilience, and it can carry out the comparison of comprehensive resilience of different cities in the same year or different years of the same city. The sub-space evaluation can be further determined on the basis of the comprehensive resilience evaluation so as to clarify the reasons affecting the comprehensive urban resilience.
The principle of the cloud evaluation model is to use several cloud drops to form an uncertain cloud. The description of the cloud consists of three elements (Ex, En, He), where Ex is the expectation of cloud drops in the theoretical domain space; Ex is actually the distribution center of the cloud, and it is also the most representative value for the evaluated object [59]; En is the entropy, which is used to represent the uncertainty degree of the cloud. En has a normal distribution that represents the acceptable numerical range for observations to be evaluated. The larger the numerical range, the more uncertain the observation to be evaluated is, and the more likely it is to migrate or fluctuate within this range [60]. He is the super-entropy, which is used to represent the uncertainty degree of entropy. He generally represents the thickness of clouds, reflecting the statistical dispersion of clouds, which should not be too large [61]. During the evaluation process, this value is mainly used to form a cloud map and has little impact on the evaluation results. Therefore, for the convenience of interpreting the cloud map, He is generally taken as a suitable value [62].
The forward cloud generator and inverse cloud generator are Included in a cloud evaluation model, where the forward cloud generator generates cloud clusters from (Ex, En, He), and the inverse cloud generator extracts the core elements of clouds from the cloud clusters [63]. In the process of cloud evaluation, it is to compare the obtained result cloud with the standard cloud and finally determines the evaluation results. In the process of comparing cloud maps of results and criteria, the main observation is the central distribution position of the cloud (location of Ex) and the acceptable range (range formed by En). The position of Ex is generally to evaluate the value of an object, which can indicate its evaluation level. The range formed by En can be seen as the size of the fluctuation range of evaluated objects; that is, evaluating whether observations are susceptible to external influences and falling within what reasonable range [64]. The algorithm is shown in Equations (6)–(8).
E x = ( a 1 + a 2 ) / 2
E n = a 1 a 2 / 2.335
H e = k
a 1 = 1 b = 1 k [ w ( Z + Z a b ) ] 2
a 2 = b = 1 k [ w ( Z Z a b ) ] 2
where Z + , Z , and Z a b represent the optimal value, the lowest value, and the standardized value of the sample data, respectively; k is a constant, which is taken as 0.001 with reference to previous papers [61,62].

3.3.3. Evaluation Criteria

The evaluation set is divided into five levels, which are “very poor”, “poor”, “qualified”, “good”, and “excellent”. Among them, “very poor” and “excellent” belong to unilateral constraint, “poor”, “qualified”, and “good” belong to the bilateral constraint [65]. The evaluation criteria are shown in Table 2 and Figure 2.

4. Data Sources and Results

4.1. Study Area and Data Sources

The empirical study area of this paper is four sub-provincial cities in three Northeastern provinces of China, including the following: Harbin, Changchun, Shenyang, and Dalian (Shown in Figure 3). Since these four cities are the cities with good economic and social development in Northeast China, and most of the cities’ construction will affect the neighboring cities and counties, the resilience evaluation of the sub-provincial cities is representative.
The data sources of this paper include the following: statistical yearbooks of each city, statistical bulletins of national economic and social development, statistical analysis reports of urban rail transportation analysis in each year, and VariFlight Map statistics. Some of the missing data are obtained from the Science and Technology Bureau, Finance Bureau, and news reports of each city to ensure the completeness and credibility of the data.

4.2. Results of Urban Resilience Comprehensive Evaluation

The CRITIC-entropy value method was used to determine the weights of each indicator for the comprehensive evaluation of urban resilience of four cities in Northeast China from 2014 to 2020, which are shown in Table 3.
By further calculations, the cloud characteristics of urban resilience of four northeastern cities from 2014 to 2020 were obtained, as shown in Table 4. It is utilized to compare the resilience intensity of each city with the evaluation criteria. Taking 2014 and 2020 as examples, the urban resilience intensity of four cities is compared with the evaluation criteria, as shown in Figure 4.
From the comparison, regardless of the year, the Ex of the resilience of cloud drops in each city is concentrated near the evaluation criteria, which is (0.500, 0.039, 0.005), and the expected distribution and shape of cloud drops in the discourse space are also basically consistent. Based on Table 4, it can be seen that the highest point of Ex is basically around 0.500, indicating that the urban resilience of four cities in Northeast China basically reached the “qualified” level from 2014 to 2020. However, the range of En is around 0.320. It means the fluctuation range of urban resilience is relatively large, not only concentrated near “qualified”. Based on the difference in the highest point of Ex for each city’s resilience, it can be basically determined that the cities with the highest resilience levels in 2014, from 2015 to 2018, and from 2019 to 2020 are Dalian, Changchun, and Shenyang, respectively. The city with the lowest resilience level is Harbin. Among them, the resilience of Harbin in various years is mainly “below qualified”, and there is a trend towards a “poor” level. To verify the reliability of the research results, this paper also used the fuzzy comprehensive evaluation method to evaluate the urban resilience of four cities from 2014 to 2020. The results can be found in Appendix A. If the fuzzy comprehensive evaluation level is divided according to the average segmentation method, the resilience of Changchun, Shenyang, and Dalian are all at a “qualified” level, while the resilience level of Harbin is relatively low, with 2016 and 2019 at a “qualified” level, and other years at a “poor” level close to the “qualified” level, which is almost consistent with the cloud model evaluation results. The trends of resilience level changes obtained by using the cloud evaluation model and fuzzy comprehensive evaluation are basically consistent, indicating that cloud evaluation model can achieve effective evaluation and the results are relatively accurate. However, compared to the fuzzy comprehensive evaluation results, which can only find the level of resilience, cloud evaluation results can further find the stability of resilience based on the results of En. It can be seen that although the resilience levels of the four cities in Northeast China are all in the “qualified” category, from the values of En and the distribution of cloud drops, regardless of any year, the distribution of cloud drops spans all resilience levels. It indicates that the uncertainty of resilience development in each city is high; that is, the resilience level of each city is not stable and is easily affected by external influences and changes. Therefore, it is necessary to evaluate the resilience of sub-spaces to clarify the main reasons for the lower comprehensive resilience of cities in the trio spaces. It can lay the foundation for enhancing the urban resilience by enhancing the resilience of each sub-space.

4.3. Results of Urban Resilience Sub-Space Evaluation

Under the trio spaces perspective, to explore how to improve the urban resilience, this paper evaluates the physical space resilience, societal space resilience, and cyberspace resilience of four cities, respectively. The results are shown in Table 5.
From Table 5, it can be seen that the resilience intensity of physical space, societal space, and cyberspace in the same city all change with a time dimension, which also affects the comprehensive intensity of urban resilience.
The evaluation results of the physical space resilience intensity in Harbin are generally higher and even higher than the comprehensive evaluation results in some years. The evaluation results of the societal space resilience intensity are generally similar to the comprehensive evaluation results. However, the cyberspace resilience was lower, and it was lower than the comprehensive resilience in almost all years. Especially in 2015, 2017, and 2018, the cyberspace resilience is mainly concentrated at the “poor” level. It indicates that it is mainly the resilience of physical space and societal space that supports the comprehensive evaluation result of urban resilience in Harbin to reach the “qualified” level. The cyberspace resilience needs to be enhanced. Taking 2017 as an example, the comparison among the cyberspace resilience level, comprehensive resilience level, and evaluation criteria of Harbin is shown in Figure 5.
The physical space resilience of Changchun is basically above the “qualified” level and generally higher than the comprehensive evaluation results. The cyberspace resilience has a good development momentum, and it is also generally higher than the comprehensive evaluation results from 2016 to 2019. Taking 2017 as an example, the cyberspace resilience level, comprehensive resilience level, and evaluation criteria of Changchun are shown in Figure 6. In comparison, the evaluation results of societal space resilience are generally lower than the comprehensive evaluation results. Interestingly, however, when the cyberspace resilience intensity is higher, the societal space resilience intensity tends to decrease, which leads to the suspicion that the local government may neglect the development of societal space resilience when vigorously developing cyberspace resilience and vice versa. It may be the reason for the opposite trend of these two space resilience evaluation results.
The physical space resilience and societal space resilience of Shenyang are basically above the “qualified” level and generally higher than the comprehensive evaluation results. In comparison, the cyberspace resilience of Shenyang is the shortboard, but it is better than the cyberspace resilience of Harbin. It indicates that the development of each space resilience in Shenyang is balanced, which is also the reason why the comprehensive evaluation results of urban resilience in Shenyang are almost kept at similar levels.
The physical space resilience of Dalian is generally slightly lower than the comprehensive evaluation results, while the societal space resilience is generally slightly higher than the comprehensive evaluation results. Although the cyberspace resilience of Dalian City was above the “qualified” level in 2014–2015, it appeared to be lower in 2016–2019 and improved in 2020. Although the decrease in cyberspace resilience in Dalian did not bring more fluctuation to the comprehensive evaluation results of Dalian, it is the main reason why the comprehensive evaluation results in Dalian did not continue to improve.

5. Discussion and Conclusions

In this paper, under trio spaces, the indicator system of urban resilience evaluation is established from the robustness, efficiency, resourcefulness, redundancy, and adaptation of physical space, societal space, and cyberspace. The evaluation model of urban resilience is established by using the CRITIC-entropy value method and cloud evaluation method. Harbin, Changchun, Shenyang, and Dalian in Northeast China were taken as empirical areas, and their urban resilience was evaluated comprehensively and spatially. The results show that the comprehensive evaluation results of urban resilience of the four cities in Northeast China are at the level of “qualified”, and there is still much room for improvement. The results of the space evaluation not only explain the comprehensive evaluation results but also help this paper to propose suggestions to improve urban resilience.
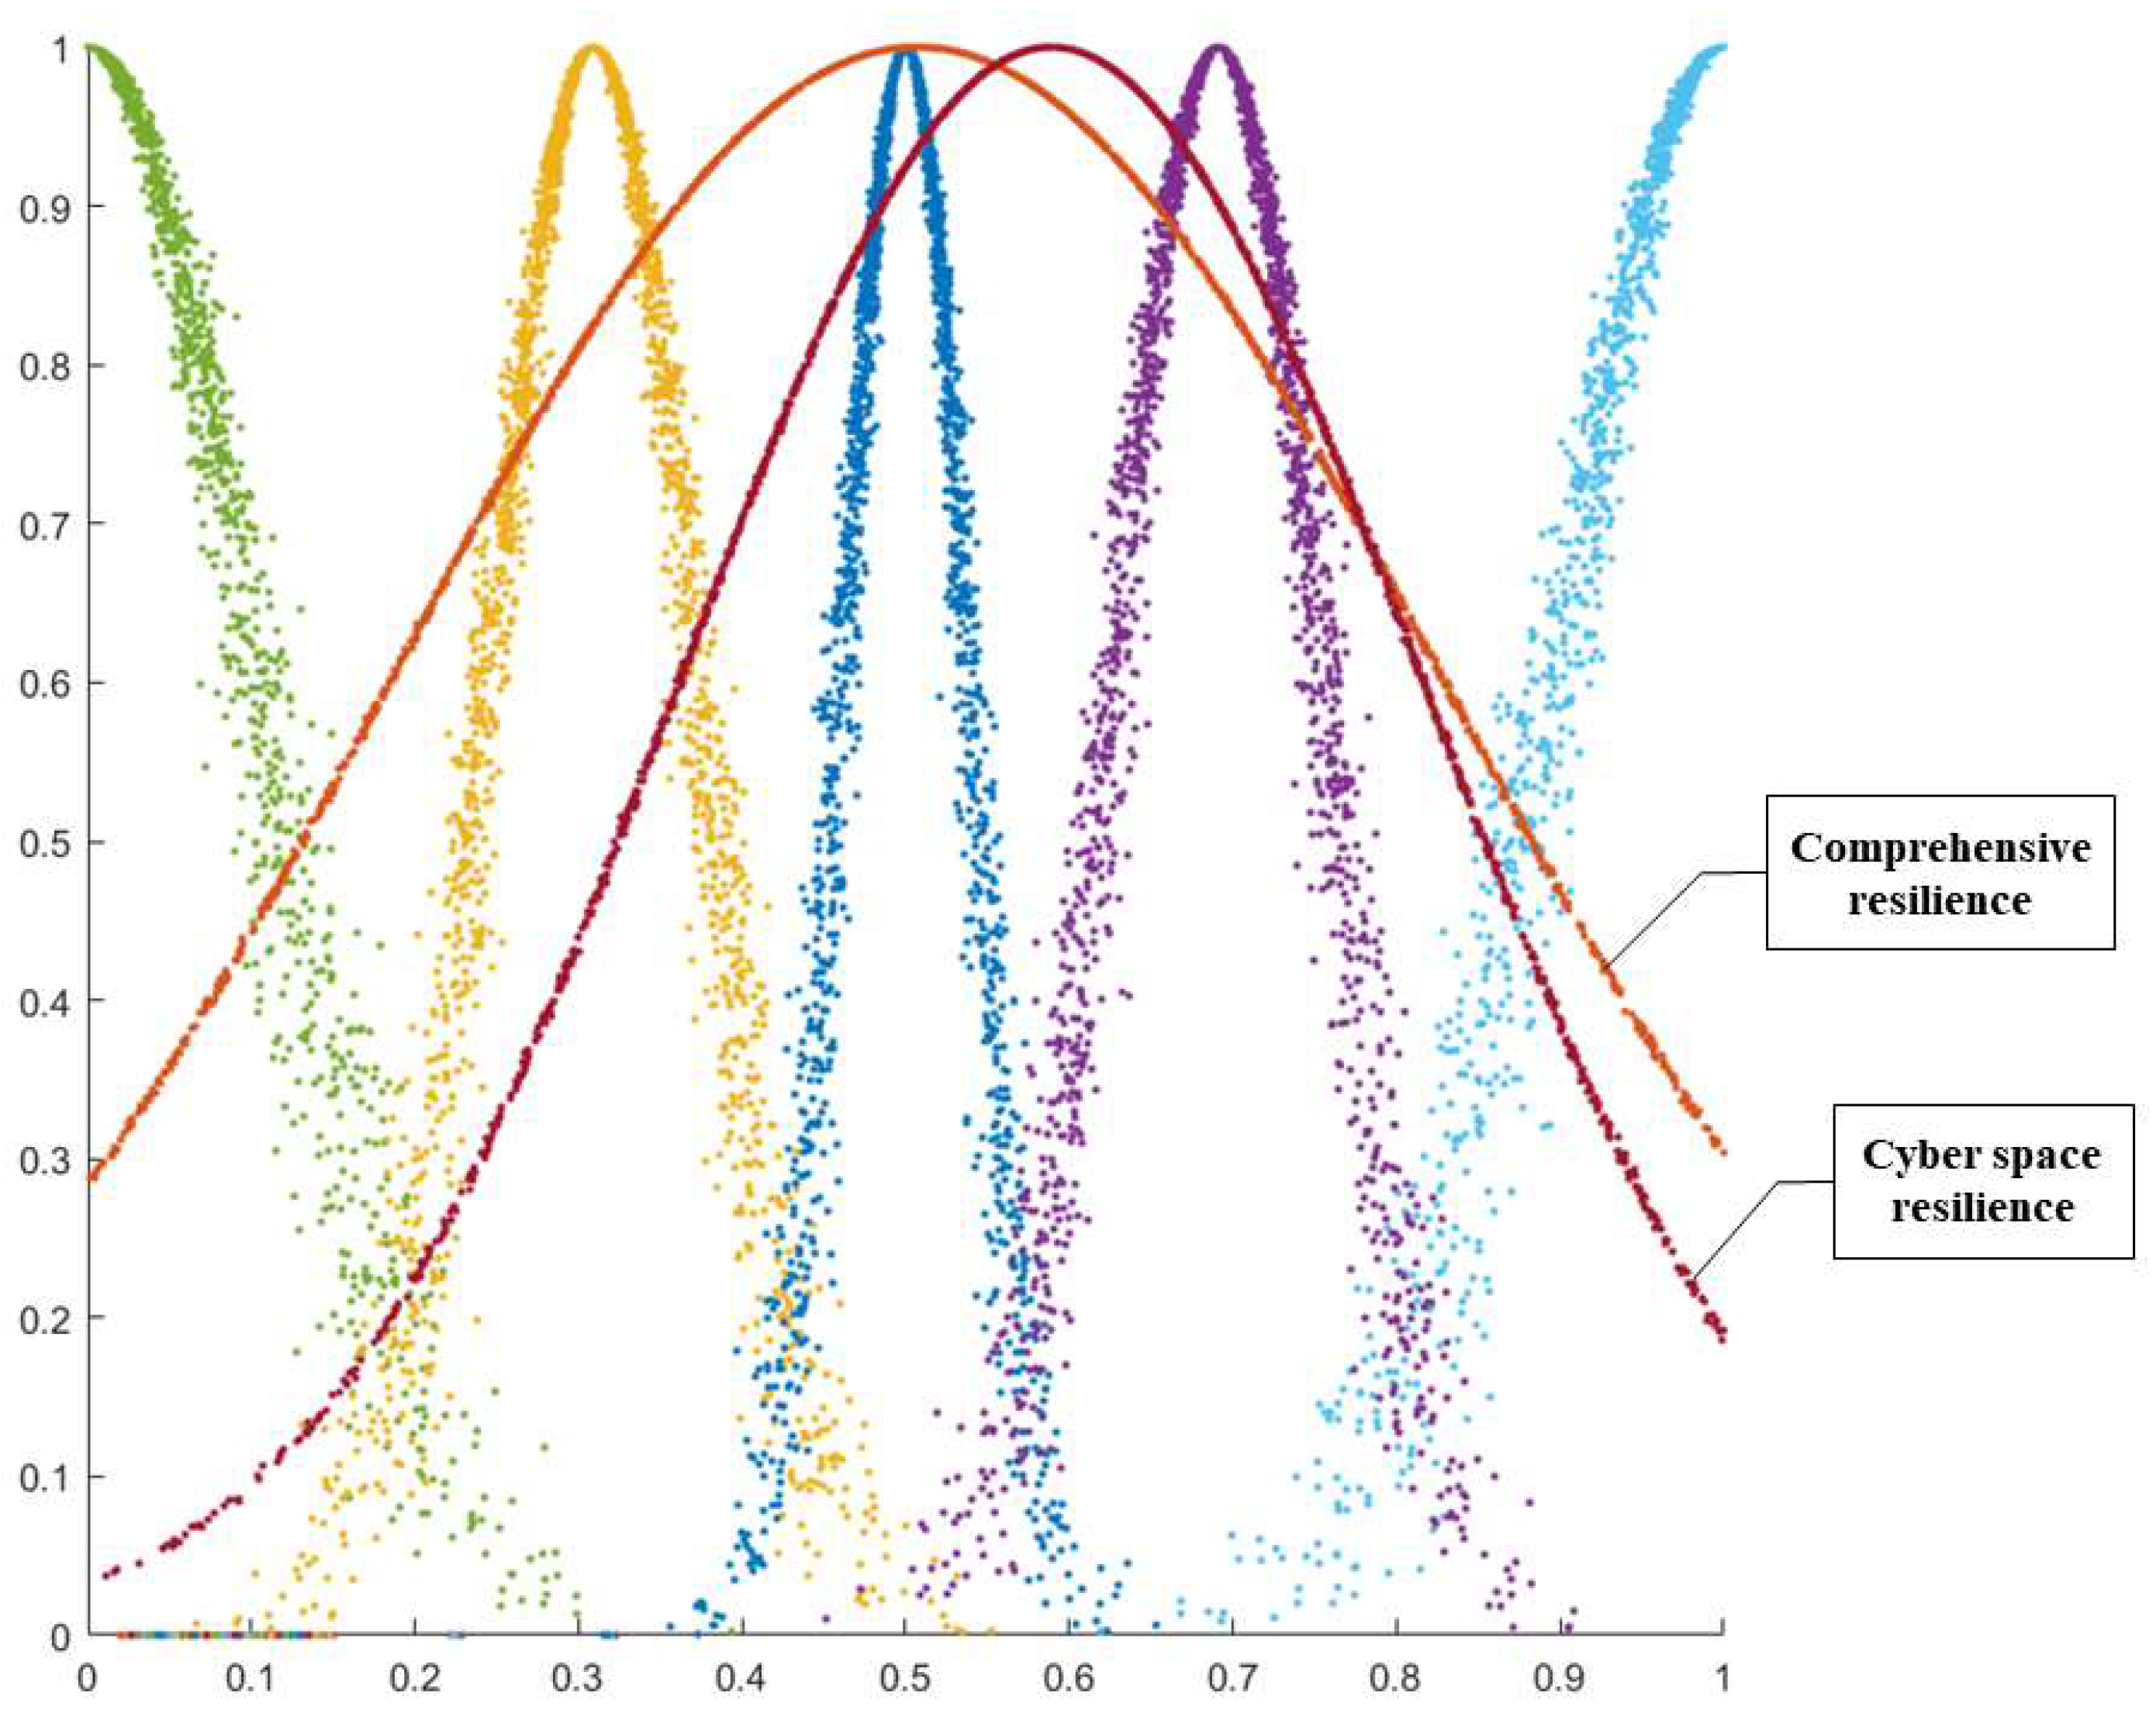
First, the resilience of physical space and societal space should continue to develop steadily, while the resilience of cyberspace is still the shortcoming of most cities and should be given high priority.
From the evaluation results of sub-spaces, most cities can basically achieve a “qualified” level of resilience in physical space and societal space. Continuous and stable improvement of the resilience of the two spaces will help to improve the comprehensive resilience level. From the results, most urban resilience levels cannot be effectively improved because of the lack of cyberspace resilience building. Therefore, in the era of big data, further improving the cyberspace resilience through digital and intelligent means will help to improve the comprehensive resilience level. Although the development of big data in the world has reached a climax since 2013, and the Chinese government is also laying out the development strategy of big data. It was only after 2016 that the Chinese government began to gradually and comprehensively promote the development and application of big data [66]. Since the application and promotion of big data in various regions need time and cycles, and there is a regional imbalance in technology development. It means that the enhancement of cyberspace resilience in various regions needs a process. It is the reason for the lower cyberspace resilience compared to physical space resilience and societal space resilience in evaluating the urban resilience of these four Northeastern cities in China from 2014 to 2020.
Second, in the process of urban resilience enhancement, the common enhancement of each space resilience should be highlighted. Especially the synchronization of resilience building in societal space and cyberspace needs to be highlighted, which helps to achieve the balance of resilience building in trio spaces.
It can be seen that the key to urban resilience enhancement is to focus on the balance of resilience building of trio spaces. For example, the resilience building of societal space and cyberspace in Changchun often appears to be in a situation where they are in contrast to each other, which leads to the inability to effectively improve the comprehensive resilience level in Changchun. Therefore, in the process of building the resilience of trio spaces, it is necessary to maintain the simultaneous improvement of each space, which can promote the improvement of the comprehensive resilience level.
Third, fluctuations may occur in the process of improving the resilience of trio spaces, and it is necessary to establish an urban resilience evaluation index system and regularly monitor the urban resilience building. The problems can be found, and program adjustments can be made in time when fluctuations occur.
It is clear that the improvement of urban resilience does not happen overnight but needs to face a long-term and iterative process. For example, the cyberspace resilience of Dalian tends to fall before rising, thus affecting the improvement of the comprehensive resilience level. To stop the decline of the urban resilience level as soon as possible, a reasonable evaluation index system can be established, and the urban resilience building situation can be monitored regularly. Through evaluation and monitoring, the key problems in the trio spaces can be found in time, which is helpful to stop the damage and promote the construction of urban resilience in time.
Finally, if the local government can recognize the importance of urban resilience building, they can guide the construction by formulating local program documents. If the local government can actively absorb the experience of other cities with better resilience building, it will also help to improve the comprehensive level of urban resilience. It is worth noting that although improving urban resilience can help cities enhance their abilities to resist disasters and promote urban development, it is also necessary to highlight the degree of urban resilience and not force the resilience building beyond the law of trio space development. The best urban resilience building plan should be developed according to the development of physical space, societal space, and cyberspace in each city, and the urban resilience building should be steadily promoted.
The innovation of this paper is reflected in the following two aspects. First, this paper explores the issue of urban resilience evaluation based on the theory of trio spaces. It not only clarifies the dimensions of indicator selection more clearly, but also reveals the impact of visible physical space, invisible societal space, and cyberspace on the urban resilience. Second, compared to previous studies using a comprehensive fuzzy evaluation method, the cloud evaluation model used in this paper can also effectively evaluate the urban resilience. It can use cloud maps to intuitively reveal the trend of urban resilience level and whether it is susceptible to the external environmental influences, which is more conducive to providing suggestions on how to maintain and enhance urban resilience and avoid negative impacts of external environment. Overall, the theoretical contribution of this paper is to clarify the relationship between the concept of trio space and urban resilience, laying a theoretical foundation for the construction of an urban resilience evaluation index system. A cloud evaluation model was proposed for urban resilience, providing a model reference for future resilience evaluation. The practical contributions include clarifying the current status of urban resilience in the four cities in Northeast China and identifying the main reasons for the lower resilience. Some suggestions are proposed to enhance resilience from different space perspectives of urban resilience in this paper.
There are also some limitations. First, to ensure the aggregation of cloud drops, this paper refers to the previous literature and sets the He as 0.001. Although it has little impact on the results of urban resilience evaluation, the distribution of urban resilience cloud drops under different He can be considered in the future. Second, the results reveal more about the impact of different spaces on urban resilience but fail to clarify which factors affect the resilience of each subspace. In the future, we should combine the method of cause analysis to clarify the reasons for the impact on the sub-space resilience. This paper explores the level of comprehensive resilience rather than evaluating resilience for a particular disaster. It will also explore urban resilience in the future under the premise of more resilient goals; that is, evaluating urban resilience from different disaster dimensions.

Author Contributions

Conceptualization, J.Z. and X.Y.; methodology, J.Z.; software, J.Z.; validation, J.Z., X.Y. and D.L.; formal analysis, J.Z.; investigation, J.Z.; resources, J.Z. and D.L; data curation, J.Z.; writing—original draft preparation, J.Z.; writing—review and editing, X.Y.; visualization, J.Z.; supervision, X.Y. and D.L.; project administration, X.Y.; funding acquisition, X.Y. All authors have read and agreed to the published version of the manuscript.

Funding

This research was funded by the Natural Science Foundation of China (grant No. 71974047), Natural Science Foundation of Heilongjiang Province (grant No. LH2023G010).

Data Availability Statement

Data available on request, due to restrictions.

Conflicts of Interest

The authors declare no conflict of interest.

Appendix A

Table A1. Evaluation of urban resilience of four cities from 2014 to 2020 using fuzzy comprehensive evaluation method.
YearHarbinChangchunShenyangDalian
20140.4820.4970.4910.503
20150.4760.5040.4940.493
20160.4850.5070.4960.496
20170.4790.5070.5040.480
20180.4730.5070.4950.496
20190.4850.4970.5050.491
20200.4750.4980.5010.490

References

  1. Statistical Bulletin on National Economic and Social Development of the People’s Republic of China in 2022. Available online: https://www.gov.cn/xinwen/2023-02/28/content_5743623.htm (accessed on 28 February 2023).
  2. Crankshaw, O.; Borel-Saladin, J. Causes of urbanisation and counter-urbanisation in Zambia: Natural population increase or migration? Urban Stud. 2018, 56, 2005–2020. [Google Scholar] [CrossRef]
  3. Firman, T. Urban development in Indonesia, 1990–2001: From the boom to the early reform era through the crisis. Habitat Int. 2002, 26, 229–249. [Google Scholar] [CrossRef]
  4. Earle, L. Addressing urban crises: Bridging the humanitarian–development divide. Int. Rev. Red Cross 2016, 98, 215–224. [Google Scholar] [CrossRef]
  5. Deshpande, N.R.; Kulkarni, B.D. Changing pattern of heavy rainstorms in the Indus basin of India under global warming scenarios. J. Earth Syst. Sci. 2015, 124, 829–841. [Google Scholar] [CrossRef] [Green Version]
  6. Goodman, D.; Mann, S. Managing public human resources following catastrophic events. Rev. Public Pers. Adm. 2008, 28, 3–19. [Google Scholar] [CrossRef]
  7. Reinhardt, G.Y.; Chatsiou, K. Using community education interventions to build resilience and avert crises: How accidental dwelling fires decreased in Essex County, UK. Local Gov. Stud. 2019, 45, 394–412. [Google Scholar] [CrossRef]
  8. Lai, F.T.T.; Huang, L.; Chui, C.S.L.; Wan, E.Y.F.; Li, X.; Wong, C.K.H.; Chan, E.W.W.; Ma, T.; Lum, D.H.; Leung, J.C.N.; et al. Multimorbidity and adverse events of special interest associated with Covid-19 vaccines in Hong Kong. Nat. Commun. 2022, 13, 411. [Google Scholar] [CrossRef]
  9. Tavares, J. The open society assesses its enemies: Shocks, disasters and terrorist attacks. J. Monet. Econ. 2004, 51, 1039–1070. [Google Scholar] [CrossRef]
  10. City Resilience Action Planning Tool (CityRAP). Available online: https://unhabitat.org/city-resilience-action-planning-tool-cityrap (accessed on 29 May 2023).
  11. Klein, R.J.T.; Nicholls, R.J.; Thomalla, F. Resilience to natural hazards: How useful is this concept? Glob. Environ. Chang. B Environ. Hazards 2003, 5, 35–45. [Google Scholar] [CrossRef]
  12. Nelson, D.R.; Adger, W.N.; Brown, K. Adaptation to environmental change: Contributions of a resilience framework. Annu. Rev. Environ. Resour. 2007, 32, 16–24. [Google Scholar] [CrossRef] [Green Version]
  13. Bozza, A.A. Developing an integrated framework to quantify resilience of urban systems against disasters. Nat. Hazards 2015, 78, 1729–1748. [Google Scholar] [CrossRef]
  14. Patel, D.A.; Lad, V.H.; Chauhan, K.A.; Patel, K.A. Development of bridge resilience index using multicriteria decision-making techniques. J. Bridge Eng. 2020, 25, 04020090. [Google Scholar] [CrossRef]
  15. Meerow, S.; Newell, J.P.; Stults, M. Defining urban resilience: A review. Landsc. Urban Plan. 2016, 147, 38–49. [Google Scholar] [CrossRef]
  16. Wang, Z.R.; Fu, H.Q.; Zhou, L. Multiple urban resilience evaluation of resource-based cities’ sustainable transformation effect. Resour. Conserv. Recy. 2023, 191, 106912. [Google Scholar] [CrossRef]
  17. Huang, J.; Sun, Z.M.; Du, M.Z. Differences and drivers of urban resilience in eight major urban agglomerations: Evidence from China. Land 2022, 11, 1470. [Google Scholar] [CrossRef]
  18. Feng, X.; Xiu, C.; Bai, L.; Zhong, Y.; Wei, Y. Comprehensive evaluation of urban resilience based on the perspective of landscape pattern: A case study of Shenyang city. Cities 2020, 104, 102722. [Google Scholar] [CrossRef]
  19. Li, D.Q.; Selig, E.T. Resilient modulus for fine-Grained subgrade soils. Mech. Mater. ASCE Am. Soc. Civ. Eng. 1994, 120, 939–957. [Google Scholar] [CrossRef]
  20. Bacchi, S.; Licinio, J. Resilience and psychological distress in psychology and medical students. Acad. Psychiatr. 2016, 41, 185–188. [Google Scholar] [CrossRef] [PubMed]
  21. Freshwater, D. Vulnerability and resilience: Two dimensions of rurality. Sociol. Rural. 2015, 55, 497–515. [Google Scholar] [CrossRef] [Green Version]
  22. Jiang, J.; Zhang, X.Q.; Huang, C.H. Influence of population agglomeration on urban economic resilience in China. Sustainability 2022, 14, 10407. [Google Scholar] [CrossRef]
  23. Jabareen, Y. Planning the resilient city: Concepts and strategies for coping with climate change and environmental risk. Cities 2013, 31, 220–229. [Google Scholar] [CrossRef]
  24. Yao, Y.; Fu, B.; Liu, Y.; Li, Y.; Wang, S.; Zhan, T.; Wang, Y.; Gao, D. Evaluation of ecosystem resilience to drought based on drought intensity and recovery time. Agric. For. Meteorol. 2022, 314, 108809. [Google Scholar] [CrossRef]
  25. van Hoek, R. Research opportunities for a more resilient post-COVID-19 supply chain–closing the gap between research findings and industry practice. Int. J. Oper. Prod. Man. 2020, 40, 341–355. [Google Scholar]
  26. Wilbanks, T.J. Enhancing the resilience of communities to natural and other hazards: What we know and what we can do. Nat. Hazards Obs. 2008, 32, 10–11. [Google Scholar]
  27. Sharma, N.; Tabandeh, A.; Gardoni, P. Resilience analysis: A mathematical formulation to model resilience of engineering systems. Sustain. D Resil. Infras. 2017, 3, 49–67. [Google Scholar] [CrossRef] [Green Version]
  28. Allan, P.; Bryant, M. Resilience as a framework for urbanism and recovery. J. Landsc. Archit. 2011, 6, 34–45. [Google Scholar] [CrossRef]
  29. Kuang, D.; Liao, K.H. Learning from floods: Linking flood experience and flood resilience. J. Environ. Manag. 2020, 271, 111025. [Google Scholar] [CrossRef]
  30. Ouyang, M.; Liu, C.; Xu, M. Value of resilience-based solutions on critical infrastructure protection: Comparing with robustness-based solutions. Reliab. Eng. Syst. Saf. 2019, 190, 106506. [Google Scholar] [CrossRef]
  31. Azadeh, A.; Hasannia, K.M.; Salehi, V. The impact of redundancy on resilience engineering in a petrochemical plant by data envelopment analysis. Proc. Inst. Mech. Eng. Part O J. Risk Reliab. 2016, 230, 285–296. [Google Scholar] [CrossRef]
  32. Zhao, R.D.; Fang, C.L.; Liu, J.; Zhang, L.F. The evaluation and obstacle analysis of urban resilience from the multidimensional perspective in Chinese cities. Sustain. Cites Soc. 2022, 86, 104160. [Google Scholar] [CrossRef]
  33. Mu, X.; Fang, C.; Yang, Z. Spatio-temporal evolution and dynamic simulation of the urban resilience of Beijing-Tianjin-Hebei urban agglomeration. J. Geogr. Sci. 2022, 32, 1766–1790. [Google Scholar] [CrossRef]
  34. Qiu, H.; Pei, J.J. Urban stormwater resilience assessment method based on cloud model and TOPSIS. Int. J. Environ. Res. Public Health 2022, 19, 38. [Google Scholar] [CrossRef] [PubMed]
  35. Shen, L.; Xue, Z.J.; Tang, L.Y.; Ge, H.Y. Research on resilience evaluation and enhancement of deep foundation pit construction safety system. Buildings 2022, 12, 1922. [Google Scholar] [CrossRef]
  36. Liu, Z.; Chen, H.; Liu, E.; Hu, W. Exploring the resilience assessment framework of urban road network for sustainable cities. Phys. A 2022, 586, 126465. [Google Scholar] [CrossRef]
  37. Vogel, C.; Moser, S.C.; Kasperson, R.E.; Dabelko, G.D. Linking vulnerability, adaptation, and resilience science to practice: Pathways, players, and partnerships. Glob. Environ. Chang. 2007, 17, 349–364. [Google Scholar] [CrossRef]
  38. Eakin, H.C.; Wehbe, M.B. Linking local vulnerability to system sustainability in a resilience framework: Two cases from Latin America. Clim. Chang. 2008, 93, 355–377. [Google Scholar] [CrossRef]
  39. Brown, C.; Shaker, R.R.; Das, R. A review of approaches for monitoring and evaluation of urban climate resilience initiatives. Environ. Dev. Sustain. 2016, 20, 23–40. [Google Scholar] [CrossRef] [Green Version]
  40. Bruneau, M.; Chang, S.E.; Eguchi, R.T.; Lee, G.C.; O’Rourke, T.D.; Reinhorn, A.M.; Shinozuka, M.; Tierney, K.; Wallace, W.A.; Von Winterfeldt, D. A framework to quantitatively assess and enhance the seismic resilience of communities. Earthq. Spectra 2003, 19, 733–752. [Google Scholar] [CrossRef] [Green Version]
  41. He, J.S.; Fan, X.J.; Wu, L.C. Identification and evaluation of urban rail transit operation risk factors based on Entropy-AHP hybrid constrained DEA method. J. Adv. Transp. 2022, 2022, 6241096. [Google Scholar] [CrossRef]
  42. Datola, G.; Bottero, M.; De Angelis, E.; Romagnoli, F. Operationalising resilience: A methodological framework for assessing urban resilience through System Dynamics Model. Ecol. Model. 2022, 465, 109851. [Google Scholar] [CrossRef]
  43. Ostadtaghizadeh, A.; Ardalan, A.; Paton, D.; Jabbari, H.; Khankeh, H.R. Community disaster resilience: A systematic review on assessment models and tools. PLoS Curr. 2015, 7, 25905026. [Google Scholar] [CrossRef]
  44. Fang, D.P.; Li, Z.S.; Li, N.; Han, L.H.; Wu, J.P.; Lu, X.Z.; Kong, X.M.; Li, Y.; Lu, X.L. Urban resilience: A perspective of system of systems in trio spaces. China Civ. Eng. J. 2017, 50, 1–7. (In Chinese) [Google Scholar]
  45. Cutter, S.L.; Barnes, L.; Berry, M.; Burton, C.; Evans, E.; Tate, E.; Webb, J. Community and regional resilience: Perspectives from hazards, disasters, and emergency management. Geography 2008, 1, 2301–2306. [Google Scholar]
  46. Kasai, S.; Li, N.; Fang, D. A system-of-systems approach to understanding urbanization-state of the art and prospect. Smart Sustain. Built 2015, 4, 154–171. [Google Scholar] [CrossRef]
  47. Lin, W.S.; Liu, W. Resilience evaluation of ports along the Maritime Silk Road from the perspective of investment and construction. J. Adv. Transp. 2023, 2023, 8818667. [Google Scholar] [CrossRef]
  48. Liu, Z.; Xiu, C.; Ye, C. Improving urban resilience through green infrastructure: An integrated approach for connectivity conservation in the central city of Shenyang, China. Complexity 2020, 2020, 1653493. [Google Scholar] [CrossRef]
  49. Sharifi, A. Resilient urban forms: A macro-scale analysis. Cities 2019, 85, 1–14. [Google Scholar] [CrossRef]
  50. Ribeiro, P.J.G.; Gonçalves, L. Urban resilience: A conceptual framework. Sustain. Cities Soc. 2019, 50, 101625. [Google Scholar] [CrossRef]
  51. Abdollah, S.; Burden, L.I. Scenario-based resilience assessment framework for critical infrastructure systems: Case study for seismic resilience of seaports. Reliab. Eng. Syst. Saf. 2014, 132, 207–219. [Google Scholar]
  52. Yang, X.; Zhang, D.; Liu, L.; Niu, J.; Zhang, X.; Wang, X. Development trajectory for the temporal and spatial evolution of the resilience of regional tourism environmental systems in 14 cities of Gansu Province, China. Environ. Sci. Pollut. R. 2021, 28, 65094–65115. [Google Scholar] [CrossRef]
  53. Chen, M.; Jiang, Y.; Wang, E.D.; Wang, Y.; Zhang, J. Measuring urban infrastructure resilience via Pressure-State-Response framework in four Chinese Municipalities. Appl. Sci.-BASEL 2022, 12, 2819. [Google Scholar] [CrossRef]
  54. Li, H.Q.; Fan, Y.Q.; Yu, M.J. Deep Shanghai project—A strategy of infrastructure integration for megacities. Tunn. Undergr. Space Technol. 2018, 81, 547–567. [Google Scholar] [CrossRef]
  55. Wang, J.; Foley, K. Assessing the performance of urban open space for achieving sustainable and resilient cities: A pilot study of two urban parks in Dublin, Ireland. Urban For. Urban Green. 2021, 62, 127180. [Google Scholar] [CrossRef]
  56. Desouza, K.C.; Flanery, T.H. Designing, planning, and managing resilient cities: A conceptual framework. Cities 2013, 35, 89–99. [Google Scholar] [CrossRef]
  57. Xu, L.; Guo, Q.; Sheng, Y.; Muyeen, S.M.; Sun, H. On the resilience of modern power systems: A comprehensive review from the cyber-physical perspective. Renew. Sustain. Energy Rev. 2021, 152, 111642. [Google Scholar] [CrossRef]
  58. Modares, H.; Lewis, F.L.; Naghibi-Sistani, M.B. Integral reinforcement learning and experience replay for adaptive optimal control of partially-unknown constrained-input continuous-time systems. Automatica 2014, 50, 193–202. [Google Scholar] [CrossRef]
  59. Wu, H.W.; Zhen, J.; Zhang, J. Urban rail transit operation safety evaluation based on an improved CRITIC method and cloud model. J. Rail Transp. Plan. Manag. 2020, 16, 100206. [Google Scholar] [CrossRef]
  60. Guo, J.; Feng, H.; Sun, J.; Cao, P.; Wang, W.; Chen, H.; Yu, Y. Application of cloud model to evaluation of forest soil fertility: A case in Chinese fir plantations in Southern China. Sustainability 2019, 11, 6286. [Google Scholar] [CrossRef] [Green Version]
  61. Chao, L.; Zhang, H.X.; Liu, S.; Guo, Y. Fishing capacity evaluation of fishing vessel based on cloud model. Sci. Rep. 2022, 12, 8976. [Google Scholar]
  62. Hu, Y.; Wu, L.; Pan, X.; Wang, Z.; Xu, X. Comprehensive evaluation of cloud manufacturing service based on Fuzzy Theory. Int. J. Fuzzy Syst. 2021, 23, 1755–1764. [Google Scholar] [CrossRef]
  63. Lu, H.A.; Zhao, Y.M.; Zhou, X.; Wei, Z.K. Selection of agricultural machinery based on improved CRITIC-Entropy weight and GRA-TOPSIS method. Processes 2022, 10, 266. [Google Scholar] [CrossRef]
  64. Pei, J.J.; Liu, W.; Han, L. Research on evaluation index system of Chinese city safety resilience based on Delphi method and cloud model. Int. J. Environ. Res. Public Health 2019, 16, 3802. [Google Scholar] [CrossRef] [Green Version]
  65. Craciun, I.; Inoan, D.; Popa, D.; Tudose, L. Generalized Golden Ratios defined by means. Appl. Math. Comput. 2015, 250, 221–227. [Google Scholar] [CrossRef]
  66. Ma, X. Is big data a big dilemma or a big opportunity in China? Intellectual property protection in the era of big data. China WTO Rev. 2018, 4, 67–92. [Google Scholar] [CrossRef] [Green Version]
Figure 1. Theoretical relationship.
Buildings 13 01695 g001
Figure 2. Evaluation criteria.
Buildings 13 01695 g002
Figure 3. Study area.
Buildings 13 01695 g003
Figure 4. The urban resilience intensity of the four cities in (a) year 2014 and (b) year 2020 compared with the evaluation criteria.
Buildings 13 01695 g004
Figure 5. Cyberspace resilience, comprehensive resilience, and evaluation criteria of Harbin in 2017.
Buildings 13 01695 g005
Figure 6. Cyberspace resilience, comprehensive resilience, and evaluation criteria of Changchun in 2017.
Buildings 13 01695 g006
Table 1. Evaluation index system of urban resilience.
TargetGuidelineCodeIndicator (Units)Sources
Physical SpaceRobustnessP110,000 people have paved road (10,000 square meters)[46,50,51,52]
P2Number of days to meet air quality standards (days)
EfficiencyP3Density of water supply and drainage network in the built-up area (km/km2)
P4Centralized sewage treatment rate (%)
ResourcefulnessP5Number of domestic air routes (No.)
P6Growth rate of fixed asset investment (%)
RedundancyP7Greening coverage of built-up areas (%)
P8The proportion of urban traffic trunk lines in the national traffic trunk lines (%)
AdaptationP9Urban construction and maintenance tax (million yuan)
P10Electricity consumption of 10,000 Yuan GDP (kWh/Yuan)
Societal SpaceRobustnessS1Registered unemployment rate (%)[17,53,54]
S2Per capita disposable income (yuan)
S3Number of health care institutions (pcs)
EfficiencyS4Number of doctors per 10,000 people (persons)
S5GDP growth rate (%)
ResourcefulnessS6Tertiary sector to GDP (%)
S7Growth rate of medical bed capacity (%)
RedundancyS8Urban basic pension insurance coverage rate (%)
S9Urban basic medical insurance coverage rate (%)
AdaptationS10Public finance revenue as a percentage of GDP (%)
S11Foreign trade dependence (%)
CyberspaceRobustnessI1Number of Internet broadband users per 10,000 people (households)[46,55,56]
I2Public library collection per 100 people (books)
EfficiencyI3Number of cell phones per 10,000 people (units)
ResourcefulnessI4Share of science and technology expenditure in fiscal expenditure (%)
RedundancyI5Research and experimental development expenditure as a proportion of GDP (%)
I6Growth rate of technology market contract turnover (%)
AdaptationI7Number of patents applied for by 10,000 people (pieces)
I8Number of students in general higher education schools for 10,000 people (people)
The indicators of P9, S1, and S10 are negative, and other indicators are positive.
Table 2. Evaluation criteria of urban resilience.
LevelsZoneParameter Characteristics (Ex, En, He)
Very poor[0.0, 0.2)(0.000, 0.103, 0.013)
Poor(0.2, 0.4)(0.309, 0.064, 0.008)
Qualified(0.4, 0.6)(0.500, 0.039, 0.005)
Good(0.6, 0.8)(0.691, 0.064, 0.008)
Excellent(0.8, 1.0](1.000, 0.103, 0.013)
Table 3. Weights of urban resilience evaluation indicators for four cities in Northeast China in 2014–2020.
CodeYear
2014201520162017201820192020
P10.03280.03060.03750.03030.03900.03490.0404
P20.02740.02930.03070.03130.03060.03300.0340
P30.03960.04560.02960.04170.03210.02830.0368
P40.02680.02660.02880.04490.02910.03270.0309
P50.02790.02810.03130.02970.03070.03410.0397
P60.04050.03560.05160.02740.02440.04580.0317
P70.02560.02910.02720.02690.02730.04270.0252
P80.02720.02890.03050.02820.02430.02680.0268
P90.02640.02650.02630.02550.02540.02580.0243
P100.05280.04060.03490.03270.04120.04080.0420
S10.03700.03060.03210.03480.02820.02790.0292
S20.02830.03180.03190.03320.03140.03300.0453
S30.04060.03610.02820.02710.03230.02930.0354
S40.02620.02690.02840.02990.02870.02870.0325
S50.03530.03880.03380.02720.03140.03410.0473
S60.04220.03450.03860.03820.03680.04110.0402
S70.03890.03430.03230.03340.02840.03090.0302
S80.03300.04080.03920.05400.05440.04830.0322
S90.03390.04020.04730.03210.03300.03100.0314
S100.03270.05050.04010.03450.03460.03460.0297
S110.02640.02770.02690.02650.02550.02700.0256
I10.04470.05090.05590.06040.06430.06460.0433
I20.03140.03000.03330.03230.03080.03170.0332
I30.02670.02960.03560.04030.04830.03000.0327
I40.04040.04300.03390.03760.04820.03800.0263
I50.03820.02870.02890.04330.02840.02960.0319
I60.05230.03020.02910.03530.03880.03170.0328
I70.02980.04170.04150.03220.03780.02710.0464
I80.03510.03290.03460.02930.03460.03660.0428
Table 4. Evaluation results of urban resilience of the four cities from 2014 to 2020.
YearHarbinChangchunShenyangDalian
2014(0.481, 0.321, 0.001)(0.497, 0.319, 0.001)(0.491, 0.325, 0.001)(0.503, 0.320, 0.001)
2015(0.476, 0.322, 0.001)(0.504, 0.321, 0.001)(0.494, 0.327, 0.001)(0.493, 0.322, 0.001)
2016(0.485, 0.322, 0.001)(0.507, 0.322, 0.001)(0.496, 0.323, 0.001)(0.496, 0.323, 0.001)
2017(0.479, 0.321, 0.001)(0.507, 0.319, 0.001)(0.504, 0.324, 0.001)(0.480, 0.323, 0.001)
2018(0.473, 0.322, 0.001)(0.507, 0.320, 0.001)(0.495, 0.322, 0.001)(0.496, 0.320, 0.001)
2019(0.485, 0.324, 0.001)(0.497, 0.318, 0.001)(0.505, 0.325, 0.001)(0.491, 0.320, 0.001)
2020(0.475, 0.325, 0.001)(0.498, 0.323, 0.001)(0.501, 0.326, 0.001)(0.490, 0.325, 0.001)
Table 5. Sub-space evaluation of urban resilience of four cities from 2014 to 2020.
YearCityPhysical SpaceSocietal SpaceCyberspace
2014Harbin(0.472, 0.247, 0.001)(0.492, 0.260, 0.001)(0.409, 0.242, 0.001)
Changchun(0.559, 0.251, 0.001)(0.491, 0.267, 0.001)(0.446, 0.218, 0.001)
Shenyang(0.490, 0.248, 0.001)(0.490, 0.279, 0.001)(0.489, 0.232, 0.001)
Dalian(0.461, 0.246, 0.001)(0.501, 0.267, 0.001)(0.538, 0.222, 0.001)
2015Harbin(0.468, 0.250, 0.001)(0.470, 0.257, 0.001)(0.391, 0.245, 0.001)
Changchun(0.549, 0.254, 0.001)(0.504, 0.263, 0.001)(0.469, 0.218, 0.001)
Shenyang(0.506, 0.254, 0.001)(0.495, 0.276, 0.001)(0.506, 0.236, 0.001)
Dalian(0.475, 0.247, 0.001)(0.503, 0.267, 0.001)(0.535, 0.222, 0.001)
2016Harbin(0.541, 0.252, 0.001)(0.455, 0.265, 0.001)(0.429, 0.229, 0.001)
Changchun(0.551, 0.250, 0.001)(0.480, 0.265, 0.001)(0.515, 0.220, 0.001)
Shenyang(0.452, 0.254, 0.001)(0.515, 0.263, 0.001)(0.492, 0.231, 0.001)
Dalian(0.483, 0.253, 0.001)(0.517, 0.269, 0.001)(0.488, 0.223, 0.001)
2017Harbin(0.503, 0.245, 0.001)(0.469, 0.263, 0.001)(0.369, 0.242, 0.001)
Changchun(0.509, 0.256, 0.001)(0.460, 0.264, 0.001)(0.589, 0.225, 0.001)
Shenyang(0.519, 0.252, 0.001)(0.544, 0.267, 0.001)(0.454, 0.235, 0.001)
Dalian(0.489, 0.246, 0.001)(0.498, 0.264, 0.001)(0.405, 0.244, 0.001)
2018Harbin(0.507, 0.248, 0.001)(0.465, 0.264, 0.001)(0.391, 0.236, 0.001)
Changchun(0.526, 0.259, 0.001)(0.473, 0.256, 0.001)(0.539, 0.219, 0.001)
Shenyang(0.498, 0.251, 0.001)(0.547, 0.268, 0.001)(0.436, 0.235, 0.001)
Dalian(0.505, 0.253, 0.001)(0.493, 0.262, 0.001)(0.479, 0.216, 0.001)
2019Harbin(0.504, 0.251, 0.001)(0.475, 0.268, 0.001)(0.436, 0.229, 0.001)
Changchun(0.471, 0.249, 0.001)(0.467, 0.258, 0.001)(0.548, 0.214, 0.001)
Shenyang(0.510, 0.257, 0.001)(0.550, 0.274, 0.001)(0.459, 0.227, 0.001)
Dalian(0.496, 0.245, 0.001)(0.497, 0.264, 0.001)(0.466, 0.219, 0.001)
2020Harbin(0.480, 0.253, 0.001)(0.449, 0.267, 0.001)(0.452, 0.233, 0.001)
Changchun(0.503, 0.262, 0.001)(0.501, 0.254, 0.001)(0.471, 0.229, 0.001)
Shenyang(0.510, 0.258, 0.001)(0.530, 0.266, 0.001)(0.453, 0.238, 0.001)
Dalian(0.463, 0.246, 0.001)(0.470, 0.275, 0.001)(0.525, 0.231, 0.001)
Disclaimer/Publisher’s Note: The statements, opinions and data contained in all publications are solely those of the individual author(s) and contributor(s) and not of MDPI and/or the editor(s). MDPI and/or the editor(s) disclaim responsibility for any injury to people or property resulting from any ideas, methods, instructions or products referred to in the content.

