Article

Seismic Performance of RC Moment Frame Buildings Considering SSI Effects: A Case Study of the New Venezuelan Seismic Code

Department of Civil Engineering, Universidad Católica de La Santísima Concepción, Concepción 4030000, Chile
*
Author to whom correspondence should be addressed.
Buildings 2023, 13(7), 1694; https://doi.org/10.3390/buildings13071694
Submission received: 12 June 2023 / Revised: 23 June 2023 / Accepted: 27 June 2023 / Published: 2 July 2023
(This article belongs to the Special Issue Advanced Design & Behavior of Concrete Structures)

Abstract

:
The Soil–Structure Interaction (SSI) effect has been widely evidenced during several earthquakes around the world. In the Venezuelan context, the seismic event in Caracas in 1967 showed the significant consequences of designing buildings without considering the SSI effect. Nevertheless, limited research on the seismic performance of concrete moment frames (commonly used as structural systems in office and residential buildings in Venezuela and Latin America) considering the SSI effects has been developed, although there have been continuous updates to the Venezuelan Seismic Code. In this research, the influence of the SSI on the seismic performance of RC moment frame buildings designed according to the New Venezuelan Seismic Code was studied. An extensive numerical study of 3D buildings using concrete moment frames supported by mat foundations on sandy and clayey soils was performed. The response spectrum method, non-linear static analysis, and non-linear dynamic analysis were used to assess the seismic response of the archetypes studied. The results show that SSI effects can have a significant impact on the seismic response of RC moment frame buildings, increasing the interstory drift ratio and decreasing the shear forces. As is shown in fragility curves, the probability of collapse increases for cases with flexible bases in comparison to the cases of models with fixed bases. Additionally, in the 24-story archetype, the fixed-base model reached a maximum probability of collapse. Finally, a new proposal for the reduction of the strength-reduction factor (R) must be incorporated into the Venezuelan Seismic Code to improve the safety of the structures. Limitations in the use of RC moment frames must be incorporated for high-rise buildings since, as the present work demonstrates, for high-period structures, the normative provisions are not reached.

1. Introduction

Reinforced concrete (RC) moment frames are a key part of the seismic resistance system widely used in Venezuelan buildings. According to [1], concrete moment frames are generally identified as an economical structural system that provides excellent stiffness and a large plastic deformation capacity under earthquakes [2,3]. The main goal of this system is to concentrate the seismic damage in the beams through ductile plastic hinges to avoid brittle failures and structural collapse. Furthermore, in a comprehensive numerical study of the seismic performance of concrete moment-frame buildings using non-linear static and dynamic analyses [4], it was demonstrated that for minor earthquakes, the system has an adequate ability to resist seismic forces and avoid major damage. On the other hand, for severe earthquakes, the weak column-strong beam behavior could result in a column experiencing sideways failure mode if the design and detailing are not appropriate. In addition, this study found that static pushover analysis reproduces comparable height-wise distributions of drift and element damage that appear in the dynamic response of the structure. Therefore, pushover analysis could be considered a useful tool for the seismic performance evaluation of concrete moment frame buildings. Nevertheless, the result of the seismic performance evaluation is highly dependent on the design and seismic provisions, material conditions, site effects, and numerical modeling considerations, making each assessment unique. In this sense, the seismic performance of concrete moment frames has been evaluated under several conditions of its materials, configurations, and reinforcements.
Research conducted by [5,6] evaluated the seismic performance of concrete moment frames reinforced with glass fiber-reinforced polymer (GFRP) bars designed according to ASCE 07 seismic loads using pushover analysis. The results found that a moment frame reinforced with GFRP bars always provided a greater load-carrying capacity, with an average of 13% greater capacity than a similar frame reinforced with steel bars. In addition, the frames were capable of providing ductility at 91% of their control frame, respectively. However, in these evaluations, only 2D structures were deemed, avoiding the torsional and site effects, as well as other uncertainties present in 3D structures.
On the other hand, an investigation conducted by [7] evaluated the performance of concrete moment frames with low-strength concrete using experimental tests on the shake table and non-linear numerical models. The results showed that a decrease in seismic performance levels was found in the frames with low-strength concrete, with significant join panel damages caused in the collapse prevision limit state. In addition, the use of low-strength concrete caused bond failures and a longitudinal bar slip, affecting the structural response. Nevertheless, this research was based only on a fixed two-story one-bay frame (2D models) plane, excluding 3D effects and site conditions in the performance evaluation. Similarly, [8,9,10] evaluated the seismic damage to concrete moment frames with high-strength concrete in 2D and 3D moment frames numerically and experimentally. For these studies, the results showed that high-strength concrete slightly increased the ductility and stiffness of the structural system and decreased the required longitudinal reinforcement. However, these investigations were focused on using specific design codes and analyzing collapse mechanisms without soil-site effect conditions.
The influence of standard provisions on the performance of concrete moment frames was evaluated by [11] through an experimental study. In this study, American, Japanese, Canadian, New Zealand, and European standards were evaluated by comparing standard stiffness with experimental lateral stiffness regarding a four-story, full-scale reinforced concrete building tested under multi-directional seismic motions on a shaking table. The results showed that the building stiffness degraded significantly as drifts increased, and the standard provisions produced more accurate stiffness estimates for frames than for shear walls. In general, the standards considered captured the building’s lateral stiffness with varying degrees of accuracy. Moreover, all standard stiffness values were higher than those of the building at the drift target of the standard that modified its seismic performance. However, the research results indicated that improvements in the stiffness provisions for concrete buildings of all investigated standards may be warranted, particularly for concrete shear walls, to guarantee a more accurate seismic performance.
Seismic performance evaluations for specific design codes have been widely carried out, as demonstrated by the studies developed by [12]. They evaluated the seismic performance of concrete moment frames designed according to Chinese code, showing that the concrete moment frame building designed by Chinese code provided the inelastic behavior and response intended by the code and satisfied the inter-story drift and maximum plastic rotation limits suggested by [13]. Similarly, Ref. [14] evaluated the strength-reduction factor of concrete moment frames in 2D designed according to the new Venezuelan seismic code using the non-linear pushover analysis. The study found that the strength-reduction factor suggested by the Venezuelan seismic code is higher than the value obtained statically for the archetypes analyzed. However, this study did not consider the site effects, foundation flexibility, and 3D effects present in the buildings, and time history analysis was not developed to evaluate the seismic performance.
Previously cited research showed how the pushover analysis provided a useful tool for identifying the plastic mechanism developed when the structure is subjected to large inelastic deformation. This information is not only useful for evaluating the seismic performance of the structure but could also help select seismic details that are more suitable for withstanding the expected inelastic deformations. Furthermore, standards and materials play a significant role in the expected seismic performance of concrete moment frame buildings and their performance levels. Nevertheless, simplifications are deemed in the analysis, which can introduce uncertainty in the seismic performance evaluation. The investigation conducted by [15] demonstrates how the explicit consideration of epistemic uncertainties in the process of the assessment of structural performance can lead to more accurate results. As part of these uncertainties, the assumption of a fixed base can underestimate the real flexibility of the system and the modification of the seismic response due to the soil–structure interaction (SSI).
Soil–structure interaction effects are defined as the modification of the structure base flexibility and ground motion modifications due to the presence of the soil-foundation system. This topic has been studied widely in a comprehensive literature review developed by [16]. This study denotes that traditionally the soil–structure interaction is beneficial to reduce the seismic base shear of a structure. In addition, it has been suggested that ignoring the soil–structure interaction in the design practice leads to a conservative design. However, observations from some past earthquakes evidence of the detrimental nature of soil–structure interaction in certain circumstances depending on structure-to-soil stiffness contrast; it may turn either beneficial or detrimental to structural response during a seismic event.
Several approaches to consider the inertial or kinematic soil–structure interaction have been proposed by investigations and provisions, using response spectrum modification, non-linear soil springs, impedance functions, and finite element method models. These methods allow for the incorporation of soil–structure interaction in the design, estimation of the inelastic response, and seismic performance assessment. Much of the current literature on soil–structure interaction pays particular attention to the effects of the soil–structure interaction when shallow foundations or piles are employed for the foundations [17] and its negative effect on the structural building response [18]. Other approaches have been focused on the soil, assessing the influence of the sandy soils in the soil–structure interaction [19] to explain that sandy soils amplify seismic waves on the soil–structure interface because of the soil–structure interaction effect. However, the main goal of this consideration is to evaluate the structural response and performance of the structures due to the soil amplification effects commonly considered by seismic standards in the design demand.
Several studies have identified the influence of soil–structure interaction on the seismic performance of concrete moment-frame buildings. The research conducted by [20] allows assessing the seismic behavior of an Australian building frame considering soil–structure interaction using a full non-linear dynamic analysis and finite element method to model the SSI. A 10-story concrete moment frame on shallow foundations was selected in combination with three soil types with a shear-wave velocity of fewer than 600 m/s, representative of soil classes Ce, De, and Ee according to the Australian standard. The results indicate that the performance level of the model supported on soil class Ce does not change substantially and remains in the life-safe level, while the performance level of the model resting on soil classes De and Ee substantially increases from the life-safe level to near collapse for both elastic and inelastic cases. However, this evaluation was limited to one 2D building archetype, and the use of Australian standards could not be representative of other countries.
The investigation developed by [21] analyzes the modification of the estimated seismic behavior of low-rise concrete buildings designed by Eurocode 8 due to the soil–structure interaction effect. The soil–structure interaction was considered by the application of a spring-dashpot-mass system at the basis of each vertical element for the case of footing foundations. For the other case of foundation, a spring-dashpot-mass discrete system was applied at the geometrical center of the mat foundation to represent the deformable soil. The results indicate that the inter-story drift increases due to soil–structure interaction, more for the case of mat foundation than for footings, modifying strongly the estimated seismic behavior of low-rise concrete buildings. Moreover, the research conducted by [22] studied two 20 and 30-story concrete moment frame buildings supported on piled raft foundations through time history analysis using seven earthquake records. Soil–structure interaction was deemed using the finite element method with solid elements. The results showed that the soil–structure interaction has a significant impact on the dynamic response of tall buildings, increasing it for both analyzed cases. Likewise, the study conducted by [23] demonstrates that for Italian reinforced concrete moment frames, the soil–structure interaction affects the seismic demand in terms of decreasing base shear and increasing maximum drift. However, in this research, the performance evaluation was only conducted using linear dynamic analysis, avoiding the estimation of the capacity and performance point of the structure and based on local design standards non-similar to Latin American standards.
On the other hand, the research conducted by [24,25,26] analyzes the seismic fragilities of non-ductile reinforced concrete moment frames considering the soil structure using 2D building archetypes. The results showed that soil–structure interaction has a significant influence on the fragilities compared to the fixed-base model, increasing the probability of exceeding a limit state of damage for the same acceleration. In addition, the difference in results obtained when considering linear or non-linear behavior of the soil was minimal for the coupled case in general. Additionally, when soil non-linearity is introduced, the SSI effects are generally expected to have a lower impact on the structure fragilities for higher levels of seismic loading. However, this research was limited to old buildings supported by shallow foundations placed on dense silty sand; thus, these results as limited to the study context. On the other hand, this research was based on the 2D typology of buildings being necessary for the development of new analysis, which includes a variety of concrete buildings and a variety of soil conditions. In this sense, the simplifications in the analysis of the soil–structure interaction could be considered without incurring significant differences in the analysis results.
In addition, recent studies [27] show that by changing values of subgrade reaction modulus (Ks) in foundation design, the effects of SSI on tall buildings can be considered automatically. Also, the soil–structure interaction can cause changes in the pattern of foundation settlement and foundation deformation. Moreover, numerical simulation of the seismic response of reinforced concrete buildings considering soil–structure interaction in liquefiable soil [28] has suggested that although liquefiable soil layers are present, the lateral displacement of the buildings is not generally sensitive to be increased for the thickness layer modification. In this sense, these results were limited to the proposed case studies. However, they may have interesting applications to design procedures and aid in the proposal of code provisions. Other more sophisticated methodologies, such as the application of Bayesian models in conjunction with finite elements for the analysis of soil–structure interaction [29], have been proposed and validated with good estimation results. Nevertheless, their existence does not limit the application of simplified methodologies that have served over the years for the consideration of soil–structure interaction in design codes; such is the case of the methodology proposed by [30,31].
As mentioned above, the soil–structure interaction effect is an important consideration that modifies the performance of the structure and, in some cases, can lead to a non-desire failure mechanism under earthquakes. Furthermore, several investigations have analyzed the influence of this effect on concrete moment frame buildings denoting that the effects produce a reduction of base shears due to soil effect dissipation and a drift increase due to the base flexibility incorporation. The drift increase can lead to no compliance with drift control specified in seismic provisions and generate damage to non-structural components [32,33]. In addition, the effect is highly dependent on the type of soil and foundation, being more significant on soft soils with isolated foundations. Moreover, these studies show the application of several methods to incorporate the soil–structure interaction in the assessment of seismic structural behavior, such as the finite element, springs on foundation, impedance functions such as damper springs couple, linear springs, and response spectrum. All these methods have been validated and tested with experimental tests, and their results, even the most simplified, have been successful. However, the estimation of the seismic performance of the building’s incorporating the soil–structure interaction is unique for each case because each evaluated structure is designed by a specific seismic provision and supported in a particular soil-foundation system.
On the other hand, in the Venezuelan context, few but significant earthquakes throughout the year have generated the necessity for updating the seismic and design code due to economic and life losses. Initially, the Caracas earthquake of 1967 provided the first lesson about the soil site effect, where the ground amplification increased the earthquake damage [34]. Furthermore, this earthquake demonstrated the lack of lateral load-resistance planes, an appropriate structural configuration, and detailing in concrete moment frames were determining factors in the poor performance under seismic loads [35,36,37]. Subsequently, the Cariaco earthquake of 1997 evidenced that the high percentage of damage in the center of Cariaco was attributed to the poor quality of the households combined with the presence of thick, poorly consolidated soils and, in some cases, to liquefaction phenomena [38]. In addition, the reinforced concrete moment frame structures collapsed due to the short column effects [39,40] and the lack of design and detailed attributes provided in the existing codes before the event [41]. In this sense, a new Venezuelan seismic code [42] has been recently released to incorporate all these lessons from past earthquakes, including the incorporation of the soil–structure interaction using the modification of the response spectrum method suggested by ASCE 7 [30]. The modification of the seismic performance of concrete moment frame Venezuelan buildings incorporating the SSI effect is not clear, especially regarding its seismic design factors and if the drift control still complies with the new Venezuelan seismic provision. On the other hand, the seismic performance of Venezuelan concrete moment frame buildings has not been evaluated after seismic code actualization.
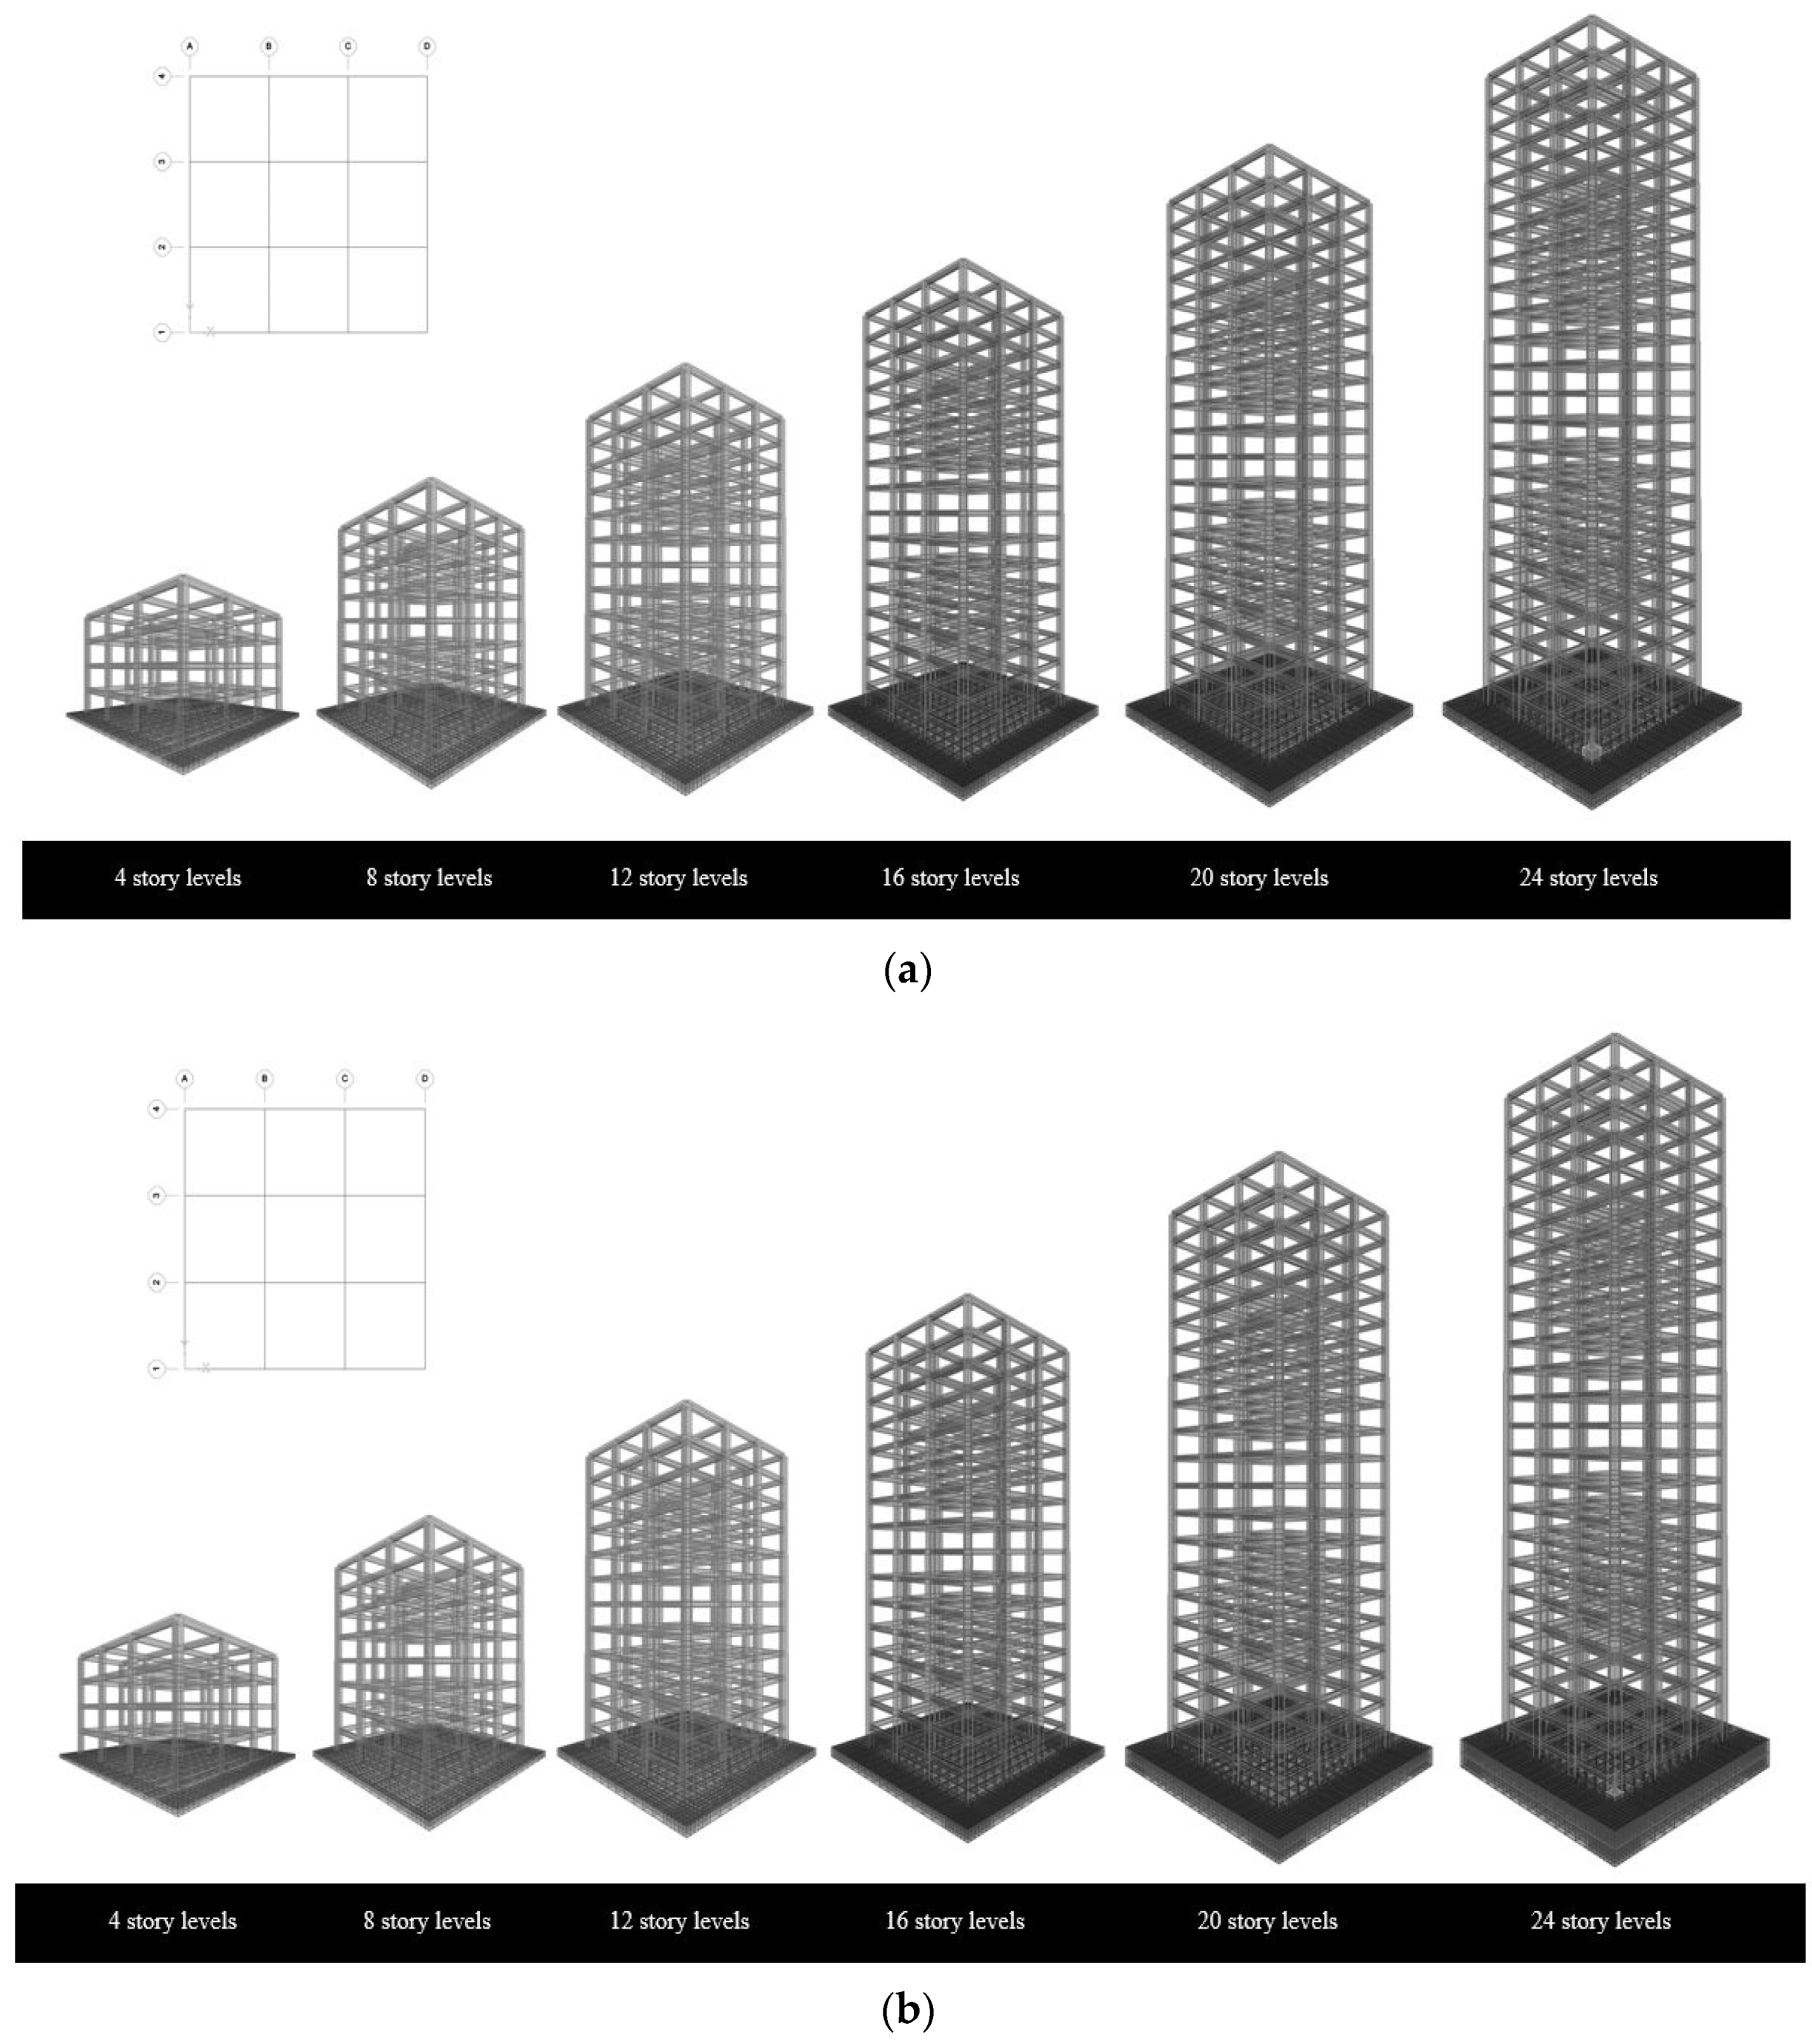
The aim of this research is to assess the influence of the soil–structure interaction on the seismic performance of concrete moment frame buildings designed according to the new Venezuelan seismic code located in the Venezuelan seismic zone with Ao = 0.3 g. In this research, 3D regular concrete moment frame buildings of 4-8-12-16-20-24 levels supported by mat foundations on sandy and clayey soils with shear wave velocity under 250 m/s are evaluated. Furthermore, the presence of a water table was not considered in this study, and the non-linearities of the soil were deemed directly from the shear modulus reduction until the final soil state after an earthquake. The response spectrum analysis is used to evaluate the design seismic response of the building. In addition, the non-linear pushover analysis is employed to evaluate the capacity and seismic design factors of the structures, determining the performance under Venezuelan seismic provisions, including SSI. Subsequently, these factors were compared with the proposed design factor established on the new Venezuelan seismic code to establish the influence of SSI in the design. Moreover, the non-linear dynamic analysis of the buildings under seven ground motions of strike-slip earthquakes is conducted to evaluate the seismic performance of the buildings according to recommendations of ASCE 41 [13] and FEMA P-58 [43]. Finally, results are reported and discussed in the next sections.

2. Design of Concrete Moment Frames Buildings

Generally, member sizes of concrete moment frames are estimated based on experience or serviceability requirements. Furthermore, architectural limitations may also have an impact on the cross-sectional dimensions of these members. It is common to go through many iterations before establishing reasonable member sizes. Once preliminary member sizes are obtained, seismic forces are determined, linear lateral analysis of the building is developed, drift requirements are checked, and member sizes are adjusted. The design process was based on current Venezuelan standards [42] for a design earthquake. Moreover, beam and column design is performed according to ACI 318-19 [44]. Consequently, the shear strengths of the joints are verified due to the behavior of the beam-column joints in the concrete moment frames affecting their overall integrity and performance.

2.1. Response Spectrum Analysis

The response spectrum analysis is a useful tool to obtain the seismic response of the buildings considering the contributions of all vibration modes. This analysis allows obtaining forces and displacements based on the seismic demand established on the provisions and are dependent on the strength-reduction factor (R). In this sense, the analysis is performed according to the new Venezuelan seismic code [42] for regular non-essential buildings located in Valencia, Venezuela, with Ao = 0.3 g and two types of soils, D and E. Furthermore, topographic conditions are assumed as low, and the depth of the rock basement is deemed as 80m. Figure 1 shows the elastic and inelastic response spectrums obtained for both types of soils in terms of spectral acceleration (Sa) and period (T), denoting how the demand increases for long-period structures with soil E but decreases for short-period structures.
Moreover, according to the Venezuelan seismic code [42], a strength-reduction factor R = 6 is established for special concrete moment frame buildings, assuming compliance with the specifications for the detailing of the reinforcement according to Chapter 18 of ACI 318 [44]. In addition to the intrinsic torsion’s effects, the additional torsion produced by displacing the center of mass in each direction and at each level were considered as an additional eccentricity of 6% to the dimension of the floor in a direction perpendicular to the analysis direction.

2.2. Archetypes and Numerical Model Description

In this research, 3D concrete moment frame residential buildings were deemed. The buildings are regular typical Venezuelan structures composed of three spans of six meters in each direction. Furthermore, six building height typologies were considered, 4, 8, 12, 16, 20, and 24, with a typical story height of 3.5 m. Commonly in Venezuelan structures, the most relevant buildings are designed from RC moment frame structures in office and residential buildings. Also, buildings greater than twenty-four stories can only be designed with shear walls. In this sense, the use of RC moment frames is limited to 24 stories, considering relevant structures from 4 stories. Figure 2 illustrates a schematic view of the 3D models adopted and their plane floor view.
The buildings were modeled using the SAP2000v24.2 [45] software using frame elements composed of two nodes with six degrees of freedom in each node. This element allows modeling the beams and columns as linear unidimensional elements joined by rigid joints. Furthermore, the base of the buildings was deemed as a fully restrained fixed base, and loads of the building were distributed along the beams. The materials deemed in this research are composed of a concrete compression strength of 25 MPa with an elasticity modulus of E = 24,000 MPa and a rebar steel 60 grade with E = 200,000MPa for all models. In addition, the second-order effects were deemed with P-delta plus large displacement analysis, and cracked stiffness was considered for the beam and column elements to comply with the recommendations established on ASCE 41 [13]. Moreover, to achieve a strong-column/weak-beam behavior in the design, a full rigid offset length was modeled in columns, and no rigid offsets were modeled in the beams.
Loads of the structure are given from the self-weight dead load, including a ribbed one-direction slab with a thickness of 0.25 m (3 kN/m2). Additionally, the self-weight dead loads were taken at 3.6 kN/m2 for floors and 1.2 kN/m2 for the roof, equivalent to electrical, plumbing, masonry, and miscellaneous dead loads. The live load (unreduced) considered a residential building of 3 kN/m2 for the floors and 1 kN/m2 for the roof. Furthermore, the seismic mass source was deemed as 100% of dead loads and 50% of live load according to [42] for residential buildings. Finally, two types of soils were considered with a shear wave velocity (Vs) of 126 m/s and 236 m/s, whose strata are described in Section 3.1.

2.3. Results of Design of Concrete Moment Frames Buildings

In order to establish similar evaluation conditions, the design of the members of the archetypes was unified at the same section size and steel requirement for both soil conditions. In this sense, a single building that meets the seismic provisions for both types of soil was obtained for each archetype. Following the design requirements established on ACI 318 [44] and COVENIN 1756-1 [42], the size of the elements and their longitudinal and transverse reinforcement is recounted in Table 1.
In addition, the inelastic design drift (amplified by Cd) and base shear are shown in Figure 3 for both types of soils, denoting that all of them comply with the drift limit established by the Venezuelan seismic code [42]. Moreover, the design base shear for all archetypes shown in Figure 4 follows a tendency to increase with the fundamental period, which agrees with a linear tendency, as mentioned in ASCE 41 [13].
A special detail that the previous figure shows is how the design demand for soil D is higher than for soil E despite the amplification soil effect existing in soil E. This observation is due to the correction needed to comply with the minimum seismic coefficient established in [42], which depends on the ground acceleration coefficient (AA) and the strength-reduction factor (R). In this sense, the new Venezuelan seismic code [42] establishes a ground acceleration coefficient greater for soil D than for soil E because the amplification effects are mainly evidence for long-period spectral acceleration.

3. Soil–Structure Interaction Approach

In this research, the effects of the soil–structure interaction are deemed using mat foundations sited in two types of soils. Furthermore, the ASCE 7 [30] approach and the flexible base approaches are employed to evidence the soil–structure interaction. These approaches are selected because the ASCE 7 method is employed as mandatory of the new Venezuelan seismic code to consider the soil–structure interaction effects. Furthermore, the ASCE 7 method calculation, although it mainly considers the kinematic SSI effects, implies the estimation of the fundamental period of the structure with a flexible base. In this sense, the selection of non-linear compression springs is computed according to FEMA P2091. Nevertheless, both documents, ASCE 7 and FEMAP2091, do not specify limitations to the application of their methodologies based on soil and type. In this sense, in this section, soil considerations, foundation design, modified SSI spectrum, and results of elastic analysis, including SSI, are presented.

3.1. Soil Profiles Characterization and Assumptions

Soil–structure interaction requires the definition of geotechnical parameters to describe the dynamic behavior of the soil. In this sense, two types of soils with common geotechnical and geophysical properties based on [46,47,48,49,50,51,52,53,54,55] are assumed to be analyzed in this research to evidence the soil–structure interaction effects under these scenarios. Table 2 shows the necessary soil properties employed in this research for soil–structure interaction estimations.
Based on these properties, mat foundations were designed using the conventional rigid method [56,57] and SAFEv20.3 software [58]. The design includes the verification of admissible soil capacity, shear stress, load punching check, and flexural reinforcement design. Table 3 and Table 4 show the result of the foundation design in terms of the geometry of the foundation, its reinforcement, and maximum soil stress for each archetype and soil, respectively. In this table, B is the base, L is the length, e is the thickness, and Df is the depth of the foundation below the ground. Furthermore, Astop and Asbottom are the top and bottom rebar steel reinforcement of the foundation. Moreover, these tables evidence how for soil E, the admissible soil capacity is less than soil D according to soil-foundation properties. Nevertheless, the design obtained for mat foundation supports in soil D is more flexible than the one obtained in soil E due to the necessity of a higher thickness of the mat foundation for soft soil type E.

3.2. Flexible Base Approach

The soil–structure interaction estimation requires the determination of the behavior of the structure with a flexible base because it is necessary to consider the change in the dynamic behavior in comparison with the fixed-base assumption. In this sense, the ratio between fixed-base to flexible-base period allows computing the radiation damping reductions. On the other hand, ASCE 7 [30] establishes that all elements of foundation flexibility must be considered, including horizontal, vertical, and rotational foundation and soil stiffness. Therefore, for the flexible-base analysis, it is necessary to include vertical springs under the mat foundation, as well as lateral springs, which represent the resistance to sliding due to passive pressure on the foundation face and friction at the bottom of the slab. Vertical springs were estimated according to method 3 described in ASCE 41 [41], considering a shear modulus degraded by seismic action to values shown previously in Table 2. In addition, these values are computed with an upper and lower limit of 50% additional and less than the original value established by ASCE 7 [30] to determine the flexible period. The lateral springs are very stiff and do not significantly affect the behavior for this kind of foundation, but the vertical springs under the mat foundation produce a rotation of the entire structure and its foundation and the primary mode of behavior. Furthermore, the FEMA P2091 [31] mentions that the non-consideration of lateral springs represents a more conservative estimate of the soil–structure interaction; in this sense, they are not considered in the present study. The development of the flexible model was carried out in SAP2000 [45] using a shell element as the mat foundation and a shell element supported on compression springs. The use of these compression springs allows considering the soil as not working on tension and shows soil pressures in a non-uniform behavior, as is common in cases of lateral loads. Figure 5 illustrates a schematic view of 3D models with flexible bases for both types of soils, denoting the results obtained for the thickness of the mat foundation in soil E, which is greater than soil D.
The main goal of the flexible base model is evidence of the inertial soil–structure interaction effect due to soil-foundation system stiffness. Hence, the modification of the modal properties is of special interest for the calculations. In this sense, Figure 6 shows the results of the fundamental period on a flexible base compared to the fixed base, with its upper and lower limits. An increase in the flexible base period is evidenced for all cases, particularly in high structures located on soil E, where the increases reached up to 12% of the value on a fixed base.

3.3. ASCE 7 Approach

Determination of the seismic design forces of the structure and its seismic design displacements is permitted to consider the effects of soil–structure interaction by Chapter 19 of ASCE 7 [30]. In this chapter, the modification of the general design response spectrum includes the effects of kinematic interaction of soil–structure interaction using the BSSI factor for damping ratios different from 0.05. In this sense, the foundation-damping effects are introduced through the direct incorporation of soil hysteretic damping and radiation damping, which are introduced by computing the effective viscous damping ratio of the soil–structure system in accordance with ASCE 7 [30].
The estimation of the soil hysteretic damping depends only on the site class and the value of the maximum site spectral acceleration (SDS); this value is taken directly from Table 19.3.3 of ASCE 7 [30]. On the other hand, the calculations of radiation damping are considerably more complex because several parameters of the soil, foundation, and structure are required. The initial parameters referred to the soil at the site are the shear wave velocity and the soil density, computing the effective shear wave velocity using Table 19.3-1 of ASCE 7 [30] for the soil hysteretic damping ratio. Consequently, the soil shear modulus at small strain (Gmax) is computed, as shown in Table 2, and is reduced to the effective shear modulus derived from the deformations imposed in the soil by the seismic actions. Table 19.3-2 of ASCE 7 [30] represents a simple way to estimate this reduction from an approximation based on Gmax; however, in this research, the effective soil shear modulus is taken arbitrarily based on the [55] study.
Several calculations based on the period-lengthening ratio ( T ~ /T) between the flexible-base period and fixed-base period, foundation plan dimensions, system ductility, and soil parameters are developed to estimate stiffness, damping rations, and other parameters needed to estimate the effective viscous damping ratio and BSSI. The summary of these calculations for each archetype and soil type is listed in Table 5.
On the other hand, the modified response spectrum obtained for the 4 Story archetype is shown in Figure 7 for each type of soil as an example of the modified spectrum obtained. These modified response spectrums represent the effect of kinematic soil–structure interaction on the reduction of the design demand. Furthermore, Table 5 shows how the spectral adjustment factor (BSSI) decreases as the period increases, denoting kinematic effects that are not relevant for design response estimations in soil D. Nevertheless, for soil E, even though the tendency is similar, the BSSI factor is greater and more important for short-period structures.

3.4. Results of Design Response with SSI

The results in terms of drift and base shear were obtained through the response spectrum analysis, checking the deformation of the compression springs to ensure the behavior is only compression and not traction. In this sense, a comparative analysis was developed considering four cases of analysis varying the soil–structure interaction consideration:
  • Fixed base with original design response spectrum (no SSI effects);
  • Fixed base with modified response spectrum with SSI (kinematic SSI effects);
  • Flexible base with original design response spectrum (inertial SSI effects);
  • Flexible base with modified response spectrum with SSI (inertial and kinematic SSI effects).
These cases allow evaluation of the influence of soil–structure interaction according to a specific behavior with kinematic or inertial interaction effects. Finally, 48 models were developed to analyze the design response with SSI. Figure 8 illustrates the variation of the design base shear with the period for all cases previously mentioned, denoting the fixed-base model as the more serious condition to design in terms of the strength of the elements. Moreover, for structures with a period of fewer than 1.5 s in D and E soil, the inertial SSI effects have not been relevant compared to the fixed-base cases with variations up to 2.62%. On the other hand, kinematic interaction has a significant impact on the variation of the design base shear, reducing it to 31.03%. This higher variation could lead to an uncomplying of minimum design base shear and minimum seismic coefficient, according to [42]. However, for structures with periods up to 2.0 s, the variations found were less than the order of only 10% for the kinematic effect and only 2.1% for the inertial effect.
Similarly, a comparison between the four cases of analysis in terms of drift is shown in Figure 9 for each archetype developed. For all cases, the design drift limit is still in compliance with [42]; however, an increase in the drift is shown when the flexible base is deemed special to soil E. This is due to the fact that the flexible base causes an increase in the system flexibility allowing the structure to be more deformed by the seismic demand. Furthermore, the reduction in the drift due to the kinematic SSI effect is higher for structures located in soil E because the seismic demand is highly reduced. Finally, although all displacements are increased by the inertial interaction effects, the drifts were mainly increased in the top stories and decreased in the bottom stories for high levels archetypes. Nevertheless, in most archetypes, the drifts were increased more uniformly along the high.

4. Non-Linear Static Analysis

The non-linear static analysis is performed in this section to evaluate the seismic performance of the structures, obtaining their capacity to several levels of demand as suggested [30]. In this sense, the structure capacity curve is obtained by applying a static load pattern as lateral forces in proportion to the distribution of mass of each floor diaphragm. Hence, the vertical distribution of these lateral forces is proportional to the shape of the fundamental vibration mode in each analysis direction. These loads are monotonically increased until the structure collapse mechanism is achieved. Finally, from the seismic demand and the capacity curve obtained, seismic design parameters (R, μ) are obtained, as well as the expected structural response from the performance point according to ASCE 41 [13] and the spectrum capacity method of ATC40 [59].

4.1. Numerical Model

The non-linear response of the buildings is the result of the interaction between the material non-linearity effect, the effects of geometry non-linearities, and environmental effects such as soil–structure interaction. In this sense, the force-displacement behavior of all components is included explicitly using full backbone curves that include strength degradation and residual strength through plastic hinges. These plastic hinges are defined as a concentrated inelastic incursion in the members and are validated and allowed by ASCE 41 [13]. For the columns, hinges consider P-M2-M3 interactions (axial and biaxial moment for 3D models), and for the beams, moment-rotation relationships according to ASCE 41 [13] were considered. Moreover, P-delta effects were deemed in the analysis to solve the equilibrium equations in deformed conditions. In addition, the control node was located at the center of mass at the roof story of the building, and a load pattern proportional to the fundamental model shape was applied according to [41,59]. Concrete moment frames buildings with 4, 8, 12, 16, 20, and 24 stories were developed considering fixed and flexible base for two types of soils to obtain a total of 18 models evaluated by two spectral conditions (with/without kinematic SSI).

4.2. Results of Pushover Analysis

The resulting capacity curves for all archetypes of buildings are shown in Figure 10. These capacity curves show similar features instead of a flexible base being considered with ductile behavior for all models. Initially, the curves exhibit an elastic behavior with a sight loss of stiffness for flexible models until the inelastic incursion starts where the post-yielding stiffness is similar. Furthermore, an increase in the ultimate displacement is shown in some archetypes due to the increase of base flexibility special for soil E. Regarding the structure capacity, no variations were found for the study cases for the maximum resistance; however, the beginning of inelastic incursion occurs for a lower base shear for flexible base cases. Moreover, due to P-delta effects, almost all models showed a negative post-elastic stiffness in their pushover curves after large displacements. However, 8 and 12-story models suffer collapse to less displacement due to a premature failure of the structures.
In addition, the collapse mechanism is shown in Figure 11 for all archetypes in fixed and flexible bases. Figure 11 shows a sideline referring to the level of damage to the plastic hinge according to the acceptance criteria of ASCE 41 [13]. The gray color refers to the performance level of immediate occupation (IO), the green color refers to the performance level of life safety (LS), and the blue color refers to the performance level of collapse prevention (CP). Above this limit, it is understood that the structural element collapses and is denoted with a red color. In this sense, a ductile collapse mechanism represented by concentrated plastic hinges in the beams is shown for most models, even with SSI. Moreover, plastic hinges in the base of the columns are illustrated as typically expected for a moment frame subjected to lateral loading. However, for high-story models with SSI in soil D, an increase in the damage of the plastic hinges of the base in the collapse mechanism is denoted. Similarly, for the 4 stories archetype, there is an increase in beam damage when SSI is considered for both soil types. Denoting the soil–structure interaction, although it leads to a greater deformation capacity of the structure, the collapse mechanism can be modified by it.
After the development of capacity curves according to the ASCE 41 [13] procedure, the seismic design parameters are obtained in terms of ductility (μ), overstrength factor (Ω), and strength-reduction factor (R). In that regard, the strength-reduction factor (R) is computed as R = Rμ × Ω. The Ω is the overstrength of the structure obtained from the maximum shear divided by the design shear, and the ductility factor Rμ is the elastic shear divided by the maximum shear. Moreover, the ductility factor μ = du/dy was obtained by dividing the maximum displacement (du) by the yield displacement (dy) from the linearization of the capacity curve. Table 6, Table 7, Table 8 and Table 9 show a summary of these parameters and the performance point computed according to ASCE 41 [13] and ATC 40 [59] for all archetypes analyzed according to the cases established in Section 3. The tables show how the elastic shear is reduced by the kinematic SSI effects due to the reduction in the demand response spectrum. These effects are related to the reduction in the demand response spectrum, which refers to the variation of ground motion intensity at different periods. Furthermore, kinematic SSI effects respond to the ground motion intensity modification due to the damping provided by the soil-foundation system. In this sense, the seismic forces acting on the structure are reduced by the additional structural damping given from the soil-foundation system, and therefore the shear force will be lower, as the studies carried out by [60,61] suggest. Moreover, the strength-reduction factor is slightly affected by inertial SSI and the combination of inertial and kinematic effects. This suggests that the presence of SSI affects the estimation of the structural strength of Venezuelan concrete moment frame buildings. However, the isolated effect of kinematic interaction in low-story structures reduces the strength-reduction factor due to the Rμ reduction.
Figure 12 illustrates how the performance point is estimated through the spectrum capacity method of ATC 40 [59]. The use of the reduced demand response spectrum by kinematic SSI effects and the pushover spectrum capacity curves with and without inertial effects are deemed. The figure is denoted in terms of spectral acceleration (Sa) and spectral displacement (Sd), as [59] states. This figure shows how the performance point defined by the intersection of both spectra has no variation due to inertial SSI effects. However, reducing the demand spectrum given by the kinematic SSI effects reduces the performance point of the structure, especially for type E soils.
Moreover, a comparison between each overstrength factor, strength-reduction factor, ductility, and performance point is shown in Figure 13, Figure 14, Figure 15 and Figure 16 for all archetypes and cases. Regarding the overstrength factor, no significant variations were found in soil D and E for high-period structures. However, an increase in overstrength factor is denoted for a short-period structure due to the kinematic SSI effect because of the design shear reduction for the same structure’s maximum capacity. Also, the strength-reduction factor is reduced only slightly by the inertial SSI effects, regardless of the period and height of the structure. Hence, no SSI effect or kinematic SSI have too similar a R. This low reduction effect is due to the simultaneous reduction of the design shear and the elastic shear of the structure when subjected to less demand, keeping Rμ and Ω. On the other hand, the ductility of the system decreases as the period of the structure increases and is increased by inertial SSI effects. This is denoted, especially for short-period structures where the decrease in the base stiffness favors the displacement capacity of the structure.
Furthermore, the performance point is normalized between the structure yield displacement to unify the evaluation. Figure 16 denotes how the soil–structure interaction decreases the performance point as the inertial and kinematic effects are incorporated. Soil D exhibits fewer differences between the results obtained; however, for soil E, higher reductions are shown, especially for a short-period structure. In addition, for most cases, the performance point is over the yield structure point, which denotes that all structures have inelastic deformations under a design earthquake. Kinematic SSI has more impact than inertial SSI in the reduction of the performance point, taking it until the point of elastic behavior for low structures. Nevertheless, the combination of kinematic and inertial SSI is more critical for high structures. In this case, there is a reduction of the performance point due to these effects; however, it is to a low extent compared to the original system. Finally, the values obtained by the spectrum capacity method are lower than the values obtained from the coefficient method of ASCE 41 [13].
The new Venezuelan seismic code [42] establishes several seismic design parameters and story-level limitations for the structural earthquake-resistant system employed in the buildings. For the concrete moment frame, no story level limitations are specified for the present case of study where the seismic intensity is greater than 0.2 g. The overstrength factor (Ω) for RC moment frames according to the new Venezuelan seismic code [42] is 3. However, the result of the non-linear static analysis shows values up to 3 for short-period structures and lower than 2 for long-period structures. The effects of SSI on the overstrength factor are slight, so they do not significantly affect reaching the normative value. On the other hand, the displacement amplification factor (Cd) can be compared with the ductility of the system, and for structures with periods less than 1.5s, the value is greater than 4.5, which is the specified value of [42]. Nevertheless, for structures with periods up to 1.5s, the normative value is not reached, denoting the structures have less deformation capacity. Furthermore, SSI imposes an increase of this value for short-period structures and a slight decrease for long-period structures, but in both cases, the effects of the SII do not condition reaching the normative value. Finally, referring to the strength-reduction factor (R) normative design value according to [42], the result is 6, and for any archetype, the system reached this value regardless of the SSI effects. Conversely, SSI effects further reduce this value, denoting that the specified normative value might not be conservative enough to warrant a safe design. It may be necessary to make a new estimate of the seismic design factors considering the SSI effects, suggesting, for example, a strength-reduction factor (R) of 4, which is evidently reached for most of the archetypes even considering SSI effects.

5. Seismic Performance Evaluation

In this research, the seismic performance is carried out using the non-linear dynamic analysis based on FEMA P-58 [43] and ASCE 41 [13] recommendations. The performance is evaluated in terms of inter-story drift, story shear, and failure mechanism of all archetypes. Furthermore, the performance levels are evaluated according to the demand imposed by [42] for frequent, design, and extreme considered earthquakes defined from the exceedance probability in 50 years. These performance levels are assessed with acceptance criteria adopted according to the Venezuelan seismic code [42]. Finally, simplified non-linear analysis (SPO2IDA) is employed following the recommendations of FEMA P-58 [43] to approximate incremental dynamic analysis results, which can be used to generate collapse fragility curves.

5.1. Non-linear Dynamic Analysis

The iterative Newton–Rapson method is employed to perform the non-linear dynamic analysis considering the direct time integration. The buildings of these analyses are modeled and assessed as three-dimensional assemblies of components, including the foundations, and considering soil–structure interaction effects for evaluations as established by FEMA P-58 [43]. Section 4.1 details how the modeled components include the non-linear representation of force-deformation behavior, with frame elements with concentrated plastic hinges as FEMA P-58 [43] and ASCE41 [13] allowed. These models include cyclic degradation characterized by loss of strength and negative stiffness occurring within a single cycle. In addition, P-delta effects and gravity loads based on expected dead and live loading are deemed.
Moreover, seven seismic records with two horizontal components are deemed according to the minimum requirements of FEMA P-58 [43] because vertical shaking is not a key contributor to earthquake damage and has little impact on seismic performance [43]. In this sense, strike-slip earthquakes are considered for the analysis due to the characteristics of the tectonic faults in Venezuela, which commonly originate from this type of earthquake. However, due to the complexity of obtaining seismic records of Venezuelan earthquakes, strike-slip seismic records from other countries are used to complete the minimum requirement of FEMA P-58 [43]. Table 10 describes the characteristics of selected ground motions.
Further, the response spectrum of the seismic records was determined using the Nigam, N. and Jennings, P. method [60], and the median of these spectrums was obtained. This procedure is developed to scale the selected seismic records to the maximum considered earthquake (MCE) as FEMA P-58 [43] set by the non-linear dynamic analysis. For this purpose, the intensity at MCE was evaluated using the extreme earthquake established in the Venezuelan seismic code [42], where the level of seismic movement of the ground has a 1.5% probability of being exceeded in a period of 50 years for the B2 importance group. Details of the MCE for each type of soil, total response spectrum, and median spectrum are shown in Figure 17.
FEMA P-58 [43] suggests that when the spectral shape of selected motions matches the target spectrum well, relatively few records can provide a reasonable estimate of the median response over building height. Figure 17 illustrates how most of the selected records have a similar match with the MCE and within themselves. Regardless of the setting, at least seven pairs of ground motions can be used.

5.2. Results of Non-Linear Dynamic Analysis

Figure 18 shows the results of the non-linear dynamic analysis regarding maximum and minimum drift. In addition, the expected drift limit for frequent (SE), design (de), and extreme (ME) earthquakes according to [42] are shown. This figure illustrates how the obtained drift on soil D for a four-story model is more significant than soil E. Both cases are greater than the fixed base case, especially for the Turkey earthquake, where the drift is even over the MCE drift limit. Moreover, in a fixed base, most of the seismic responses for other earthquakes are within the MCE drift limit. However, when SSI effects are present, most seismic responses are out of the expected MCE drift limit and less for non-Venezuelan earthquakes.
Furthermore, a notable increase in first-story drift is shown for the models, which could indicate a soft-story failure mechanism. Likewise, a similar behavior for 8-story and 12-story models was obtained, mainly for the Turkey and Centro earthquakes, where the structural collapse was reached for all cases. In this sense, the performance of the buildings could not be satisfactory according to the performance objectives for earthquakes of these magnitudes and frequency contents; the opposite point of what happens for earthquakes such as Cariaco, Imperial Valley, and Northridge, where the dynamic drifts are within the expected design limits, avoiding the collapse of buildings.
On the other hand, for high-rise buildings of 16-story, 20-story, and 24-story, the soil–structure interaction effects in models supported on soil D reduce the dynamic drift response. However, lower stories show a slight increase in the drift for structures supported on soil E. In addition, structural collapse is reached for Turkey and Centro earthquakes and the Managua earthquake, similar to low-rise buildings, by a soft-story failure mechanism. Nevertheless, plastic hinges are initially formed in beams and later in columns. In this sense, although soil–structure interaction causes a more unfavorable seismic performance, the collapse mechanism did not change.
Moreover, the response in terms of maximum dynamic base shear is shown in Figure 19, denoting a significant decrease in the base shear due to soil–structure interaction effects, special to soil E. Nevertheless, instead of the structure members being less solicited, the inter-story drift plots’ suggests that the elements’ plastic deformation increases as their capacity and performance decrease. In addition, if soil–structure interaction is deemed, the minimum base shear specified in [42] could not be satisfied.

5.3. Simplified Non-Linear Analysis (SPO2IDA)

FEMA P58 [43] allows the simplified non-linear analysis to determine the collapse acceleration as incremental dynamic analysis approximation. This methodology was developed by [62] and based on the non-linear static analysis to identify the sequence of components yielding to a deformation at which collapse is judged to occur. In this sense, it uses static pushover analysis (SPO) results and a library of empirical fitting coefficients for the different branches of the idealized SPO backbone. Thus, it permits the quantification of structural performance up to structural collapse as a function of seismic intensity simply and efficiently [63].
This methodology has been developed mainly for ductile structures that can be sufficiently represented by a pushover curve with a certain ductile post-yield hardening followed by a post-peak degradation. This behavior is quite representative of ductile concrete and steel moment frame buildings and has resulted in the tool being widely adopted. Figure 20 illustrates an example of the application of the SPO2IDA tool [63], where the spectral acceleration of the vertical axis is in terms of SDOF yield acceleration and a transformation factor (Γ) for a 4-story model supported in soil D. This spectral acceleration is obtained by each percentile of 16%, 50%, and 84% to decrease the uncertainty of the approximation. In addition, the horizontal axis expresses the ductility of the structure; hence, the collapse acceleration can be determined using the ductility computed in the non-linear static analysis.
Table 11 summarizes the SDOF yield acceleration, computed collapse acceleration, and the determinate collapse margin. The 50% percentile was deemed to collapse acceleration calculations because the FEMA P-58 [43] established a median collapse intensity as the collapse intensity. The results illustrate that a higher strength-reduction factor than considered initially by [42] is needed to achieve a successful performance. Furthermore, the soil–structure interaction effects show decreased collapse acceleration and structural performance due to the base flexibility.
Moreover, the results indicate that the application of [63] seems to not be representative of the performance of tall buildings in this case for the 16 and 20-story models, where the collapse accelerations, especially in soil D, do not seem to be consistent with the results obtained for the non-linear static and dynamic analysis. Figure 21 shows the collapse fragility curves considering an uncertainty βTR equal to 0.6, as FEMA P-58 [43] suggests, denoting how soil–structure interaction decreases the seismic performance, especially in soft soils such as E. However, for 12 and 16-story models, a reduction of the collapse probability is denoted. Finally, the results of fragility curves for 20 and 24 stories do not follow a clear tendency in their behavior that allows conclusions about them. On the other hand, the fragility curves for 20 and 24 stories models in soil D were obtained from the SPO2IDA tool, where the median collapse acceleration obtained does not follow a clear tendency in the structural behavior as the other archetypes. Therefore, this article is not a representative result, and other methods, such as IDA, are necessary to obtain the median collapse acceleration and a new fragility curve.
Finally, the result of this research follows a similar tendency with previous research detailed in Section 1, even though the context of the studies is different. Similarly to the results obtained in [19,20,21], an increase in the inter-story drift is denoted for both scenarios of soil types analyzed. Likewise, a decrease in the base shear is shown similar to the results obtained in [23,61] due to the flexibility given from inertial effects and the additional damping from kinematic effects. Regarding the performance evaluation, the investigations developed by [24,25,26] based on non-ductile RC moment frames showed an increase in the collapse probability of the fragility curves by incorporating inertial SSI effects. In the present research, this effect is evidenced for RC moment frame buildings instead of the buildings designed as ductile, and different foundation systems are employed. Compared with previous studies, the present study shows that seismic design factors differ from the nationally and internationally recommended normative values when SSI is present. Therefore, the seismic performance of RC moment frames in Venezuela and Latin America may require more stringent design assumptions.

6. Conclusions

In this research, the influence of the soil–structure interaction in terms of design response and structural performance was assessed for six archetypes of 3D buildings designed according to the new Venezuelan seismic code. Numerical models were developed using SAP2000v24.2 software, and foundations were designed using SAFEv20.3 software supported in soils type D and E regarding seismic code. In this sense, inertial soil–structure interaction was deemed using an explicit model of the mat foundations supported on non-linear compression springs, and kinematic SSI was considered using the ASCE-7 method. Furthermore, response spectrum analysis was employed to determine the design response; posteriorly, non-linear static and dynamic analyses to evaluate the seismic performance following the recommendations of FEMA P-58 for a fixed base and flexible base for both types of soil were used. The main conclusions of this study are listed as follows:
  • The flexible foundation models evaluated using spectral modal analysis reached higher drifts than the rigid foundation models. This is due to the flexibility induced by the foundation system at the base. However, the stresses are lower when the flexible foundation is considered; therefore, it is recommended that the designs be performed with a rigid foundation and the drifts verified with a flexible foundation;
  • A maximum reduction of the design base shear was around 6.36% for the 4 stories archetype due to kinematic SSI effects. However, this reduction decreases as the period of the structure or story levels increases, reaching average reductions of 1.5%; a few kinematic effects were significant for design purposes;
  • The capacity curve in flexural base models achieved a slight reduction in strength and stiffness compared to rigid base models. However, the performance point in the flexural-based and rigid-based models without demand reduction due to inertial interaction reached very similar values. On the other hand, the models considering the demand reduction proposed by ASCE reached a better performance point due to the effects of kinematic interaction;
  • The flexible-based models subjected to earthquakes scaled to the MCE reached drifts much higher than those established in the Venezuelan seismic code. Even fixed-base models reported drifts greater than the normative drift for the Managua and Turkey earthquakes in the case of high-rise buildings. Therefore, it is not possible to avoid collapse mechanisms in the archetypes evaluated for these earthquakes;
  • The fragility curves using SSI effects show that the probability of collapse increases compared to the cases of buildings analyzed with a fixed base. However, for the 24-story archetype, the fixed-base model reached a maximum probability of collapse;
  • The collapse mechanisms in the archetypes with fixed and flexible bases developed plastic hinges in beams mainly and, in very few cases, hinges in columns, the latter for the Turkey and Managua earthquakes. Therefore, the use of SSI does not affect or modify the failure mechanisms of the structure;
  • In comparison with previous studies where footing foundations were analyzed, this study demonstrated that the SSI effects could be mitigated when mat foundations are employed;
  • The authors consider necessary a clear procedure for verification of the drift story ratio SSI. However, for design members, a fixed base model is more conservative and safe because greater design forces are obtained;
  • A new proposal for the reduction of the strength-reduction factor (R) must be incorporated into the Venezuelan seismic code to improve the safety of the structures. Limitations in the use of RC moment frames must be incorporated for high-rise buildings since, as the present work demonstrates, for high-period structures, the normative provisions are not reached;
  • Soil–structure interaction considerations must be considered mainly in terms of inertial interaction for design purposes so that maximum amplified deformations can be controlled;
  • Other structural systems, soil types, water conditions, pile foundations, irregular structures, and explicit finite element soil models could be incorporated to analyze the effects of SSI in Latin American buildings, as suggested for future research.

Author Contributions

Conceptualization, R.M. and E.N.; methodology, R.M.; software, M.H.; validation, R.M. and E.N.; formal analysis, R.M.; investigation, R.M.; resources, E.N.; data curation, R.M.; writing—original draft preparation, R.M. and E.N.; writing—review and editing, R.M. and C.C.; visualization, R.M. and E.N.; supervision, E.N., C.C. and G.B.; project administration, E.N.; funding acquisition, G.B. All authors have read and agreed to the published version of the manuscript.

Funding

The APC was funded by the Dirección de Investigación y Postgrado, UCSC.

Data Availability Statement

No new data were created or analyzed in this study. Data sharing is not applicable to this article.

Conflicts of Interest

The authors declare no conflict of interest.

References

  1. Paulay, T. Seismic design in reinforced concrete: The state of the art in New Zealand. Bull of the New Zealand. Soc. Earthq. Eng. 1988, 21, 2008–2232. [Google Scholar]
  2. Shahrooz, B.M.; Moehle, J.P. Evaluation of Seismic Performance of Reinforced Concrete Frames. J. Struct. Eng. 1990, 116, 1403–1422. [Google Scholar] [CrossRef]
  3. Goulet, C.A.; Haselton, C.B.; Mitrani-Reiser, J.; Beck, J.L.; Deierlein, G.G.; Porter, K.A.; Stewart, J.P. Evaluation of the seismic performance of a code-conforming reinforced-concrete frame building—From seismic hazard to collapse safety and economic losses. Earthq. Eng. Struct. Dyn. 2007, 36, 1973–1997. [Google Scholar] [CrossRef]
  4. Sadjadi, R.; Kianoush, M.; Talebi, S. Seismic performance of reinforced concrete moment resisting frames. Eng. Struct. 2007, 29, 2365–2380. [Google Scholar] [CrossRef]
  5. Aliasghar-Mamaghani, M.; Khaloo, A. Seismic behavior of concrete moment frame reinforced with GFRP bars. Compos. Part B: Eng. 2019, 163, 324–338. [Google Scholar] [CrossRef]
  6. Saqan, E.I.; Rasheed, H.A.; Alkhrdaji, T. Evaluation of the seismic performance of reinforced concrete frames strengthened with CFRP fabric and NSM bars. Compos. Struct. 2018, 184, 839–847. [Google Scholar] [CrossRef]
  7. Rizwan, M.; Ahmad, N.; Khan, A.N. Seismic performance assessment of reinforced concrete moment resisting frame with low strength concrete. Structures 2021, 30, 1140–1160. [Google Scholar] [CrossRef]
  8. Mousseau, S.; Paultre, P.; Mazars, J. Seismic performance of a full-scale, reinforced high-performance concrete building. Part II: Analytical study. Can. J. Civ. Eng. 2008, 35, 849–862. [Google Scholar] [CrossRef]
  9. Paultre, P.; Weber, B.; Mousseau, S.; Proulx, J. Detection and prediction of seismic damage to a high-strength concrete moment resisting frame structure. Eng. Struct. 2016, 114, 209–225. [Google Scholar] [CrossRef]
  10. Yousef, A.M.; El-Mandouh, M.A. Dynamic analysis of high-strength concrete frame buildings for progressive collapse. Case Stud. Constr. Mater. 2020, 13, e00470. [Google Scholar] [CrossRef]
  11. Kwon, J.; Ghannoum, W.M. Assessment of international standard provisions on stiffness of reinforced concrete moment frame and shear wall buildings. Eng. Struct. 2016, 128, 149–160. [Google Scholar] [CrossRef] [Green Version]
  12. Duan, H.; Hueste, M.B.D. Seismic performance of a reinforced concrete frame building in China. Eng. Struct. 2012, 41, 77–89. [Google Scholar] [CrossRef]
  13. ASCE. Seismic Evaluation and Retrofit of Existing Buildings (ASCE 41); American Society of Civil Engineers: Reston, VA, USA, 2017. [Google Scholar]
  14. Mata-Lemus, R.; Idrees-Rustom, A.; Sánchez-Rodríguez, J.; Torres-Moreno, R.; Nuñez-Castellanos, E.; Bustamante-Laissle, G. Assessment of Strength Reduction Factor on Concrete Moment Frames According to the New Venezuelan Seismic Code. Buildings 2022, 12, 255. [Google Scholar] [CrossRef]
  15. Celarec, D.; Dolšek, M. The impact of modelling uncertainties on the seismic performance assessment of reinforced concrete frame buildings. Eng. Struct. 2013, 52, 340–354. [Google Scholar] [CrossRef]
  16. Anand, V.; Kumar, S.S. Seismic Soil-structure Interaction: A State-of-the-Art Review. Structures 2018, 16, 317–326. [Google Scholar] [CrossRef]
  17. Visuvasam, J.A.; Chandrasekaran, S.S. Effect of Spacing and Slenderness Ratio of Piles on the Seismic Behavior of Building Frames. Buildings 2022, 12, 2050. [Google Scholar] [CrossRef]
  18. Brandis, A.; Kraus, I.; Petrovčič, S. Nonlinear Static Seismic Analysis and Its Application to Shallow Founded Buildings with Soil-Structure Interaction. Buildings 2022, 12, 2014. [Google Scholar] [CrossRef]
  19. Matinmanesh, H.; Asheghabadi, M.S. Seismic Analysis on Soil-Structure Interaction of Buildings over Sandy Soil. Procedia Eng. 2011, 14, 1737–1743. [Google Scholar] [CrossRef] [Green Version]
  20. Tabatabaiefar, S.H.R.; Fatahi, B.; Samali, B. Seismic Behavior of Building Frames Considering Dynamic Soil-Structure Interaction. Int. J. Géomeéch. 2013, 13, 409–420. [Google Scholar] [CrossRef]
  21. Askouni, P.K.; Karabalis, D.L. The Modification of the Estimated Seismic Behaviour of R/C Low-Rise Buildings Due to SSI. Buildings 2022, 12, 975. [Google Scholar] [CrossRef]
  22. Shaaban, M.; Abouelsaad, M.N.; El Bagalaty, S.; El Madawy, M.E. Seismic Analysis of RC High-Rise Buildings Rested on Cellular Raft. Buildings 2022, 12, 1924. [Google Scholar] [CrossRef]
  23. Tomeo, R.; Bilotta, A.; Pitilakis, D.; Nigro, E. Soil-structure interaction effects on the seismic performances of reinforced concrete moment resisting frames. Procedia Eng. 2017, 199, 230–235. [Google Scholar] [CrossRef]
  24. Rajeev, P.; Tesfamariam, S. Seismic fragilities of non-ductile reinforced concrete frames with consideration of soil structure interaction. Soil Dyn. Earthq. Eng. 2012, 40, 78–86. [Google Scholar] [CrossRef]
  25. Karapetrou, S.T.; Fotopoulou, S.D.; Pitilakis, K.D. Seismic vulnerability assessment of high-rise non-ductile RC buildings con-sidering soil–structure interaction effects. Soil Dyn Earthq. Eng. 2015, 73, 42–57. [Google Scholar] [CrossRef]
  26. Tabatabaiefar, H.R.; Massumi, A. A simplified method to determine seismic responses of reinforced concrete moment resisting building frames under influence of soil–structure interaction. Soil Dyn. Earthq. Eng. 2010, 30, 1259–1267. [Google Scholar] [CrossRef]
  27. Khosravifardshirazi, A.; Johari, A.; Javadi, A.A.; Khanjanpour, M.H.; Khosravifardshirazi, B.; Akrami, M. Role of Subgrade Reaction Modulus in Soil-Foundation-Structure Interaction in Concrete Buildings. Buildings 2022, 12, 540. [Google Scholar] [CrossRef]
  28. Alzabeebee, S.; Forcellini, D. Numerical Simulations of the Seismic Response of a RC Structure Resting on Liquefiable Soil. Buildings 2021, 11, 379. [Google Scholar] [CrossRef]
  29. Ebrahimian, H.; Taha, A.; Ghahari, F.; Asimaki, D.; Taciroglu, E. Estimation of Soil–Structure Model Parameters for the Millikan Library Building Using a Sequential Bayesian Finite Element Model Updating Technique. Buildings 2022, 13, 28. [Google Scholar] [CrossRef]
  30. ASCE. Minimum Design Loads for Buildings and Other Structures (ASCE/SEI 7); American Society of Civil Engineers: Reston, VA, USA, 2016. [Google Scholar]
  31. FEMA P-2091; A Practical Guide to Soil-Structure Interaction. Applied Technology Council: Redwood, CA, USA, 2020.
  32. Colangelo, F. Drift-sensitive non-structural damage to masonry-infilled reinforced concrete frames designed to Eurocode 8. Bull. Earthq. Eng. 2013, 11, 2151–2176. [Google Scholar] [CrossRef]
  33. Mayes, R.L. Interstory drift design and damage control issues. Struct. Des. Tall Build. 1995, 4, 15–25. [Google Scholar] [CrossRef]
  34. Espinosa, A.F.; Algermissen, S.T. A study of soil amplification factors in earthquake damage areas, Caracas, Venezuela. In NOAA Technical Report ERL. 280-ESL 31; National Oceanic and Atmospheric Administration: Washington, DC, USA, 1972. [Google Scholar]
  35. Skinner, R.I. Engineering Study of Caracas Earthquake, Venezuela, 29 July 1967; Department of Scientific and Industrial Research: Wellington, New Zealand, 1968. [Google Scholar]
  36. Urich, A.; López, O. Importancia de la Ori-entación de los Planos resistentes en el Desempeño Sísmico de Edificios en los Palos Grandes 1967. In Proceedings of the VIII CONVESIS (Venezuelan Congress of Seismology and Seismic Engineering), Caracas, Venezuela, 17–19 May 2006. (In Spanish). [Google Scholar]
  37. Guerrero, A.; López, O. Sobre cómo un edificio vulnerable resistió sin daños el sismo de Caracas de 1967. Inge-Niería Sísmica 2021, 106, 31–44. (In Spanish) [Google Scholar] [CrossRef]
  38. González, J.; Schmitz, M.; Audemard, F.; Contreras, R.; Mocquet, A.; Delgado, J.; De Santis, F. Site effects of the 1997 Cariaco, Venezuela earthquake. Eng. Geol. 2003, 72, 143–177. [Google Scholar] [CrossRef]
  39. López, O.A.; Espinosa, L.F. Collapse of rmc high-school during the 1997 cariaco earthquake. IMME Tech Bull. 2007, 45, 35–57. [Google Scholar]
  40. López, O.A.; Hernández, J.J.; Del Re, G.; Puig, J.; Espinosa, L. Reducing Seismic Risk of School Buildings in Venezuela. Earthq. Spectra 2007, 23, 771–790. [Google Scholar] [CrossRef]
  41. Castilla, E.; Marinilli, A. Structural Behavior of “Raimundo Martinez Centeno” High School on 07/09/1997 Cariaco Earthquake. In Proceedings of the XII WCEE (World Conference on Earthquake Engineering), Auckland, New Zealand, 30 January–4 February 2000. [Google Scholar]
  42. Comisión Venezolana de Normas Industriales, Fodenorca. Construcciones Sismorresistentes. In Norma Venezolana COVENIN 1756-1:2019; Comisión Venezolana de Normas Industriales, Fodenorca: Caracas, Venezuela, 2019. [Google Scholar]
  43. FEMA P-58 Vol 1; Seismic Performance Assessment of Buildings. Applied Technology Council: Redwood, CA, USA, 2018.
  44. ACI 318; Building Code Requirements for Structural Concrete (ACI 318-19) and Commentary (ACI 318R-19). American Concrete Institute: Farmington Hills, MA, USA, 2019.
  45. SAP2000 v23; Computer and Structures, Inc.: Berkeley, CA, USA, 2000.
  46. Iwasaki, T.; Tatsuoka, F.; Takagi, Y. Shear Moduli of Sands under Cyclic Torsional Shear Loading. Soils Found. 1978, 18, 39–56. [Google Scholar] [CrossRef] [Green Version]
  47. Kumar, S.S.; Krishna, A.M.; Dey, A. Evaluation of dynamic properties of sandy soil at high cyclic strains. Soil Dyn. Earthq. Eng. 2017, 99, 157–167. [Google Scholar] [CrossRef]
  48. Lambert, D.N.; Valent, P.J.; Richardson, M.D.; Merrill, G.F. Spatial variability in selected geotechnical property measurements from three sedimentary provinces in the Venezuela Basin. Mar. Geol. 1985, 68, 107–123. [Google Scholar] [CrossRef]
  49. Vieira Faria, N.; De Ponte Fernandes, D. Geotechnical characterization of calcareous sands in the northeastern coast of Vene-zuela. In Deformation Characteristics of Geomaterials; IOS Press: Amsterdam, NY, USA, 2015; pp. 1153–1160. [Google Scholar]
  50. Garzón, E.; Sánchez-Soto, P.; Romero, E. Physical and geotechnical properties of clay phyllites. Appl. Clay Sci. 2010, 48, 307–318. [Google Scholar] [CrossRef]
  51. Cortez, C.; Jünemann, R.; Fernández, C.; Urrutia, A.; Crempien, J.; Cienfuegos, R. Performance of an RC building under seismic and tsunami actions in sequence via nonlinear dynamic analysis including soil-structure interaction. Eng. Struct. 2022, 272, 114942. [Google Scholar] [CrossRef]
  52. Motahari, M.R.; Amini, O.; Khoshghalb, A.; Etemadifar, M.; Alali, N. Investigation of the Geotechnical Properties and Estimation of the Relative Density from the Standard Penetration Test in Sandy Soils (Case Study: North East of Iran). Geotech. Geol. Eng. 2022, 40, 2425–2442. [Google Scholar] [CrossRef]
  53. Kokusho, T.; Yoshida, Y.; Esashi, Y. Dynamic Properties of Soft Clay for Wide Strain Range. Soils Found. 1982, 22, 1–18. [Google Scholar] [CrossRef] [Green Version]
  54. Yang, J.; Yin, Z.-Y.; Liu, X.-F.; Gao, F.-P. Numerical analysis for the role of soil properties to the load transfer in clay foundation due to the traffic load of the metro tunnel. Transp. Geotech. 2020, 23, 100336. [Google Scholar] [CrossRef]
  55. Bray, J.D.; Macedo, J. 6th Ishihara lecture: Simplified procedure for estimating liquefaction-induced building settlement. Soil Dyn. Earthq. Eng. 2017, 102, 215–231. [Google Scholar] [CrossRef]
  56. Horvath, J.S. New Subgrade Model Applied to Mat Foundations. J. Geotech. Eng. 1983, 109, 1567–1587. [Google Scholar] [CrossRef]
  57. Liou, G.-S.; Lai, S.C. Structural Analysis Model for Mat Foundations. J. Struct. Eng. 1996, 122, 1114–1117. [Google Scholar] [CrossRef]
  58. SAFE v21; Computer and Structures, Inc.: Berkeley, CA, USA, 2000.
  59. ATC 40; Seismic Evaluation and Retrofit of Concrete Buildings. Applied Technology Council: Redwood City, CA, USA, 1996.
  60. Lin, Y.-Y.; Miranda, E. Kinematic soil-structure interaction effects on maximum inelastic displacement demands of SDOF sys-tems. Bull. Earthq. Eng. 2008, 6, 241–259. [Google Scholar] [CrossRef]
  61. Ahmadi, E. Concurrent effects of inertial and kinematic soil-structure interactions on strength-ductility-period relationship. Soil Dyn. Earthq. Eng. 2019, 117, 174–189. [Google Scholar] [CrossRef]
  62. Vamvatsikos, D.; Cornell, C.A. Direct estimation of seismic demand and capacity of multidegree-of-freedom systems through incremental dynamic analysis of single degree of freedom approximation. J. Struct. Eng. 2005, 131, 589–599. [Google Scholar] [CrossRef] [Green Version]
  63. Nafeh, A.M.B.; O’reilly, G.J.; Monteiro, R. Simplified seismic assessment of infilled RC frame structures. Bull. Earthq. Eng. 2020, 18, 1579–1611. [Google Scholar] [CrossRef]
Figure 1. Response spectrum according to Venezuelan seismic code [42].
Buildings 13 01694 g001
Figure 2. Schematic view of the 3D models.
Buildings 13 01694 g002
Figure 3. (a) Design drift for all archetypes in soil D and (b) design drift for all archetypes in soil E.
Buildings 13 01694 g003
Figure 4. (a) Design base shear for all archetypes in soil D and (b) design base shear for all archetypes in soil E.
Buildings 13 01694 g004
Figure 5. (a) Schematic view for all flexible base archetypes in soil D and (b) schematic view for all flexible bases for all archetypes in soil E.
Buildings 13 01694 g005
Figure 6. (a) Fundamental period for all archetypes in soil D and (b) fundamental period for all archetypes in soil E.
Buildings 13 01694 g006
Figure 7. Response spectrum according to Venezuelan seismic code [42] for 4-story archetype with SSI.
Buildings 13 01694 g007
Figure 8. (a) Variation of design base shear due to SSI for all archetypes in soil D and (b) variation of design base shear due to SSI for all archetypes in soil E.
Buildings 13 01694 g008
Figure 9. Variation of design drift due to SSI for all archetypes.
Buildings 13 01694 g009aBuildings 13 01694 g009bBuildings 13 01694 g009c
Figure 10. Capacity pushover curves for all archetypes.
Buildings 13 01694 g010aBuildings 13 01694 g010b
Figure 11. Pushover analysis failure mechanism for all archetypes.
Buildings 13 01694 g011aBuildings 13 01694 g011bBuildings 13 01694 g011c
Figure 12. (a) Illustration of spectrum capacity method for 4 stories archetype in soil D and (b) illustration of spectrum capacity method for 4 stories archetype in soil E.
Buildings 13 01694 g012
Figure 13. (a) Comparison of overstrength factor for all archetypes in soil D and (b) comparison of overstrength factor for all archetypes in soil E.
Buildings 13 01694 g013
Figure 14. (a) Comparison of strength-reduction factor for all archetypes in soil D and (b) comparison of strength-reduction factor for all archetypes in soil E.
Buildings 13 01694 g014
Figure 15. (a) Comparison of ductility for all archetypes in soil D and (b) comparison of ductility for all archetypes in soil E.
Buildings 13 01694 g015
Figure 16. (a) Comparison of normalized performance point (D/dy) for all archetypes in soil D and (b) comparison of normalized performance point (D/dy) for all archetypes in soil E.
Buildings 13 01694 g016
Figure 17. Response spectrum of selected records and MCE deemed for soil D and E.
Buildings 13 01694 g017
Figure 18. Maximum story drift of non-linear dynamic analysis for soil D and E.
Buildings 13 01694 g018aBuildings 13 01694 g018bBuildings 13 01694 g018c
Figure 19. Maximum base shear of non-linear dynamic analysis for soil D and E.
Buildings 13 01694 g019aBuildings 13 01694 g019bBuildings 13 01694 g019c
Figure 20. Application of SPO2IDA tool for 4-story model supported in soil D.
Buildings 13 01694 g020
Figure 21. Collapse fragility curves obtained from the SPO2IDA tool.
Buildings 13 01694 g021
Table 1. Properties of the beams and columns of the archetypes.
Model.LevelElementb (mm)h (mm)Aslong (Bars)Astop
(Bars)
Asbot
(Bars)
Asv
(Bars)
4-story levels1Column60060016φ#7 4φ#4
Beam400600 6φ#66φ#64φ#3
2 to 3Column50050016φ#7 4φ#4
Beam400600 6φ#66φ#64φ#3
4Column50050016φ#7 4φ#4
Beam400600 3φ#63φ#63φ#3
8-story levels1 to 4Column80080024φ#7 5φ#4
Beam400600 5φ#85φ#83φ#3
5 to 7Column70070024φ#7 5φ#4
Beam400600 5φ#75φ#73φ#3
8Column70070024φ#7 5φ#4
Beam400600 3φ#73φ#73φ#3
12-story levels1 to 8Column90090024φ#8 6φ#4
Beam400600 5φ#85φ#83φ#3
9 to 11Column70070024φ#7 6φ#4
Beam400600 5φ#75φ#73φ#3
12Column70070024φ#7 6φ#4
Beam400600 3φ#73φ#73φ#3
16-story levels1 to 4Column90090020φ#8 4φ#4
Beam400600 6φ#84φ#74φ#3
5 to 9Column80080020φ#7 4φ#4
Beam400600 6φ#84φ#74φ#3
9 to 12Column70070020φ#6 4φ#4
Beam400600 6φ#84φ#74φ#3
13 to 15Column70070020φ#6 4φ#4
Beam400600 7φ#75φ#74φ#3
16Column70070020φ#6 4φ#4
Beam400600 4φ#64φ#63φ#3
20-story levels1 to 4Column1000100024φ#8 6φ#4
Beam400600 8φ#8 + 2φ#53φ#8 + 2φ#74φ#3
5 to 11Column90090020φ#8 4φ#4
Beam400600 8φ#8 + 2φ#53φ#8 + 2φ#74φ#3
12Column90090020φ#8 4φ#4
Beam400600 7φ#85φ#84φ#3
13Column80080020φ#7 4φ#4
Beam400600 7φ#85φ#84φ#3
14Column80080020φ#7 4φ#4
Beam400600 7φ#85φ#84φ#3
15 to 19Column70070020φ#6 4φ#4
Beam400600 6φ#84φ#74φ#3
200Column70070020φ#6 4φ#4
Beam400600 4φ#64φ#64φ#3
24-story levels1 to 6Column1100110024φ#8 6φ#4
Beam400600 9φ#8 + 2φ#55φ#84φ#3
7Column1000100024φ#8 6φ#4
Beam400600 9φ#8 + 2φ#55φ#84φ#3
8Column1000100024φ#8 6φ#4
Beam400600 9φ#8 + 2φ#55φ#84φ#3
9 to 11Column90090020φ#8 4φ#4
Beam400600 9φ#8 + 2φ#55φ#84φ#3
12 to 18Column90090020φ#8 4φ#4
Beam400600 8φ#8 + 2φ#53φ#8 + 2φ#74φ#3
19Column80080020φ#7 4φ#4
Beam400600 7φ#85φ#84φ#3
200 to 23Column80080020φ#7 4φ#4
Beam400600 6φ#84φ#74φ#3
24Column70070020φ#6 4φ#4
Beam400600 4φ#64φ#63φ#3
Table 2. Soil properties of considered soils.
Soil ParametersSoil DSoil EDescription
Soil TypeDense SandSoft Clay-
Dr (%)3656Relative density
N1(60)307.35Standard penetration test blow count
Vs (m/s)236141Shear wave velocity
Gs2.652.42Empirical soil-specific gravity
Φ (°)35.54Friction angle
Cu (kN/m2)1.633Undrained cohesion
Ρ (Kg/m3)1.8961.78Mass density
Gmax (MPa)106 52.66Maximum shear modulus Gmax = pVs2
γ (%)0.030.2Maximum shear strain [55]
G/Gmax0.220.3Shear modulus degradation [55]
ν0.30.4Poisson coefficient
Table 3. Summary of foundation design for soil D.
ArchetypeB (m)L (m)e (m)Df (m)qadm (kN/m2)AstopAsbottomMax Punching Shear RatioMax Soil Stress (kN/m2)
4 Story22220.400.40505.3361φ#4 each 0.15 m1φ#5 each 0.15 m0.72142.294
8 Story23230.700.70492.8821φ#4 each 0.10 m1φ#5 each 0.10 m0.71165.242
12 Story24240.900.90558.3911φ#5 each 0.10 m1φ#6 each 0.10 m0.69210.255
16 Story25251.101.10672.051φ#5 each 0.10 m1φ#7 each 0.10 m0.75298.514
20 Story26261.301.30672.051φ#6 each 0.10 m1φ#7 each 0.10 m0.70363.729
24 Story26261.351.35743.341φ#6 each 0.10 m1φ#8 each 0.10 m0.57430.708
Table 4. Summary of foundation design for soil E.
ArchetypeB (m)L (m)e (m)Df (m)qadm (kN/m2)AstopAsbottomMax Punching Shear RatioMax Soil Stress (kN/m2)
4 Story22220.400.40230.1331φ#4 each 0.15 m1φ#5 each 0.15 m0.5793.163
8 Story23230.700.70233.9771φ#4 each 0.10 m1φ#5 each 0.10 m0.55120.131
12 Story24240.900.90235.7811φ#5 each 0.10 m1φ#6 each 0.15 m0.53162.398
16 Story25251.101.10237.0461φ#5 each 0.10 m1φ#7 each 0.15 m0.58224.768
20 Story26262.002.00298.5341φ#8 each 0.10 m1φ#7 each 0.10 m0.20292.729
24 Story26263.003.00372.6531φ#8 each 0.10 m1φ#8 each 0.10 m0.12337.055
Table 5. Summary of ASCE 7 effective damping ratio calculations.
ArchetypeSoil DSoil E
T ~ /Tβyβxxβrdβfβ0BSSI T ~ /Tβyβxxβrdβfβ0BSSI
4 Story1.0550.5160.2180.00650.0190.0641.0701.1061.5491.7640.2330.2460.2911.793
8 Story1.0300.2990.0540.00230.0100.0571.0361.0580.8960.7500.1050.1120.1591.413
12 Story1.0260.2060.0190.00100.0080.0551.0281.0510.6190.3620.0510.0580.1051.232
16 Story1.0220.1440.0070.00040.0060.0541.0221.0430.4330.1580.0220.0270.0751.116
20 Story1.0440.1200.0040.00030.0110.0571.0351.0850.3600.0990.0140.0250.0711.097
24 Story1.0270.1000.0020.00020.0070.0551.0251.0540.3000.0620.0100.0170.0651.071
Table 6. Results of pushover analysis for archetypes without SSI.
NO SSI EFFECTSPerformance Point
ATC 40ASCE
41-13
Story [-]Vdesign [kN]Velastic [kN]Vmax [kN]dy [mm]du [mm]μ [-]Rμ [-]Ω [-]R [-]D [mm]D [mm]
Soil D42131.14211,564.6267195.30835.500310.9638.7601.6073.3765.42671.50983.066
82449.07713,745.3309239.37880.000517.8236.4731.4883.7735.612134.772156.113
123276.20614,395.2079018.787128.000656.2455.1271.5962.7534.394205.171228.281
163560.12114,522.1916020.573155.000596.3803.8482.4121.6914.079277.639334.899
203661.33615,126.5296753.182226.000846.7323.7472.2401.8444.131313.439427.825
243797.22114,770.9637417.825283.000972.0863.4351.9911.9533.890352.760450.903
Soil E41704.9239208.5457195.30835.500310.9638.7601.2804.2205.40178.23464.625
83306.23818,065.8259239.37880.000517.8236.4731.9552.7955.464190.857213.375
123277.11518,407.1239018.787128.000656.2455.1272.0412.7525.617291.299308.211
163417.70418,655.8916020.573155.000596.3803.8483.0991.7625.459400.339449.349
203905.42319,748.5256753.182226.000846.7323.7472.9241.7295.057424.481570.065
244252.88920,687.9837417.825283.000972.0863.4352.7891.7444.864454.540675.648
Table 7. Results of pushover analysis for archetypes with inertial SSI.
INERTIAL SSI EFFECTSPerformance Point
ATC 40ASCE 41-13
Story [-]Vdesign [kN]Velastic [kN]Vmax [kN]dy [mm]du [mm]μ [-]Rμ [-]Ω [-]R [-]D [mm]D [mm]
Soil D42214.94311,927.1907137.16941.000500.00012.191.6713.2225.38579.842104.910
82438.04013,574.7428966.00587.000473.7705.4461.5143.6785.568143.875159.243
123283.54414,279.9959016.568135.000672.6924.9831.5842.7464.349214.611237.469
163544.81314,366.6525990.841166.000595.0583.5852.3981.6904.053283.663349.265
203645.53814,961.7916584.688235.000478.7012.0372.2721.8064.104324.800439.796
243730.18514,370.2387372.806315.0001149.4283.6491.9491.9773.852371.208457.477
Soil E41809.9529722.2567137.16941.000500.00012.191.3623.9435.37281.36391.070
83219.11117,514.0679073.28890.000506.1555.6241.9302.8195.441206.705219.255
123191.65717,829.4828737.614141.000609.1174.3202.0412.7385.586310.835327.719
163327.13818,115.7795976.856169.000618.7003.6613.0311.7965.445406.950474.942
203820.17119,227.6156691.536248.000856.0233.4522.8731.7525.033440.448608.503
244066.96819,687.5667342.521321.0001050.8603.2742.6811.8054.841481.559686.298
Table 8. Results of pushover analysis for archetypes with kinematic SSI.
KINEMATIC SSI EFFECTSPerformance Point
ATC 40ASCE 41-13
Story [-]Vdesign [kN]Velastic [kN]Vmax [kN]dy [mm]du [mm]μ [-]Rμ [-]Ω [-]R [-]D [mm]D [mm]
Soil D41995.44910,832.3607195.30835.500310.9638.7601.5053.6065.42967.06477.042
82375.43813,329.7259239.37880.000517.8236.4731.4433.8905.611130.933151.271
123208.82114,096.2599018.787128.000656.2455.1271.5632.8114.393200.352223.540
163507.50914,303.2926020.573155.000596.3803.8482.3761.7164.078274.063329.968
203558.15014,698.0276753.182226.000846.7323.7472.1761.8984.131307.952416.290
243737.42214,535.3807417.825283.000972.0863.4351.9601.9853.889349.546444.158
Soil E41100.0275076.3167195.30835.500310.9638.7600.7066.5414.61533.22034.327
82316.91512,659.6999239.37880.000517.8236.4731.3703.9885.464127.904147.474
122644.96814,854.9089018.787128.000656.2455.1271.6473.4105.616226.253248.688
163062.45916,714.5506020.573155.000596.3803.8482.7761.9665.458361.030403.275
203563.34218,014.7836753.182226.000846.7323.7472.6681.8955.056395.783520.860
243985.83719,386.6157417.825283.000972.0863.4352.6141.8614.864434.924643.401
Table 9. Results of pushover analysis for archetypes with inertial and kinematic SSI.
KINEMATIC AND INERTIAL SSI EFFECTSPerformance Point
ATC 40ASCE 41-13
Story [-]Vdesign [kN]Velastic [kN]Vmax [kN]dy [mm]du [mm]μ [-]Rμ [-]Ω [-]R [-]D [mm]D [mm]
Soil D42073.91711,171.9677137.16941.000500.00012.191.5653.4415.38774.63096.980
82364.73413,164.2958966.00587.000473.7705.4461.4683.7925.567139.576154.455
123216.00813,983.4399016.568135.000672.6924.9831.5512.8044.348210.215232.577
163492.42614,150.0985990.841166.000595.0583.5852.3621.7154.052280.309344.172
203542.79714,537.9566584.688235.000478.7012.0372.2081.8594.104318.932427.895
243671.44214,141.0477372.806315.0001149.4283.6491.9182.0083.852368.176672.635
Soil E4997.7695359.5057137.16941.000500.00012.190.7517.1535.37143.60646.871
82255.85912,273.0529073.28890.000506.1555.6241.3534.0225.441140.338153.615
122575.99414,388.7418737.614141.000609.1174.3201.6473.3925.586244.554264.832
162981.30716,230.6425976.856169.000618.7003.6612.7162.0055.444366.919428.828
203485.55817,539.6046691.536248.000856.0233.4522.6211.9205.032410.915556.490
243811.59118,449.1287342.521321.0001050.8603.2742.5131.9264.840459.731644.600
Table 10. Selected seismic records.
Epicenter IdentifierDateStationDuration [s]Magnitude [Mw]PGA (g)Direction
Cariaco, Venezuela9 July 1997UDO-Cumaná2.986.90.463EW
0.762NS
Managua, Nicaragua1 January 1972Managua, ESSO30.86.20.335EW
0.325NS
Imperial Valley, CA, USA15 October 1979Cerro Prieto12.776.50.156EW
0.153NS
El Centro, CA, USA18 May 1940Imperial Valley Irrigation District36.886.90.313EW
0.333NS
Landers, Inland Empire, USA28 June 1992Joshua Tree8.87.30.235EW
0.255NS
Northridge, USA17 January 1994LA—Sepulveda VA Hospital9.5556.70.546EW
0.776NS
Pazarcık, Turkey6 February 2023Kahramanmaraş, 461247.317.80.533EW
0.650NS
Table 11. Summary of SPO2IDA results.
ModelSDOF Yield Acceleration, Say [g]Strength FactorMedian Collapse Acceleration [g]
FixedSoil DSoil EFixedSoil DSoil EFixedSoil DSoil E
4-Story0.78030.77390.77454.445.034.964.71985.303125.23338
8-Story0.54130.52530.53164.243.743.743.286832.813532.84728
12-Story0.74440.74420.72123.593.453.103.84833.697283.21945
16-Story0.38000.37810.37733.413.143.001.884861.727041.64619
20-Story0.34510.33650.34194.691.014.282.36830.497292.14153
24-Story0.31840.31640.31513.451.014.011.613980.469631.85692
Disclaimer/Publisher’s Note: The statements, opinions and data contained in all publications are solely those of the individual author(s) and contributor(s) and not of MDPI and/or the editor(s). MDPI and/or the editor(s) disclaim responsibility for any injury to people or property resulting from any ideas, methods, instructions or products referred to in the content.

