Article

Method and Experimental Study of Oscillator Frequency Optimization of Distributed Tuned Mass Dampers for Broadband Multimodal Vibration Mitigation of Reinforced Concrete Wall

1
College of Civil Engineering, Tongji University, Shanghai 200092, China
2
Shanghai Nuclear Engineering Research and Design Institute, Shanghai 200433, China
3
State Key Laboratory for Disaster Reduction in Civil Engineering, Tongji University, Shanghai 200092, China
*
Author to whom correspondence should be addressed.
Buildings 2023, 13(7), 1686; https://doi.org/10.3390/buildings13071686
Submission received: 5 June 2023 / Revised: 26 June 2023 / Accepted: 27 June 2023 / Published: 30 June 2023
(This article belongs to the Special Issue Structural Vibration Control Research)

Abstract

:
Distributed tuned mass dampers (dTMD) can effectively mitigate the broadband vibration of a structure. However, when the vibration frequency in question reaches several hundred hertz, traditional optimization methods represented by fixed point theory are difficult to apply due to dense modal density, complex boundary conditions, and vibration inputs. This paper proposes the minimax method based on modal damping to optimize the oscillator’s frequency. Two typical wall panel specimens are tested to evaluate the proposed method. The mode shape of the uncontrolled wall and the vibration mitigation effect of the stacked sandwich-damped TMD under single-point bidirectional excitation is tested. The correlation between the modal damping and the vibration mitigation effect is evaluated. The results show that the RC wall panel has a dense mode when the frequency of interest reaches 300 Hz and above; the distributed stacked sandwich-damped TMDs can effectively mitigate the vibration of the RC wall panel in the frequency range of 200~450 Hz; and that the idea of optimizing the frequency of dTMD based on modal damping is feasible.

1. Introduction

With the construction of high-rise, large-span, and lightweight structures, the vibration problem of civil engineering structures under external excitation is becoming increasingly prominent, making vibration control an important part of structural design [1,2]. TMD vibration reduction technology is widely used in civil engineering vibration control because of its remarkable reliability and economy [3,4]. High-efficiency and low-cost vibration monitoring and signal processing technology make identifying complex structures’ vibration characteristics and modal parameters easy, providing a solid foundation for TMD vibration reduction schemes [5]. According to the spectral characteristics of structural vibration under external excitation, the structural vibration control problem is divided into single- and multi-mode [5,6]. In terms of reducing the structural modal vibration under wind load, earthquake action, and pedestrian load, many scholars have carried out optimization studies on various TMDs to achieve the optimal vibration reduction effect of TMDs and improve the robustness of vibration reduction effect, including the optimization of TMD devices and their dynamic parameters, as well as the optimization of the location and number of TMDs [7,8,9,10].
Due to process requirements, concrete walls in plant structures are required as support boundaries for equipment or piping [11,12,13,14]. The high-frequency vibrations of equipment or piping will excite broadband, high-order, multimodal (even dense-modal) vibrations of wall panels resulting in problems of vibration comfort and secondary structure noise. Existing passive control techniques for wall panels under complex broadband excitation include multiple tuned mass damper (MTMD) [15,16], distributed multiple tuned mass damper (DMTMD) [17,18] at the receptor for control, and local resonance metamaterial or metastructure (LRM) [19] for control in the propagation path. Distributed oscillators are an essential feature of such techniques.
When the vibration frequency of interest reaches several hundred hertz, traditional optimization methods represented by fixed point theory are difficult to apply. When the structural vibration frequency and the modal order are high, the uncertainty of the structural mass, stiffness, and boundary conditions make it quite difficult to accurately calculate the modal parameters of the structure [20]; therefore, it is challenging to apply the simplified design theory based on an equivalent single degree of freedom such as fixed-point theory [21]. In addition, Quantifying the impact of vibration reduction becomes difficult due to the multi-directional components and complicated spectrum of vibration source stimulation, both of which can significantly alter how different structure modes respond to vibration. For example, in a plant structure, process piping with broadband excitation characteristics is embedded in the building RC wall resulting in broadband multimodal vibration of the wall within 200~450 Hz. However, for practical design, it is hard to determine the specific mode mass and mode shape within 200~450 Hz and the components in various directions of pipeline excitation (along or perpendicular to the pipeline direction).
Previous research in automotive, aviation, and marine fields [22,23] has shown that the effect of distributed oscillators on structural broadband dense modes can be approximated by band gap width [24,25], attenuation constant [26,27], and modal damping [20]. For example, Jaesoon Jung et al. [22] predicted the band gap using a finite element-based unit cell analysis method. They experimentally verified the effectiveness of distributed tuned mass dampers for controlling the vibration of automobile dash panel structure.
The author team’s previous research demonstrated [28] that modal damping based on modal strain energy can potentially characterize the vibration reduction performance of distributed oscillators on finite plates under complex excitation. The results showed that when the modal order is high, the modal damping theory can ignore the effect of boundary conditions, and the theoretically predicted modal damping has a high correlation with the steady-state average acceleration reduction rate and steady-state reduction rate of peak strain energy of the substrate under multi-point non-uniform excitation. However, further research is needed on controlling modal damping to achieve high vibration reduction efficiency of distributed oscillators for wall panels subjected to complex excitations.
In short, the existing control design of distributed tuned mass dampers control of RC wall vibration has the following shortcomings: (1) it still lacks experimental verification of the effectiveness of applying distributed damped oscillator devices to control multimodal vibration of RC walls; (2) there is a lack of methods determining the parameters of distributed tuned mass dampers for vibration reduction in the target frequency band.
The contribution of this article is to extend the optimization design method based on modal damping [29] to the plate to determine the frequency of TMD. Moreover, the method’s hypothesis is also verified through experiments demonstrating the method’s feasibility for evaluating the vibration reduction effect under single-point bidirectional excitation. Unlike traditional modal-shape-based methods, the proposed method determines the natural frequency of the TMD device according to the target vibration reduction frequency band, making it easy to apply for practical design. The test also can verify the effectiveness of the dTMD on the broadband multimodal vibration of the wall within 200~450 Hz.
The paper is organized as follows: Section 2 introduces the minimax method for determining the oscillator frequencies based on modal damping. Section 3 presents the experimental setup and method. Section 4 presents the experimental results, including the dense modes of the wall panel at high frequencies and the frequency response comparison with or without dTMD. Section 5 evaluates the proposed modal damping-based method based on the experimental data.

2. Frequency Optimization of dTMD Based on Modal Damping

The research in [28,29] shows that the composite beam or composite plate with distributed oscillators (dTMD) achieves the maximum modal damping ratio at the mode closest to the oscillator frequency. The modal damping ratio of the composite structure will decrease with the deviation of the modal frequency from the oscillator frequency. To mitigate vibration in the target frequency band, literature [29] proposes an oscillator design method with the minimum modal damping ratio of the composite beam in the target frequency band as the optimization target.
Where the modal damping of the plate distributed with oscillators can be expressed by the following Equation [28]:
ξ p = ξ t 1 + 1 λ m n 2 2 μ λ m n 2
where ξ p is the modal damping of the plate distributed with oscillators, ξ t is the damping ratio of the oscillator, λ m n is the frequency ratio between the modal frequency of the plate and the oscillator frequency, and μ is the ratio of the total effective mass of the oscillators to the mass of the wall plate in the region of the distributed oscillators arrangement. Since the modal damping formulation of the plate distributed with oscillators has the same form as that of the beam in the literature [29], this inspires us to adopt the minimax optimization method similar to that of literature [29] to obtain the optimized frequency of the oscillator for controlling the target frequency band vibration.
To facilitate the discussion, the starting frequency f L of the target band is used as the reference frequency. The dimensionless modal frequency of the plate is λ L = f / f L . The dimensionless target frequency band is ( λ L L ,   λ L R ), where λ L L = f L / f L = 1 , λ L R = f R / f L . The dimensionless oscillator frequency is λ L t = f t / f L . So, Equation (1) can be rewritten as:
ξ p = ξ t 1 + 1 λ L λ L t 2 2 μ λ L λ L t 2
Further, the normalized damping ratio is taken as ξ N p = ξ p / ξ t . The expression of ξ N p is:
ξ N p = 1 1 + 1 λ L λ L t 2 2 μ λ L λ L t 2
According to the optimization strategy, we need to maximize the minimum modal damping ratio of the plate in the target frequency band; the optimization target can be expressed as:
max λ L t 1 ,   λ L R min λ L 1 ,   λ L R ξ N p λ L t ,   λ L
As shown in Figure 1, for a given mass ratio μ, the composite plate obtains the minimum modal damping ratio at the boundary of the target frequency band. When the lowest modal damping ratio is equal to the highest in the target frequency band, the minimum modal damping ratio in the target frequency band reaches the maximum value.
Therefore, the optimization can be transformed into solving the following problems:
  For   a   given   μ   Solve :   λ L t Which   satisfy :   ξ N p | λ L = 1 = ξ N p | λ L = λ L R
According to ξ N p | λ L = 1 = ξ N p | λ L = λ L R , the optimized oscillator dimensionless frequency is:
λ L t = λ L R
Therefore, the optimal oscillator frequency is:
f t o p t = f R f L
When the oscillator frequency is the optimal frequency, the minimum modal damping ξ p m in the target frequency band is:
ξ p m = ξ t 1 + f R μ f L 1 f L f R 2
From Equation (7), the optimal frequency of the oscillator is f R f L . For example, when the target control band is 250~400 Hz, the oscillator frequency, according to the minimax optimization principle, is 400 × 250 = 316   Hz . When the target control band is 200~450 Hz, the optimized oscillator frequency is 450 × 200 = 300   Hz .
The modal damping ratio of the composite plate in the target frequency band is the best after using the optimal oscillator frequency. Even at both bounds of the target frequency band, the distributed oscillators can still play a significant role, as shown in Figure 2.
It is worth noting that the above derivation process implies the following assumptions:
(1)
The frequency range with higher modal damping has a better vibration reduction effect. Specifically, the vibration mitigation effect at two frequencies with equal modal damping in the modal damping curve is equivalent;
(2)
The practical frequency of TMD can reach the design target value.
Therefore, we will further evaluate the rationality of the method through experiments in subsequent sections.

3. Experimental Setups and Method
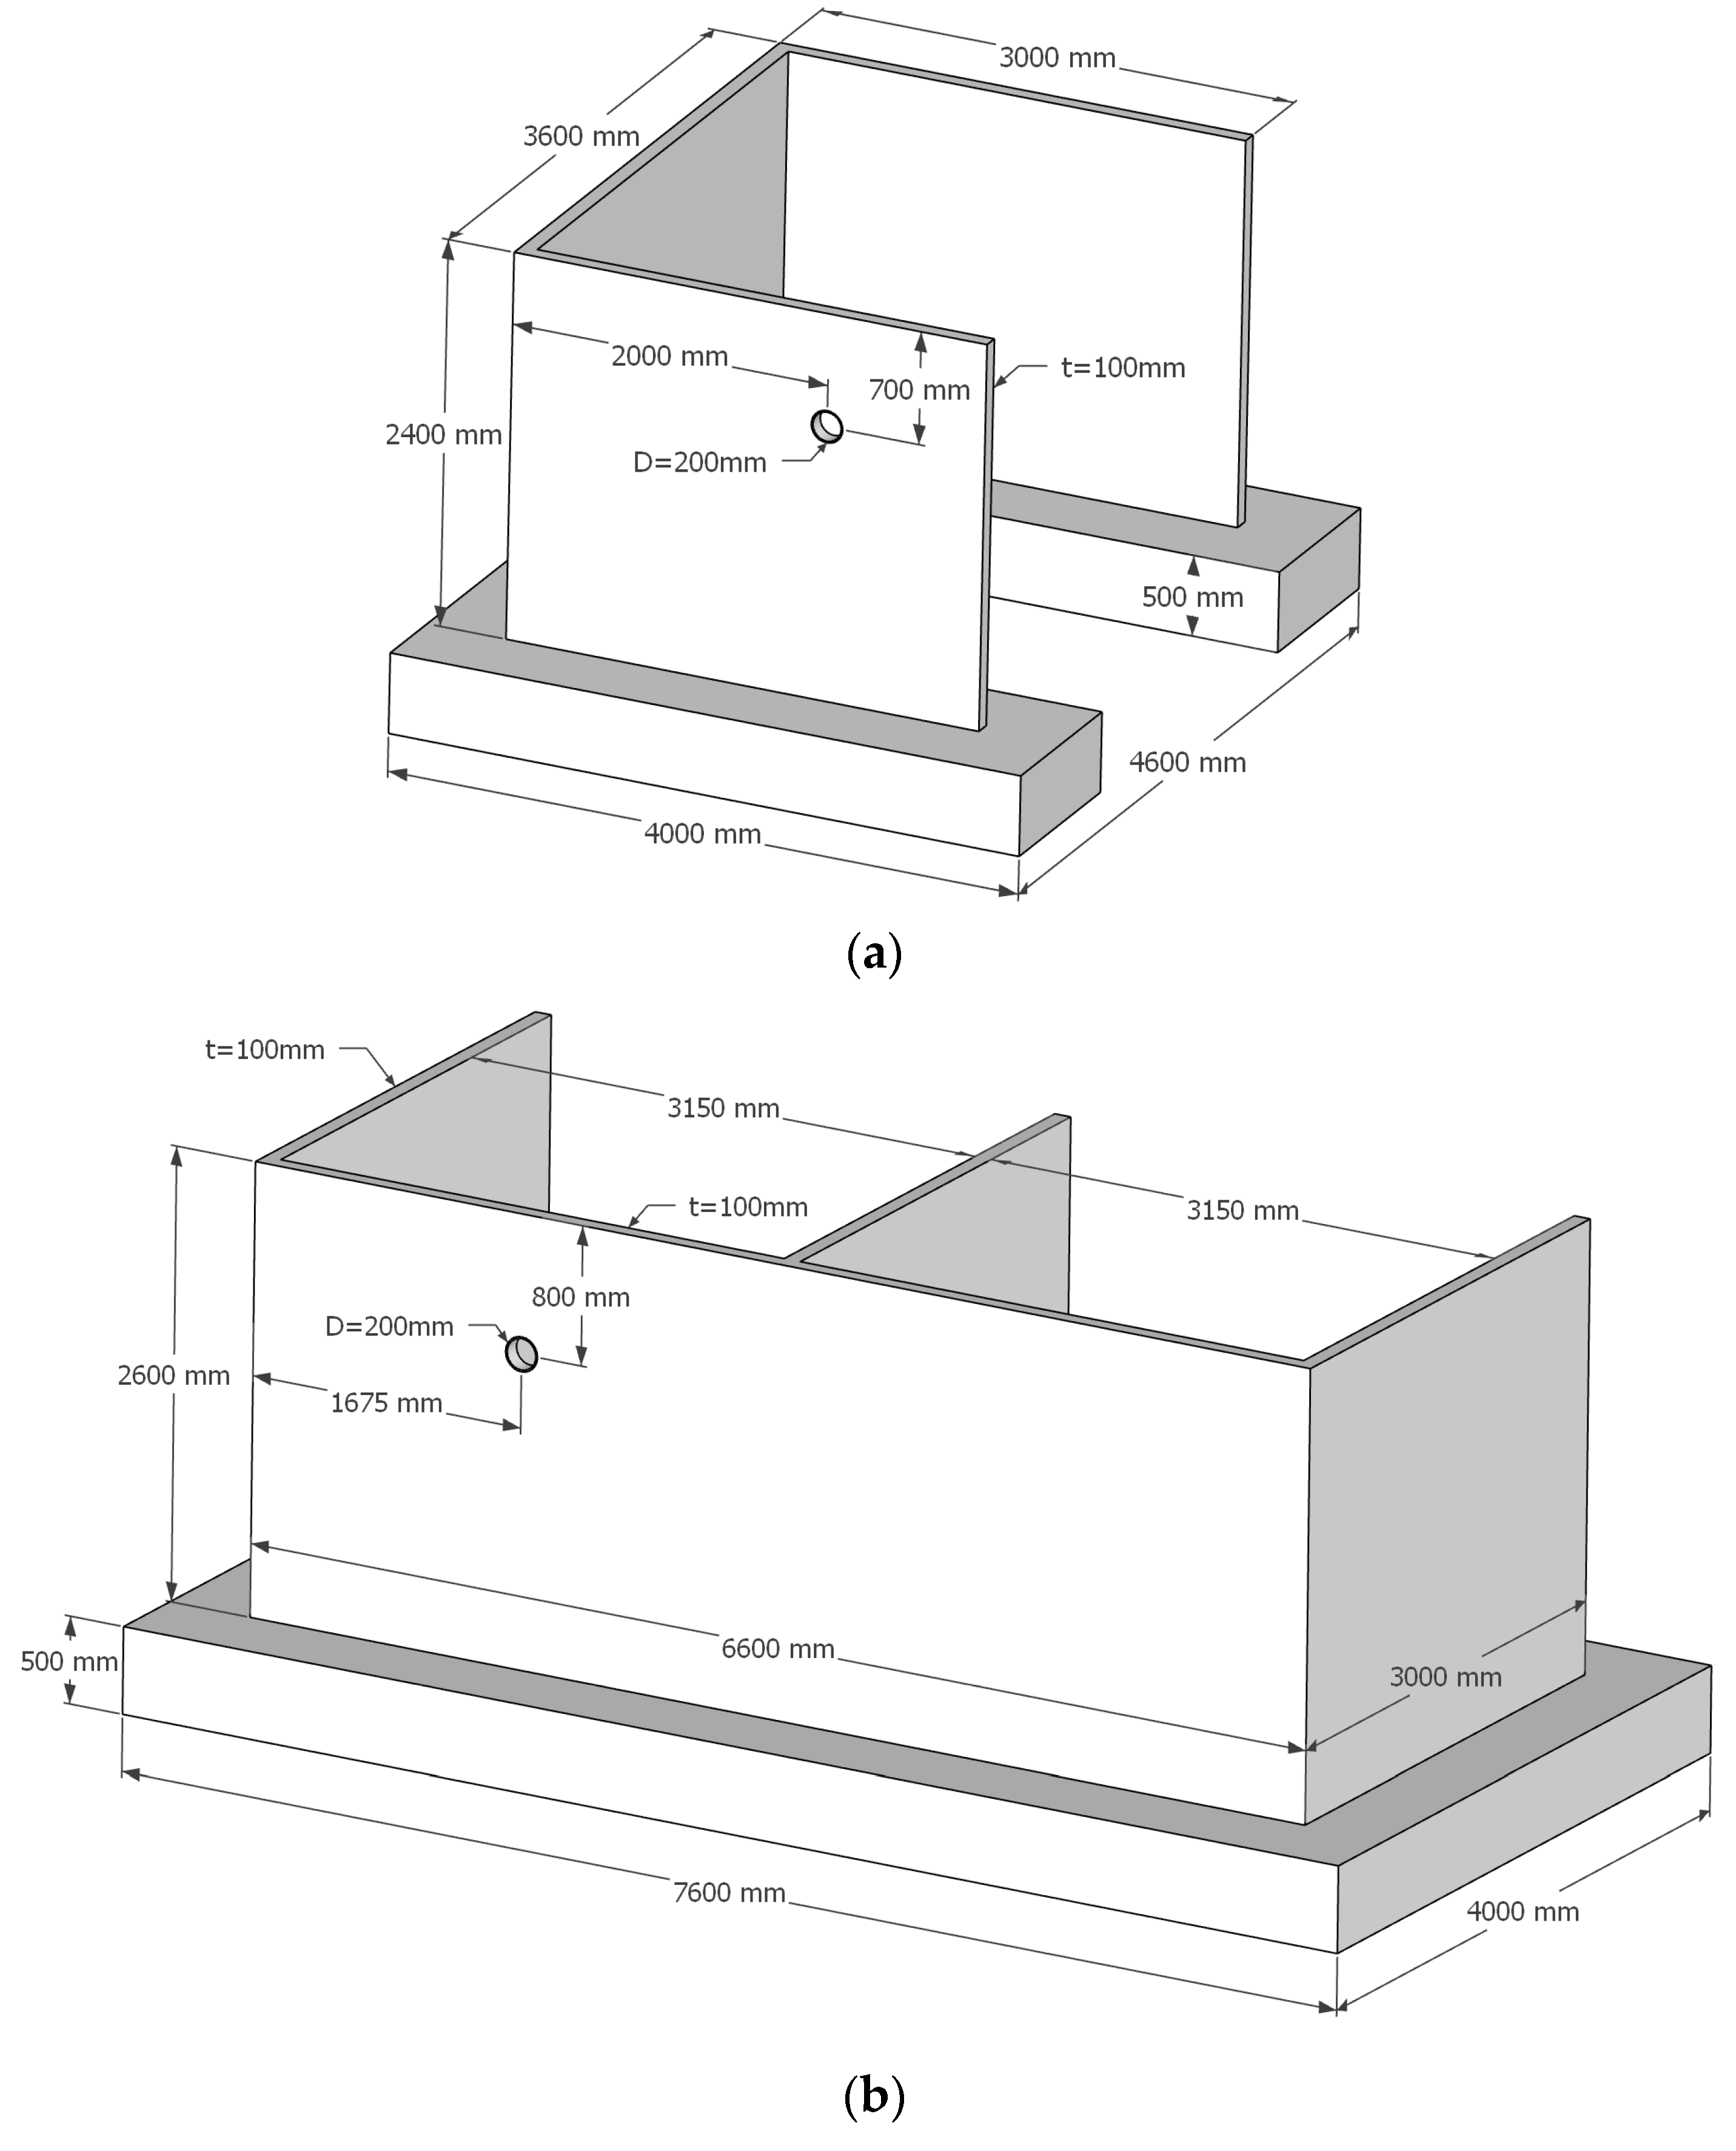
To evaluate the method based on modal damping in Section 2, wall panel specimens’ modal shape and frequency response were tested. The prototype of the wall panel specimen is a factory’s RC wall affected by pipe-caused vibration. The dTMD used for tests were stacked sandwich-damped TMDs designed by the authors of this paper.

3.1. Wall with Pipe

In the prototype plant structure, the process pipeline is embedded in the RC wall, which results in broadband vibration within 200~450 Hz. According to the symmetry of the floor, two half-story reinforced concrete test wall specimens with a pipe were built, respectively, and a large base was poured at the bottom of the RC wall to consider the strong embedded effect of the floor slab on the wall. One of the wall specimens was a U-shaped wall with pipes set on the flange wall to study the vibration caused by the adjacent vertical web wall, as shown in Figure 3a. The other wall specimen was a W-shaped wall with pipes set on the web wall to study the vibration caused by the adjacent vertical web wall, as shown in Figure 3b.
The geometric parameters of the experimental wall are shown in Figure 4. The concrete material is C30 (wall thickness 100 mm), and the bidirectional reinforcement ratio is about 2%.

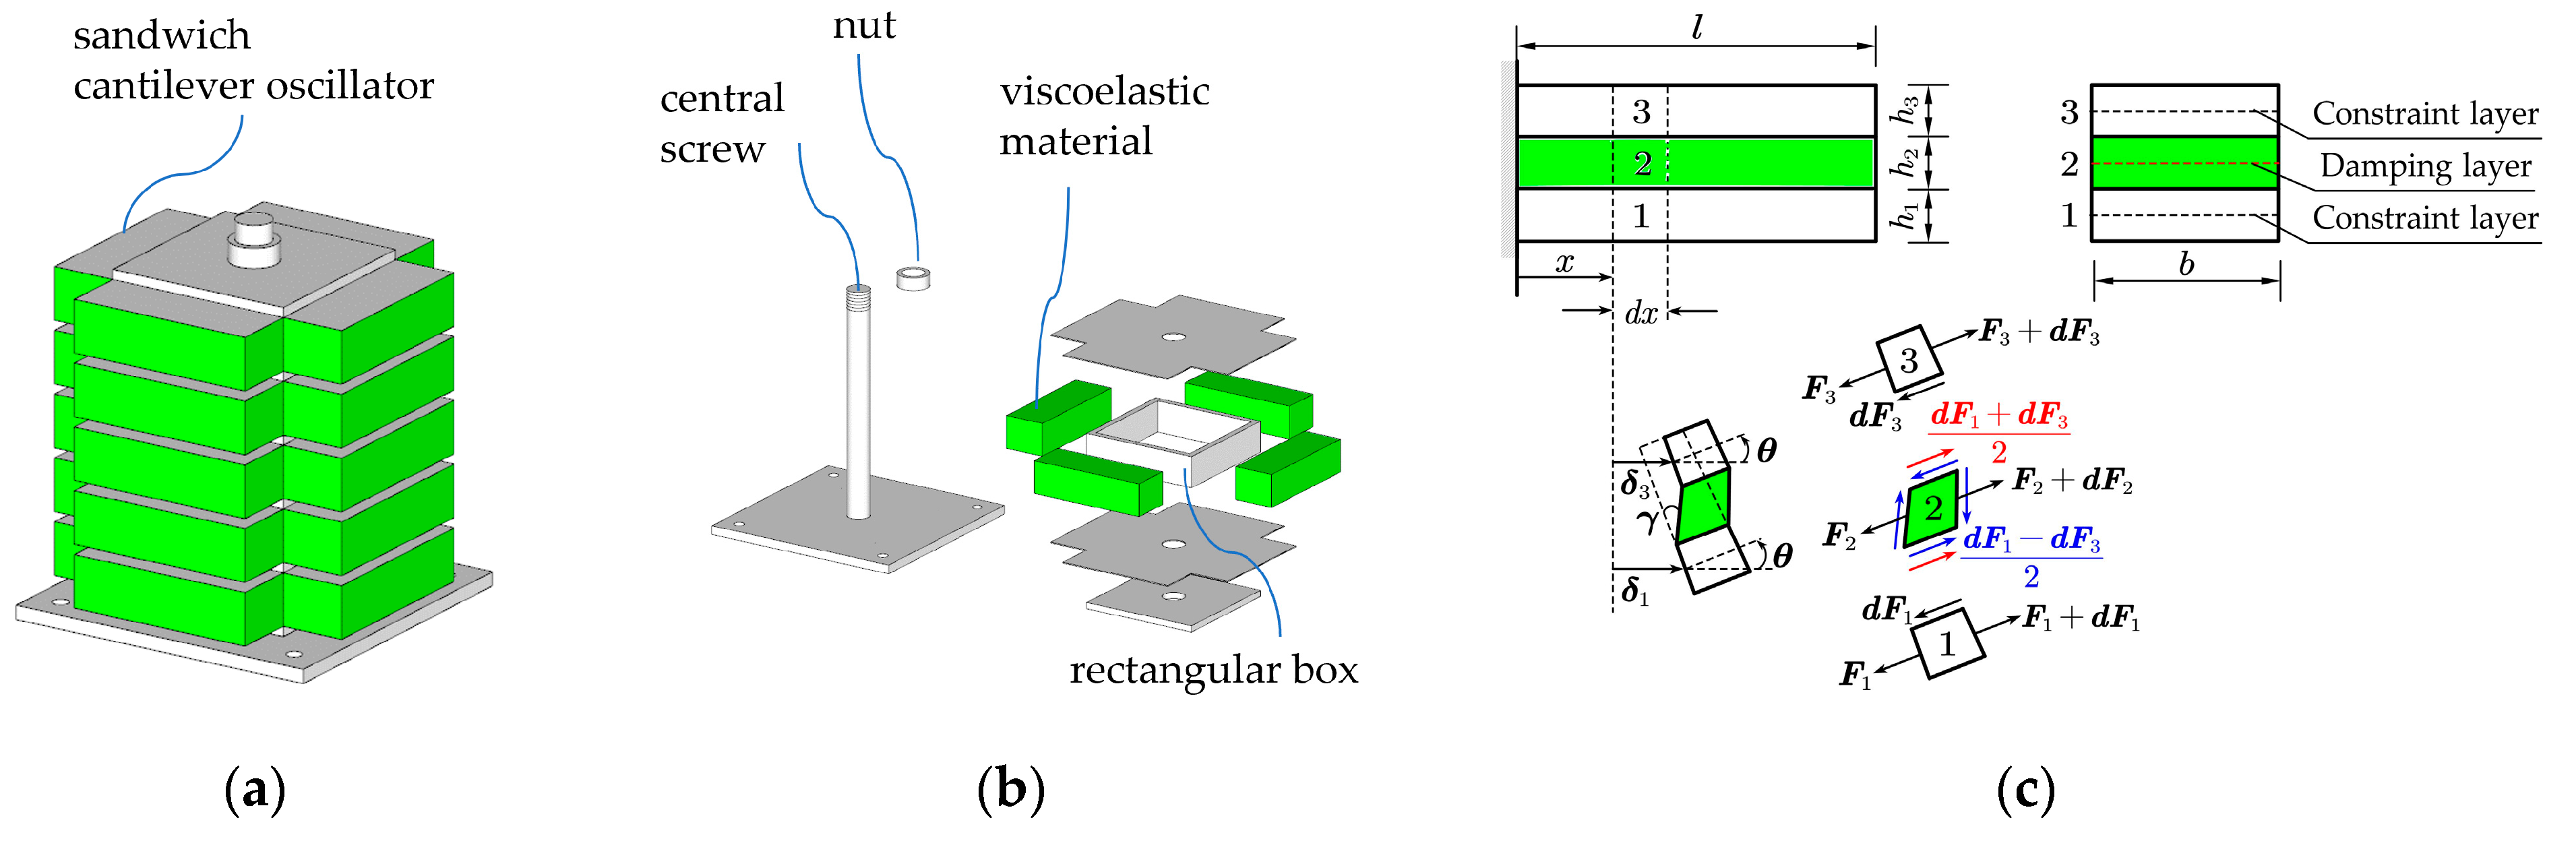
3.2. Stacked Sandwich TMD

The stacked sandwich TMD (SSTMD) with higher frequencies and higher damping proposed in reference [30] is used to mitigate the vibration of the wall. The configuration and energy dissipation mechanism of SSTMD is shown in Figure 4. Each TMD device is formed by stacking and assembling a five-layer sandwich structure, as shown in Figure 4a. Each sandwich structure consists of four sandwich cantilever oscillators formed by bonding viscoelastic materials between the upper and lower layers of steel plates, as shown in Figure 4b. When SSTMD vibrates along a vertical rod, the viscoelastic material layer between each sandwich cantilever oscillator undergoes shear deformation and consumes vibration energy. The geometric parameters and deformation mechanism of the sandwich cantilever oscillator are shown in Figure 4c; in this figure, l and b are the length and width of the cantilever oscillator, respectively. h1 and h3 are the thickness of the constraint layer, and h2 is the thickness of the damping layer. For practical applications, the size of sandwich cantilever oscillators can be designed based on SSTMD’s target frequency and damping ratio. SSTMD can achieve higher damping ratios when using viscoelastic materials with a high-loss factor.
To test the vibration reduction effect, 9 SSTMD devices were fabricated, with high-damping polyurethane material SP100 as the viscoelastic layer and steel as the constraint layer. The material parameters are shown in Table 1. The sandwich cantilever oscillator that meets the target frequency and damping ratio is designed according to the design method in [30]. The effective mass of the SSTMD device is raised through the stack of sandwich cantilever oscillators. When the target control frequency is 200–450 Hz, according to the minimax principle in Section 2, the optimized frequency of the oscillator is taken as 450 / 200 × 200 = 300   Hz . The geometric parameters of the sandwich cantilever oscillator are shown in Table 2, and the equivalent dynamic parameters of the SSTMD device are shown in Table 3. The installation of the SSTMD device is shown in Figure 5.

3.3. Test Conditions and Methods

The modal of the uncontrolled specimen is tested to confirm the dense modal characteristics in this frequency range. The vibration characteristics of the RC wall under pipe excitation and the vibration mitigation effect of dTMD are evaluated by frequency response comparison of uncontrolled and controlled structures.
Vibration control on the vibration propagation path or the vibration receiver is a common strategy. Different arrangements of dTMD can be used to reduce vibration on the propagation path and at the receiver terminal, respectively. For the specimen shown in Figure 3, the wall on which the pipeline excitation is located can be referred to as the vibration source wall, while adjacent walls can be considered the receiver wall. When dTMD is arranged on the vibration source wall, it can be seen as controlling the vibration path to reduce the receptor wall’s vibration, as shown in Figure 6a,b. On the contrary, we can also directly arrange dTMD on the receptor wall, as shown in Figure 6c,d.
It is worth noting that the complexity of actual pipeline excitation comes from its hydrodynamic interaction and the multi-directionality of the excitation components. To investigate the applicability of applying modal damping to evaluate the vibration reduction effect of complex excitations, we also tested the vibration characteristics of the wall under longitudinal and transverse excitation of pipelines.
Because of the differences in the placement of dTMD and the direction of excitation, two uncontrolled and four controlled test conditions were designed for the W-shaped wall (as shown in Figure 6), two uncontrolled test conditions and two controlled conditions were designed for the U-shaped wall (as shown in Figure 7). The numbering and differences of each working condition are summarized in Table 4.
To obtain the vibration intensity of the wall under pipeline excitation, a force hammer is used to excite the wall vibration along the pipeline or vertically striking the pipeline (as shown in Figure 8). Acceleration sensors are arranged on the wall panel to collect the acceleration response of the wall vibration. After obtaining the input force signal and output acceleration signal, the acceleration frequency response function of each measurement point on the wall is obtained through data processing. Forty-eight measuring points (numbered 1–48) were evenly arranged on the receptor wall of the U-shaped wall, as shown in Figure 9a. Thirty-six acceleration measurement points were uniformly arranged (numbered 1–36) on the receptor wall of the W-shaped wall, as shown in Figure 9b.

4. Test Results

4.1. U-Shaped Wall Modal Test Results Analysis

To obtain the frequency response function required for modal analysis, 120 acceleration sensor measurement points are evenly arranged on each wall surface of the U-shaped wall. Then a point on the middle wall is used as the force hammer impact point. Use a hammer to vertically strike the wall while collecting the input force signal of the force hammer and the output acceleration signal of each measurement point, to obtain the acceleration transfer function from the excitation point to each acceleration measurement point. After obtaining one or more columns of the frequency response function matrix through single input multiple outputs (SIMO), the modal parameter identification algorithm can obtain the U-shaped wall’s modal shape, frequency, and damping ratio (as shown in Table 5).
The existing modal analysis results indicate that the high-frequency vibration of the wall panel has complex and dense modal characteristics, and the modal damping ratio of the high-order modes of the wall panel is about 1.0~1.7%. Due to the low modal damping of dense modes of wall panels, significant high-frequency vibration responses will be generated under high-frequency pipeline excitation.
The tested dense mode also indicates that it is difficult to design TMD according to design methods based on single or multimodal modes when the target frequency research is about 350 Hz.

4.2. Vibration Mitigation Effect under Single-Point Bidirectional Excitation

Considering the high-frequency dense modes exhibited by the wall panel in the above modal test results, the vibration reduction effect is evaluated by arranging SSTMD on the wall panel. After obtaining the results of each measurement point shown in Figure 9, the root means square value (RMS value) of the vibration transfer frequency response of the wall panel is calculated as shown in Equation (9):
R M S F R F ω = 1 n i = 1 n F R F i ω 2
where the acceleration frequency response function F R F i ω = A i ω / F ω . n is the number of acceleration measurement points. A i ω is the vibration acceleration response of the ith measurement point, and F ω is the excitation force.
After processing the test results, the results of installing SSTMD on the vibration source wall of the W-shaped wall are compared with the uncontrolled results, as shown in Figure 10. The results of installing SSTMD on the receptor wall of the W-shaped specimen are compared with the uncontrolled results, as shown in Figure 11. The comparison between the controlled and the uncontrolled results of installing SSTMD on the receptor wall of the U-shaped specimen is shown in Figure 12.
Figure 10, Figure 11, Figure 12 illustrate that dTMD have a good vibration reduction effect on the high-frequency vibration of the receptor wall in the frequency range of 200–450 Hz under different pipeline excitation methods. Especially for peaks near 300 Hz, the vibration reduction effect of the controlled structure is obvious, indicating that the true frequency of the TMD device is close to the design value.
Calculate the vibration mitigation rates of W-shaped and U-shaped walls relative to uncontrolled walls to compare the difference in RMS values caused by dTMD excitation in the x and y directions. The definition of vibration mitigation rate D is shown in Equation (10):
D = R M S w / o R M S w R M S w / o
where R M S w / o is the root mean square value of the frequency response of the uncontrolled wall according to Equation (9), and R M S w is the root mean square value of the frequency response of the controlled wall.
The results of the vibration mitigation rate of the controlled receptor wall relative to the uncontrolled wall in Figure 13a shows this phenomenon: the difference in the vibration mitigation rate law under excitation conditions in the two directions (x direction and y direction) mainly occurs in the range of 200–250 Hz, while the vibration mitigation rate law is very consistent in other frequency bands (especially near the designed natural frequency of the oscillator at 302 Hz). The difference in vibration between 200 and 250 Hz may be due to certain detuning issues caused by tight connections. Linear fitting is performed on the vibration mitigation effect of the W-shaped wall under x-direction excitation and y-direction excitation, and it can be found that the two have a very high linear correlation, with R2 reaching 0.81, as shown in Figure 14. This indicates that although there are differences in the response of pipelines under single point and bidirectional excitation, the vibration reduction rate brought by dTMD seems to be the same. This also indicates that our previous minimax optimization under single-point and unidirectional excitation is likely equally applicable in single-point-bidirectional excitation.
Similarly, the comparison in the x and y directions in Figure 13b exhibits similar phenomena, indicating that the vibration mitigation rate of dTMD in the sense of average vibration wall transmission is unaffected by the excitation direction.
It is also worth noting that the receptor wall and vibration source wall in the W-shaped specimen are coplanar, while the receptor wall and vibration source wall of the U-shaped wall are perpendicular. Therefore, the vibration propagation modes between the W-shaped and U-shaped walls differ. Figure 13a,b exhibit different vibration mitigation rate patterns, indicating that the propagation mode also influences the distribution of the vibration mitigation rate.

5. Evaluation of Design Methods

Previous studies have shown that the control effect of dTMD on the broadband and dense modes of structures can be approximately characterized by indicators such as bandgap width [24,25], attenuation constant [26,27], and modal damping [20]. However, the attenuation constant is obtained based on the infinite period theory, whose derivation is relatively complex for the quantitative design of finite engineering structures. The calculation formula for the first bandgap width based on an undamped system is relatively simple. This section first evaluates the comparison between the bandgap width calculation formula and the experimental prediction results in this paper. Then, we compare the theory-predicted modal damping curve with the measured vibration mitigation rate to evaluate the optimization method of oscillator frequency based on modal damping.

5.1. Predicted Bandgap Width and Measured Vibration Mitigation Frequency Range

Many studies on local resonance metamaterial estimate the width of the band gap by using the simplified formula of the first local resonance band gap shown in Equation (11):
λ p l = [ 1 + μ 1 ] f t
where f t is the natural frequency of the oscillator, μ is the mass ratio of dTMD to the uniformly arranged wall. For the test in this paper, the effective mass ratio μ = 0.026 , and the calculated dimensionless bandwidth is 0.0125, resulting in a bandgap width of 0.0125 × 302 = 3.775   Hz . The comparison between the predicted bandgap based on the design value of the oscillator frequency and the measured mitigation frequency rate is shown in Figure 15. For the high-damping TMD applied in this article, the bandgap formula’s predicted vibration mitigation frequency band is so narrow that it underestimated the actual vibration mitigation frequency band. This is because the simplified calculation formula for the bandgap shown in Equation (11) is derived based on an undamped oscillator. However, the dTMD used in this article have significant damping. Previous studies [19] have shown that increasing the damping of the oscillator will reduce the vibration reduction effect within the bandgap, but it will significantly broaden the vibration reduction frequency band. The above results indicate that theory-predicted bandgaps do not seem appropriate for estimating the vibration reduction frequency range caused by high-damping oscillators.

5.2. Evaluation of Method Based on Modal Damping

Compare the measured vibration mitigation rate with Equation (1) predicted modal damping curve, as shown in Figure 15. Overall, the modal damping has a similar trend to the vibration mitigation rate of the controlled wall. The difference between the measured vibration mitigation rate and the theoretical predicted modal damping trend may be due to the frequency deviation between the design value of the oscillator frequency and the actual value. The SSTMD’s design nature frequency is 302 Hz, shown in Table 3, while the practical value is close to 320 Hz, illustrated by the peak of the vibration mitigation rate.
If the modal damping curve is moved based on the actual tested oscillator frequency, as shown in Figure 16. For the shaded areas near 290–390 Hz in Figure 16a and near 273–360 Hz in Figure 16b, the modal damping curve is very close to the trend of the vibration reduction effect. The measured vibration reduction effects of two frequency points with the same modal damping values in the modal damping curve are very close. This verifies the rationality of using modal damping curves to characterize the vibration reduction effect in Section 2.
The modal damping curve of the wall with the measured vibration mitigation rate is further linearly fit within the frequency range of 250~400 Hz, as shown in Figure 17. The results indicate that except for u-R-Fx, the modal damping curve under the other three test conditions has a good linear correlation with the measured vibration mitigation rate, with R2 reaching around 0.49~0.56. This indicates that although there may be frequency deviations in the actual design of SSTMD, the overall trend of the vibration reduction effect near the oscillator frequency is close to the law of the modal damping curve.
The deviation outside the shaded area may be due to the machining and installation deviation of fasteners or the rotational freedom of SSTMD.

6. Conclusions

The distributed tuned mass dampers (dTMDs) can effectively control the broadband vibration of the structure. However, the design controlling the broadband multimodal vibration of the structure under complex excitation in multiple directions is difficult. This article proposes the method of oscillator frequency optimization based on modal damping. Two RC wall specimens are tested with oscillators arranged on the receptor or vibration source walls under two pipeline excitation directions. The conclusions are as follows:
  • The modal test results of the U-shaped wall indicate that a typical RC wall has a rich natural vibration mode when the target frequency range reaches 300 Hz. The mode density significantly increases with the increase in frequency;
  • The tests of U-shaped and W-shaped walls have verified that using dTMD can significantly reduce the vibration of RC walls in the frequency range of 200–450 Hz. The comparison results of controlled and uncontrolled frequency responses of U-shaped and W-shaped walls indicate that arranging dTMD on the target-controlled receptor wall can effectively control the broadband multimodal vibration of the receptor wall from 200 to 450 Hz. The comparison results of the W-shaped wall’s controlled and uncontrolled frequency response indicate that arranging dTMD on the vibration source wall can effectively control the broadband vibration of the receptor wall from 200 to 450 Hz. dTMD can effectively control both lateral and longitudinal excitation of pipelines;
  • The comparison between bandgap prediction and the measured effective vibration reduction frequency range of the vibration source wall shows that the optimal vibration reduction frequency range is close to the bandgap range. However, for the damped oscillator used in this article, the range predicted by the bandgap width estimation formula will greatly underestimate its vibration mitigation frequency range;
  • The response of the wall under two excitation directions at the same excitation point is significantly different. However, there is a strong correlation between the vibration reduction effect of dTMD on the wall, with R2 reaching 0.81. Extending the frequency optimization method under single-point unidirectional excitation to single-point bidirectional excitation is reasonable;
  • U-shaped and W-shaped walls’ average vibration mitigation rate with uniformly dTMD on the receptor wall correlates well with the theory-predicted modal damping. The measured vibration reduction effects of two frequency points with the same modal damping value in the modal damping curve are very close. Therefore, it is feasible to apply modal damping to make the target control frequency band’s upper and lower bounds have comparable vibration mitigation effects.

Author Contributions

Conceptualization, F.D., M.C. and W.Y.; methodology, W.Y. and F.S.; software, F.D.; validation, F.S., W.Y. and M.C.; formal analysis, M.C. and W.Y.; investigation, F.D.; resources, F.S. and M.C.; data curation, F.D.; writing—original draft preparation, M.C. and W.Y.; writing—review and editing, M.C., W.Y., F.S., S.H. and Y.H.; visualization, F.D. and W.Y.; supervision, F.S.; project administration, F.S. and F.D.; funding acquisition, F.S. All authors have read and agreed to the published version of the manuscript.

Funding

This research was funded by the National Science and Technology Major Project, No. 2019ZX06004001.

Data Availability Statement

Research data are available from the corresponding author upon reasonable request.

Acknowledgments

We thank the journal experts who edited this paper. We also appreciate the reviewers’ and editors’ constructive suggestions and comments on the manuscript.

Conflicts of Interest

The authors declare no conflict of interest.

References

  1. Taha, A.E. Vibration Control of a Tall Benchmark Building under Wind and Earthquake Excitation. Pract. Period. Struct. Des. Constr. 2021, 26, 04021005. [Google Scholar] [CrossRef]
  2. El Ouni, M.H.; Abdeddaim, M.; Elias, S.; Ben Kahla, N. Review of Vibration Control Strategies of High-Rise Buildings. Sensors 2022, 22, 8581. [Google Scholar] [CrossRef] [PubMed]
  3. Elias, S.; Matsagar, V. Research developments in vibration control of structures using passive tuned mass dampers. Annu. Rev. Control. 2017, 44, 129–156. [Google Scholar] [CrossRef]
  4. Rahimi, F.; Aghayari, R.; Samali, B. Application of Tuned Mass Dampers for Structural Vibration Control: A State-of-the-art Review. Civ. Eng. J. 2020, 6, 8. [Google Scholar] [CrossRef]
  5. Komarizadehasl, S.; Huguenet, P.; Lozano, F.; Lozano-Galant, J.A.; Turmo, J. Operational and Analytical Modal Analysis of a Bridge Using Low-Cost Wireless Arduino-Based Accelerometers. Sensors 2022, 22, 9808. [Google Scholar] [CrossRef]
  6. Debnath, N.; Deb, S.; Dutta, A. Multi-modal vibration control of truss bridges with tuned mass dampers under general loading. J. Vib. Control. 2016, 22, 4121–4140. [Google Scholar] [CrossRef]
  7. Zhang, M.; Xu, F. Tuned mass damper for self-excited vibration control: Optimization involving nonlinear aeroelastic effect. J. Wind. Eng. Ind. Aerodyn. 2022, 220, 104836. [Google Scholar] [CrossRef]
  8. Zhang, M.; Wu, T.; Øiseth, O. Vortex-induced vibration control of a flexible circular cylinder using a nonlinear energy sink. J. Wind. Eng. Ind. Aerodyn. 2022, 229, 105163. [Google Scholar] [CrossRef]
  9. Pellizzari, F.; Marano, G.; Palmeri, A.; Greco, R.; Domaneschi, M. Robust optimization of MTMD systems for the control of vibrations. Probabilistic Eng. Mech. 2022, 70, 103347. [Google Scholar] [CrossRef]
  10. Domaneschi, M.; Martinelli, L.; Po, E. Control of wind buffeting vibrations in a suspension bridge by TMD: Hybridization and robustness issues. Comput. Struct. 2015, 155, 3–17. [Google Scholar] [CrossRef]
  11. Alikhail, M.; Xun, L. Concrete Slab Vibration and Structure-Borne Noise, Burj Dubai Case Study. In Proceedings of the Acoustics 2008, Geelong, VIC, Australia, 24–26 November 2008. [Google Scholar]
  12. Lee, C.-L.; Wang, Y.-P.; Su, R.K.L. Assessment of vibrations induced in factories by automated guided vehicles. Proc. Inst. Civ. Eng.-Struct. Build. 2013, 166, 182–196. [Google Scholar] [CrossRef] [Green Version]
  13. Gao, M.W.; Fang, C.Y. Vibration responses analysis of hydro-plant powerhouse structure due to endogenic vibration. Water Power 2017, 43, 44–46+103. [Google Scholar]
  14. Price, S.; Smith, D.R. High-Frequency Piping Vibration and Noise. In Proceedings of the 4th International Pipeline Conference, Calgary, AB, Canada, 29 September–3 October 2002. [Google Scholar]
  15. Hwang, J.-S.; Kim, H.; Moon, D.-H.; Park, H.-G. Control of floor vibration and noise using multiple tuned mass dampers. Noise Control. Eng. J. 2011, 59, 652. [Google Scholar] [CrossRef]
  16. Wang, M.Q.; Sheng, M.P.; Sun, J.C. The characteristic of power flow in broad band dynamic vibration absorber. Chin. J. Acoust. 2002, 21, 360–364. [Google Scholar]
  17. Li, C.; Han, B.; Du, D. Robustness evaluation of the control strategy of dual-layer multiple tuned mass dampers (DMTMD) for structures. Earthq. Eng. Eng. Vib. 2004, 24, 97–104. [Google Scholar]
  18. Aida, T.; Kawazoe, K.; Toda, S. Vibration Control of Plates by Plate-Type Dynamic Vibration Absorbers. J. Vib. Acoust. 1995, 117, 332–338. [Google Scholar] [CrossRef]
  19. Colombi, A.; Roux, P.; Guenneau, S.; Rupin, M. Directional cloaking of flexural waves in a plate with a locally resonant metamaterial. J. Acoust. Soc. Am. 2015, 137, 1783–1789. [Google Scholar] [CrossRef]
  20. Baek, G.O.; Mun, D.H.; Han, H.K.; Park, H.G. Analysis of heavy-weight floor impact noise and vibration of concrete slabs in a residential building. In Proceedings of the 2015 World Congress on Advances in Civil, Environmental, and Materials Research (ACEM15), Incheon, Republic of Korea, 25–29 August 2015. [Google Scholar]
  21. Dayou, J.; Wang, S. Derivation of the Fixed-Points Theory with Some Numerical Simulations for Global Vibration Control of Structure with Closely Spaced Natural Frequencies. Mech. Based Des. Struct. Mach. 2006, 34, 49–68. [Google Scholar] [CrossRef]
  22. Jung, J.; Kim, H.-G.; Goo, S.; Chang, K.-J.; Wang, S. Realisation of a locally resonant metamaterial on the automobile panel structure to reduce noise radiation. Mech. Syst. Signal Process. 2018, 122, 206–231. [Google Scholar] [CrossRef]
  23. Jain, P.; Mukherjee, A.; Krishna, Y. Tuned mass dampers for flight vehicle components subjected to rocket noise. Aerosp. Sci. Technol. 2011, 15, 175–182. [Google Scholar] [CrossRef]
  24. Li, C.; Zhu, B. Estimating double tuned mass dampers for structures under ground acceleration using a novel optimum criterion. J. Sound Vib. 2006, 298, 280–297. [Google Scholar] [CrossRef]
  25. Johnson, M.; Batton, B. Wave based optimization of distributed vibration absorbers. J. Acoust. Soc. Am. 2005, 118, 1868–1869. [Google Scholar] [CrossRef]
  26. Park, S.; Lee, J.Y.; Jeon, W. Vibration damping of plates using waveguide absorbers based on spiral acoustic black holes. J. Sound Vib. 2022, 521, 116685. [Google Scholar] [CrossRef]
  27. da Costa, M.M.A.; Castello, D.A.; Magluta, C.; Roitman, N. On the optimal design and robustness of spatially distributed tuned mass dampers. Mech. Syst. Signal Process. 2021, 150, 107289. [Google Scholar] [CrossRef]
  28. Yin, W.H.; Sun, F.F.; Liou, J.H.; Zhang, G.; Qian, C. Modal damping of composite plate distributed with dissipative oscillators and its correlation with vibration mitigation performance under multi-point excitation. Chin. Q. Mech. 2022, 43, 512–525. [Google Scholar]
  29. Yin, W.-H.; Sun, F.-F. Analytical method of the modal damping ratio of the beam with distributed dissipative oscillators and application in broadband vibration mitigation. Mech. Syst. Signal Process. 2022, 166, 108470. [Google Scholar] [CrossRef]
  30. Dong, F.; Sun, F.F.; Yin, W.H.; Chu, M.; Wang, B.; Cao, Z.; Yao, Z.T.; Gong, Q.; Jin, H.J. Two-step design method of high frequency sandwich damping steel tuned mass damper. Prog. Steel Build. Struct. 2021, 23, 85–93+100. [Google Scholar]
Figure 1. Normalized parameters.
Buildings 13 01686 g001
Figure 2. Modal damping distribution before and after optimization.
Buildings 13 01686 g002
Figure 3. Dimensions of specimens. (a) U-shaped specimen; (b) W-shaped specimen.
Buildings 13 01686 g003
Figure 4. Stacked sandwich TMD device (SSTMD). (a) General assembly drawing of the device; (b) Device composition; (c) Shear deformation of viscoelastic materials in sandwich cantilever oscillators.
Buildings 13 01686 g004
Figure 5. The installation of the SSTMD device.
Buildings 13 01686 g005
Figure 6. Testing of Controlled W-shaped Walls. (a) w-S-Fx; (b) w-S-Fy; (c) w-R-Fx; (d) w-R-Fy.
Buildings 13 01686 g006
Figure 7. Testing of controlled U-shaped walls. (a) u-R-Fx; (b) u-R-Fy.
Buildings 13 01686 g007
Figure 8. Pipeline incentive method. (a) Hammer excite direction for U-shaped wall; (b) Hammer excite direction for W-shaped wall.
Buildings 13 01686 g008
Figure 9. The layout of acceleration measurement points for reinforced concrete walls. (a) Measurement points for U-shaped wall; (b) Measurement points for W-shaped wall.
Buildings 13 01686 g009
Figure 10. Comparison of control and uncontrol results of vibration source wall (W-shaped wall). (a) w-Fx; (b) w-Fy.
Buildings 13 01686 g010
Figure 11. Comparison of control and uncontrol results of receptor wall (W-shaped wall). (a) w-Fx; (b) w-Fy.
Buildings 13 01686 g011
Figure 12. Comparison of control and uncontrol results of receptor wall (U-shaped wall). (a) u-Fx; (b) u-Fy.
Buildings 13 01686 g012
Figure 13. Comparison of vibration mitigation rates. (a) Receptor control at a W-shaped wall; (b) Receptor control at a U-shaped wall.
Buildings 13 01686 g013
Figure 14. Linear correlation between damping performance in x-direction and y-direction (Receptor control at W-shaped wall).
Buildings 13 01686 g014
Figure 15. Comparison between predicted bandgap and measured damping rate.
Buildings 13 01686 g015
Figure 16. Comparison of vibration mitigation rate and modal damping curve. (a) W-shape specimen; (b) U-shape specimen.
Buildings 13 01686 g016
Figure 17. Linear correlation between vibration mitigation rate and modal damping curve. (a) w-R-Fx; (b) w-R-Fy; (c) u-R-Fx; (d) u-R-Fy.
Buildings 13 01686 g017
Table 1. Steel plate and SP100 material parameters.
MaterialDensityPoisson’s RatioElastic ModulusLoss Factor
Damping layerSP100352.8 kg/m30.492.65 MPa0.47
Constraint layerSteel7850 kg/m30.30206 GPa
Table 2. Geometric dimensions of a single sandwich cantilever oscillator.
Frequencyh1h2h3bl
302 Hz1.5 mm50 mm1.5 mm200 mm61.5 mm
Table 3. Equivalent dynamic characteristics of one SSTMD.
FrequencyTotal MassEffective MassDamping Ratio
302 Hz42.69 kg6.21 kg7.2%
Table 4. Test Conditions.
Case No.Excitation DirectionTMD Layout Location
w-w/o-Fxx
w-w/o-Fyy
w-S-Fxxvibration source wall
w-S-Fyyvibration source wall
w-R-Fxxreceptor wall
w-R-Fyyreceptor wall
u-w/o-Fxx
u-w/o-Fyy
u-R-Fxxreceptor wall
u-R-Fyyreceptor wall
Table 5. Modal test results of U-shaped wall.
f (Hz)ξ (%)f (Hz)ξ (%)f (Hz)ξ (%)f (Hz)ξ (%)f (Hz)ξ (%)
Buildings 13 01686 i001Buildings 13 01686 i002Buildings 13 01686 i003Buildings 13 01686 i004Buildings 13 01686 i005
11.160.73521.624.27535.731.92439.061.06859.633.111
Buildings 13 01686 i006Buildings 13 01686 i007Buildings 13 01686 i008Buildings 13 01686 i009Buildings 13 01686 i010
88.990.770102.141.180126.822.619142.361.324162.581.333
Buildings 13 01686 i011Buildings 13 01686 i012Buildings 13 01686 i013Buildings 13 01686 i014Buildings 13 01686 i015
181.471.326240.241.355247.081.100268.231.134291.671.225
Buildings 13 01686 i016Buildings 13 01686 i017Buildings 13 01686 i018Buildings 13 01686 i019Buildings 13 01686 i020
298.951.352310.200.901319.831.160326.391.183344.401.743
Disclaimer/Publisher’s Note: The statements, opinions and data contained in all publications are solely those of the individual author(s) and contributor(s) and not of MDPI and/or the editor(s). MDPI and/or the editor(s) disclaim responsibility for any injury to people or property resulting from any ideas, methods, instructions or products referred to in the content.

