Article

Interface Shear Strength Behavior of Cement-Treated Soil under Consolidated Drained Conditions

Faculty of Civil Engineering, Ho Chi Minh City University of Technology and Education (HCMUTE), 01 Vo Van Ngan Street, Thu Duc City, Ho Chi Minh City 70000, Vietnam
*
Author to whom correspondence should be addressed.
Buildings 2023, 13(7), 1626; https://doi.org/10.3390/buildings13071626
Submission received: 5 May 2023 / Revised: 9 June 2023 / Accepted: 25 June 2023 / Published: 27 June 2023

Abstract

:
This paper presents a series of laboratory tests to determine the shear strength and interface shear strength of cement-treated silty soil under consolidated and drained conditions. The test variables include the effective normal stress, cement content, and curing period. Experimental results indicated that the effective shear strength and interface shear strength of cement-treated soil specimens increased significantly as the cement content increased. After 28 days, the average shear strength ratio increased from 1.28 to 2.4, and the average interface efficiency factor improved from 1.15 to 1.55 as the cement content increased from 3% to 10%. It resulted from an increase in grain size and the fraction of sand-sized particles in the treated soils, approximately in two-time increments for the specimens treated with 10% cement content after 28 days of curing. In addition, the peak and residual values of the shear strength and interface shear strength of the cement-treated soil specimens were determined to assess their brittle behavior under high shear deformation. Last, two new empirical models are introduced herein. The first power equation is to predict the shear strength ratio of cement-treated soil at 28 days of curing using the soil-water/cement content ratio. The other proposed model is useful for assessing the rate of shear strength and interface shear development of cement-treated soil specimens within 56 days of curing.

1. Introduction

The deep mixing method (DMM) is an established grouting technique for improving the mechanical properties (such as shear strength, deformation behavior, and permeability) of soft clay. In the DMM procedure, cement is the most popular binder injected and mixed with soil using a rotating shaft, paddles, or jet in constructing deep soil-mixed walls for excavation and tunnel support [1]. Subsequently, the improvement approach was also integrated with the sheet pile wall to enhance the stability of excavations, decrease the horizontal displacement of walls, and minimize the impact of the deep excavation on adjacent structures [2]. Moreover, in the Mekong Delta, sheet pile walls and cement-treated soil were also utilized to maintain cofferdam structures and prevent water leakage between sheet pile wall segments during riverbed excavation [3]. In addition, temporary H-piles were installed in the excavation to support the shoring system vertically. In these instances, the shear strength and interface shear strength parameters are crucial in quantifying either the lateral earth pressure of the treated soil acting on sheet pile walls or the skin friction of the H-piles.
The improvement in characteristics of cement-treated soil has been attributed to the cement reactions, which include a primary hydration reaction followed by a secondary pozzolanic reaction. The hydration reaction forms the primary cementitious materials [4,5].
2 3 C a O S i O 2 + 6 H 2 O 3 C a O 2 S i O 2 3 H 2 O + 3 C a ( O H ) 2
2 2 C a O S i O 2 + 4 H 2 O 3 C a O 2 S i O 2 3 H 2 O + C a ( O H ) 2
The secondary pozzolanic reaction between the hydrated lime, the silica, and the alumina from the clay minerals would form calcium silicate hydrates (CSH) and aluminate hydrates (CAH).
C a ( O H ) 2 + S i O 2 C a O S i O 2 H 2 O
C a ( O H ) 2 + A l 2 O 3 C a O A l 2 O 3 H 2 O
Hydration and pozzolanic reactions improved the strength of cement-treated soil, in which hydration occurred in the early stages of hardening and pozzolanic reactions occurred considerably later [6]. As a result, the cementitious materials gradually fill the void spaces and enhance soil particle connections. Since the rate of strength development with time is mainly determined by the hydration process [7], numerous studies have used the strength of cement-stabilized soil at 28 days as a reference value [8,9]. In particular, Horpibulsuk et al. [8] and Horpibulsuk et al. [9] investigated the influence of curing time on the unconfined compressive strength of cement-treated coarse-grained soils and silty clay. In most prior investigations, a correlation between unconfined compressive strength and curing time was well established to assess the rate of strength development in cement-treated soil. The rates of shear strength and the interface shear strength development of the treated soils have yet to be determined in previous studies.
The shear strength of cement-treated soil has been studied using numerous experimental techniques. To determine the shear strength of soil, standard triaxial compression and unconfined compressive strength tests are the most typical laboratory techniques. In these two test procedures, a cylindrical soil specimen with standard dimensions and a length-to-diameter ratio of 2 is subjected to axisymmetric stress. According to the results of laboratory experiments, the unconfined compressive strength of the treated soil rose with the addition of cement [10,11,12,13,14,15]. The conclusions were based on the test results of different types of soils, including Bangkok soft clay [10,11], marine clays [12,14], Washington State soils [13], and silica sand [15]. Some researchers have demonstrated that the after-curing void ratio and water-cement ratio are enough to characterize the strength and compressibility of cement-treated clay [11,12]. Several investigations performed the triaxial compression test to examine the undrained shear strength of cement-treated soils. The test results indicated that the undrained shear strength rises with increasing confining pressure and curing time [16,17]. Under unconfined and triaxial compression, cement-treated soils demonstrated much more brittle behavior than untreated soils [13]. For the plane strain test, laboratory tests revealed that the behavior of the shear strength and excess pore pressure of cement-treated soils were comparable to those of overconsolidated clays [14]. A few studies have conducted various types of direct shear tests to investigate the shear behavior of the modified soil. The findings indicated that the cohesion and friction angle of cement-treated soil increased with increasing amounts of binder and curing time [18,19]. In direct shear tests and unconfined compression tests, the experimental investigations illustrated that the utilization of cemented specimens increased strength parameters, reduced displacement at failure, and changed soil behavior to an observable brittle behavior [18]. In addition to the conventional cement, rice husk ash was added to the soil and cement mixture to improve the cohesion and friction angle of the treated soil [19]. Sukpunya et al. [20] designed a large, simple shear test rig for determining the shear strength of stabilized soil columns in the composite ground. Based on the test results, the study recommended a correction factor to stabilize soil for slip circle analysis of stabilized soil columns. Although numerous studies have evaluated the shear strength of cement-treated soils with varying cement contents, the loss in shear strength and interface shear strength from their peak values due to their brittle nature has yet to be thoroughly reported.
The shear strength of the soil-steel interface was evaluated using various modified direct shear test apparatuses. The most commonly used shear test apparatus was a conventional direct shear box with the lower portions of the box replaced with an interface plate [18,19,21,22,23]. Tsubakihara et al. [21] estimated the effective interface shear behavior of clay and mild steel under consolidated, drained shear conditions using a simple direct shear type of test apparatus. In addition, the ring shear box and conventional direct shear box were utilized to determine the shear properties of the clay-steel interface [22]. However, previous research has rarely assessed the shear strength of the cement-treated soil-steel interface. Hamid et al. [23] investigated the interface shear performance of a bio-cemented soil-steel interface using a large-scale direct shear apparatus. The test results revealed that bio-cementation significantly increased the shear strength parameters of the soil-steel interface.
This study presents a series of laboratory experiments to determine the shear strength and interface shear strength of cement-treated soil specimens under consolidated, drained conditions. The objectives of the study are to examine the effects of cement content and curing time on the shear strength behavior of the cement-treated clay and steel interface. In addition, grain size analysis was conducted on the treated soil samples to reveal the influence of cement treatment on enhancing the soil structure and increasing shear strength. In addition, the brittleness of the treated soil was also evaluated through peak and residual strength values. Lastly, this research proposed two correlation equations to predict the strength ratio and quantify the rate of shear strength and interface shear strength development in cement-treated soil specimens with respect to curing time.

2. Experimental Program

2.1. Silty Soil

This study utilized the soft soil collected from the CaiLon River in southern Vietnam. In its natural state, the soil had a high void ratio, e = 1.57, and a high water content, w = 57.4%. The Atterberg limits of the soil include the liquid limit (LL), plastic limit (PL), and plasticity index (PI), which are 91.5, 44.9, and 46.5, respectively. According to the Unified Soil Classification System, this soil is high-plasticity inorganic silt (MH). Figure 1 depicts the grain size distribution, which was determined using ASTM D422 [24]. The test results show that the sand content, fines content, and median particle size, D50, are 12.3%, 87.7%, and 0.006 mm, respectively. The ignition loss of the soil was 3.96% at about 900 °C, at which decarbonization would be completed [25]. Although the ignition loss cannot definitively indicate the amount of organic matter, it shows minimal organic content in the soil samples.

2.2. Ordinary Portland Cement

This investigation utilized ordinary Portland cement PC40 with a specified density of 3.0 g/cm3 (ASTM C188 [26]). According to ASTM C595 [27], the specific surface area (Blaine technique) was 2800 cm2/g, while 10% of the sieve size was retained. Using ASTM C191 [28], the initial and final setting times were approximately 185 and 480 min, respectively. In addition, the minimum required compressive strength at three days, 45 min, and 28 days, 8 h, was 21 and 40 MPa, respectively. The result of the Le-Chatelier apparatus test was 10 mm. Table 1 presents the oxide composition of PC40. Note that the ratio of CaO to SiO2 was higher than 2.0 and the MgO content was less than 2.0%, which conformed to the European Cement Standard’s specifications (EN 197-1) [29]. By mixing the cement with the soil with a high water content, the primary hydration reaction happens in the cement-water mixture, as shown in Equations (1) and (2). The pozzolanic reaction would then occur between the hydrated lime and clay minerals (Equations (3) and (4)). This soil-cement reaction provides a clear basis by which to explain the improvement in the strength of stabilized soil, as discussed previously.

2.3. Modified Shear Box

The direct shear test was conducted using conventional direct shear equipment with a shear box of 60 mm × 60 mm. In addition, a modified shear box was developed to evaluate the interface shear strength between untreated or cement-treated soils and a stainless steel surface. As shown in Figure 2, the upper shear box is filled with soil, while the original lower shear box has been replaced with a stainless steel plate. A stainless steel plate was used because it would be able to prevent chemical corrosion during the specimen soaking process. The modified shear box mirrors that proposed by Tsubakihara et al. [21].

2.4. Specimen Preparation

The soil specimens in this study were remodeled from natural soil to ensure homogeneity. Firstly, the riverbed soil was excavated and dried in an oven at less than 60 °C. With a rubber hammer, it was then pulverized into a powder (100% passing Sieve No. 40) without crushing the soil particles. The remolding water content plays a crucial role in influencing the strength of cement-treated soils [11]. In this investigation, the powdered soil was mixed with tap water at 57.4% moisture content to simulate the soil condition in the deep mixing wall. A quantity of dry cement, equivalent to the cement content, was then put into the soft soil. The cement content is defined as the mass ratio of cement to dry soil expressed as a percentage. After 15 min of mixing, the uniform was transferred to a rectangular stainless steel mold 60 mm in width, 60 mm in length, and 20 mm in thickness. Trapped air bubbles were removed from the samples by tapping gently on the walls of each mold and employing the thumb-kneading technique [30,31]. It takes about 60 min to complete a sample (mix and compact), less than the first setting time of Portland cement. Two porous stone plates then covered the molds at the two ends to confine the specimens and preserve their original volume. The prepared samples were then cured by soaking them in water to simulate the saturated condition of the treated soil after mixing. This curing procedure is consistent with the preparation approach provided by Chew et al. [6] for cement-treated soil samples. It was also adapted to the curing state of the cement-treated soil in the deep mixing wall using the dry mixing method under the groundwater level.
After 7, 14, 28, and 56 days of curing, the samples were tested by direct shear and interface direct shear tests under consolidated, drained conditions. At first, the prepared samples were consolidated in saturated conditions for 24 h under normal consolidation pressures, according to ASTM D3080 [32]. The tests were then performed with the shearing rate fixed at 0.004 mm/min to prevent significant excess pore water pressure at failure [23]. It was evaluated based on the assumption that MH-type soil would fail at 10% shear strain after 24 h of shearing, as recommended by ASTM D3080 [32]. As per ASTM D5321 [33], the tests in this investigation would end when the shear displacement reaches 5 mm, the threshold at which the applied shear force remains constant with increasing displacement. The repeatability and consistency of the test results were evaluated by conducting several tests on the samples under the same conditions.
The variations of the two tests include effective normal stresses, cement contents, and curing periods. The four levels of effective normal stresses are 50, 100, 150, and 200 kPa, as shown in Table 2, and they correspond to the overburden pressure of the soil at a depth of roughly 3 m to 12 m (i.e., the unit weight of the soil was about 17 kN/m3). The cement contents for cement-treated soil were set based on the soil-water/cement ratio, w/Cm, which is defined as the ratio of soil water content to cement content. Previous studies identified w/Cm as a crucial parameter for analyzing and assessing laboratory strength development in cement-admixed clays [7,9,34]. The lower the w/Cm, the higher the cementation bond strength, which leads to higher strength. Since the water content of the soil was 57.4%, the cement contents were set from 3% to 10%, equivalent to the values w/Cm varying from 5.7 to 19.1. A similar range of w/Cm (i.e., 4–14) was utilized to investigate the unconfined compression strength of cement-admixed Bangkok clay [9]. Last, the admixed samples with 10% cement were tested at 3, 7, 14, 28, and 56 days under 200 kPa of normal stress to determine the strength development in cement-treated soil with curing time. After 28 days of curing, the particle size of the cement-treated soil specimens was determined following ASTM D422 [24]. In particular, the distribution of particle sizes larger than 75 mm (retained on the No. 200 sieve) in the treated specimens was obtained by the sieving method. Meanwhile, the hydrometer test was performed to evaluate the distribution of particle sizes smaller than 75 mm.
Table 2 summarizes the testing conditions of the direct shear and interface direct shear tests, in which the curing period was extended to 56 days. As discussed previously, the strength development of the treated soil was due to the hydration and pozzolanic reactions in cement [4,5]. In contrast, the strength would be reduced with the curing period due to the organic matter (such as humic acid) and salt concentration [31]. The study of the uniaxial compression strength of the cubic cement-treated organic soil samples found that their maximum compressive strengths at 84 days would be lower than those at 56 days [31]. In this study, the organic matter in the soil was very small, as its ignition loss was less than 4%. In addition, the soil was retrieved from a freshwater region devoid of salt. Due to the minimum presence of organic and salty matter, the strength of the cement-treated soil in this study would not degrade within 56 days of curing, as indicated in the next section.

3. Results and Discussion

3.1. Grain Size Distribution of Cement-Treated Soil

The effects of cement treatment on the structure of the modified soil after 28 days of curing were examined based on particle size analysis. As mentioned previously, the sieve and hydrometer tests were performed on cement-treated soil samples, followed by ASTM D422 [24].
As illustrated in Figure 1, the particle size of the treated soil was larger than that of the untreated soil. The increase in cement content resulted in a greater fraction of sand-size particles and a larger median particle size, D50 (Table 3). The mercury intrusion porosimeter yielded similar findings when measuring the particle size distribution of cement-treated clay [6]. It revealed a transition from predominantly clay-sized particles to silt-sized particles. Due to hydration and pozzolanic processes in cement, the creation of fabric and bonding in cement-treated soil induces an increase in particle size. In this investigation, the latter effect predominated and caused the particle size to increase.
In contrast, the fabric and bonding did not entirely form due to the low cement content (i.e., less than 10%) and the soaking procedure when curing the treated specimens. The size improvement in fine particles was also observed in the cement-treated soft Singapore marine clay. Chew et al. [6] concluded that there was a shift from predominantly clay-size particles to silt-size particles. By examining the percentage of sand-sized particles and contents of fines shown in Table 3, it was possible to quantify the increase in the sand-size fraction of cement-treated soil specimens.
Considering the dry mass of sand-size particles and fines particles is Ms and Mf, respectively, the percentage of sand-size particles in the untreated soil should be:
% S u n t r e a t e d = M s M s + M f × 100 %
When mixing soil with cement, the total dry weight of the cement-treated soil, Mtreated, included the dry mass of the soil, the mass of cement, the mass of hydration, and cementitious products, which were evaluated as follows:
M t r e a t e d = M s + M f × 1 + 1 + α c m
in which α was the dry mass ratio between hydration, cementitious products, and cement. The value of α was reported differently depending on the composition of the cement and the types of soils. At 28 days of curing, Zhu et al. [35] reported that the value of α was about 0.16 for the mixture of cement with lake and marine sediments (high plasticity clay) and 0.21 for that with river sediment (high plasticity silt). For hydration of Portland cement and water, Chu et al. [36] stated that the mass of water related to complete hydration was about 25.2% (i.e., α = 0.252), which was close to the value α = 0.23 reported by the Concrete Society [37] at complete hydration.
The hydration and cementitious products increased particle size in cement-treated soil specimens. By assuming a uniform condition in the mixture, the mass of sand-sized particles in the treated sample was evaluated as follows:
M s _ t r e a t e d = M s × 1 + 1 + α c m + β M f × 1 + 1 + α c m
in which β is the coefficient that accounts for the effects of cement on integrating the fine particles with the sand-sized particles. Meanwhile, the first term is the new dry mass of sand-size particles mixed with cement with hydration and cementitious products. The percentage of sand-sized particles in the treated soil should be:
% S t r e a t e d = % S u n t r e a t e d + β % F u n t r e a t e d
The percentage of sand-size particles in the untreated soil as the first term in Equation (4) illustrates that the cement and its hydration and cementitious products do not contribute to the increment in the value %Streated. However, it might increase the particle size and form bonds between them. The increment in particle size due to cement treatment was also reported in granular soil mixed with 2% cement content [38]. It also concluded that the cement bonds were difficult to destroy by hand but might be destroyed under the confining pressure and monotonic shearing.
The values of β for the cement-treated soil at 28 days are given in Table 3, in which it increased from 0.018 to 0.135 when increasing the cement content from 3% to 10%. In other words, up to 13.5% of the fine contents in the soil were transferred to sand-size particles when treated with 10% of the cement contents. The increase in particle size of the cement-treated soil was used to explain the significant improvement in the effective friction angle of the treated samples presented in the next section.

3.2. Shear Stress-Strain Behavior of Cement-Stabilized Soil

Figure 3 illustrates the stress-strain relationships of the soil and cement-treated soil after 28 days of curing under various effective normal stresses. At the effective normal stress range of 50–200 kPa, the peak shear strength of cement-treated soil specimens was substantially higher than that of untreated soil. More cement content increases the shear strength of treated soil samples [10,11,12,13,14].
In addition, cement treatment shifted the stress-strain behavior of the untreated and treated soil specimens from ductile to brittle failure, respectively (Figure 3). The increase in cement content led to more brittle sample failures. These results are consistent with the brittle failure behavior of cement-treated soil observed in other tests, such as unconfined compression tests [13,17,18,19], direct shear tests [18,19], and triaxial and plane strain tests [13]. As demonstrated in Figure 3, 10% of the shear strain was selected as the strain at failure of the untreated soil [29]. In contrast, the shear strain at the maximum shear stress of soil specimens treated with cement was much smaller and reduced as the cement content rose. Increased effective normal stress also increased shear strain at failure (Figure 3).

3.3. Interface Shear Strength Behavior between Cement-Treated Silty Soil and Steel

Figure 4 presents the interface shear strength between the stainless steel surface and the silty soil after 28 days of curing at different cement contents. According to the shear strength behavior, the interface shear strength of cement-treated soil was greater but reached its maximum value at a smaller shear displacement than that of untreated soil. Moreover, the increase in cement content led to a rise in peak interface shear strength and a reduction in peak shear displacement. Specifically, the interface shear stress of the untreated specimens peaked at a shear displacement of 1.2 mm to 3.2 mm, corresponding to 2.0% to 5.3% of shear strain. These shear strains were considerably less than those at the highest shear strain of the soil (i.e., 10%), which were also observed in prior investigations [23]. For soil treated with cement, the shear displacement at the highest interface shear strength was much smaller, ranging from 0.2 mm to 1.6 mm (Figure 4). Under higher effective normal stresses, the cement-treated soil specimens required greater shear displacement to reach their maximum interface shear strength. Compared to untreated soil, the increased interface shear strength between steel and cement-treated soil would be mobilized at a smaller shear displacement. Su et al. [39] found a similar interface shear behavior on the red clay concrete interface in a large-scale direct shear test, where all the curves exhibit a stick-slip phenomenon after yielding. This failure mode was also observed in the interface shear test between soil and smooth interfaces, such as polished stainless steel [23].
Furthermore, the greater the effective normal stress, the greater the shear displacement at maximum interface shear stress. Moreover, as the effective normal stress increases, the shear displacement at maximum interface shear stress also increases. These findings are consistent with the shear behavior of the steel-soil contact, as reported in previous research. Employing a modified interface direct shear test apparatus, Tsubakihara et al. [21] reported that the maximal interface shear strength of a normally cemented Kawasaki clay and steel surface occurred at around 1–3 mm of shear displacement. In addition, the peak interface shear stress between the soil and stainless steel was less than the peak shear strength of the soil. This observation is consistent with the interface shear strength between the high-content clay and the smooth, polished surface [40].

3.4. Effects of Cement Content on Shear Strength and Interface Shear Strength of Cement-Treated Soil

The effects of cement content on enhancing the shear strength and interface shear strength of treated soil specimens were further examined using peak and residual strength values. As shown in Figure 3 and Figure 4, after the shear and interface shear strengths of the treated specimens reached their maximum values, they would be reduced dramatically at the end of the tests. The residual shear strength of the treated specimens was calculated at 10% of the shear strain to quantify the brittle shear-strain behavior. On the other hand, the interface shear stress at 5 mm of shear displacement was chosen as the residual value to investigate the stick-slip phenomenon of the interface shear behavior of treated soil [23].
Figure 5 and Figure 6 depict the effective failure envelopes of the shear strength and interface shear strength of the cohesive soil treated with changing cement content. The untreated soil had almost minimal effective cohesion, which demonstrated that the soil was in a normally consolidated condition. The shear strength of the cement-treated soil was manifested by relatively small increases in effective cohesions and significant increases in effective friction angles. In particular, the peak effective friction angle rose from 27.5° for the untreated soil to 53.5° for specimens treated with 10% cement content (Figure 7).
Figure 7 also illustrates the effects of cement content on the enhancement of the interface shear strength of cement-treated soil. Like the shear strength, the peak and residual effective interface friction angles, ϕ′int_max and ϕ′int_res, were higher when the Cm value was increased. In particular, the ϕ′int_max values increased from 15.4° for the untreated soil specimens to 25.4° for the treated soil specimens with 10% cement content. At that cement content, the residual effective interface friction angle was smaller, about 21.9°. That might be explained using the investigation of Horpibulsuk et al. [9] on the microstructure of cement-stabilized silty soil. For cement contents less than 10%, as cement content increased, more cementitious products were produced, which enhanced inter-cluster bonding and filled pore space. As a result, it would result in the formation of larger particles (i.e., a higher fraction of sand-size particles and a larger mean particle size, D50, as shown in Table 3) and bonding between them. The first factor would considerably increase the effective friction angle of treated soil. In contrast, the slight increase in effective cohesion under consolidated, drained shearing may expose weak particle bonding.
The increase in the percentage of sand-sized particles in cement-treated soil would increase its shear strength and interface shear strength. The effects of sand size fraction on the shear strength of sand-clay mixtures could demonstrate this. Previous research reveals that shear strength depends on the relative concentrations of large particles and clay. For a fine content greater than 60 percent, the shear strength of the mixtures is equivalent to that of pure clay [41]. In these cases (i.e., fine content > 60%), the decrease in fine content (i.e., the increase in sand-size particle fraction) results in an increase in the internal friction angle [42,43]. Tsubakihara et al. [44] reported similar effects of particle size on the shear strength of the soil-steel interface. The results of this study indicated that the shear strength of the interface between a sand-clay mixture and steel increased significantly as the percentage of granular soil particles increased. Compared to the interface shear strength of the sand-clay mixture, the increase in the interface shear strength was more pronounced in soil specimens stabilized by a higher cement content. The enhancement can be attributed to cementitious materials, which increased particle size and decreased void space in the treated soil [9].
Nonetheless, these observations on the shear strength values of the cement-treated soil differed from those revealed in previous research. Issa and Reza [18] performed a standard direct shear test to show that treating sand with cement increased its shear strength. The increase in cohesion was more noticeable than the increase in friction angle. In that investigation, specimens were made by compacting the soil-cement mixture to the optimum moisture content and then shearing it at 0.12 mm/min. Hence, the test findings demonstrated the total shear strength behavior of unsaturated specimens, which was significantly different from those presented in this study (i.e., the effective shear strength behavior of saturated samples). Azneb et al. [14] found that the effective cohesion increased significantly with the addition of cement for the shear behavior of the cement-treated soil under consolidated undrained triaxial compression. However, the effective friction angle was constant for all cement contents. The difference may be attributed to the high cement content and water-to-cement ratio employed in the Azneb et al. [14] investigation. In particular, the treated specimens were created by combining soil with a water content as high as 1.2 times the liquid limit of base soil with 10–20% cement. In addition, the cement was added as a slurry with a water-to-cement ratio of 0.6, increasing the water content of the mixture. For such a high cement concentration and water-to-cement ratio, significant hydration and cementitious products are believed to exist and produce strong intercluster bonding in treated soil samples. The test findings demonstrated a significant improvement in effective cohesiveness and effective friction angle [14].
In addition, there was a significant difference between the peak and residual shear strengths of cement-treated soil samples (Figure 7). Although there was a little difference (about 2 kPa) between the peak and residual effective cohesion of the cement-treated soil, a significant difference between the peak and residual effective residual friction angles, ϕ′max and ϕ′res, was observed. The difference would be greater as the cement content increased. Specifically, ϕ′res was 8.5 degrees less than ϕ′max for specimens with 10% cement content, equating to a 15% decrease in the highest effective friction angle. Similar results were found for the peak and residual strength parameters of cement-stabilized soil during consolidated, undrained triaxial compression [17]. Between the peak undrained shear strength and the residual value of the treated soil samples, the results of the tests demonstrated a significant drop. The difference rose as the effective consolidation pressure and curing period increased [17].
Last, the shear strength and interface shear strength improvements of the cement-treated soil were quantified using the shear strength ratio, Rs, and interface efficiency ratio, IEF, respectively. The ratio Rs was defined as the ratio of the shear strength of treated soil to that of untreated soil at a normal stress level, as follows:
R s = τ t r e a t e d τ u n t r e a t e d
Similarly, the interface efficiency ratio, IEF, was defined as the ratio of the interface shear strength of the treated soil to that of untreated soil, which was first presented by Hamid et al. [23].
I E F = τ int t r e a t e d τ int u n t r e a t e d
Figure 8 illustrates the average values of Rs and IEF obtained from cement-treated soil samples at 28 days of curing subjected to different effective normal stresses with a relative standard deviation of less than 5%. The peak shear strength ratio changed from 1.28 to 2.40 as the cement content increased from 3% to 10%. At 10% of the shear strain, however, the residual shear strength ratio was significantly lower, ranging from 1.16 to 1.80 in that cement content range (Figure 8a).
Similarly, the peak values of the average interface efficiency factor, IEFaverage, also increased from 1.15 to 1.55 when the cement content was raised from 3% to 10%. Under this cement content range, the residual values of the IEFaverage were smaller, ranging between 1.12 and 1.44.
A number of studies have reported that the soil-water/cement ratio is strongly correlated with unconfined compressive strength [7,8,34,45,46,47] and undrained shear strength [31]. For instance, a power function could present the unconfined compressive strength of cement-treated soil at 28 days of curing, qu, as follows [46]:
q u = A w / C m B
in which A and B are empirical constants.
Based on the above correlation, the strength ratio of cement-treated soil could also be evaluated using w/Cm values. Figure 9 shows the values of the shear strength ratio plotted against soil-water/cement content. The relationship can be satisfactorily modeled by the following power function (R2 = 0.92), which is in a similar form to Equation (11):
R s = 15.191 w / C m 1.019
The points in Figure 9 represent the direct shear test results of different types of soil treated with varying amounts of ordinary Portland cement. As indicated in Table 4, test variations included normal stresses, cement contents, water contents, and drainage conditions. Notably, the correlation equation was devised without considering normal stress, which would result in a prediction error. Nevertheless, the error could be negligible because the strength ratio changed insignificantly with the variation of the normal stresses (i.e., the relative standard deviation was less than 5%). The proposed prediction for Rs values was also restricted to the shear strength at 28 days of soils with low organic or inorganic content treated with ordinary Portland cement, of which the value w/Cm is in the range of 0.6 to 19.1.

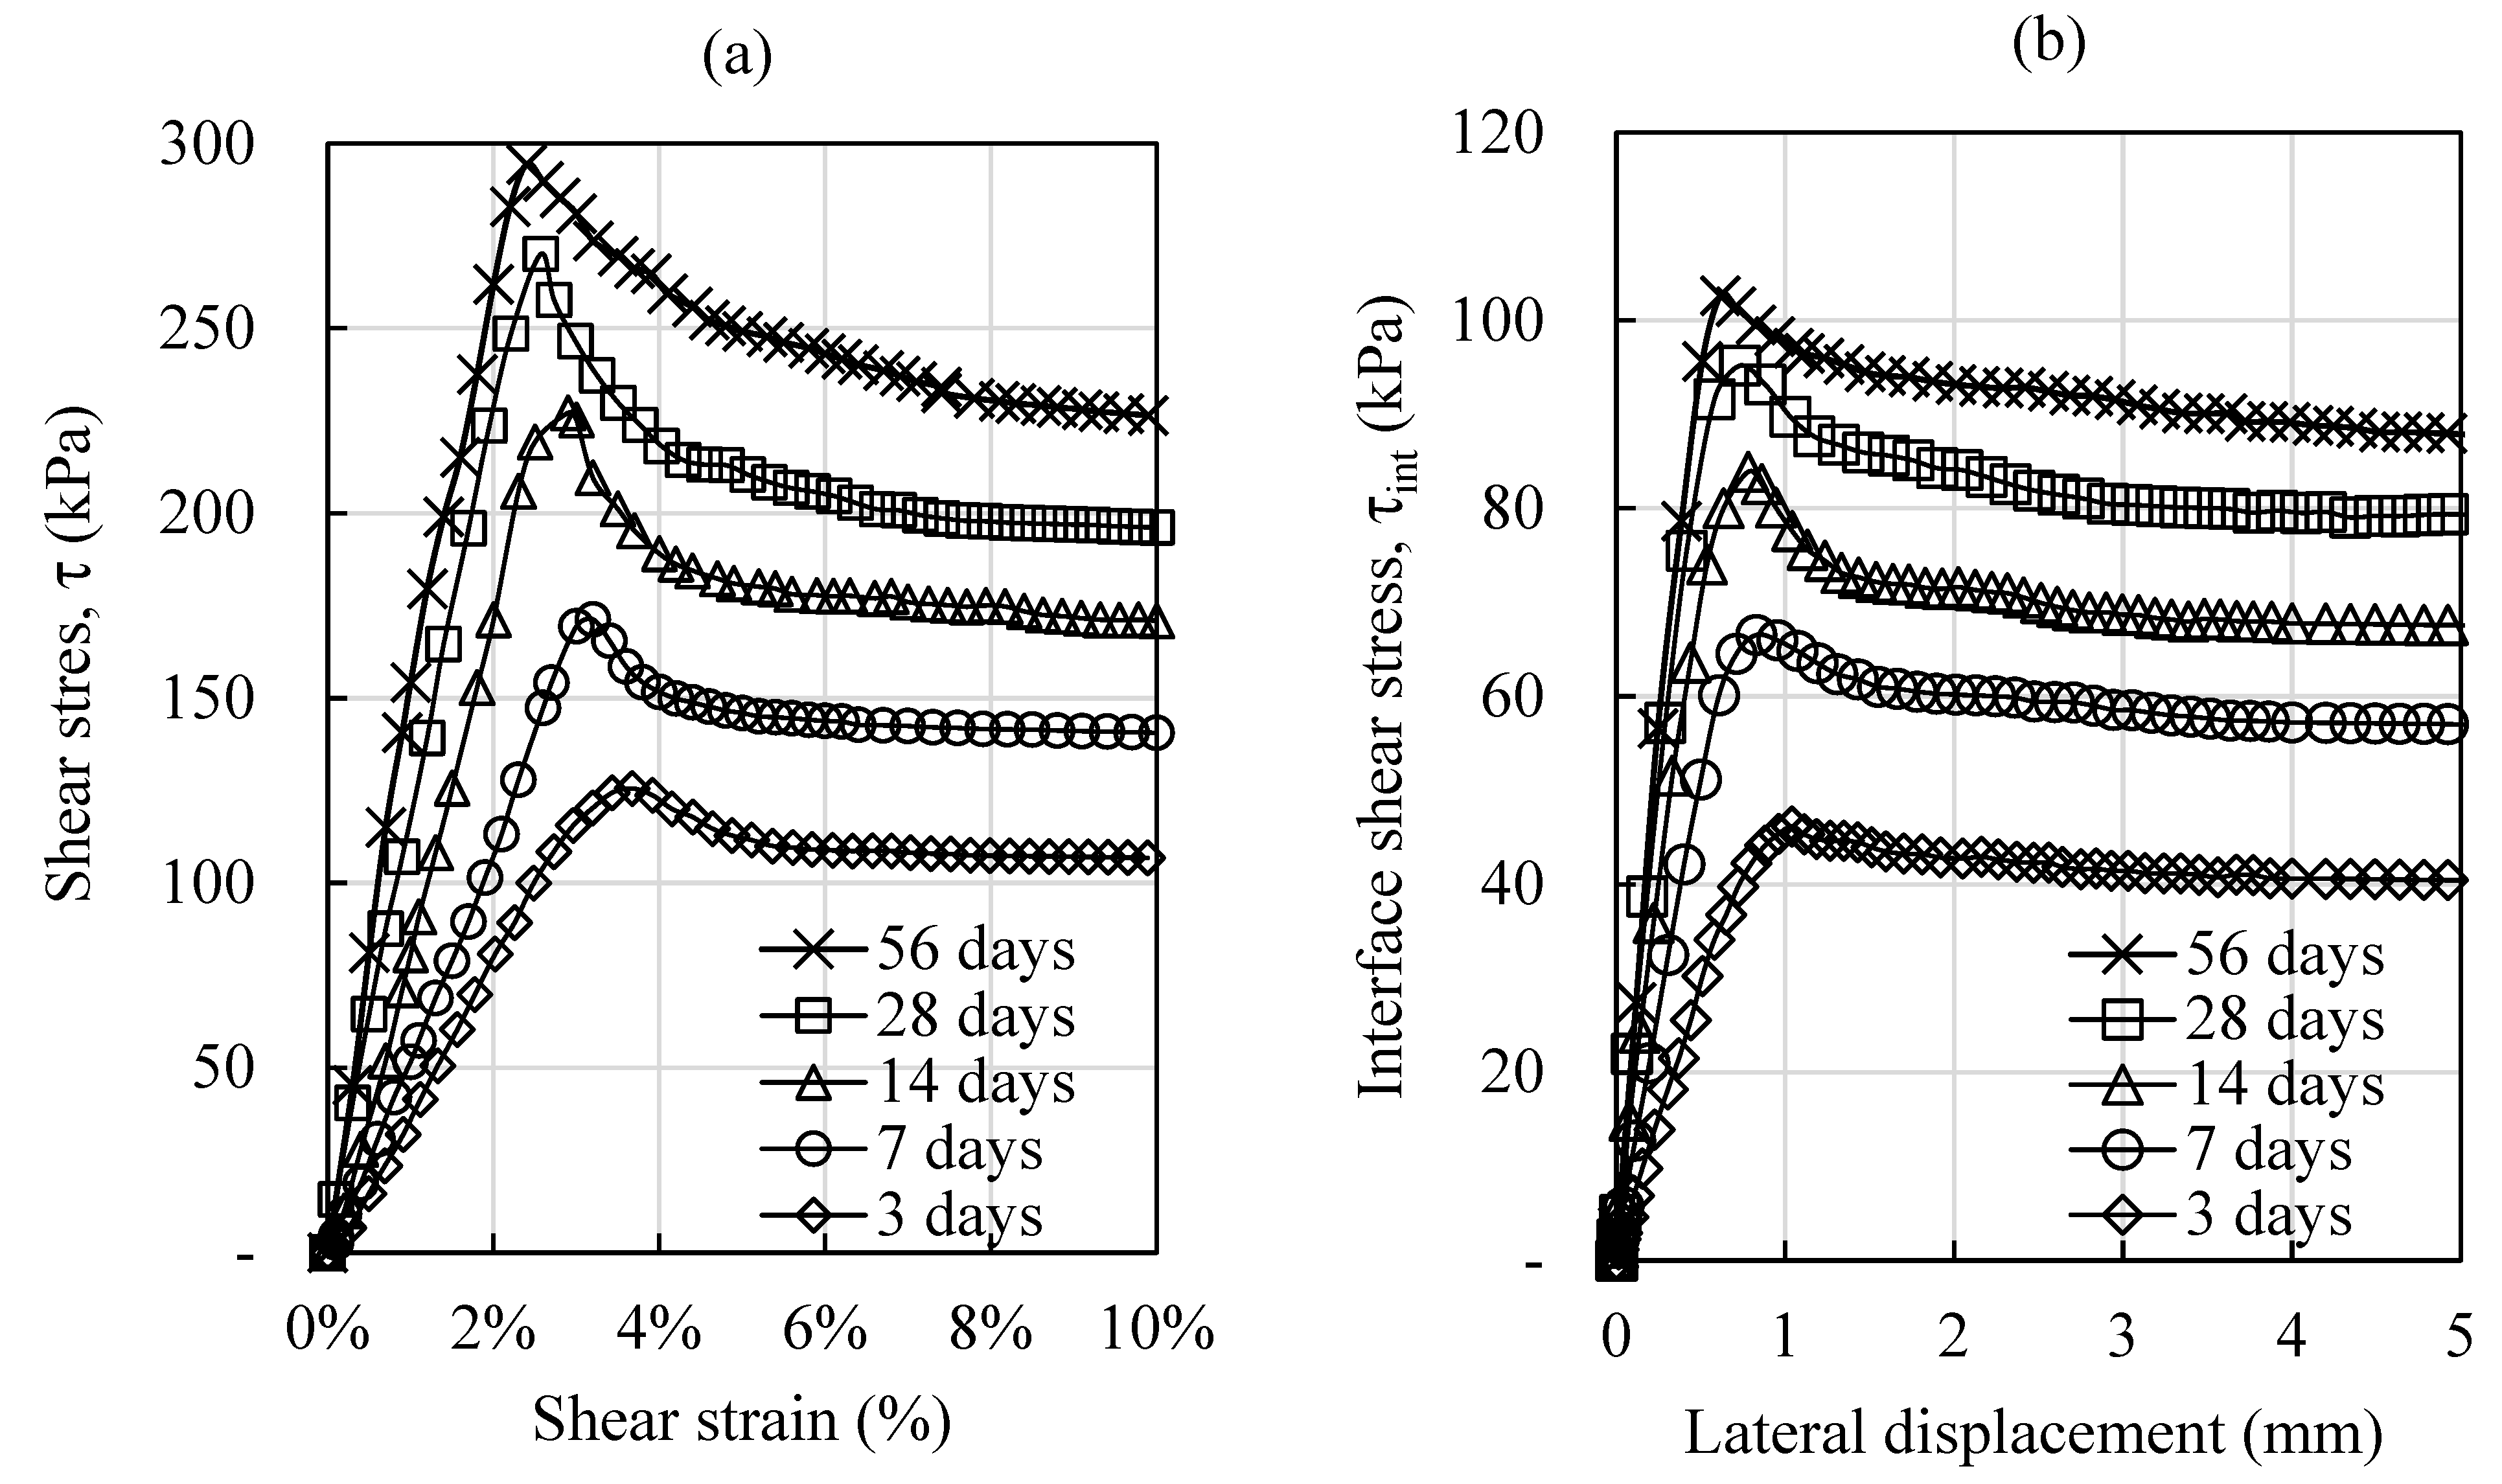
3.5. Effect of the Curing Period on the Shear Strength and the Interface Shear Strength of Cement-Treated Soil

Figure 10 shows the development of the shear and interface shear behavior of soil treated with 10% cement during the 56 days of the curing period. In addition, the lengthening of the curing period caused the shear and interface shear failures of the treated soil to become more brittle.
Similar to previous research, the 28-day-old strength of cement-stabilized soil was used as a reference value to evaluate the rate of strength development [8,44,45]. As shown in Figure 11, a strong correlation (R2 = 0.98) was found between the curing period and the strength development ratio, RSD.
R S D = τ max D τ max 28 = τ r e s D τ r e s 28 = τ int _ max D τ int _ max 28 = τ int _ r e s D τ int _ r e s 28 = 0.2108 ln D + 0.2833
in which τmaxD, τresD, τint_maxD, and τint_resD are the peak shear stress, residual shear stress, peak interface shear stress, and residual interface shear stress after D days of curing period, respectively, τmax28, τres28, τint_max28, and τint_res28 are the peak shear stress, residual shear stress, peak interface shear stress, and residual interface shear stress after 28 days of curing period, respectively.
Although this relationship is linked to the rate of shear strength and interface shear strength development of cement-treated soil in the curing period range of 3 to 56 days, as shown in Figure 11, the finding correlation is matched to the logarithmic relationship developed for the unconfined compressive strength with a curing period of cement-stabilized low plasticity and coarse-grained soil [8]. In that study, the proposed model was valid for the extended curing period (i.e., between 7 and 120 days). It accounted for the variations in soil types, water contents, cement contents, and compaction energies. In addition, the relationship in this study also agrees with the development of undrained shear strength of various clays cemented with Portland cement with curing time proposed by Sasanian et al. [31], which was developed using more than 440 data points for 12 different clays with a wide range of liquidity indices (LI ~ 0.4–3.0) and cement content (c ~ 1–100%). In short, the development rate of the effective shear strength and interface shear strength of the cement-treated soil within 56 days of curing is similar to that of the unconfined compressive strength and undrained shear strength of the cement-treated soil suggested by previous studies.

4. Conclusions

A series of laboratory tests were conducted to examine the behavior of effective shear strength and interface shear strength of cement-treated silty soil under consolidated, drained conditions up to 56 days of curing. The test results illustrated that the shear strength and interface shear strength of the treated soil specimens improved significantly. The remaining findings were as follows:
-
The addition of cement led to an increase in the particle size of the treated soil. Higher cement content resulted in a higher percentage of sand and an increased average particle size, D50. After 28 days of curing, the percentage of sand in soil treated with 10% cement doubled, and its value of D50 was 2.7 times higher than that of the untreated soil. In particular, about 1.8% and 13.5% of the fine content integrated into sand-size particles in the soil treated with 3% and 10% cement content, respectively.
-
The shear strength and interface shear strength of the cement-treated soil showed brittle shear-strain and stick-slip phenomena, respectively, after reaching the yielding stage. The improvement in the shear strength of the cement-treated soil was mostly caused by the increase in the effective friction angle. For example, the peak effective friction angle increased from 27.5° for the untreated soil to 53.5° for the soil treated with 10% cement content. On the other hand, peak effective cohesion increased by a negligible amount. The peak effective interface friction angle of treated soil at that cement content was 25.4°, significantly higher than that of untreated soil (i.e., 15.4°).
-
The higher the cement content, the greater the shear strength ratio Rs. In particular, at 28 days, the peak and residual average shear strength ratios Rs of specimens treated with 3–10% cement ranged from 1.28 to 2.40 and 1.16 to 1.80, respectively. Similarly, on a smaller scale, the cement also enhanced the soil-steel interface’s strength parameters. At its peak, the average interface efficiency factor (IEF) was approximately 1.55 when 10% cement content was added. The shear strength ratio of cement-treated soil can be predicted using a proposed power function model, which was devised based on the soil-water/cement ratio. The model is verified using data from previous studies and the authors own.
-
A new logarithmic equation with a strong correlation (R2 = 98) was proposed to predict the rate of shear strength and interface shear strength development in cement-treated silty soil within 56 days of curing. The developed equation also agrees with prediction models provided in earlier research on the undrained shear strength and unconfined compressive strength of soil treated with cement.
Adding cement to soils increased their shear and interface shear strengths, which had various advantageous implications for construction. For instance, the increase in shear strength would enhance the slope stability of embankments when employing soil treated with cement as a backfill. Additionally, the active earth pressure could be reduced, and the stability of the sheet piles could be increased due to the improvement in the shear strength and interface shear strength of the soil behind the sheet pile when treated with cement. Last but not least, retaining walls formed of cement-deep soil combined with H-piles would provide significant support for excavation stabilization.
It should also be emphasized that the findings presented in this study pertain to soil that has been remolded and treated with cement in a laboratory setting. Although the mixing method, homogeneity, and curing conditions of treated soil specimens in the laboratory are substantially different from those in the field, the tests were intended to replicate the shear strength and interface shear strength of cement-treated soil in the field. Those differences lead to significant differences in the shear strength and interface shear strength behaviors of treated soils. Especially in the cement deep soil mixing method, the improved engineering properties of the stabilized soil are governed by soil types, slurry properties, mixing procedures, and curing conditions. Moreover, the presented laboratory test results are applicable for low organic or inorganic soil treated with ordinary Portland cement, and the soil-water/cement content varied from 5.7 to 19.1. The new models were developed based on observations of the cement-treated soil’s strength development within 56 days of curing, which may be less time than the duration of deep soil mixing construction in reality. Despite these limitations and discrepancies, the results are expected to provide useful information regarding the effects of cement content and curing period on enhancing the effective shear strength and interface effective shear strength of the cement-treated soil.

Author Contributions

Conceptualization, T.T.N. and M.D.N.; methodology, M.D.N.; software, T.N.; validation, T.N. and T.C.P.; formal analysis, T.N.; resources, T.C.P.; writing—original draft preparation, T.T.N.; writing—review and editing, T.T.N.; supervision, M.D.N.; project administration, T.T.N.; funding acquisition, M.D.N. All authors have read and agreed to the published version of the manuscript.

Funding

This work belongs to the project grant No: T2022-149 funded by Ho chi Minh city university of Technology and Education, Vietnam.

Data Availability Statement

Some or all data, models generated or used during the study are available from the corresponding author by request.

Acknowledgments

The authors would like to thank Ho Chi Minh City University of Technology and Education, Vietnam, for supporting the equipment and fund (Grant No. T2022-149).

Conflicts of Interest

The authors declare that the research was conducted in the absence of any commercial or financial relationship that could be construed as potential conflict of interest.

References

  1. Fan, J.; Wang, D.; Qian, D. Soil-Cement Mixture Properties and Design Considerations for Reinforced Excavation. J. Rock Mech. Geotech. Eng. 2018, 10, 791–797. [Google Scholar] [CrossRef]
  2. Nguyen, T.A.; Nguyen, D.T.; Nguyen, A.D. A Novel Approach to Use Soil-Cement Piles for Steel Sheet Pile Walls in Deep Excavations. Civ. Eng. Archit. 2021, 9, 301–316. [Google Scholar] [CrossRef]
  3. Quang, T.N.; Anh, B.T.; Cong, T.V.; Cao, T.M. Combination of Cement Deep Mixing (CDM) and Steel Sheet Piles for the Cofferdam Used in Construction of Deep Foundation Pit in Soft Ground in the Mekong Delta Coast. In Proceeding of the 6th International Conference on Geotechnics, Civil Engineering and Structure; Ha-Minh, C., Tang, A.M., Bui, T.Q., Vu, X.H., Huynh, D.V.K., Eds.; Springer Nature Singapore: Singapore, 2022; pp. 97–106. [Google Scholar]
  4. Bergado, D.T.; Anderson, L.R.; Miura, N.; Balasubramaniam, A.S. Soft Ground Improvement in Lowland and Other Environments; American Society of Civil Engineers: New York, NY, USA, 1996. [Google Scholar]
  5. Schaefer, V.R.; Abramson, L.W.; Drumheller, J.C.; Sharp, K.D. Ground Improvement, Ground Reinforcement and Ground Treatment: Developments 1987–1997. In Sessions of Geo-Logan ’97 Conference; American Society of Civil Engineers: New York, NY, USA, 1997; p. 616. [Google Scholar]
  6. Chew, S.H.; Kamruzzaman, A.H.M.; Lee, F.H. Physico-Chemical and Engineering Behavior of Cement Treated Singapore Marine Clay. J. Geotech. Geoenviron. Eng. 2004, 130, 696–706. [Google Scholar] [CrossRef]
  7. Horpibulsuk, S.; Miura, N.; Nagaraj, T.S. Assessment of Strength Development in Cement-Admixed High Water Content Clays with Abrams’ Law as a Basis. Geotechnique 2003, 53, 439–444. [Google Scholar] [CrossRef]
  8. Horpibulsuk, S.; Katkan, W.; Sirilerdwattana, W.; Rachan, R. Strength Development In Cement Stabilized Low Plasticity And Coarse Grained Soils: Laboratory And Field Study. Soils Found. 2006, 46, 351–366. [Google Scholar] [CrossRef] [Green Version]
  9. Horpibulsuk, S.; Rachan, R.; Chinkulkijniwat, A.; Raksachon, Y.; Suddeepong, A. Analysis of Strength Development in Cement-Stabilized Silty Clay from Microstructural Considerations. Constr. Build. Mater. 2010, 24, 2011–2021. [Google Scholar] [CrossRef]
  10. Uddin, K.; Balasubramaniam, A.; Bergado, D. Engineering Behaviour of Cement-Treated Bangkok Soft Clay. Geotech. Eng. 1997, 28, 89–119. [Google Scholar]
  11. Lorenzo, G.A.; Bergado, D.T. Fundamental Parameters of Cement-Admixed Clay—New Approach. J. Geotech. Geoenviron. Eng. 2004, 130, 1042–1050. [Google Scholar] [CrossRef]
  12. Lee, F.-H.; Lee, Y.; Chew, S.-H.; Yong, K.-Y. Strength and Modulus of Marine Clay-Cement Mixes. J. Geotech. Geoenviron. Eng. 2005, 131, 178–186. [Google Scholar] [CrossRef]
  13. Sariosseiri, F.; Muhunthan, B. Effect of Cement Treatment on Geotechnical Properties of Some Washington State Soils. Eng. Geol. 2009, 104, 119–125. [Google Scholar] [CrossRef]
  14. Azneb, A.S.; Banerjee, S.; Robinson, R.G. Shear Strength of Cement-Treated Marine Clay under Triaxial and Plane Strain Conditions. Proc. Inst. Civ. Eng. Ground Improv. 2021, 174, 143–156. [Google Scholar] [CrossRef]
  15. Pham, T.A.; Koseki, J.; Dias, D. Optimum Material Ratio for Improving the Performance of Cement-Mixed Soils. Transp. Geotech. 2021, 28, 100544. [Google Scholar] [CrossRef]
  16. Kasama, K.; Kouki, Z.; Iwataki, K. Undrained Shear Strength Of Cement-Treated Soils. Soils Found. 2006, 2, 221–232. [Google Scholar] [CrossRef] [Green Version]
  17. Suzuki, M.; Fujimoto, T.; Taguchi, T. Peak and Residual Strength Characteristics of Cement-Treated Soil Cured under Different Consolidation Conditions. Soils Found. 2014, 54, 687–698. [Google Scholar] [CrossRef]
  18. Issa, S.; Reza, A.S. Effect of Cement Stabilization on Geotechnical Properties of Sandy Soils. Geomech. Eng. 2015, 8, 17–31. [Google Scholar]
  19. Eliaslankaran, Z.; Daud, N.N.N.; Yusoff, Z.M.; Rostami, V. Evaluation of the Effects of Cement and Lime with Rice Husk Ash as an Additive on Strength Behavior of Coastal Soil. Materials 2021, 14, 1140. [Google Scholar] [CrossRef] [PubMed]
  20. Sukpunya, A.; Jotisankasa, A. Large Simple Shear Testing of Soft Bangkok Clay Stabilized with Soil–Cement-Columns and Its Application. Soils Found. 2016, 56, 640–651. [Google Scholar] [CrossRef]
  21. Tsubakihara, Y.; Kishida, H.; Nishiyama, T. Friction between Cohesive Soils and Steel. Soils Found. 1993, 33, 145–156. [Google Scholar] [CrossRef] [PubMed] [Green Version]
  22. Borana, L.; Yin, J.-H.; Singh, D.N.; Shukla, S.K.; Tong, F. Direct Shear Testing Study of the Interface Behavior between Steel Plate and Compacted Completely Decomposed Granite under Different Vertical Stresses and Suctions. J. Eng. Mech. 2018, 144, 04017148. [Google Scholar] [CrossRef]
  23. Hamid, T.B.; Miller, G.A. Shear Strength of Unsaturated Soil Interfaces. Can. Geotech. J. 2009, 46, 595–606. [Google Scholar] [CrossRef]
  24. ASTM D422; Standard Test Method for Particle Size Analysis of Soils. ASTM International: West Conshohocken, PA, USA, 2007.
  25. Hoogsteen, M.J.J.; Lantinga, E.A.; Bakker, E.J.; Tittonell, P.A. An Evaluation of the Loss-on-Ignition Method for Determining the Soil Organic Matter Content of Calcareous Soils. Commun. Soil Sci. Plant Anal. 2018, 49, 1541–1552. [Google Scholar] [CrossRef]
  26. ASTM C188; Standard Test Method for Density of Hydraulic Cement. ASTM International: West Conshohocken, PA, USA, 2017.
  27. ASTM C595; Standard Specification for Blended Hydraulic Cements. ASTM International: West Conshohocken, PA, USA, 2001.
  28. ASTM C191; Time of Setting of Hydraulic Cement by Vicat Needle. ASTM International: West Conshohocken, PA, USA, 2002.
  29. BS EN 197-1:2011; Cement Composition, Specifications and Conformity Criteria for Common Cements. British Standards Institute: London, UK, 2011.
  30. Bushra, I.; Robinson, R.G. Shear Strength Behavior of Cement Treated Marine Clay. Int. J. Geotech. Eng. 2012, 6, 455–465. [Google Scholar] [CrossRef]
  31. Sasanian, S.; Newson, T.A. Basic Parameters Governing the Behaviour of Cement-Treated Clays. Soils Found. 2014, 54, 209–224. [Google Scholar] [CrossRef] [Green Version]
  32. ASTM D3080; Standard Test Method for Direct Shear Test of Soils Under Consolidated Drained Conditions. ASTM International: West Conshohocken, PA, USA, 2011.
  33. ASTM D5321; Standard Test Method for Determining the Coefficient of Soil and Geosynthetic or Geosynthetic and Geosynthetic Friction by the Direct Shear Method. ASTM International: West Conshohocken, PA, USA, 2011.
  34. Horpibulsuk, S.; Miura, N.; Nagaraj, T.S. Clay–Water∕Cement Ratio Identity for Cement Admixed Soft Clays. J. Geotech. Geoenviron. Eng. 2005, 131, 187–192. [Google Scholar] [CrossRef]
  35. Zhu, W.; Zhang, C.; Chiu, A.C.F. Soil–Water Transfer Mechanism for Solidified Dredged Materials. J. Geotech. Geoenviron. Eng. 2007, 133, 588–598. [Google Scholar] [CrossRef]
  36. Chu, D.C.; Kleib, J.; Amar, M.; Benzerzour, M.; Abriak, N.E. Determination of the Degree of Hydration of Portland Cement Using Three Different Approaches: Scanning Electron Microscopy (SEM-BSE) and Thermogravimetric Analysis (TGA). Case Stud. Constr. Mater. 2021, 15, e00754. [Google Scholar] [CrossRef]
  37. Report of Joint Working Party of the Concrete Society and Society of the Chemical Industry. In Analysis of Hardened Concrete; The Concrete Society: Camberley, UK, 1989; Volume 32.
  38. Rezaeian, M.; Ferreira, P.M.V.; Ekinci, A. Mechanical Behaviour of a Compacted Well-Graded Granular Material with and without Cement. Soils Found. 2019, 59, 687–698. [Google Scholar] [CrossRef]
  39. Su, L.J.; Zhou, W.H.; Chen, W.B.; Jie, X. Effects of Relative Roughness and Mean Particle Size on the Shear Strength of Sand-Steel Interface. Meas. J. Int. Meas. Confed. 2018, 122, 339–346. [Google Scholar] [CrossRef]
  40. Lemos, L.J.; Vaughan, P.R. Clay-Interface Shear Resistance. Géotechnique 2000, 8, 55–64. [Google Scholar] [CrossRef]
  41. Yin, K.; Fauchille, A.-L.; Di Filippo, E.; Kotronis, P.; Sciarra, G. A Review of Sand–Clay Mixture and Soil–Structure Interface Direct Shear Test. Geotechnics 2021, 1, 260–306. [Google Scholar] [CrossRef]
  42. Balaban, E.; Šmejda, A.; Onur, M.I. An Experimental Study on Shear Strength Behavior of Soils under Low Confining Pressure. In Proceedings of the 4th World Congress on Civil, Structural, andEnvironmental Engineering (CSEE’19), Rome, Italy, 7–9 April 2019; pp. 1–8. [Google Scholar]
  43. Shahin, M.; Mehedi Hasan Khan, M.; Niamul Bari, M. A Disaster Resilient Road: Effects of Fines on Density and Shear Strength of Sands. Int. J. Transp. Eng. Technol. 2020, 6, 38–43. [Google Scholar] [CrossRef]
  44. Tsubakihara, Y.; Kishida, H. Frictional Behaviour between Normally Consolidated Clay and Steel by Two Direct Shear Type Apparatuses. Soils Found. 1993, 33, 1–13. [Google Scholar] [CrossRef] [Green Version]
  45. Miura, N.; Horpibulsuk, S.; Nagaraj, T.S. Engineering Behavior of Cement Stabilized Clay at High Water Content. Soils Found. 2001, 41, 33–35. [Google Scholar] [CrossRef] [PubMed] [Green Version]
  46. Horpibulsk, S.; Rachan, R.; Suddeepong, A.; Chinkulkijniwat, A. Strength Development in Cement Admixed Bangkok Clay: Laboratory and Field Investigations. Soils Found. 2011, 51, 239–251. [Google Scholar] [CrossRef] [Green Version]
  47. Yamashita, E.; Aristo Cikmit, A.; Tsuchida, T.; Hashimoto, R. Strength Estimation of Cement-Treated Marine Clay with Wide Ranges of Sand and Initial Water Contents. Soils Found. 2020, 60, 1065–1083. [Google Scholar] [CrossRef]
  48. Ahmed, M.E.-H.; Mohammed, H.A. Effect of Using Cemented Sand as a Replacement Layer beneath a Strip Footing. HBRC J. 2021, 17, 1–17. [Google Scholar]
  49. Sarkar, G.; Rafiqul Islam, M.D.; Alamgir, M.; Rokonuzzaman, M.D. Study on the Geotechnical Properties of Cement Based Composite Fine-Grained Soil. Int. J. Adv. Struct. Geotech. Eng. 2012, 1, 42–49. [Google Scholar]
  50. Kayvan Karimi, A.; Mohammad Sirous, P. Drained Shear Strength of Over-Consolidated Compacted Soil-Cement. J. Mater. Civ. Eng. 2016, 28, 04015207. [Google Scholar]
  51. Boroumandzadeh, B.; Pakbaz, M.S. Evaluation of Effect of Cementation on Drained Shear Strength of Overconsolidated Clay Soils. World Appl. Sci. J. 2012, 16, 1375–1379. [Google Scholar]
Figure 1. The grain size distributions of the untreated soil and the cement-treated soil after 28 days of curing.
Buildings 13 01626 g001
Figure 2. (a) Schematic diagram of the modified shear box for the soil-steel interface direct shear test and (b) modified direct shear test apparatus.
Buildings 13 01626 g002
Figure 3. Shear stress vs. shear strain of the untreated silty soil and the soil treated with different cement contents at 28 days of curing. The effective normal stress was set at (a) σ′ = 50 kPa; (b) σ′ = 100 kPa; (c) σ′ = 150 kPa; and (d) σ′ = 200 kPa.
Buildings 13 01626 g003
Figure 4. Interface shear stress vs. shear displacement between corrosionless steel and silty soil treated with different cement content(Cm) under various effective normal stresses: (a) σ′= 50 kPa; (b) σ′ = 100 kPa; (c) σ′ = 150 kPa; and (d) σ′ = 200 kPa.
Buildings 13 01626 g004
Figure 5. Peak and residual shear stress failure envelopes.
Buildings 13 01626 g005
Figure 6. Peak and residual interface shear stress failure envelopes.
Buildings 13 01626 g006
Figure 7. Shear strength and interface shear strength parameters of untreated and treated soil specimens. The continuous and dashed lines exhibited the peak and residual values, respectively.
Buildings 13 01626 g007
Figure 8. Average shear strength ratio and average interface efficiency factor of cement-treated soil at 28 days of curing with standard deviation.
Buildings 13 01626 g008
Figure 9. Shear strength ratio of cement-treated soil at 28 days of curing versus soil-water/cement ratio (after [18,48,49,50,51]).
Buildings 13 01626 g009
Figure 10. (a) Shear behavior and (b) Interface shear behavior of cement-treated soil specimens under 200 kPa of effective normal stress after different curing periods.
Buildings 13 01626 g010
Figure 11. Shear strength and interface shear strength development with the curing period of the soil treated with 10% cement content. The bold and empty nodes indicate the peak and residual strength values, respectively (after [9,31]).
Buildings 13 01626 g011
Table 1. Oxide composition of ordinary Portland cement, PC40.
Type of OxideSiO2Al2O3CaOFe2O3MgOSO3K2ONa2O
Content (%)22.05.564.53.01.52.00.60.2
Table 2. Testing program.
MaterialCement Content,
Cm (%)
Effective Normal Stress (kPa)Curing Period (Days)
Type of test: Direct shear test under consolidated drained conditions, ASTM D3080 [32]
Untreated soil0%50, 100, 150, and 2000
Cement-treated soil10%2003, 7, 14, 28, and 56
Cement-treated soil3%, 5%, 7%, and 10%50, 100, 150, and 20028
Type of test: Interface shear test under consolidated drain conditions using a modified shear box
Untreated soil vs. stainless steel0%50, 100, 150, and 2000
Cement-treated soil vs. stainless steel10%2003, 7, 14, 28, and 56
Cement-treated soil vs. stainless steel3%, 5%, 7%, and 10%50, 100, 150, and 20028
Table 3. Percentage of sand and fines with median particle size of untreated and treated soil specimens after 28 days of curing.
Cement Content, Cm (%)% Sand (%)% Fines (%)Median Particle Size, D50 (mm)Coefficient β
0% (untreated)12.387.70.0060
3%13.986.10.0100.018
5%16.483.60.0110.048
7%19.081.00.0140.077
10%24.175.90.0160.135
Table 4. Summary of direct shear test conditions on cement-treated soil in various studies at 28 curing days.
Type of Soilw, %Drainage ConditionNormal Stress, kPaCm, %w/CmReferences
Caspian Sea sand (SP)12.3–14.4Undrained34–1212.5–7.51.6–5.4Issa and Reza [18]
Egypt’s clean siliceous yellow sand (SP)9.4–11.5Undrained50–1053–150.6–3.8Ahmed and Mohammed [48]
Bangladesh silty clayey soil (CL)23.5–27Undrained35–1055–12.52.2–4.7Sarkar et al. [49]
50% Aeolian and 50% bentonite24.8Drained55–41638.3Kayvan and Mohammad [50]
70% sand and
30% bentonite
18Drained24–34753.6Boroumandzadeh and Pakbaz [51]
Cai Lon riverbed soil (MH)54.7Drained50–2003–105.7–19.1This study
Disclaimer/Publisher’s Note: The statements, opinions and data contained in all publications are solely those of the individual author(s) and contributor(s) and not of MDPI and/or the editor(s). MDPI and/or the editor(s) disclaim responsibility for any injury to people or property resulting from any ideas, methods, instructions or products referred to in the content.

