Article

The Influence of the Prestressing Level of the Fully Threaded Anchor Bar on the Corrosion Rate

Department of Structures and Bridges, Faculty of Civil Engineering, University of Zilina, Univerzitna 8215/1, 010 26 Zilina, Slovakia
*
Author to whom correspondence should be addressed.
Buildings 2023, 13(7), 1592; https://doi.org/10.3390/buildings13071592
Submission received: 22 May 2023 / Revised: 13 June 2023 / Accepted: 20 June 2023 / Published: 23 June 2023

Abstract

:
The article presents experimental research on the corrosion of prestressing steel bars with denotation CKT (fully threaded anchor bars), which are composed of high-quality prestressing steel of the grade Y 1050 (1050 MPa). The experiment was performed using an electrochemical accelerated test. The aspects of the electric current value influence, time dependence on the degree of corrosion, and especially the influence of the prestressing level in the prestressing steel bars on the degree of corrosion were observed and examined. The results of the experiment showed that if the sample was in a stressed state, its degree of corrosion increased. Specifically, for the maximal stress equal to 90% of the tensile strength, the corrosion degree was increased by approximately 7.3%, in comparison to the unstressed specimen. In this case, a 7.3% corrosion degree corresponds to a weight loss of 350 g. The theoretical degree of corrosion was calculated using Faraday’s Law, which allowed the prediction of a rough estimate of the corrosion degree obtained with known input data. The experimental results showed that there was no apparent difference in the corrosion morphology of the sample during the same time-dependent corrosion influence at the same prestressing level in the sample with the same electric current value.

1. Introduction

In practice, we distinguish various factors that can cause damage to structures and bridges, such as foundation shift, overloading of the structure, accidental mechanical damage, and others. However, damage to structures due to reinforcement corrosion is one of the significant factors that affect the reliability and remaining service life of structures and bridges, which can lead to failure and even loss of lives [1,2,3,4,5,6,7]. Almost all the materials used in construction undergo degradation. The most used materials in civil engineering are concrete, steel reinforcement, and prestressing steel. Reinforcement corrosion is one of the most common examples of the degradation of reinforced concrete (RC) members. The same applies to the corrosion of the prestressing steel and its effect on the prestressed concrete (PC) members.
Physical and chemical reactions, caused by corrosion, permanently change the chemical, physical, and mechanical properties of the material. The indications of corrosion are various and depend on the nature of the material (metal, glass, and polymers), the environment, and all the external and internal factors. In the case of reinforced concrete or prestressed concrete members, corrosion primarily causes a reduction of the cross-sectional area of reinforcement bars or prestressing steel, which negatively affects the load-carrying capacity of the member (ULS—ultimate limit state). Subsequently (secondarily), corrosion can also cause significant damage, such as cracking in the concrete, mainly in the cover layer, concrete crushing, corrosion staining, or other signs of damage to reinforced or prestressed concrete, or the degradation of the concrete itself. Consequently, corrosion affects the serviceability of the structure (SLS—serviceability limit state) [8,9,10].
Corrosion of reinforcement or prestressing steel (corrosion loss) is a relatively complicated process that can be observed either under accelerated conditions in a corrosion chamber, in situ on real samples, or through an accelerated laboratory test using electrochemical corrosion [11,12]. Generally, various types of aggressive environments can be found in different locations in the world that affect the final value of the corrosion rate (rcorr). Many studies have focused more on the corrosion of conventional reinforcement than on the corrosion of prestressing steel so far.
In [13], the authors focused on experimental research on the corrosion of stainless steel bars in the stressed state. Electrochemical accelerated corrosion tests were performed on S11203 stainless steel bars at different stress (strain) levels, and tensile tests were performed on corbared stainless steel bars. Consequently, the influence of the stress level on the corrosion of the stainless steel bar was investigated. The results of the experiment showed that the stainless steel stress level influences the degree of corrosion of the studied samples. Although Wu et al. [13] studied accelerated corrosion on stainless steel, they achieved a 9% higher corrosion at the maximum chosen strain of 1.0 × 10⁻³ than at zero strain. In the work [14], the research focused on the experimental research of the corrosion of wires in the stressed state. Electrochemical accelerated corrosion tests were performed on seven-wire strands with a diameter of 15.2 mm and a tensile strength of 1860 MPa at different stress levels and time periods. The results of the experiment showed that the stress level influenced the degree of wire corrosion. Li et al. [14] studied accelerated corrosion on prestressing wires and achieved a 7.5% higher corrosion at the maximum chosen prestressing of (0.7 × σs) than at the zero-prestressing level. Similarly, in [15], experimental research also studied the corrosion of reinforcement in the stressed state. Tests were performed in a corrosion chamber at different stress levels and with different time periods. As a result, the influence of stress level on the corrosion of the reinforcement, the change in strain level during corrosion, and the extension of the samples were investigated and the results of the experiment suggested the influence of stress level on the bars’ degree of corrosion. Li et al. [15] studied accelerated corrosion on reinforcement, and in the case of a maximum strain level of 1.0 × 10⁻³, the corrosion rate was higher by 6.5% than in the case of unstressed samples. In [16], the authors performed a numerical analysis of prestressed beams for the evaluation of crack initiation by the corrosion of prestressing steel in the form of strands. The study suggested that corrosion has a huge impact on crack initiation. The crack, as a result of the corrosion, was wider in the case of higher stress in prestressing steel. This effect is more visible in the case of the lower value of the concrete cover and tensile strength of concrete.
Therefore, it is necessary to perform the accelerated corrosion test on prestressing steel bars at different levels of applied tensile stress. Since the corrosion rate of steel in atmospheric corrosion conditions is relatively slow [17,18,19,20,21,22,23,24,25,26,27,28,29,30,31], it is difficult to achieve the expected degree of corrosion in a short period of time. Therefore, electrochemical corrosion was used in the presented experimental measurements [32,33,34,35], which achieved a significant degree of corrosion in a relatively short time by analyzing the effect of corrosion on prestressing steel bars. External electrical current is commonly used in electrochemical accelerated corrosion to simulate corrosion damage to reinforcement or prestressing steel at a certain time. In the electrochemical corrosion test, the reinforcement corrosion process is accelerated with the support of an external electrical current. It should be noted that there is no standard procedure for electrochemical corrosion testing [36].
The extent of corrosion attack on prestressing bars after performing a corrosion resistance test can be evaluated from a macroscopic perspective, specifically through optical metallography. Optical metallography involves cutting a sample and analyzing its corrosion non-uniformity. Various types of corrosion attacks can occur, such as pitting and selective corrosion, which are among the most dangerous. Specifically, metallographic analysis can determine the extent and often also the cause of the corrosion. The primary assessment describes whether the corrosion attack exhibits signs of uniform or non-uniform (localized) corrosion [37,38,39]. Figure 1 shows the types of corrosion that can occur during the experimental measurement.
Uniform corrosion (see Figure 1b) occurs evenly over the entire surface of the material. The type of corrosion is determined by the profile changes before and after the corrosion. The non-uniform corrosions, which are displayed in Figure 1c–f, penetrate to different widths and depths at various points on the material. These types of corrosion have the same shapes as uniform corrosion, but some areas of the metal may remain completely unaffected. Point corrosion (see Figure 1c) is characterized by a small or large number of isolated points, with further corrosion significantly increasing the depth of attack with only a slight increase in width. It is necessary to monitor for selective corrosion attack, and it is typical of Cr–Ni stainless steel, aluminum, and other metals. The pitting corrosion, which can be seen in Figure 1d, is essentially non-uniform corrosion that occurs on small surface areas and penetrates deeply. It mainly occurs in carbon steel and steel equipment when the protective coating is damaged. Special-shaped corrosion (see Figure 1e) is described by a corrosion attack that extends over a large area below the surface but covers a small area on the surface of the sample. Spot corrosion depicted in Figure 1f requires the direct examination of the same sample or an uncorroded sample to determine any differences in grain size, phase distribution, inclusions, precipitates, etc., and to determine if their distribution corresponds to the distribution of corroded layers.
Gravimetric analysis of the corrosion rate using weight loss is one of the most widely used quantitative methods. During the corrosion resistance tests of metallic materials, weight losses of the tested samples occur in most cases, from which the rate of their corrosion can subsequently be determined using gravimetry.
This paper aimed to examine the corrosion process of fully threaded prestressing steel bars CKT composed of high-quality steel Y1050 (1050 MPa). The experiment was focused on an electrochemical accelerated corrosion test using direct current at different levels of tensile stresses, time, and electric current value, as in this field, only a few studies are available.
This issue is important considering numerous failures of existing prestressed concrete structures and bridges. Firstly, it is necessary to study the corrosion of prestressing steel without coating and subsequently enlarge the analysis to prestressing steel specimens embedded in the concrete.

2. Materials and Methods

2.1. Material

During the experimental measurements, the CKT prestressing steel bars, composed of high-quality Y 1050 (1050 MPa) steel, were analyzed. The entire length of the bar has a continuous right-hand thread, which is hot-rolled onto the bar. The nominal diameter of the tested bars was 18 mm (Ø18). Fully threaded prestressing bars are used in geotechnics and underground construction for the implementation of temporary or permanent prestressing bar anchors (in accordance with the EN 1537 standard execution of special geotechnical works—ground anchors [40,41,42,43]). The mentioned material was chosen for experimental measurements precisely because of its relatively frequent use in practice. Table 1 shows the chemical composition of high-quality Y 1050 steel. The chemical composition was provided by the manufacturer of the prestressing steel bar.

2.2. Calibration of Effective Uniform Corrosion

The first samples were placed in a copper cylinder, which acted as a cathode, and then in a plastic container. The samples were in a vertical position, as can be seen in Figure 2. Inspections during the running of the experiment revealed that very significant pitting corrosion was occurring near the top, where the cathode inlet was engaged and the rest of the sample was minimally corroded. This finding was also confirmed after the early disconnection of the samples, as one of the samples failed too early. Refinement and change of wiring were in progress for the other samples, where once optimum uniform corrosion was achieved, the results were considered irrelevant.

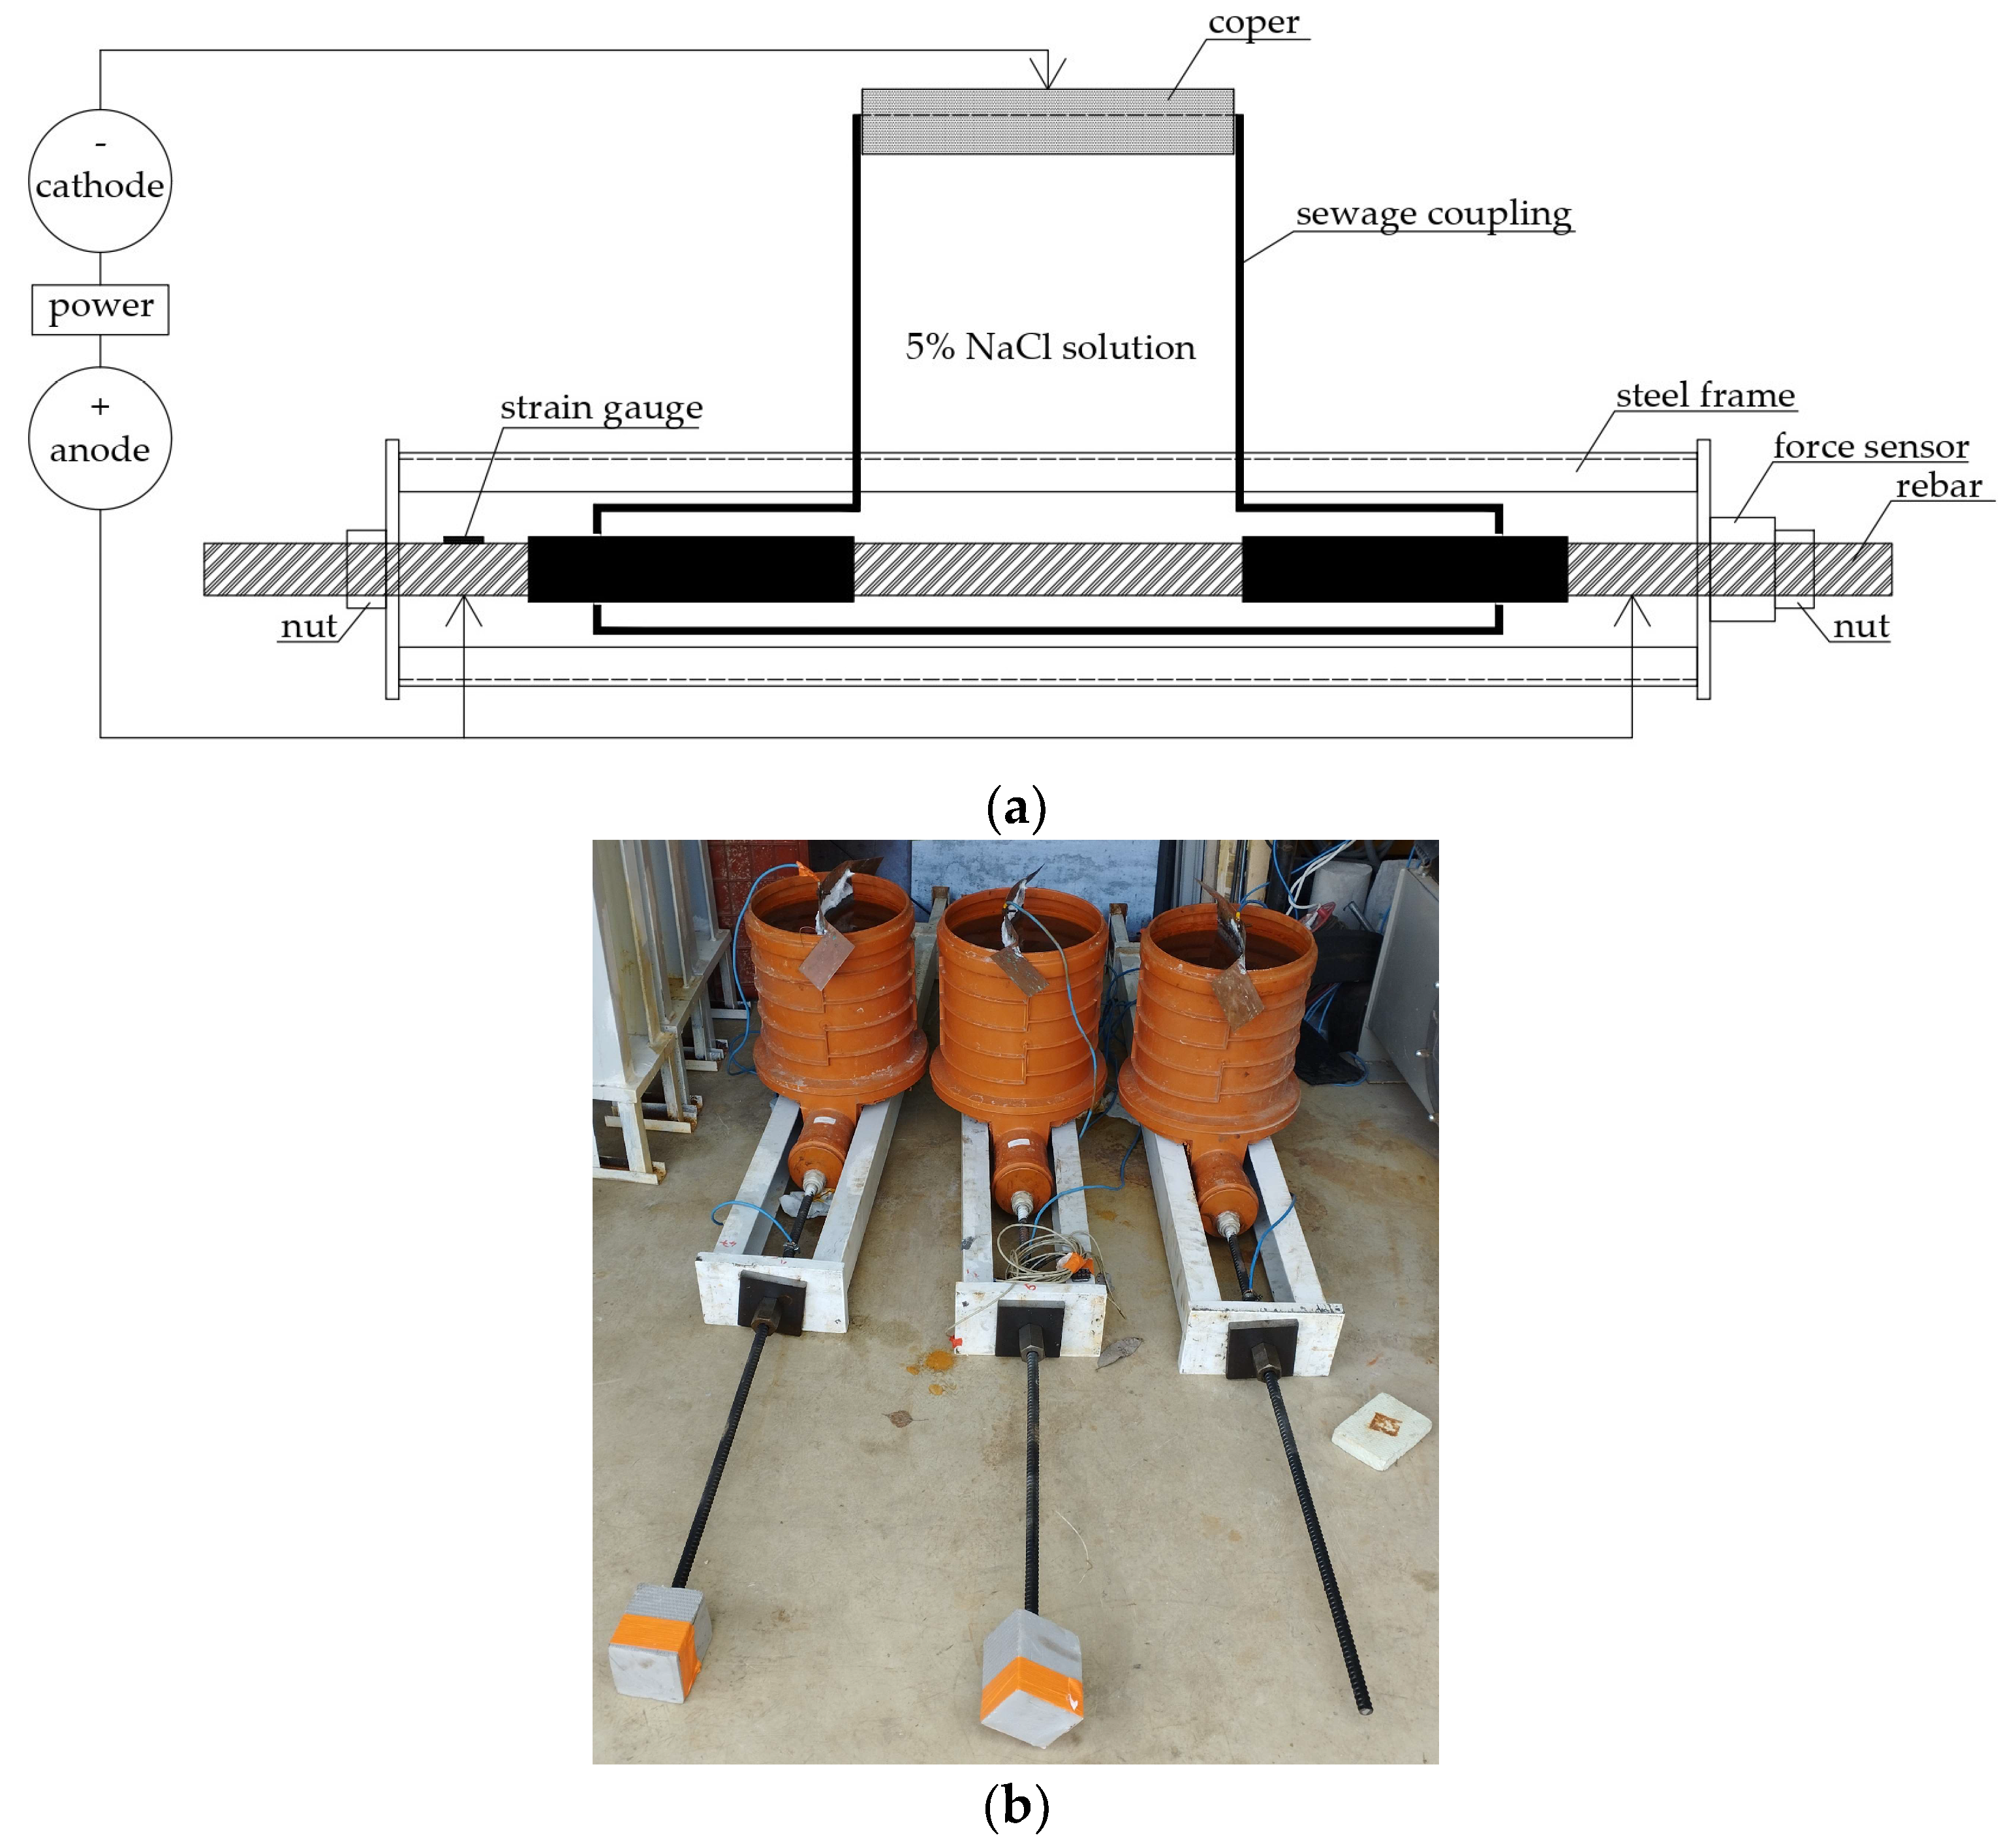
2.3. Sample Preparation and Electrical Current Connection

The corrosion process on the prestressing steel bars was accelerated using an electrochemical accelerated test. The Keysight Technologies N8739 equipment provided the source of electrical energy and precisely selected the value of the electrical current. It is a direct current (DC) power supply that provides constant output, built-in voltage and current measurement, and output voltage from 0 V to 600 V and electric current from 0 A to 400 A.
Corrosion tests were carried out in an accredited laboratory at the Faculty of Civil Engineering of the University of Žilina, Slovakia. The prestressing steel bars were placed in a plastic coupling filled with a 5% sodium chloride (NaCl) salt solution. Only a certain length of the sample was exposed to the corrosive attack, while the rest of the sample was protected with an epoxy coating (see Figure 3). The anode (positive) was connected to the prestressing bar on both sides, and the cathode (negative) was connected to a copper plate, which was vertically inserted into the salt solution to a depth of approximately 40 mm (see Figure 4). The test was carried out in the laboratory at a temperature of 20 °C, the temperature of the salt solution was 15 °C, and the potential of hydrogen (pH) range was between 6.3 and 7.4.

2.4. Theoretical Calculation Using Faraday’s Law

The theoretical degree of corrosion (change in mass) can be calculated using Equation (1) based on Faraday’s Law, which states that the mass of a substance deposited by an electrolyte is directly proportional to the electric charge transferred during electrolysis and the atomic weight of the substance, and inversely proportional to the valence of the ions involved:
Δ m = M × I × t Z × F
After modifying Equation (1), we obtain Equation (2), which describes the theoretical degree of corrosion ηfr in (%):
η f r = Δ m m = M × I × t m × Z × F = M × I × t π × r 2 × ρ × l × Z × F ,
where M is the atomic weight of iron (56 g × mol−1); I is the electric current (A); t is time (s); Z is the ionic charge (6 for Cr → Cr6+ + 6e); F is the Faraday Constant (96,320 A/s); r is the radius of the bar (cm); ρ is the density of iron (7.874 g/cm3); l is the length of the sample exposed to corrosion (cm).

2.5. Influence of Electric Current Value

The experiment was focused on several aspects of the influence of electrochemical corrosion using direct current. Firstly, the influence of electric current value on the prestressing steel bar was examined. The electric current value was within range from 0.25 A to 3.0 A. The corrosion behavior with respect to time (corrosion rate) was also verified using the same electric current value in different time intervals, for example, 10 days (240 h), 20 days (480 h), and 30 days (720 h).

2.6. Influence of Prestressing Level on Corrosion

During the tensile test of the bars, a maximum ultimate force of 235 kN was measured. Therefore, the three prestressing levels were chosen for the analyzed bars as follows: 0 kN; 85 kN; 170 kN; and 210 kN, which represent 0%; 35%; 75%; and 90% of the measured tensile strength (or stresses), respectively. The test was performed in the same time interval for each selected prestressing level, which was 20 days (480 h). The chosen value of the electric current was 0.25 A.
Figure 5 shows the device for the application of prestressing—two steel plates to which four L-profiles are welded. The prestressing steel bar was placed in the center of the end steel plates. The force sensor HBM C6B was installed on one end of the bar. The sensor is composed of stainless steel, hermetically sealed and has a high level of quality (IP68). The sensor contains an internal hole, which is mainly used for monitoring the stress in the case of anchors or strands. During the measurement, two strain gauges of type HBM 1-LY11-6/120 were used to record the change in strain. These strain gauges’ measuring grid length was 0.006 m. Using HBM’s Catman software (CatmanAP, version 3.2), the measured data from the sensors placed on the sample were obtained. The tensile stress at chosen prestressing level (35%; 75%; and 90%) was generated by an electric hydraulic pump and a hydraulic press. The tensile stress was applied until the required value was reached. The strain gauges were installed on the samples and after the chosen time for corrosion of the sample, the value of the tensile strength was measured again.

2.7. Evaluation Method Using Weight Loss

Before exposing the samples to the corrosion environment, they were thoroughly cleaned of impurities and their exact weight and surface area, which was in direct contact with the corrosion environment, were determined. After a specified exposure time to the corrosion environment, the corrosion products were removed from the surface of the samples mechanically.
Gravimetry, as a method for determining the corrosion rate of metallic materials, is not suitable if the test samples are subjected to intergranular or transgranular corrosion.
Based on the obtained appropriate values of the sample weight before and after the corrosion resistance test, it is possible to determine the corrosion rate using Equation (3):
r c o r r = M 0 M 1 ρ × S c o r r × t × 8760 ,
where “8760” is an empirical constant; rcorr is the corrosion rate (mm/year); M0 is the gravitational weight of the reinforcing steel before the test (g); M1 is the gravitational weight of the reinforcing steel after the test (g); ρ is the density of the sample (g/mm3); t is the time of exposure to the corrosive environment (h); and Scorr is the area of the sample exposed to the corrosive environment (mm2) [39].
The degree of corrosion of the sample can be represented by the average gravimetric weight loss, which is identical to the average loss of cross-sectional area. The experimental degree of corrosion is calculated using Equation (4), as follows:
η e x = M 0 M 1 × 100 % .

2.8. Summary of All Experimental Samples

A total of 48 samples of prestressing bars were measured at different levels of the electric current, and tensile strength (various tensile forces), considering the various prestressing levels and different periods of exposure. The description of individual samples is listed in Table 2.

3. Discussion

3.1. Corrosion Morphology

The morphology of the sample corrosion at different times of corrosion is shown in Figure 6. The photographs show a uniform corrosion attack. Uniform corrosion is characterized by the balanced dissolution of the entire surface area of the material. In the case of the corrosion time of 10 days, the experimental weight loss was 3.22%, while in the case of the corrosion time of 20 days, the experimental weight loss was increased to 6.52%, and finally, the corrosion time of 30 days caused experimental weight loss of 10.12%. Moreover, the depth of the corrosion pits increased slightly, the corrosion areas gradually expanded, and the transverse and longitudinal ribs gradually disappeared. Overall, the depth of local corrosion pits was relatively small, so the morphology of corrosion was defined as uniform.

3.2. Influence of Electric Current Value

The influence of the electric current value on the prestressing bars’ corrosion was significant. At the location where the corrosion was initiated, pronounced pitting corrosion occurred at the beginning and the end of the designated area. The examined samples were measured in two positions according to Figure 7, every 50 mm in the designated area of the reinforcement for corrosion. The measurement was performed using a calibrated caliper. After a predetermined time period, which was the same for all the samples, the sample exposed to electrochemical corrosion was cleaned of corrosion. The measurements were taken again in two positions according to Figure 7, in the same positions as prior to corrosion. The percentage cross-section loss was calculated using Equation (5):
S = π × r 1 2 + π × r 2 2 2 π × r 1 . c o r r 2 + π × r 2 . c o r r 2 2 × 100 % .
After evaluation, as can be seen in Figure 8 and Figure 9, in the case of an electric current of 0.25 A, the average cross-sectional loss at the edges was 86%, while in the middle area, the loss was 88%. For an electric current of 0.5 A, the average cross-sectional loss at the edges was 71% and in the middle 83%. In the case of an electric current of 0.75 A, the average cross-sectional loss at the edges was 55%, while in the middle it was 70%.

3.3. Electric Current Efficiency

The efficiency of electric current and the estimated percentage of corrosion loss ηfr were calculated using Equation (2) based on Faraday’s Law. The theoretical degree of corrosion was confirmed by the experimental degree of corrosion ηex, calculated using Equation (4). One parameter that can be used to compare the deviations is the current efficiency defined by Equation (6):
E f f i c i e n c y = η e x η f r × 100 % ,
where η e x is the experimental weight loss of the sample given by Equation (4), and η f r is the theoretical weight loss of the sample given by Formula (2).
The results of electric current efficiencies are listed in Table 3.
The electric current efficiency ranged from 92.0% to 96.43%. The results suggest that the electric current efficiency is lower than 100%, which is a common phenomenon. This can be explained by the theory that in electrochemical-accelerated corrosion, only a portion of the external electric current oxidizes at the anode to form the corrosive products, while the remaining current is consumed in competitive reactions [44,45,46].
Experimental as well as theoretical corrosion results at different time dependencies are shown in Figure 10. The corrosion loss increased with the prolongation of the corrosion test time and the corrosion rate had a linear behavior in terms of time.

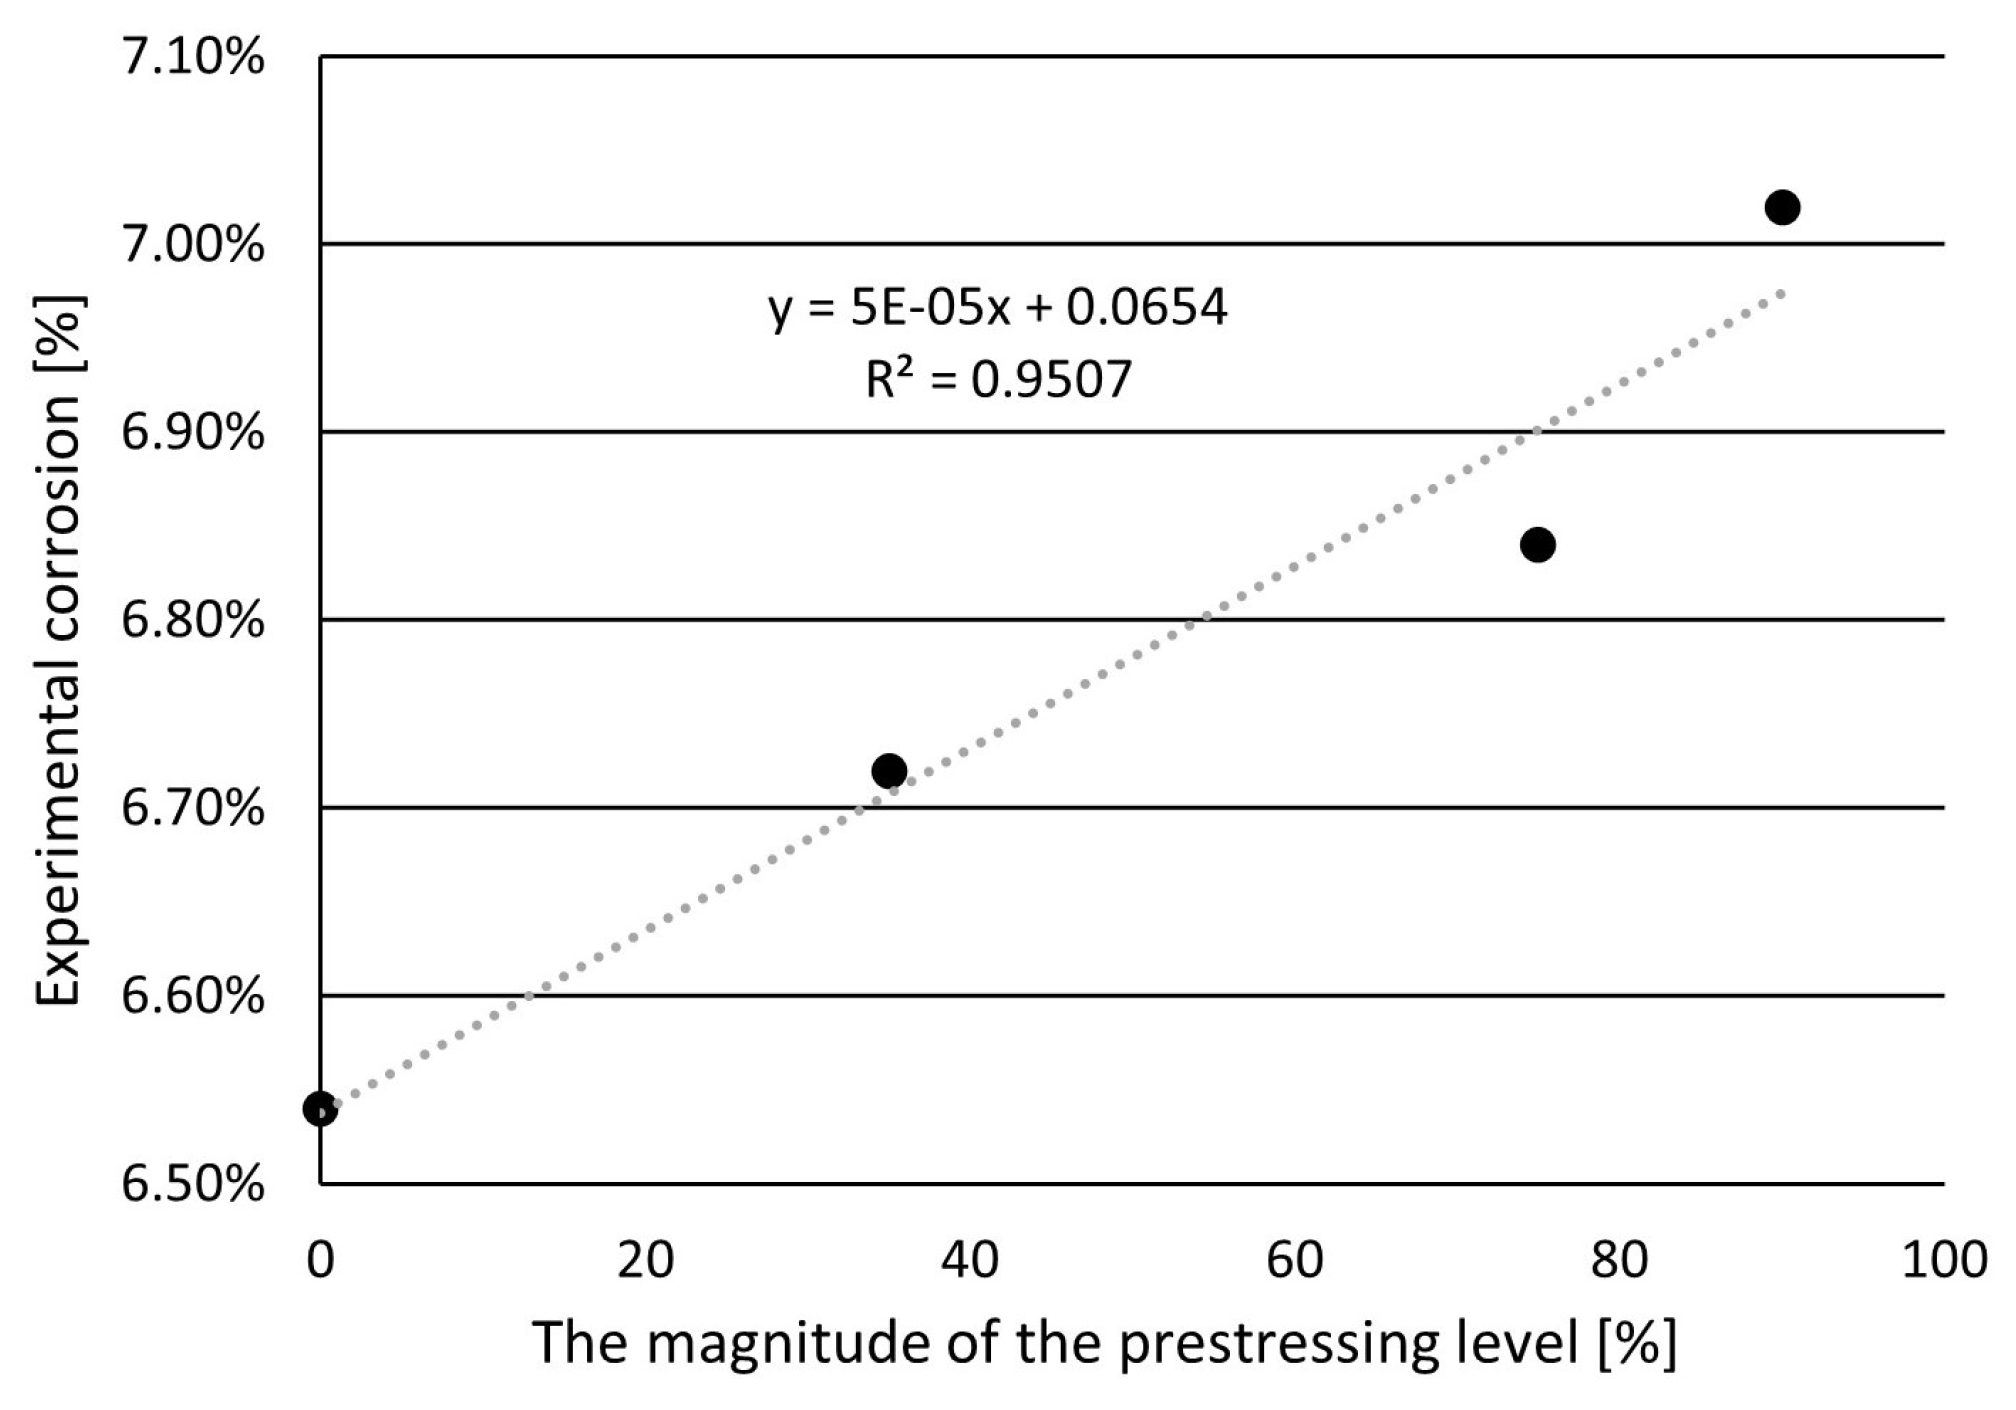
3.4. Effect of Prestressing Level on Corrosion

The average values of the corrosion degree of the samples at each selected prestressing levels in the prestressing bar during the uniform time of 20 days are listed in Table 4.
During corrosion, the degree of corrosion of the sample increased with increasing stresses (prestressing level) in the prestressing steel bar, indicating that the prestressing level affected the degree of corrosion of the prestressing steel bar. At the maximum selected prestressing level, the degree of corrosion increased by 7.3% compared to the zero-prestressing level (unstressed state), as shown in Figure 11.
The increased corrosion rate was confirmed using Equation (3), as well, where for the tensile stresses level of 35% tensile strength, the corrosion rate increased by 2.8%, for a tensile stresses level of 75% tensile strength, the corrosion rate increased by 4.6%, and for a tensile stresses level of 90% tensile strength, the corrosion rate increased by 7.3%, compared to the unstressed state (see Figure 12).
The tensile stress level decreased from f0 = 35%, 75%, and 90% of tensile strength to f1 = 32%, 71%, and 85% of measured tensile strength of the prestressing steel bar after the samples’ corrosion (see Figure 13).

4. Conclusions

The paper presented the results of an experimental study of corrosion of the prestressing steel bars of the CKT type, which are composed of high-quality prestressing steel of grade Y 1050 (1050 MPa) at different levels of stress (prestressing level).
The main conclusions of this study can be presented as follows:
  • The distance of the copper (as a cathode) from the sample has a significant effect on the course and outcomes of the experiment. If the copper is very close, the sample cannot corrode evenly, but primary corrosion occurs in the vicinity of the copper. In addition, for uniform corrosion of the sample, it has a better effect if the sample is placed horizontally during the experiment.
  • Experimental results have shown that there is no obvious difference in the sample morphology corrosion during the same time of corrosion exposure and the same value of electric current at the different levels of prestressing.
  • The electric current value significantly affects the corrosion of prestressing bars. The optimal electric current value for the selected sample’s diameter is 0.25 A, which does not create significant pitting corrosion at the beginning and end of the corrosion area of the sample. This pitting corrosion could lead to the premature failure or rupture of the sample.
  • The efficiency of the electric current was slightly lower than the theoretical calculation using Faraday’s Law. This could have been caused by the loss of current in competing reactions, so only a part of the external current oxidizes the anode to form corrosion products. Although Faraday’s Law does not apply exactly, it is possible to predict a rough estimate of the corrosion degree with known input data.
  • Experimental, as well as the theoretical results of corrosion at different time dependencies, show that the degree of corrosion increased with the prolongation of the corrosion test time, and the degree of corrosion with time had a linear progression.
  • The prestressing level affected the corrosion degree of the prestressing steel bar. The higher the level of prestressing, the higher the degree of corrosion. The degree of corrosion of the sample at the maximum selected stresses of 90% of measured tensile strength increased by 7.3% compared to the unstressed state.
  • The prestressing force during the electrochemical test decreased. This may have been caused by the corrosion of the sample and the reduction of the surface area of the prestressing steel bar, resulting in a decrease in the stresses of the prestressing steel bar.
  • The results obtained during the experimental campaign are affected by the coating and quality of the chemical composition. If the coating and chemical composition of the CKT bar differs, the results can significantly vary. In this basic experiment, which is the crucial base for future detailed analysis, the specimens with the same coating and chemical composition were studied. In the future, it is important to enlarge the number of experimental specimens and observe the corrosion of different types of prestressing steel, material properties, and diameters. Moreover, the study would benefit from the observation of the corrosion of prestressing steel embedded in the surrounding concrete with different classes and compositions. This way, the study would describe the real behavior of the corrosion losses in more detail.
Due to time and budget constraints, the experiment was conducted without the tensile tests and an examination of the effect of corrosion on the mechanical properties of the prestressing steel bars. It would also be appropriate to perform a precise chemical analysis of the prestressing steel bar and process a Pourbaix diagram to correctly determine whether the sample is in the passive, active, or immunity region during the test.

Author Contributions

Conceptualization, P.K. and M.Z.; methodology, P.K. and M.Z.; validation, P.K., M.Z. and J.K.; formal analysis, P.K., M.Z. and J.K.; investigation, M.Z.; resources, P.K. and M.Z.; data curation P.K. and M.Z.; writing—original draft preparation, M.Z. and P.K.; writing—review and editing, P.K., M.Z. and J.K.; visualization, M.Z.; supervision, P.K. and M.Z. All authors have read and agreed to the published version of the manuscript.

Funding

This paper was supported under the project of Operational Programme Integrated Infrastructure: Application of innovative technologies focused on the interaction of engineering constructions of transport infrastructure and the geological environment, ITMS2014+ code 313011BWS1. The project is co-funding by European Regional Development Fund and by Research Project No. 1/0306/21 of the Slovak Grant Agency.

Data Availability Statement

Some or all data, and results used during the study are available from the corresponding author by request.

Conflicts of Interest

The authors declare no conflict of interest.

References

  1. Ozbolt, J.; Oršanic, F.; Balabanic, G.; Kušter, M. Modelling damage in concrete caused by corrosion of reinforcement: Coupled 3D FE model. Int. J. Fract. 2012, 178, 233–244. [Google Scholar] [CrossRef]
  2. Moravcik, M.; Bujnakova, P.; Bahleda, F. Failure and damage of a first-generation precast prestressed bridge in Slovakia. Struct. Concr. 2020, 16, 2353–2362. [Google Scholar] [CrossRef]
  3. Tu, B.; Dong, Y.; Fang, Z. Time-Dependent Reliability and Redundancy of Corbared Prestressed Concrete Bridges at Material Component, and System Levels. J. Bridge Eng. 2019, 24, 04019085. [Google Scholar] [CrossRef]
  4. Kralovanec, J.; Bahleda, F.; Moravcik, M. State of Prestressed Analysis of 62-Year-Old Bridge. Materials 2022, 15, 3583. [Google Scholar] [CrossRef]
  5. Abdelaziz, M.M.; Gomaa, M.; El-Ghazaly, A.H. Progressive collapse analysis of prestressed concrete girder bridges using improved applied element method. Adv. Bridge Eng. 2022, 3, 24. [Google Scholar] [CrossRef]
  6. Kralovanec, J.; Moravcik, M.; Jost, J. Analysis of prestressed in precast prestressed concrete beams. Civ. Environ. Eng. 2021, 17, 184–191. [Google Scholar] [CrossRef]
  7. Bobalo, T.; Blikharskyy, Y.; Kopiika, N.; Volynets, M. Serviceability of RC Beams Reinforced with High Strength Rebar’s and Steel Plate. In Proceedings of the Advances in Resource-Saving Technologies and Materials in Civil and Environmental Engineering (CEE 2019), Lviv, Ukraine, 11–13 September 2019; Lecture Notes in Civil Engineering. Springer International Publishing: Berlin/Heidelberg, Germany, 2020; Volume 47, pp. 25–33. [Google Scholar] [CrossRef]
  8. Vereecken, E.; Botte, W.; Lombaert, G.; Caspeele, R. Assessment of corroded prestressed and posttensioned concrete structures: A review. Struct. Concr. 2021, 22, 2556–2580. [Google Scholar] [CrossRef]
  9. Huang, G.; Wu, B.; Shen, Y.; Wang, L.; Li, G. Comparative experiment of steel bar corrosion at concrete construction joints. Front. Mater. 2022, 9, 1094696. [Google Scholar] [CrossRef]
  10. Chen, M.; Qian, H. Effects of natural minor corrosion levels on mechanical property and bond anchorage behavior of CRB600H steel bars. Constr. Build. Mater. 2022, 340, 127660. [Google Scholar] [CrossRef]
  11. Vizhi, I.M.; Kalirajan, K.; Selvaraj, S. Study of Carbon Steel Corrosion in 1.0N HCL Medium by Mimusops Elengi Leaves Extract by Electro Chemical Studies. J. Adv. Sci. Res. 2019, 10 (Suppl. S2), 324–327. [Google Scholar]
  12. Bejinariu, C.; Munteanu, C.; Florea, D.C.; Istrate, B.; Cimpoesu, N.; Alexandru, A.; Sandu, V.A. Elektro-chemical Corrosion of a Cast Iron Protected with a Al2O3 Ceramic Layer. Rev. Chim. 2018, 69, 3586–3589. [Google Scholar] [CrossRef]
  13. Wu, X.; Li, L.; Li, H.; Li, B.; Ling, Z. Effect of strain level on corrosion of stainless steel bar. Constr. Build. Mater. 2018, 163, 189–199. [Google Scholar] [CrossRef]
  14. Li, J.; Miki, T.; Yang, Q.; Mao, M. Experimental Study on Prestressed Strength of Corbared Prestressed Concrete Steel Strands. J. Adv. Concr. Technol. 2022, 20, 550–563. [Google Scholar] [CrossRef]
  15. Hui, L.; Wu, X. Effect of Tension Strain Level on Reinforcement Corrosion. J. Mater. Civ. Eng. 2018, 30, 04017311. [Google Scholar] [CrossRef]
  16. Wang, L.; Zhang, X.; Zhang, J.; Yi, J.; Liu, Y. Simplified Model for Corrosion-Induced Bond Degradation between Steel Strand and Concrete. J. Mater. Civ. Eng. 2017, 24, 04016257. [Google Scholar] [CrossRef]
  17. Kucharikova, L.; Liptakova, T.; Tillova, E.; Bonek, M.; Medvecka, D. Corrosion Behaviour Correlation of the Secondary Aluminium Casts in Natural Atmosphere and Laboratory Conditions. Arch. Metall. Mater. 2020, 65, 1455–1462. [Google Scholar]
  18. Faten, Y.T.; Mohammed, A.M.; Hayder, M.O. Numerical Analysis of Corrosion Reinforcements in Fibrous Concrete Beams. Civ. Environ. Eng. 2021, 17, 259–269. [Google Scholar] [CrossRef]
  19. Koteš, P.; Strieška, M.; Bahleda, F.; Bujňaková, P. Prediction of RC Bridge Member Resistance Decreasing in Time under Various Conditions in Slovakia. Materials 2020, 13, 1125. [Google Scholar] [CrossRef] [Green Version]
  20. Blikharskyy, Y.; Selejdak, J.; Kopiika, N. Specifics of corrosion processes in thermally strengthened rebar. Case Stud. Constr. Mater. 2021, 15, e00646. [Google Scholar] [CrossRef]
  21. Tian, Y.; Zhang, G.; Ye, H.; Zeng, Q.; Zhang, Z.; Tian, Z.; Jin, X.; Jin, N.; Chen, Z.; Wang, J. Corrosion of steel rebar in concrete induced by chloride ions under natural environments. Constr. Build. Mater. 2023, 369, 130504. [Google Scholar] [CrossRef]
  22. Joch, R.; Pilc, J.; Daniš, I.; Drbúl, M.; Krajčoviech, S. Analysis of Surface roughness in turning process using rotating tool with chip breaker for specific shape of automotive transmission shafts. Transp. Res. Procedia 2019, 40, 295–301. [Google Scholar] [CrossRef]
  23. Kralovanec, J.; Moravcik, M. Experimental measurements in the field of prestressing force monitoring. Civ. Environ. Eng. 2022, 18, 104–110. [Google Scholar] [CrossRef]
  24. Ivosevic, S.; Kovac, N.; Vastag, G.; Majeric, P.; Rudof, R.J. The Analyses of the Rate of Pitting Corrosion of a NiTi Rod in a Natural Marine Environment. Marit. Transp. Sci. Spec. Ed. 2022, 4, 87–99. [Google Scholar] [CrossRef]
  25. Kralovanec, J.; Bahleda, F.; Prokop, J.; Moravcik, M.; Neslusan, M. Verification of Actual Prestressed in Existing Pre-Tensioned Members. Appl. Sci. 2021, 11, 5971. [Google Scholar] [CrossRef]
  26. Krajci, Ľ.; Jerga, J. Assessment of Steel Reinforcement Corrosion State by Parameters of Potentiodynamic Diagrams. Civ. Environ. Eng. 2015, 11, 95–102. [Google Scholar] [CrossRef] [Green Version]
  27. Dasar, A.; Patah, D.; Hamada, H.; Yamamoto, D.; Sagawa, Y. Life performance of 40-year-old RC Beams with different concrete covers and bar diameters in natural corrosion environments. Structures 2022, 46, 2031–2046. [Google Scholar] [CrossRef]
  28. Strieška, M.; Koteš, P. Corrosion map of zinc in Slovakia. Pollack Periodica 2018, 13, 129–136. [Google Scholar] [CrossRef]
  29. Jabir, O.Y.; Oleiwi, H.M.; Sultan, A.A. Reliability of Non—Destructive Technologies in Corrosion Detection of Reinforced Concrete Structures. Civ. Environ. Eng. 2022, 18, 137–147. [Google Scholar] [CrossRef]
  30. Jančula, M.; Jošt, J.; Gocál, J. Influence of aggressive environmental actions on bridge structures. Transp. Res. Procedia 2021, 55, 1229–1235. [Google Scholar] [CrossRef]
  31. Gandel, R.; Jerabek, J.; Marcalikova, Z. Reinforced Concrete Beams Without Shear Reinforcement Using Fiber Reinforced Concrete and Alkali-Activated Material. Civ. Environ. Eng. 2023, 19, 348–356. [Google Scholar] [CrossRef]
  32. Du, Y.G.; Clark, L.A.; Chan, A.H.C. Residual capacity of corroded reinforcing bars. Mag. Concr. Res. 2005, 57, 135–147. [Google Scholar] [CrossRef]
  33. Bacharz, K.; Raczkiewicz, W.; Bacharz, M.; Grzmil, W. Manufacturing Errors of Concrete Cover as a Reason of Reinforcement Corrosion in a Precast Element—Case Study. Coatings 2019, 9, 702. [Google Scholar] [CrossRef] [Green Version]
  34. Al-Sulaimani, G.J.; Kaleemullah, M.; Basunbul, I.A. Rasheeduzzafar, Influence of corrosion and cracking on bond behavior and strength of reinforced concrete members. ACI Struct. J. 1990, 87, 220–231. [Google Scholar] [CrossRef]
  35. Maaddawy, T.E. Long-term performance of corrosion-damaged reinforced concrete beams. ACI Struct. J. 2005, 102, 649–656. [Google Scholar] [CrossRef]
  36. Nossoni, G.; Harichandran, R.S. Harichandran, Electrochemistry of Accelerated Corrosion Testing Using an Impressed Current. In Proceedings of the Transportation Research Board 90th Annual Meeting, Washington, DC, USA, 23–27 January 2011. [Google Scholar]
  37. STN 03 8137; Corrosion Prevention. Metals, Alloys and Metal Coatings. Metallographic Examination of Corrosion Stress. Slovak Technical Standard. Slovak Office of Standards, Metrology and Testing: Bratislava, Slovakia, 1989.
  38. Hadzima, B.; Liptáková, T. Fundamentals of Electrochemical Corrosion of Metals; EDIS—The Publisher of UNIZA: Žilina, Slovakia, 2008. (In Slovak) [Google Scholar]
  39. Dziková, J.; Kajánek, D.; Nový, F.; Pastorek, F. Corrosion of Metal Materials; EDIS—The Publisher of UNIZA: Žilina, Slovakia, 2021. (In Slovak) [Google Scholar]
  40. STN EN 1537; Execution of Special Geotechnical Works. Ground Anchors. Slovak Technical Standard. Slovak Office of Standards, Metrology and Testing: Bratislava, Slovakia, 2013.
  41. Gago, F.; Muzik, J.; Bulko, R. The slope stability solution using meshless local Petrov-Galerkin method. Transp. Res. Procedia 2019, 40, 686–693. [Google Scholar] [CrossRef]
  42. Blikharskyy, Y.; Selejdak, J.; Kopiika, N. Corrosion Fatigue Damages of Rebars under Loading in Time. Materials 2021, 14, 3416. [Google Scholar] [CrossRef] [PubMed]
  43. Drusa, M.; Mihalik, J.; Muzik, J.; Gago, F. The Role of Geotechnical Monitoring at Design of Foundation Structures and Their Verification—Part 2. Civ. Environ. Eng. 2021, 17, 681–689. [Google Scholar] [CrossRef]
  44. Nossoni, G.; Harichandran, R. Current Efficiency in Accelerated Corrosion Testing of Concrete. Corrosion 2012, 68, 801–809. [Google Scholar] [CrossRef]
  45. Li, H.; Qiu, T.; Li, Z.; Lin, F.; Zhang, Q. Analytical Model for Ionic Current Dominated Corrosion of Nanoelectrodes in Metallized Films: Frequency and Electric Stress. J. Chem. Phys. 2023, 158, 114702. [Google Scholar] [CrossRef]
  46. Wang, X.; Cao, G.; Wang, B.; Xing, Y.; Lu, M.; Qiao, L.; Zhang, L. Effect of electric-arc-induced ablation on corrosion behavior of pipeline steel under high-voltage direct current interference. Anti-Corros. Methods Mater. 2022, 69, 481–489. [Google Scholar] [CrossRef]
Figure 1. Example of corrosion: (a) Corrosion scheme; (b) Uniform corrosion; (c) Non-uniform point corrosion; (d) Non-uniform pitting corrosion; (e) Non-uniform corrosion of a special-shape; (f) Non-uniform spot corrosion.
Buildings 13 01592 g001
Figure 2. Photographs from calibration of the effective uniform corrosion: (a) running experiment for vertical samples; (b) photographs of samples at the top where the cathode feed to the copper tube was connected; (c) close-up of the top of the sample where there was significant pitting corrosion; (d) close-up of the bottom of the sample where there was minimal pitting corrosion.
Buildings 13 01592 g002
Figure 3. Scheme and dimensions of the tested sample (unit: mm).
Buildings 13 01592 g003
Figure 4. Samples circuit connection diagram and illustration: (a) circuit diagram; (b) photography of the actual circuit connection.
Buildings 13 01592 g004
Figure 5. Scheme of prestressing and circuit connection display: (a) circuit diagram in a prestressed state; (b) photograph of the actual connection of prestressing bar samples.
Buildings 13 01592 g005
Figure 6. Corrosion morphology, samples at different corrosion times: (a) corroded sample after 10 days; (b) corroded sample after 20 days; (c) corroded sample after 30 days.
Buildings 13 01592 g006
Figure 7. Schematic cross-section and longitudinal view on the prestressing bar: (a) uncorroded prestressing bar; (b) corroded prestressing bar.
Buildings 13 01592 g007
Figure 8. Influence of electric current value on the cross-sectional loss of the prestressing steel bar.
Buildings 13 01592 g008
Figure 9. The influence of the electric current value on the prestressing steel bar cross-section after 30 days: (a) electric current value of 0.25 A; (b) electric current value of 0.5 A; (c) electric current value of 0.75 A.
Buildings 13 01592 g009
Figure 10. Corrosion behavior over time with an electric current of 0.25 A.
Buildings 13 01592 g010
Figure 11. The influence of the prestressing level in the prestressing steel bar on the level of experimental corrosion after 20 days.
Buildings 13 01592 g011
Figure 12. Increased corrosion rate due to increasing tensile stresses (prestressing level) in the prestressing steel bar after 20 days.
Buildings 13 01592 g012
Figure 13. The effect of corrosion on decrease in the stresses’ level (prestressing level) of the samples, where f0—the level of stresses in the samples before the effect of corrosion, f1—the level of stresses in the samples after the effect of corrosion.
Buildings 13 01592 g013
Table 1. Chemical composition of high-quality Y 1050 steel, wt%.
CMnSi PmaxSmax
0.700.700.300.0350.035
Table 2. Summary of all experimental samples.
Sample No.Time (Days)Electric Current (A)Tensile Strength (kN)
1152.000
2152.000
3153.000
4153.000
5154.000
6154.000
7103.000
8103.000
9103.000
10103.000
11103.000
12103.000
13101.500
14101.500
15202.000
16202.000
17302.500
18302.500
19100.250
20100.250
21100.500
22100.500
23100.750
24100.750
25200.250
26200.250
27200.500
28200.500
29200.750
30200.750
31300.250
32300.250
33300.500
34300.500
35300.750
36300.750
37200.2585
38200.2585
39200.25170
40200.25170
41200.25210
42200.25210
43200.2585
44200.2585
45200.25170
46200.25170
47200.25210
48200.25210
Table 3. Electric current efficiency.
Electric Current Value (A)Time (Days)Theorical Corrosion η f r (%) Experimental Corrosion η e x (%) Electric Current Efficiency (%)
103.503.2292.00
0.25207.006.5493.42
3010.509.7893.14
107.006.5293.14
0.52014.0013.3795.50
3021.0020.0795.57
1010.5010.1296.38
0.752021.0020.2596.43
3031.5029.7494.41
Table 4. Degree of corrosion of samples as a function of prestressing level at a uniform time of 20 days.
Prestressing Level (%)Time (Days)Theorical Corrosion η f r (%) Experimental Corrosion η e x (%) Electric Current Efficiency (%)
0207.006.5493.42
35207.006.7296.00
75207.006.8497.71
90207.007.02100.29
Disclaimer/Publisher’s Note: The statements, opinions and data contained in all publications are solely those of the individual author(s) and contributor(s) and not of MDPI and/or the editor(s). MDPI and/or the editor(s) disclaim responsibility for any injury to people or property resulting from any ideas, methods, instructions or products referred to in the content.

