Article

Numerical Analysis on the Behavior of Floating Geogrid-Encased Stone Column Improved Foundation

1
College of Urban and Rural Construction, Zhongkai University of Agriculture and Engineering, Guangzhou 510225, China
2
School of Civil Engineering, Guangzhou University, Guangzhou 510006, China
3
China Construction Fourth Engineering Division Corp. Ltd., Guangzhou 510665, China
*
Author to whom correspondence should be addressed.
Buildings 2023, 13(7), 1609; https://doi.org/10.3390/buildings13071609
Submission received: 16 May 2023 / Revised: 14 June 2023 / Accepted: 21 June 2023 / Published: 25 June 2023

Abstract

:
The ordinary (OSC) and geosynthetic-encased stone column (ESC) with different bearing strata significantly influenced its behavior. The paper established seven models for studying the behavior of floating stone columns using the finite difference method (FDM). The effect of geogrid and column length on the load-settlement behavior, bulging deformation, failure mode, and load transfer coefficient were also analyzed based on proposal models. The results showed that the bearing capacity of F-OSCs and F-ESCs increased with the increase in column and encasement length, respectively, and a critical length (i.e., 4D, where D was the column diameter) was found in settlement improvement. The bulging deformation was significant in F-OSCs and was observed at the top of a long column and the full length of a short column. The geogrid encasement could constrain the OSC to decrease the bulging deformation. The failure mode in F-OSCs was mainly a punching failure with bulging deformation for a short column (e.g., less than 4D), and was relative to the vertical pressure for a long column. The failure mode in F-ESCs was a punching failure, and the punching degree increased with an increase in encasement length. The load transfer coefficient of F-OSCs or F-ESCs was relatively stable as the column length increased to a critical value (e.g., 4D) or the encasement length increased to a critical value (e.g., 4D).

1. Introduction

The stone column was widely used in geotechnics engineering to improve the weak foundation due to the good drainage [1], mitigating liquefaction [2], and increasing bearing capacity [3]. The geosynthetic-encased stone column (ESC) solved the insufficient lateral confinement of ordinary stone column (OSC) because of the excellent tensile-resistant of geosynthetic material [4,5,6]. Therefore, the ESC-improved foundation was favored by researchers and extensively adopted in engineering [7,8,9]. The geology in actual construction was complex, and the stone column was almost impossibly supported in a hardened stratum. Consequently, the floating ordinary (F-OSC) and geosynthetic-encased stone column (F-ESC) began occurring, and their mechanism was investigated based on model tests [10,11,12]. Moreover, the F-OSC/F-ESC constructed in some cases was found to be more economical and practical than the end-bearing ordinary (E-OSC) or geosynthetic-encased stone column (E-ESC). However, it was unreal to understand their mechanism comprehensively by conducting substantial model tests due to the time and economic problems. The numerical simulation was a way to overcome this problem by parameter change.
The numerical simulation could detail the pile-soil interaction, which was one of important factor in affecting the study of underground structures [13,14,15,16]. The numerical method was used to study the floating stone column installed in the soft layer and achieved good results [17,18,19,20]. Moreover, most previous studies focused on either ordinary floating stone column [21,22] or end-bearing geosynthetic-encased stone column [23,24]. However, there are also limited studies on the performance of F-OSC/F-ESC based on numerical simulation. The authors [25] conducted the centrifuge tests and numerical model to investigate the effect of basal reinforcement on the global performance of F-ESC-supported embankments. Fattah et al. [26] estimated the bearing capacity of floating stone columns obtained by a general equation using SPSS (Statistical Package for the Social Sciences), and the results indicated that the area replacement ratio was the most critical factor in controlling the bearing capacity of floating stone columns. Ng and Tan [27] proposed a factor for the settlement improvement of floating stone columns based on the 2D finite element method (FEM). Şahinkaya et al. [28] conducted a numerical analysis of the behavior of floating stone columns under seismic loading and found that the bearing capacity of the column increased with the increase in column length and diameter. Ali [29] compared the behavior between the end-bearing and floating stone columns using PLAXIS 3D and found that the maximum settlement decreased with increased column length. Debnath and Dey [30] adopted the model tests and finite element method to analyze the optimum column and encasement length of floating stone columns with a geogrid-reinforced sand bed. Thakur et al. [31] studied the floating stone column group based on model tests and numerical simulation and found that the bulging area appeared within two times column diameter. The numerical method could effectively reduce the workload and compensate for the shortcomings of the experiments. However, the complexity of the interaction mechanism among aggregate, geosynthetic material, and surrounding soil resulted in difficulty in understanding the behavior of floating stone columns. The deformation, load transfer mechanisms, and failure modes were complicated for such column-reinforced foundations and are not thoroughly understood. Therefore, further investigation of the behavior of floating stone columns was essential for safe application in practical engineering.
In this paper, seven numerical models were developed to investigate the behavior of F-OSC and F-ESC installed in a clay foundation. The properties of materials (e.g., soil, aggregates, and geogrid) and interface were calibrated by numerical models or laboratory tests, and the proposed numerical models were validated by experimental data. The effect of geogrid and column length on the behavior of floating stone column composite foundations was studied based on proposal models. The load-settlement behavior, bulging deformation, failure mode, and load transfer coefficient were also analyzed.

2. Model Preparation and Validation
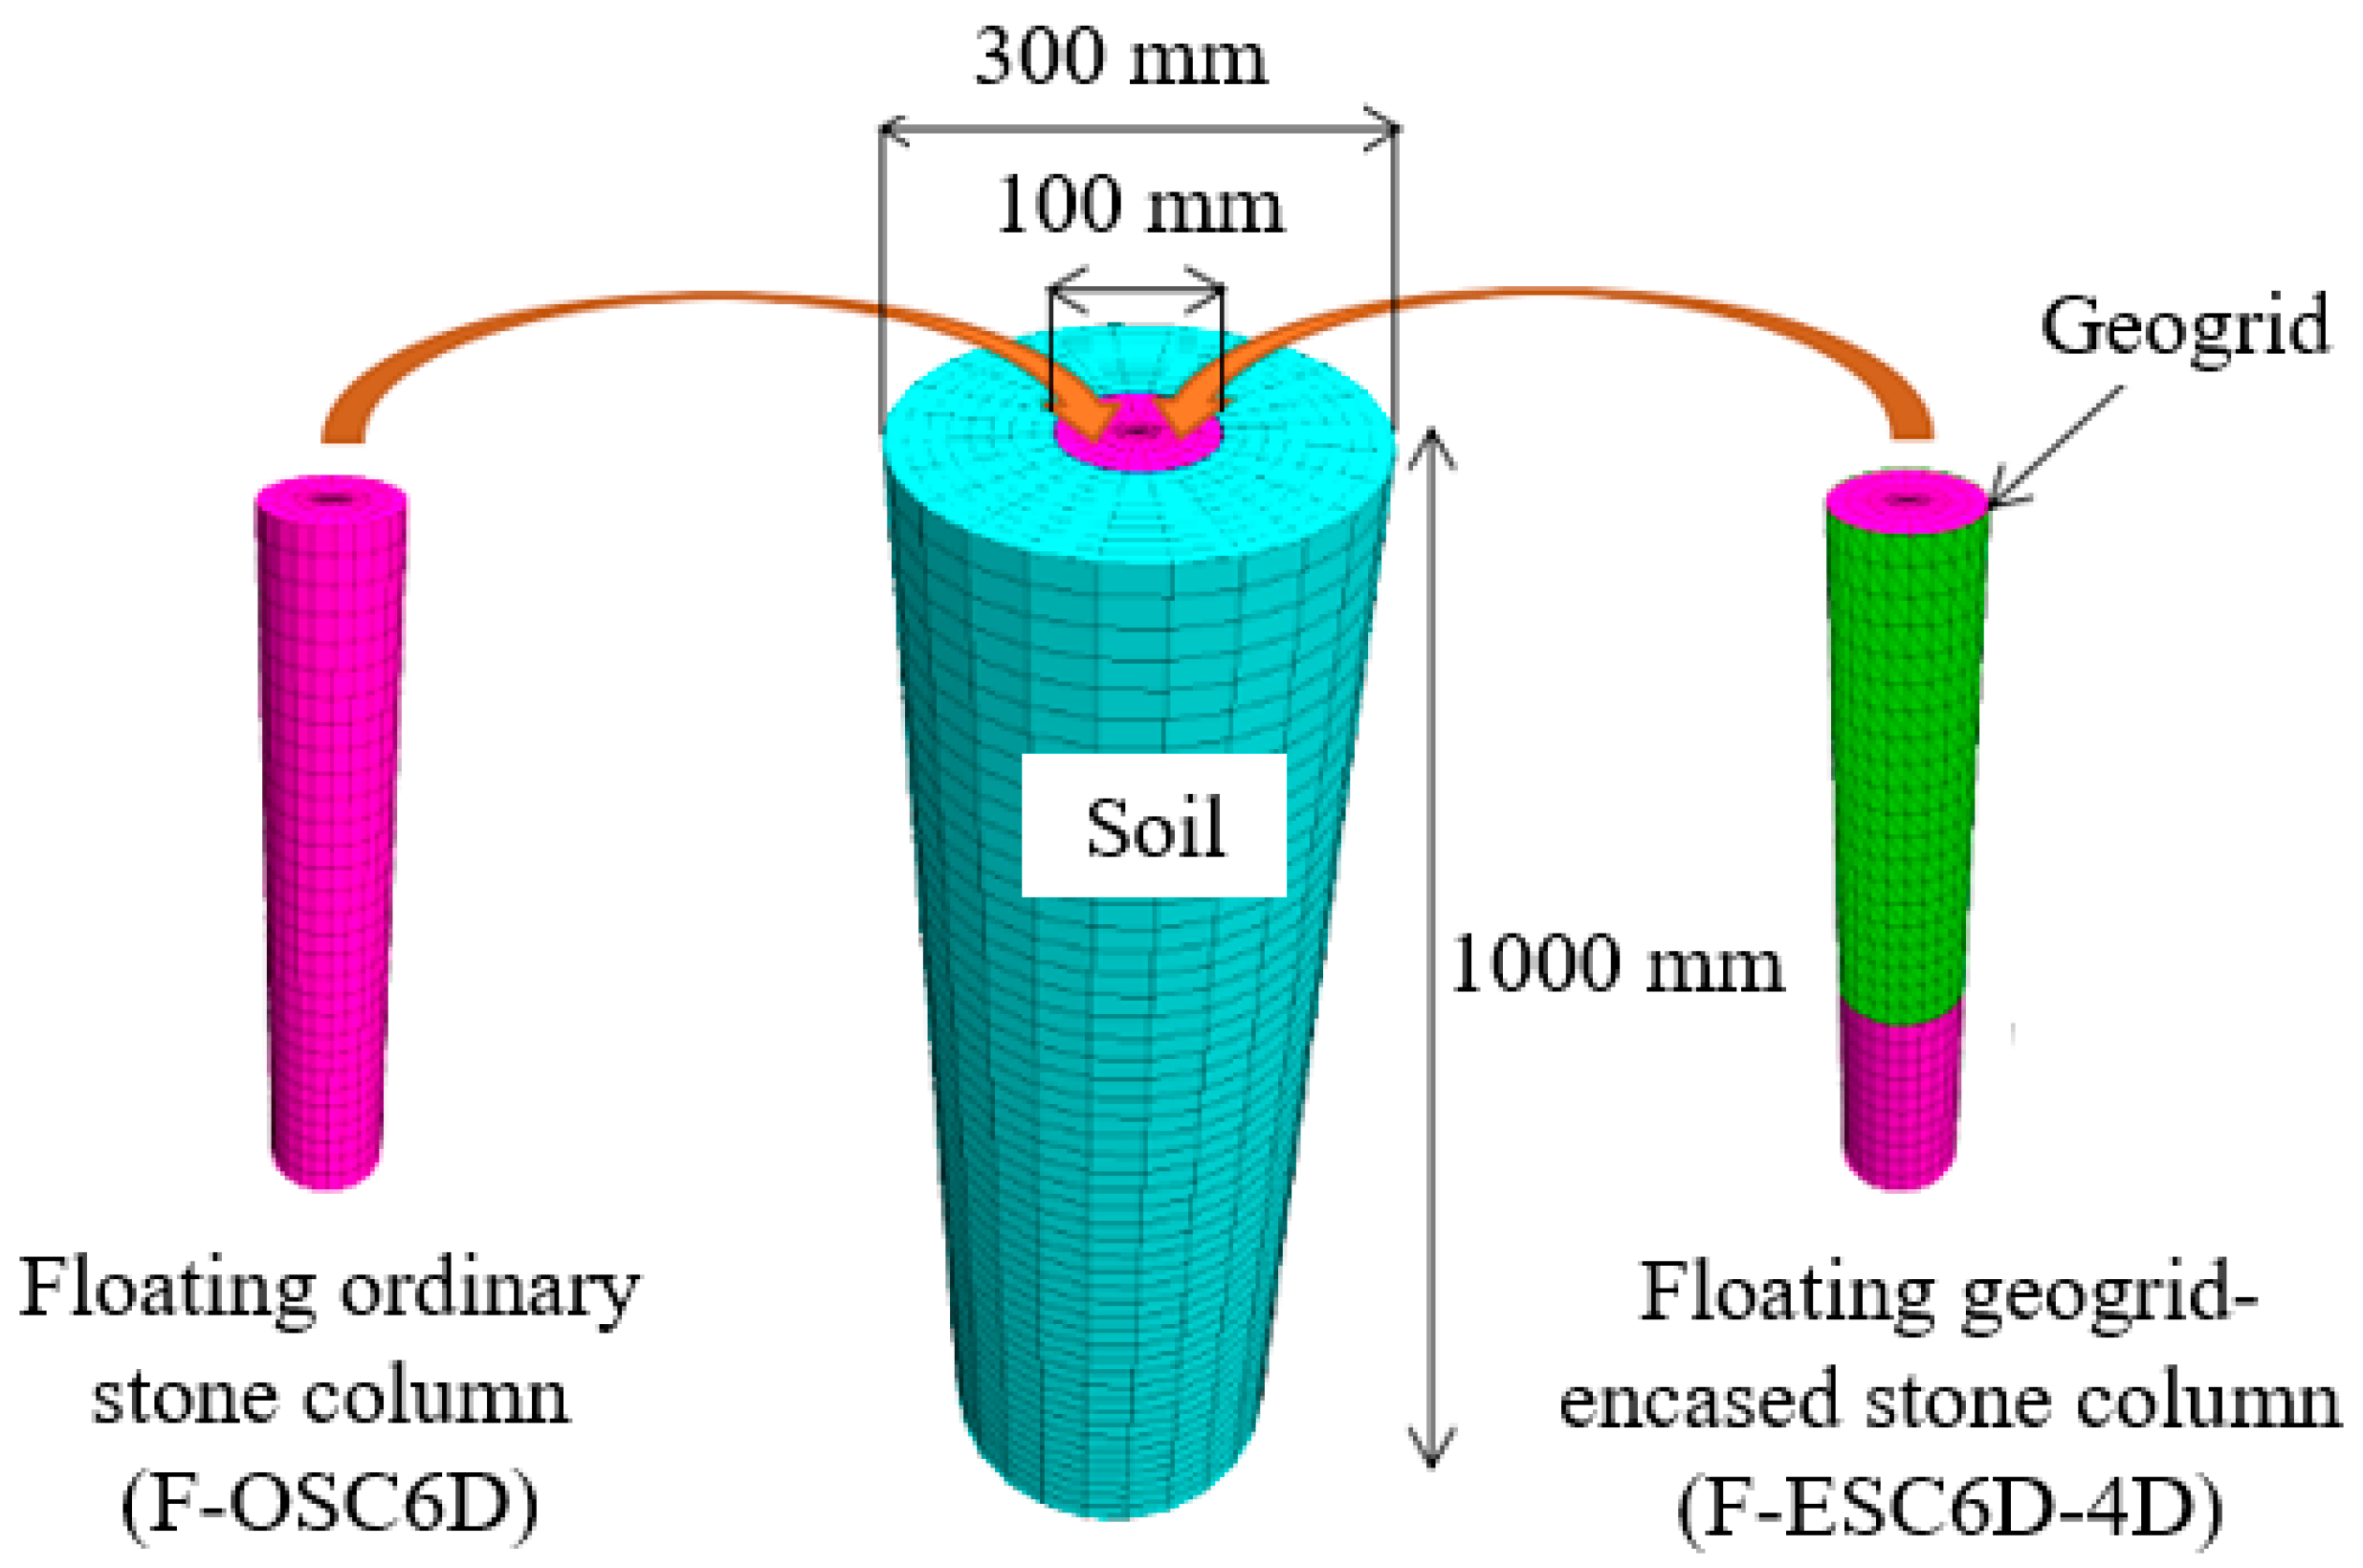
2.1. General

The numerical method can solve complex geotechnical problems for three-dimensional analysis. FLAC3D (Fast Lagrangian Analysis in the Continua Software Program) was used to establish a 3D numerical model [32]. FLAC3D was good at solving continuum problems and analyzing the materials’ and structures’ bearing capacity and deformation. The column and soil deformations were fully captured based on the numerical model through the node information updated continuously. The displacements and forces were solved numerically using FLAC3D in time. This paper totally established seven numerical models to study the effect of encasement and column length on the behavior of floating stone columns. The proposed numerical model was calibrated against the model test results. The load-settlement, bulging deformation, failure mode, and load transfer coefficient were analyzed in this paper. Table 1 summarizes the model test parameters, and the numerical model (F-OSC6D or F-ESC6D-4D) was presented in Figure 1. For instance, F-ESC6D-4D represented the floating geogrid-encased stone column (F-ESC) with 6D in column length and 4D in geogrid length.
The geogrid element was used to model the geogrid encasement, and the soil and stone column was simulated as the zone element in FLAC3D. The cylindrical zone (soil and stone column), the same size as the model tank, was first generated within the predetermined computational area and was grouped to realize the different properties setting of soil and stone column. The interface was introduced into the models to investigate better the column-soil interaction in F-OSC improved foundation. Therefore, the interface or geogrid element was built for the F-OSC or F-ESC. The cylindrical zone element center was set in the same properties as the stone column for constructing a floating stone column with a diameter of 100 mm. The other zone area was assigned the same properties as the soil. The normal displacement of the side and bottom of the zone element (soil) was fixed to zero. The vertical pressure was applied to the top of the stone column to model the actual vertical loading. The data were recorded by writing the fish function and history command in FLAC3D.

2.2. Soft Soil

The clay was classified according to ASTM [33] as CL and used in composite foundation testing. To determine the properties of clay, the conventional triaxial test was conducted. In the meantime, the corresponding numerical model with 38 mm in diameter and 76 mm in height was built based on FLAC3D. The comparison between the laboratory test and the numerical model is shown in Figure 2. The initial slope was about 0.3 MPa, which was used in numerical model. The numerical results were consistent with the experimental data. The properties of clay used in the numerical model are presented in Table 2.

2.3. Aggregates

The triaxial tests were carried out based on laboratory tests and numerical model. The specimen used in testing and modeling was 150 mm in diameter and 300 mm in height. The axial strain and deviatoric stress were measured in tests and models. The comparison of data variation between the laboratory test, and the numerical model is shown in Figure 3. The numerical results were consistent with the experimental data. The properties of aggregates used in the numerical model are presented in Table 3.

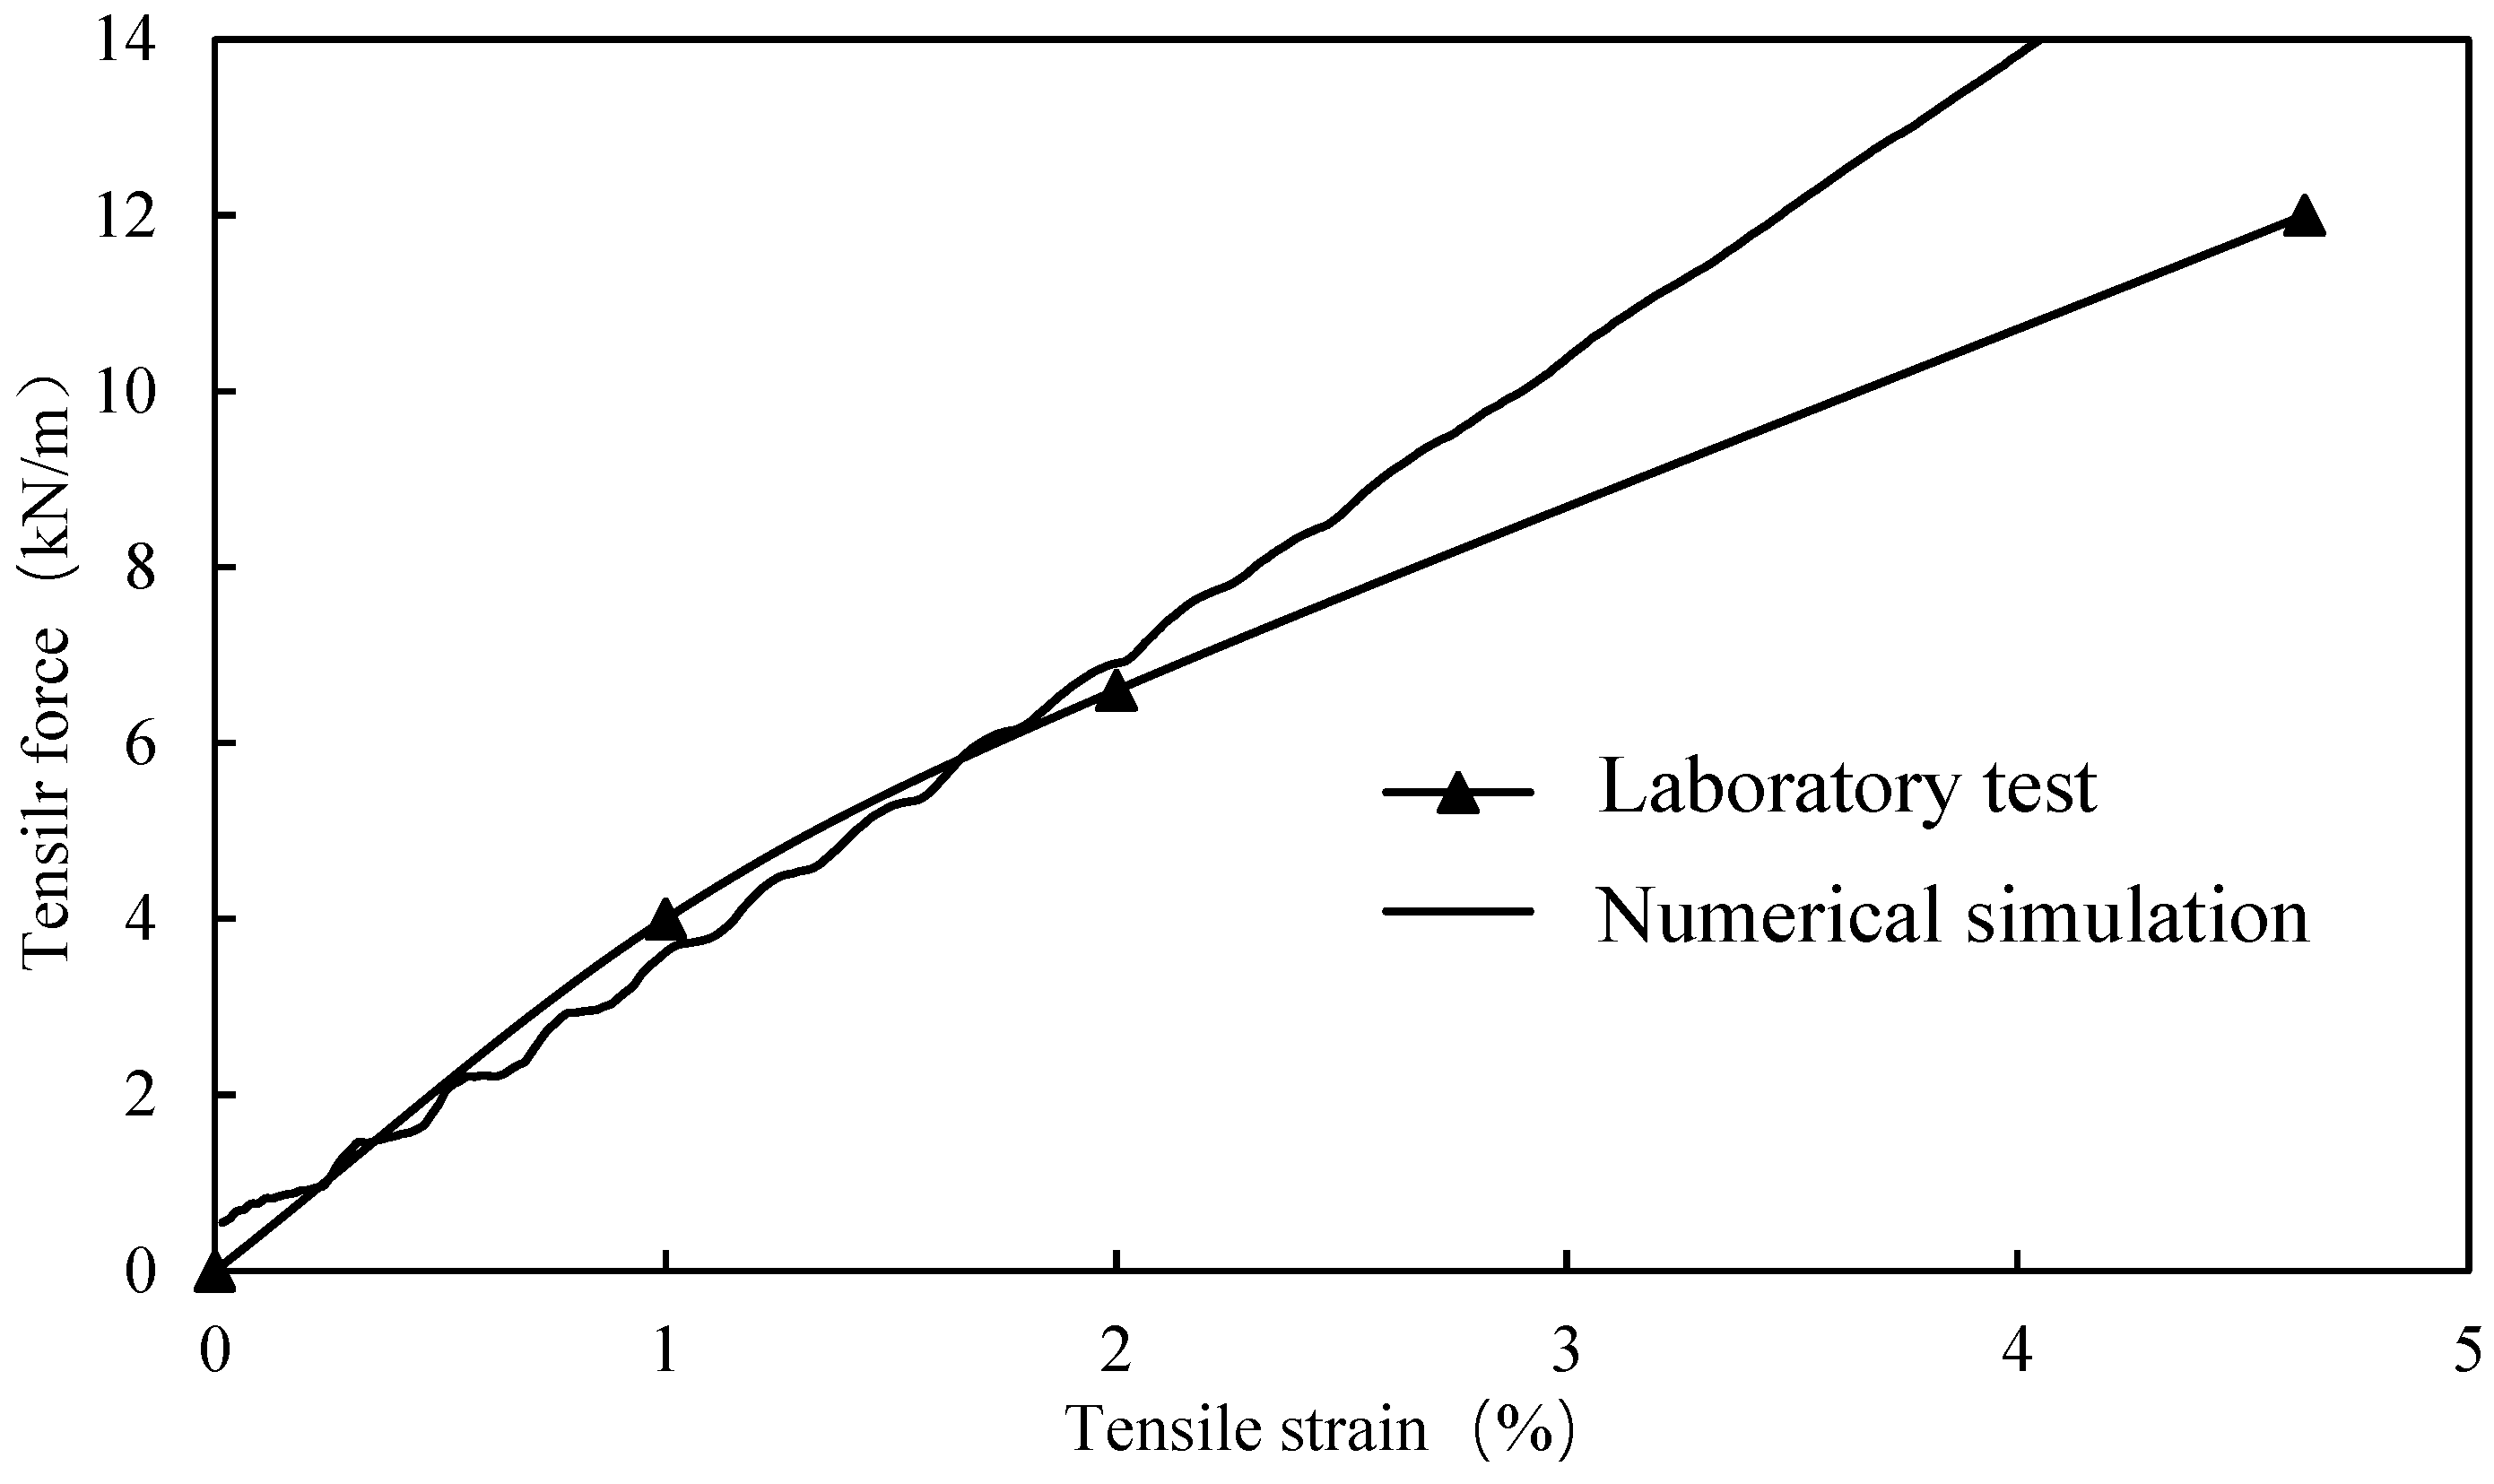
2.4. Biaxial Geogrid

The tensile test of biaxial geogrid 35 mm in width, 250 mm in length, and 1 mm in thickness was performed based on laboratory tests and numerical models. The tensile force and strain were recorded from the laboratory test and the numerical model, as shown in Figure 4. The elastic modulus was calculated as the tensile stiffness divided into the geogrid thickness. The tensile force in 2% tensile strain was 6.6 kN/m for geogrid with cable ties. The numerical results were consistent with the experimental data. The properties of geogrid used in the numerical model are presented in Table 4.

2.5. Interface

The different materials or meshes were generally assigned in the interface to reflect the slide or deformation of structures. Potyondy and Autio [34] suggested that the cohesion and friction could be 0.8 times that of adjacent soil under rough contact. If the stiffness of adjacent materials had a significant difference, the contact stiffness could be calculated as ten times that of the softer material, according to the FLAC3D help document. Therefore, the interface parameters used in the model are determined and summarized in Table 5. The constitutive model of the interface was Mohr-Coulomb.

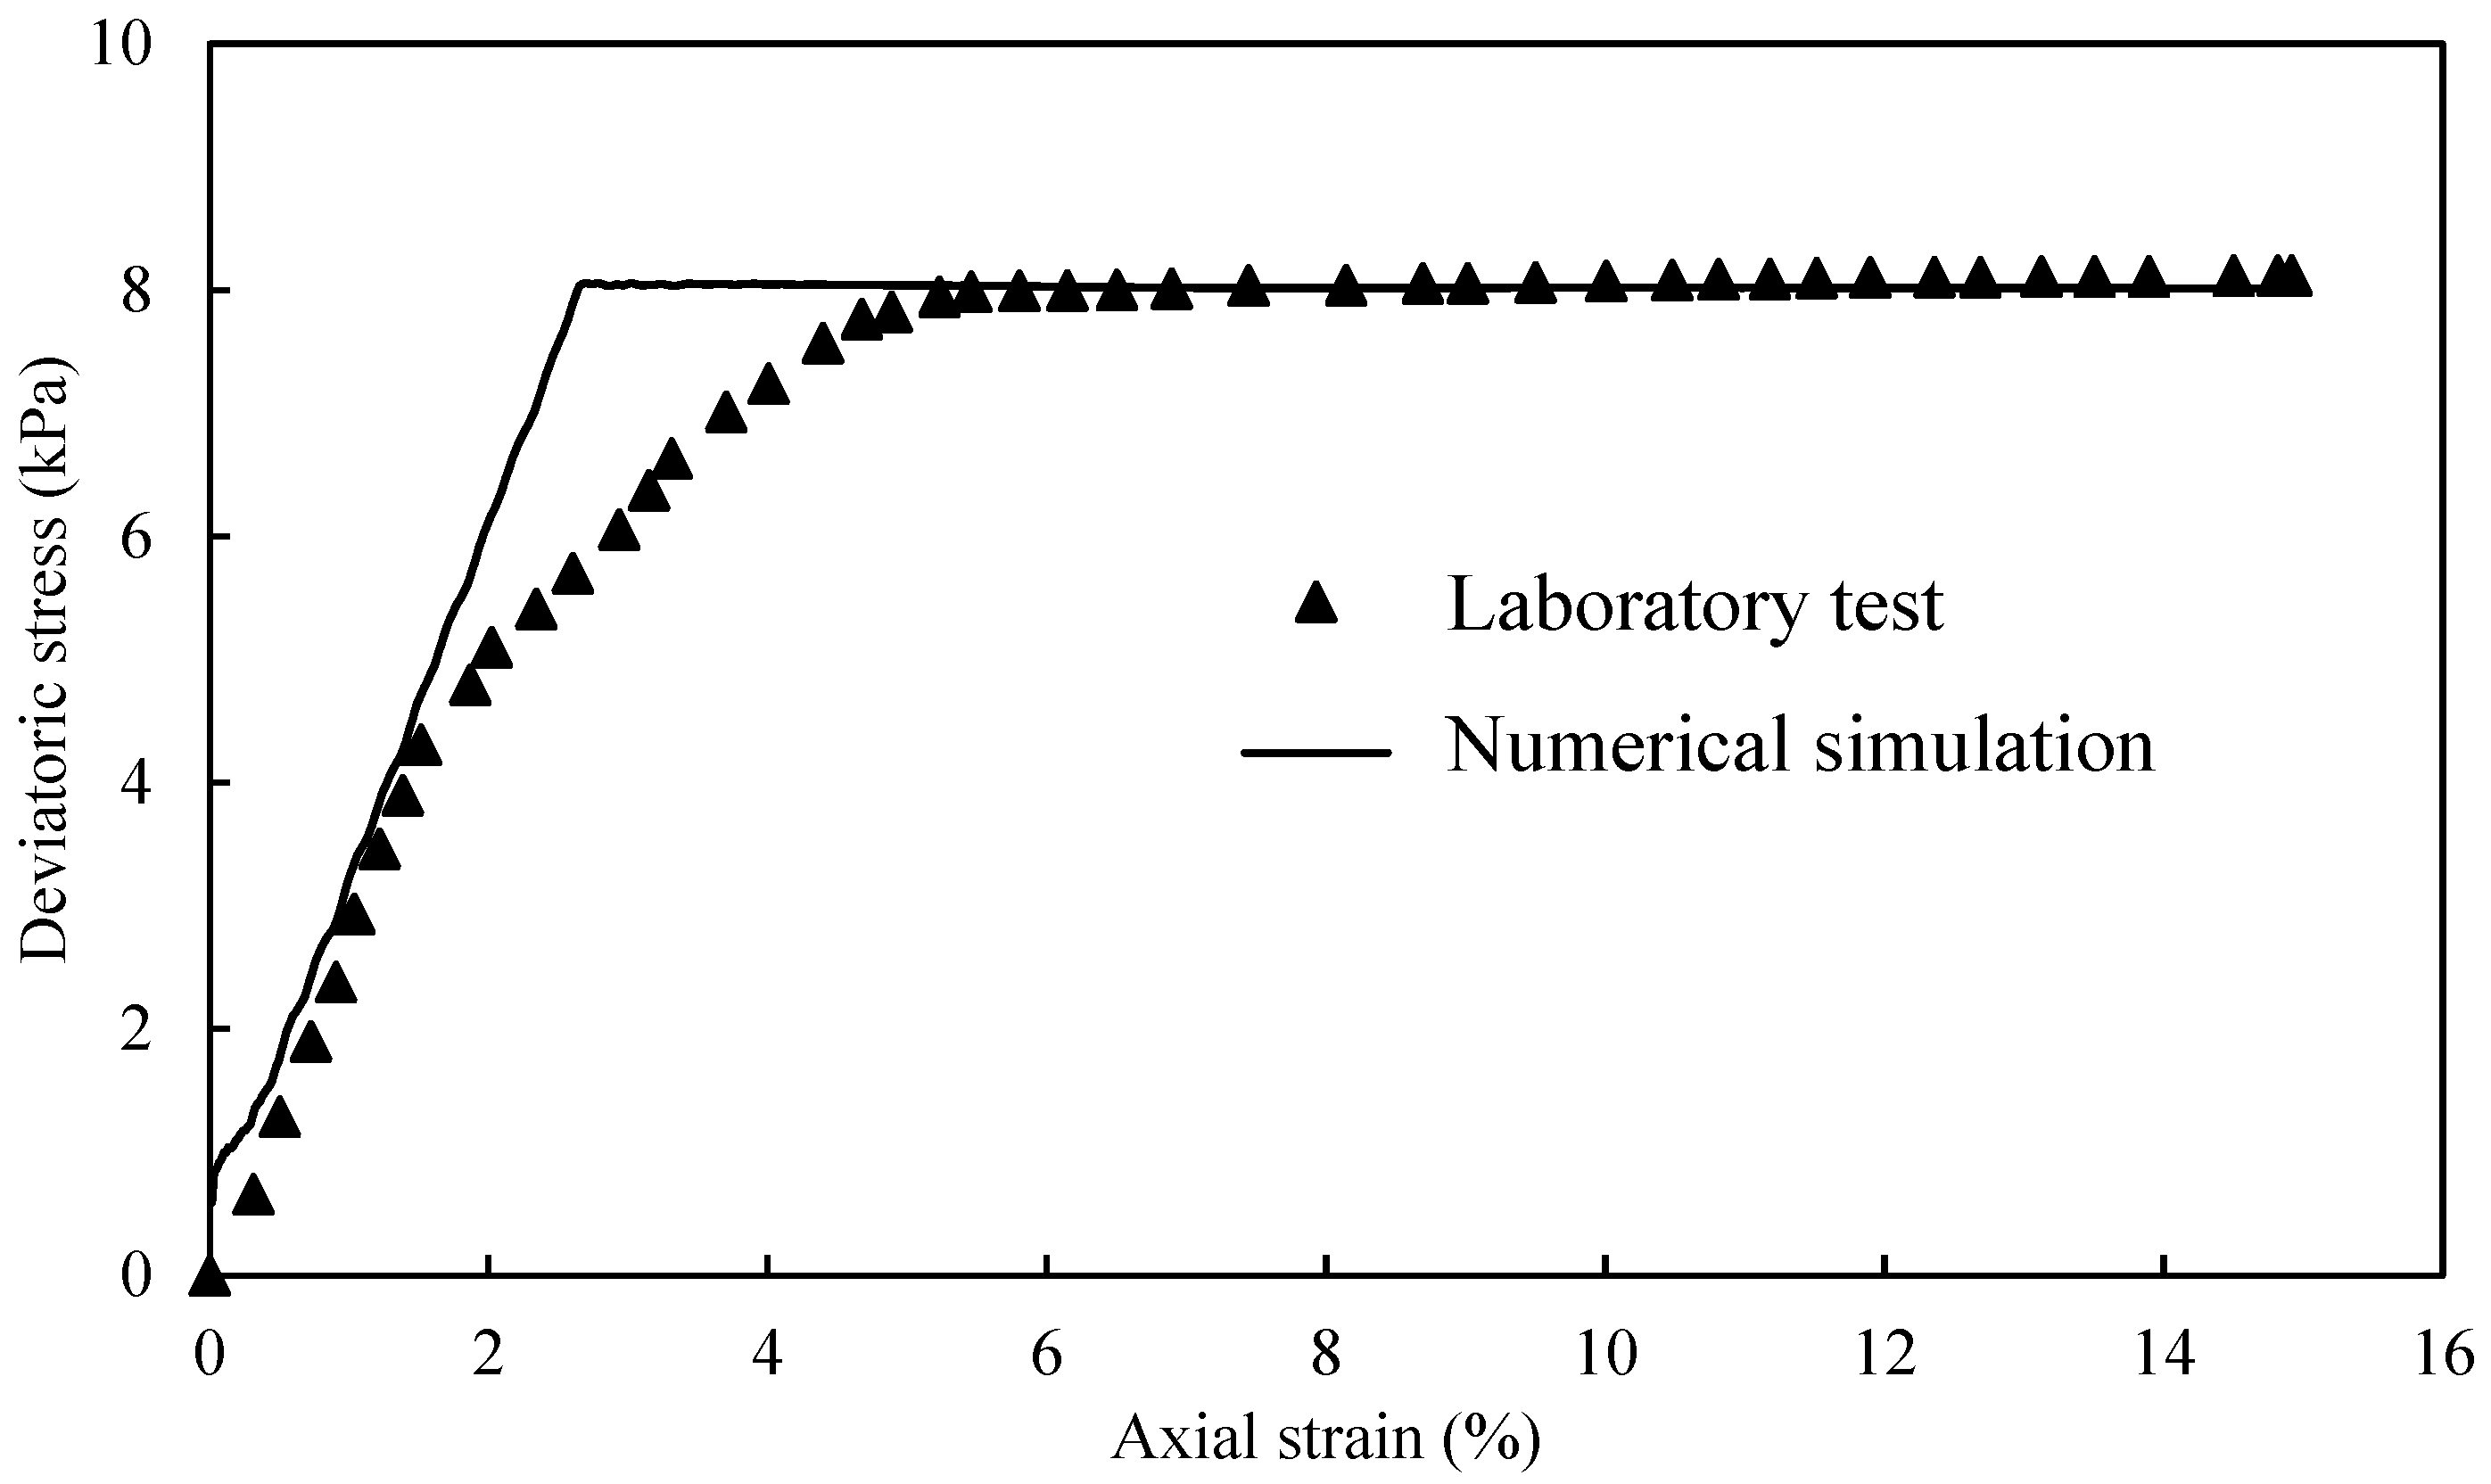
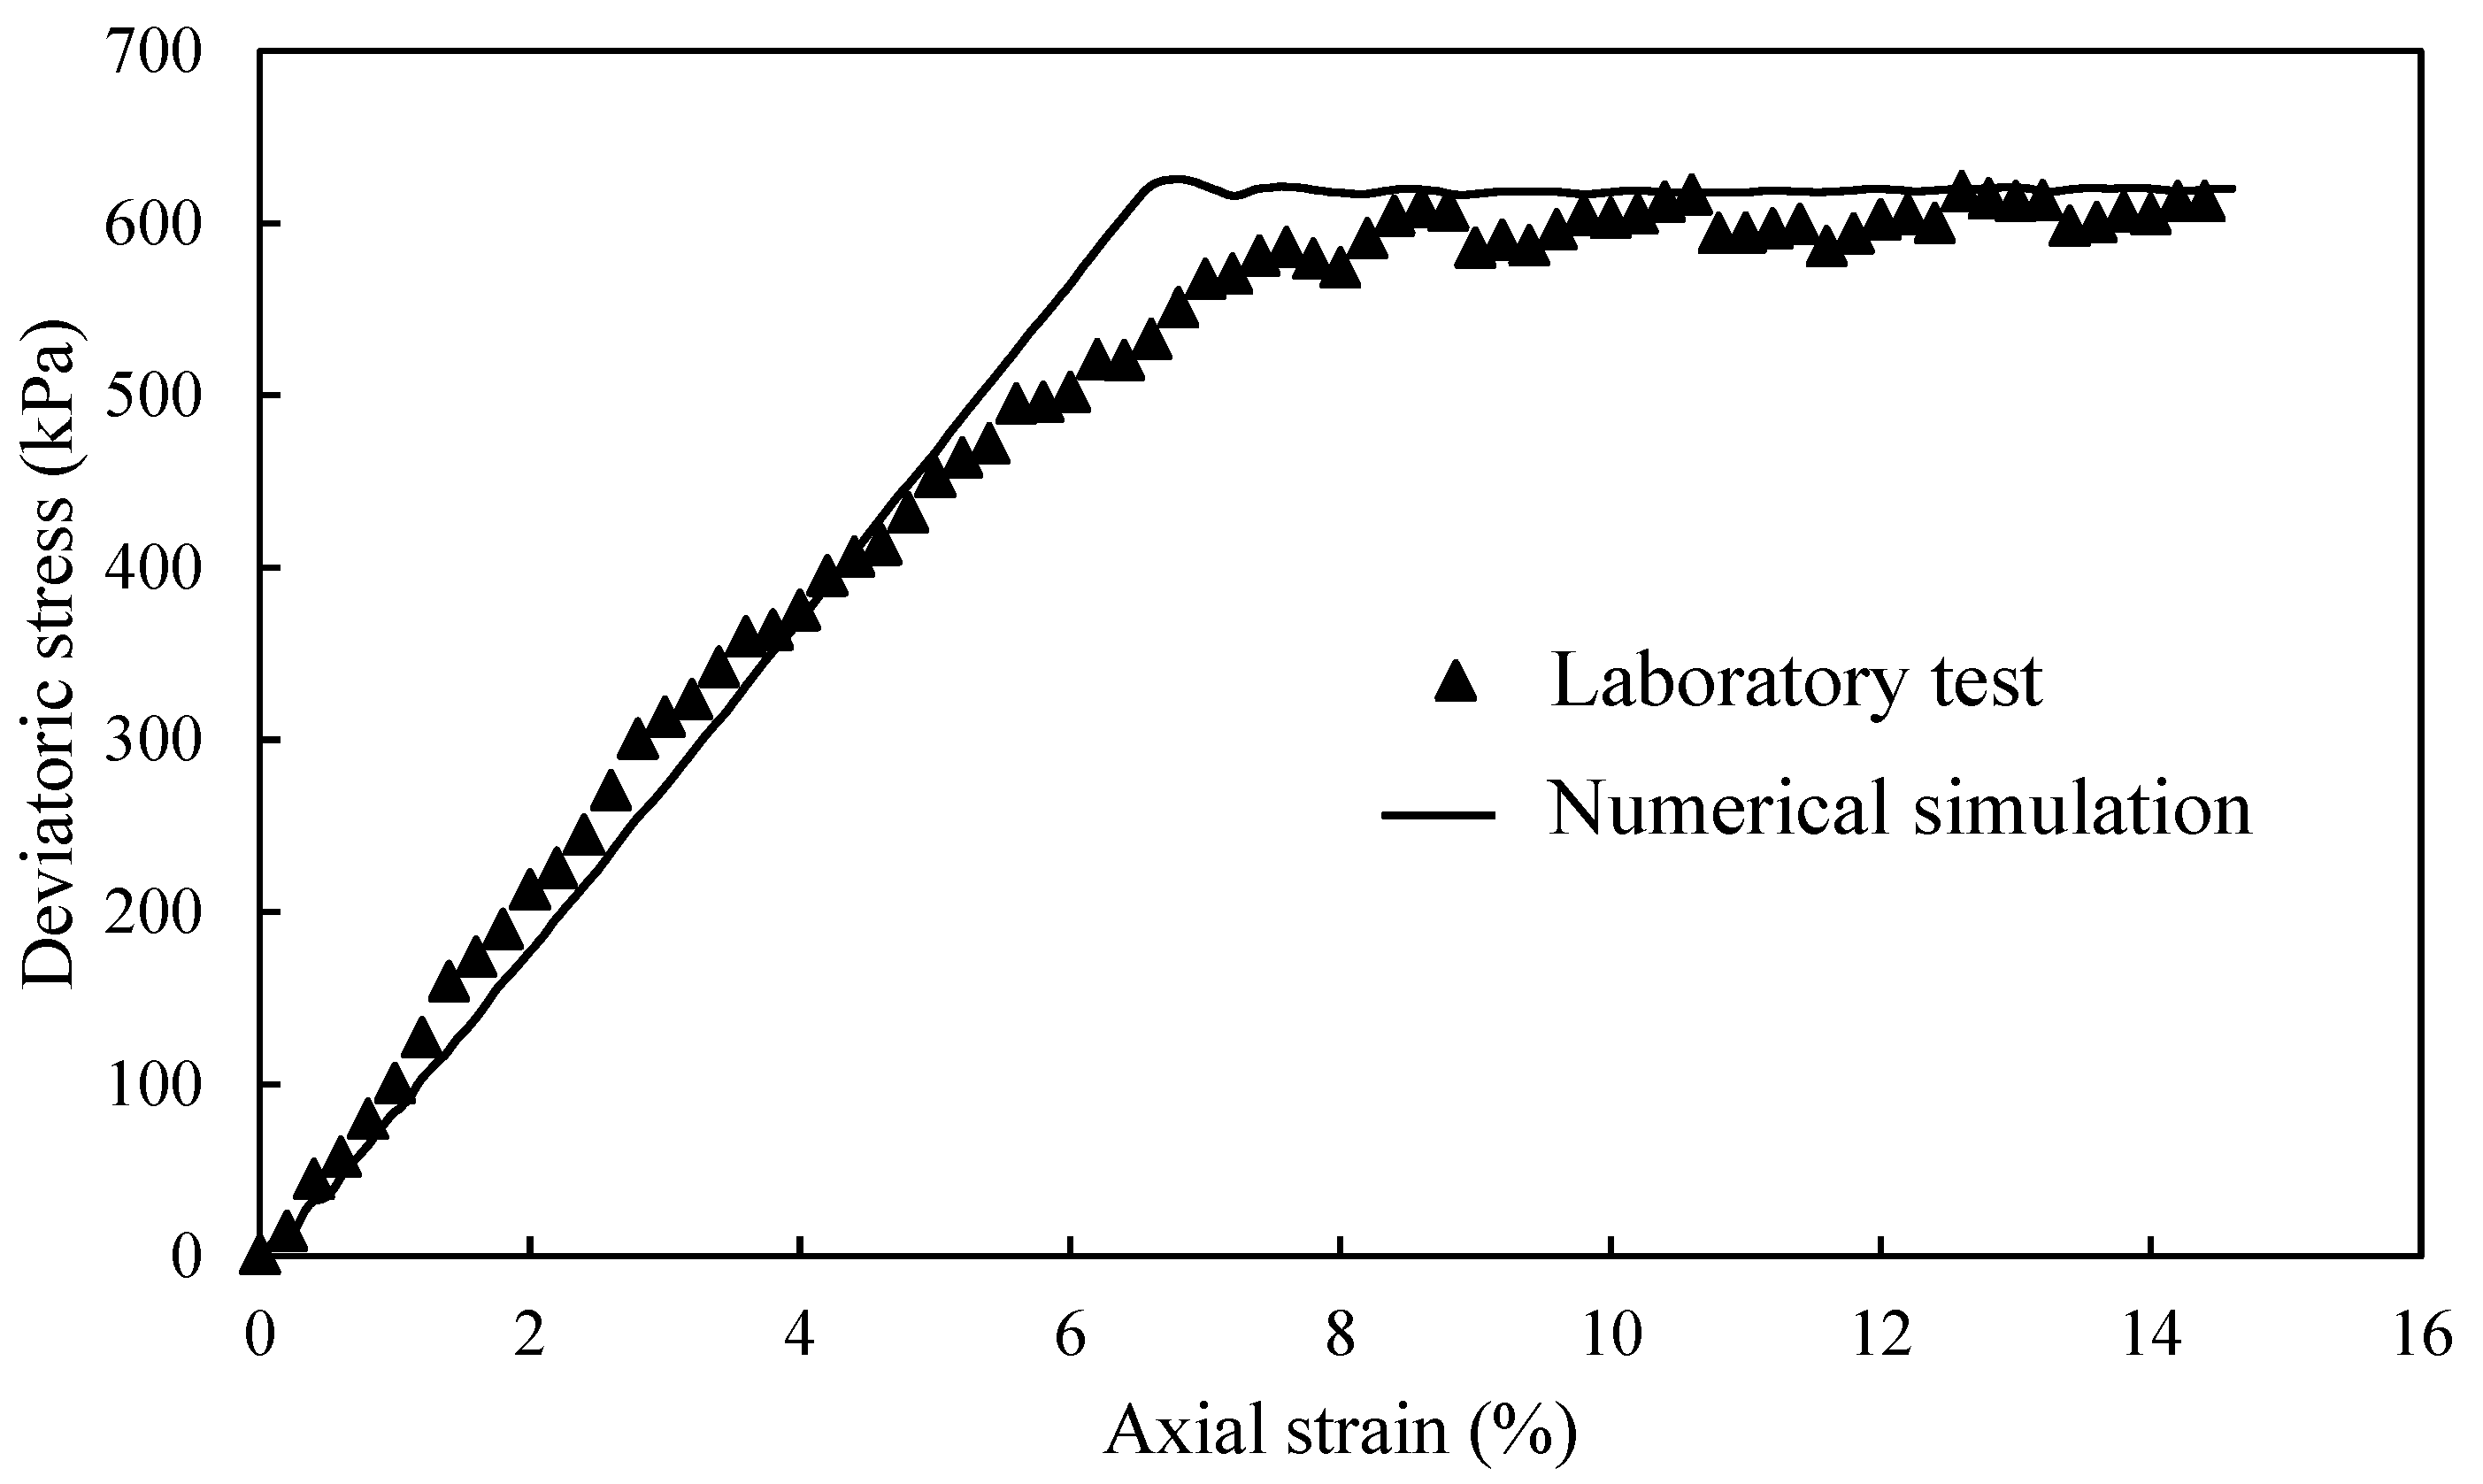
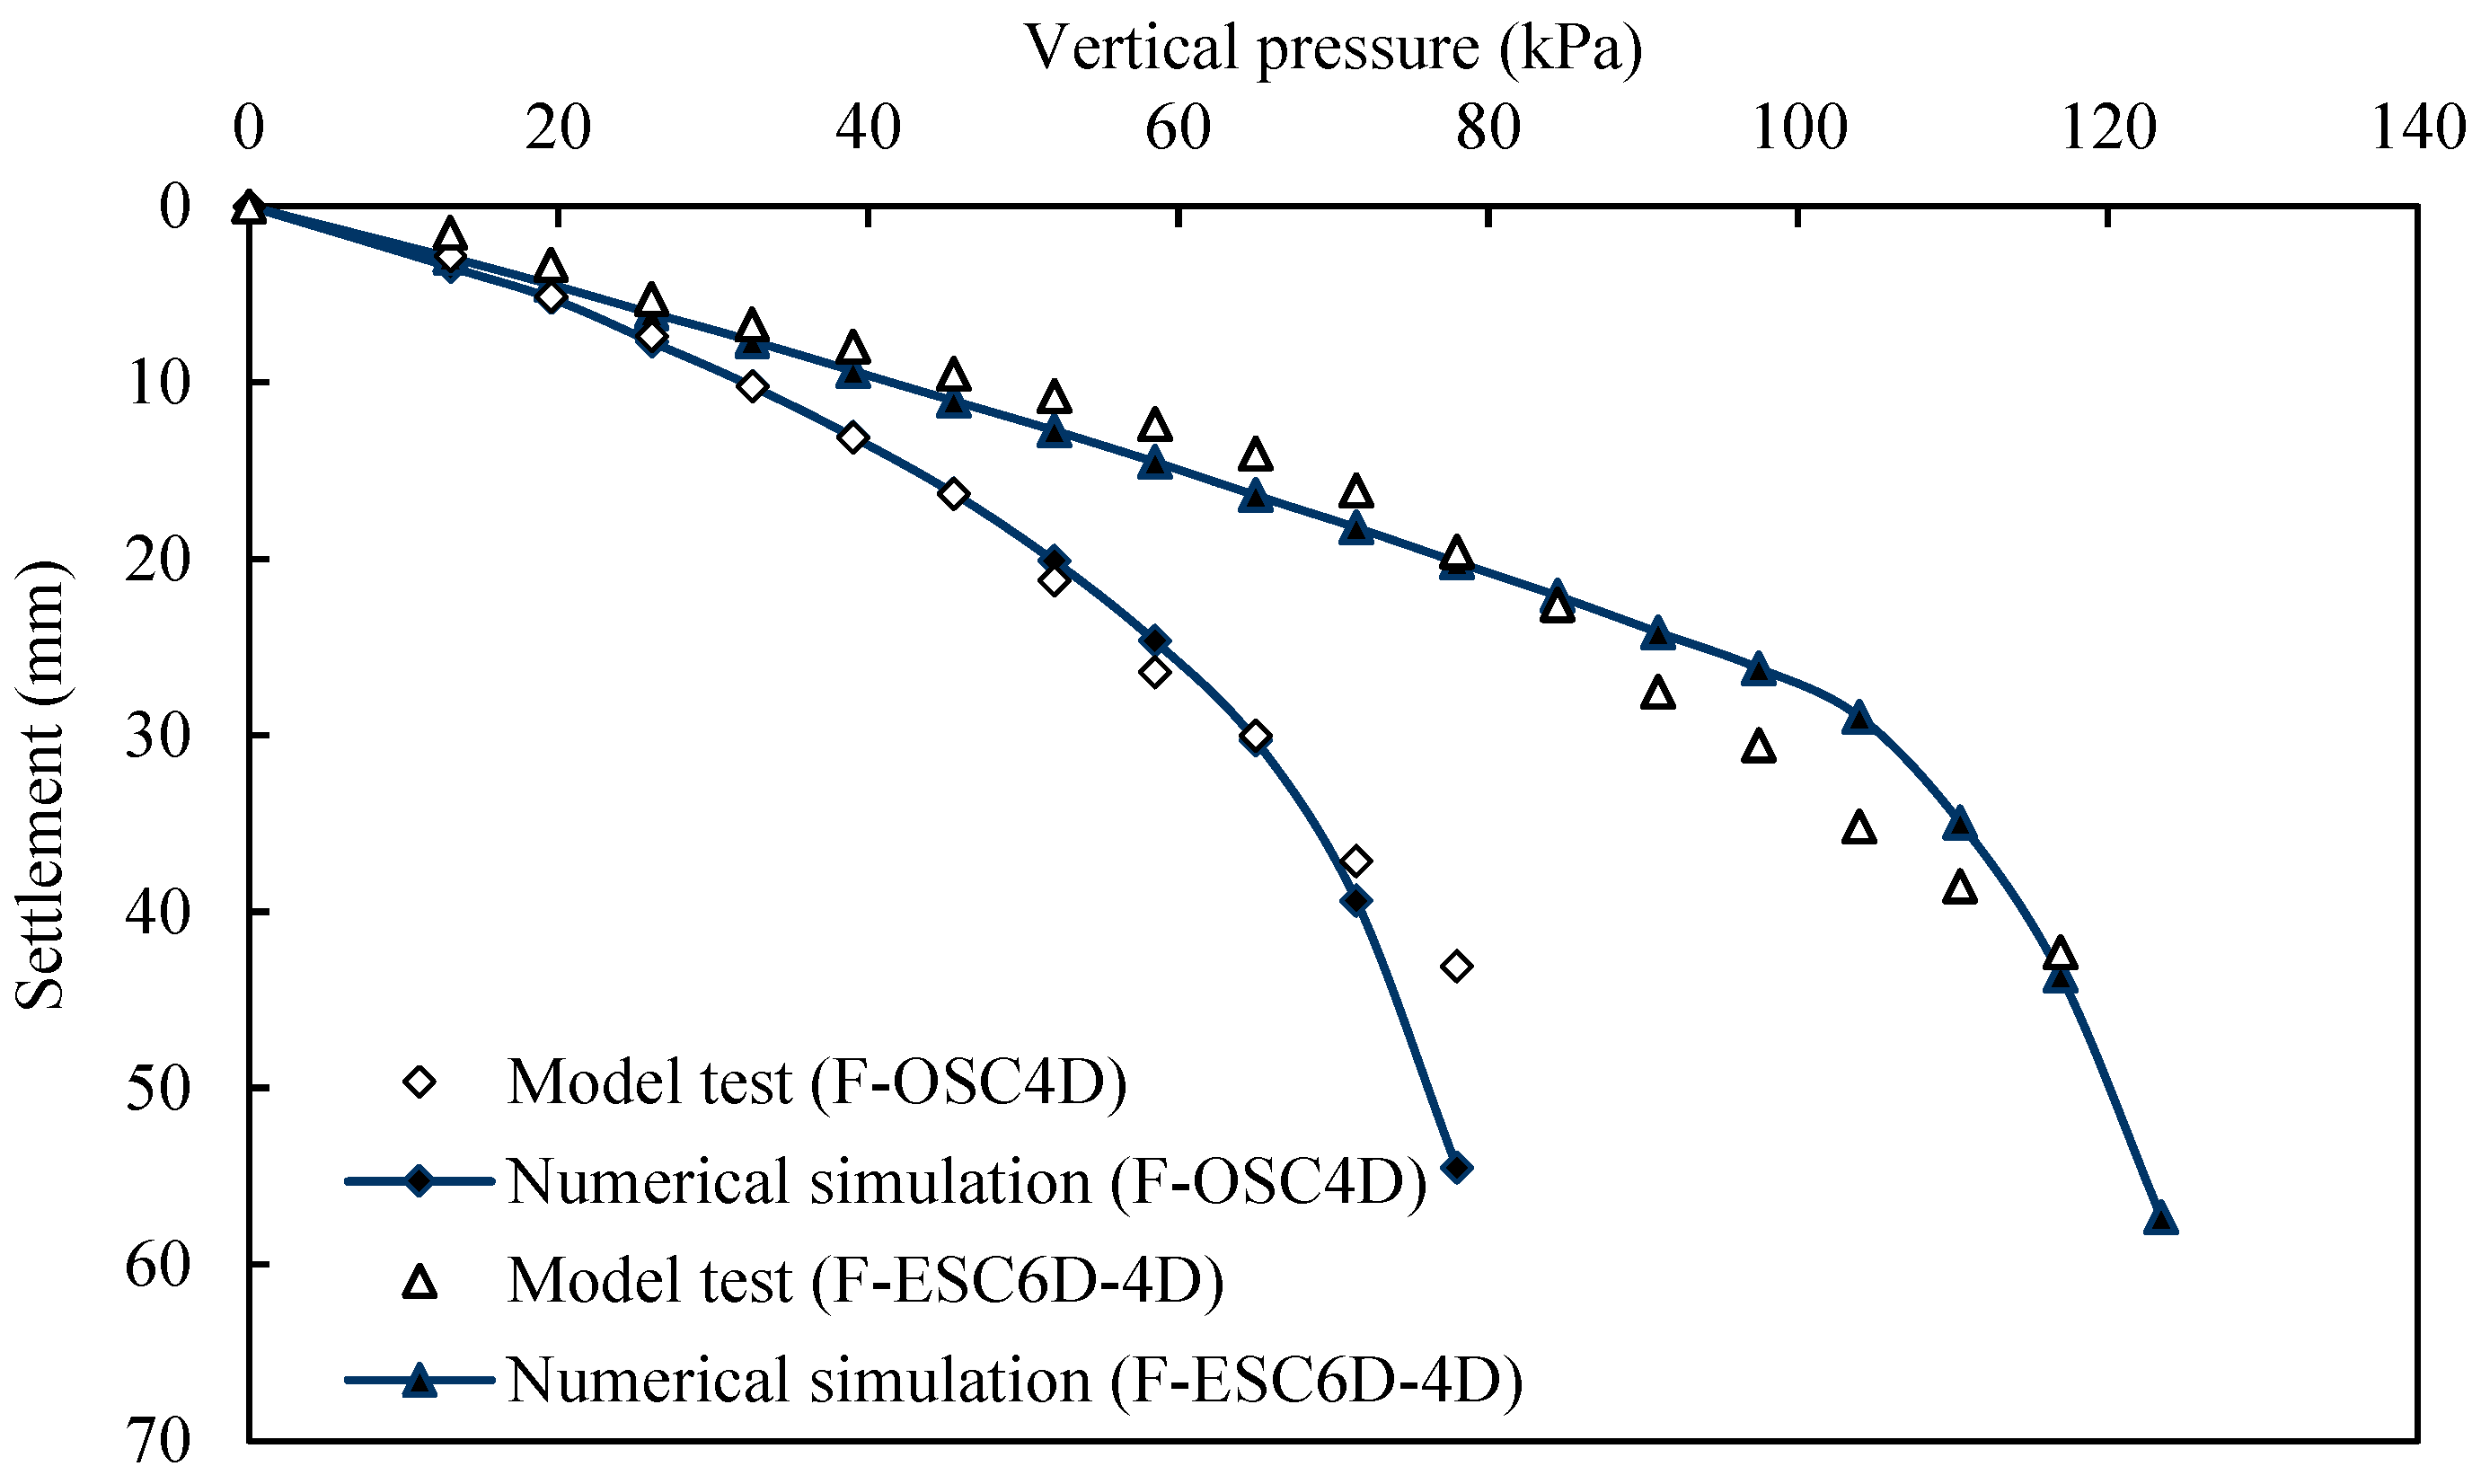
2.6. Model Validation

For simplicity, the F-OSC4D and F-ESC6D-4D were selected as examples to analyze the accuracy and reliability of the proposal numerical models. The load-settlement curves were plotted in Figure 5, which presents the settlement variation with vertical pressure in F-OSC4D and F-ESC6D-4D composite foundations. The settlement increased with the increase in vertical pressure until the model failed. It was clear that good consistency between the model tests and numerical simulations was observed in Figure 5. The results again indicated the precision of numerical models and materials properties.

3. Results and Discussion

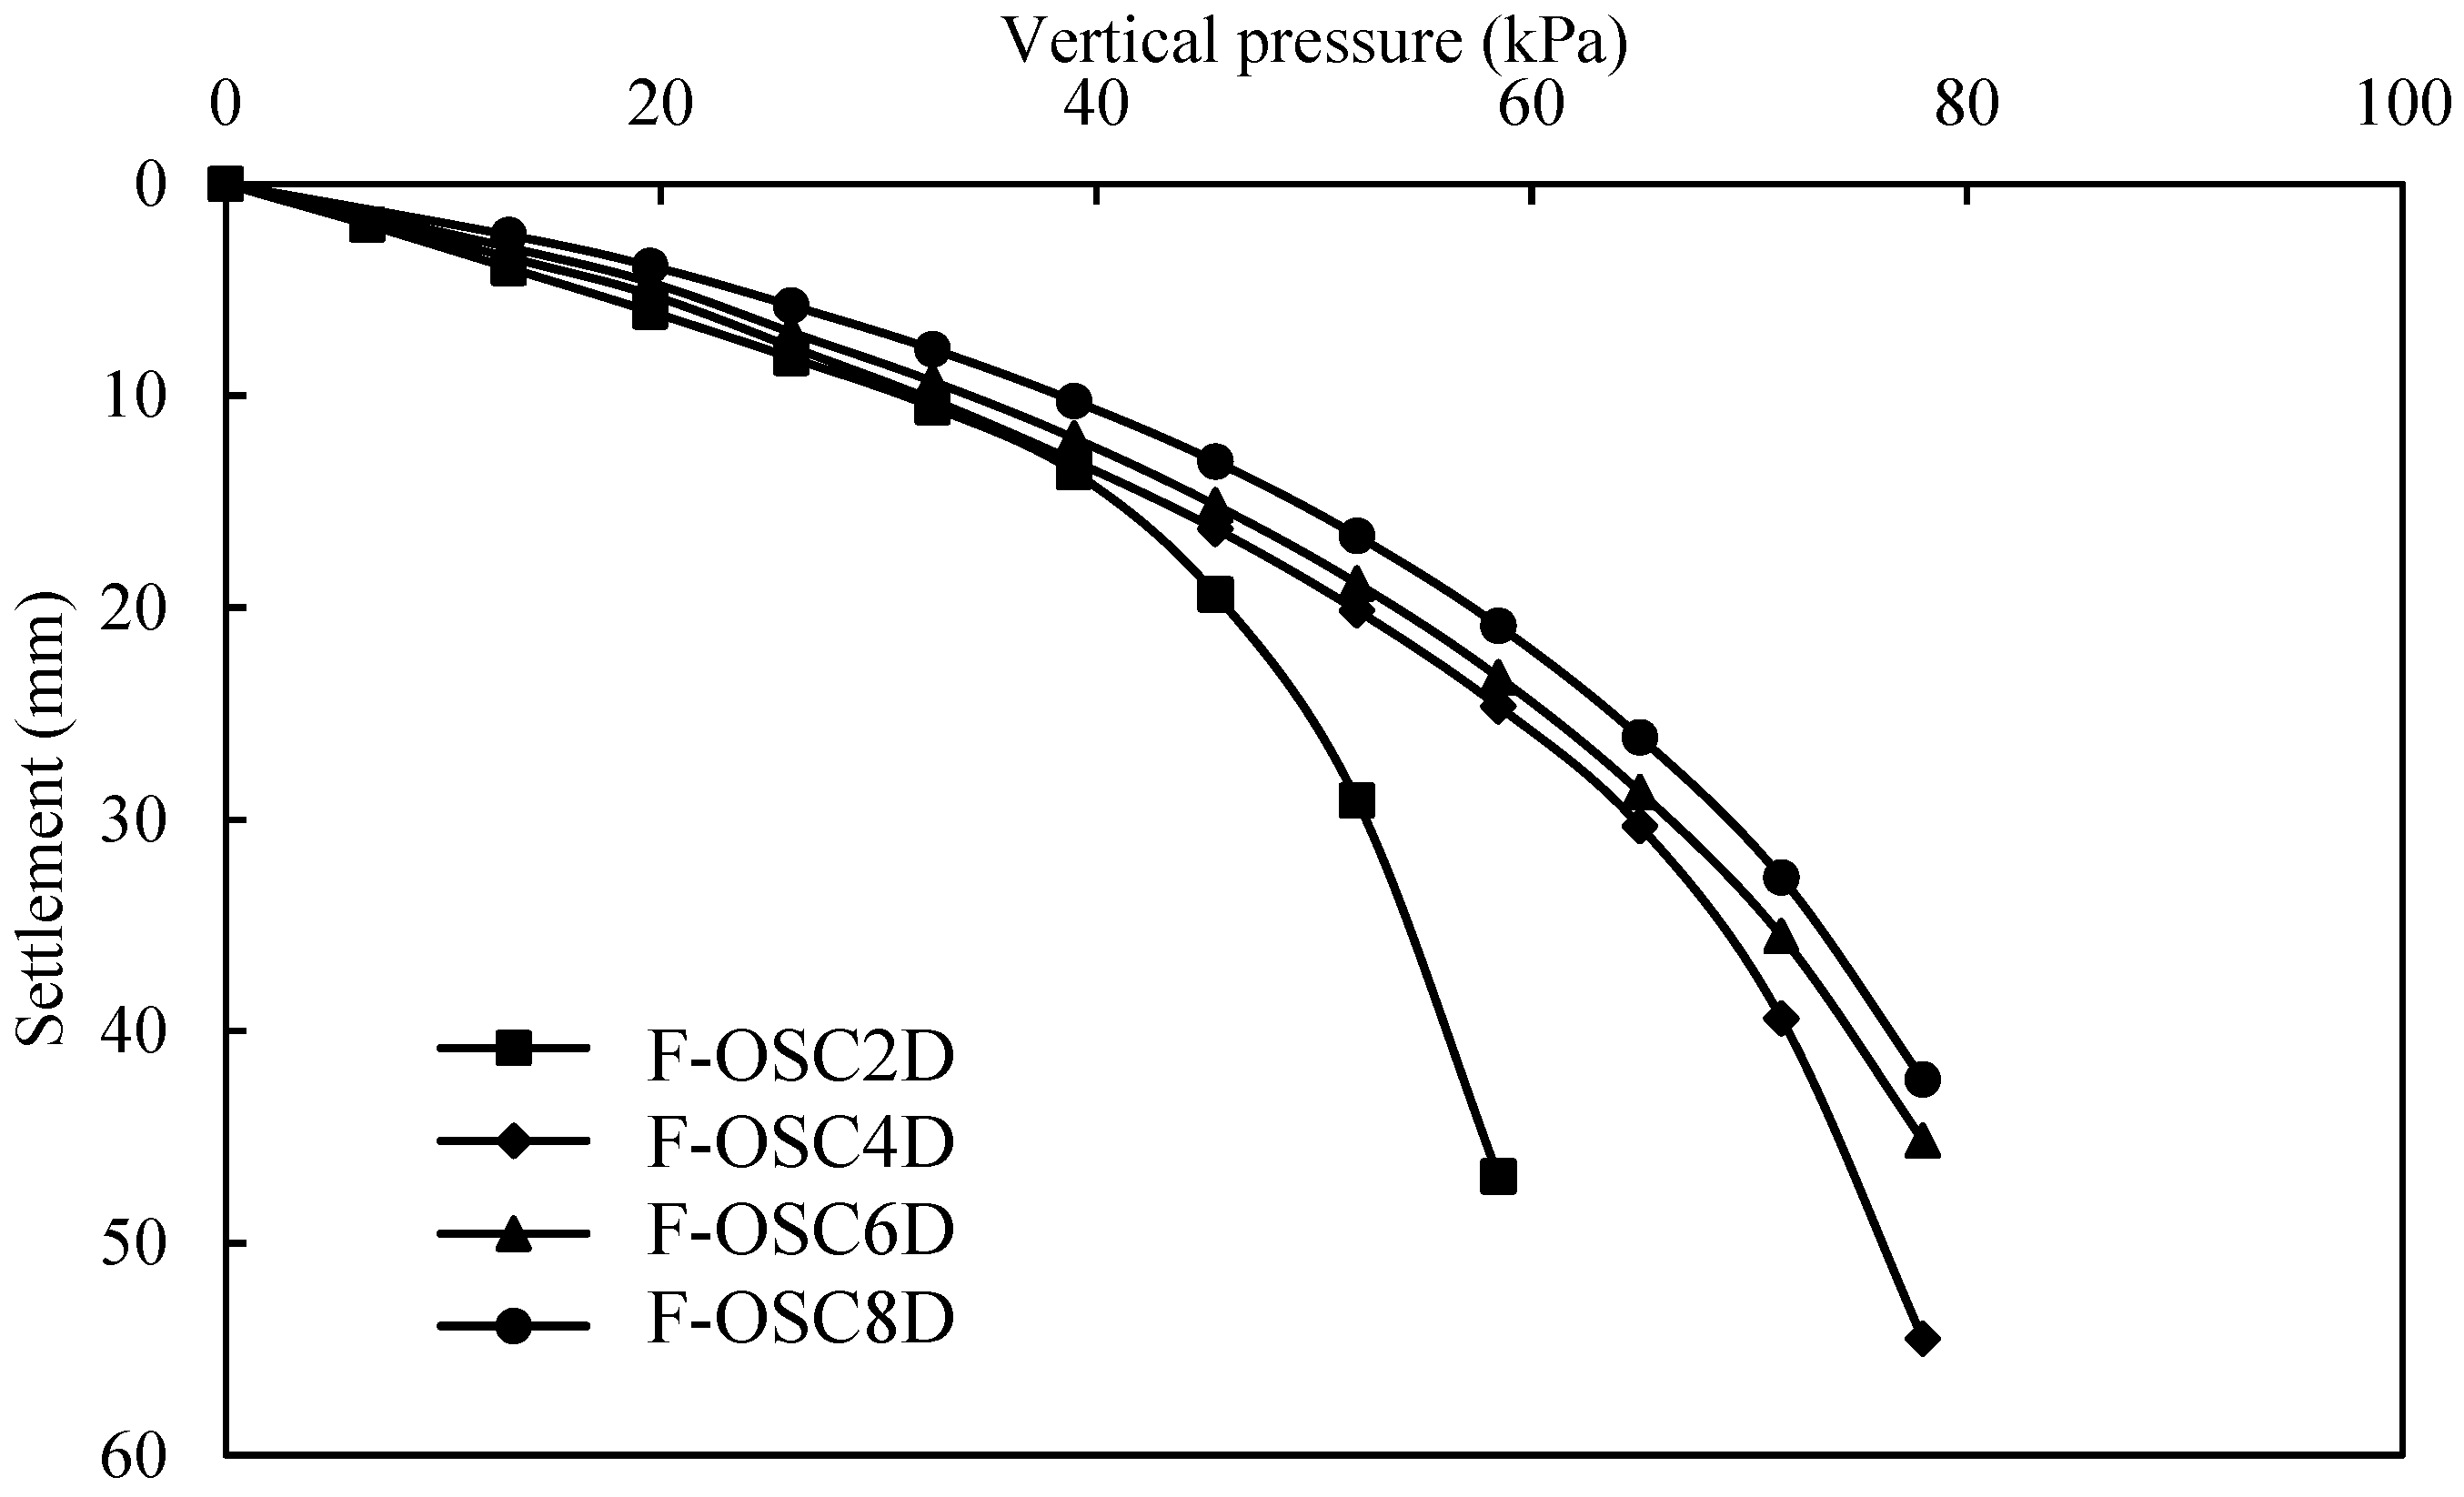
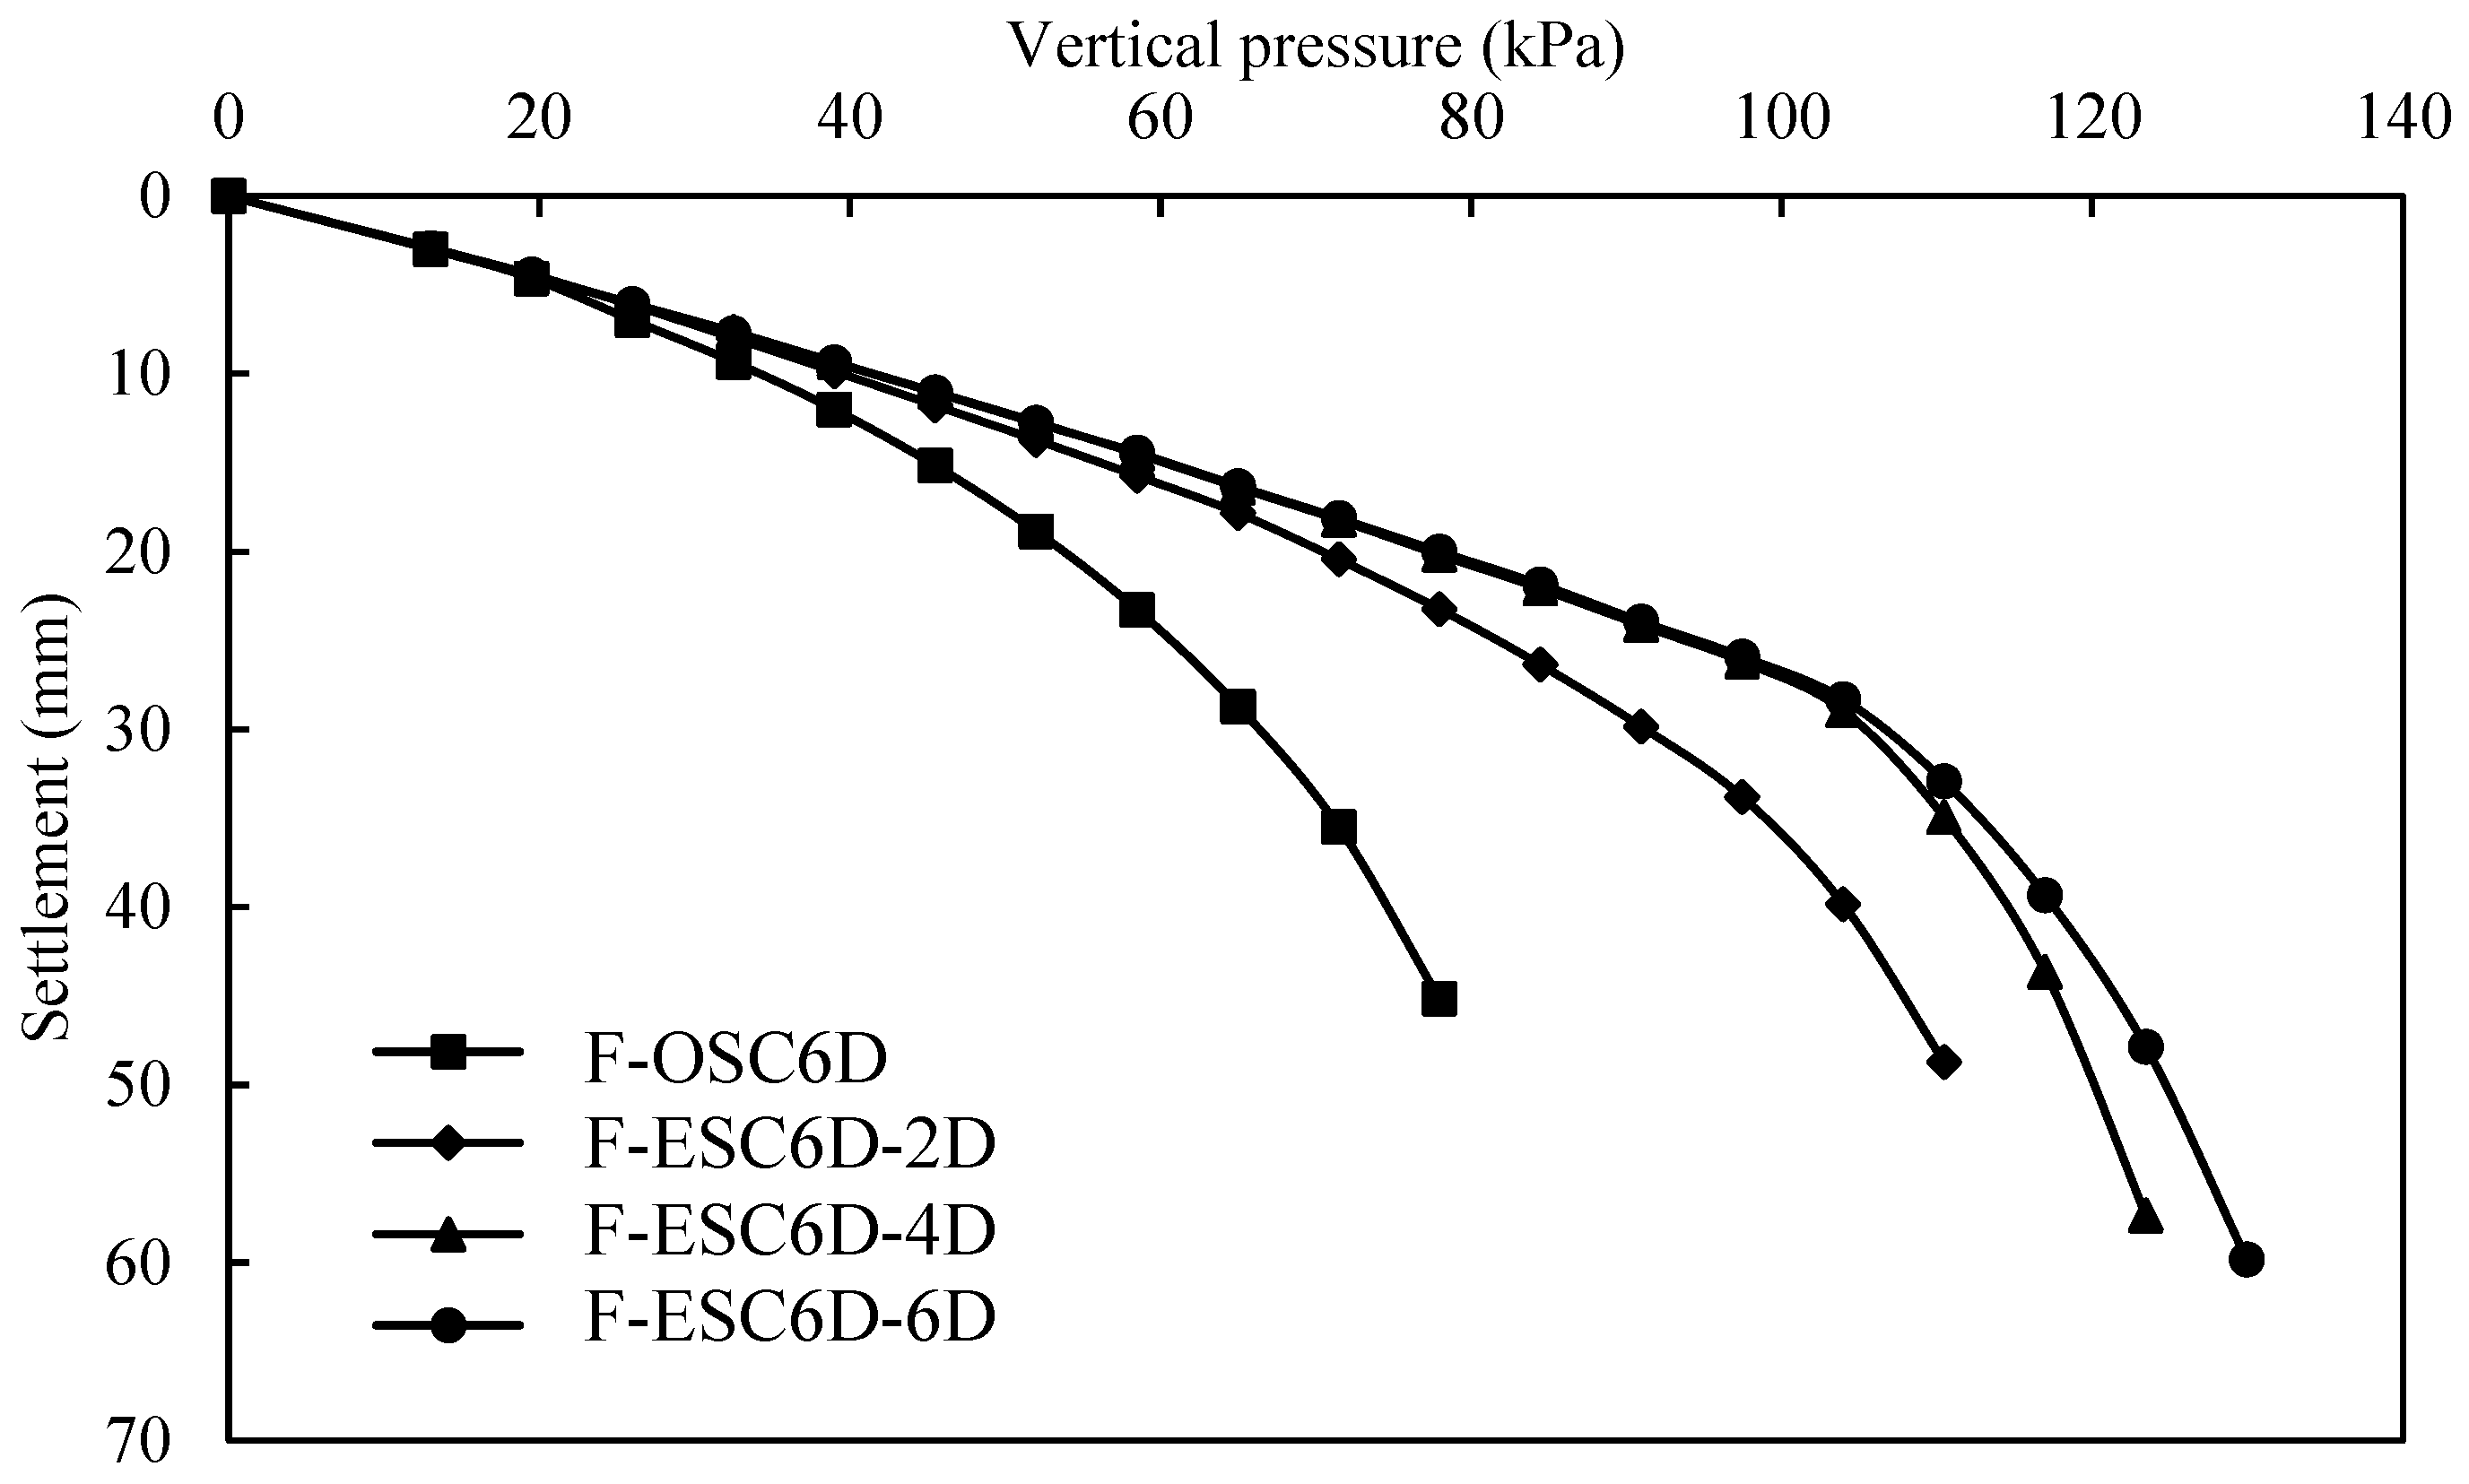
3.1. Load-Settlement Behavior

Figure 6 shows the load-settlement curves of F-OSC composite foundations with different column lengths. The ultimate bearing capacity of a column was defined as the settlement reaching 0.2 times the diameter of the loading plate, i.e., the settlement equaled 20 mm in this paper. The settlement increased with an increase in vertical pressure in all columns until the column reached failure. The ultimate bearing capacity of the clay bed was 27.1 kPa at the settlement of 20 mm [12]. The F-OSC would improve the performance of clay bed significantly, and the improvement extent was 69.74%, 91.88%, 97.42%, and 110.33% for the F-OSC2D, F-OSC4D, F-OSC6D, and F-OSC8D, respectively, compared with clay bed without reinforcement. The ultimate bearing capacity was 46, 52, 53.5, and 57 kPa, respectively, for the F-OSC2D, F-OSC4D, F-OSC6D, and F-OSC8D. The bearing capacity was improved by the columns with different lengths, i.e., the bearing capacity increased with the increase in column length. Further, there had a critical value of column length in improving F-OSC (i.e., l = 4D). The improvement degree was 2.9% and 9.6% for F-OSC6D and F-OSC8D, respectively, compared with F-OSC4D. There was a slight improvement in F-OSC when the column length exceeded 4D. Generally, the effective column length was recommended as not to exceed 10 times the column diameter [12]. Therefore, the effect of geogrid length on the behavior of F-OSC and F-ESC was analyzed based on the 6D in column length.
Figure 7 shows the load-settlement curves of F-ESC composite foundations with different geogrid lengths. The settlement in different foundations also increased with the progressive loading until the model failed. The ultimate bearing capacity was 70, 77.5, and 77.8 kPa, respectively, for the F-ESC6D-2D, F-ESC6D-4D, and F-ESC6D-6D. The geogrid encasement could significantly improve F-OSC by its lateral constriction, increasing the bearing capacity, integration, and stiffness. The improvement degree of bearing capacity for the F-ESC6D-2D, F-ESC6D-4D, and F-ESC6D-6D was 30.84%, 44.86%, and 45.42%, respectively, compared with F-OSC6D. The bearing capacity of F-OSC was improved by the geogrid encasement with different lengths, i.e., the bearing capacity increased with the increase in geogrid length. Moreover, there also was a critical value of geogrid length in improving the bearing capacity of floating stone column (i.e., l = 4D). The improvement degree was 10.7% and 11.1% for F-ESC6D-4D and F-ESC6D-6D, respectively, compared with F-ESC6D-2D. The encasement length once exceeded this critical value meaning that the bearing capacity of F-ESC6D had a slight variation. Therefore, partial encasement (e.g., 4D) was recommended to improve the performance of F-OSC with an appropriate column length (e.g., 6D). Moreover, the effective length of the encasement was 3-4 times the column diameter suggested by Gu, et al. [35] based on model tests. The results from the numerical model in this paper were consistent with Gu, et al. [35].

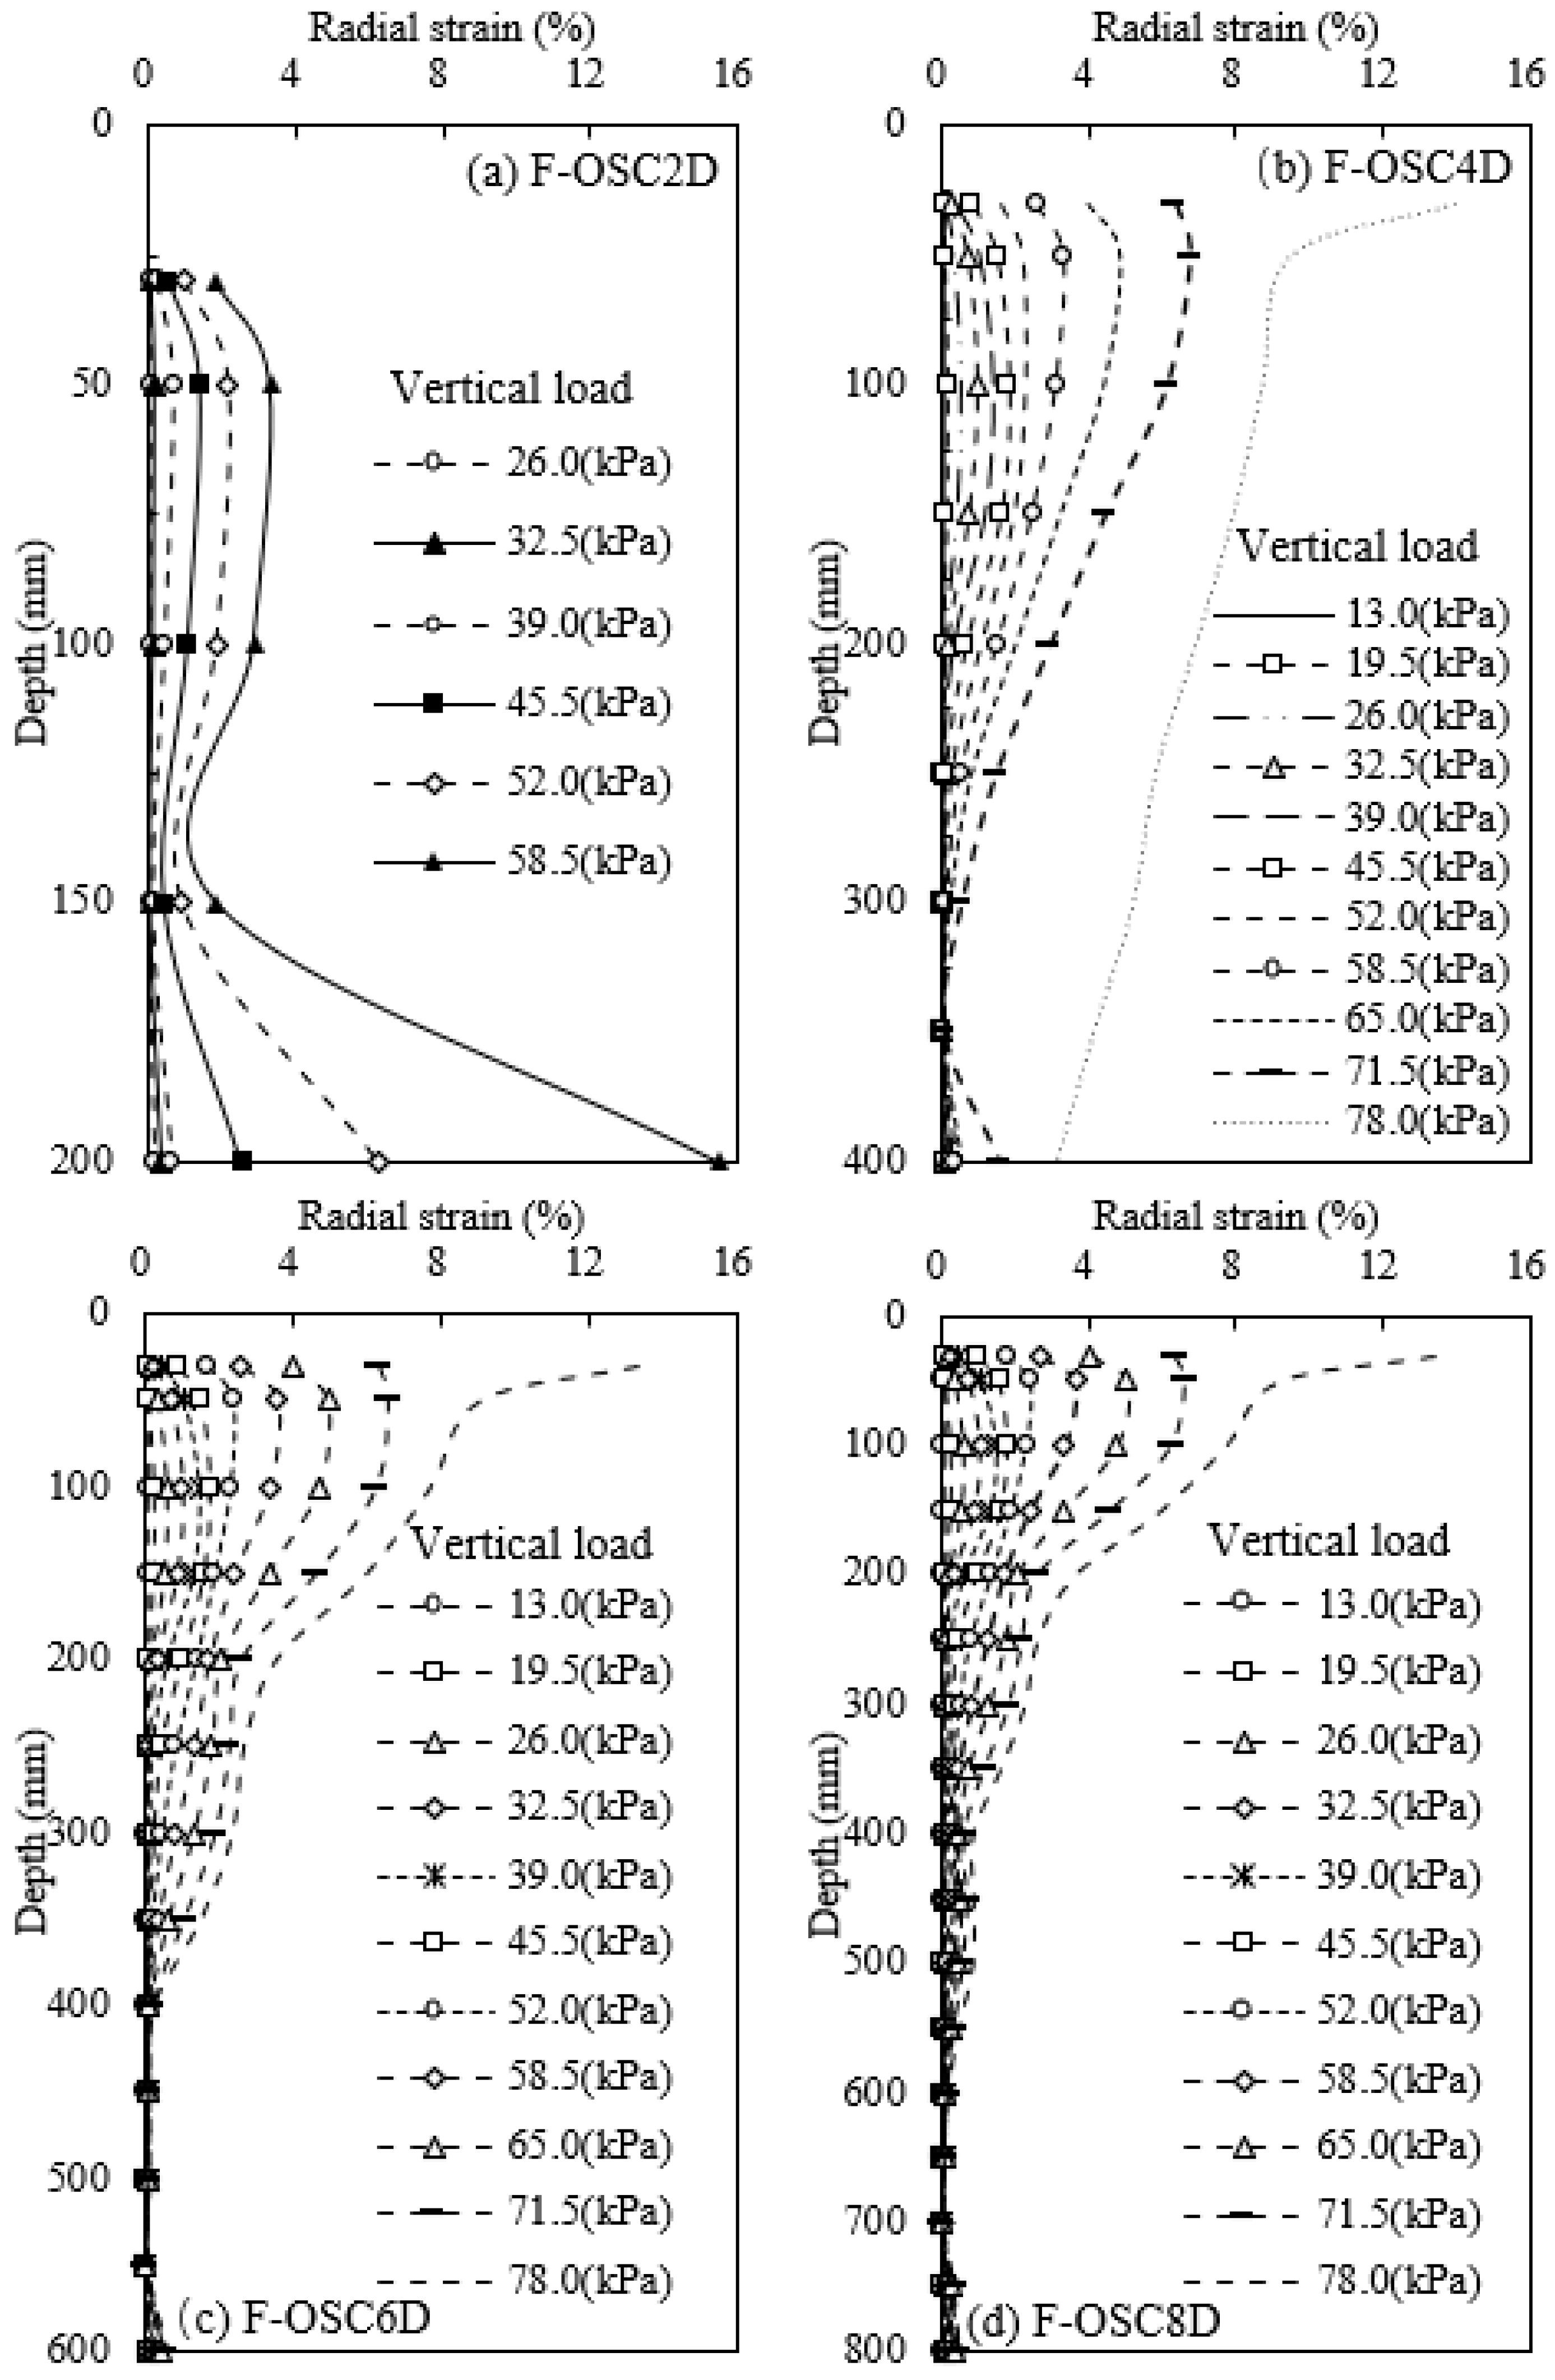
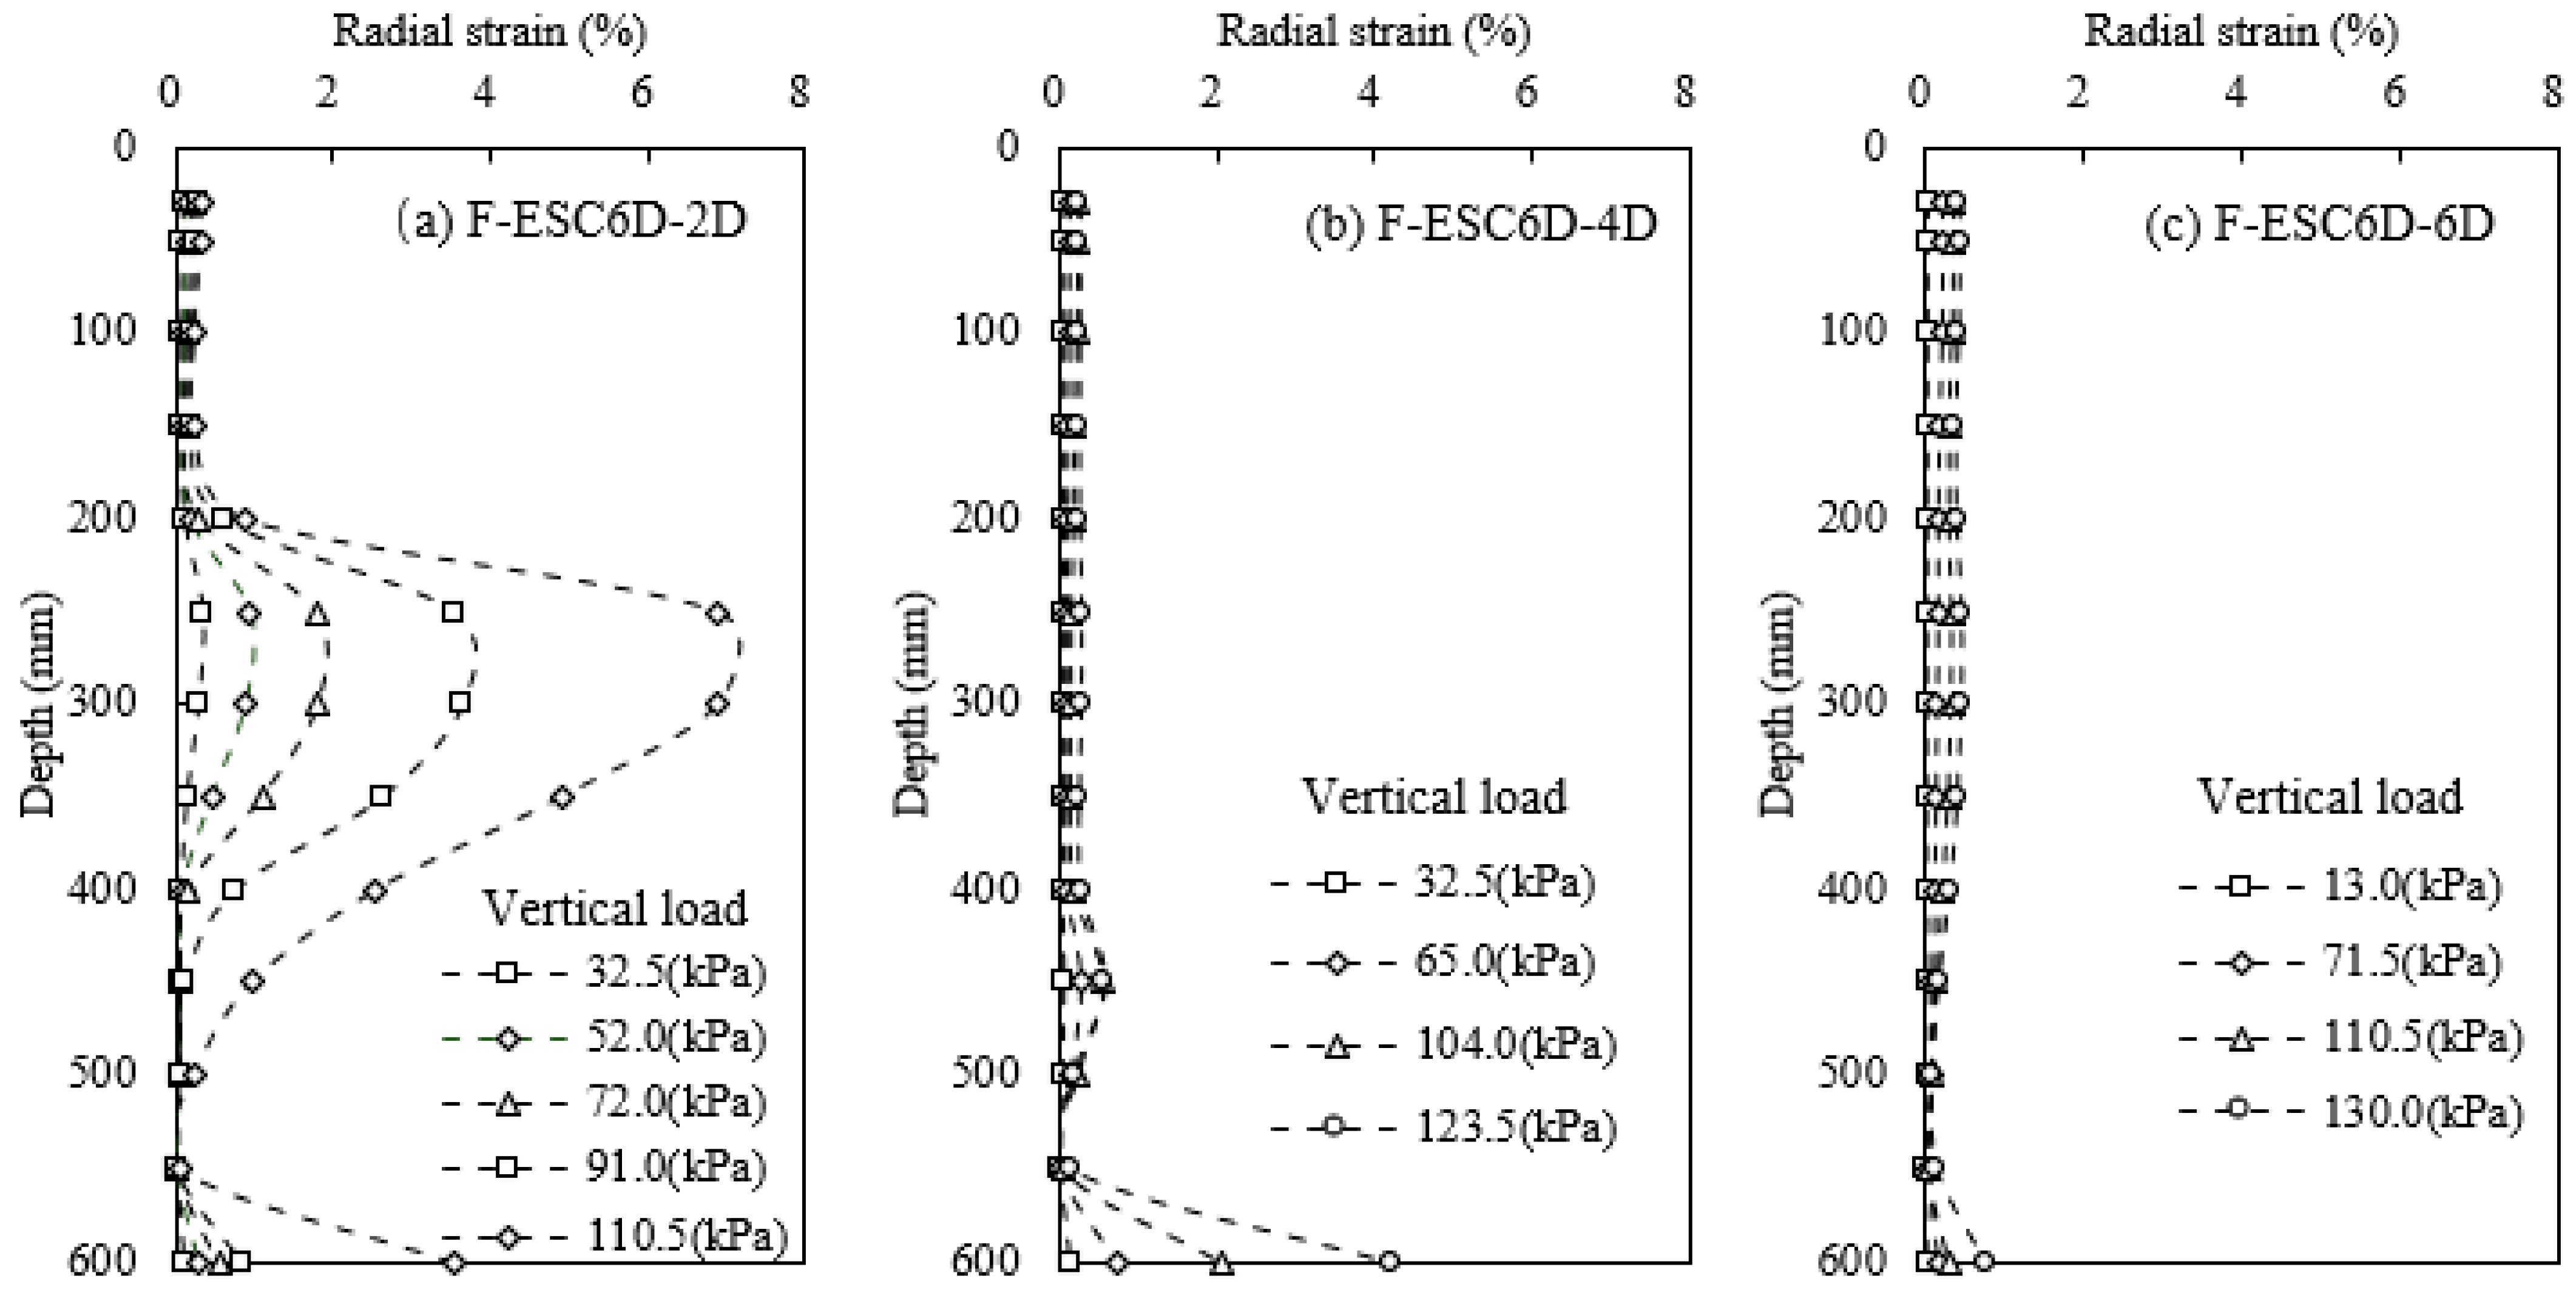
3.2. Bulging Deformation
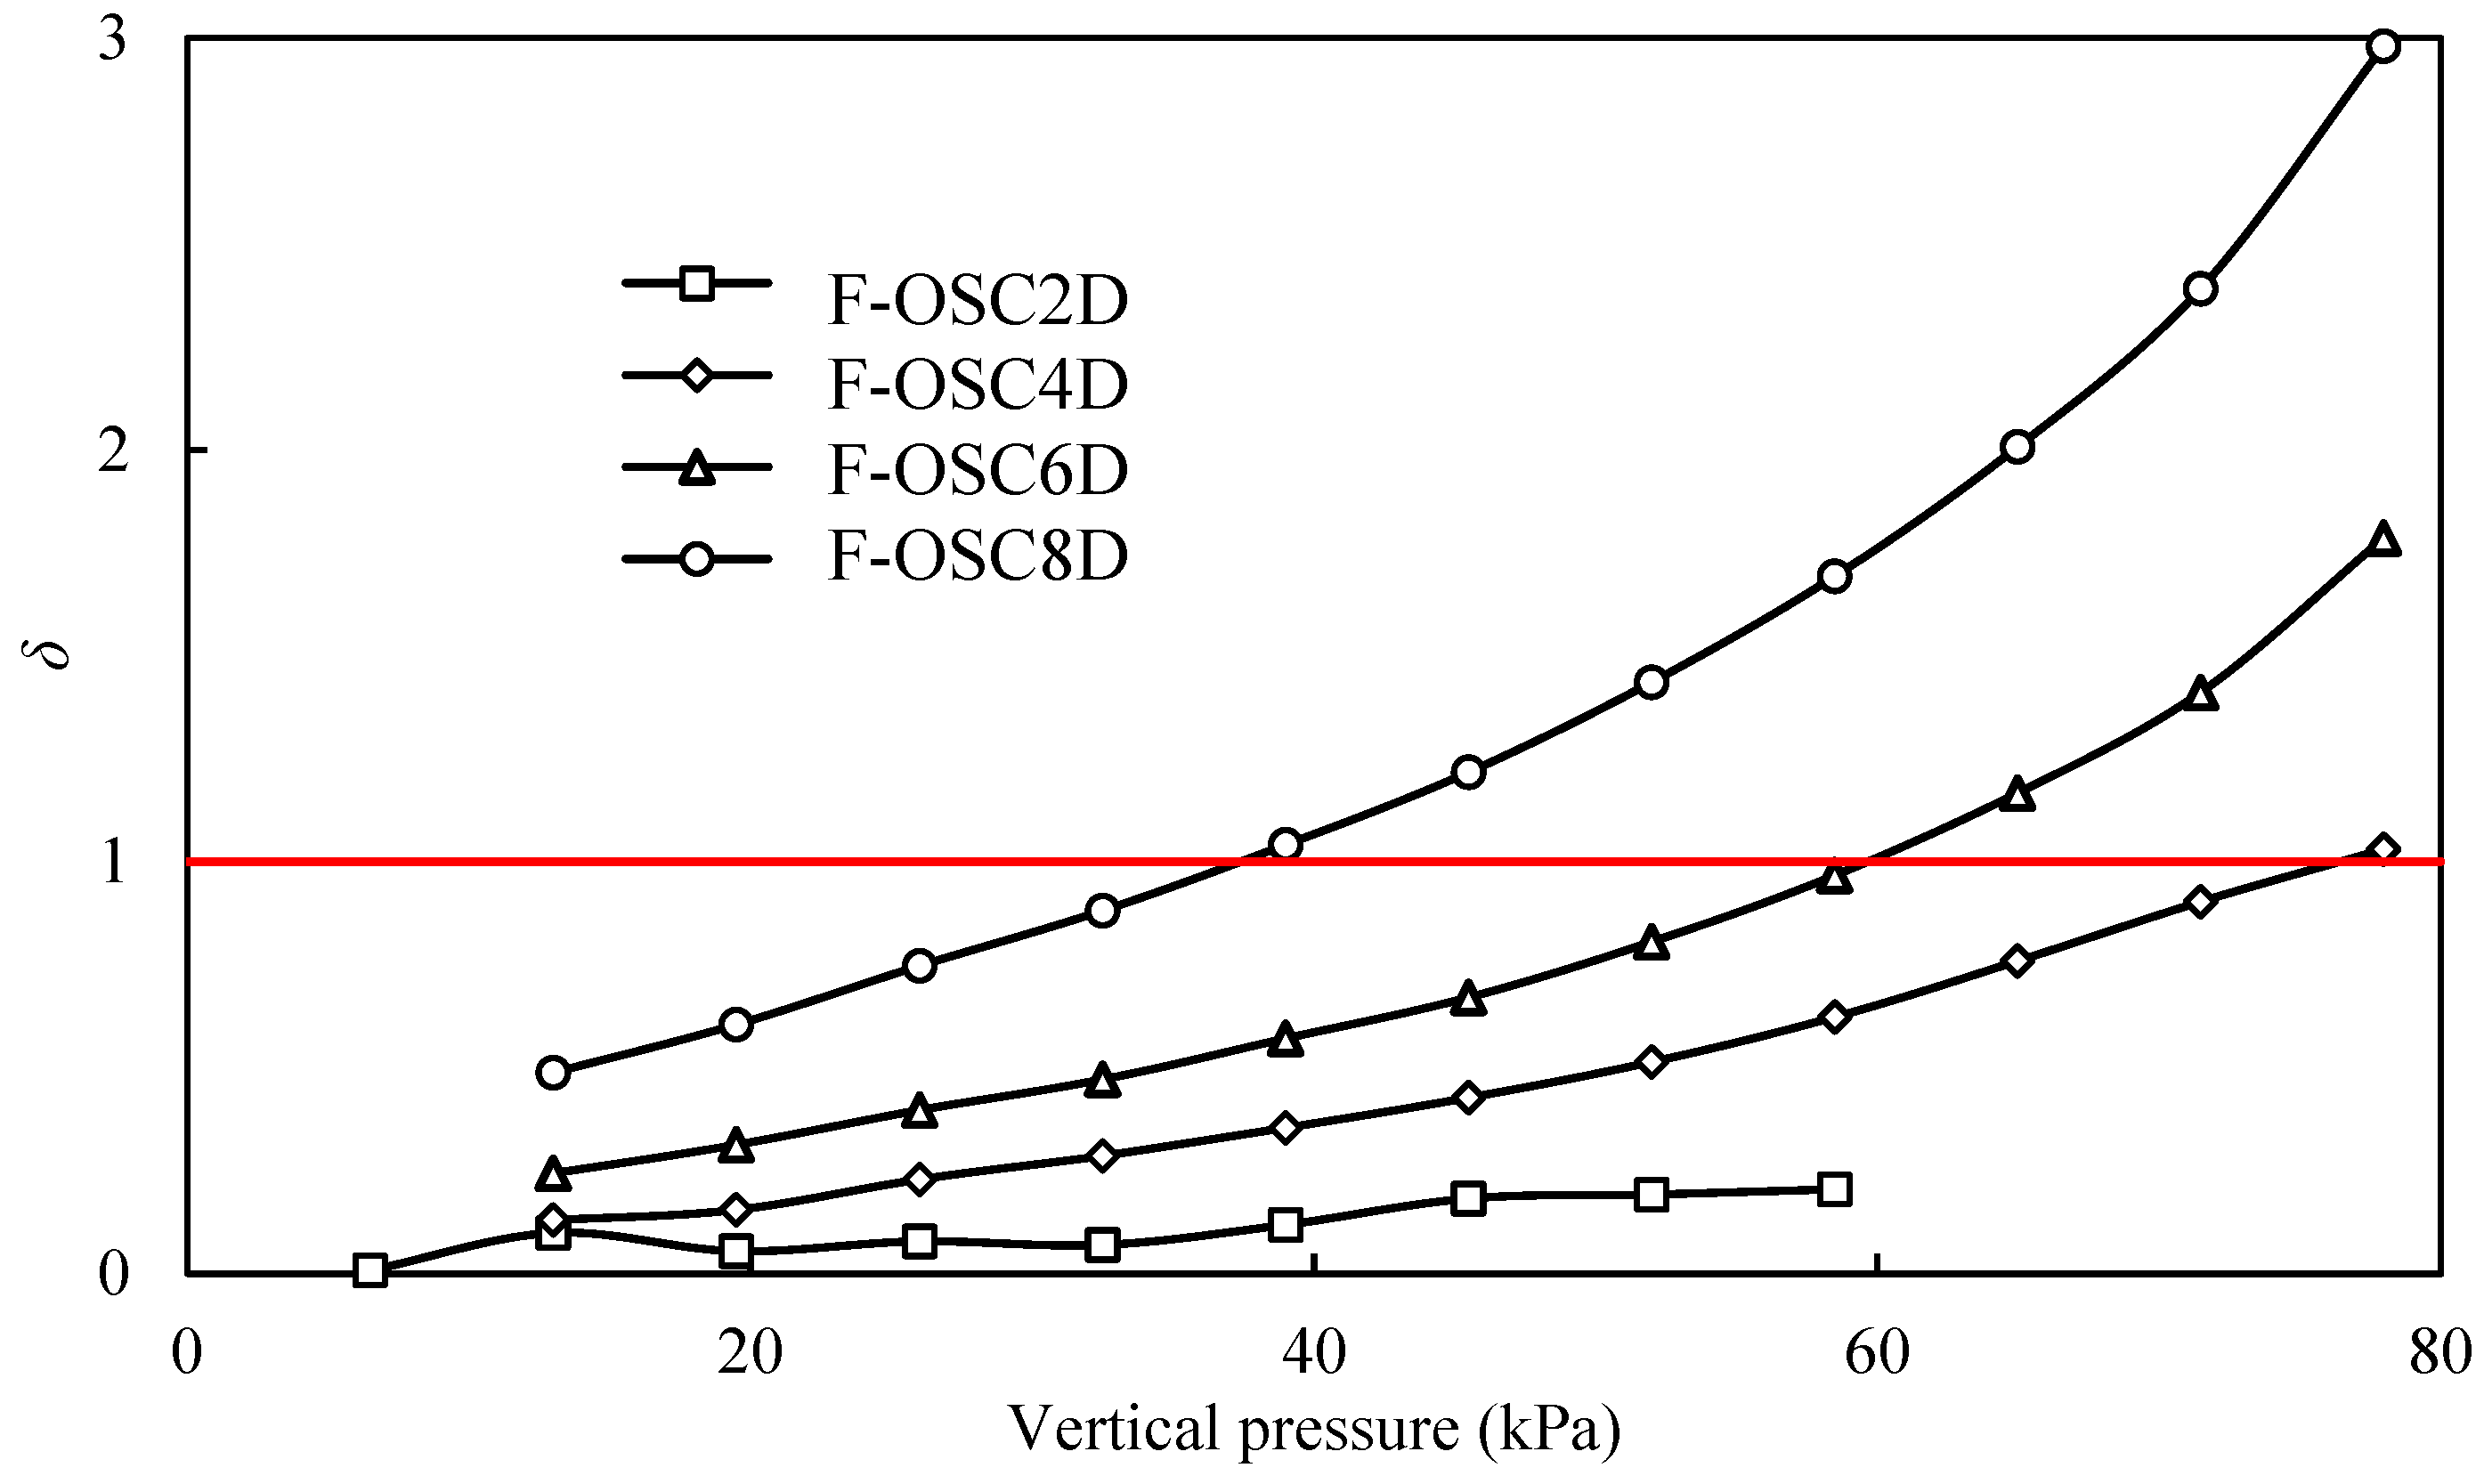
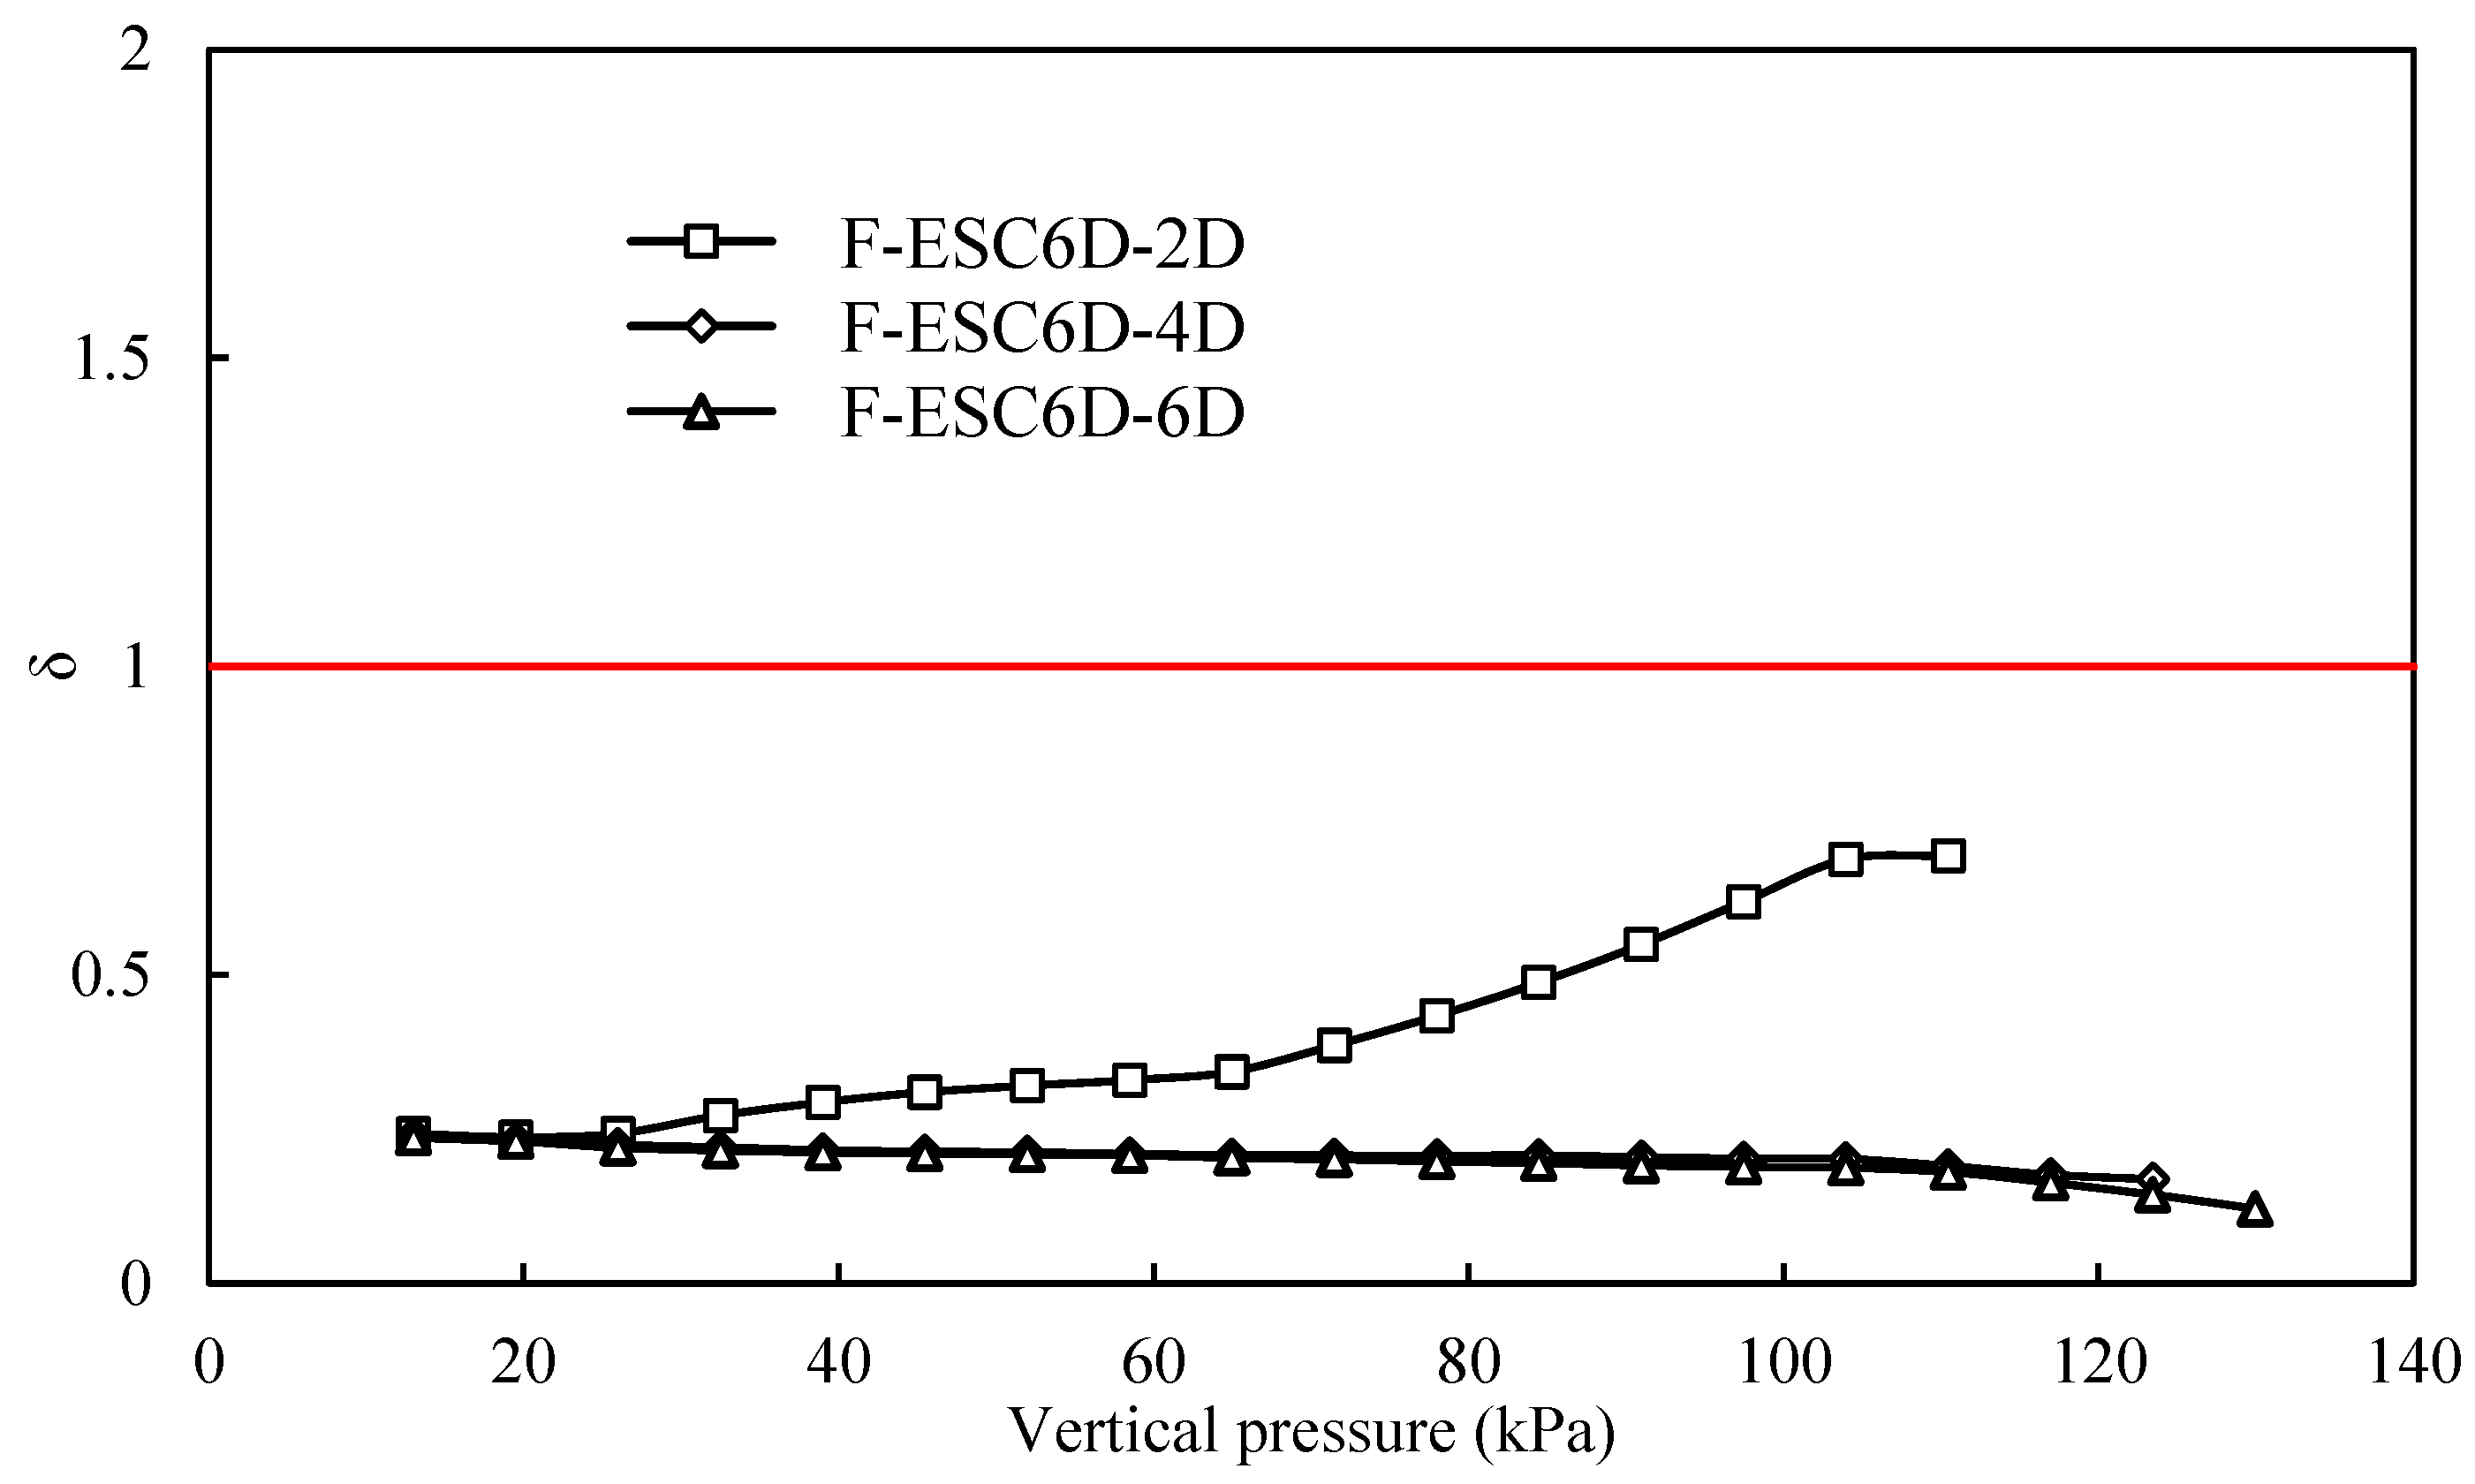
Figure 8 presents the bulging deformation of different F-OSCs with different column lengths. The radial strain increased with the increase in vertical load in all columns. In Figure 8a, the bulging deformation appeared at full column length, and the maximum bulging deformation was observed in the column tip. A small vertical pressure (e.g., 58.5 kPa in F-OSC2D) had a significant deformation (e.g., 15.5%) due to a small column length, as shown in Figure 8a. In Figure 8b–d, the relatively large vertical load (78 kPa) resulted in a great radial strain (bulging deformation) due to a relatively enough column length and a slight radial strain in the bottom of the column was observed. There was a fractional difference among F-OSC4D, F-OSC6D, and F-OSC8D, except for the strain of F-OSC4D at a vertical pressure of 78 kPa. Interestingly, the radial strain was significant in the full length of F-OSC4D when the vertical load reached 78 kPa due to column failure. The bulging area was observed between 0 and 4D, and there was almost no deformation of columns below 4D. The maximum bulging deformation found at 0.3D and the values were 13.96%, 13.29%, and 13.37% respectively, for F-OSC4D, F-OSC6D, and F-OSC8D.
Figure 9 presents the bulging deformation of different F-ESCs with different geogrid lengths. Similarly, the deformation increased with the increase in vertical load in all columns. The column with geogrid encasement had a slight deformation compared with F-OSC, and the load could be transferred deeper, resulting in a great bulging deformation below the encasement area. As shown in Figure 9a,b, the bulging deformation appeared below 2D and 4D (i.e., without encasement) for F-ESC6D-2D and F-ESC6D-4D, respectively. The maximum deformation was observed below the encasement area, and the values were 6.91% and 4.22% for F-ESC6D-2D and F-ESC6D-4D, respectively. The short encasement could not constrain the bulging deformation of the column due to the insufficient confinement of the surrounding soil. The encasement length increasing from 2D to 4D significantly improved the bulging deformation of the column, but the column tip still appeared to have relatively large bulging deformation due to the great bearing capacity and a punching failure. The deformation was relatively even and slight in F-ESC6D-6D due to full-length encasement. The improvement degree of encasement was slight as its length increased from 4D to 6D. Combining with Figure 8 and Figure 9, it could be concluded that the geogrid encasement could effectively decrease the bulging deformation, and the critical encasement length was 4D.

3.3. Failure Mode

The failure mode coefficient δ was introduced in this paper to study the failure mode of the F-OSC/F-ESC improved foundation, as follows:
δ = δ p δ d = δ t δ d δ d
where δ p , δ d , and δ t are the settlement of bulging deformation, the column’s tip settlement, and the column’s top settlement, respectively.
Figure 10 shows the failure mode coefficient variation of different F-OSCs with different column lengths during vertical loading. The short column with 2D column length had a small value of δ which was significantly less than 1.0, and the value was stable with the increase in vertical load, indicating that the short column without geogrid encasement was damaged by a punching failure with slight bulging deformation. The main failure in F-OSC4D was almost unchanged under vertical loading, and its value of δ smaller than 1.0 except for the final load. The failure mode in F-OSC4D could be considered as a punching failure with large bulging deformation. The value of δ in F-OSC6D and F-OSC8D was great than 1.0 when the vertical pressure reached a value. This result revealed that the F-OSC6D and F-OSC8D mainly appeared to punch deformation in early loading, and then their deformation mode primarily transformed into bulging deformation until the column failure (i.e., deformation failure). The failure mode in F-OSC6D and F-OSC8D was a bulging failure with punching deformation. The great the column length, the earlier the deformation mode transition point. If the column length was adequate, the column failure would be altered (e.g., F-OSC2D and F-OSC4D), and the deformation mode could be changed (e.g., F-OSC6D and F-OSC8D).
Figure 11 shows the failure mode coefficient variation of different F-ESCs with different geogrid lengths with vertical loading. The value of δ in all columns was smaller than 1.0, indicating that the column with geogrid encasement was damaged in a punching failure with a slight bulging deformation. The column with short encasement had a certain increase in failure mode coefficient with vertical loading (e.g., F-ESC6D-2D). The short geogrid length could not prevent the development of bulging deformation, and a relatively large bulging deformation could be observed in F-ESC6D-2D, consistent with Figure 9. However, the column with 4D and 6D encasement had a stable variation in failure mode coefficient with vertical loading. The bulging deformation was almost not observed in F-ESC6D-4D and n F-ESC6D-6D due to good bearing capacity, consistent with Figure 7 and Figure 9.

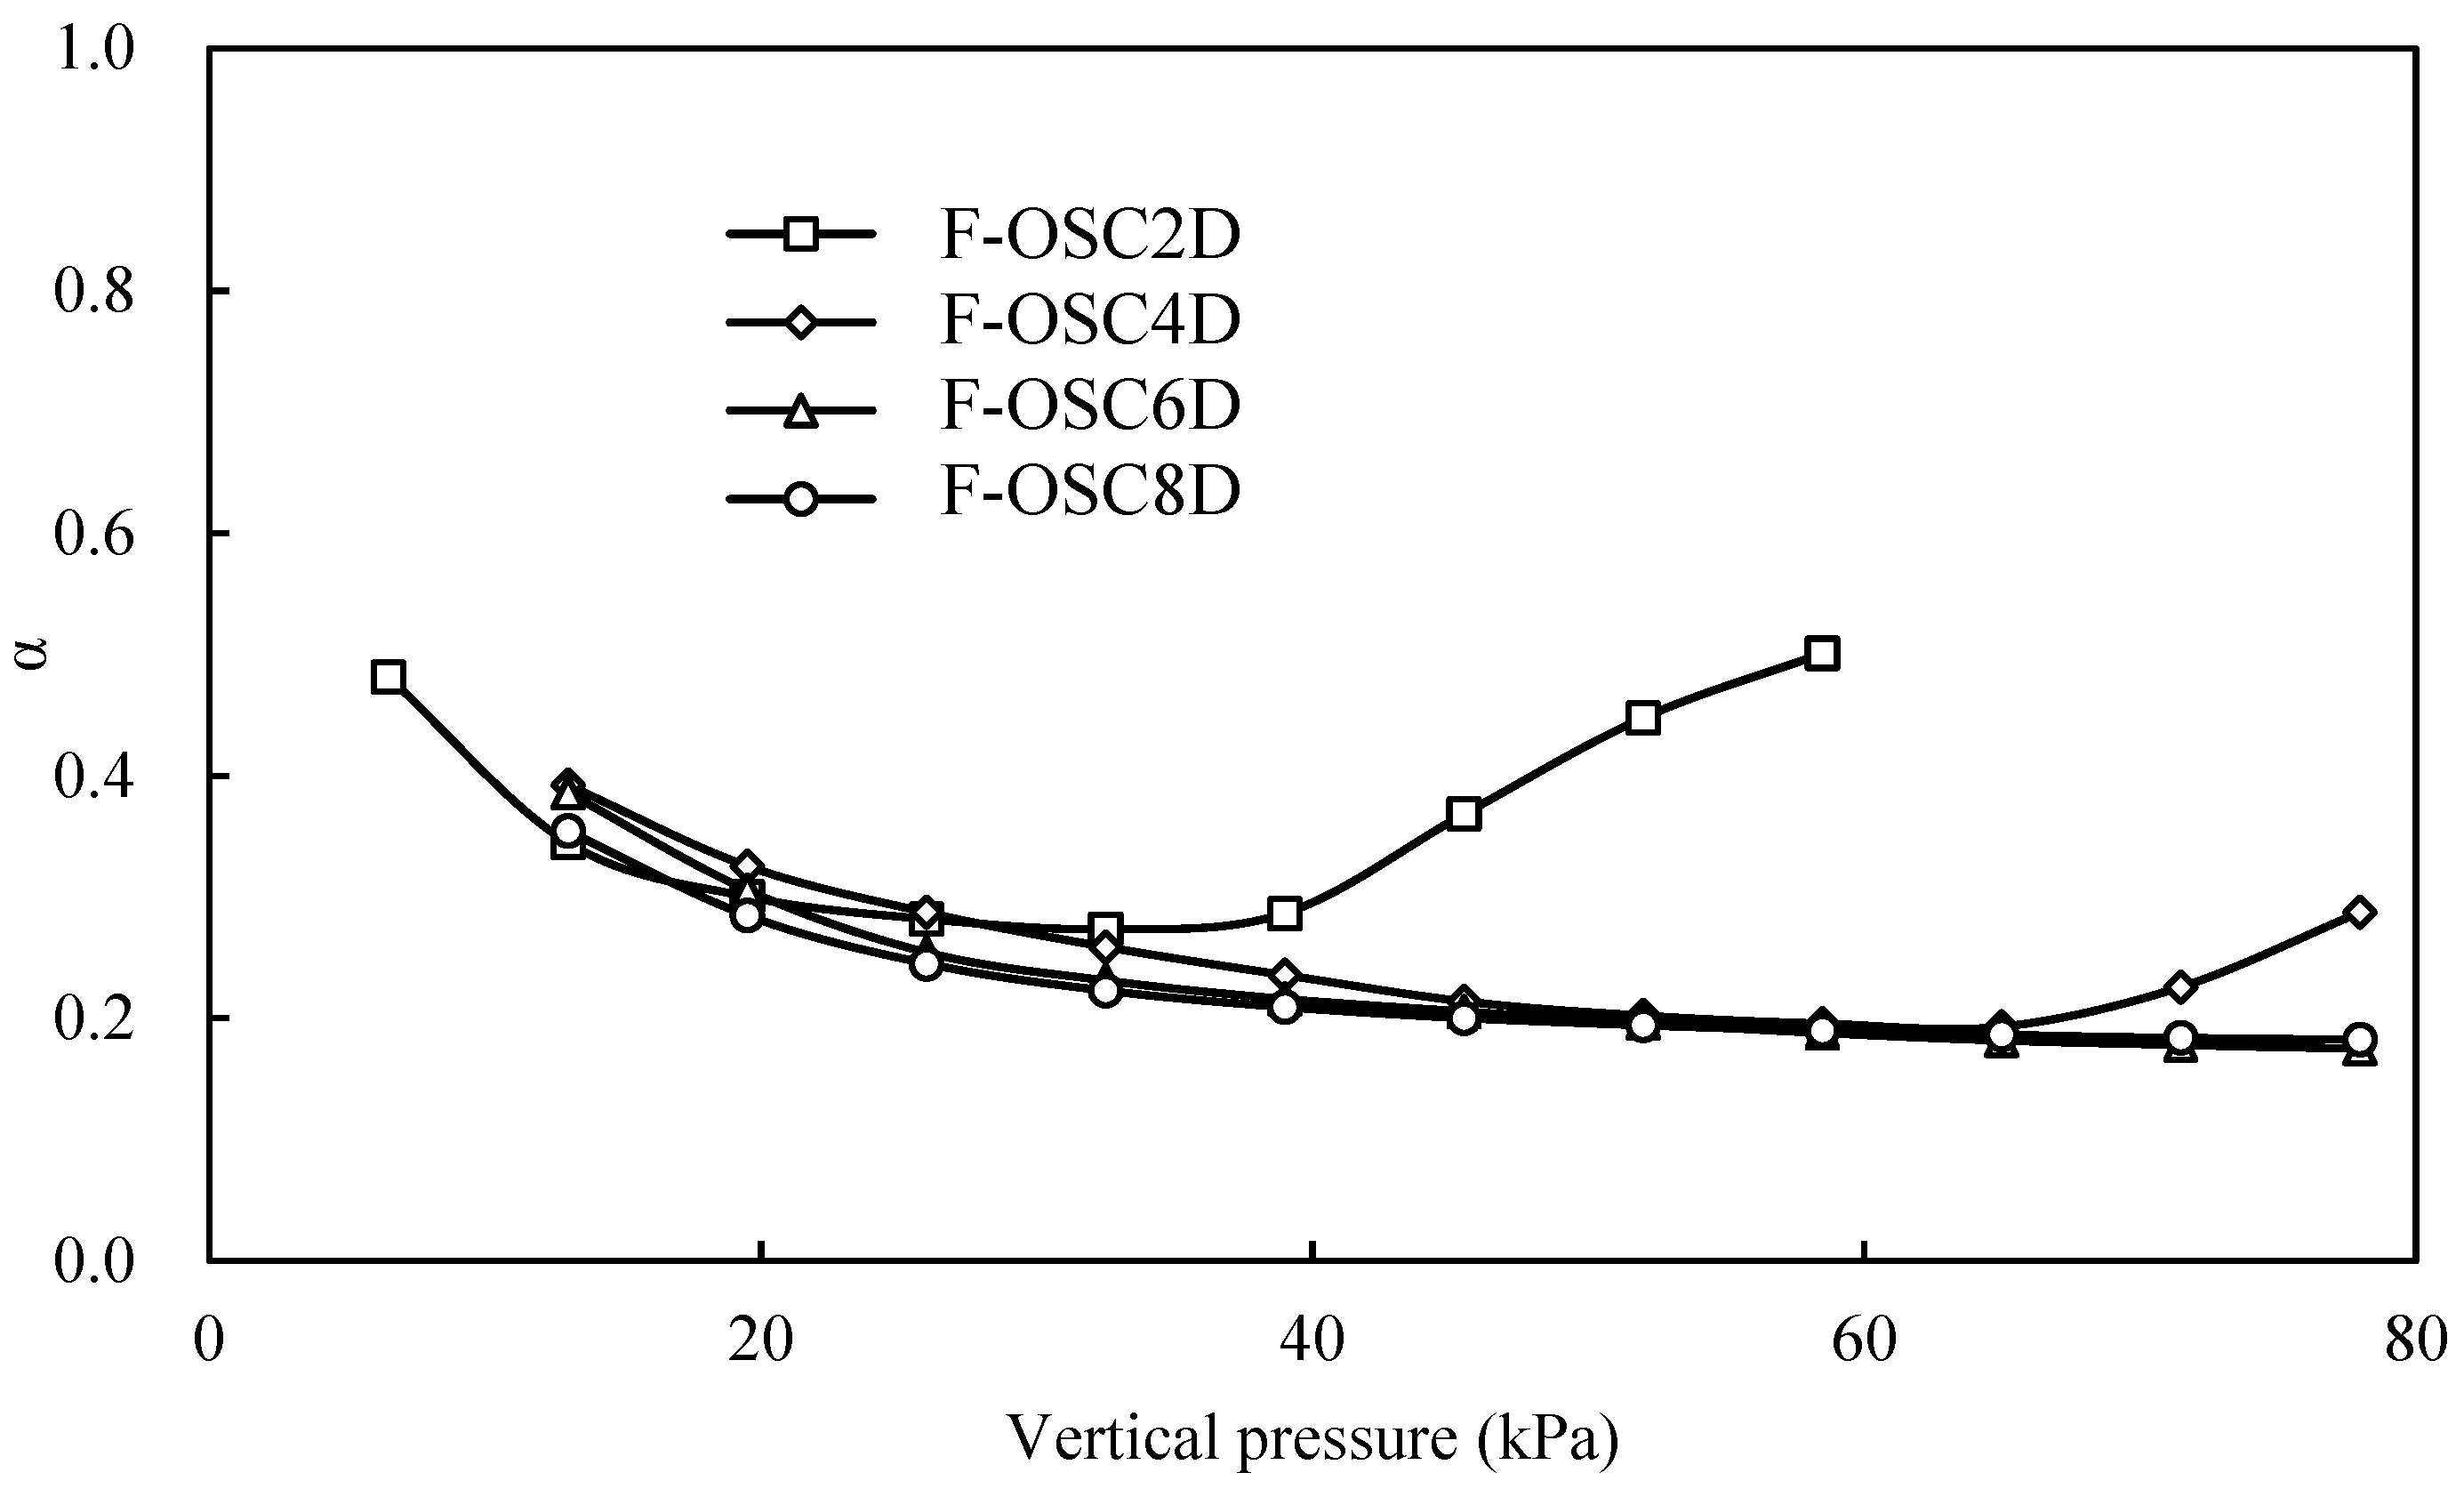
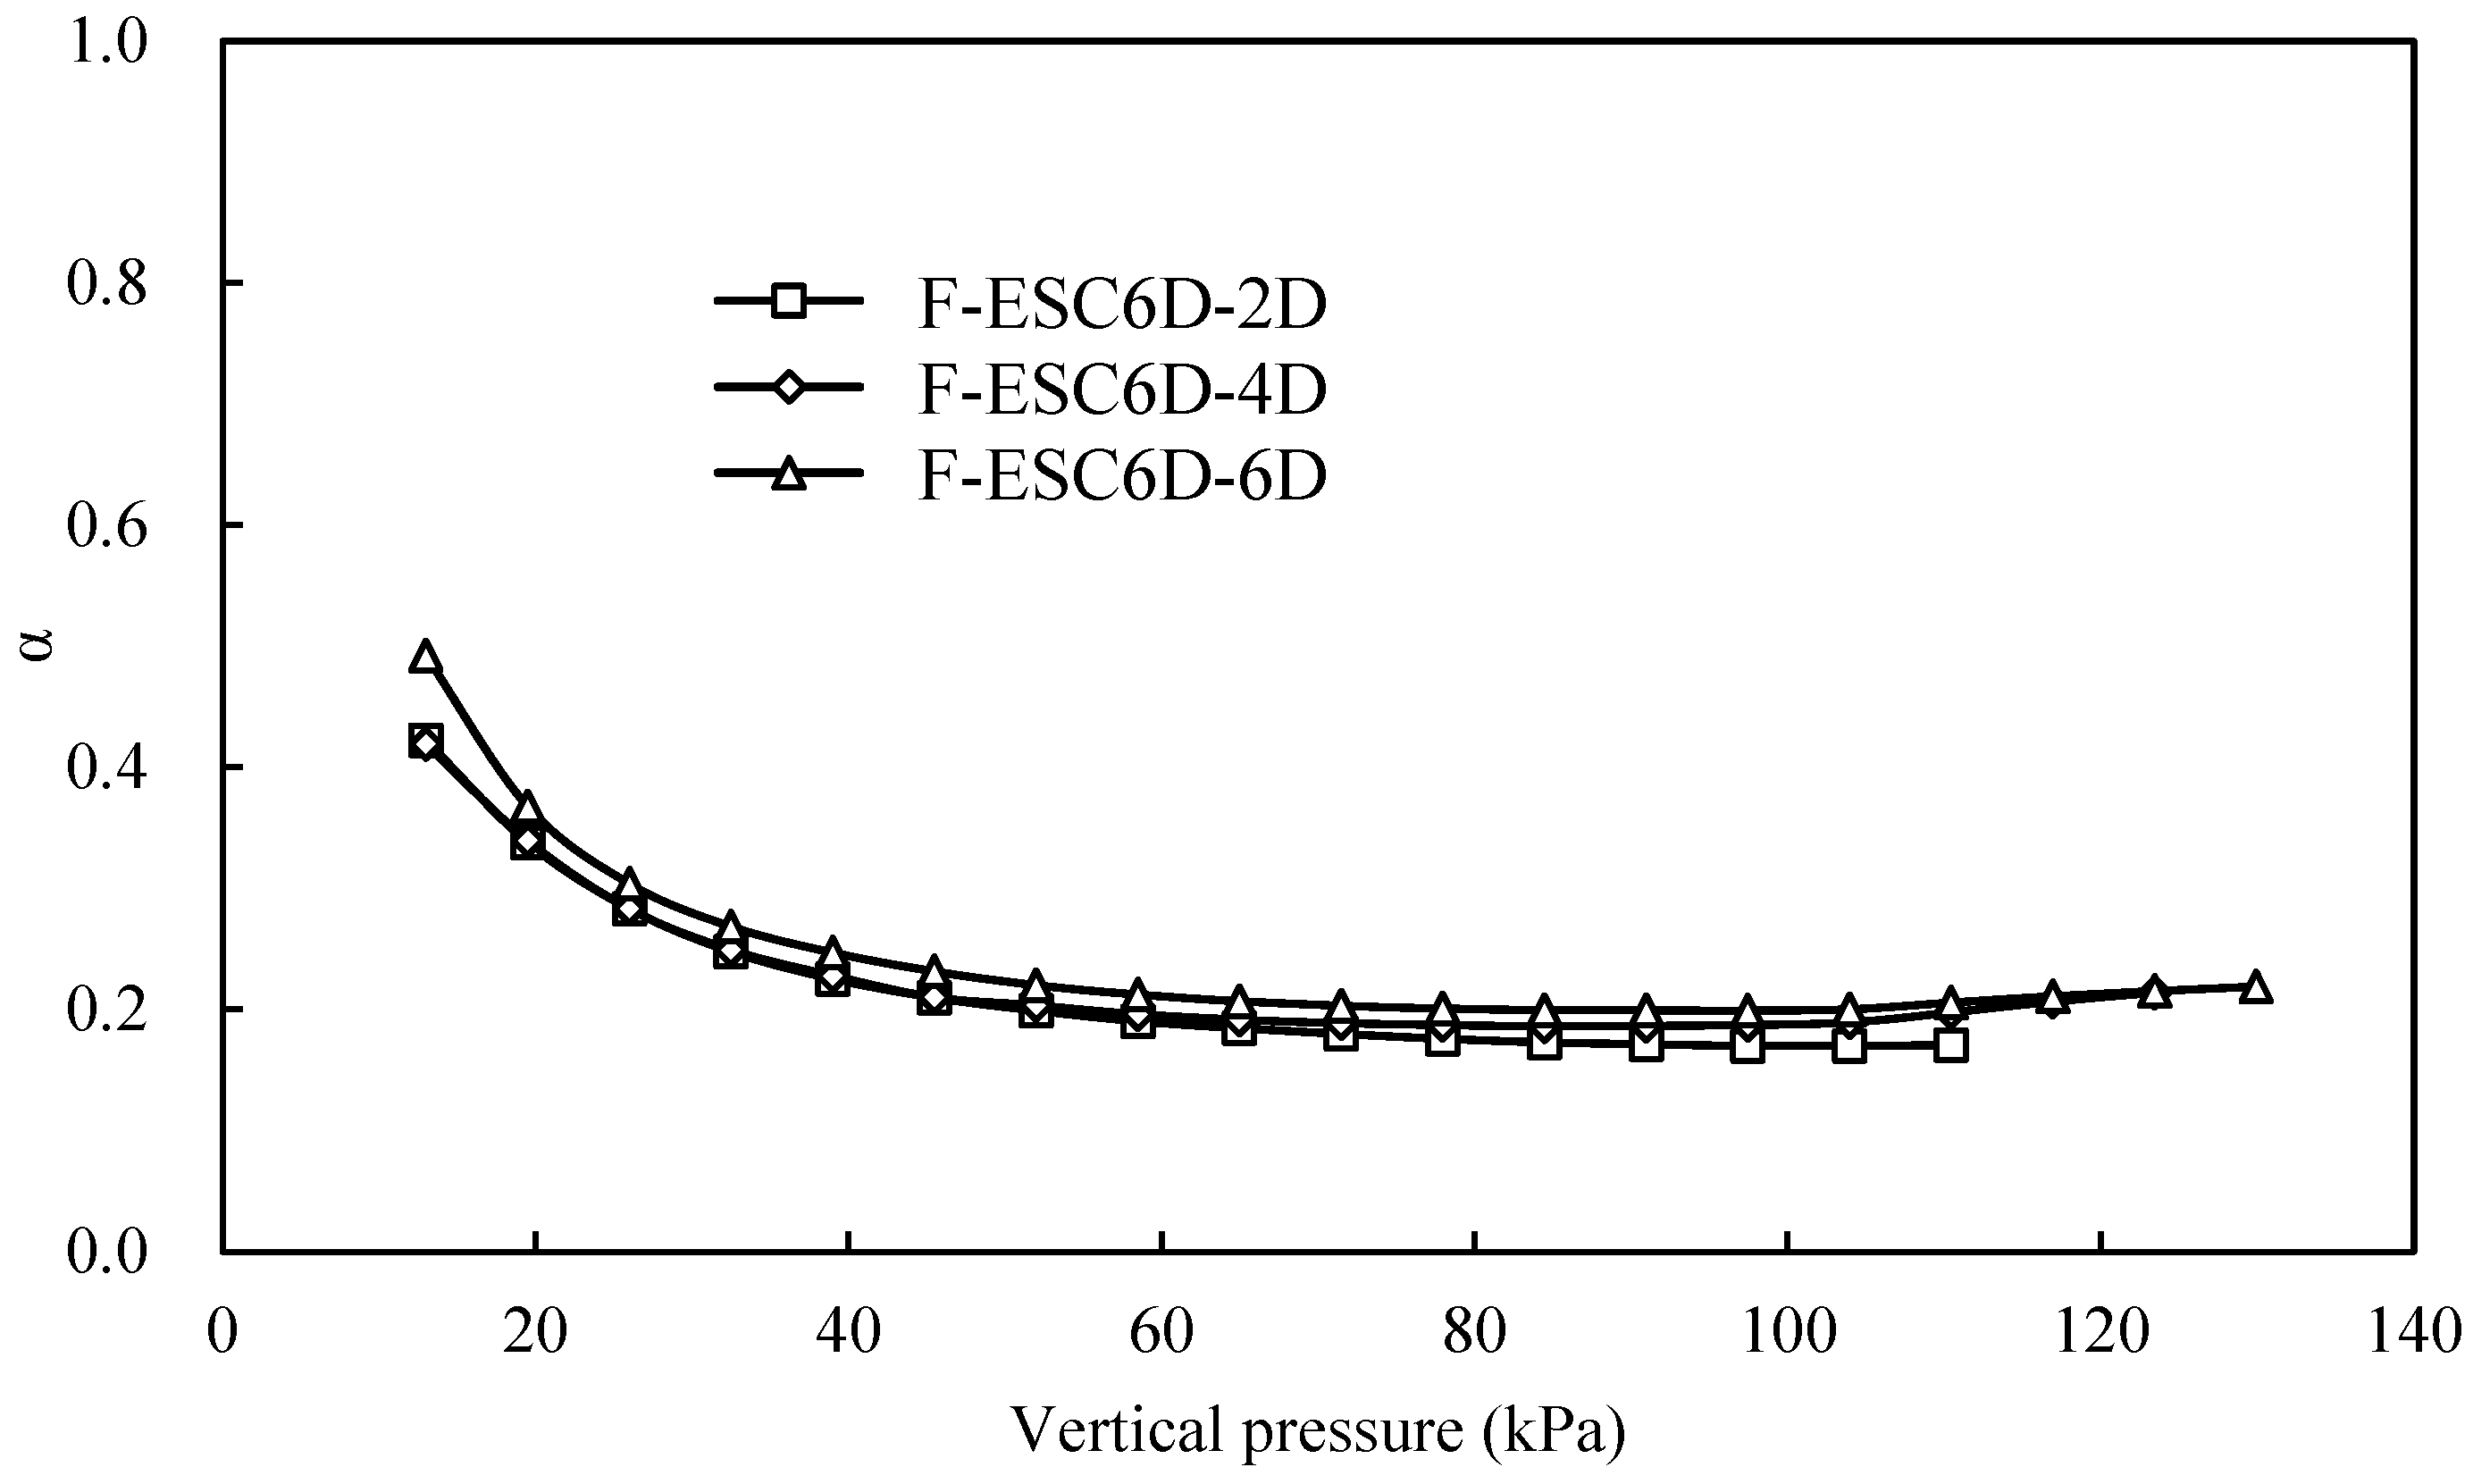
3.4. Load Transfer Coefficient

The load transfer coefficient was used in this paper to study the load transfer law on floating stone columns, as follows:
α = σ p 2 / σ p 1
where σ p 1 and σ p 2 are the stress at the top and bottom of the column, respectively.
Figure 12 shows the variation of the load transfer coefficient of different F-OSCs with different column lengths during vertical loading. The value of α decreased with increase in vertical pressure, and then increased with the increase in vertical pressure in F-OSC2D. The bulging deformation increasing the energy dissipation of the surrounding soil and decreasing integration of F-OSC resulted in the decrease in value of α , and then the large settlement and a punching failure caused by a great vertical load increased the value of α . The load transfer coefficient variation of F-OSC4D was similar to that of F-OSC2D, but it was not significantly obvious in the ascent stage due to the punching failure. Moreover, the difference between α value of F-OSC4D, F-OSC6D, and F-OSC8D was slight. The bulging failure was observed in the column with the encasement greater than 4D, as shown in Figure 8 and Figure 10, so the load transfer coefficient in F-OSC4D, F-OSC6D, and F-OSC8D almost decreased with an increase in vertical pressure. The vertical load was limited to be transferred deeper due to poor integration and stiffness, and large bulging deformation in long columns (e.g., F-OSC4D, F-OSC6D, and F-OSC8D).
Figure 13 shows the load transfer coefficient variation of different F-ESCs with different geogrid lengths during vertical loading. The geogrid encasement increased the integrity and stiffness, and the F-ESCs were damaged in a punching failure, as shown in Figure 11. Therefore, the value of α in all F-ESC decreased with the increase in vertical pressure, and was stable in the later stage (e.g., 80 kPa–140 kPa). Although the punching deformation could result in a large load in the bottom of the column, the column with geogrid encasement had a significant bearing capacity to carry more vertical load leading to a decrease in the load transfer coefficient. The difference between different F-ESCs in the value of α was slight. The vertical load could be transferred into deeper by the column with high integrity and stiffness.

4. Conclusions

A finite difference method (FDM) was used in this paper to establish the numerical models based on FLAC3D. The geogrid-type element was used to model the geogrid encasement, and the zone-type element was adopted to simulate the soil and aggregates. The interface was introduced in numerical models to realize the relative movement between different materials. Seven models were developed to investigate the effect of geogrid and column length on the behavior of floating stone columns. The load-settlement behavior, bulging deformation, failure mode, and load transfer coefficient were also analyzed. The behaviors of floating stone columns were analyzed through the developed numerical models, and the main findings are summarized as follows:
(1)
The bearing capacity of F-OSCs increased with the increase in column and encasement length, and a critical length (i.e., 4D) was found in improving bearing capacity. The geogrid encasement could increase the bearing capacity of F-OSCs, and also had a critical length (i.e., 4D) in settlement improvement.
(2)
The bulging deformation was significant in F-OSCs and observed at the top of a long column and the full length of a short column. The geogrid encasement could constrain the OSC to decrease the bulging deformation due to excellent tensile strength. The short encasement length (e.g., 2D) could not effectively confine the column, and only the deformation transferred deeper.
(3)
The failure mode in F-OSCs was mainly a punching failure with bulging deformation for a short column (e.g., less than 4D), and was relative to the vertical pressure for a long column. The failure mode in F-ESCs was a punching failure with a slight bulging deformation due to a good integration improved by geogrid, and the punching degree increased with an increase in geogrid encasement length.
(4)
The load transfer coefficient in the short column would increase in a later stage due to a punching failure. The load transfer coefficient of F-OSCs or F-ESCs was relatively stable as the column length increased to a critical value (e.g., 4D) or the encasement length increased to a critical value (e.g., 4D).

5. Limitations

This study was focused on the numerical analysis of floating geogrid-encased stone column improved foundation using FDM. The main work was to investigate the behavior of floating stone columns. The deformation of the stone column, failure mode, and load transfer law were analyzed based on the validated models. The shape of aggregates could be considered in the model in future research to reveal the mechanical properties better. The fluid could be added into the model to simulate the more actual condition.

Author Contributions

Conceptualization, M.G. and Y.C.; methodology, M.G.; software, H.M.; validation, X.C. and H.M.; formal analysis, X.C. and H.M.; investigation, H.M. and X.C.; resources, H.M. and X.C.; writing—original draft preparation, X.C.; writing—review and editing, Y.C.; supervision, M.G.; project administration, Y.C.; funding acquisition, M.G. All authors have read and agreed to the published version of the manuscript.

Funding

This research was funded by the National Natural Science Foundation of China grant number (51908150). The APC was funded by the Guangzhou City Technology and Science Program grant number (202102010456).

Institutional Review Board Statement

Not applicable.

Informed Consent Statement

Not applicable.

Data Availability Statement

Some or all data, models, or code generated or used during the study are available from the corresponding author by request.

Acknowledgments

This research was funded by the National Natural Science Foundation of China (Grant No. 51908150) and the Guangzhou City Technology and Science Program (202102010456). The above support was appreciated.

Conflicts of Interest

The authors declare that the research was conducted in the absence of any commercial or financial relationship that could be construed as potential conflict of interest.

References

  1. Zhang, L.; Xu, Z.; Zhou, S. Vertical cyclic loading response of geosynthetic-encased stone column in soft clay. Geotext. Geomembr. 2020, 48, 897–911. [Google Scholar]
  2. Vijay Kumar, S.P.; Ganesh Kumar, S.; Datta Gupta, S. Performance assessment of composite skirted ground reinforcement system in liquefiable ground under repeated dynamic loading conditions. Bull. Earthq. Eng. 2022, 20, 1397–1429. [Google Scholar] [CrossRef]
  3. Rezaei, M.M.; Lajevardi, S.H.; Saba, H.; Ghalandarzadeh, A.; Zeighami, E. Laboratory study on single stone columns reinforced with steel bars and discs. Int. J. Geosynth. Ground Eng. 2019, 5, 2. [Google Scholar]
  4. Hasan, M.; Samadhiya, N.K. Performance of geosynthetic-reinforced granular piles in soft clays: Model tests and numerical analysis. Comput. Geotech. 2017, 87, 178–187. [Google Scholar] [CrossRef]
  5. Yoo, C.; Lee, D. Performance of geogrid-encased stone columns in soft ground: Full-scale load tests. Geosynth. Int. 2012, 19, 480–490. [Google Scholar]
  6. Ji, M.; Wang, J.; Zheng, J.-J.; Zheng, Y. Contribution of geosynthetic to the shear strength of geosynthetic encased stone columns. Geosynth. Int. 2023; ahead of print. [Google Scholar] [CrossRef]
  7. Ong, D.; Sim, Y.; Leung, C. Performance of field and numerical back-analysis of floating stone columns in soft clay considering the influence of dilatancy. Int. J. Geomech 2018, 18, 04018135. [Google Scholar]
  8. Almeida, M.; Lima, B.; Riccio, M.; Jud, H.; Cascão, M.; Roza, F. Stone columns field test: Monitoring data and numerical analyses. Geotech. Eng. J. SEAGS AGSSEA 2014, 45, 103–112. [Google Scholar]
  9. Gao, J.; Liu, L.; Zhang, Y.; Xie, X. Deformation mechanism and soil evolution analysis based on different types geogrid reinforced foundation. Constr. Build. Mater. 2022, 331, 127322. [Google Scholar] [CrossRef]
  10. Thakur, A.; Rawat, S.; Gupta, A.K. Experimental study of ground improvement by using encased stone columns. Innov. Infrastruct. Solut. 2021, 6, 1. [Google Scholar] [CrossRef]
  11. Thakur, A.; Rawat, S.; Gupta, A.K. Experimental and numerical modelling of group of geosynthetic-encased stone columns. Innov. Infrastruct. Solut. 2021, 6, 12. [Google Scholar] [CrossRef]
  12. Gu, M.; Mo, H.; Qiu, J.; Yuan, J.; Xia, Q. Behavior of floating stone columns reinforced with geogrid encasement in model tests. Front. Mater. 2022, 9, 980851. [Google Scholar] [CrossRef]
  13. Gu, M.; Cai, X.; Fu, Q.; Li, H.; Wang, X.; Mao, B. Numerical Analysis of Passive Piles under Surcharge Load in Extensively Deep Soft Soil. Buildings 2022, 12, 1988. [Google Scholar] [CrossRef]
  14. Gu, M.; Han, J.; Zhao, M. Three-Dimensional Discrete-Element Method Analysis of Stresses and Deformations of a Single Geogrid-Encased Stone Column. Int. J. Geomech. 2017, 17, 1–4. [Google Scholar] [CrossRef]
  15. Gu, M.; Cui, J.; Wu, Y.; Yuan, J.; Li, Y. Effects of Geogrid Encasement on Behavior of Stone Column-Improved Soft Clay. In Advances in Transportation Geotechnics IV; Springer: Cham, Switzerland, 2022; pp. 559–573. [Google Scholar]
  16. Gu, M.; Han, J.; Zhao, M. Three-dimensional DEM analysis of axially loaded geogrid-encased stone column in clay bed. Int. J. Geomech. 2020, 20, 04019180. [Google Scholar] [CrossRef]
  17. Hasan, M.; Samadhiya, N. Experimental and numerical analysis of geosynthetic-reinforced floating granular piles in soft clays. Int. J. Geosynth. Ground Eng. 2016, 2, 22. [Google Scholar] [CrossRef] [Green Version]
  18. Liu, F.; Guo, P.; Hu, H.; Zhu, C.; Gong, X. Loading Behavior and Soil-Structure Interaction for a Floating Stone Column under Rigid Foundation: A DEM Study. Geofluids 2021, 2021, 9508367. [Google Scholar] [CrossRef]
  19. Xu, Z.A.; Cy, B.; Jfc, A.; Zag, A. Numerical modeling of floating geosynthetic-encased stone column–supported embankments with basal reinforcement. Geotext. Geomembr. 2022, 50, 720–736. [Google Scholar]
  20. Yasser, F.; Altahrany, A.; Elmeligy, M. Numerical investigation of the settlement behavior of hybrid system of floating stone columns and granular mattress in soft clay soil. Int. J. Geo Eng. 2022, 13, 12. [Google Scholar] [CrossRef]
  21. Shahu, J.T.; Kumar, S.; Bhowmik, R. Ground Improvement for Transportation Infrastructure: Experimental Investigations on Cyclic Behavior of a Group of Granular Columns. Int. J. Geomech. 2023, 23, 04022309. [Google Scholar] [CrossRef]
  22. Sadaoui, O.; Bahar, R. Analyse numérique et expérimentale du comportement des ouvrages fondés sur un sol mou renforcé par des colonnes ballastées flottantes. Bull. Eng. Geol. Environ. 2020, 79, 2721–2745. [Google Scholar] [CrossRef]
  23. Bhatia, R.; Kumar, A. Load-Settlement Behavior of Concrete Debris Pile in Fly Ash Fill. J. Hazard. Toxic Radioact. Waste 2020, 24, 1–9. [Google Scholar] [CrossRef]
  24. Ehsaniyamchi, A.; Ghazavi, M. Short-term and long-term behavior of geosynthetic-reinforced stone columns. Soils Found. 2019, 59, 1579–1590. [Google Scholar] [CrossRef]
  25. Chen, J.-F.; Zhang, X.; Yoo, C.; Gu, Z.-A. Effect of basal reinforcement on performance of floating geosynthetic encased stone column-supported embankment. Geotext. Geomembr. 2022, 50, 566–580. [Google Scholar] [CrossRef]
  26. Fattah, M.Y.; Al-Neami, M.A.; Shamel Al-Suhaily, A. Estimation of bearing capacity of floating group of stone columns. Eng. Sci. Technol. Int. J. 2017, 20, 1166–1172. [Google Scholar] [CrossRef]
  27. Ng, K.S.; Tan, S.A. Design and analyses of floating stone columns. Soils Found. 2014, 54, 478–487. [Google Scholar] [CrossRef] [Green Version]
  28. Şahinkaya, F.; Vekli, M.; Çadır, C. Numerical analysis under seismic loads of soils improvement with floating stone columns. Nat. Hazards 2017, 88, 891–917. [Google Scholar] [CrossRef]
  29. Ali, M. Behavior of Ordinary and Encased Stone Columns End-Bearing and Floating in Soft Clay (Numerical Model). In Proceedings of the International Congress and Exhibition “Sustainable Civil Infrastructures: Innovative Infrastructure Geotechnology”, Cairo, Egypt, 24–28 November 2018. [Google Scholar]
  30. Debnath, P.; Dey, A.K. Bearing capacity of geogrid reinforced sand over encased stone columns in soft clay. Geotext. Geomembr. 2017, 45, 653–664. [Google Scholar] [CrossRef]
  31. Thakur, A.; Rawat, S.; Gupta, A.K. Experimental and Numerical Investigation of Load Carrying Capacity of Vertically and Horizontally Reinforced Floating Stone Column Group. Geotech. Geol. Eng. 2021, 39, 3003–3018. [Google Scholar] [CrossRef]
  32. Itasca. FLAC3D 6.0 Document; Itasca Consulting Group: Minneapolis, MN, USA, 2018. [Google Scholar]
  33. ASTM. Standard Practice for Classification of Soils for Engineering Purposes (Unified Soil Classification System); D2487-17; ASTM International: West Conshohocken, PA, USA, 2017. [Google Scholar]
  34. Potyondy, D.O.; Autio, J. Bonded-Particle Simulations of the In-Situ Failure Test At Olkiluoto. In Proceedings of the 38th U.S. Symposium on Rock Mechanics (USRMS), Washington, DC, USA, 7–10 July 2001. [Google Scholar]
  35. Gu, M.; Zhao, M.; Zhang, L.; Han, J. Effects of geogrid encasement on lateral and vertical deformations of stone columns in model tests. Geosynth. Int. 2016, 23, 100–112. [Google Scholar] [CrossRef] [Green Version]
Figure 1. Numerical model of F-OSC6D and F-ESC6D-4D.
Buildings 13 01609 g001
Figure 2. Indoor triaxial test of the clay with moisture water 36%.
Buildings 13 01609 g002
Figure 3. Comparing the value of the plastic strain between the test and simulation.
Buildings 13 01609 g003
Figure 4. The tensile results of the geogrid of the simulation and test.
Buildings 13 01609 g004
Figure 5. Comparison of load-settlement curves between the model test and numerical simulation in F-OSC4D and F-ESC6D-4D composite foundations.
Buildings 13 01609 g005
Figure 6. Load-settlement curves of F-OSC composite foundations with different column lengths.
Buildings 13 01609 g006
Figure 7. Load-settlement curves of F-ESC composite foundations with different geogrid lengths.
Buildings 13 01609 g007
Figure 8. Bulging deformation of F-OSC with different column lengths: (a) F-OSC2D, (b) F-OSC4D, (c) F-OSC6D, and (d) F-OSC8D.
Buildings 13 01609 g008
Figure 9. Bulging deformation of F-ESC with different geogrid lengths: (a) F-ESC6D-2D, (b) F-ESC6D-4D, and (c) F-ESC6D-6D.
Buildings 13 01609 g009
Figure 10. Change in failure mode coefficient of different F-OSCs during loading.
Buildings 13 01609 g010
Figure 11. Change in failure mode coefficient of different F-ESCs during loading.
Buildings 13 01609 g011
Figure 12. Change in load transfer coefficient of different F-OSCs during loading.
Buildings 13 01609 g012
Figure 13. Change in load transfer coefficient of different F-ESCs during loading.
Buildings 13 01609 g013
Table 1. Summary of model test schemes.
DescriptionStone ColumnGeogridModel Box
Diameter (D)Length (L)Length (l)Diameter (De)Height (H)
F-OSC2D100 mm200 mm-300 mm1000 mm
F-OSC4D400 mm
F-OSC6D600 mm
F-OSC8D800 mm
F-ESC6D-2D600 mm200 mm
F-ESC6D-4D600 mm400 mm
F-ESC6D-6D600 mm600 mm
Table 2. Micro-parameters of the clay in FLAC3D.
ParameterValueParameterValue
Elastic modular0.3 MPaFriction angle
Poisson’s ratio0.3Density 1900   kg / m 3
Cohesion4.06 kPa
Table 3. Micro-parameters of crushed stones in FLAC3D.
ParameterValueParameterValue
Elastic modular9.2 MPaFriction angle42.9°
Poisson’s ratio0.27Density 1500   kg / m 3
Cohesion 0 kPa
Table 4. Micro-parameters of geogrid in FLAC3D.
ParameterValue
Elastic modulus330 MPa
Passion’s ratio0.33
Coupling spring cohesion (kPa)3.2
Coupling spring friction angle (°)0
Coupling spring shear stiffness (N/m3)3.2 × 104
Thickness1 mm
Table 5. Micro-parameters of the interface in FLAC3D.
Interface PositionCohesion (kPa)Friction (°)Shear Stiffness (N/m)Normal Stiffness (N/m)
Column side3.203.0 × 1083.0 × 108
Column bottom3.201.9 × 1081.9 × 108
Disclaimer/Publisher’s Note: The statements, opinions and data contained in all publications are solely those of the individual author(s) and contributor(s) and not of MDPI and/or the editor(s). MDPI and/or the editor(s) disclaim responsibility for any injury to people or property resulting from any ideas, methods, instructions or products referred to in the content.

