Article

Influence of Water Content and Mixing Conditions on the Properties of Lime-Based Materials

by
Bruna A. Silva
1,*,
Ana Paula Ferreira Pinto
1,
Augusto Gomes
1 and
António Candeias
2,3
1
CERIS, Instituto Superior Técnico, Universidade de Lisboa, Av. Rovisco Pais 1, 1049-001 Lisboa, Portugal
2
HERCULES Laboratory, University of Évora, Palácio do Vimioso, Largo Marquês de Marialva 8, 7000-809 Évora, Portugal
3
Chemistry and Biochemistry Department, School of Sciences and Technology, University of Évora, Rua Romão Ramalho 59, 7000-671 Évora, Portugal
*
Author to whom correspondence should be addressed.
Buildings 2023, 13(6), 1530; https://doi.org/10.3390/buildings13061530
Submission received: 19 April 2023 / Revised: 23 May 2023 / Accepted: 7 June 2023 / Published: 15 June 2023
(This article belongs to the Special Issue Lime-Based Materials for Historic Buildings)

Abstract

:
This paper evaluates the influence of water content and mixing conditions (mixing time and sequence of addition of the constituents) on the fresh state properties of lime-based materials and their impact on the hardened state properties. Higher water contents allowed an increased fluidity and lower torque, yield stress and plastic viscosity values. In turn, a longer mixing time with the aggregate caused a progressively stiffer mortar and a substantial increase in the torque, yield stress and plastic viscosity values due to the breakdown of lime agglomerates that consume part of the free water available to lubricate the mix. A longer mixing time without the aggregate caused similar trends, albeit to a much lesser extent. The water content and mixing conditions also had a major impact on the resulting porous structure of lime mortars and, thus, on their mechanical strength.

1. Introduction

A renewed interest in compatible mortars, as is the case of lime-based ones, for their application in conservation and restoration interventions has led to the emergence of several studies on their properties over the last few decades [1,2,3,4,5,6,7,8]. Among them, the properties in the fresh state of lime mortars are of great importance, as they influence their ease of application onto a substrate and, therefore, their suitability for a given function (bedding, pointing, rendering etc.), their stability during and after application as well as their properties in the hardened state [9,10,11]. In this context, rheology assumes great importance since it is dedicated to the analysis of the flow behaviour of materials [12,13,14].
The properties of mortars and pastes are affected by a variety of factors, including the binder type and content, the water/binder (w/b) ratio, the type and dosage of admixtures or additions and the mixing time and sequence [15,16]. While the influence of all these variables on the rheological behaviour of cement-based materials (pastes, grouts, mortars and concrete) has been extensively studied [12,13,15,16,17,18,19,20,21,22,23,24,25,26,27,28], few works have contemplated their effects on lime-based materials.
Several subjects related to the rheology of hydraulic lime grouts, pastes and mortars have been addressed, among others, by Seabra et al. [29], Henriques et al. [30,31,32,33] and Banfill et al. [34,35]. For air lime, the scarcely available literature focuses mainly on putties, pastes and grouts. For instance, Atzeni et al. [36], Ruiz-Agudo and Rodriguez-Navarro [37,38], Arizzi et al. [39] and Boháč and Nečas [40] dealt with the influence of the type and/or ageing time of the lime used on the rheological properties of lime putties, whereas Rago [41] and Fourmentin et al. [42] compared the rheological behaviour of lime pastes with that of cement ones. Additionally, Izaguirre et al. [43] and Fernández et al. [44] briefly addressed the effects of water-retaining and plasticizing admixtures, respectively, on the rheological properties of lime pastes, and Azeiteiro et al. [45] studied the effects of the same admixtures on lime grouts for the consolidation of old renders. Specific research on the rheology of air lime mortars was performed by Paiva et al. [7], who analysed the effect of the maturation process of lime mortars, by Seabra et al. [11,46], who evaluated the influence of plasticizing, air-entraining and water-retaining admixtures, and more recently, by our team [47,48], who studied the effects of the addition of plasticizing and water-retaining admixtures. A rotational rheometer was used in these works [7,11,45,46,47,48]. In turn, Cardoso et al. [49] characterised several rendering mortars, including some that were based on air lime, through compressive (squeeze-flow tests) and rotational rheometry, while Hendrickx et al. [50] studied the rheology of lime mortars using different methods, but mostly rotational rheometry. However, to the best of the authors’ knowledge, the influence of water content and mixing conditions on the rheological behaviour of lime-based materials has not yet been addressed in the literature.
In this context, this paper aims to evaluate the influence of water content, mixing time and sequence of introduction of the constituents on the rheological properties of lime-based materials and their implications on the physical and mechanical properties. To fulfil the research objectives, these said parameters were drastically altered to clearly understand their effects on the properties of the studied materials.

2. Materials and Methods

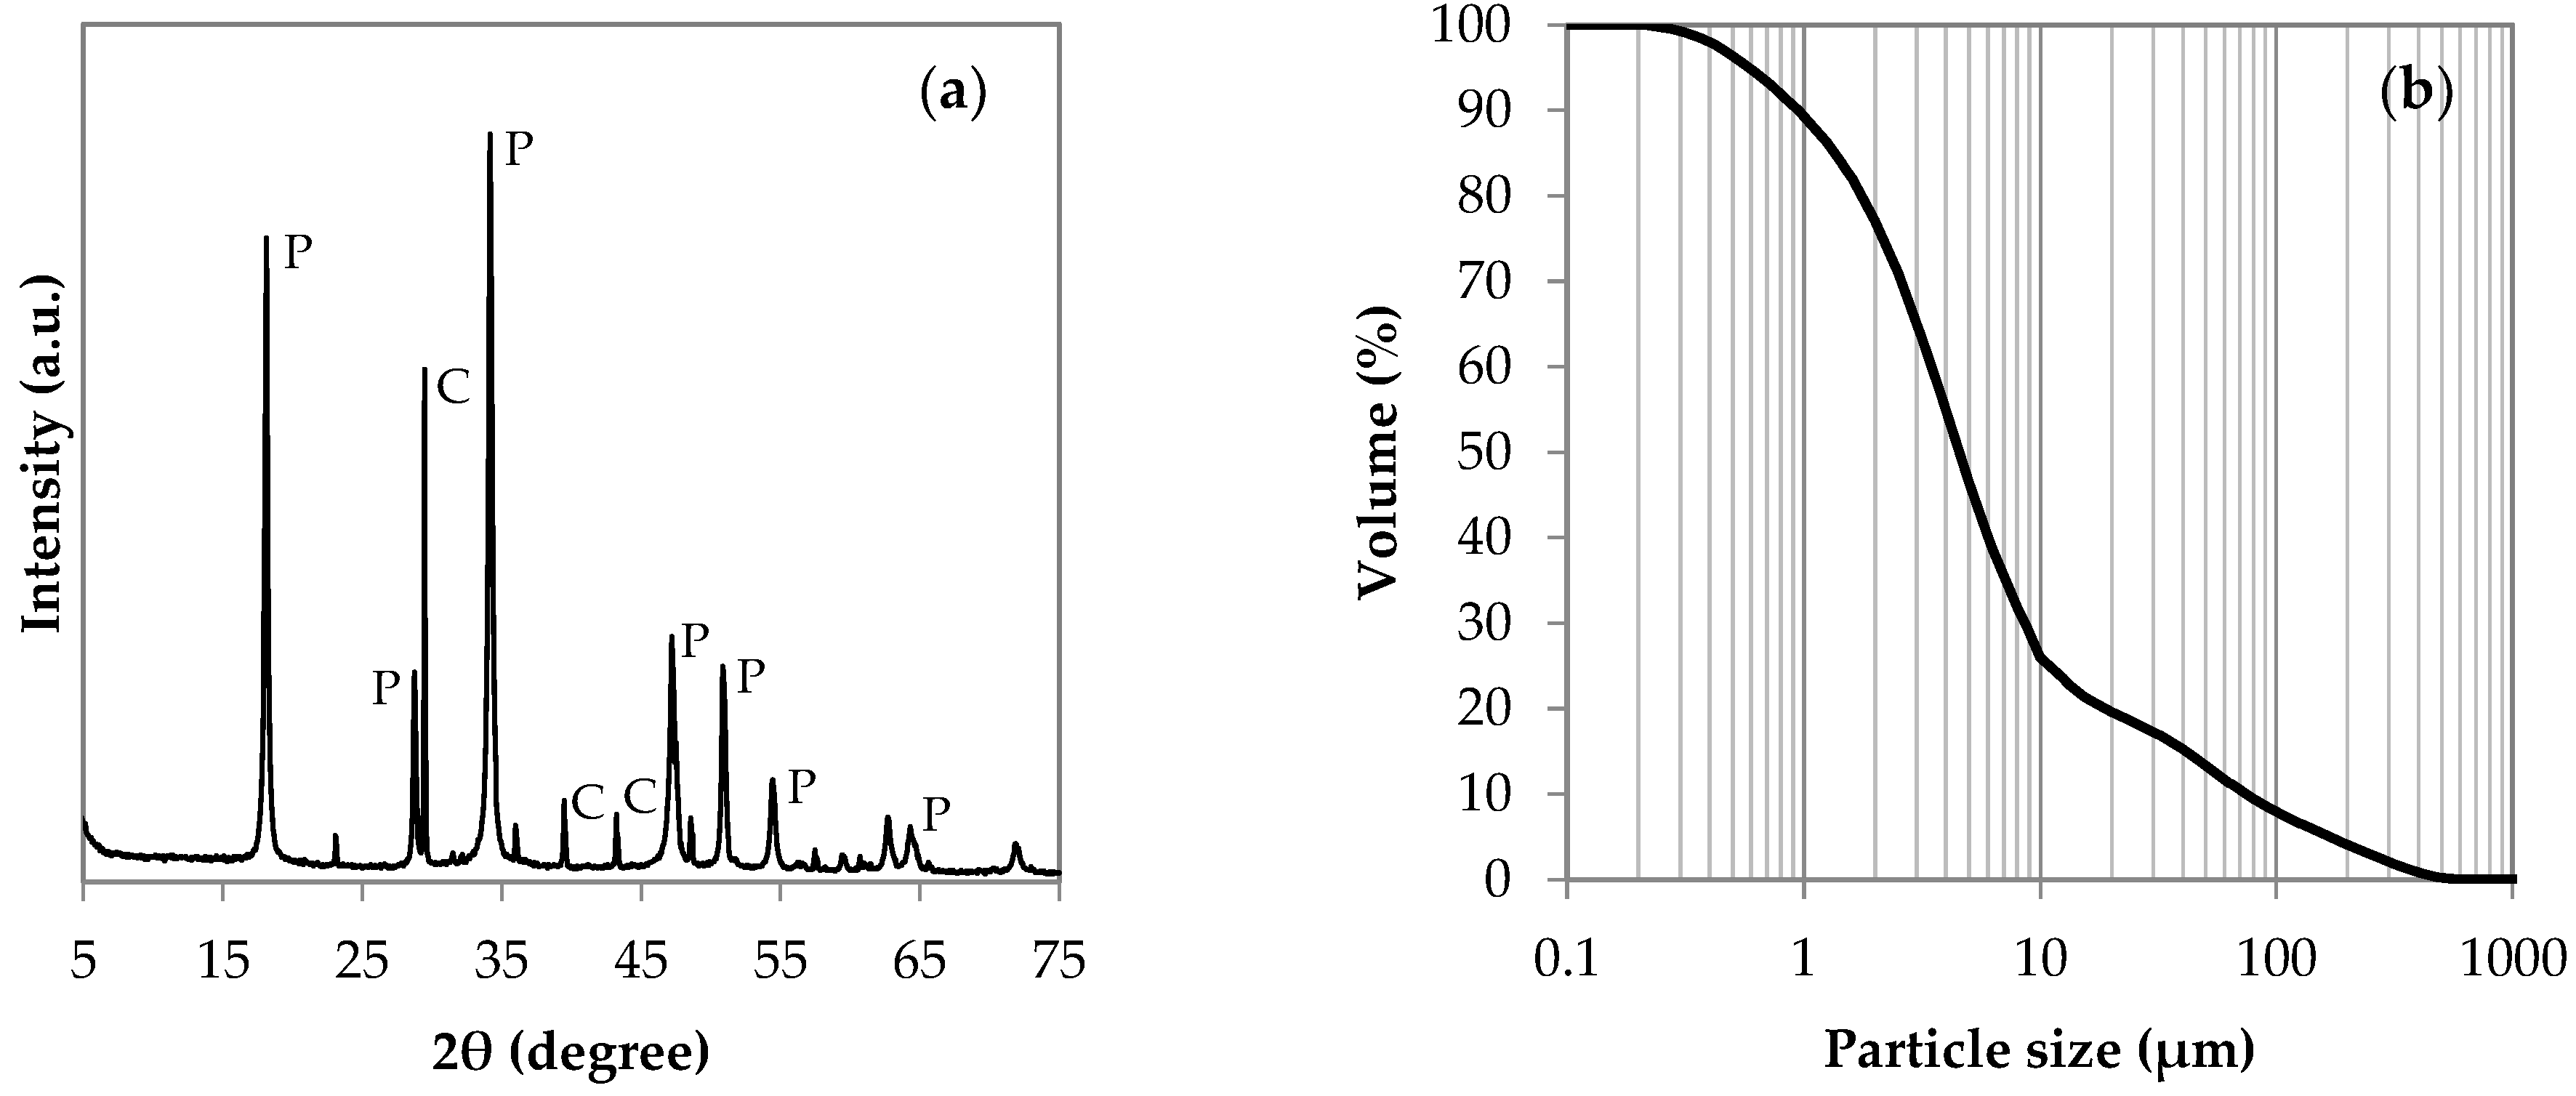
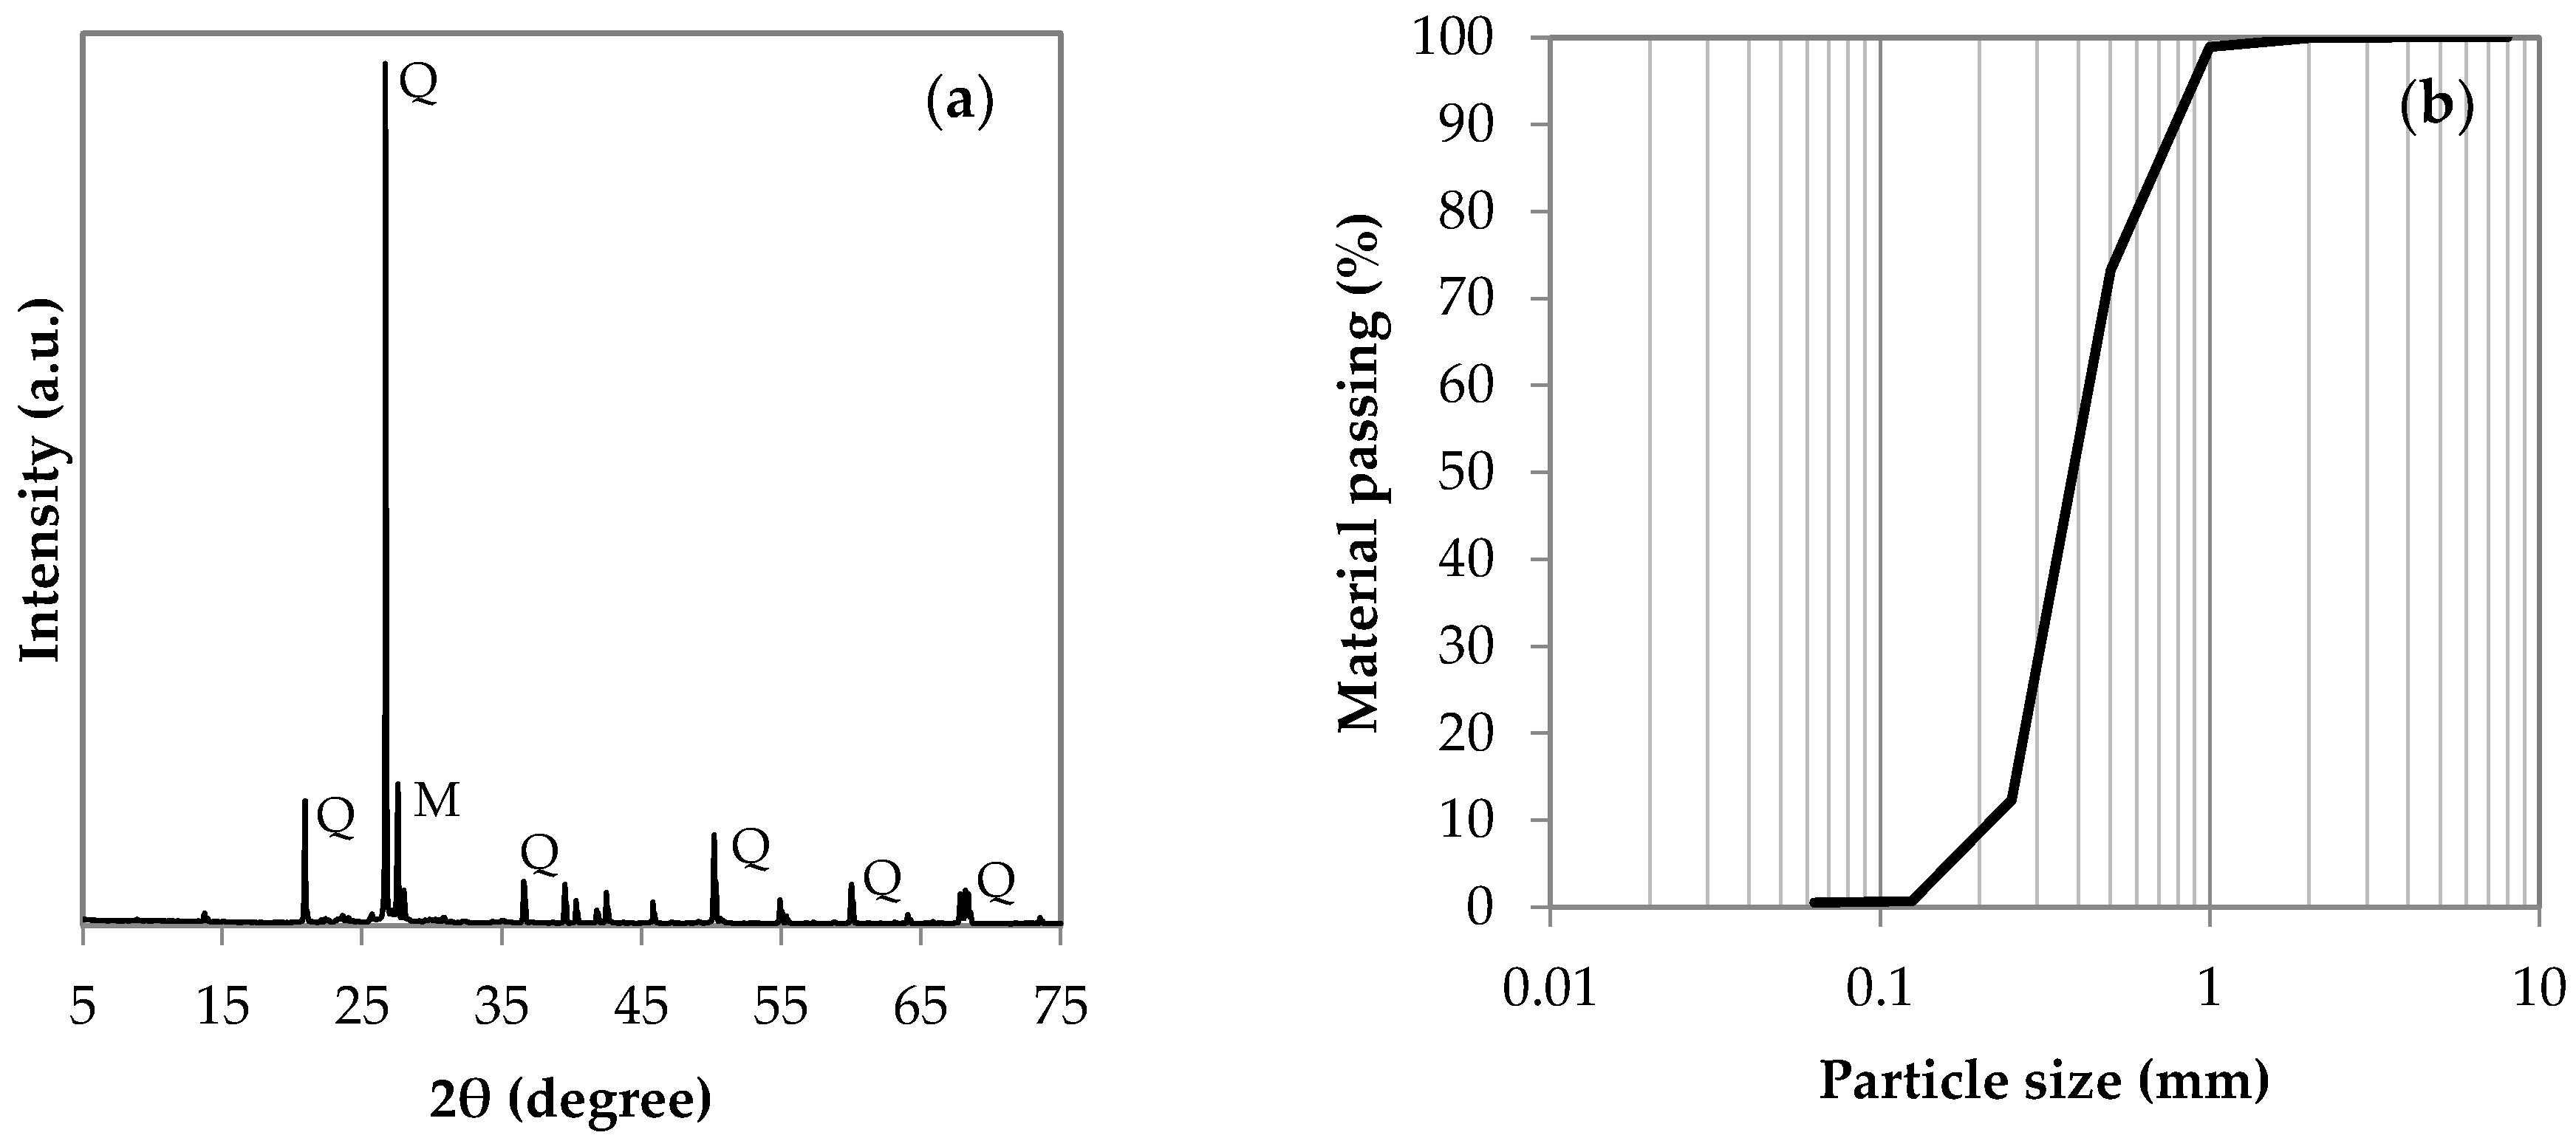
2.1. Materials and Formulations

Mortars and pastes were produced using powdered hydrated lime from Calcidrata (type CL80-S according to EN 459-1:2010 [51]). The mineralogical composition of the lime was determined by X-ray diffraction (XRD) with a Bruker AXS D8 Discover powder diffractometer (Bruker AXS GmbH, Karlsruhe, Germany), using CuKa radiation (λ = 1.5406 Å). The diffractogram was obtained in the interval of 5° to 75° 2θ, with a step of 0.05° and a time per step of 1 s. The results showed that the lime was composed of portlandite (Ca(OH)2) with a small amount of calcite (CaCO3), owing to a slight carbonation (Figure 1a). The particle size distribution of the air lime can provide an idea of the degree of agglomeration of the lime particles, which, in turn, can help to understand and interpret the rheological behaviour of the mortars and pastes. The average particle size curve of the lime used is presented in Figure 1b and was obtained by laser diffraction using a Malvern Mastersizer 2000 particle size analyser (Malvern Panalytical Ltd., Malvern, UK). As can be seen, the majority of lime particles lie between 1–10 µm, and a significant part are between 10–300 µm, with the latter belonging to the larger agglomerates or clusters of Ca(OH)2 particles. According to Rodriguez-Navarro et al. [52], these particles are keen to agglomerate upon drying (which occurs during the industrial manufacturing process of hydrated lime), with only a part of it being reversible. Nevertheless, the dimensions obtained are within the reported particle sizes for commercial hydrated limes [28,52,53].
A siliceous sand mainly composed of quartz, as evidenced by the XRD pattern presented in Figure 2a, and with a 0/2 mm particle size (according to EN 13139:2002 [54]), as shown in Figure 2b, was used as aggregate.
The binder-to-aggregate ratio used in the formulation of the mortars was 1:2 (in volume). Several water contents (water/binder ratios) were used, as explained in Section 3.1.
The mortars were produced based on the procedures established in EN 1015-2:1998 [55] and EN 196-1:2005 [56] unless otherwise stated, since in Section 3.2, different mixing times and sequences were used in order to understand the influence of these variables on the rheological behaviour. The standard mixing procedure was as follows: (i) water and lime were added into the bowl of a mechanical paddle mixer and mixed for 30 s at low speed (140 ± 5 rpm); (ii) without stopping the mixer, the fine aggregate was added steadily over a period of 30 s and the material was mixed for another 30 s at high speed (285 ± 5 rpm); (iii) the mixer was paused for 75 s to scrap the mortar adhered to the borders of the bowl to its centre and to allow the mix to stand; (iv) finally, the mortar was mixed at high speed for 60 s. The pastes were produced using the same mixing sequence as the mortars but without adding the aggregate.
After production, a sample of the material was taken to determine its fluidity, in the case of pastes, or its consistency in the case of mortars. Another sample was taken for the rheometric test. The remaining mortar was used to mould specimens with the standard dimensions (160 × 40 × 40 mm3), according to EN 196-1:2005 [56]. These specimens were left to cure under controlled conditions of temperature and relative humidity (20 ± 5 °C and 60 ± 10% RH) and were de-moulded after 7 days of curing. The specimens were tested after 14, 28, 90 and 180 days of curing.
Throughout the paper, the designation ‘LM’ is attributed to lime mortars and ‘LP’ to lime pastes.

2.2. Fresh State Characterisation

2.2.1. Consistency and Fluidity

The consistency of the mortars and the fluidity of the pastes were determined to complement the information regarding the flow behaviour of these materials.
The consistency of the mortars was evaluated by the flow table test and by the plunger penetration test, according to the procedures established in EN 1015-3:1999 [57] and EN 1015-4:1998 [58], respectively. In the flow table test, the mortar spread diameter (flow value) was measured after jolting the flow table 15 times, whereas in the plunger penetration test, the penetration of a plunger, which was allowed to fall through a height of 100 mm onto a vessel filled with fresh mortar, was measured on a scale from 0 to 70 mm. A higher plunger penetration depth corresponds to a higher fluidity.
For the pastes, the fluidity was evaluated by measuring the time it took for 1 L of paste to pass through a cone filled with 1.7 L of paste. In order to do that, a metallic cone, as specified by EN 445:2008 [59], was used.

2.2.2. Particle Size Determination

The particle size of the lime suspensions was determined by laser diffraction using a Malvern Mastersizer 2000 particle size analyser (Malvern Panalytical Ltd., Malvern, UK). The analysed suspensions were obtained by passing the respective mortars through a sieve with a mesh of 100 µm in order to remove the aggregate after mixing.
The suspensions were later mounted on slides and examined under a Leica S6 D stereo microscope (Leica, Wetzlar, Germany) connected to a Motic Moticam 3+ digital camera (Motic, Barcelona, Spain) in order to obtain images of the lime agglomerates.

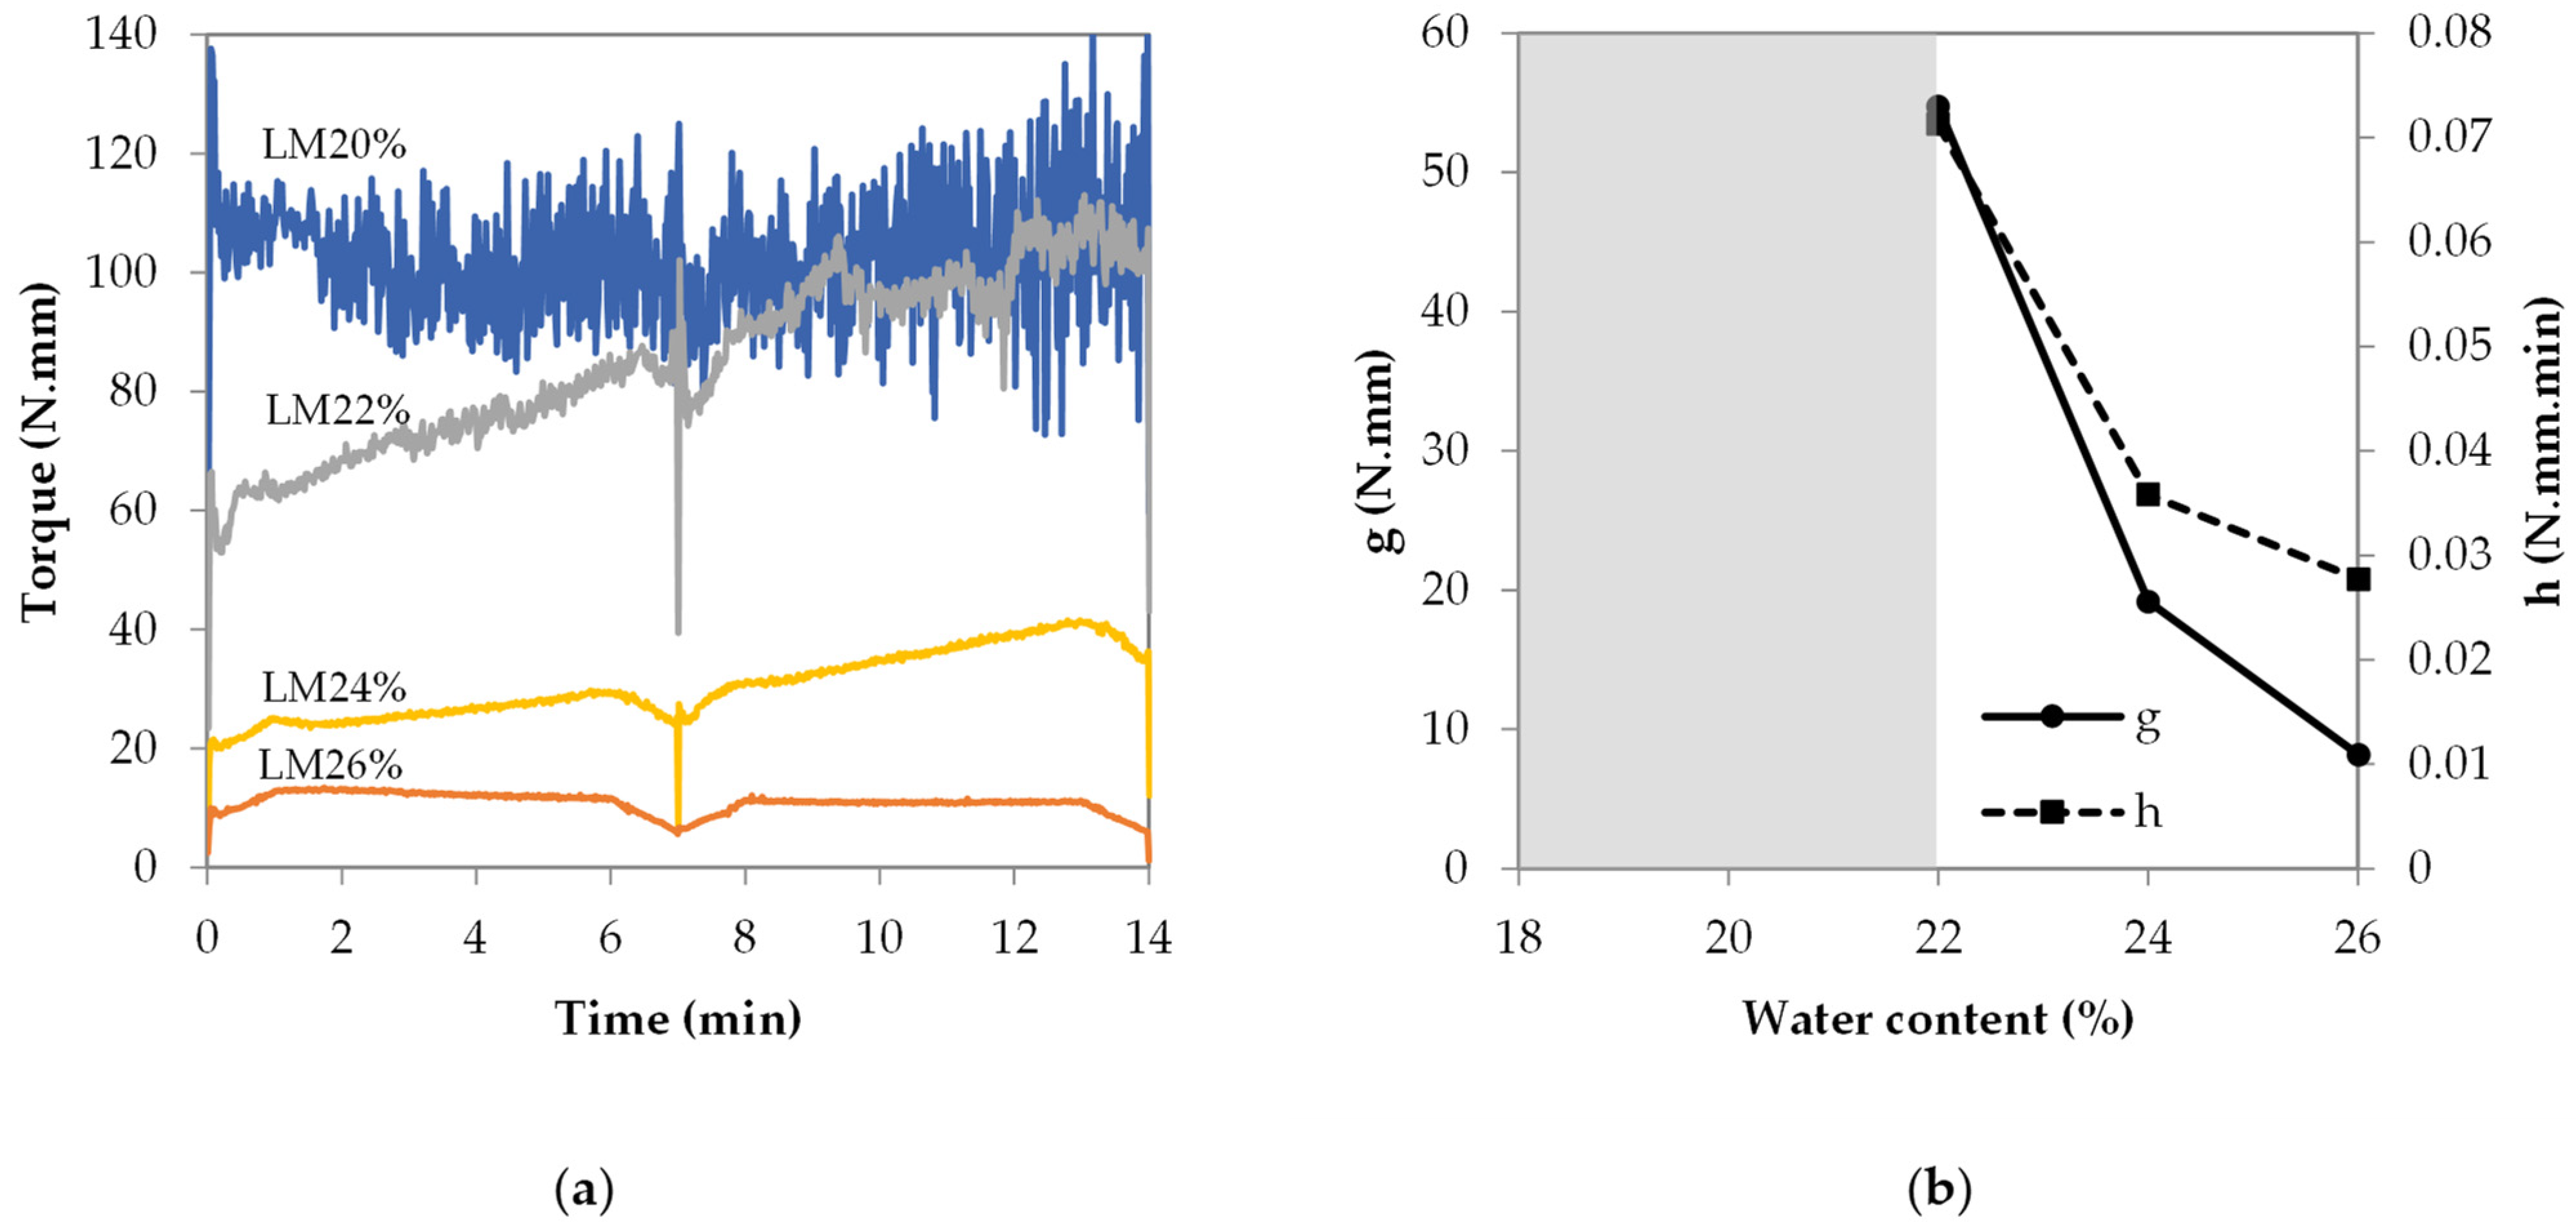
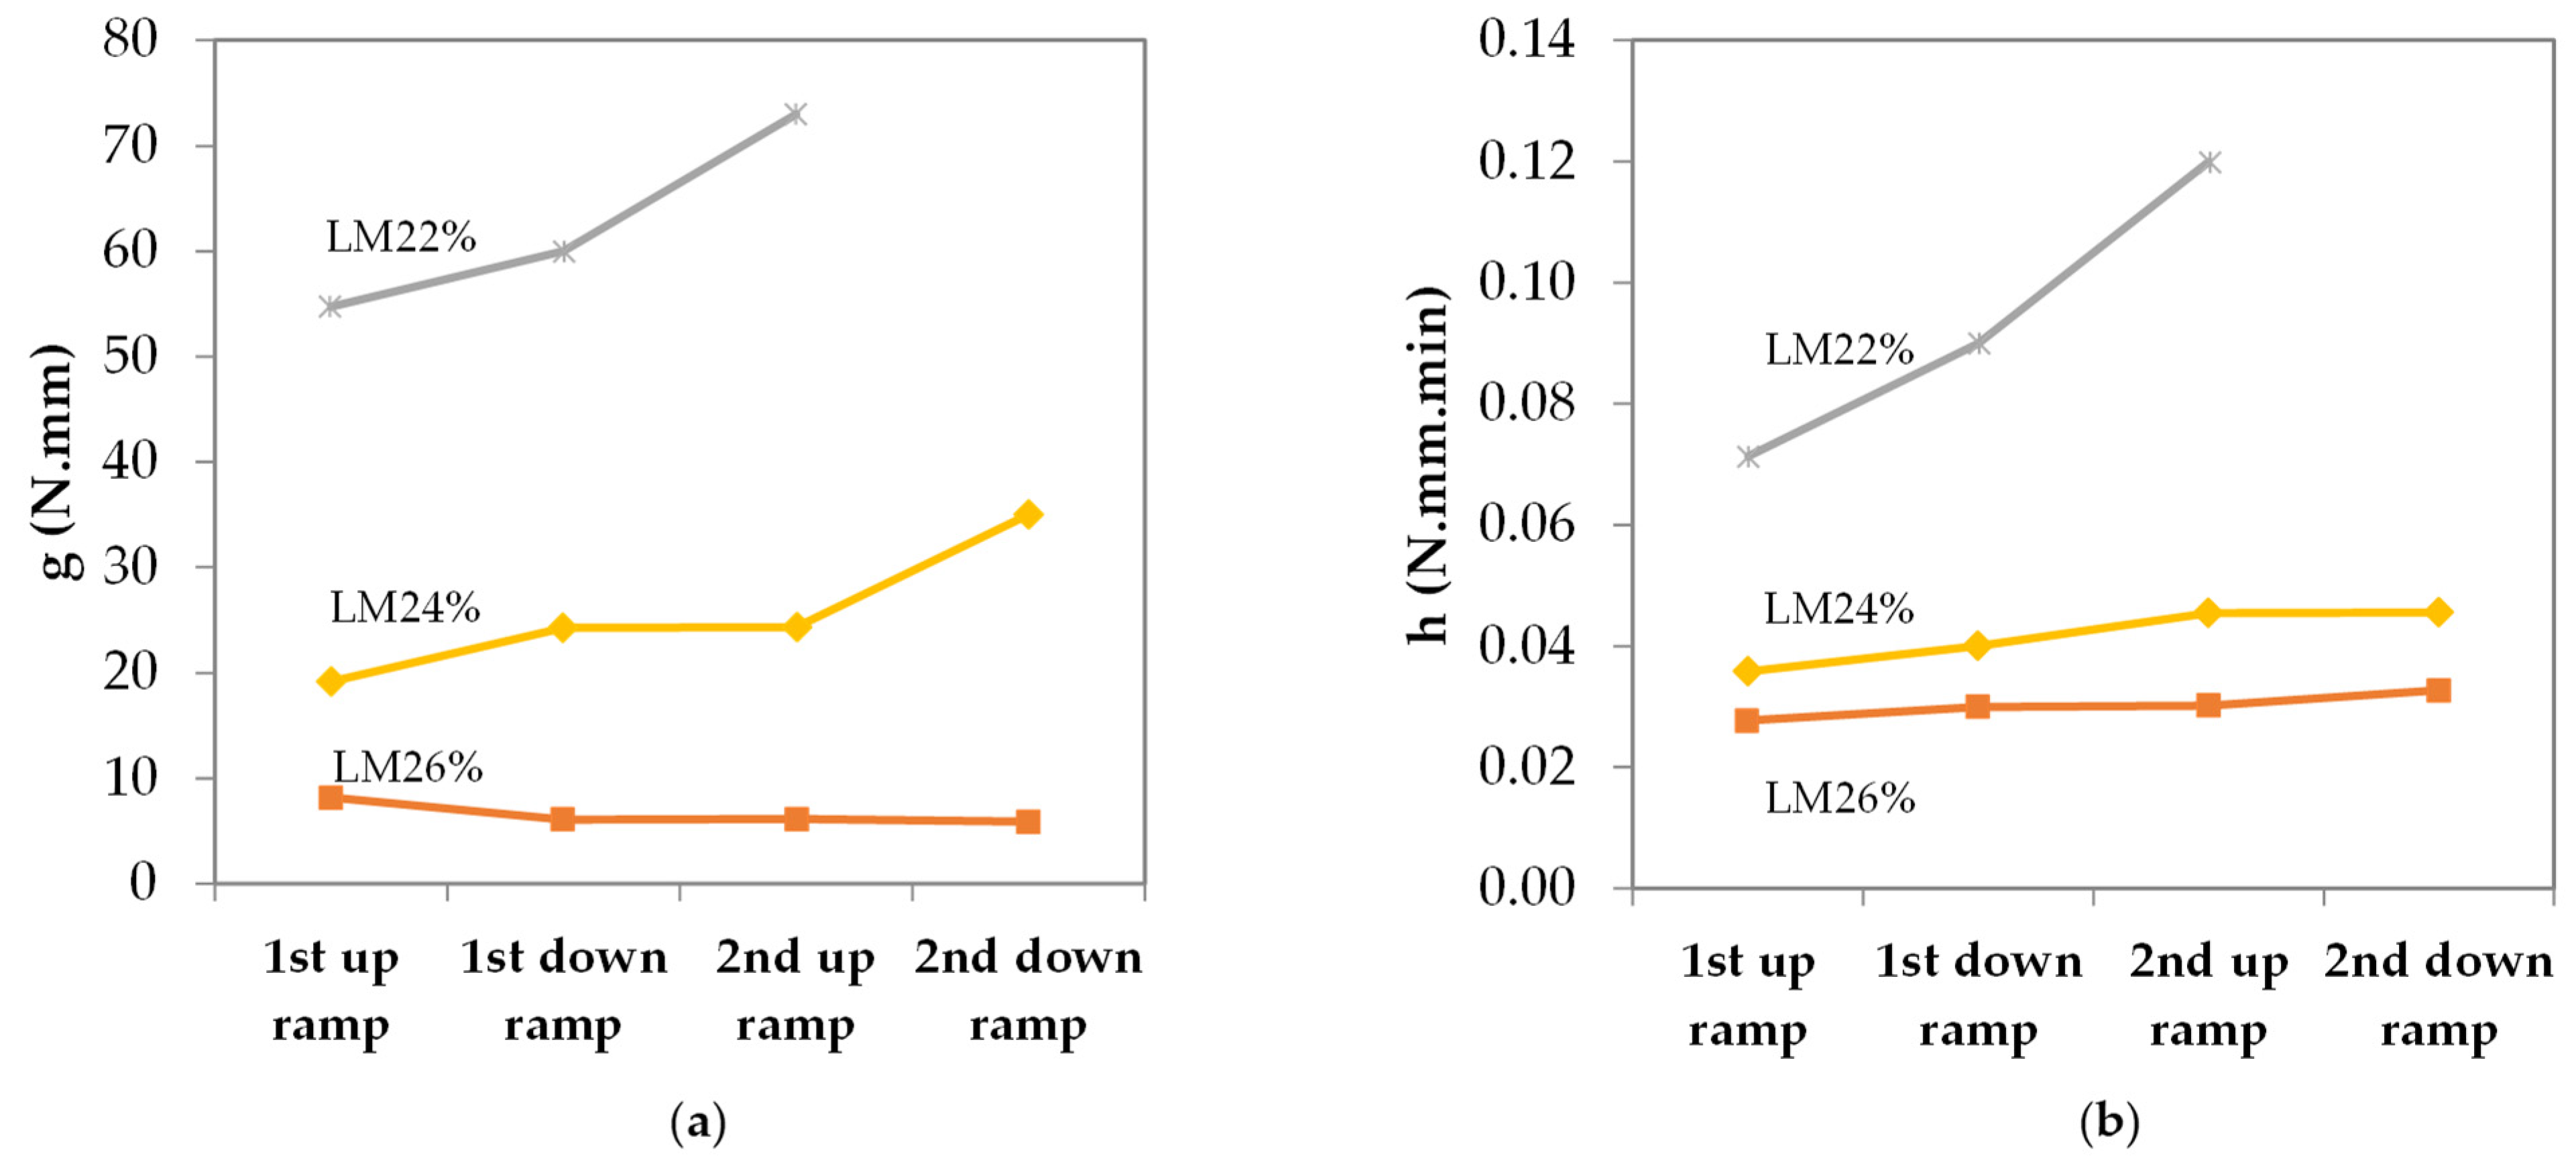
2.2.3. Rheological Measurements

The most used rheological model to describe the flow behaviour of fresh mortars and pastes is the Bingham model, where the material can support shear stresses ( τ , in Pa) not exceeding a threshold value (yield stress— τ 0 ) without flowing. However, for higher stresses than τ 0 , the material shows a linear relationship between the shear stress and shear rate ( γ ˙ , in s−1), characterised by the plastic viscosity (µ, in Pa·s):
τ = τ 0 + μ γ ˙
The yield stress results from the forces of attraction between the molecules or the solid particles in a suspension. Hence, the flow is observed when the applied stress is sufficient to break down the particle networks [12,13,60].
The rheological behaviour of fresh mortars and pastes can then be defined by two parameters, yield stress and plastic viscosity, which can be determined using a rheometer.
In this work, a rotational rheometer suitable for mortars was used (Viskomat NT, from Schleibinger Geräte, Buchbach, Germany). For this type of equipment, the sample is in a cylindrical container that rotates around a stationary paddle at a designated rotation speed (N, in rpm). As the sample flows around the paddle, the shear resistance generates a torque (T, in N·mm) that is continuously measured during the test [61]. Based on the data acquired by the rheometer, and if the Bingham model applies, Equation (1) can be expressed as:
T = g + h N   ,
where g (N·mm) and h (N·mm·min) are the characteristic parameters related to yield stress and plastic viscosity, respectively. These data allow for plotting the torque vs. time curves and torque vs. rotation speed curves (flow curves). From the latter, the parameters g (from the interception of the flow curve with the y-axis) and h (the slope of the flow curve) were determined by linear regression since the typical behaviour of a Bingham fluid was verified.
A ‘dwell’ speed profile was used that consisted of increasing the rotation speed from 0 to 160 rpm in 1 min (up ramp), keeping it constant for 5 min and then decreasing it from 160 to 0 rpm in 1 min (down ramp). This was repeated two times, providing a total of 14 min of testing time. The same amount of mortar or paste was used in all the rheological measurements, and the material was not re-used for any other tests. The scraper was not utilised.
The reproducibility of these tests proved to be quite good. Hence, only one test per mortar formulation will be presented.

2.2.4. Hardened State Characterisation

The impact of water content and mixing conditions on the hardened state properties of lime mortars was evaluated based on mechanical strength, carbonation depth and porosity.
The mechanical characterisation included flexural and compressive strength tests, according to EN 1015-11:1999 [62], on at least 3 specimens of each mortar formulation. After the flexural test, the resulting freshly broken surfaces of the half prisms were sprayed with a phenolphthalein solution in order to determine the carbonation depth.
The determination of open porosity was performed according to RILEM Test I.1 (1980) [63] on at least two half specimens of each mortar formulation. The porosity and pore size were also determined for mortar samples with 180 days of curing by mercury intrusion porosimetry (MIP), using a Micromeritics Autopore IV 9500 porosimeter (Micromeritics Instruments Corporation, Norcross, GA, USA) and a pressure range between 0.0015 and 207 MPa.

3. Fresh State Properties

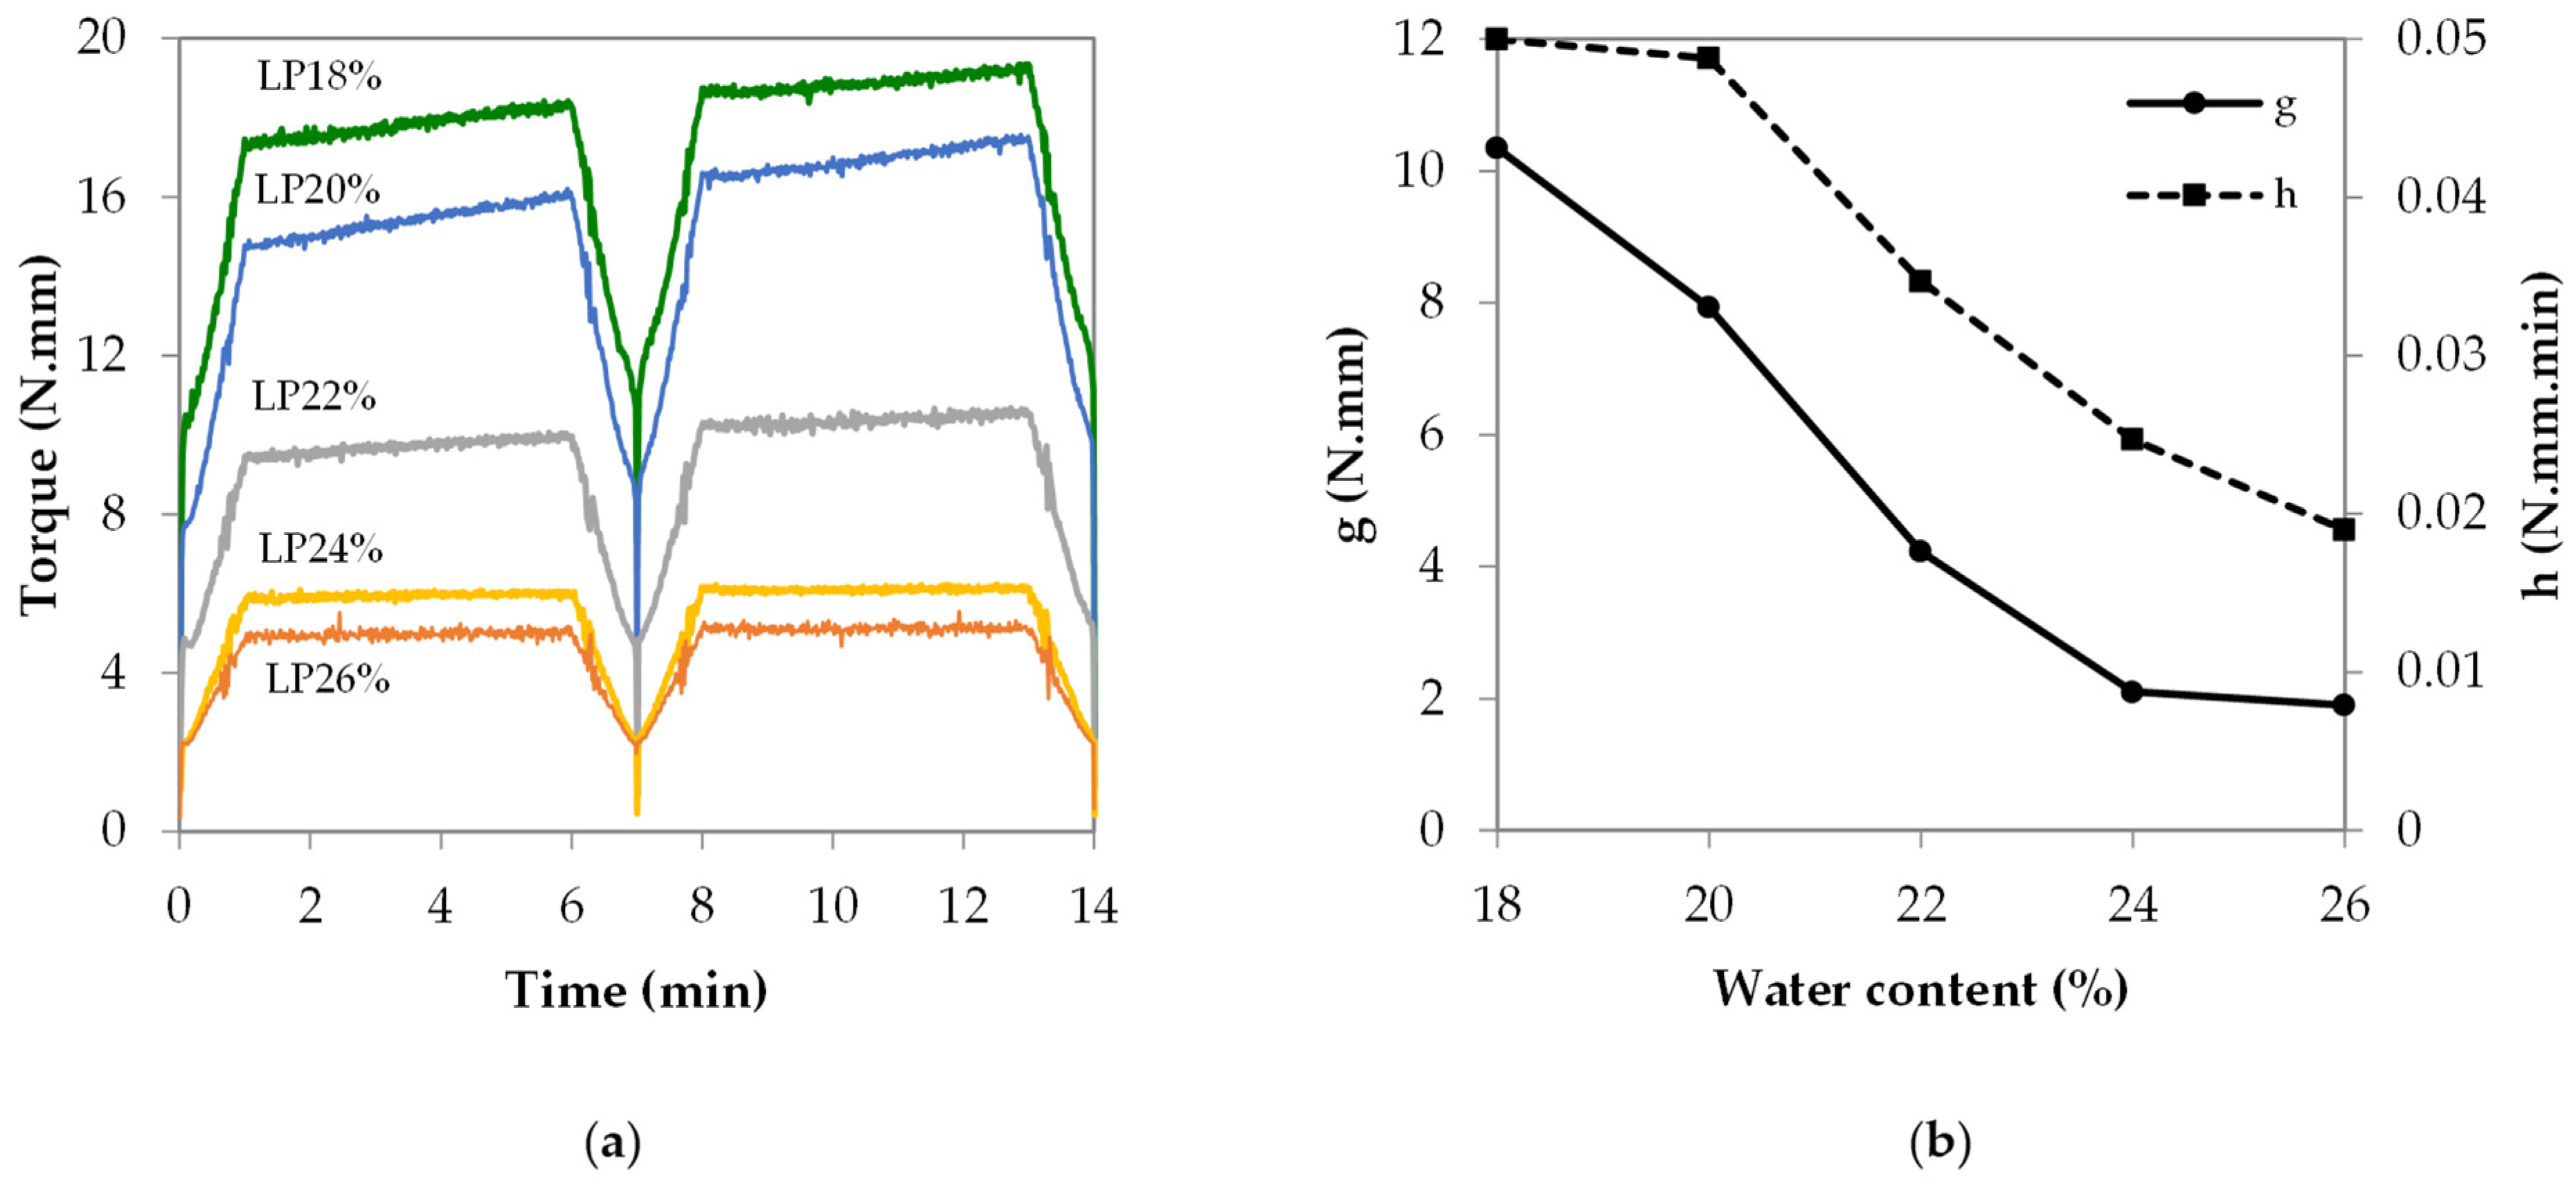
3.1. Influence of Water Content

The influence of the water content was studied using air lime mortars and pastes prepared with water contents between 18% and 26%.
Table 1 presents the corresponding designations and properties evaluated on the fresh state of the studied lime-based materials, where it is possible to observe a progressive increase in the flow values and penetration depth for mortars and a progressive decrease in the flow time for pastes with rising water content, as it would be expected, given the fluidity increase.
Figure 3a shows the torque vs. time curves for the studied lime mortars with different water contents, from which it is possible to conclude that water contents higher than 22% but below 26% were needed to obtain valid rheological measurements. Indeed, the mortar with the lowest water content, LM18%, proved to be excessively stiff for the rheological measurement, exceeding the maximum allowable torque value of the rheometer (300 N·mm), which was the reason why the resulting torque vs. time curve is not presented in Figure 3a. Mortar LM20% was so stiff and plastic that it did not flow back after being deformed by the paddle, leading to an intermittent loss of contact between the mortar and the paddle throughout the test, which was responsible for the wide variation in torque values. This behaviour is in agreement with what has been reported in the literature [46,49]. In turn, mortar LM22% was initially rather fluid; however, it progressively became stiffer due to a continuous breakdown of lime agglomerates during the test since water evaporation during the test was very reduced (always below 1%). With 24% water, mortar LM24% remained homogenous throughout the entire rheological measurement without displaying problems of excessive stiffness or segregation. However, an increase in water content of 2% (mortar LM26%) caused artificially low torque and plastic viscosity values due to the occurrence of segregation during the test. Indeed, by the end of the test, almost all the aggregate was resting at the bottom of the vessel. This behaviour was later confirmed by the similarity of the torque vs. time curve of mortar LM26% to those obtained for lime pastes.
From the curves depicted in Figure 3a, it can be concluded that lime mortars present a typical increase in torque as the rotation speed increases as well as its decrease at dwell times [49,64]. A steady decrease in torque values (reduction in flow resistance) with increasing water content is also evident. Figure 3b shows the corresponding yield stress (g) and plastic viscosity (h) values taken from the first up-ramp of the test. It was not possible to obtain these parameters for the mortars with water contents below 22% due to the high stiffness of these mortars (thus, the grey area in the graph), as stated above. Nevertheless, a sharp decrease in both parameters can be seen with rising water content, as expected, given the higher amount of water available to fluidify the mixes.
Throughout the test, an increase in torque values was also noticeable, particularly in mortars LM22% and LM24%, which was similar to that observed by Paiva et al. [7] and Seabra et al. [46]. According to these authors, this initially occurs due to a better homogenisation of the mortar paste and afterwards due to a gradual breakdown of the lime agglomerates by the agitation promoted by the test. Since lime particles are very small, they have a strong tendency to agglomerate due to interparticle attractive forces (predominantly of van der Waals origin) [14,52]. As such, their breakdown increases the specific surface area required to be covered by water, which in turn, reduces the water available for lubricating the mix, thus leading to an increase in torque, yield stress and plastic viscosity with time (thickening of the lime suspension) [7,11,36,46]. From here, it follows that the higher the water content of the mix is, the longer it takes for the free water to reduce and for thickening to occur.
The abovementioned yield stress (g parameter) and plastic viscosity (h parameter) values increased over time with continued shearing, as can be seen in Figure 4 for the mortars LM22% and LM24%. The latter is indicative of a time-dependent behaviour, namely, rheopexy. Rodriguez-Navarro et al. [52] correlate a greater viscosity with an abundance of submicrometer calcium hydroxide particles, given that these have a greater capacity to adsorb water and to be more easily displaced in relation to one another without being immediately segregated. This increase in viscosity (after prolonged shearing) was also reported by Ruiz-Agudo and Rodriguez-Navarro [37] and by Vávrová and Kotlík [65], with the latter authors offering a similar explanation for this behaviour. On the contrary, mortar LM26% showed a decrease in the g values and a gentler increase in the h values over time due to the occurrence of segregation.
From the torque vs. time curves (Figure 5a) of the studied lime pastes with different water contents, it can be seen that they displayed torque values similar to those of the most fluid mortar (LM26%, Figure 3a). The increase in torque observed in the mortars was not as evident in the pastes due to the absence of the aggregate that intensifies the breakdown of lime agglomerates. Additionally, according to Seabra et al. [11], the aggregate can lead to an increase in torque values because of its higher friction when flowing through the paddle. Nevertheless, a slight increase in torque values was observed for the pastes with water contents lower or equal to 20% during the test. In turn, the pastes with water contents higher or equal to 24% presented segregation, where the larger lime agglomerates tended to migrate to the bottom of the vessel due to the excessive water content. More so, a larger difference was verified between the pastes LP24% and LP22% than between the pastes LP24% and LP26%, despite the difference in water content being the same.
The absence of a pronounced thickening allowed the computation of g and h values for all pastes based on the respective torque vs. rotation speed or flow curves (not shown). These are presented as a function of water content in Figure 5b. The values were taken from the first up-ramp, but over the duration of the test, these values showed only small variations. The increase in water content of lime pastes was responsible for a significant decrease in g and h values, as occurs in cement pastes and mortars [66].

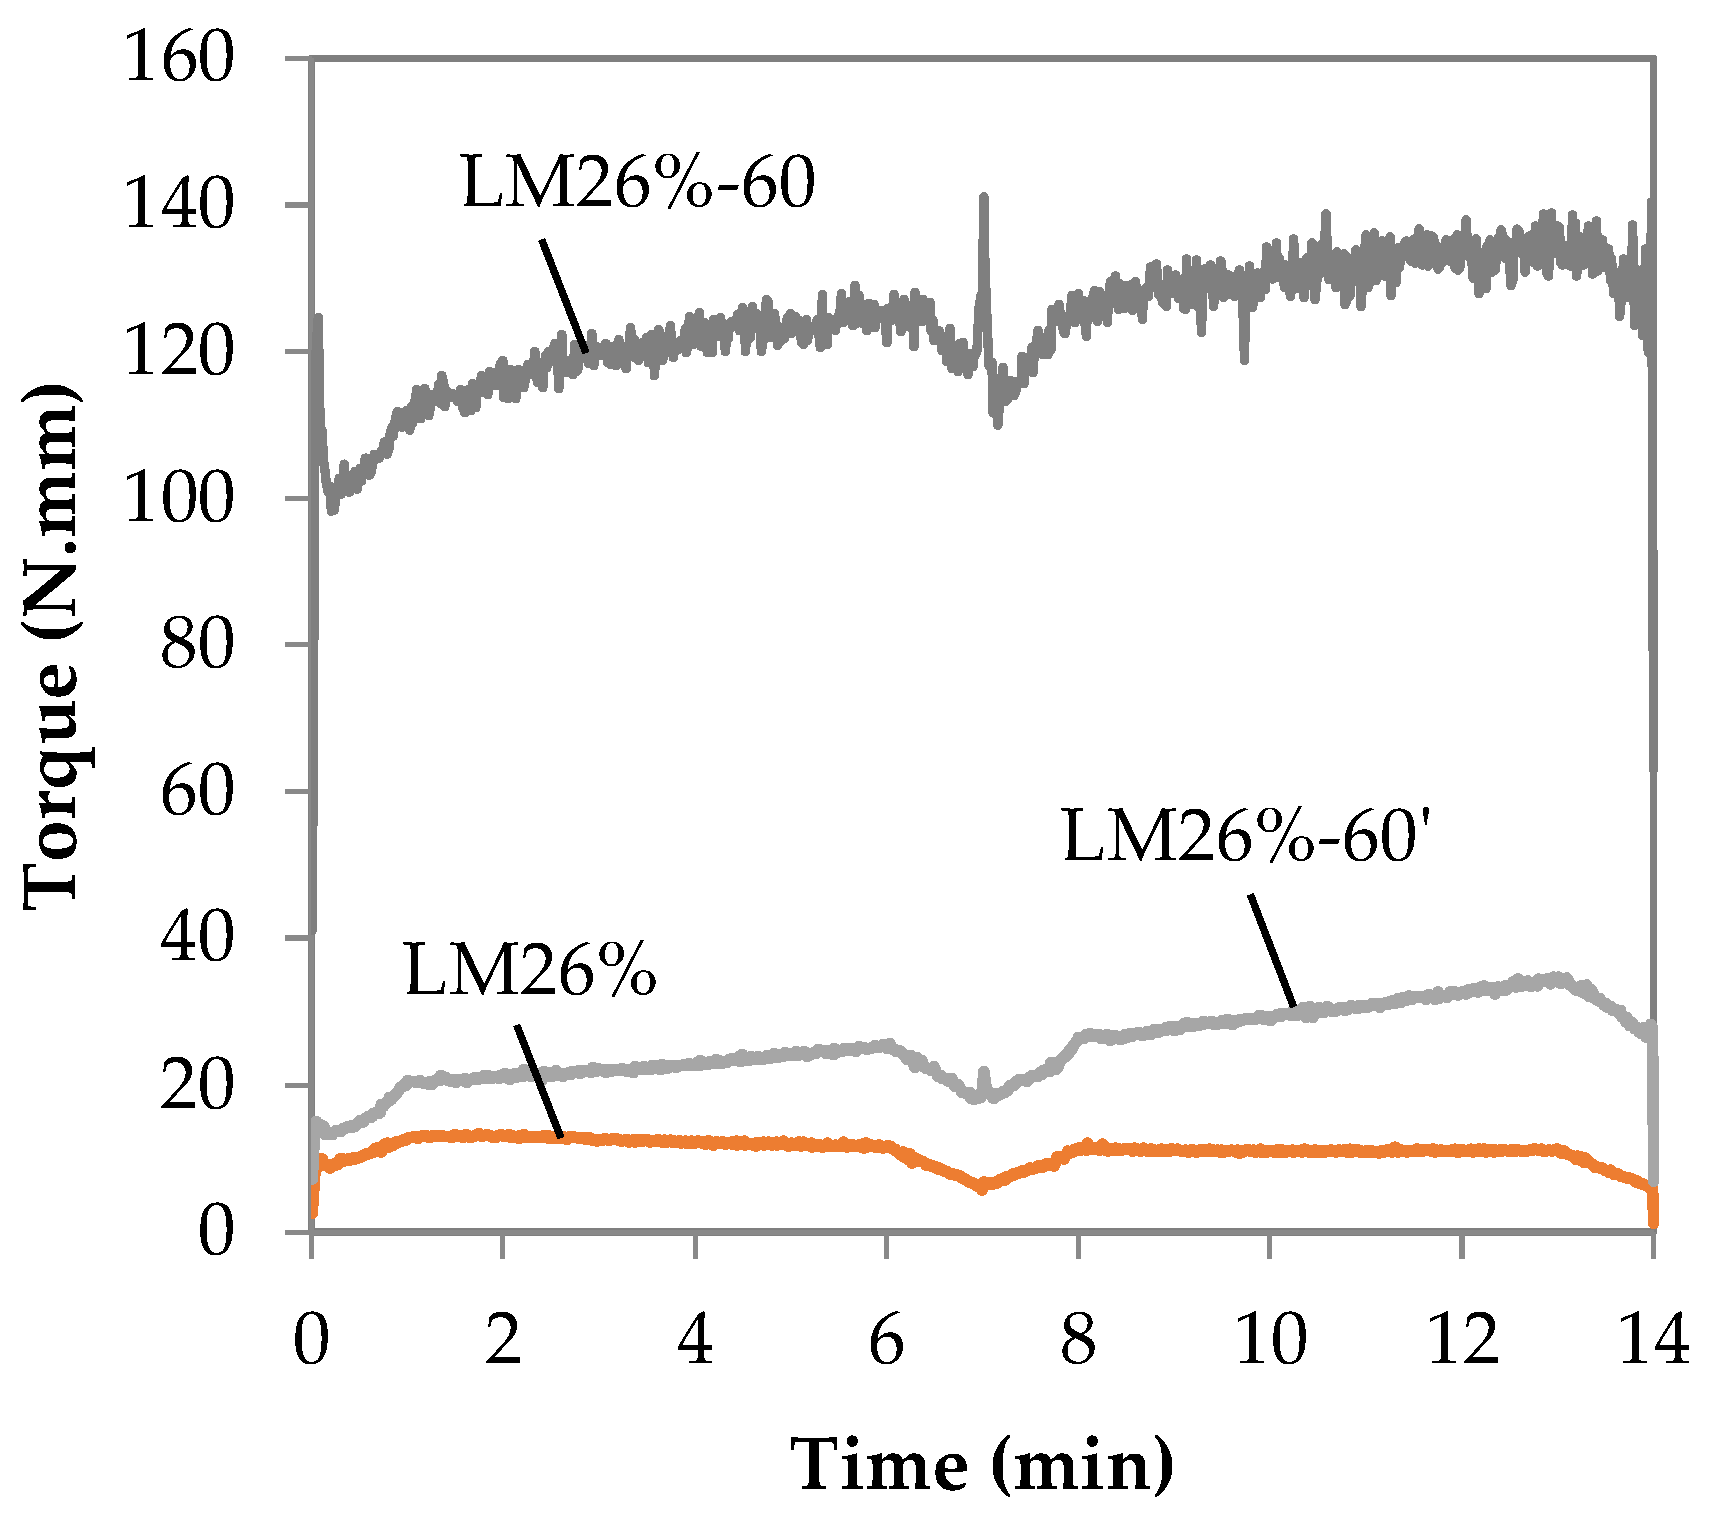
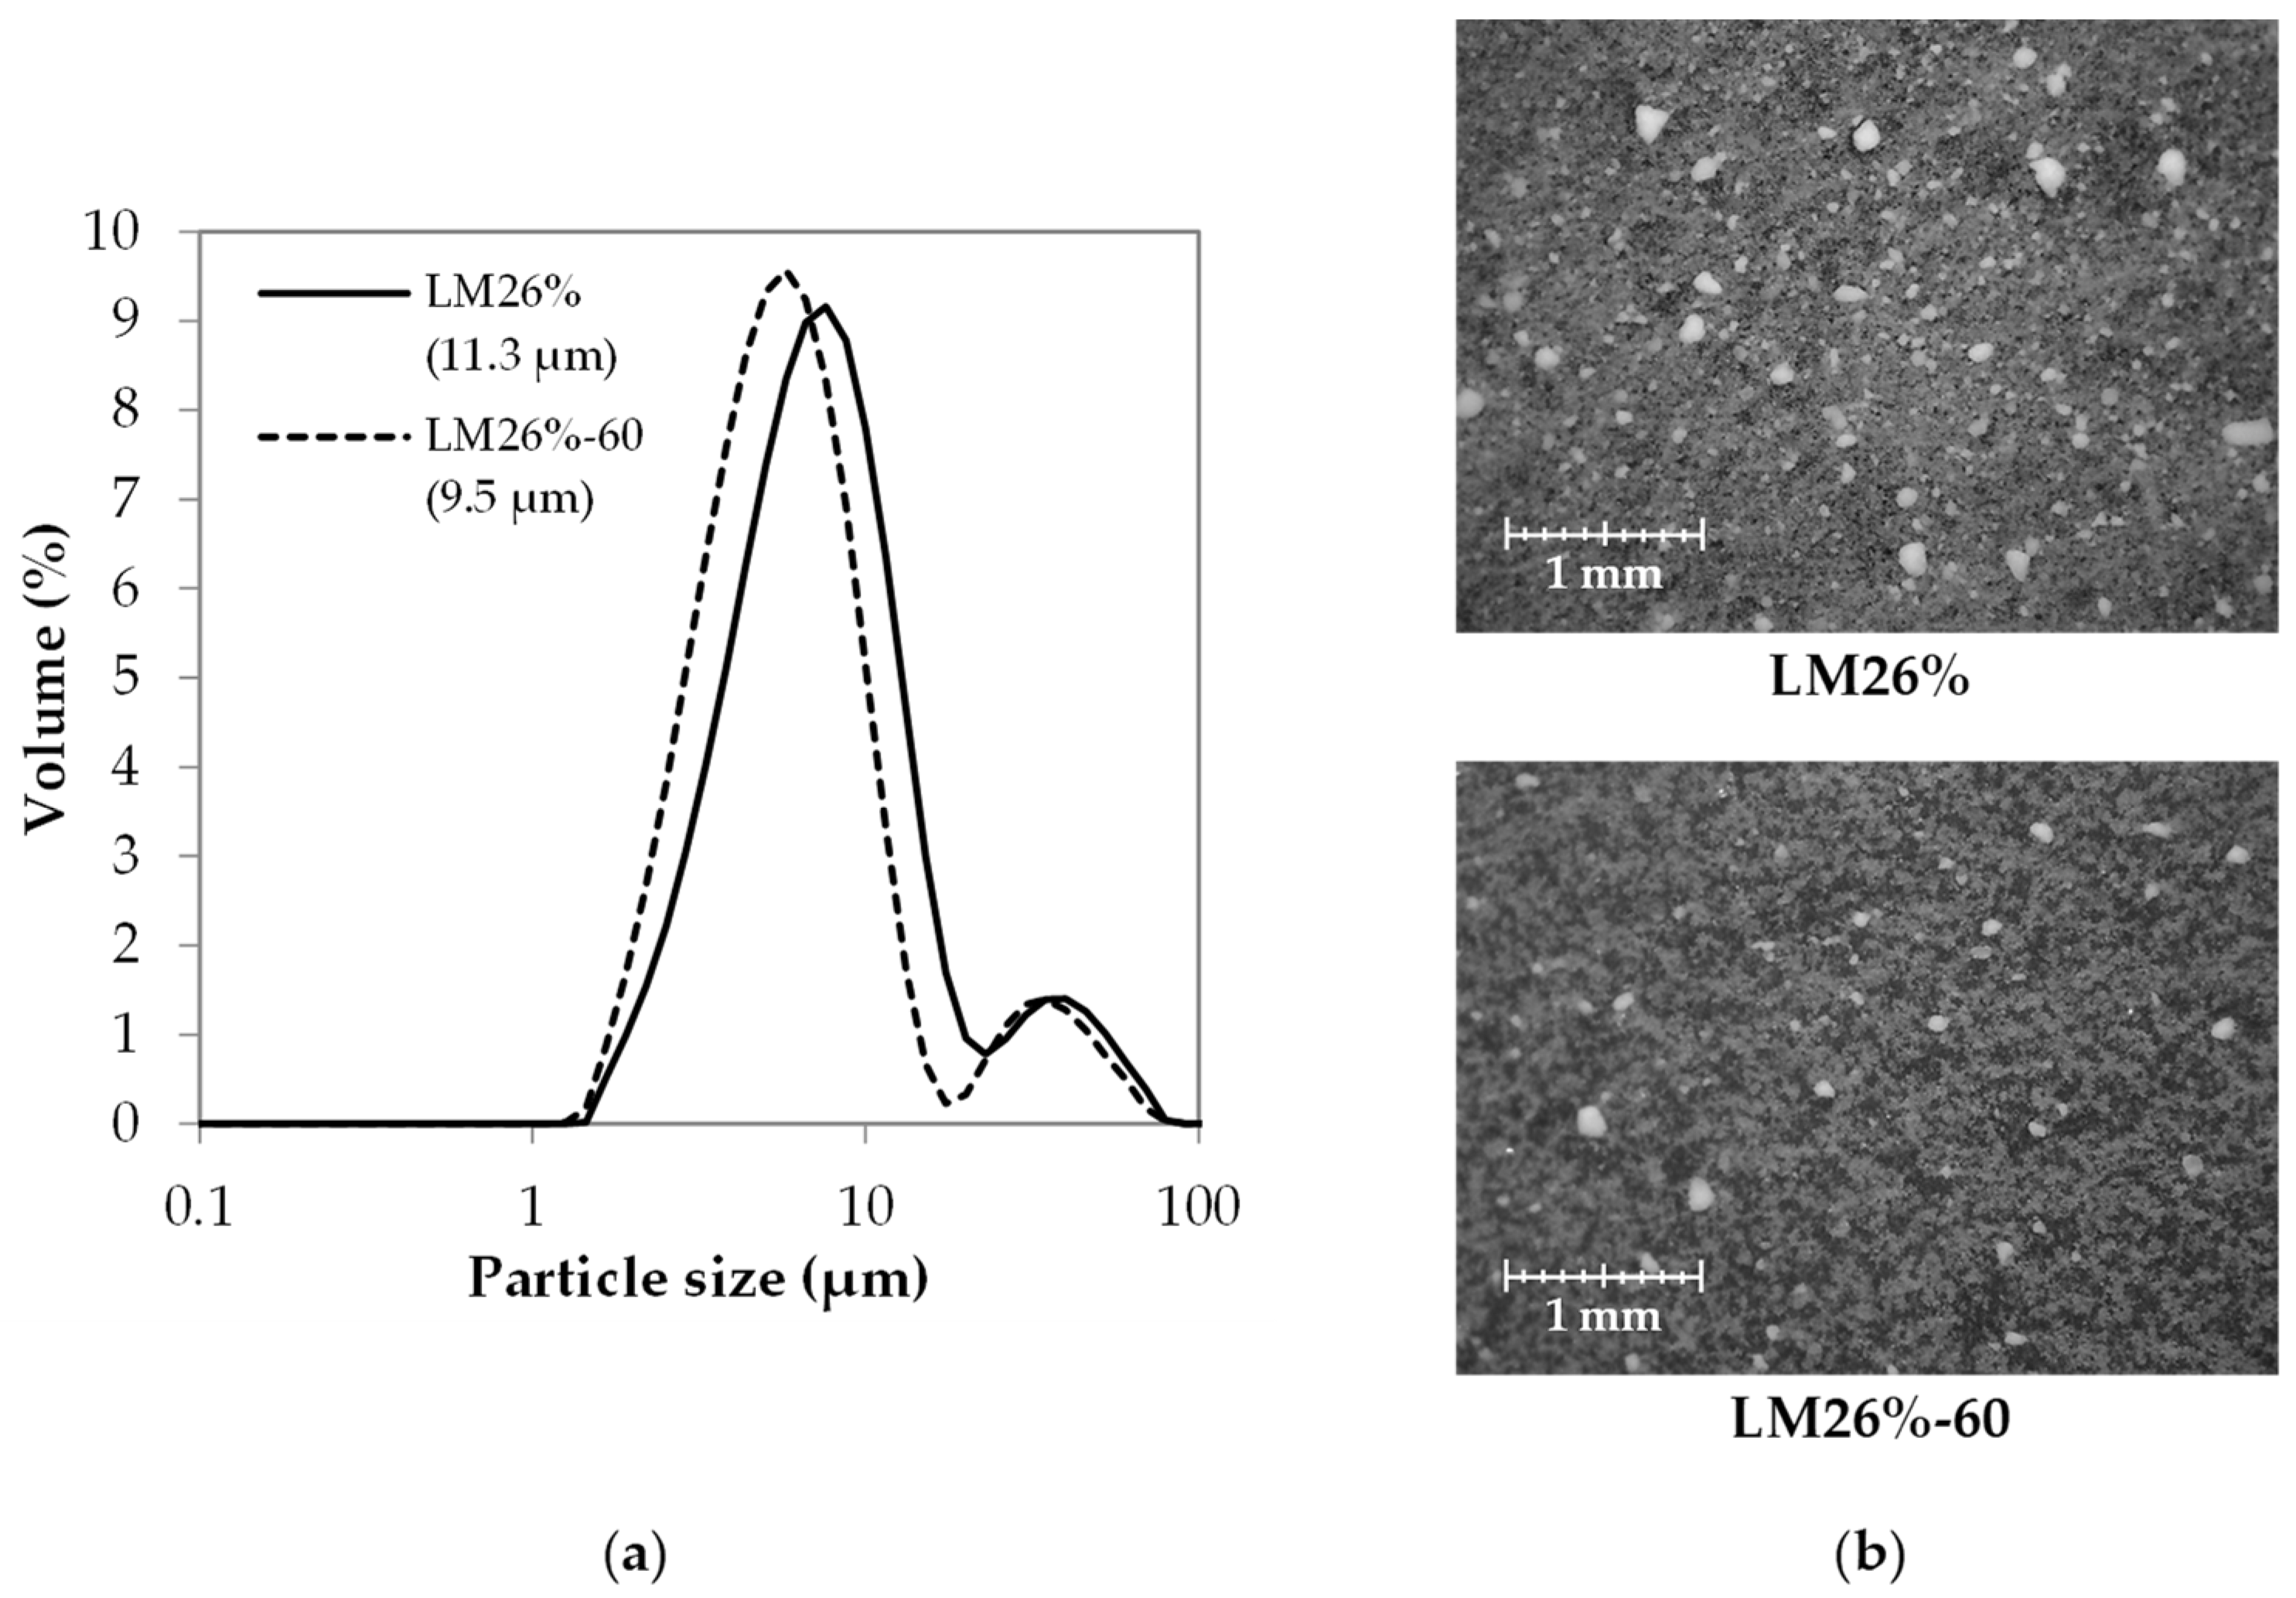
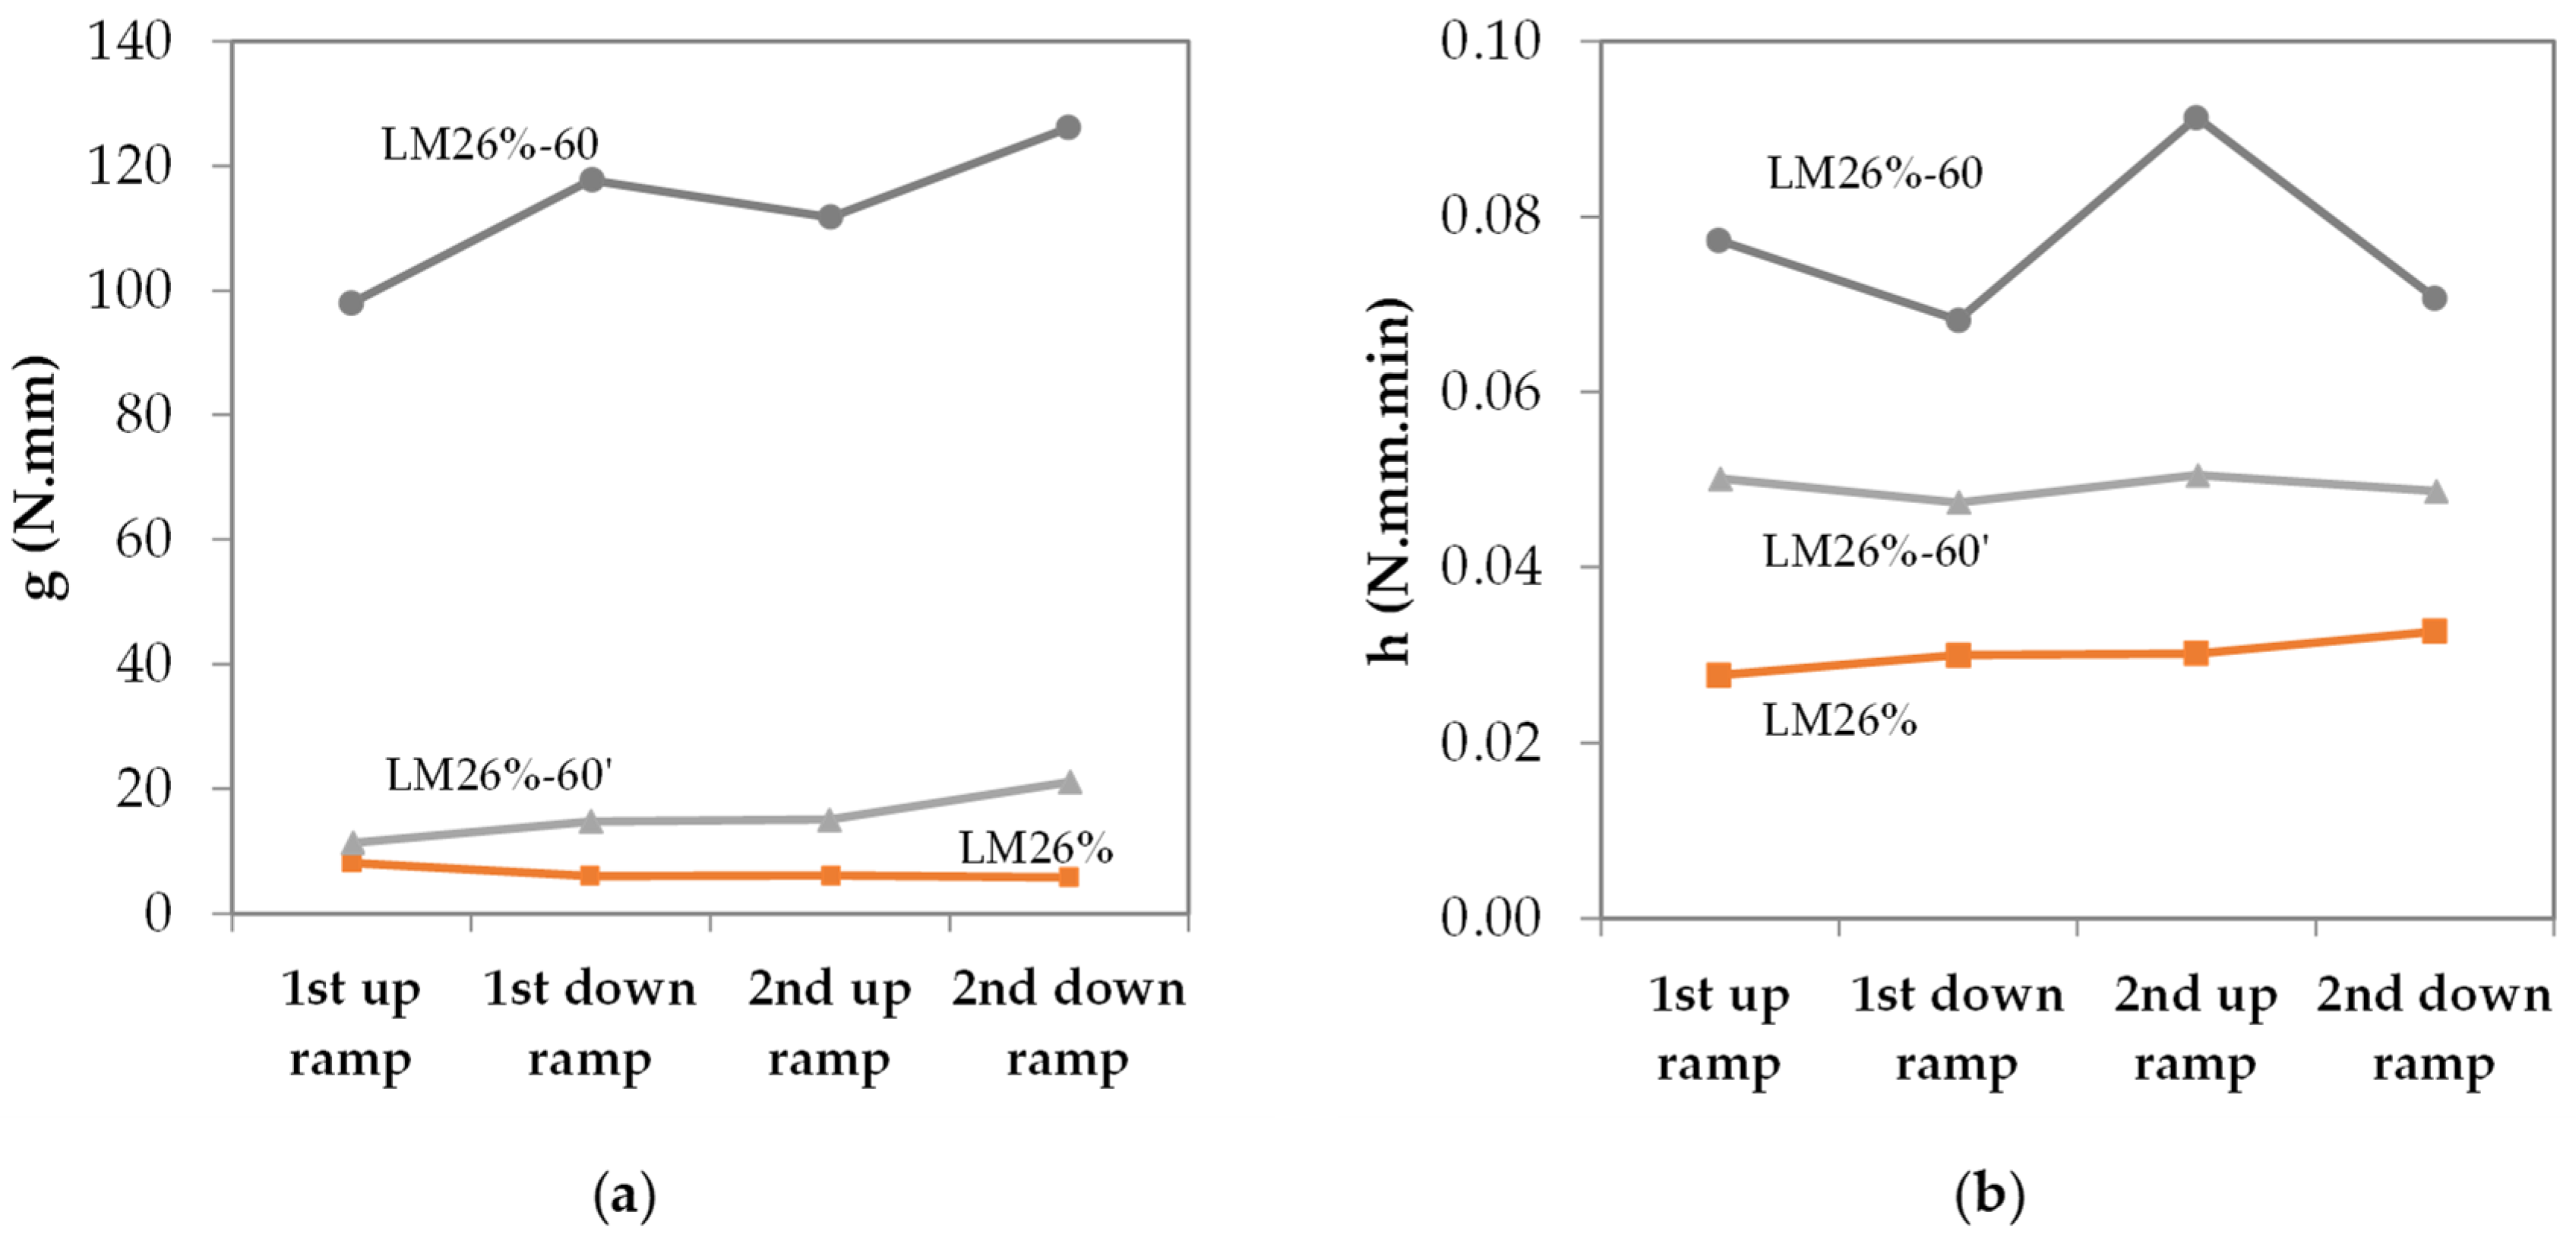
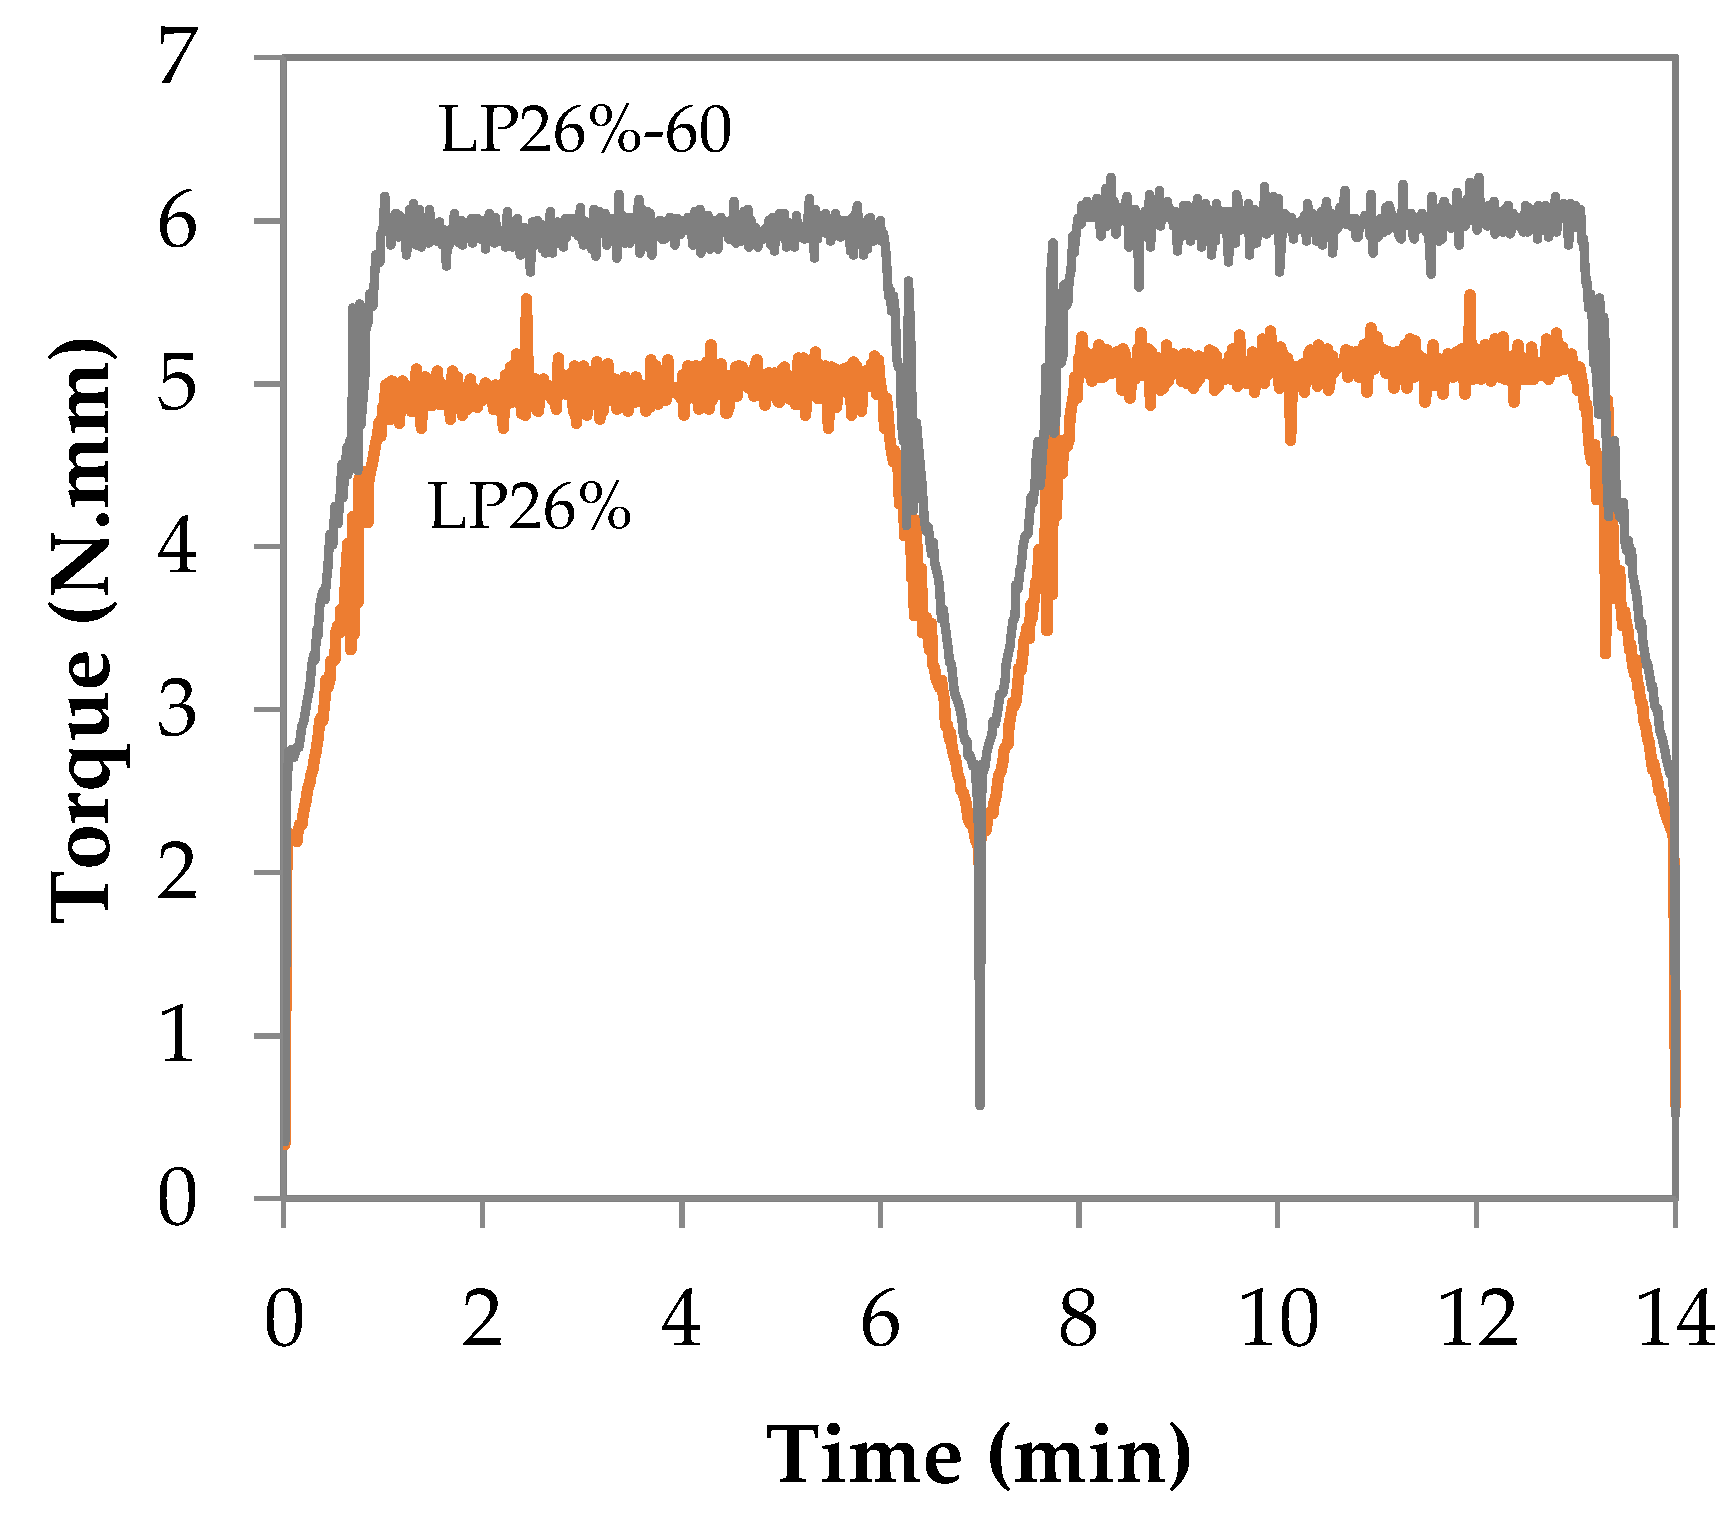
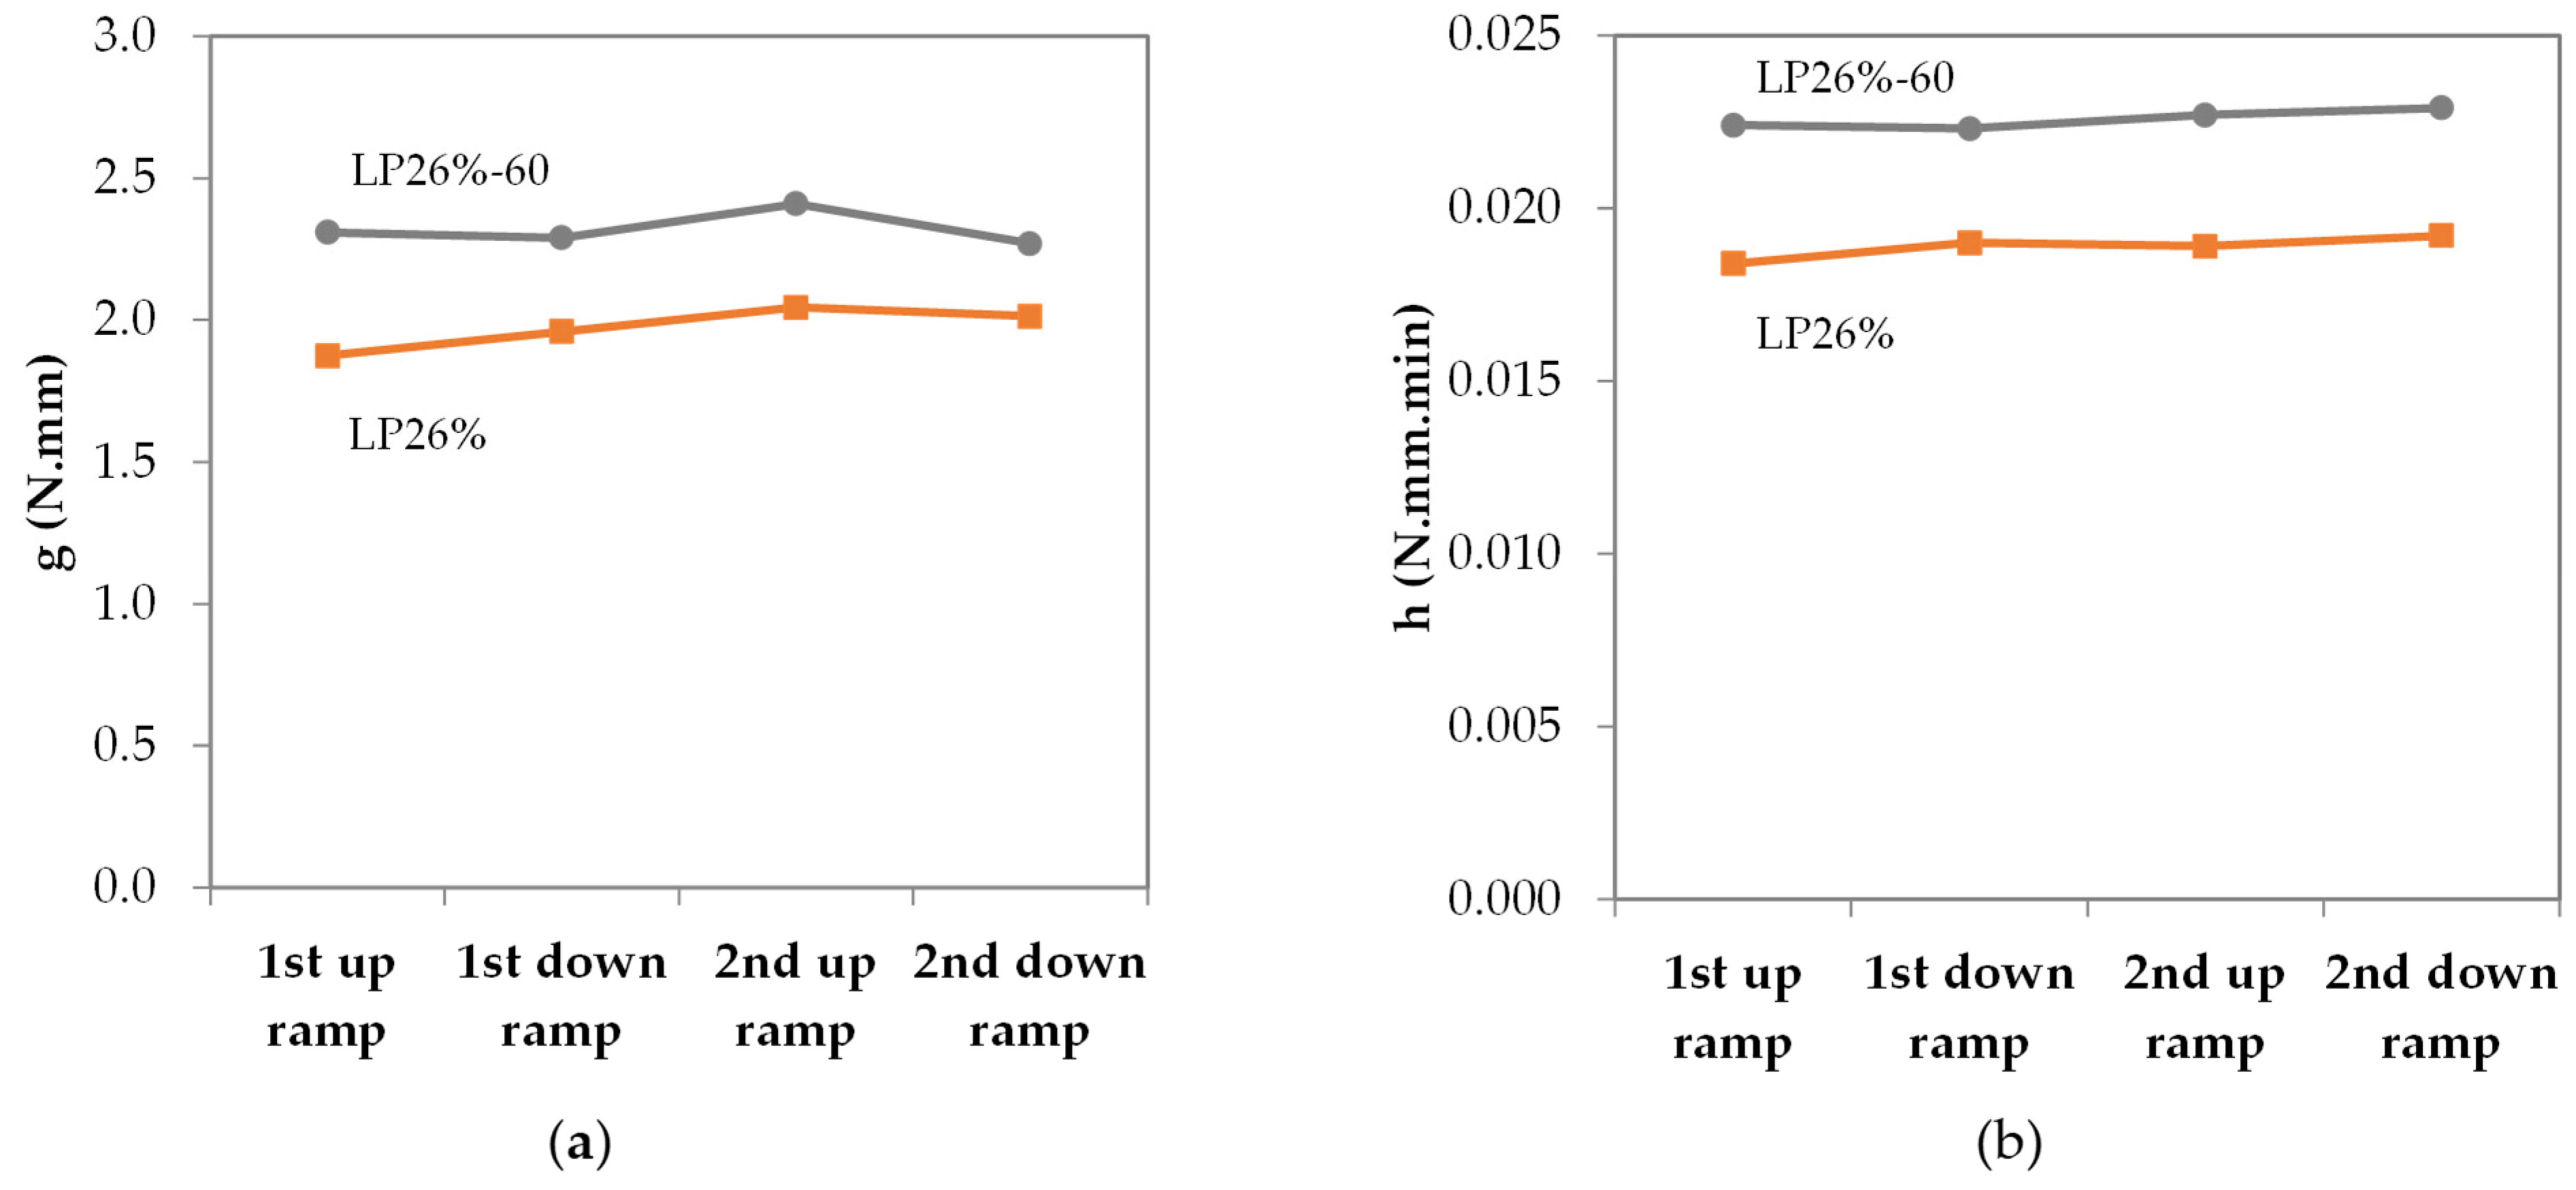
3.2. Influence of Mixing Conditions

The breakdown of lime agglomerates was found to be dependent on the agitation promoted by the rheological test. It is then important to understand if the agitation promoted by mixing has a similar effect on the agglomerate’s breakdown and what is the relevance of the aggregate to this process. These issues were addressed by studying the influence of the mixing conditions on the rheological behaviour of lime-based materials and included the analysis of two different variables: the mixing time and the sequence of addition of the constituents.
For the evaluation of the influence of the mixing time, the behaviour of a mortar mixed under standard conditions (based on EN 1015-2:1998 [55] and EN 196-1:2005 [56]) was compared to that of the same mortar with an additional mixing time of 60 min (at a low speed—140 ± 5 rpm), as shown in Table 2. Such a long additional mixing time was selected to make its effect (if any) more noticeable. Since a greater breakdown of lime agglomerates and a higher consumption of kneading water were expected due to the longer mixing time, a very fluid mortar would be necessary to achieve a valid rheological measurement. Mortar LM26% was chosen because of its high water content. The designation LM26%-60 was attributed to the mortar with a long mixing time. The same principle was applied to study the lime pastes (Table 2). In order to understand the influence of the aggregate on the breakdown of lime particles during mixing, an identical mortar to LM26%-60, in which the aggregate was only added at the end of the long mixing time, was also tested (Table 2). The resulting mortar was denominated LM26%-60′.
The fresh state properties of the mortars and pastes studied in this sub-chapter are presented in Table 3.
The torque vs. time curves obtained for the studied mortars are shown in Figure 6. As can be seen, the mixing time exerts an important influence on the fresh state properties of lime-based materials, with mortar LM26%-60 displaying a much lower fluidity (Table 3) and, thus, higher torque values than mortar LM26%. This is owing to the agitation promoted by mixing that gradually breaks the lime agglomerates down, as discussed in the previous section, leading to a gradual thickening of the material. This effect is clearly intensified by the addition of the aggregate due to its ‘ball-milling action’ [17]. As a consequence, by the time that mortar LM26%-60 was subjected to the rheological measurements, part of that thickening had already occurred—as denoted by the higher initial torque—and continued throughout the test since the torque continued to increase over time. Similarly worthy of note is the fact that the long mixing time allowed to perform a valid rheological measurement on a mortar with a final flow value of 160 ± 5 mm (mortar LM26%-60, Table 3), which could not be performed on a mortar with the same consistency but mixed during the standard time (mortar LM18%, Table 1). This means that the rate of the lime agglomerates breakdown tends to decrease over time, leading to the conclusion that mortar LM26%-60 has a more stable rheological behaviour than mortar LM18%.
The particle size measurements performed on the lime suspensions (Figure 7a) and the observations of these suspensions under a stereo microscope (Figure 7b) allowed corroborating the above observations. When comparing the size of the lime agglomerates after a standard mixing procedure and after a longer one with the aggregate, it can be seen that the latter leads to smaller agglomerates (the average particle size decreased from 11.3 to 9.5 µm, i.e., 16%), owing to a shift of the particle size distribution curve to smaller diameters. It should be stressed, however, that the use of the mesh to extract the aggregate also possibly removed the lime agglomerates with diameters greater than 100 µm (the lime had particles/agglomerates with dimensions up to 400 µm, as shown in Figure 1b), which is the reason why there are no particles/agglomerates above that size.
When comparing the mortars LM26%-60 and LM26%-60′ (Figure 6), it can be perceived that the latter presents much lower torque values. That is because the aggregate did not have enough time to induce a significant breakdown of lime agglomerates in mortar LM26%-60′, since it was added near the end of the mixing process (Table 2). Consequently, there was still a notable amount of water to lubricate the mix after the mixing process was completed, as corroborated by the high flow value obtained for this mortar (Table 3). Therefore, it can be concluded that the mixing time with the aggregate is the main factor responsible for the breakdown of lime agglomerates.
Regarding the values obtained for g and h, presented in Figure 8, a longer mixing time with the aggregate (mortar LM26%-60) caused a vast increase in the parameters related to yield stress and plastic viscosity, as occurred with the decreasing water content (Figure 4). In turn, the inclusion of the aggregate only after a long mixing time of the paste (mortar LM26%-60′) led only to a slight increase in both the h and g values when compared to those presented by mortar LM26% due to a small thickening of the lime suspension prior to the addition of the aggregate (Figure 8).
For the pastes, a longer mixing time (without the aggregate) was responsible for destroying some of the lime agglomerates, as denoted by the lower flow time and by the higher torque values obtained for paste LP26%-60 than for paste LP26% (Table 3 and Figure 9), confirming the previous assumptions. During the rheometric test, however, the destruction of lime agglomerates seemed insignificant, as there was no relevant increase in torque, yield stress or plastic viscosity over time (Figure 9 and Figure 10). These results reinforce the idea that the mixing time with the aggregate has a greater influence on the rheological properties than the mixing time without it.

4. Hardened State Properties

Table 4 summarizes the information regarding the composition and fresh state properties of the mortars tested in the hardened state in order to aid in the subsequent discussion of the results. Their hardened state properties are presented in Figure 11, Figure 12 and Figure 13. Their pore size distribution, determined with MIP, was used to complement the results (Figure 14 and Figure 15).

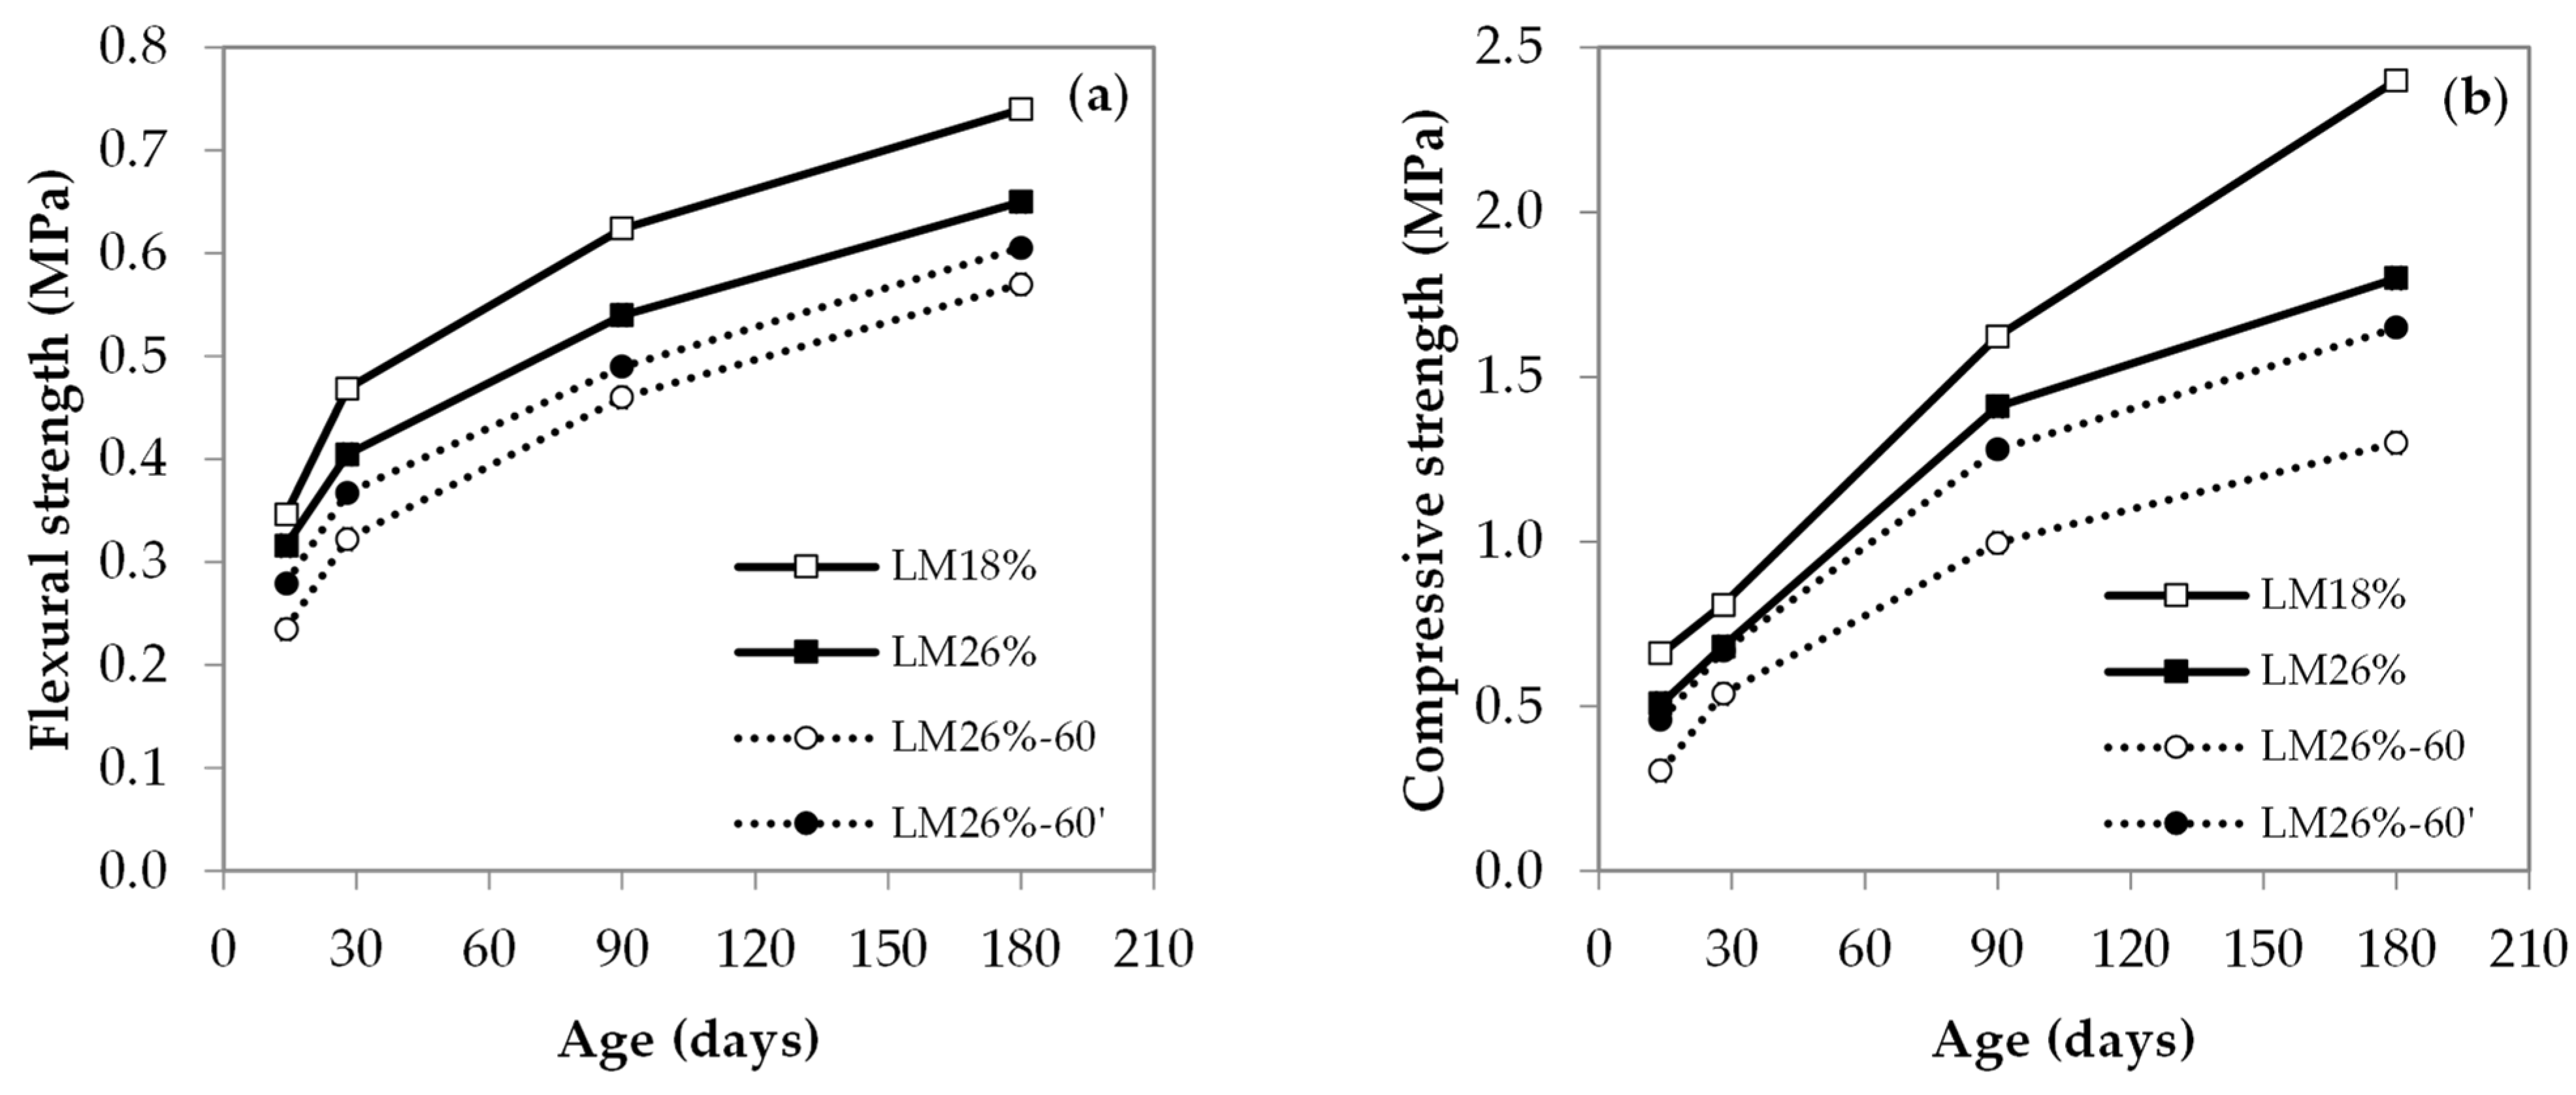
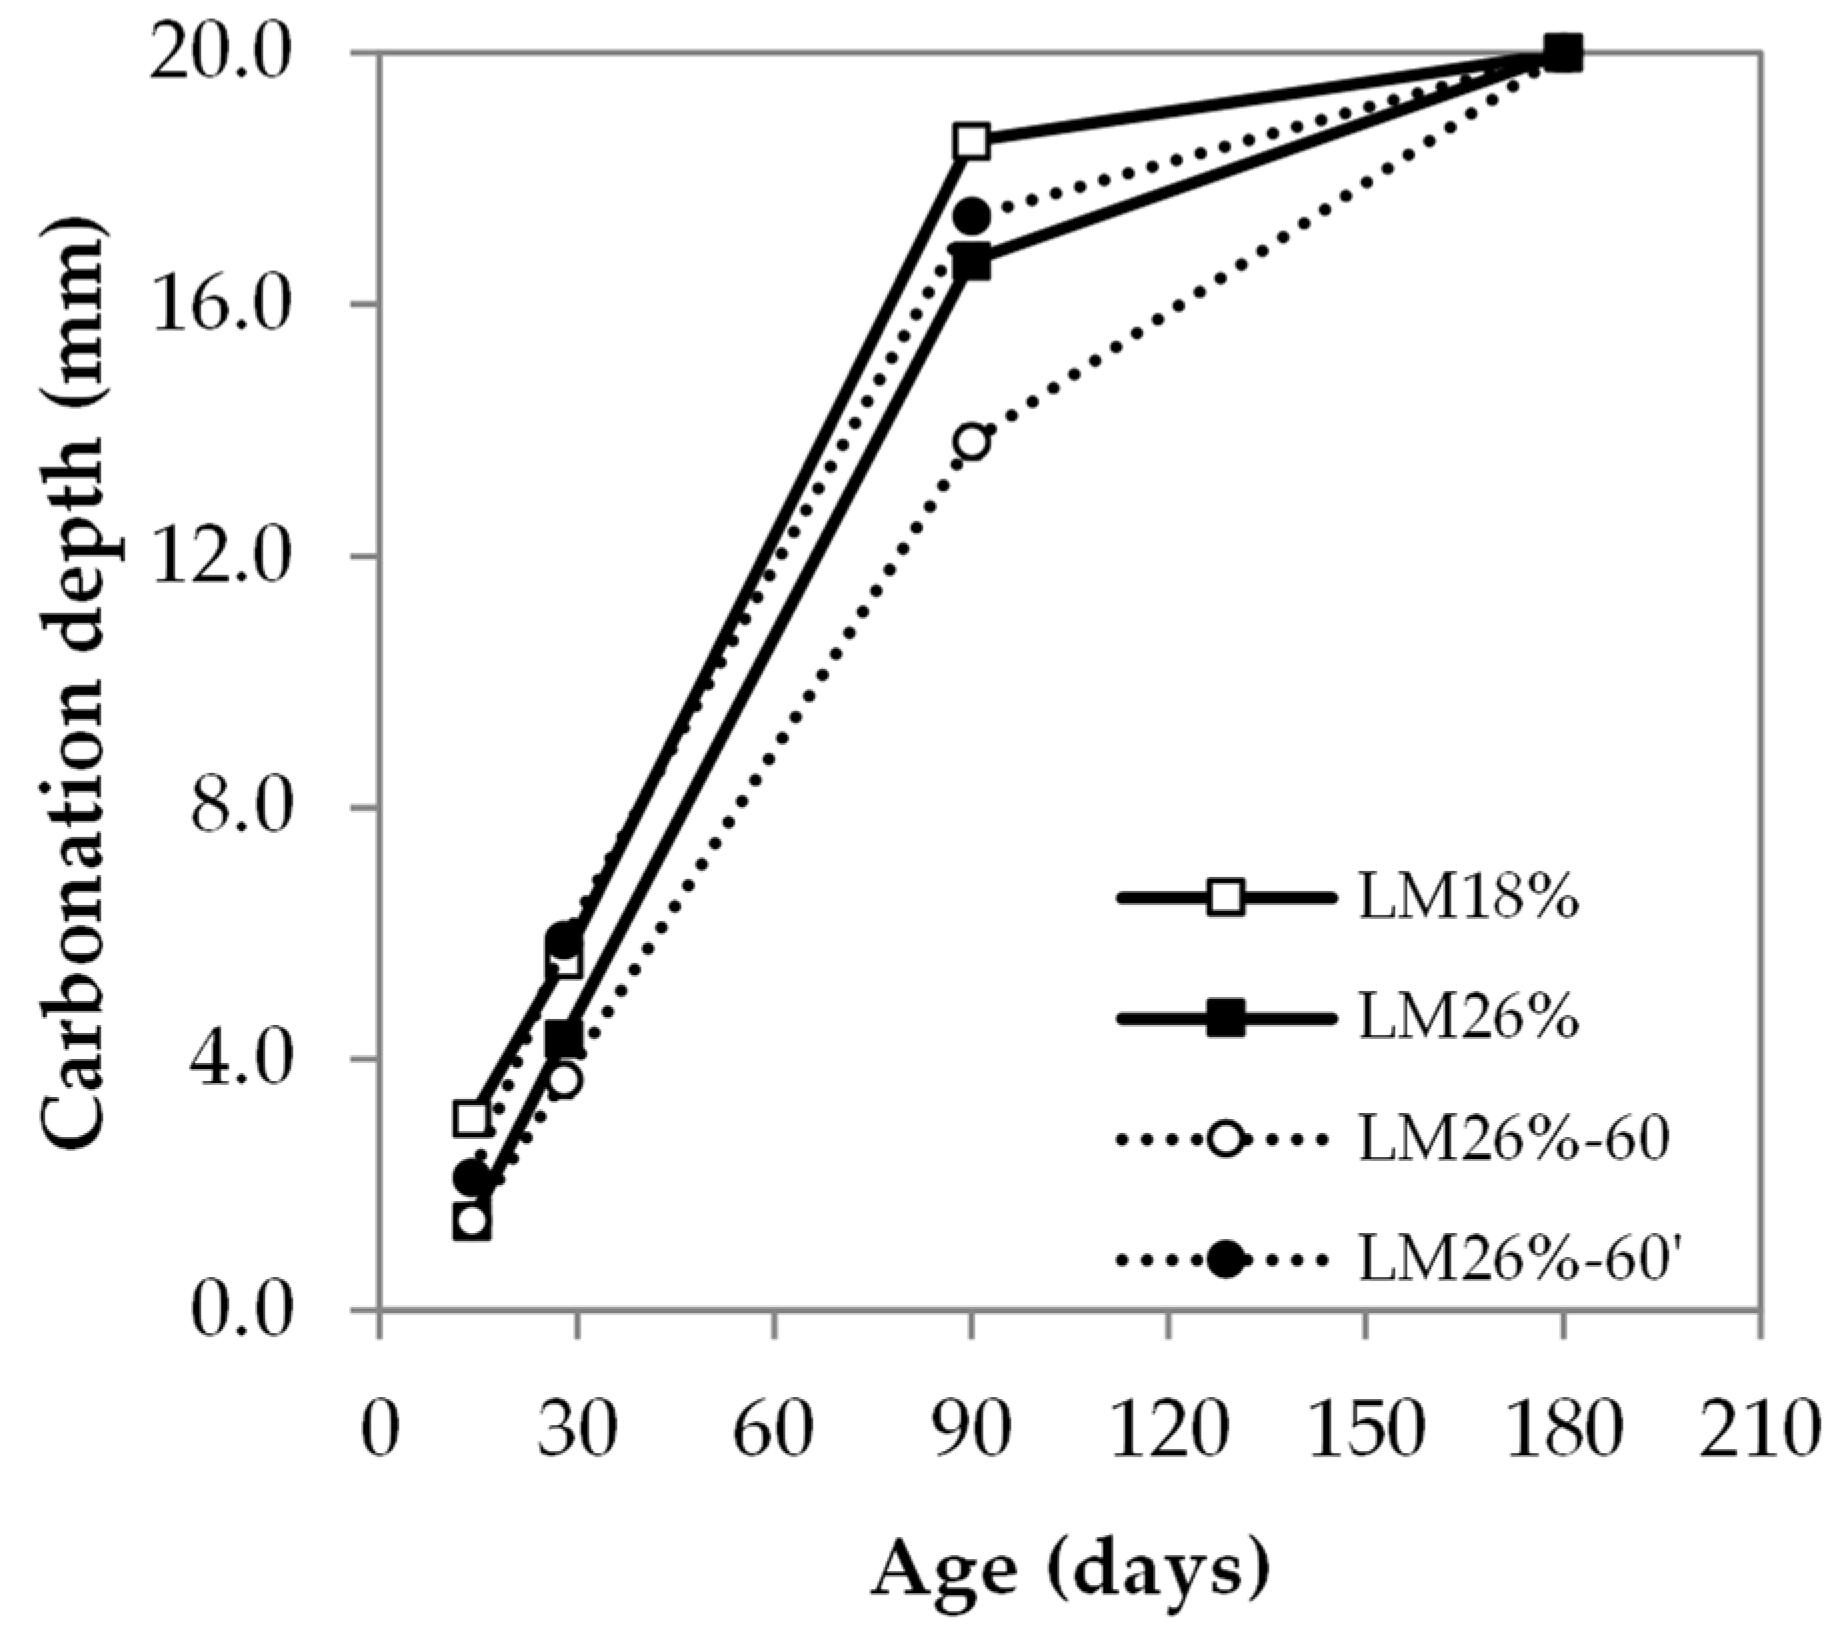
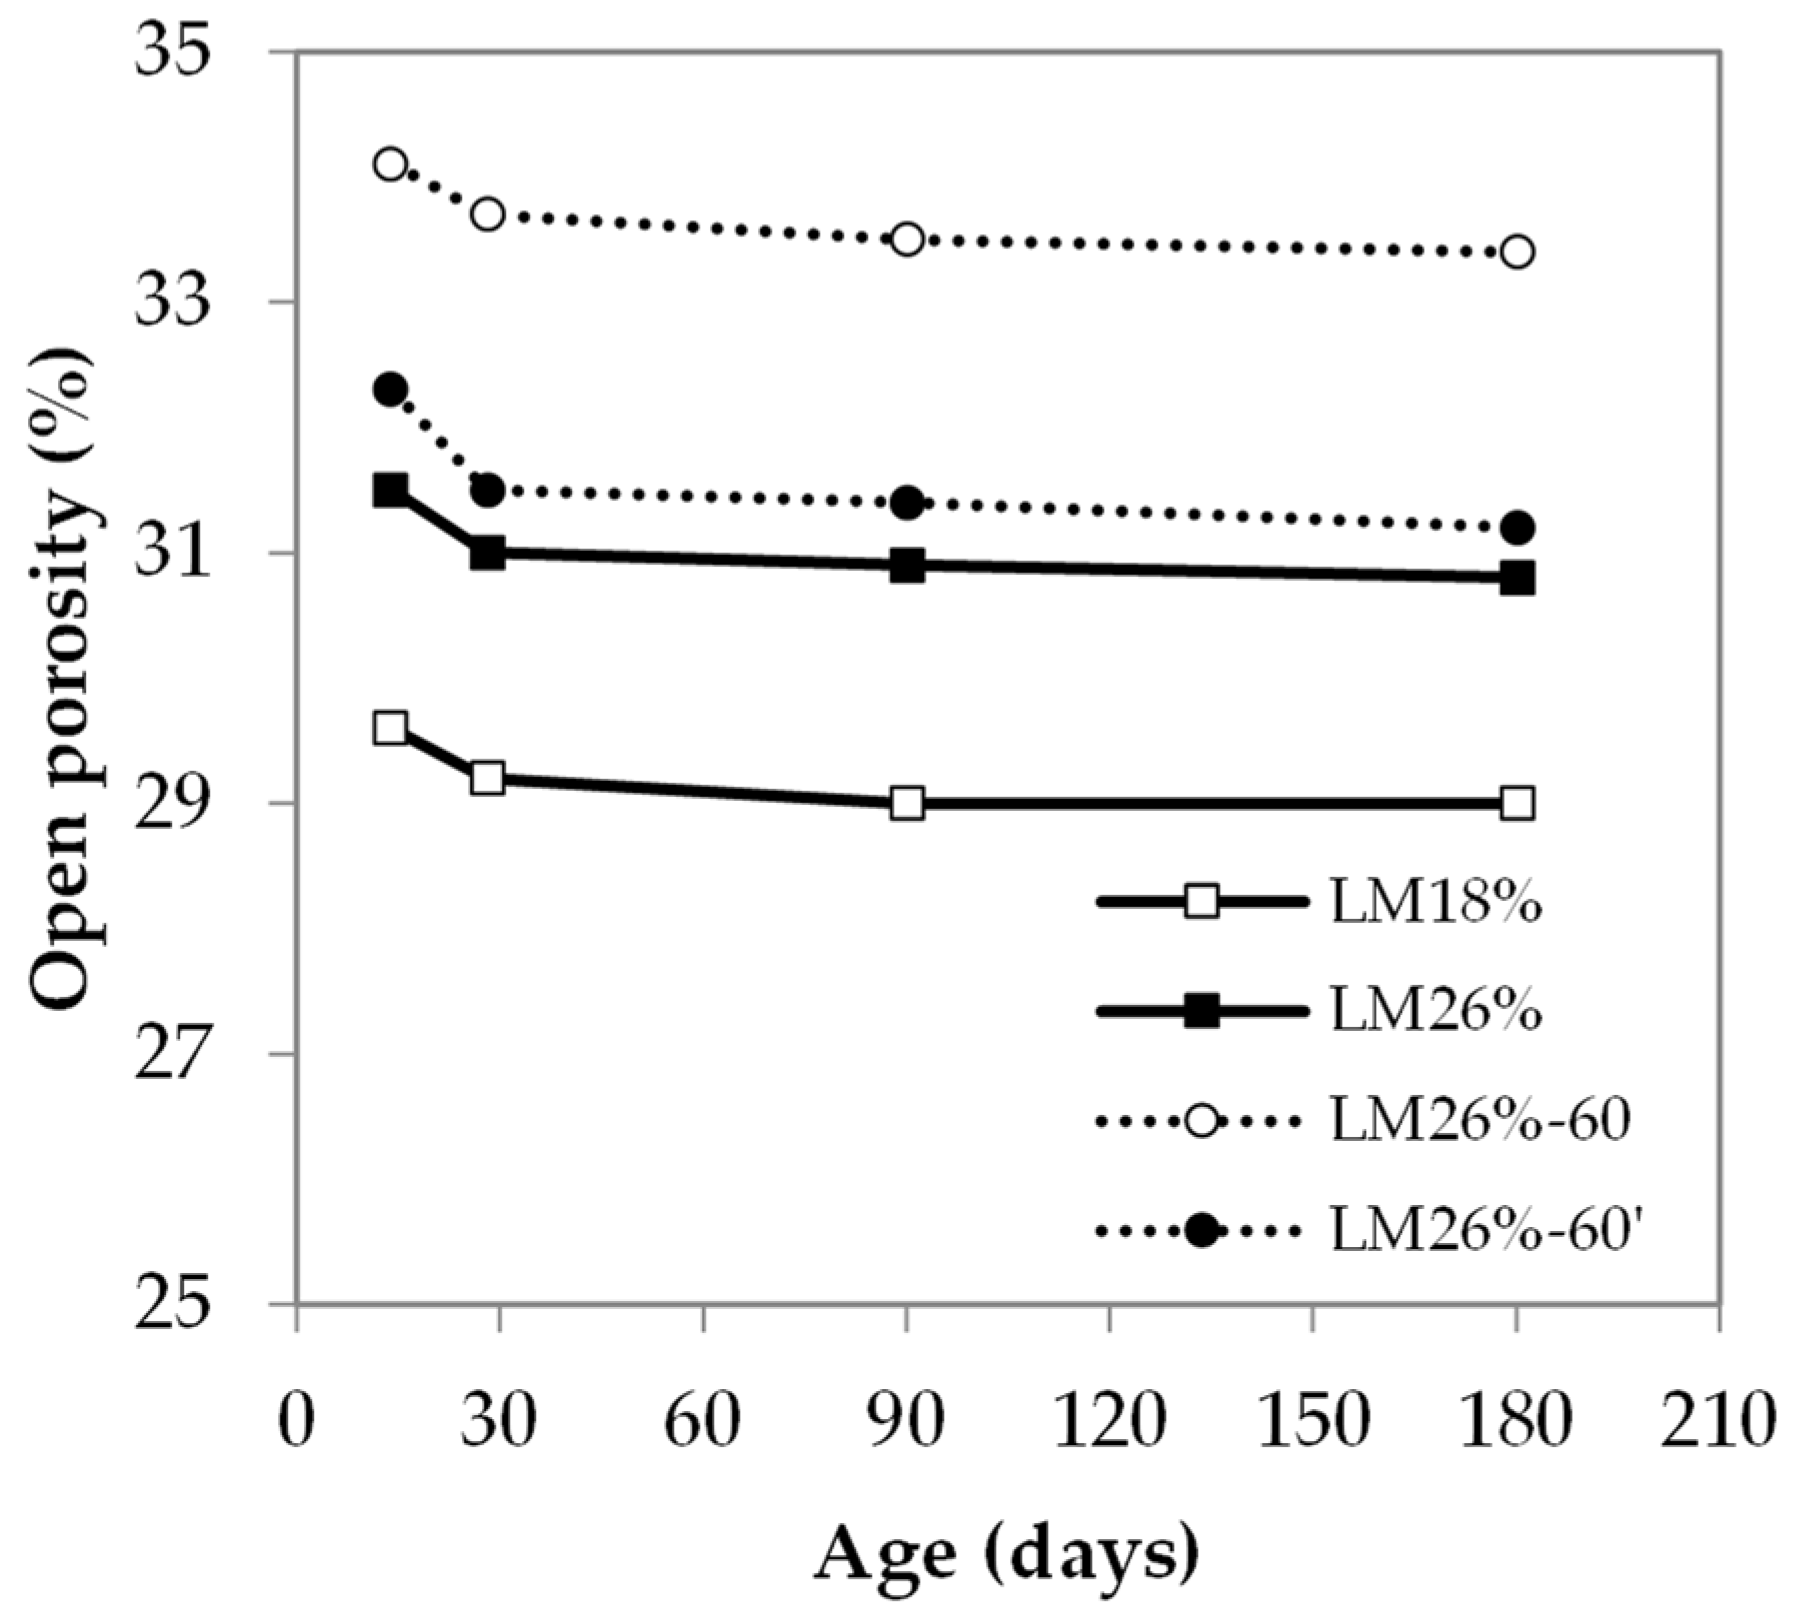
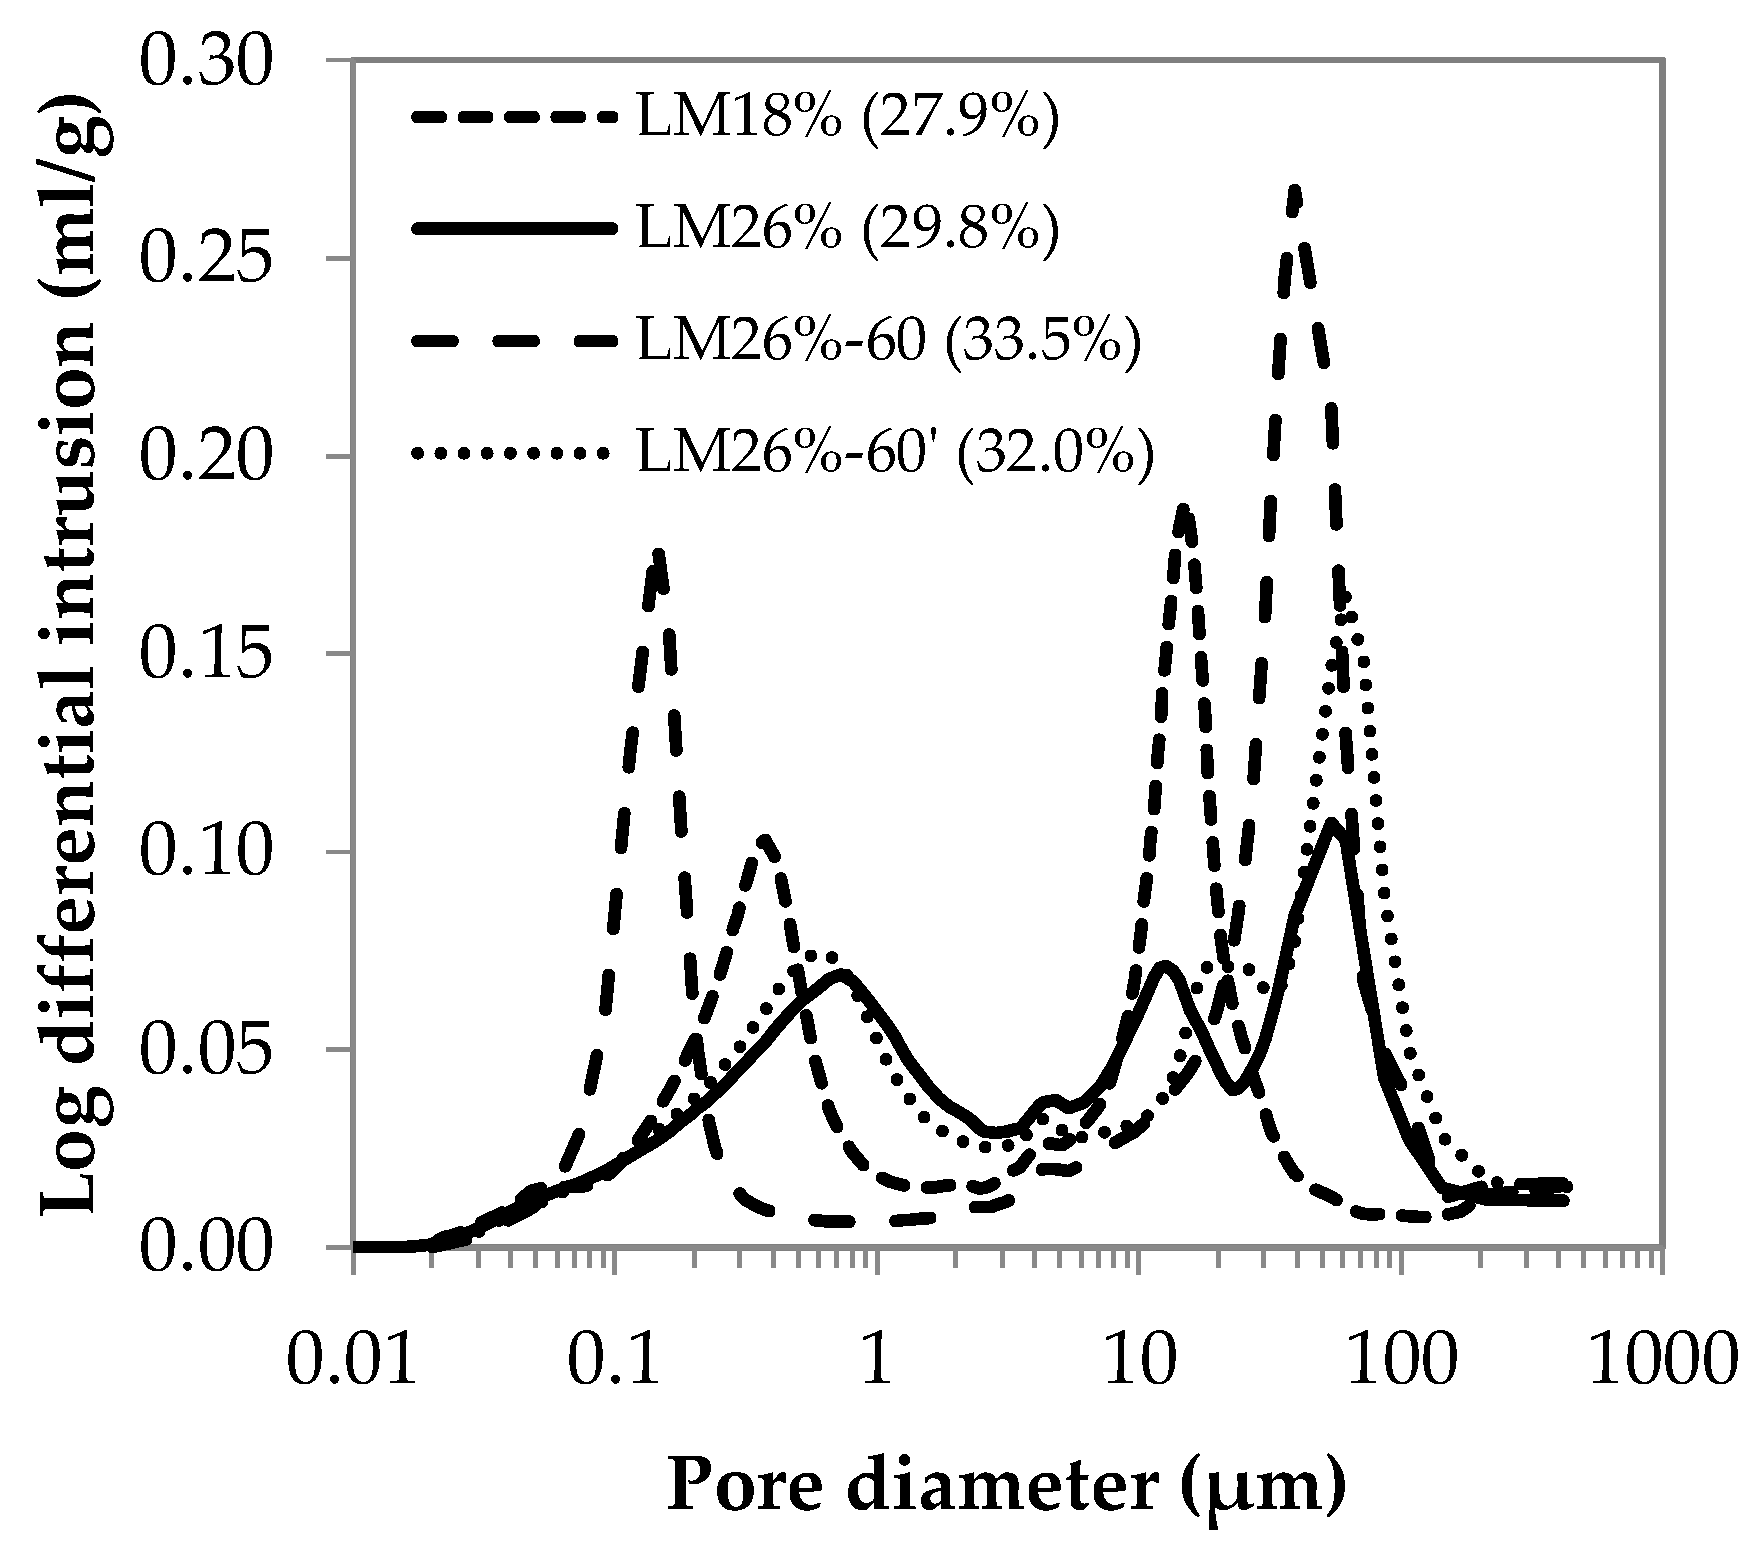
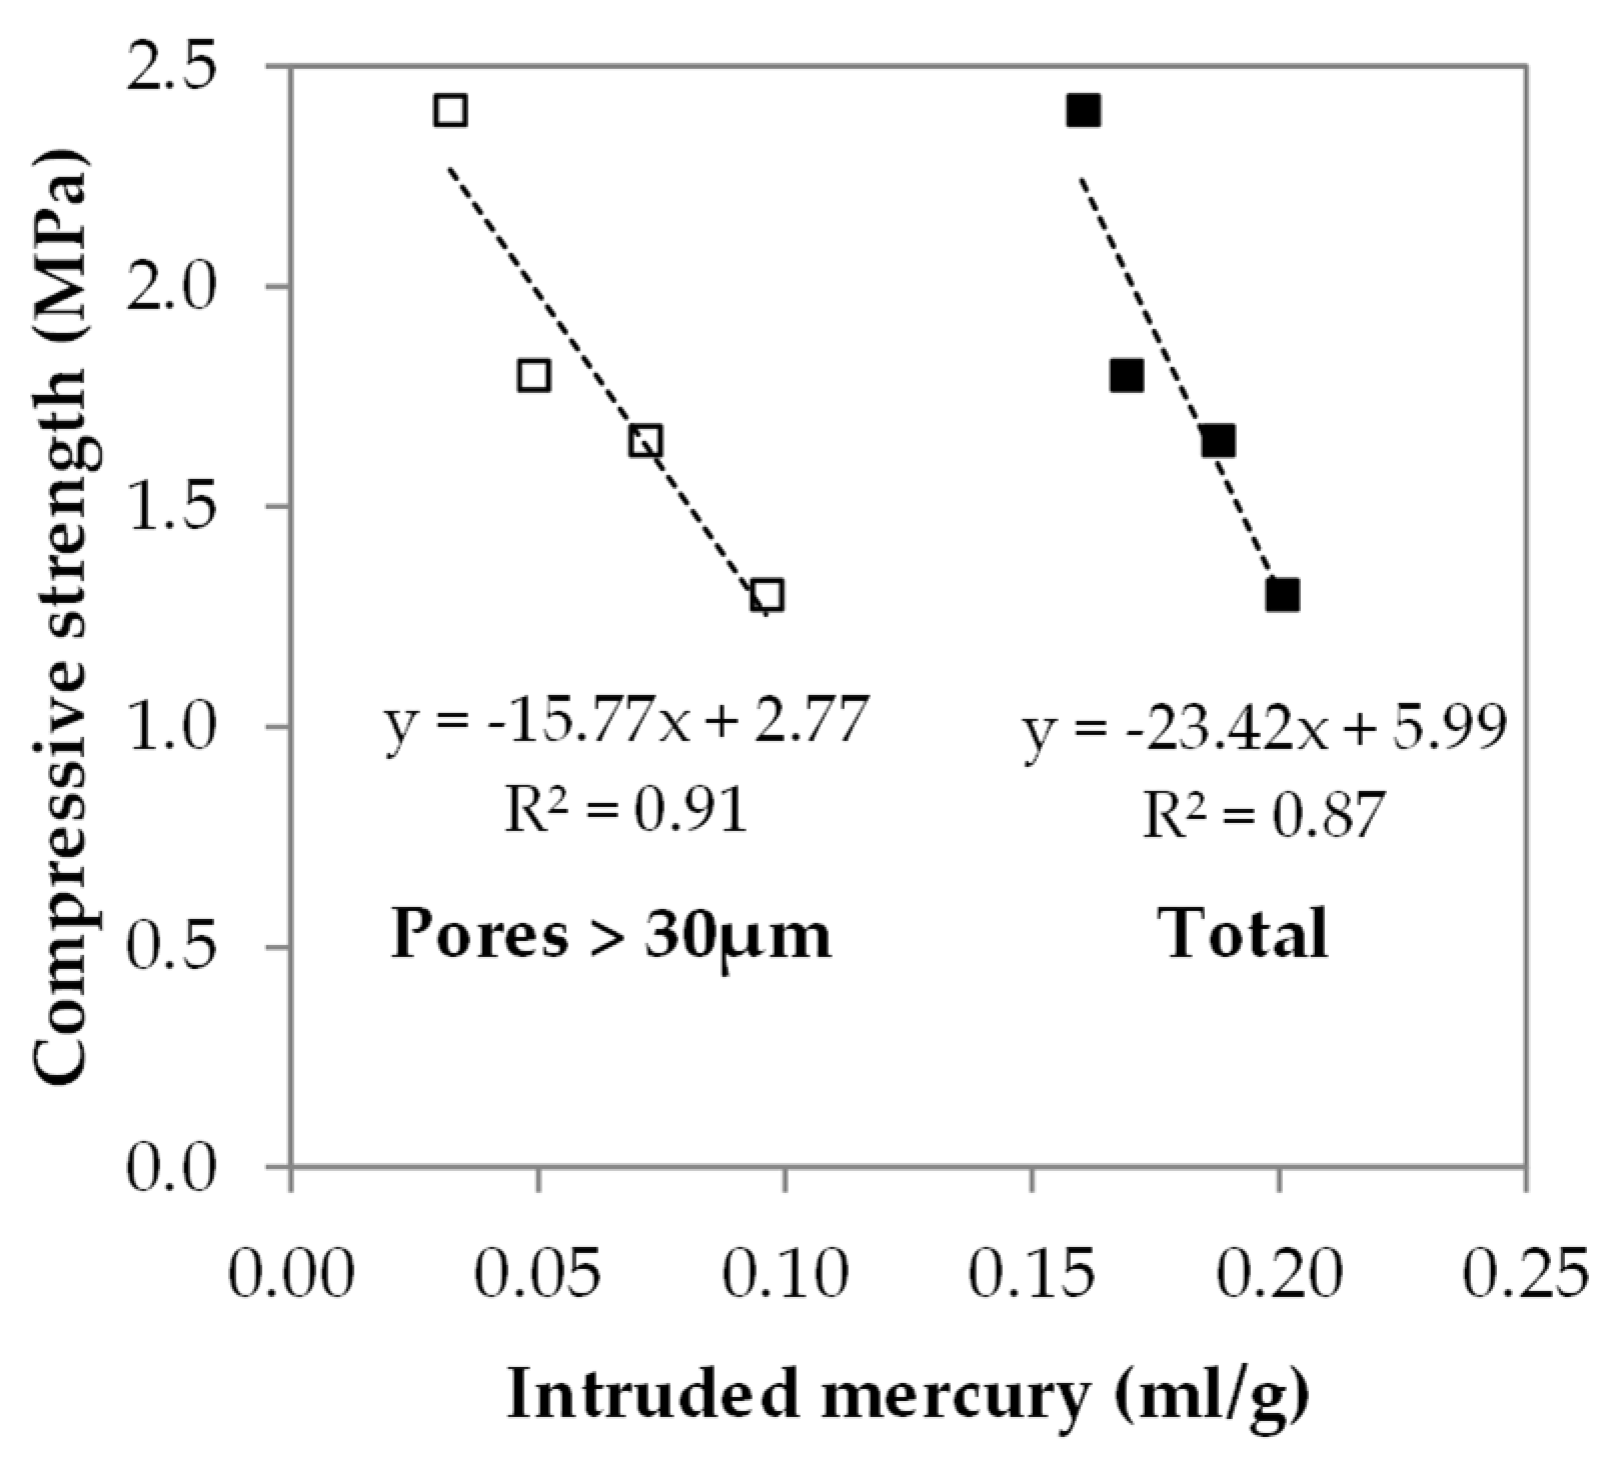
4.1. Influence of Water Content

As concluded in the previous section, the water content was one of the main influencing factors of the rheological properties and had a direct impact on the consistency/workability of lime mortars. Hence, it is important to evaluate its effect on the hardened state properties of these materials.
When comparing mortar LM18%, which was produced with the water content (18%) necessary for obtaining a consistency of 160 ± 5 mm, and mortar LM26%, which was made with a higher water content (26%), the latter presented lower mechanical strengths at all ages (Figure 11). This can be attributed to its higher free water amount that caused a delay in the carbonation process (Figure 12), a higher porosity (Figure 13) and a larger pore size (Figure 14). These results are in good agreement with those obtained by Arandigoyen et al. [67], who, when studying lime pastes with different water contents, concluded that higher w/b ratios caused swelling of the porous structure and, thus, a porosity and pore size increase. Moreover, Hanley and Pavia [68] reported that water excess is responsible for a porosity increase, harming the mechanical strength of lime-based materials as a result.
Figure 14. Pore size distribution of the tested lime mortars.
Buildings 13 01530 g014
Figure 15. Mercury intruded in different pore ranges.
Buildings 13 01530 g015

4.2. Influence of Mixing Conditions

The mixing conditions also proved to be quite important for the hardened state properties. When comparing mortars LM18% and LM26%-60, it can be perceived that they presented distinct properties, despite having the same consistency. In fact, the longer mixing time under the presence of the aggregate of mortar LM26%-60 was not beneficial since it caused lower mechanical strength and higher open porosity (Figure 11 and Figure 13) than those presented by the mortars mixed under the standard procedure (LM18% and LM26%). Previously, it was concluded that, with a longer mixing time, there is a more effective breakdown of lime agglomerates. In the literature, a finer lime particle size is associated with a higher carbonation rate [69,70,71,72,73] due to the higher solubility of smaller portlandite crystals. However, contrary to the claims in the literature, mortar LM26%-60 displayed the lowest carbonation rate (Figure 12), which had repercussions on its mechanical strength (Figure 11). This can be explained when considering the pore size distribution of this mortar (Figure 14 and Figure 15), as it presented the highest proportion of smaller and larger pores. The significant volume of small pores (<0.3 µm) hindered the access of carbon dioxide to the uncarbonated areas of mortar LM26%-60, reducing the carbonation progress and, as a result, the mechanical strength. At the same time, the substantial volume of large pores (>30 µm) that contributed to the high porosity displayed by mortar LM26%-60 (Figure 13 and Figure 14) was detrimental to the mechanical strength (Figure 16), despite facilitating carbonation. These large pores may originate in entrapped air due to the low fluidity of the mortar, in entrained air derived from the long mixing time and/or in drying shrinkage cracks. Regarding the latter, it should be noted that, despite having the same water content as mortar LM26%, mortar LM26%-60 has a lower amount of free water (thus the lower flow value) since part of the kneading water is retained in the greater surface area of the finer lime particles and may lead to the formation of shrinkage cracks. In this regard, Lawrence [73], when studying a mortar made with a dispersed lime (with a lower particle size obtained by using a high-speed mixer to break up the agglomerates), reported similar trends, namely, a slower rate of carbonation and of strength growth than that of a mortar made with regular hydrated lime. However, despite being slower, the strength increase was verified until later ages than in the other mortars, resulting in a final higher strength. Furthermore, the mortar with dispersed lime showed the greatest proportion of smaller pores, as verified in this work.
In turn, mortars LM26% and LM26%-60′ presented very similar properties, partly due to analogous consistencies. The lower mechanical strength and the higher porosity values of these mortars, when compared to those of mortar LM18%, occurred due to the higher amount of free water that, when evaporated, left behind a significant volume of capillary pores (between 0.1–100 µm) and shrinkage cracks (>100 µm). Nevertheless, it should be noted that these mortars presented a high tendency to segregate due to their high water content, which was aggravated by compaction, and part of the bleeding water that formed a layer on top of the specimens was lost during moulding.

5. Conclusions

The rheological behaviour of lime mortars with consistencies typically used in practise (stiff to plastic) could not be adequately measured using a rotational rheometer (Viskomat NT, Schleibinger). This occurs due to the tendency of lime particles to form small agglomerates or clusters that suffer a gradual breakdown during the mixing process and the rheological test (i.e., with continued shearing). This, in turn, leads to a reduction in the water available to lubricate the mix due to an increase in the surface area to be covered by water, resulting in a steep increase in torque, yield stress and plastic viscosity (thickening of the lime suspension) over time (rheopectic behaviour). It was only possible to obtain valid rheological measurements for fluid mortars with high water contents (in this case, equal to or higher than 24% of the dry weight for a mortar with a volumetric binder:aggregate ratio of 1:2), owing to a reduction in the said parameters. On the other hand, excessively high water contents (in this case, equal to or greater than 26%) caused segregation problems and unstable rheological behaviour.
A longer mixing time caused an increase in torque, yield stress and plastic viscosity values in the lime-based materials, especially when the aggregate was present. This means that the breakdown of lime agglomerates is promoted by a ‘ball-milling’ action of the aggregate.
The lime pastes presented a rheological behaviour similar to that of mortars in what concerns the influence of the water content and mixing conditions, albeit not as markedly, due to the absence of the aggregate, reinforcing the idea that the mixing time with the aggregate has a greater influence on the rheological properties than the mixing time without it.
The properties of lime mortars in the hardened state proved to be affected by the abovementioned factors, particularly the resulting porous structure, with repercussions on mechanical strength. A higher water content caused higher porosity, owing to an increase in capillary pores and shrinkage cracks, and lower mechanical strength. A longer mixing time with the aggregate was very detrimental to mechanical strength, despite the smaller lime particle size, as it originated a significant volume of large pores (>30 µm) due to shrinkage and poorer compaction as well as of small pores (<0.3 µm) that delayed the carbonation progress. Conversely, a longer mixing time without the aggregate was not as unfavourable.

Author Contributions

Conceptualization, B.A.S., A.P.F.P. and A.G.; Investigation, B.A.S.; Methodology, A.P.F.P., A.G. and A.C.; Resources, A.P.F.P., A.G. and A.C.; Supervision, A.P.F.P., A.G. and A.C.; Writing—original draft, B.A.S.; Writing—review and editing, B.A.S. and A.P.F.P. All authors have read and agreed to the published version of the manuscript.

Funding

The authors would like to thank the Foundation for Science and Technology (FCT) for funding the research unit CERIS through UIDB/04625/2020. The first author also acknowledges the financial support given by FCT in the context of doctoral scholarship SFRH/BD/107879/2015.

Data Availability Statement

The data presented in this study are available on request from the corresponding author.

Acknowledgments

The authors would like to gratefully acknowledge the HERCULES Laboratory for supporting the analytical characterisation and SECIL S.A. for performing the laser diffraction analysis of hydrated lime.

Conflicts of Interest

The authors declare no conflict of interest.

References

  1. Teutonico, J.M.; McCaig, I.; Burns, C.; Ashurst, J. The Smeaton project: Factors affecting the properties of lime-based mortars. APT Bull. 1993, 25, 32–49. [Google Scholar] [CrossRef]
  2. Elert, K.; Rodriguez-Navarro, C.; Pardo, E.S.; Hansen, E.; Cazalla, O. Lime mortars for the conservation of historic buildings. Stud. Conserv. 2002, 47, 62–75. [Google Scholar]
  3. Lanas, J.; Alvarez-Galindo, J.I. Masonry repair lime-based mortars: Factors affecting the mechanical behaviour. Cem. Concr. Res. 2003, 33, 1867–1876. [Google Scholar] [CrossRef] [Green Version]
  4. Lanas, J.; Bernal, J.P.; Bello, M.A.; Galindo, J.A. Mechanical properties of natural hydraulic lime-based mortars. Cem. Concr. Res. 2004, 34, 2191–2201. [Google Scholar] [CrossRef] [Green Version]
  5. Stefanidou, M.; Papayianni, I. The role of aggregates on the structure and properties of lime mortars. Cem. Concr. Compos. 2005, 27, 914–919. [Google Scholar] [CrossRef]
  6. Faria, P.; Henriques, F.; Rato, V. Comparative evaluation of lime mortars for architectural conservation. J. Cult. Herit. 2008, 9, 338–346. [Google Scholar] [CrossRef]
  7. Paiva, H.; Velosa, A.; Veiga, R.; Ferreira, V.M. Effect of maturation time on the fresh and hardened properties of an air lime mortar. Cem. Concr. Res. 2010, 40, 447–451. [Google Scholar] [CrossRef]
  8. Silva, B.A.; Pinto, A.F.; Gomes, A. Influence of natural hydraulic lime content on the properties of aerial lime-based mortars. Constr. Build. Mater. 2014, 72, 208–218. [Google Scholar] [CrossRef]
  9. Neville, A.M. Properties of Concrete, 5th ed.; Prentice Hall: Harlow, UK, 2011. [Google Scholar]
  10. Hewlett, P. Lea’s Chemistry of Cement and Concrete, 4th ed.; Butterworth-Heinemann: Oxford, UK, 2004. [Google Scholar]
  11. Seabra, M.P.; Paiva, H.; Labrincha, J.A.; Ferreira, V.M. Admixtures effect on fresh state properties of aerial lime based mortars. Constr. Build. Mater. 2009, 23, 1147–1153. [Google Scholar] [CrossRef]
  12. Banfill, P.F.G. Rheological methods for assessing the flow properties of mortar and related materials. Constr. Build. Mater. 1994, 8, 43–50. [Google Scholar] [CrossRef]
  13. Roussel, N. (Ed.) Understanding the Rheology of Concrete, 1st ed.; Woodhead Publishing: Cambridge, UK, 2012. [Google Scholar]
  14. Aïtcin, P.; Flatt, R.J. (Eds.) Science and Technology of Concrete Admixtures, 1st ed.; Woodhead Publishing: Cambridge, UK, 2015. [Google Scholar]
  15. Gołaszewski, J.; Szwabowski, J. Influence of superplasticizers on rheological behaviour of fresh cement mortars. Cem. Concr. Res. 2004, 34, 235–248. [Google Scholar] [CrossRef]
  16. Papo, A.; Piani, L. Effect of various superplasticizers on the rheological properties of Portland cement pastes. Cem. Concr. Res. 2004, 34, 2097–2101. [Google Scholar] [CrossRef]
  17. Williams, D.A.; Saak, A.W.; Jennings, H.M. The influence of mixing on the rheology of fresh cement paste. Cem. Concr. Res. 1999, 29, 1491–1496. [Google Scholar] [CrossRef]
  18. Toumbakari, E.E.; Van Gemert, D.; Tassios, T.P.; Tenoutasse, N. Effect of mixing procedure on injectability of cementitious grouts. Cem. Concr. Res. 1999, 29, 867–872. [Google Scholar] [CrossRef]
  19. Ferraris, C.F.; Obla, K.H.; Hill, R. The influence of mineral admixtures on the rheology of cement paste and concrete. Cem. Concr. Res. 2001, 31, 245–255. [Google Scholar] [CrossRef]
  20. Chandra, S.; Björnström, J. Influence of cement and superplasticizers type and dosage on the fluidity of cement mortars—Part I. Cem. Concr. Res. 2002, 32, 1605–1611. [Google Scholar] [CrossRef]
  21. Puertas, F.; Santos, H.; Palacios, M.; Martínez-Ramírez, S. Polycarboxylate superplasticiser admixtures: Effect on hydration, microstructure and rheological behaviour in cement pastes. Adv. Cem. Res. 2005, 17, 77–89. [Google Scholar] [CrossRef]
  22. Banfill, P.F.G. Rheology of fresh cement and concrete. In Proceedings of the 11th International Cement Chemistry Congress, Durban, South Africa, 11–16 May 2003; Volume 1, pp. 50–62. [Google Scholar]
  23. Fernàndez-Altable, V.; Casanova, I. Influence of mixing sequence and superplasticiser dosage on the rheological response of cement pastes at different temperatures. Cem. Concr. Res. 2006, 36, 1222–1230. [Google Scholar] [CrossRef]
  24. Dils, J.; De Schutter, G.; Boel, V. Influence of mixing procedure and mixer type on fresh and hardened properties of concrete: A review. Mater. Struct. 2012, 45, 1673–1683. [Google Scholar] [CrossRef]
  25. Trejo, D.; Prasittisopin, L. Effects of mixing variables on early-age characteristics of portland cement systems. J. Mater. Civ. Eng. 2016, 28, 04016094. [Google Scholar] [CrossRef]
  26. Nowoświat, A.; Gołaszewski, J. Influence of the variability of calcareous fly ash properties on rheological properties of fresh mortar with its addition. Materials 2019, 12, 1942. [Google Scholar] [CrossRef] [PubMed] [Green Version]
  27. Sonebi, M.; Perrot, A. Effect of mix proportions on rheology and permeability of cement grouts containing viscosity modifying admixture. Constr. Build. Mater. 2019, 212, 687–697. [Google Scholar] [CrossRef] [Green Version]
  28. De França, M.S.; Cazacliu, B.; Cardoso, F.A.; Pileggi, R.G. Influence of mixing process on mortars rheological behavior through rotational rheometry. Constr. Build. Mater. 2019, 223, 81–90. [Google Scholar] [CrossRef]
  29. Seabra, M.P.; Labrincha, J.A.; Ferreira, V.M. Rheological behaviour of hydraulic lime-based mortars. J. Eur. Ceram. Soc. 2007, 27, 1735–1741. [Google Scholar] [CrossRef]
  30. Brás, A.; Henriques, F.M. The influence of the mixing procedures on the optimization of fresh grout properties. Mater. Struct. 2009, 42, 1423–1432. [Google Scholar] [CrossRef]
  31. Brás, A.; Henriques, F.M.A. Natural hydraulic lime-based grouts—The selection of grout injection parameters for masonry consolidation. Constr. Build. Mater. 2012, 26, 135–144. [Google Scholar] [CrossRef]
  32. Jorne, F.; Henriques, F.M.; Baltazar, L.G. Influence of superplasticizer, temperature, resting time and injection pressure on hydraulic lime grout injectability. Correlation analysis between fresh grout parameters and grout injectability. J. Build. Eng. 2015, 4, 140–151. [Google Scholar] [CrossRef]
  33. Baltazar, L.G.; Henriques, F.M.; Cidade, M.T. Rheology of natural hydraulic lime grouts for conservation of stone masonry—Influence of compositional and processing parameters. Fluids 2019, 4, 13. [Google Scholar] [CrossRef] [Green Version]
  34. Banfill, P.F.G.; Shimizu, L. Rheology of natural hydraulic limes for masonry repair. In Proceedings of the 4th Historic Mortars Conference, Thessaloniki, Greece, 10–12 October 2016; pp. 606–613. [Google Scholar]
  35. Arizzi, A.; Banfill, P.F.G. Rheology of lime pastes with biopolymer-based additives. Mater. Struct. 2019, 52, 8–25. [Google Scholar] [CrossRef]
  36. Atzeni, C.; Farci, A.; Floris, D.; Meloni, P. Effect of aging on rheological properties of lime putty. J. Am. Ceram. Soc. 2004, 87, 1764–1766. [Google Scholar] [CrossRef]
  37. Ruiz-Agudo, E.; Rodriguez-Navarro, C. Microstructure and rheology of lime putty. Langmuir 2009, 26, 3868–3877. [Google Scholar] [CrossRef] [PubMed]
  38. Rodriguez-Navarro, C.; Hansen, E.; Ginell, W.S. Calcium hydroxide crystal evolution upon aging of lime putty. J. Am. Ceram. Soc. 1998, 81, 3032–3034. [Google Scholar] [CrossRef]
  39. Arizzi, A.; Hendrickx, R.; Cultrone, G.; Van Balen, K. Differences in the rheological properties of calcitic and dolomitic lime slurries: Influence of particle characteristics and practical implications in lime-based mortar manufacturing. Mater. Construcc. 2012, 62, 231–250. [Google Scholar] [CrossRef] [Green Version]
  40. Boháč, M.; Nečas, R. The role of aging on rheological properties of lime putty. Procedia Eng. 2016, 151, 34–41. [Google Scholar] [CrossRef] [Green Version]
  41. Rago, F. Características Reológicas de Pastas de Cales Hidratadas Normalizadas e de Cimento. Master’s Thesis, University of São Paulo, São Paulo, Brasil, 1999. (In Portuguese). [Google Scholar]
  42. Fourmentin, M.; Ovarlez, G.; Faure, P.; Peter, U.; Lesueur, D.; Daviller, D.; Coussot, P. Rheology of lime paste—A comparison with cement paste. Rheol. Acta 2015, 54, 647–656. [Google Scholar] [CrossRef]
  43. Izaguirre, A.; Lanas, J.; Alvarez, J.I. Characterization of aerial lime-based mortars modified by the addition of two different water-retaining agents. Cem. Concr. Compos. 2011, 33, 309–318. [Google Scholar] [CrossRef] [Green Version]
  44. Fernández, J.M.; Duran, A.; Navarro-Blasco, I.; Lanas, J.; Sirera, R.; Alvarez, J.I. Influence of nanosilica and a polycarboxylate ether superplasticizer on the performance of lime mortars. Cem. Concr. Res. 2013, 43, 12–24. [Google Scholar] [CrossRef] [Green Version]
  45. Azeiteiro, L.C.; Velosa, A.; Paiva, H.; Mantas, P.Q.; Ferreira, V.M.; Veiga, R. Development of grouts for consolidation of old renders. Constr. Build. Mater. 2014, 50, 352–360. [Google Scholar] [CrossRef]
  46. Seabra, M.P.; Labrincha, J.A.; Ferreira, V.M. Ageing effect on aerial lime mortars rheology. In Materials Science Forum; Trans Tech Publications Ltd.: Stafa-Zurich, Switzerland, 2008; Volume 587, pp. 872–876. [Google Scholar]
  47. Silva, B.; Ferreira Pinto, A.P.; Gomes, A.; Candeias, A. Fresh and hardened state behaviour of aerial lime mortars with superplasticizer. Constr. Build. Mater. 2019, 225, 1127–1139. [Google Scholar] [CrossRef]
  48. Silva, B.A.; Ferreira Pinto, A.P.; Gomes, A.; Candeias, A. Impact of a viscosity-modifying admixture on the properties of lime mortars. J. Build. Eng. 2020, 31, 101132. [Google Scholar] [CrossRef]
  49. Cardoso, F.A.; John, V.M.; Pileggi, R.G.; Banfill, P.F.G. Characterisation of rendering mortars by squeeze-flow and rotational rheometry. Cem. Concr. Res. 2014, 57, 79–87. [Google Scholar] [CrossRef]
  50. Hendrickx, R. The Adequate Measurement of the Workability of Masonry Mortar. Ph.D. Thesis, Katholieke Universiteit Leuven, Leuven, Belgium, 2009. [Google Scholar]
  51. EN 459-1; Building Lime. Definitions, Specifications and Conformity Criteria. European Committee for Standardization (CEN): Brussels, Belgium, 2010.
  52. Rodriguez-Navarro, C.; Ruiz-Agudo, E.; Ortega-Huertas, M.; Hansen, E. Nanostructure and irreversible colloidal behavior of Ca(OH)2: Implications in cultural heritage conservation. Langmuir 2005, 21, 10948–10957. [Google Scholar] [CrossRef]
  53. Walker, R.; Pavía, S. Physical properties and reactivity of pozzolans, and their influence on the properties of lime-pozzolan pastes. Mater. Struct. 2011, 44, 1139–1150. [Google Scholar] [CrossRef] [Green Version]
  54. EN 13139; Aggregates for Mortar. European Committee for Standardization (CEN): Brussels, Belgium, 2002.
  55. EN 1015-2; Methods of Test for Mortar for Masonry. Bulk Sampling of Mortars and Preparation of Test Mortars. European Committee for Standardization (CEN): Brussels, Belgium, 1998.
  56. EN 196-1; Methods of Testing Cement. Determination of Strength. European Committee for Standardization (CEN): Brussels, Belgium, 2005.
  57. EN 1015-3; Methods of Test for Mortar for Masonry. Determination of Consistency of Fresh Mortar by Flow Table. European Committee for Standardization (CEN): Brussels, Belgium, 1999.
  58. EN 1015-4; Methods of Test for Mortar for Masonry. Determination of Consistence of Fresh Mortar (by Plunger Penetration). European Committee for Standardization (CEN): Brussels, Belgium, 1999.
  59. EN 445; Grout for Pre-Stressing Tendons. Test Methods. European Committee for Standardization (CEN): Brussels, Belgium, 2008.
  60. Coussot, P. Rheophysics—The Matter in All Its States, 1st ed.; Springer: Berlin, Germany, 2014. [Google Scholar]
  61. Teubert u. Greim GmbH. Schleibinger Viskomat NT and Viskomat XL Manual, Schleibinger Testing Systems; Teubert u. Greim GmbH: Buchbach, Germany, 2016. [Google Scholar]
  62. EN 1015-11; Methods of Test for Mortar for Masonry. Determination of Flexural and Compressive Strength of Hardened Mortar. European Committee for Standardization (CEN): Brussels, Belgium, 1999.
  63. RILEM Test, I. 1—Porosity Accessible to Water. RILEM TC 25-PEM—Recommended tests to measure the deterioration of stone and to assess the effectiveness of treatment methods. Mater. Struct. 1980, 13, 177–179. [Google Scholar]
  64. Banfill, P.F.G. (Ed.) Rheology of Fresh Cement and Concrete. In Proceedings of an International Conference; CRC Press: Liverpool, UK, 1990. [Google Scholar]
  65. Vávrová, P.; Kotlík, P. Rheological properties of lime putty. Meterialy Pro Stavbu 2003, 3, 6. [Google Scholar]
  66. Banfill, P.F.G. The rheology of fresh mortar. Mag. Concr. Res. 1991, 43, 13–21. [Google Scholar] [CrossRef]
  67. Arandigoyen, M.; Bernal, J.P.; López, M.B.; Alvarez, J.I. Lime-pastes with different kneading water: Pore structure and capillary porosity. Appl. Surf. Sci. 2005, 252, 1449–1459. [Google Scholar] [CrossRef] [Green Version]
  68. Hanley, R.; Pavía, S. A study of the workability of natural hydraulic lime mortars and its influence on strength. Mater. Struct. 2008, 41, 373–381. [Google Scholar] [CrossRef]
  69. Cazalla, O.; Rodriguez-Navarro, C.; Sebastian, E.; Cultrone, G.; De la Torre, M.J. Aging of lime putty: Effects on traditional lime mortar carbonation. J. Am. Ceram. Soc. 2000, 83, 1070–1076. [Google Scholar] [CrossRef]
  70. Cultrone, G.; Sebastián, E.; Huertas, M.O. Forced and natural carbonation of lime-based mortars with and without additives: Mineralogical and textural changes. Cem. Concr. Res. 2005, 35, 2278–2289. [Google Scholar] [CrossRef]
  71. Van Balen, K.; Van Gemert, D. Modelling lime mortar carbonation. Mater. Struct. 1994, 27, 393–398. [Google Scholar] [CrossRef]
  72. Strottman, R. Dispersed Hydrated Lime: Development and Production, Techniques and Applications. In Proceedings of the International RILEM Workshop on Historic Mortars: Characteristics and Tests, Paisley, Scotland, 12–14 May 1999; RILEM Publications SARL: Champs-sur-Marne, France; pp. 407–411. [Google Scholar]
  73. Lawrence, R.M.H. A Study of Carbonation in Non-Hydraulic Lime Mortars. Ph.D. Thesis, University of Bath, Bath, UK, 2006. [Google Scholar]
Figure 1. Air lime: (a) X-ray diffraction pattern (P: portlandite; C: calcite); (b) particle size distribution.
Buildings 13 01530 g001
Figure 2. Fine aggregate: (a) X-ray diffraction pattern (Q: quartz; M: microcline); (b) particle size distribution.
Buildings 13 01530 g002
Figure 3. Lime mortars with different water contents: (a) torque vs. time curves; (b) variation in yield stress (g) and in plastic viscosity (h) with water content.
Buildings 13 01530 g003
Figure 4. Mortars with different water contents: variation in (a) yield stress (g) and in (b) plastic viscosity (h) throughout the rheometric test.
Buildings 13 01530 g004
Figure 5. Lime pastes with different water contents: (a) torque vs. time curves; (b) variation in yield stress (g) and in plastic viscosity (h) with water content.
Buildings 13 01530 g005
Figure 6. Mortars with different mixing conditions: torque vs. time curves.
Buildings 13 01530 g006
Figure 7. Lime suspensions taken from mortars LM26% and LM26%-60: (a) particle size distribution and average particle size; (b) stereo microscope images.
Buildings 13 01530 g007
Figure 8. Mortars with different mixing conditions: variation in (a) yield stress (g) and in (b) plastic viscosity (h) throughout the rheometric test.
Buildings 13 01530 g008
Figure 9. Pastes with different mixing conditions: torque vs. time curves.
Buildings 13 01530 g009
Figure 10. Pastes with different mixing conditions: variation in (a) yield stress (g) and in (b) plastic viscosity (h) throughout the rheometric test.
Buildings 13 01530 g010
Figure 11. (a) Flexural and (b) compressive strength of the tested lime mortars.
Buildings 13 01530 g011
Figure 12. Carbonation depth of the tested lime mortars.
Buildings 13 01530 g012
Figure 13. Open porosity of the tested lime mortars.
Buildings 13 01530 g013
Figure 16. Variation in compressive strength values (at 180 days) with total intruded mercury and with that in pores greater than 30 µm.
Buildings 13 01530 g016
Table 1. Fresh state properties of lime pastes and mortars with different water contents.
MortarsLM18%LM20%LM22%LM24%LM26%
Water content (%) 11820222426
Water/binder ratio1.131.201.321.441.56
Flow value (mm)161197215261284
Plunger pen. (mm)1120395168
PastesLP18%LP20%LP22%LP24%LP26%
Water/binder ratio1.131.201.321.441.56
Flow time (s)11.010.08.58.07.5
1 Percentage of the mortar’s dry weight.
Table 2. Mixing processes used to study the influence of mixing conditions.
Mortars and PastesMixing Time (min), Speed (rpm) and Sequence of Addition of the Constituents
Lime + WaterAggregateTotal Mixing Time
LM26%1 min 1
(140 ± 5 rpm)
3 min 2
(285 ± 5 rpm)
4 min
LM26%-603 min 2
(285 ± 5 rpm)
60 min
(140 ± 5 rpm)
64 min
LM26%-60′1 min 1
(140 ± 5 rpm)
60 min
(140 ± 5 rpm)
3 min 2
(285 ± 5 rpm)
64 min
LP26%1 min
(140 ± 5 rpm)
3 min
(285 ± 5 rpm)
-4 min
LP26%-601 min
(140 ± 5 rpm)
3 min
(285 ± 5 rpm)
60 min
(140 ± 5 rpm)
-64 min
1 Includes 30 s of mixing lime with water and 30 s for adding the aggregate. 2 Includes 30 s at 285 ± 5 rpm, 75 s of pause for scrapping the bowl and for the mix to stand, and 60 s at 285 ± 5 rpm. The time was approximated in the scheme for simplicity.
Table 3. Fresh state properties of lime mortars and pastes with different mixing conditions.
MortarsLM26%LM26%-60LM26%-60′
Water/binder ratio1.561.561.56
Flow value (mm)284165275
Plunger pen. (mm)681367
PastesLP26%LP26%-60-
Water/binder ratio1.561.56-
Flow time (s)7.58.0-
Table 4. Summary of the water content, mixing time and consistency of the mortars tested on the hardened state.
MortarLM18%LM26%LM26%-60LM26%-60′
Water content (%)18262626
Water/binder ratio1.081.561.561.56
Mixing time (min)446464
Flow value (mm)161284165275
Disclaimer/Publisher’s Note: The statements, opinions and data contained in all publications are solely those of the individual author(s) and contributor(s) and not of MDPI and/or the editor(s). MDPI and/or the editor(s) disclaim responsibility for any injury to people or property resulting from any ideas, methods, instructions or products referred to in the content.

