Article

Indoor Air Quality and Thermal Environment Assessment of Scottish Homes with Different Building Fabrics

1
Mackintosh Environmental Architecture Research Unit, The Glasgow School of Art, 167 Renfrew Street, Glasgow G3 6RQ, UK
2
Department of Architecture, University of Strathclyde, 75 Montrose Street, Glasgow G1 1XJ, UK
*
Author to whom correspondence should be addressed.
Buildings 2023, 13(6), 1518; https://doi.org/10.3390/buildings13061518
Submission received: 24 April 2023 / Revised: 29 May 2023 / Accepted: 9 June 2023 / Published: 13 June 2023
(This article belongs to the Topic Ventilation and Indoor Air Quality, 2nd Volume)

Abstract

:
The ongoing climate change and policies around it are changing how we design and build homes to meet national carbon emission targets. Some countries such as Scotland are adopting higher-energy-efficient buildings as minimum requirements in the building regulations. While net zero homes might be more energy-efficient and emit fewer operational carbon emissions, we have yet to fully understand the influence on the indoor environment, particularly on indoor air quality (IAQ) and thermal comfort. This study compares the IAQ of three homes in Scotland with equal internal layouts and designs but different building fabrics. The homes represent the minimum Scottish building regulations (2015), the Passivhaus standard and the Scottish ‘Gold Standard’. Temperature, relative humidity, PM2.5 and total volatile organic compounds (tVOC) were measured at five-minute intervals for seven months and compared to occupants’ subjective responses to the IAQ. All three homes had temperatures above the recommended thresholds for overheating. Measured hygrothermal conditions were within the ideal range 66.4% of the time in the Passivhaus, 56.4% in the Gold Standard home and 62.7% in the control home. Measured IAQ was better in homes with higher energy efficiency, particularly tVOC. For instance, indoor PM2.5 in the Passivhaus were 78.0% of the time below the threshold, while in the standard home the figure was 51.5%, with a weak correlation with outdoor PM2.5 (Passivhaus: B rs = 0.167, K rs = 0.306 and L rs = 0.163 (p < 0.001); Gold: B rs = −0.157, K rs = 0.322 and L rs = 0.340 (p < 0.001); Control: B rs = −0.111, K rs = 0.235 and L rs = 0.235 (p < 0.001)). TVOCs in the Passivhaus were 81.3%, while in the control home they were 55.0%. While the results cannot be generalised, due to the small sample, this study has significant policy implications, particularly in Scotland, exhibiting the importance of IAQ in current building legislation and sustainable assessment methods.

1. Introduction

The recent concerns about climate change have driven significant changes in how we design and build homes. Several countries have realised the building industry’s impact on carbon emissions and declared a climate emergency, aiming to achieve net zero between 2030 and 2050 [1]. For instance, the European Union framework and policies (i.e., the 2030 Climate and Energy Policy) target the reduction of carbon emissions. They aim to decrease carbon emissions by 95% compared to 1990 levels by 2050 [2]. The UK has similar ambitions with its net zero strategy, Build Back Greener, to decarbonise all sectors by 2050. The UK government recognises that the building industry is responsible for up to 17% of the national carbon emissions, of which 78% comes from heating [3]. Scotland, meanwhile, has implemented more challenging targets for net zero. One of the major changes made to meet these net zero targets in Scotland is the approval of the Domestic Building Environmental Standards (Scotland) Bill (approved in 2023 and set to start in 2025), which sets all new buildings to comply with a Scottish Passivhaus equivalent as a minimum in the building regulations. Hence, is it more critical to collect evidence of the performance of Passivhaus buildings in Scotland ahead of its implementation, particularly those related to factors of the indoor environment and health.
Since 2010, carbon emissions have been the main driver for net zero homes and have intensified the popularity of sustainable certifications such as LEED and Passivhaus [4]. Nowadays, net zero dwellings can produce more energy on-site from renewable sources than those needed for their operation. For instance, Passivhaus Premium dwellings consume less than 30 kWh/(m2a)—90% below traditional homes—and produce at least 30 kWh/(m2a) [5]. While many of the Passivhaus requirements and principles are still applicable in the Domestic Building Environmental Standards (Scotland) Bill (2025), the airtightness level is the major difference of the Passivhaus standard. In Scotland, it will be set at 3.0 m3/(h·m3) at 50 Pa compared to 0.6 m3/(h·m3) at 50 Pa in Passivhaus buildings. While the Scottish bill will significantly impact carbon emissions and achieve the net zero targets, other factors, such as indoor air quality (IAQ) and thermal comfort, which impact our health, should be addressed and still need to be researched [6]. New energy-efficient homes should not compromise indoor environmental quality.
While residential IAQ and ventilation were highlighted through the 2020–2022 COVID-19 lockdown [7,8], previous studies recognised the need to understand better the relationship between energy efficiency and IAQ in homes [9]. Regardless of whether residential IAQ studies were conducted before [10,11,12] or during the lockdown [13,14], the results have reinforced the need to better understand the relationship between energy efficiency and IAQ in homes. For instance, a study found that dwellings that rely on mechanical ventilation with heat recovery (MVHR) systems showed a lower concentration of indoor PM10, PM2.5, CO2, and VOCs compared to conventional homes, and suggests that occupants in energy-efficient homes have improved health and satisfaction [15]. These findings are akin to the lessons highlighted in residential IAQ in Passivhaus [11]. However, IAQ in homes with mechanical ventilation systems depend on greatly on the commissioning and handover process. The lack of system training can impact the overall satisfaction levels for IAQ and thermal comfort [16].
A recent European climate study found a strong correlation between dry-bulb temperature and operative temperature in relation to less-energy-efficient building fabrics [17]. They also point out that airflow in homes with higher fabric efficiency has a strong correlation between wind speed, and a higher temperature difference between indoors and outdoors. The materials used in the building fabric also have an impact on the IAQ and thermal comfort in the buildings. For instance, composite phase-change materials can reduce the indoor air temperature and improve thermal comfort. However, they might negatively impact IAQ, particularly with VOC offgassing [18].
IAQ in the Scottish Passivhaus is not fully understood, as a limited number of peer-reviewed studies exist, and those that exist only measure CO2. A 2-year study concluded that residential Scottish Passivhaus buildings have been characterised as suffering from poor IAQ and overheating, due to an imbalance in the MVHR system [10]. However, a 3-month study suggests that CO2 levels in Scottish Passivhaus dwellings are lower and more consistent compared to homes without MVHR systems [19]. They also observed that one of the biggest challenges for poor energy performance in Scottish Passivhaus homes was the lack of occupants’ understanding of the MVHR system and the poor layout and ductwork. These findings are comparable to other parts of the UK, where the authors found that the lack of occupant knowledge in controlling the MVHR system was the main cause of IAQ problems [20]. They indicated that the CO2 exceeded 1000 ppm in summer and winter in all homes, according to the 24 h monitored periods in summer and winter.
High temperatures impact the offgassing of building materials and how we perceive IAQ. A study in the UK looking at summer temperatures found that homes with higher insulation reported overheating more frequently than uninsulated homes [21]. Similarly, concerning levels of overheating have been measured previously in Scotland, and are not always limited to the non-heating season [22]. However, Passivhaus homes in Scotland [23] and other countries [24,25,26] have been found to be within acceptable temperature ranges, particularly when incorporating passive techniques to regulate indoor temperatures [27,28].
The building design is critical when conducting post-occupancy evaluation studies, particularly for IAQ studies. Studies should compare buildings as much as possible, but exclude the differences in energy efficiency [29]. However, this is not often the case; having the same building with different building fabrics is rare in real life. Thus, many studies comparing the same building are often based on virtual models. Having the opportunity to conduct this study in real life would progress the understanding of the impact of ventilation [30,31], airtightness, mechanical ventilation [32] and outdoor air pollution [33].
Although similar studies may have been conducted in Scotland, these are based on homes with different layouts and locations, comparing the Passivhaus to standard homes in terms of thermal comfort or IAQ in limited temporal frames. This study differentiates itself from these studies by looking at IAQ and overheating in three homes with equal internal layouts and designs but with different building fabric in the same location. Additionally, as far as the authors are aware, this study is the first attempt to assess the long-term IAQ—other than CO2-performance—in Scottish homes that share the same building characteristics except for energy-related factors. Finally, this paper discusses the results in the UK and Scottish context and discusses the impact that the new building regulation in Scotland could have on IAQ. This work focuses on the IAQ, as the dwellings’ energy performances are discussed elsewhere [34].

2. Method

This study involved IAQ monitoring and occupant perception surveys of three homes in Dunfermline, Scotland. The monitoring was conducted between the 15 January and the 15 August 2017, and the occupants’ IAQ perception surveys were conducted pre- and post-monitoring. Geographical regions with oceanic and subtropical highland (Cfb) weather, such as Dunfermline, are distinguished by a temperate climate with no dry season and warm summers [35].
Foobot IAQ monitors were used to measure relative humidity (0–100%RH; ±4%RH), temperature (−40–125 °C; ±0.4 °C), total volatile organic compounds (tVOC, 125–1000 μg/m3; ±1 μg/m3 or ±10%), and particulate matter—2.5 μm (PM2.5, 0–1300 μg/m3; ±4 μg/m3 or ±20%). The long-term IAQ monitoring using Foobot was tested and verified for accuracy [36] and the calibration process [37]. They found that the Foobot had a significant agreement with the reference instruments, for temperature (rs = 0.832–0.871), relative humidity (rs = 0.935–0.948), tVOC (rs = 0.827–0.869), and PM2.5 (rs = 0.787–0.866) data. The calibration equations for tVOC (Equation (1), R2 = 0.697) and PM2.5 (Equation (2), R2 = 0.887) reduced variability between the monitors and improved their accuracy when compared to the reference instruments.
t V O C = 1.56 + 4.5 F o o b o t   t V O C 0.02 F o o b o t   t V O C 2 + 3.57 e 5 F o o b o t   t V O C 3
P M 2.5 = 0.49 + 0.79 F o o b o t   P M 2.5 + 3.76 e 3 F o o b o t   P M 2.5 2
To address the limited monitoring protocols for measuring indoor air quality (IAQ) in residential buildings, this study adapted general IAQ monitoring protocols such as BS EN ISO 16000-1:2006, ASTM D6245-12, and the CIBSE KS1. The monitoring protocol adhered to the BS EN ISO 16000-1:2006 guidance and was modified for a novel monitoring approach that enabled remote monitoring. As described in [36], participants were directed to install the equipment in specific locations in their homes (layouts with indications were provided, see Figure 1) and to fill out online questionnaires. Data were collected in each room (kitchen, living room, and bedroom) at five-minute intervals using three devices. However, these devices were not suitable for outdoor deployment, so data for outdoor air quality was obtained from local monitoring networks. Outdoor PM2.5 was acquired from Air Quality in Scotland (http://www.scottishairquality.co.uk/ accessed 25 May 2018), and outdoor temperature and relative humidity were collected from the Met Office (https://www.metoffice.gov.uk/ accessed 3 June 2018). The monitoring network point is located within 2.8 km of the homes. A site visit was scheduled between November and December 2016 to conduct blower door (air tightness) tests before collecting IAQ data.
To gather the occupants’ perceptions of IAQ, certified surveys were used [38]. These surveys were administered to a total of nine participants (three in each home), and they included unipolar and bipolar seven-point rating scales to collect information about the occupants’ perceptions during both winter and summer. The survey results were evaluated according to the guidelines outlined in the survey framework [38]. Instead of keeping a detailed diary, the occupants provided a general weekly pattern of their activities, and information about window and door opening and the density of their homes during the study.

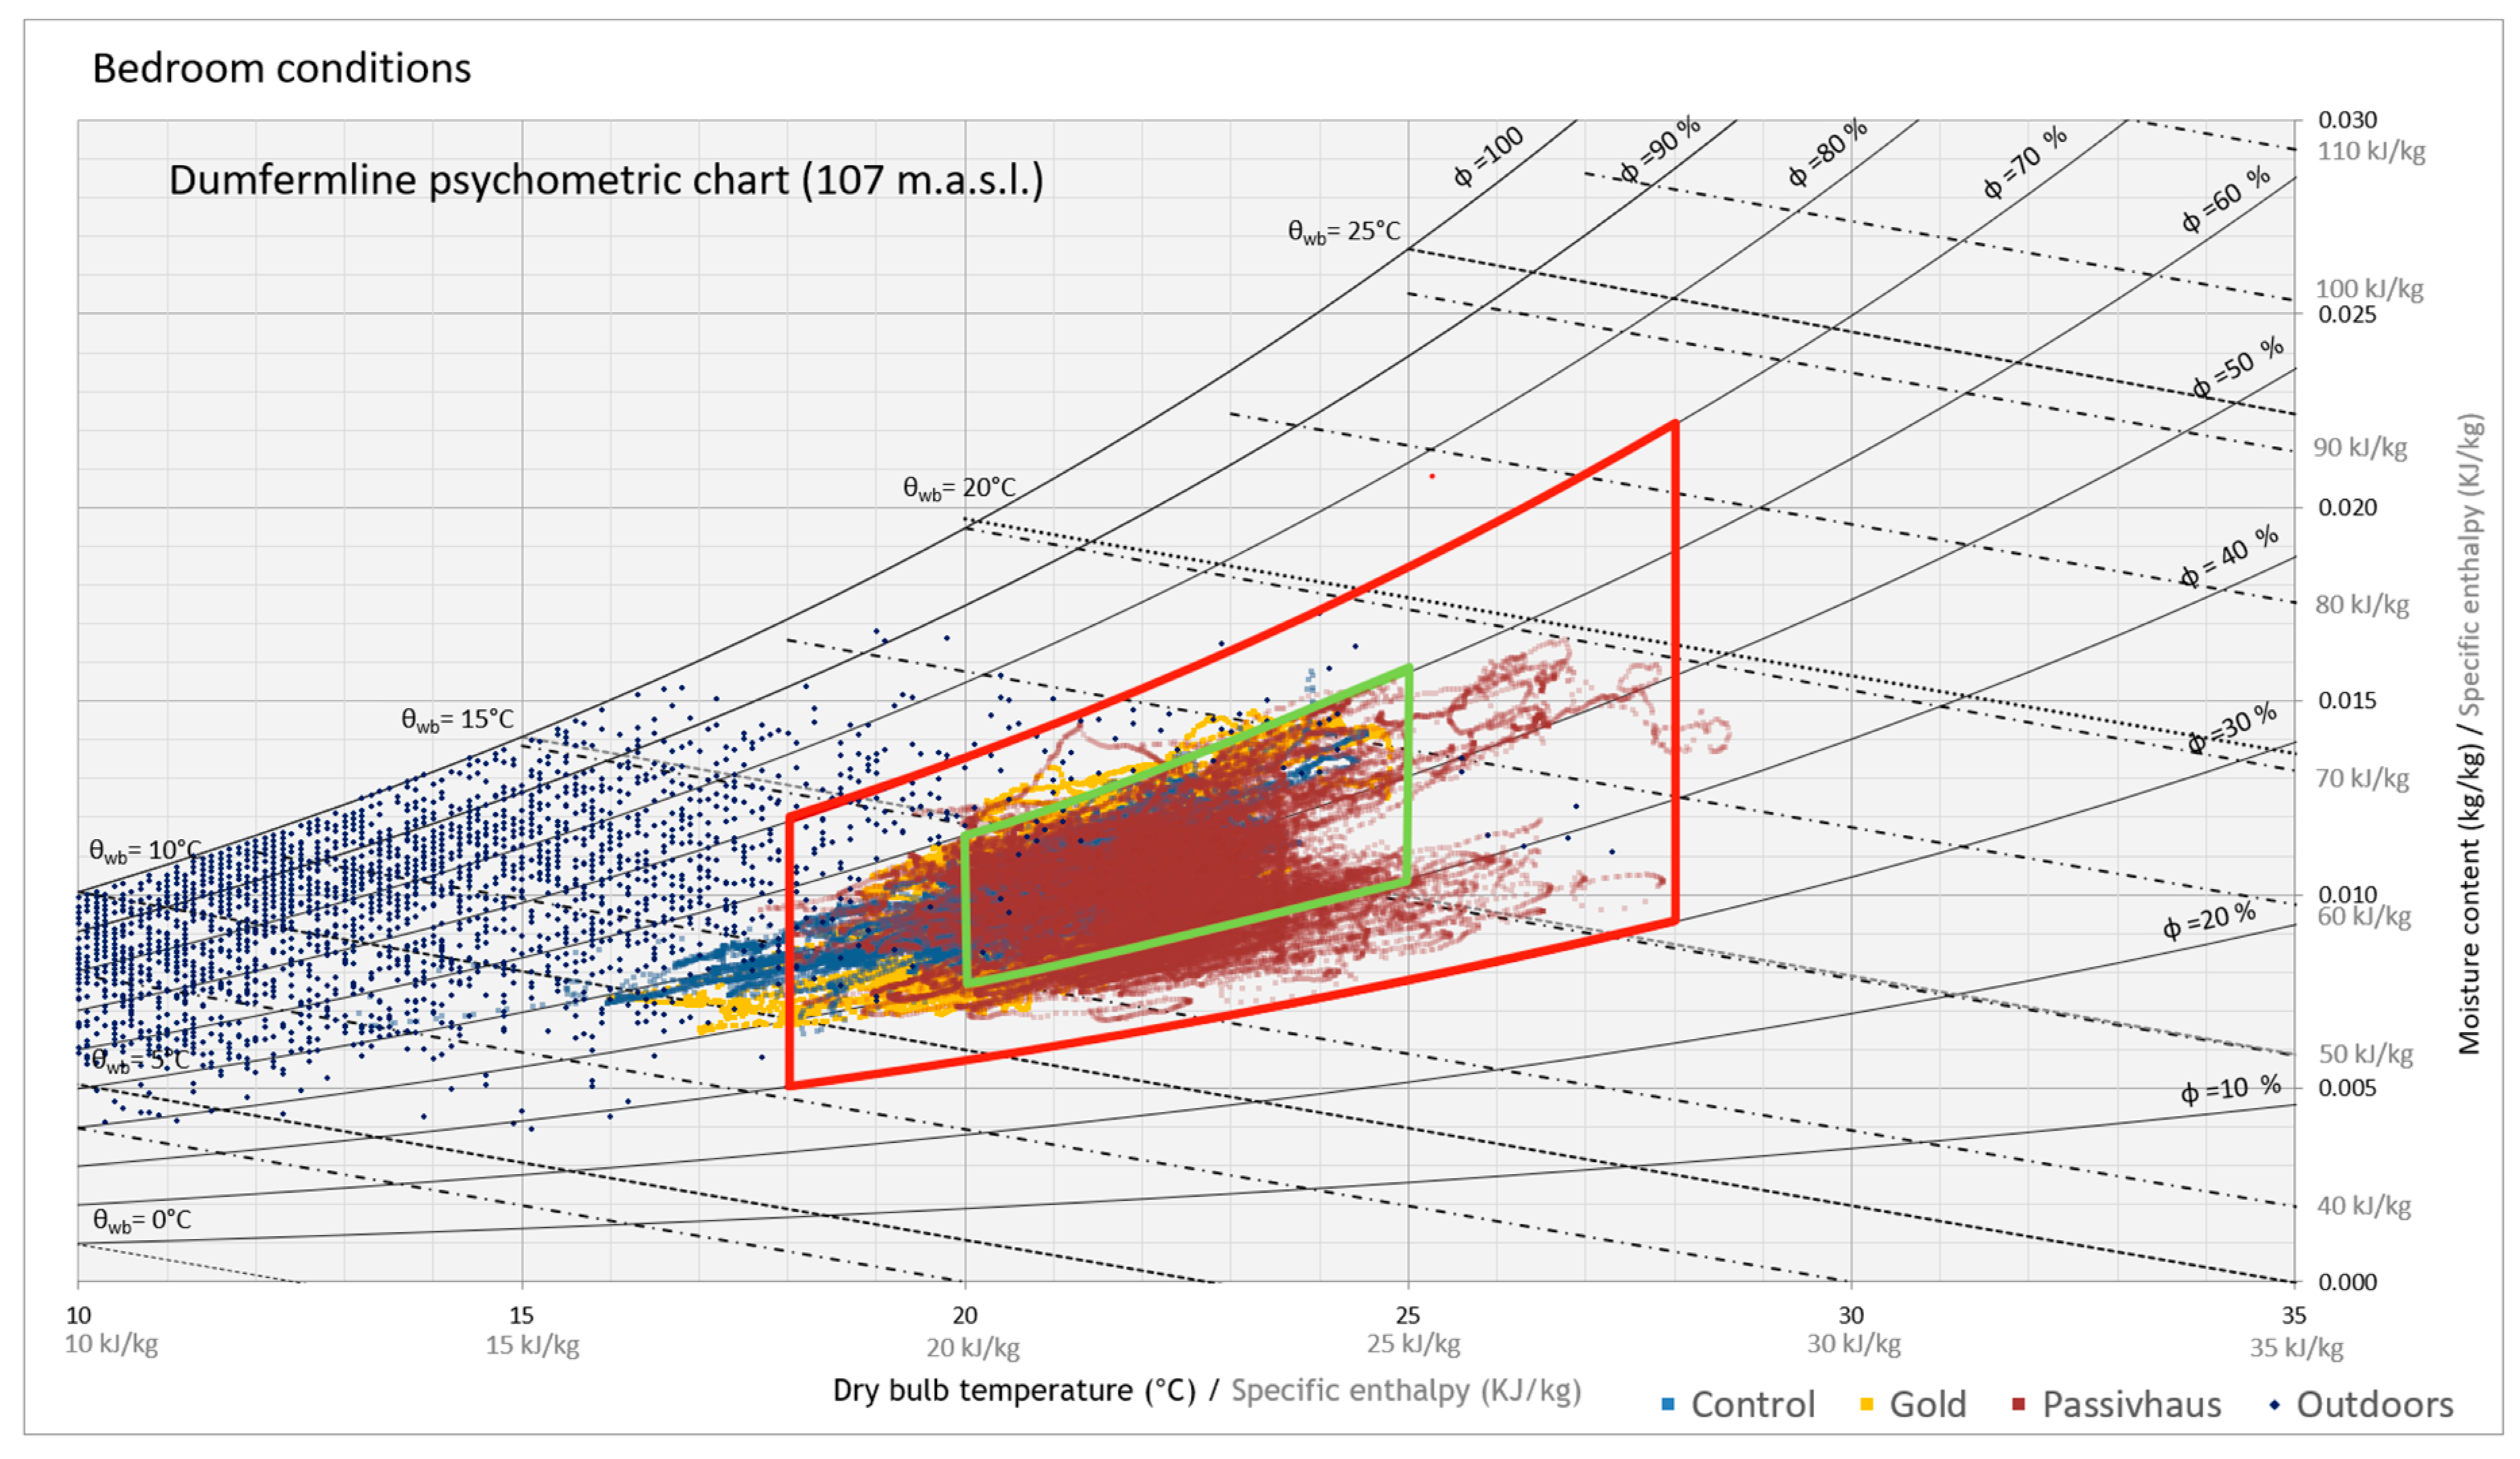
2.1. Hygrothermal Conditions

Assessing IAQ in mechanically ventilated buildings requires considering factors beyond air pollutants. For instance, high temperatures and relative humidity levels impact indoor material emission rates from indoor sources and the dissipation of airborne and chemical pollutants [39], as well as IAQ perception [40]. This work uses a static (i.e., CIBSE Guide A and Passivhaus) and a dynamic (i.e., Adaptive Approach) methods to evaluate thermal comfort. The use of the CIBSE TM59 was considered but ruled out, as it is based on simulations rather than measured temperatures as in the CIBSE TM52.
The Passivhaus threshold for indoor temperatures was used to evaluate the temperatures, as it aligns with Lang’s [40] and Haghighat’s [39] studies. The Passivhaus standard defines thermal comfort across five categories, based on the percentage of hours during which the temperature exceeds the 25 °C threshold (as shown in Table 1) [41]. For this study, the Passivhaus criteria benchmark is defined as having temperatures above 25 °C for more than 10% of the time and above 28 °C for 1% or more of the time.
The adaptive approach is described in the CIBSE TM52. It outlines the fact that the adaptive method utilizes a dynamic benchmark by taking into account indoor and outdoor temperatures over a period of multiple days. The upper and lower temperature limits are established based on the mean outdoor air temperature, as well as the maximum and minimum acceptable temperatures for Category II buildings, according to the CIBSE TM52 (which applies to new buildings or renovations):
U p p e r   l i m i t : T m a x = 0.33 T t m + 18.8 + 3
L o w e r   l i m i t : T m i n = 0.33 T t m + 18.8 3
The acceptable temperature range is represented by Tmin and Tmax, while Trm refers to the mean running temperature of the outdoor environment, which is calculated as follows:
T r m = T o d 1 + T o d 2 + T o d 3 + T o d 4 + T o d 5 + T o d 6 + T o d 7 / 3.8
T r m = 1 a T o d 1 + α T r m 1
The calculation of Trm involves taking the outdoor temperature daily mean for the previous day (Tod−1), the day before that (Tod−2), and so on. Trm−1 refers to the exponentially weighted running mean for the previous day, with α being 0.8. If a building or room satisfies any two of the following conditions, the adaptive approach recognises it as overheated [42]:
  • Hours of exceedance is a metric that assesses the duration for which the temperature exceeds a comfort threshold. In order to ensure comfort, the temperature difference (ΔT) between the measured temperature (T) and the maximum allowable temperature (Tmax) should not equal or exceed 1.0 °C for more than 3% of the occupied hours during the non-heating season (May to September).
  • Daily weighted exceedance is a metric that evaluates the severity of overheating on a particular day. If the daily limit for weighted exceedance (We) during occupied hours equals or exceeds 6, it is regarded as a failure. The computation of We involves the following equations:
W e = h e + W F
W e = h e × 0 + h e × 1 + h e × 2 + h e × 3
  • Upper-temperature limit metric assesses the highest acceptable indoor temperature and, as such, the temperature difference (ΔT) should never exceed 4 °C.
Relative humidity is also a significant factor in identifying the risk of dampness, mould growth, and the spread of house dust mites and other invertebrates. Research has revealed that keeping relative humidity under 60%RH can aid in preventing the proliferation of house dust mites [43]. Similar to Lang’s [40] and Haghighat’s [39] studies, for residential spaces, the CIBSE suggests levels of relative humidity between 40 and 70%RH, with 65%RH being the ideal level for adequate thermal comfort [44]. This study’s benchmark is 40–60%RH, which is widely considered the most suitable range.

2.2. Indoor Air Quality Criteria (PM2.5 and tVOC)

The increasing concern for the health effects of PM2.5, especially in residential buildings [45], has led to the establishment of various exposure thresholds. Some studies suggest that there is no safe exposure to PM2.5 in the long or short term [46]. Recommended daily mean exposure levels range from 8 µg/m3 [47] to 25 µg/m3 [48], it is generally agreed that levels of particulate matter above 25 µg/m3 can be detrimental to human health [49]. This work establishes the exposure benchmark for PM2.5 at 25 µg/m3 over 24 h, to align with the World Health Organisation’s guidelines.
Volatile organic compounds (VOCs) are a varied collection of compounds that evaporate at room temperature, and their total mix is typically referred to as total volatile organic compounds (tVOCs). There are varying recommendations for tVOC concentrations in non-industrial settings, with some guidelines starting from 25 µg/m3 [50] and going up to 500 µg/m3 [51]. However, it is generally accepted that a maximum level of 300 µg/m3 over 8 h should be adopted [52], which aligns with the UK guidelines [53] and is used as the benchmark for this study.

2.3. Household Characteristics

The homes are part of the Housing Innovation Showcase (HIS) built in 2012. The HIS is situated in the vicinity of a highway and a bustling street, implying a potential for high pollution concentrations. Motivated by environmental concerns, the HIS aimed to identify an approach to decrease CO2 emissions from new buildings in Scotland through high-performance homes. To this end, they constructed twenty-seven residential units in ten blocks, using various construction techniques. Although each block was built with a distinct building construction process, their flooring and roof systems were alike and included a combination of apartments and houses.
This case study examines three homes: a Passivhaus, a control house constructed to the minimum UK building regulations, and a gold standard home conforming to the Scottish building regulations (2007) [54]. The three homes are located next to each other. The internal layout of the homes is shown in Figure 1. Table 2, Table 3 and Table 4 show the characteristics of the households and the building fabric, respectively.
For this study, one of the key differences between the homes is the ventilation systems. The Passivhaus and gold standard homes relied on the MVHR system to provide continuous ventilation, while the standard home only had natural ventilation. The standard home relied on window opening, trickle vent ventilation and extraction fans in the kitchen and bathroom. The occupants stated that they kept the trickle vents closed at all times. The Passivhaus used the Paul Novus 300 MVHR, which provided an airflow rate between 145 m3/h to 200 m3/h depending on the setting running. The gold home used the Nuaire MXMRXBOX95-WH1 MVHR, which provides airflows between 120 m3/H and 180 m3/h.

2.4. Study Limitations

This study has some clear limitations. Firstly, it is based on a limited number of homes, 1 of each type. Hence the results cannot be generalised. However, the results discuss the first IAQ and thermal comfort comparison of dwellings with the same internal layout but different building fabrics in Scotland. Secondly, low-cost monitors were used in this research. While they were tested before the study, this could still suppose a drift in data. Three monitors were installed in each room to minimise this impact, providing data corroboration. Thirdly, this study did not focus on collecting ventilation flow rates of the homes; it was assumed that the air flows were those provided by a previous report [34], which also reviewed the MVHR efficiency. Hence, this study lacks an assessment according to the ASHRAE 62.2-2022 standard, as it is based mostly on air flow rates in residential buildings. Finally, the difference in sensing technologies between indoors and outdoors and the spatial differences between the locations of the homes and local networks can impact the data.

3. Results

3.1. Hygrothermal Conditions

The profiles for temperature and relative humidity are presented in Figure 2 and Figure 3. Supplementary Table S1 shows a statistical summary of the temperature and relative humidity results. Despite a relatively mild summer, all dwellings recorded temperatures exceeding 28 °C. Among all the rooms, the control home’s living room was the most susceptible to overheating, with a higher risk observed across all seasons. This implies that building occupants may prefer warmer temperatures or misuse the heating system, resulting in overheating. The Passivhaus dwelling also encountered overheating in the kitchen. The gold standard home exhibited a higher occurrence of low air temperatures, whereas temperatures ranging from 20 °C to 25 °C were more common in the Passivhaus home. The thermal comfort analysis results are shown in Table 5.
The three homes recorded relative humidity levels above the 60%RH threshold for 10% of the time or less, with the exception of the living room in the gold standard home, where it was measured at 11.2% of the time. One of the home occupants complained that the dwelling was very dry, and stated having to place bowls full of water on top of the living room radiator. The control (6.28% of the time) and Passivhaus (7.92% of the time) kitchens had higher occurrences of relative humidity exceeding 60%RH. The Passivhaus home had more frequent levels below the recommended 40%RH. The assessment of the ideal ranges (20 °C to 25 °C and 40%RH to 60%RH) indicated that the bedrooms were the most comfortable across all three homes (refer to Figure 4 and Table 6).

3.2. Particulate Matter 2.5 µm

The measured PM2.5 concentrations in all dwellings and those outdoors, alongside the frequency of concentrations above 25 µg/m3 and 10 µg/m3, are described in Table 7. A measured PM2.5 exceeding 100 µg/m3 was frequently found in the control and gold homes.
Based on the PM2.5 analysis, the variations in indoor concentrations among the dwellings are likely related to the pollution events and internal door opening. The PM2.5 concentration examination in the living rooms implies that the doors to the kitchen and bedroom may have been left open most of the time, resulting in identifiable pollution peaks traced to the bedroom. Nevertheless, pollution sources in the bedroom did not substantially affect the other rooms. The dissipation of PM2.5 can be influenced by a variety of factors, including the levels of PM2.5, heat [55], air flows, cooking methods, type and source of heating [56], and the presence of partitions and wall openings. A weak association was found between the indoor and outdoor concentrations through correlational analysis, and in certain instances, negative correlations were observed (Passivhaus: B rs = 0.167, K rs = 0.306 and L rs = 0.163 (p < 0.001); Gold: B rs = −0.157, K rs = 0.322 and L rs = 0.340 (p < 0.001): Control: B rs = −0.111, K rs = 0.235 and L rs = 0.235 (p < 0.001)). This indicates that the primary origins of indoor contamination are associated with either human behaviours or building materials.
There was a significant difference in PM2.5 levels between the ground floor and the first floor in the three homes. Additionally, in homes equipped with MVHR systems, PM2.5 levels were typically higher on the first floor than those recorded on the ground floor. The examination of the indoor–outdoor PM2.5 excess indicated that all three homes had higher indoor levels compared to those outdoors. Notably, the Passivhaus had relatively high mean levels of PM2.5 in the bedrooms, characterised by low background levels and a higher occurrence of PM2.5 pollution peaks.
There was a significant difference in PM2.5 concentrations in the three homes between the ground and first floors. Generally, concentrations on the first floor were higher than those on the ground floor for dwellings equipped with MVHR systems. All three homes had indoor PM2.5 concentrations that exceeded outdoor levels. Notably, even though the Passivhaus had some of the highest average PM2.5 concentrations in the bedroom, this was characterised by a higher occurrence of pollution peaks with low background concentrations, compared to the other dwellings.

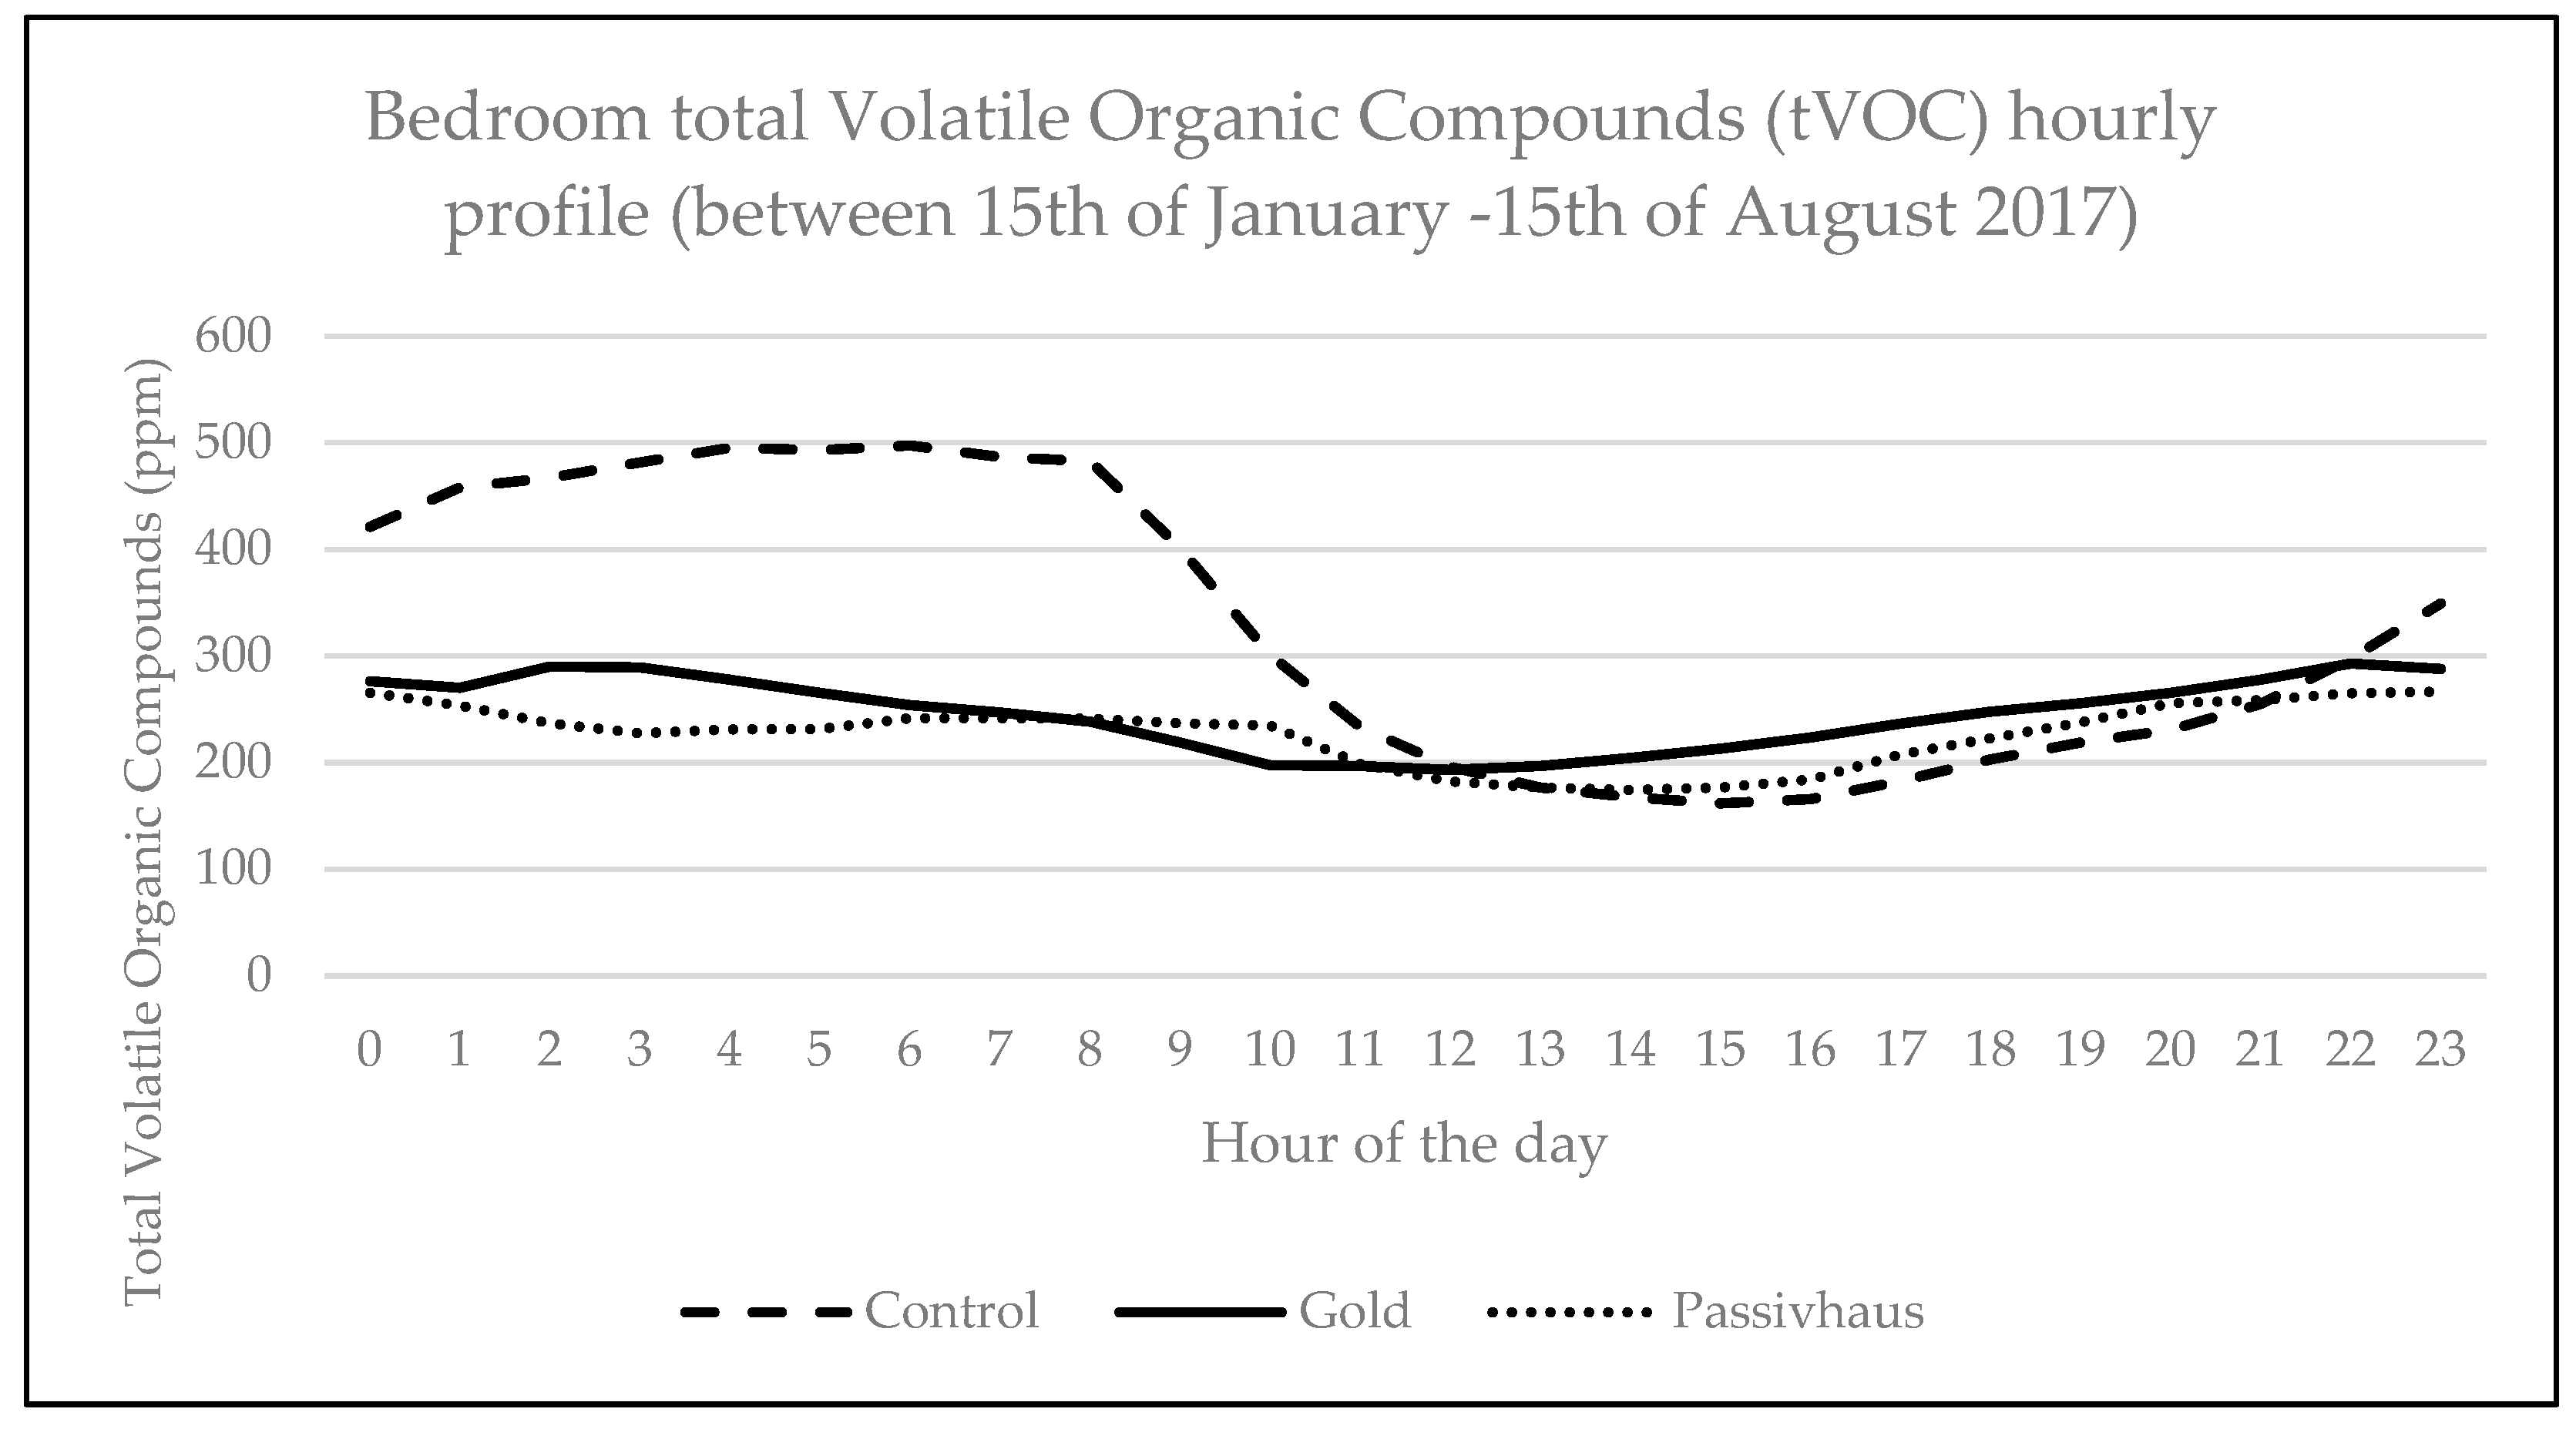
3.3. Total Volatile Organic Compounds

Table 7 provides a summary of the tVOC concentrations, indicating significant variations among the houses. The control home had the highest tVOC concentrations, followed by the gold and Passivhaus homes. All rooms in the three residences exhibited concentrations exceeding 300 µg/m3. The control home’s living room had the highest frequency of concentrations above the threshold, accounting for 56.26% of the time. In the gold and Passivhaus homes, the kitchens had the highest frequency of concentrations above 300 µg/m3, with 25.25% and 28.44%, respectively. Table 8 shows the lower frequency of occurrences in the control kitchen (36.98%) and the Passivhaus (11%) and gold (20.67%) living rooms. Many of these differences, however, could be associated with human behaviours rather than a direct impact of the buildings. Seasonal differences over the entire time period were noticed in the three dwellings, with mean concentrations lower in winter, while spring showed higher concentrations in the three homes.

3.4. Indoor Air Quality and Hygrothermal Conditions

The relation between temperature and relative humidity to indoor pollution—PM2.5 and tVOC—was explored, both in relation to seasonal and through the duration of the monitoring. The analysis of the relationship between temperature and PM2.5 (see Figure 5) and between the relative humidity and tVOC (see Figure 6) showed a weak association (below rs = 0.182; p < 0.001) between these variables. This suggests that higher levels of pollution indoors are associated with human behaviour and that indoor temperature and relative humidity have a minimal relation with each other, and might be related to other factors.
There were distinctive differences between the relation of indoor hydrothermal conditions to PM2.5 and tVOC during summer and winter. As seen in Figure 5 and Figure 6, the linear trends indicate higher air pollutant concentrations as temperature and relative humidity increase. This trend is more evident in the heating season, where constant warm temperatures are expected.

3.5. Indoor Air Quality Perception

Online surveys were conducted to evaluate the occupants’ perceptions of indoor air quality, utilising both bipolar and unipolar scales. The desired scores for the bipolar scale were within the range of 3 to 5, while for the unipolar scale, they were less than 3. The statistical analysis of the survey results is presented in Supplementary Tables S2 and S3. Occupants’ perceptions were collected from three participants in each house (See Table 2 for demographic characteristics).
The mean summer results for the odour scale (M = 4.00), still–draughty scale (M = 5.00) and fresh–stuffy scale (M = 4.67) of the control home require further investigation, although the home residents reported being satisfied with the overall IAQ (M = 2.67). This implies that while the home residents may have been uncomfortable with stuffy air and draughts, they did not view them as critical factors in global satisfaction. In the case of the gold dwelling, the building residents had comparable satisfaction (M = 2.5) results. However, issues with air movement (still, M = 2.00) and humidity (dry, M = 2.00) were acknowledged as requiring further investigation.
During summer, the residents of the gold home reported feeling that the air was excessively dry, leading them to place bowls filled with water on top of the radiators as a solution. Based on the psychrometric chart analysis, it was found that the living room had lower humidity and colder temperatures compared to the rest of the house. However, the levels were still within the range of extended comfort. There is a possibility that air movement might have contributed to this observation. Nonetheless, it is worth noting that the increased indoor humidity may affect the occupants’ perception of the indoor air quality, which they rated as satisfactory. Conversely, the occupants of the Passivhaus reported high satisfaction with the indoor air quality (M = 1.0) and perceived the air as humid (M = 5.5). Nonetheless, the analysis of relative humidity showed a lower occurrence than 7% of the time of levels exceeding 60%RH. It appears that they did not take humidity into account when evaluating IAQ satisfaction, likely because they focused on outdoor factors.
The residents living in the gold home reported that they had not observed any condensation on their windows or doors, despite having a humidity level of over 60%RH in the living room. However, they felt that the air was dry. On the other hand, one of the occupants in the control house experienced condensation on their windows and doors, which could be due to the humidity in the air. Although high levels of relative humidity were not measured, the high temperature in the control house may have concealed actual humidity issues, as evidenced in the psychrometric charts. The control house occupants also detected unpleasant odours from outside, since there was no air filtration in the ventilation system. Moreover, the indoor air was deemed stale, indicating that the airflows were not efficient enough to remove odours and indoor pollution.
During winter, occupants of the control home felt the air to be smelly (M = 4), stuffy (M = 5), and still (M = 5.33), which could be concerning. Although the overall satisfaction with winter IAQ was regarded as satisfactory (M = 3), some personal ratings raised concerns, suggesting that occupants may not always be satisfied with IAQ during winter. In the gold home, occupants perceived the air as still (M = 2) and dry (M = 2); nevertheless, they regarded the overall IAQ (M = 2.5) as satisfactory. Similarly-, in the summer, occupants of the Passivhaus perceived the air as too humid (M = 5.33) during winter; nonetheless, the residents regarded the overall IAQ (M = 1) as acceptable.
The Passivhaus occupants reported experiencing condensation on windows and doors, but the analysis showed a lower incidence of relative humidity exceeding 60%RH, while levels under 40%RH were more frequent. The examination of vapour levels indicated that they fall within the ideal comfort range (with a few exclusions monitored within the extended range), contradicting the residents’ opinion of the air being humid. The Passivhaus occupants also reported not experiencing any odours, which could be attributed to the proper maintenance of ventilation systems and filters, as indicated in a previous report [34].

4. Discussion

The three dwellings were found to have indoor temperatures associated with overheating. As the homes’ energy efficiency increased, the overheating occurrence was higher. This is similar to findings from a previous larger study [21]. The only exception to this was the control home’s living room, which showed higher levels of overheating, potentially related to the manual operation of windows to regulate temperature. The results were mixed for the hydrothermal (temperature and relative humidity) conditions. The gold home achieved conditions within the ideal range for 91.5% of the time in the bedroom, the control home 82.6% in the kitchen, and the Passivhaus 79.3% in the living room. These percentages were the best within all three dwellings. Another important metric that was evaluated for thermal comfort was when temperatures were below 20 °C. Research conducted in Scotland has found that temperatures under 18 °C may lead to high blood pressure [57]. In the gold home, temperatures lower than 18 °C were recorded in both the living room and kitchen. Furthermore, temperatures below the recommended ideal temperature of 21 °C in the UK [58] were measured in all of the homes.
Outdoor temperatures in Scotland are relatively low. According to the UK Met Office, average maximum summer temperatures are between 15 and 17 °C, while winter could be between 0 and 5 °C. Despite these temperatures, overheating has been identified in several homes around Scotland, particularly during summer [10]. This issue tends to be more common in high-energy-efficient dwellings, due to occupants’ behaviour and poor engagement with the building system. Dwelling design should consider how the design and specification can impact the risk of overheating in dwellings, particularly in a climate where heat waves and warmer summers are starting to become more common.
In a prior study, a PM2.5 24 h mean of 12.6 µg/m3 indoors was reported in a hundred dwellings located in Scotland and Ireland [59]. The study reported a considerably higher PM2.5 value of 99.3 µg/m3 in homes where smoking occurred, while inferior 24 h means were observed in homes where wood (5.7 µg/m3), coal (7.4 µg/m3), and gas (7.1 µg/m3) were burned. In the context of this work, the three dwellings exceeded 12.6 µg/m3 for 13.18% of the time in the Passivhaus; 28.95% in the gold home; and 32.53% in the control home. The 24 h average of PM2.5 concentrations suggested by the WHO (25 µg/m3) was surpassed in 13 days in the control home, 8 days in the gold home and 12 days in the Passivhaus.
The concentration of PM2.5 showed significant variation between the ground and first floor of all three dwellings. The PM2.5 levels on the first floor were consistently higher, compared to those measured on the ground floor. This suggests that the distribution of indoor PM2.5 was dependent on various factors, including location, source, ventilation system, and door openings. The Passivhaus and gold homes showed greater efficiency in reducing and diluting indoor pollutant concentrations, compared to the control home. This may be attributed to the Passivhaus and gold homes utilising MVHR systems to provide fresh air, leading to constant pollutant dilution and dissipation. In contrast, the control home relied on manually operated windows for ventilation. However, pollution peaks took longer to dissipate in the Passivhaus and gold homes, possibly due to their higher airtightness and lower ventilation rates.
Upon comparing the levels across the rooms, it was evident that the tVOC levels were consistently higher in the bedrooms than in the kitchens and living rooms. The high tVOC concentrations could be a potential health risk to building residents, as measurements indicated higher and continuous concentrations in the bedrooms. Occupied-bedroom tVOC concentrations exceeding 300 µg/m3 were observed in 71.45% of the control, 34.48% in the gold, and 21.67% in the Passivhaus homes. The tVOC levels observed in the three homes were similar to those found in another paper that measured indoor concentrations in buildings in the UK [60]. Indoor tVOC levels between 194 and 288 µg/m3 were measured in the dwellings, while outdoor levels in residential neighbourhoods were measured at 77.2 µg/m3.
The levels of TVOC pollution were observed to begin increasing in the early evening and remain consistent until the early morning, particularly in the control home (see Figure 7). The observed tVOC pollution concentrations in the living room at night were associated with those observed in the bedroom, but morning concentrations may be associated with human activities, such as cooking. For instance, cooking during dinner and breakfast may have been the primary pollution source in the kitchen, which could be linked to those in the living room.
The control home had the highest tVOC levels, exceeding 300 µg/m3, among the three homes. Concentrations exceeding 500 µg/m3 were observed for over 10% of the time. In contrast, the gold and Passivhaus homes had lower frequencies of tVOC concentrations above the recommended threshold. However, human behaviour may have contributed to these differences. Notably, tVOC levels exceeding the threshold were more frequently observed during reported occupancy.
The indoor environmental conditions in net zero homes are of particular interest in the UK. The UK published the Net Zero Strategy: Build Back Greener [3] national strategy, wherein the government recognises the importance of the building industry to meet this target. Thus, the national strategy is pushing the building regulations to higher levels of energy efficiency, to meet the carbon emissions target. As mentioned above, in May 2022, Scotland presented the Domestic Building Environmental Standards (Scotland) Bill, which was approved in 2023 and set to start in 2025. The bill pushes all new buildings to meet a Scottish equivalent (see Table 9). Hence, the evidence of the performance of the Passivhaus in Scotland is of utmost importance. Furthermore, other countries such as the US, Australia, New Zealand, France and Germany are also pushing to reduce their carbon emissions in the building industry.

5. Conclusions

This paper set out to evaluate and compare the indoor environment of three homes in Scotland with equal internal layouts but different building fabric construction specifications for energy efficiency control, representing the minimum standards, the Passivhaus with the highest standard, and the gold home, a benchmark between the previous cases. Although the results cannot be generalised due to the small number of homes, they present evidence for dwellings with high energy performance in Scotland. This is important, as policymakers in Scotland will be looking for such evidence of the performance of the Domestic Building Environmental Standards (Scotland) Bill (2025) and to support other countries following a similar path.
The indoor-environment monitoring campaign results suggest that higher levels of energy efficiency, the Passivhaus in this case, were related to better indoor environmental conditions, particularly IAQ. While no significant concerns for overheating were observed in any of the homes, the Passivhaus home design and construction need to be approached carefully, to reduce the risk of overheating. Further studies should be carried out with a higher number of homes to provide more evidence of the relationship between the building fabric and the indoor air quality and thermal comfort in Scotland.
While the occupant health implications for overheating and air pollution levels observed in the homes are fairly obvious, they are significant evidence of how the policy and practice of new net zero, energy-efficient dwellings in Scotland (and internationally) should respond. For instance, policy should consider minimum levels of overheating and look at resilient design in the context of future climate changes. Overheating and indoor air quality are only sometimes considered during the design phase, but they should be considered from the beginning, to provide healthier living environments. Inaccurate assessment, or if these aspects are not even considered, could lead to the use of new systems to overcome these factors’ impact, causing more reliance on active systems for air conditioning and purification, which could be avoided.

Supplementary Materials

The supporting information can be downloaded at https://www.mdpi.com/article/10.3390/buildings13061518/s1, Table S1: Statistical analysis of temperature, relative humidity and absolute humidity for the control, gold and Passivhaus homes, Table S2: Statistical analysis of IAQ perceptions for summer in the three homes, and Table S3: Statistical analysis of IAQ perceptions for winter in the three homes.

Author Contributions

Conceptualisation, A.M.-R., T.S., G.M. and F.M.; data curation, A.M.-R.; formal analysis, A.M.-R.; funding acquisition, A.M.-R.; investigation, A.M.-R.; methodology, A.M.-R., T.S., G.M. and F.M.; project administration, A.M.-R.; supervision, T.S., G.M. and F.M.; visualisation, A.M.-R.; writing—original draft, A.M.-R.; writing—review and editing, T.S., G.M. and F.M. All authors have read and agreed to the published version of the manuscript.

Funding

CONACyT partially funded this research through a Ph.D. grant. AirBoxLab (Foobot) partially funded this study, offering a discount on the monitors used in this research.

Institutional Review Board Statement

Ethical approval was sought and granted by the Glasgow School of Art Ethics Sub-committee; for further details, please refer to: https://www.gsa.ac.uk/media/497492/gsa_research_ethics_policy.pdf (accessed on the 3 April 2023).

Informed Consent Statement

Informed consent was obtained from all subjects involved in the study.

Data Availability Statement

The data for this study were part of a Ph.D. published in 2019 with an embargo until March 2024. Data could be made available before this date upon request to the corresponding author [37].

Acknowledgments

This work would not have been possible without the support and participation of the building occupants, for which we are thankful. Thanks are given to Adam Hotson, who offered useful editing and proofreading of an earlier version of this paper. The work published here was undertaken at the Mackintosh Environmental Research Unit.

Conflicts of Interest

The authors declare no conflict of interest. The funders had no role in the design of the study; in the collection, analyses, or interpretation of data; in the writing of the manuscript; or in the decision to publish the results.

References

  1. Malinauskaite, J.; Jouhara, H.; Ahmad, L.; Milani, M.; Montorsi, L.; Venturelli, M. Energy efficiency in industry: EU and national policies in Italy and the UK. Energy 2019, 172, 255–269. [Google Scholar] [CrossRef]
  2. European Commission. Roadmap for Moving to a Low-Carbon Economy in 2050; European Commission: Brussels, Belgium, 2011. [Google Scholar]
  3. Department for Business Energy & Industrial Strategy. Net Zero Strategy: Build Back Greener; Department for Business Energy & Industrial Strategy: London, UK, 2021; p. 368. [Google Scholar]
  4. Moreno-Rangel, A. Passive House Institute and US Green Building Council. In The Palgrave Handbook of Global Sustainability; Brinkmann, R., Ed.; Palgrave Macmillan: Cham, Switzerland, 2022; pp. 1–11. [Google Scholar] [CrossRef]
  5. Moreno-Rangel, A. Passivhaus. Encyclopedia 2021, 1, 20–29. [Google Scholar] [CrossRef]
  6. Sullivan, L.; Smith, N.; Adams, D.; Andrews, I.; Aston, W.; Bromley, K.; Butler, K.; Christie, A.; Davies, M.; Decort, P.; et al. Mechanical Ventilation with Heat Recovery in New Homes; Zero Carbon Hub: London, UK, 2013. [Google Scholar]
  7. Abouleish, M. Indoor air quality and COVID-19. Public Health 2021, 191, 1–2. [Google Scholar] [CrossRef] [PubMed]
  8. Kumar, A.; Moreno-Rangel, A.; Khan, M.A.I.; Piasecki, M. Ventilation and Indoor Air Quality. Atmosphere 2022, 13, 1730. [Google Scholar] [CrossRef]
  9. Wang, Z.; Yu, Z. PM2.5 and Ventilation in a Passive Residential Building. Procedia Eng. 2017, 205, 3646–3653. [Google Scholar] [CrossRef]
  10. Foster, J.; Sharpe, T.; Poston, A.; Morgan, C.; Musau, F. Scottish Passive House: Insights into Environmental Conditions in Monitored Passive Houses. Sustainability 2016, 8, 412. [Google Scholar] [CrossRef]
  11. Moreno-Rangel, A.; Sharpe, T.; McGill, G.; Musau, F. Indoor Air Quality in Passivhaus Dwellings: A Literature Review. Int. J. Environ. Res. Public Health 2020, 17, 4749. [Google Scholar] [CrossRef]
  12. Moreno-Rangel, A.; Musau, F.; Sharpe, T.; McGill, G. Indoor Air Quality Assessment of Latin America’s First Passivhaus Home. Atmosphere 2021, 12, 1477. [Google Scholar] [CrossRef]
  13. Roh, T.; Moreno-Rangel, A.; Baek, J.; Obeng, A.; Hasan, N.T.; Carrillo, G. Indoor Air Quality and Health Outcomes in Employees Working from Home during the COVID-19 Pandemic: A Pilot Study. Atmosphere 2021, 12, 1665. [Google Scholar] [CrossRef]
  14. Pietrogrande, M.C.; Casari, L.; Demaria, G.; Russo, M. Indoor Air Quality in Domestic Environments during Periods Close to Italian COVID-19 Lockdown. Int. J. Environ. Res. Public Health 2021, 18, 4060. [Google Scholar] [CrossRef]
  15. Lim, A.-Y.; Yoon, M.; Kim, E.-H.; Kim, H.-A.; Lee, M.J.; Cheong, H.-K. Effects of mechanical ventilation on indoor air quality and occupant health status in energy-efficient homes: A longitudinal field study. Sci. Total Environ. 2021, 785, 147324. [Google Scholar] [CrossRef] [PubMed]
  16. O’Donovan, A.; Murphy, M.C.; Charles, E.; Baker, N.; O’Sullivan, P.D. Technical Evaluation of a Retrofitted MVHR System: Design and In-Use Performance. ASHRAE Trans. 2021, 127, 81–90. [Google Scholar]
  17. Zune, M.; Kolokotroni, M. Correlation model to evaluate two European climates’ impacts on thermal comfort and indoor air quality in houses. In Proceedings of the 3rd International Conference on: Comfort at the Extremes: COVID, Climate Change and Ventilation [CATE 2022], Edinburgh, UK, 5–6 September 2022; pp. 1–15. Available online: http://mosser.scot/CATE2022/CATE2022%20Proceedings%20(web_220930).pdf (accessed on 15 May 2023).
  18. Amoatey, P.; Al-Jabri, K.; Al-Saadi, S.; Al-Saadi, S.N. Influence of phase change materials on thermal comfort, greenhouse gas emissions, and potential indoor air quality issues across different climatic regions: A critical review. Int. J. Energy Res. 2022, 46, 22386–22420. [Google Scholar] [CrossRef]
  19. Tuohy, P.; Murphy, G.; Deveci, G. Lessons from Post Occupancy Evaluation and Monitoring of the 1st Certified Passive House in Scotland. In Proceedings of the 2012 Passivhaus Norden Conference: From Low Energy Buildings to Plus Energy Developments, Trondheim, Norway, 21–23 October 2012. [Google Scholar]
  20. McGill, G.; Sharpe, T.; Oyedele, L.; Keeffe, G.; McAllister, K. An Investigation of Indoor Air Quality in UK Passivhaus Dwellings. Smart Innov. Syst. Technol. 2017, 67, 245–268. [Google Scholar] [CrossRef]
  21. Gupta, R.; Gregg, M.; Irving, R. Meta-analysis of summertime indoor temperatures in new-build, retrofitted, and existing UK dwellings. Sci. Technol. Built Environ. 2019, 25, 1212–1225. [Google Scholar] [CrossRef]
  22. Morgan, C.; Foster, J.A.; Poston, A.; Sharpe, T.R. Overheating in Scotland: Contributing factors in occupied homes. Build. Res. Inf. 2017, 45, 143–156. [Google Scholar] [CrossRef] [Green Version]
  23. Sharpe, T.; Morgan, C.; Shearer, D. Towards Low Carbon Homes—Measured Performance of Four Passivhaus Projects in Scotland. In Proceedings of the EUROSUN 2014, Aix-Les Bains, France, 16–19 September 2014; pp. 1–10. [Google Scholar] [CrossRef]
  24. Moreno-Rangel, A.; Sharpe, T.; McGill, G.; Musau, F. Thermal comfort assessment of the first residential Passivhaus in Latin America. J. Build. Eng. 2021, 43, 103081. [Google Scholar] [CrossRef]
  25. Hatt, T.; Saelzer, G.; Hempel, R.; Gerber, A. High indoor comfort and very low energy consumption through the implementation of the passive house standard in Chile. Rev. Constr. 2012, 11, 123–134. [Google Scholar] [CrossRef]
  26. Zhao, J.; Carter, K. Perceived Comfort and Adaptive Process of Passivhaus ‘Participants’. Energy Procedia 2015, 83, 121–129. [Google Scholar] [CrossRef] [Green Version]
  27. Peacock, A.; Jenkins, D.; Kane, D. Investigating the potential of overheating in UK dwellings as a consequence of extant climate change. Energy Policy 2010, 38, 3277–3288. [Google Scholar] [CrossRef]
  28. Al-Yasiri, Q.; Szabó, M. Incorporation of phase change materials into building envelope for thermal comfort and energy saving: A comprehensive analysis. J. Build. Eng. 2021, 36, 102122. [Google Scholar] [CrossRef]
  29. Mendell, M. Do we Know Much about Low Energy Buildings and Health? In Proceedings of the ASHRAE IAQ: Environmental Health in Low Energy Buildings, Vancouver, BC, Canada, 15–18 October 2013. [Google Scholar]
  30. Seppänen, O.A.; Fisk, W.J. Summary of human responses to ventilation. Indoor Air 2004, 14 (Suppl. 7), 102–118. [Google Scholar] [CrossRef] [Green Version]
  31. Wargocki, P. The Effects of Ventilation in Homes on Health. Int. J. Vent. 2013, 12, 101–118. [Google Scholar] [CrossRef]
  32. Yu, C.; Crump, D. Indoor Environmental Quality—Standards for Protection of Occupants’ Safety, Health and Environment. Indoor Built Environ. 2010, 19, 499–502. [Google Scholar] [CrossRef]
  33. Bernstein, J.A.; Alexis, N.; Bacchus, H.; Bernstein, I.L.; Fritz, P.; Horner, E.; Li, N.; Mason, S.; Nel, A.; Oullette, J.; et al. The health effects of nonindustrial indoor air pollution. J. Allergy Clin. Immunol. 2008, 121, 585–591. [Google Scholar] [CrossRef]
  34. Jack, M.; Currie, J.; Bros-Williamson, J.; Stinson, J. Housing Innovation Showcase 2012: Building Performance Evaluation, Phase 1-Part 1; Kingdom Housing Association: Inverness, UK, 2013; p. 180. [Google Scholar] [CrossRef] [Green Version]
  35. Kottek, M.; Grieser, J.; Beck, C.; Rudolf, B.; Rubel, F. World map of the Köppen-Geiger climate classification updated. Meteorol. Z. 2006, 15, 259–263. [Google Scholar] [CrossRef]
  36. Moreno-Rangel, A.; Sharpe, T.; Musau, F.; McGill, G. Field evaluation of a low-cost indoor air quality monitor to quantify exposure to pollutants in residential environments. J. Sens. Sens. Syst. 2018, 7, 373–388. [Google Scholar] [CrossRef] [Green Version]
  37. Moreno-Rangel, A. Continuous IAQ Monitoring with Low-Cost Monitors: Protocol Development, Performance and Application in Residential Building. The Glasgow School of Art. 2019. Available online: https://discovery.gsa.ac.uk/discovery/fulldisplay?context=L&vid=44GSA_INST:44GSA_VU1&docid=alma991000649329706296 (accessed on 25 November 2022).
  38. Raw, G.J. A Questionnaire for Studies of Sick Building Syndrome: A Report to the Royal Society of Health; BRE Press: Watford, UK, 1995. [Google Scholar]
  39. Haghighat, F.; De Bellis, L. Material emission rates: Literature review, and the impact of indoor air temperature and relative humidity. Build. Environ. 1998, 33, 261–277. [Google Scholar] [CrossRef]
  40. Fang, L.; Clausen, G.; Fanger, P.O. Impact of Temperature and Humidity on the Perception of Indoor Air Quality. Indoor Air 1998, 8, 80–90. [Google Scholar] [CrossRef]
  41. Feist, W.; Bastian, Z.; Ebel, W.; Gollwitzer, E.; Grove-Smith, J.; Kah, O.; Kaufmann, B.; Krick, B.; Pfluger, R.; Schnieders, J.; et al. Passive House Planning Package Version 9, The Energy Balance and Design Tool for Efficient Buildings and Retrofits, 1st ed.; Passive House Institute: Darmstadt, Germany, 2015. [Google Scholar]
  42. CIBSE. The Limits of Thermal Comfort: Avoiding Overheating in European Buildings TM52b; CIBSE: London, UK, 2013; Available online: https://www.cibse.org/knowledge-research/knowledge-portal/tm52-the-limits-of-thermal-comfort-avoiding-overheating-in-european-buildings (accessed on 3 December 2022).
  43. Wolkoff, P.; Kjærgaard, S.K. The dichotomy of relative humidity on indoor air quality. Environ. Int. 2007, 33, 850–857. [Google Scholar] [CrossRef]
  44. Chartered Institution of Building Services Engineers. CIBSE Guide A: Environmental Design, 7th ed.; CIBSE Publications: Norwich, UK, 2006. [Google Scholar] [CrossRef]
  45. Crump, D.; Dengel, A.; Swainson, M. Indoor Air Quality in Highly Energy Efficient Homes—A Review; BRE Press: St. Albans, UK, 2009. [Google Scholar]
  46. Laxen, D.; Moorcroft, S.; Marner, B.; Laxen, K.; Boulter, P.; Barlow, T.; Harrison, R.; Heal, M. PM 2.5 in the UK. Report for SNIFFER, Edinburgh. December 2010. Available online: https://www.sniffer.org.uk/Handlers/Download.ashx?IDMF=a199be3c-548b-4063-900d-c209823d38b3 (accessed on 12 June 2023).
  47. National Environmental Protection Council. National Environment Protection (Ambient Air Quality) Measure; National Environmental Protection Council: Canberra, Australia, 2003.
  48. European Commission. Air Quality Standards. Air Quality. 2015. Available online: http://ec.europa.eu/environment/air/quality/standards.htm (accessed on 10 September 2015).
  49. WHO. Air Quality Guidelines for Europe, 2nd ed.; WHO Regional Publications: Copenhagen, Denmark, 2000. [Google Scholar]
  50. Molhave, L.; Clausen, G.; Berglund, B.; Ceaurriz, J.; Kettrup, A.; Lindvall, T.; Maroni, M.; Pickering, A.C.; Risse, U.; Rothweiler, H.; et al. Total Volatile Organic Compounds (TVOC) in Indoor Air Quality Investigations. Indoor Air 1997, 7, 225–240. [Google Scholar] [CrossRef]
  51. Delia, A. Total Volatile Organic Compounds (Total VOCs) in the Air; State of Knowledge Report for PRISM Analytical Technologies; PRISM Analytical Technologies: Mt. Pleasant, MI, USA, 2012; pp. 1–4. [Google Scholar]
  52. ECA. European Collaborative Action Indoor Air Quality & Its Impact on Man: Report No.11: Guidelines for Ventilation Requirements in Buildings; Commission of the European Communities: Luxembourg, 1992. [Google Scholar]
  53. HM Government. Ventilation—Approved Document F Volume 1 applies to dwellings. In The Building Regulation 2010; Approved Document L1; HM Government: London, UK, 2013; p. 61. [Google Scholar]
  54. Scottish Government. Domestic Technical Handbook 2017; Scottish Government: Edinburgh, UK, 2017. Available online: http://www.gov.scot/Topics/Built-Environment/Building/Building-standards/publications/pubtech/thb2011octdom (accessed on 10 September 2019).
  55. Wan, M.P.; Wu, C.L.; To, G.N.S.; Chan, T.C.; Chao, C.Y.H. Ultrafine particles, and PM2.5 generated from cooking in homes. Atmos. Environ. 2011, 45, 6141–6148. [Google Scholar] [CrossRef]
  56. Torkmahalleh, M.A.; Gorjinezhad, S.; Unluevcek, H.S.; Hopke, P.K. Review of factors impacting emission/concentration of cooking generated particulate matter. Sci. Total Environ. 2017, 586, 1046–1056. [Google Scholar] [CrossRef] [PubMed]
  57. Shiue, I.; Shiue, M. Indoor temperature below 18 °C accounts for 9% population attributable risk for high blood pressure in Scotland. Int. J. Cardiol. 2014, 171, e1–e2. [Google Scholar] [CrossRef]
  58. PHE. Minimum Home Temperature Thresholds for Health in Winter: A Systematic Literature Review; Public Health England: London, UK, 2014; pp. 1–69. [Google Scholar]
  59. Semple, S.; Garden, C.; Coggins, M.; Galea, K.S.; Whelan, P.; Cowie, H.; Sánchez-Jiménez, A.; Thorne, P.S.; Hurley, J.F.; Ayres, J.G. Contribution of solid fuel, gas combustion, or tobacco smoke to indoor air pollutant concentrations in Irish and Scottish homes. Indoor Air 2012, 22, 212–223. [Google Scholar] [CrossRef] [Green Version]
  60. Lai, H.; Kendall, M.; Ferrier, H.; Lindup, I.; Alm, S.; Hänninen, O.; Jantunen, M.; Mathys, P.; Colvile, R.; Ashmore, M.; et al. Personal exposures and microenvironment concentrations of PM2.5, VOC, NO2 and CO in Oxford, UK. Atmos. Environ. 2004, 38, 6399–6410. [Google Scholar] [CrossRef]
Figure 1. Home floor plans. The red (extract) and blue (supply) lines indicate the ducts for the MVHR system for the dwellings that have one. The green dots represent the location of each of the Foobot devices in each room. Source: Authors, adapted from [34].
Buildings 13 01518 g001
Figure 2. Temperature profile of the control, gold and Passivhaus homes between the 15 January and the 15 August 2017. Source: Authors.
Buildings 13 01518 g002
Figure 3. Relative humidity profile of the control, gold and Passivhaus homes between the 15 January and the 15 August 2017. Source: Authors.
Buildings 13 01518 g003
Figure 4. Psychrometric chart of the bedroom conditions in the three homes and outdoors. The green box identifies the ideal comfort criteria and the red box the extended comfort. Source: Authors.
Buildings 13 01518 g004
Figure 5. PM2.5 and temperature scatter plot showing the linear relation in the living room by season in each of the homes. Blue—summer, green—spring and orange—winter, top to bottom—control, gold and Passivhaus homes. Source: Authors.
Buildings 13 01518 g005
Figure 6. tVOC and relative humidity scatter plot showing the linear relation in the bedroom by season in each of the homes. Blue—summer, green—spring and orange—winter; top to bottom—control, gold and Passivhaus homes. Source: Authors.
Buildings 13 01518 g006
Figure 7. Hourly mean tVOC levels in the three homes. Source: Authors.
Buildings 13 01518 g007
Table 1. Frequency of overheating criteria in Passivhaus dwellings. Adapted from [41].
% of the Time of Temperature above 25 °CAssessment
≥15%Catastrophic
10–15%Poor
5–10%Acceptable
2–5%Good
<2%Excellent
Table 2. Household characteristics. Source: Authors.
Household CharacteristicPassivhausGoldControl
Household occupancy4 adults2 adults2 adults, 2 children
Age range2 × 25–35;
2 × 45–75
35–4535–45, <16
Gender3 M, 1 F1 M, 1 F2 M, 2 F
SmokingNoNoNo
Cooking fuelElectricityElectricityGas
Heating fuelGasElectricityGas
Occupancy pattern
Bedroom22:30–06:30;22:30–06:30;22:30–06:30;
Kitchen07:30–09:00; 12:35–14:00; 20:30–21:3007:30–09:00; 12:35–14:00; 20:30–21:3007:30–09:00; 12:35–14:00; 20:30–21:30
Living room09:00–12:30; 14:00–20:30; 21:30–22:3009:00–12:30; 14:00–20:30; 21:30–22:3009:00–12:30; 14:00–20:30; 21:30–22:30
Frequency of window opening
Morning *RegularlyNeverNever
Afternoon *RegularlyNeverRegularly
Evening *RegularlyConstantlyRarely
Night *ConstantlyNeverRarely
* Constantly: >5 h/d, Regularly: 5–2.5 h/d, Rarely: 2.5–0 h/d, Never: 0 h/d.
Table 3. Main building characteristics of the control, gold and Passivhaus homes. Source: Authors, with data taken from [34].
Building CharacteristicPassivhausGoldControl
Airtightness as-designed @50 Pa0.60 m3/(h·m3)3.00 m3/(h·m3)5.00 m3/(h·m3)
Airtightness as-built @ 50 Pa0.53 m3/(h·m3)3.90 m3/(h·m3)3.60 m3/(h·m3)
Internal floor area94 m296 m296 m2
Ug-value (window)0.8 W/(m2K)0.8 W/(m2K)0.8 W/(m2K)
U-value (floor slab)0.15 W/(m2K)0.15 W/(m2K)0.15 W/(m2K)
U-value (roof)0.10 W/(m2K)0.09 W/(m2K)0.10 W/(m2K)
U-value (external wall)0.10 W/(m2K)0.15 W/(m2K)0.23 W/(m2K)
VentilationMVHRMVHRNatural with window trickle vents, extract fans
Window typeTriple glazing, low-e, uPVCTriple glazing, low-e, uPVCTriple glazing, low-e, uPVC
Building Certification or StandardCertified PassivhausGold Standard 2016 SBS 12010 SBS 1
ContractorCampion HomesSpringfield PropertiesCampion Homes
1 SBS: Scottish Building Standard.
Table 4. Main construction elements of the homes. Source: Authors, with data taken from [34].
Building
Element
PassivhausGoldControl
Flooring
(indoor to outdoors)
22 mm V313 chipboard on 70 × 50 mm treated timber battens @ 400 mm with 45 mm rigid insulation between 150 mm of rigid insulation on VCL, on a concrete slab and 25 mm of sand blinding22 mm chipboard, 70 mm treated batten service zone, 100 mm perimeter insulation, 150 mm RC in situ ground-bearing slab, 100 mm rigid insulation, 25 mm
sand blinding
22 mm V313 chipboard on 70 × 50 mm treated timber battens @ 400 mm with 20 mm service void, concrete slab, 100 mm rigid insulation, 25 mm sand blinding
External walls
(indoor to outdoors)
12.5 mm plasterboard, 25 mm internal service battens, 25 mm polyurethane board, an airtight/vapour control layer (VCL), 10 mm OSB, 235 mm injected polyurethane insulation, 235 × 38 mm treated timber panelling, 10 mm OSB, and a layer of reflectashield TF insulating barrier12.5 mm wallboard, 25 mm batten/service zone, VCL, 11 mm OSB, 45 × 45 mm stud filled with insulation, 65 mm insulation, 90 × 45 mm stud insulation, 9 mm OSB, thermo reflective breather
membrane, 50 mm cavity, 102.5 common brick, 19 mm render coat
12.5 mm plasterboard, a VCL, 140 mm timber frame panels with insulation between studs, 10 mm OSB sheathing, a reflective breather membrane, 50 mm vertical treated timber battens @ 600 m
and 5 mm of proprietary render system
Attic roof
(indoor to outdoors)
12.5 mm plasterboard (ceiling supported by treated timber), 350 mm mineral wool insulation (between the over rafters), 50 mm gap of proprietary eaves vent tray, 10 mm OSB, concrete roof tiles (25 × 50 mm sw tiling battens, 18 × 25 mm counter battens, proctor roof shield roofing membrane, proprietary roof cassette)12.5 wallboard, VCL, 3 × 90 mm insulation, 22 mm P5 chipboard, attic frame, 15 mm OSB, roof membrane, 25 × 50 mm treated counter battens, 25 × 38 mm treated battens, fibre cement tiles12.5 mm plasterboard (ceiling supported by treated timber), 350 mm mineral wool insulation (between the over rafters), 50 mm gap of proprietary eaves vent tray, 10 mm OSB, concrete roof tiles (25 × 50 mm sw tiling battens, 18 × 25 mm counter battens, type 1f roof felt, 15 mm OSB sheathing)
Table 5. Summary of temperature analysis from the control, gold and Passivhaus homes. Source: Authors.
RoomCriterionControlGoldPassivhaus
WinterSpringSummerAllWinterSpringSummerAllWinterSpringSummerAll
BedroomPassivhaus
CIBSE A (23 °C/25 °C)
CIBSE A (26 °C/28 °C)
Adaptive approach Criterion 1---- ---- ----
Adaptive approach Criterion 2
Adaptive approach Criterion 3
KitchenPassivhaus
CIBSE A (23 °C/25 °C)
CIBSE A (26 °C/28 °C)
Adaptive approach Criterion 1-------- ----
Adaptive approach Criterion 2
Adaptive approach Criterion 3
Living roomPassivhaus
CIBSE A (23 °C/25 °C)
CIBSE A (26 °C/28 °C)
Adaptive approach Criterion 1-------- ----
Adaptive approach Criterion 2
Adaptive approach Criterion 3
-- = not applicable. • = failed criterion.
Table 6. Percentage of time that each home meets the ideal criteria (20–25 °C; 40–60%RH). Source: Authors.
PassivhausGoldControl
Bedroom74.9%91.5%82.4%
Kitchen44.9%61.2%82.6%
Living room79.3%16.5%23%
Total66.4%56.4%62.7%
Table 7. Analysis summary of time periods with PM2.5 concentrations exceeding 25 µg/m3 in the three homes between the 15 January and the 15 August 2017. Source: Authors.
All Period Mean (µg/m3)Standard Deviation% of Time above 10 µg/m3No. of Days with a Daily Mean above 25 µg/m3% of Days above 25 µg/m3
PassivhausBedroom15.1542.0229.27%126.15%
Kitchen8.2619.2516.21%31.67%
Living room9.1523.4620.61%42.05%
GoldBedroom14.017.4065.92%42.05%
Kitchen11.7318.4544.43%84.10%
Living room8.9117.8021.23%42.05%
ControlBedroom10.8914.1635.04%136.67%
Kitchen15.7026.4667.98%105.26%
Living room11.6916.4542.61%52.56%
Outdoors5.555.4713.17%21.03%
Table 8. Summary of the analysis of time periods when tVOC levels exceeded 300 µg/m3 in the three homes between the 15 January and the 15 August 2017. Source: Authors.
All Period Mean (µg/m3)Standard Deviation% of Time above 300 µg/m3% of Time above 300 µg/m3 When OccupiedNo. of Days with a Daily Mean above 300 µg/m3
PassivhausBedroom224.6889.0216.54%21.67%21
Kitchen271.56128.4428.44%37.78%51
Living room201.3299.9111.00%9.89%5
GoldBedroom246.61102.4025.08%34.48%35
Kitchen248.22104.9225.25%23.99%40
Living room234.6494.9720.67%57.53%19
ControlBedroom323.60211.0741.85%71.45%103
Kitchen282.90144.2136.98%30.20%71
Living room345.95145.4556.26%57.84%130
Table 9. Summary of the building characteristics of the Scottish Regulations (2015, 2020, 2025) and Passivhaus. Source: Authors, based on Scottish Regulations (2015, 2020, 2025) and the Passivhaus Planning Package (PHPP).
Thermal ElementScottish Building Regulations Section 6 (2015) U-Values (W/m2K)Scottish Building Regulations Section 6 (2020) U-Value (W/m2K)Scottish Building Regulations Section 6 (2025) U-Value (W/m2K)Passivhaus U-Value (W/m2K)
Wall0.170.150.130.10–0.15
Roof0.110.090.090.10–0.15
Floor0.150.120.100.10–0.15
Windows1.41.20.8–1.00.8
Doors1.41.20.8–1.00.8
Air Permeability7 m3/(h·m2) at 50 Pa5.0 m3/(h·m2) at 50 Pa3.0 m3/(h·m2) at 50 Pa0.6 m3/(h·m2) at 50 Pa
Disclaimer/Publisher’s Note: The statements, opinions and data contained in all publications are solely those of the individual author(s) and contributor(s) and not of MDPI and/or the editor(s). MDPI and/or the editor(s) disclaim responsibility for any injury to people or property resulting from any ideas, methods, instructions or products referred to in the content.

