Article

Damage Prediction Observation for Existing Buildings in Sabah under Moderate Risk Earthquakes

by
Noor Sheena Herayani Harith
1,2,*,
Nur Izzati Husna Hassan
1,2,
Samnursidah Samir
1,2,
Ngui Min Fui Tom
1,3,
Nabilah Abu Bakar
4 and
Habib Musa Mohamad
1
1
Faculty of Engineering, Universiti Malaysia Sabah, Jalan UMS, Kota Kinabalu 88400, Sabah, Malaysia
2
Natural Disaster Research Center (NDRC), Universiti Malaysia Sabah, Jalan UMS, Kota Kinabalu 88400, Sabah, Malaysia
3
Eramaju Synergy Sdn Bhd, Lot 23, 2nd Floor Lido Plaza, Jalan Nosoob, Kota Kinabalu 88300, Sabah, Malaysia
4
Faculty of Engineering, Universiti Putra Malaysia, Serdang 43400, Selangor, Malaysia
*
Author to whom correspondence should be addressed.
Buildings 2023, 13(6), 1500; https://doi.org/10.3390/buildings13061500
Submission received: 12 April 2023 / Revised: 17 May 2023 / Accepted: 28 May 2023 / Published: 10 June 2023

Abstract

:
Seismic design in building construction is still new in Malaysia. Sabah, a Malaysian state, is situated southeast of the Eurasian Plate, between the highly active Philippine Sea Plate and Indo-Australian Plate, and has a history of earthquakes, with the largest measuring a magnitude of 6.3 (2015). Although small earthquakes occur annually, most old buildings in Sabah were built pre-code and designed without considering earthquake loadings. This study aimed to analyze the potential damage to buildings in Sabah based on their vulnerability to moderate earthquakes. More than 500 buildings in seven districts were evaluated using a quantitative method based on score assignment, within 100 kilometers of the epicenters. According to the findings, more than 160 buildings in the Kota Kinabalu and Kudat districts were assessed as vulnerable to Grade 4 damage. In Ranau, Kota Marudu, Tawau, Semporna, and Lahad Datu, most buildings had a Grade 3 damage potential, with some at Grade 2 or 4. This study’s findings provide a summary of the damage risk for structures in Sabah and offer a starting point for planning and developing safer buildings that can withstand local seismic conditions. The resulting building-grade damage map can be used as a reference for future damage mitigation measures.

1. Introduction

Prediction of the seismic behavior of buildings in moderate-risk earthquake areas, such as Sabah, involves using a numerical assessment and an analytical model to estimate the damage potential to buildings. This is typically achieved by analyzing the building’s dynamic response to ground motions and predicting the extent of damage, based on the forces and deformations experienced by the building [1,2,3]. Since it is difficult to obtain building drawings due to a lack of historical records, in order to conduct a parametric analysis of damage prediction behavior for the buildings in Sabah, a moderate-risk earthquake area, one would need to identify the key parameters that affect the building’s response to seismic activity. These might include the type of construction, the height and shape of the building, the soil and foundation conditions, and the seismic hazard level in the area. The analysis would involve running multiple simulations of the building’s response to different earthquake scenarios, varying one or more key parameters each time. By comparing the results of these simulations, one can determine how each parameter impacts the building’s seismic performance and identify the optimal design and construction strategies for minimizing damage and protecting occupants in the event of an earthquake.
Seismic design for building structures is not yet widely used in Malaysia, unlike in other earthquake-prone, developing countries. Several factors contribute to this, including a lack of awareness and knowledge of the risks of earthquakes and the importance of seismic design, particularly in areas where earthquakes are rare. The significant cost of implementing seismic design can also deter developers, who may prioritize cost savings over seismic design, especially if it is not required by local building codes. Weak enforcement of building codes can also lead to non-compliance, as developers may take shortcuts to cut costs. Furthermore, a lack of incentives, such as insurance premiums, may not encourage developers to apply seismic design. Finally, resistance to change and new building techniques can be another barrier to implementing seismic design, as some developers may be reluctant to adopt new methods that have not been proven successful in the past.
Sabah, a state in Malaysia, is in a seismically active region and has experienced several earthquakes with magnitudes of six on the Richter scale. Although Sabah is about a thousand kilometers away from the collision boundary of the Indo-Australian Plate, Eurasian Plate, and Philippine Plate, it is still susceptible to earthquakes due to the compressive forces resulting from plate collision [4]. Past earthquake events in Sabah, such as the 1923 Lahad Datu Earthquake, the 1951 Kudat Earthquake, the 1976 Lahad Datu Earthquake, and the 2015 Ranau Earthquake, indicate the need for seismic vulnerability assessment in Sabah to minimize negative impacts on buildings [5]. For instance, the 2015 Ranau earthquake caused shear cracking in brick walls, cracks on columns and beams, roof damage, damage to supporting columns or tilts, concrete spalling, and shattered windows, demonstrating the lack of earthquake-resistant engineering in many structures in Sabah [6]. Vulnerability refers to the inability of structures to withstand hazards, while seismic vulnerability specifically refers to the likelihood that structures will be damaged by earthquakes [7]. Therefore, the vulnerability assessment of structures in Sabah is crucial in determining the need for further investigation and retrofitting. The harm caused by a modest magnitude, shallow earthquake is rare, with few findings since the low magnitude causes less damage to the structures [8]. In some conditions, a small and shallow earthquake might cause damage. A study by Bommer et al. [9] showed that small earthquakes can be potentially dangerous if the area has a lot of construction. The severity of the damage also depends on factors such as the depth of the earthquake, the distance from the epicenter to populated areas, and the type and quality of buildings in the affected area.
Polese et al. [10] conducted a study that found that the macro-seismic method was one of the earliest methods used by engineers to evaluate building vulnerability. The evaluation involved a vulnerability index V and a ductility index Q, both of which considered the building typology and its construction features. However, assessing a building’s seismic risk is complicated and can only be applied to a few structures [11]. Therefore, a quick and reliable method for assessing building vulnerability is crucial, so more complex techniques can be reserved for the most critical structures. This study uses the conventional method of Rapid Visual Screening (RVS) to identify a building’s vulnerability in the event of an earthquake, which requires less expertise and time [12]. The study focuses on typical building construction and the grade of damage potential for buildings in Kota Kinabalu, Ranau, Kota Marudu, Kudat, Semporna, Lahad Datu, and Tawau; it highlights that RVS is a practical approach based on fieldwork [13,14].
It is reasonable to assume that the seismic vulnerability of this building stock is the main cause of a potentially high number of human casualties in the future, since most buildings in Sabah were designed and constructed without adhering to seismic codes. This study presents a paradigm for evaluating the seismic susceptibility of various building types in Sabah and creating a map with potential damage grades for each building. In general, it is crucial for governments, professional organizations, and the public to increase awareness of the importance of seismic design and encourage developers to prioritize it in areas prone to earthquakes. This can involve better enforcement of building codes, providing incentives for seismic design, and educating building developers on the benefits of seismic design. Since it is difficult to predict when or where earthquakes will occur, it is crucial for people living in earthquake-prone areas to be prepared and have plans in place to minimize the risk of injury or property damage. In moderate-risk earthquake areas like Sabah, parametric analysis is a powerful tool for earthquake engineers and architects to optimize building design and construction, ensuring the safety and resilience of buildings in the face of seismic activity. The Ranau earthquake was a tragic reminder of the ongoing risk of earthquakes in Southeast Asia and the importance of preparation for natural disasters. Although Malaysia is not located in a seismically active zone, the country is still at risk of earthquakes. It must be prepared to mitigate the risks and manage the consequences of a seismic event. This is particularly relevant for countries in Southeast Asia, where rapid urbanization and population growth have led to the construction of many buildings that are not designed to withstand strong earthquakes. The seismic design code for Malaysia was published in 2017 but, in the 2015 Sabah earthquake, many of the buildings were damaged. Thus, this study attempts to predict the damage from a moderate earthquake.

2. Earthquake Activities in Sabah

Between 1902–2023, Sabah experienced about 300 earthquakes with moment magnitudes ranging from 2.0 to 6.3. The recorded earthquakes were internal, in that no external influences from medium or far-field earthquake sources were accounted for. Ranau had 112 earthquake epicenters, whereas Lahad Datu had 60. Sabah in Borneo is situated in the center of Southeast Asia, surrounded by the long-lasting westward subduction of the Pacific Plate, the northward subduction of the Indian Plate underneath the Eurasian Plate, and the passive continental border of the South China Sea [15]. Several analyses of sedimentary and magmatic data indicate that the Borneo region represents an accretionary orogeny during the Mesozoic and Cenozoic eras [16]. Sabah is the second largest state in Malaysia and is located on the island of North–East Borneo. Many large numbers of large-scale developments, including pipelines, power plants, and dams, are currently ongoing to bring the state to the same level as other industrialized nations [5,17]. The statistics for an updated earthquake recorded for 120 years of observation indicate an increment of earthquake events as shown in Figure 1. Thus, numerous geological investigations, such as the one by Tongkul [18], have been conducted in Sabah to study fault activity.
Sabah has been found to have moderate earthquakes, with the highest earthquake magnitude being equal to six, and this region also has its fault lines as mentioned in Tongkul’s study [4]. Several prominent active and potentially active faults in Sabah have been identified based on the presence of earthquakes, mud volcanoes, and hot springs, as well as remote sensing analysis and field surveys conducted over the past few years (Figure 2). The active faults can be grouped into compressional structures (thrust faults are mostly orientated East Northwest–West Southwest (ENW–WSW), and strike-slip faults are mostly oriented Northwest–Southwest (NW–SW)) and extensional structures (normal faults are mostly oriented Northeast–South West (NE–SW)). The evidence for thrust and strike-slip faults is most prevalent in the Lahad Datu-Tawau region of southeast Sabah. The region is surrounded by several linear features with a value of 20 to 40 km in length that are predominantly connected with earthquakes. Active normal fault evidence is particularly prevalent in the Northwest–Southeast (NW–SE) trending inland valleys of the Crocker-Trusmadi Range in western Sabah. The Northeast–Southwest (NE–SW) scarps intersect with the Lobou-Lobou Fault, which is believed to have caused the 2015 Ranau earthquake of magnitude six. In addition to the normal fault scarps, evidence of strike-slip faults can be observed here, as a sequence of NW–SE trending negative lineaments cutting through the south-flowing Mesilou River.
A fault is a fracture in rock that has caused the rock to move. Variably sized and positioned faults can sustain various types of rock deformation, including compression and extension. All shallow earthquakes occur on active faults because a displacement-producing process triggers them. On the contrary, certain faults experience large earthquakes only once every hundred years and require careful evaluation of their hazard potential in Sabah. Wannier [19] and Mohd Zainudin et al. [20] are recognized as sources for the most recent geological map of Sabah. Hazard de-aggregation is the terminology used to depict the total seismic hazard, de-aggregated into the contribution from each source. The illustrations of seismic hazards in Ranau and Lahad Datu result from various earthquake sources in Sabah namely, line, area, and point source faults as studied by Harith et al. [21]. The end result of seismic hazard assessment is seismic de-aggregation. The study conducted a probabilistic analysis that led to the finalization of the current de-aggregation assessment. According to their findings, the fault zone near Lahad Datu and Ranau has a recurrence rate, expressed as a beta value, of 0.921, with a maximum magnitude of 6.5. Moreover, the predicted peak ground acceleration (PGA) values for the 10%, 5%, and 2% probability of exceedance are 0.16 g, 0.22 g, and 0.28 g, respectively. The seismic de-aggregation results are a function of the site location, return period of interest, and intensity measure considered. The fact that site location affects the seismic hazard should be evident because it changes the site’s proximity to nearby faults, contributing the most to the total hazard. The de-aggregation is a function of the return period because of the different occurrence rates of the sources and their potential to produce large and small ground motions. The de-aggregation analysis on Ranau and Lahad Datu, shown in Figure 3, are moderate magnitude (>M 5.0) and close proximity (20–30 km) sources, which tend to dominate the PGA hazard.
Three of the five major earthquakes caused significant damage to buildings in Lahad Datu and Ranau. The most significant earthquakes occurred in Lahad Datu in 1923 and 1976 and Ranau in 1966, 1991, and 2015. The 1923 Lahad Datu Earthquake, with a magnitude of MW 6.3, and the 1976 quake, with a magnitude of MW 5.8, destroyed some properties. The ground floor walls of the low-rise constructions were severely damaged, and cracks emerged in neighboring buildings, including service buildings and low-cost flats. The Ranau Earthquake of 1991, with a magnitude of 5.4 MW, caused extensive property damage in the Ranau region, close to the epicenter, and resulted in one fatality. The four-story structure sustained substantial structural damage, with crumbling brick walls and visible cracks in multiple buildings. In 2015, a magnitude 6 earthquake ravaged Ranau, killing many individuals. The epicenter was 14 km from Ranau and approximately 23 schools were affected. Table 1 describes noteworthy earthquakes and the damage caused. Peak ground acceleration (PGA) was recorded for each event, with the exception of 5 June 2015, when Sabah’s seismic station recorded the PGA value. Hence, the Modified Mercalli Intensity (MMI) based on the Standard USGS conversion technique was used to calculate the PGA for the following events.
The approaches of existing damage prediction on buildings are post-disaster observation-based and numerical simulation-based. For instance, the post-disaster observation-based approach consisting of an in situ field investigation on affected buildings by Majid et al. [22] found that damage was observed due to a recent earthquake in Ranau (2015). Figure 4 illustrates the significant damage where wider cracks occurred, and the concrete cover spalled. As a result, the reinforcement of the longitudinal and transverse columns is visible. The damage also occurred in the critical regions, located at the top and bottom parts of the columns. Based on quick observation, it appears that the confinement or transverse reinforcement spacing within the crucial zone of the column is insufficient to withstand earthquake load. The confinement reinforcement in one of the inspected columns is spaced at 250 mm intervals. In addition, a numerical simulation-based approach to predict existing damage is not applicable since the present study is limited to fieldwork observation only to save the time consumed for numerous buildings in the study areas.

3. Materials and Methods

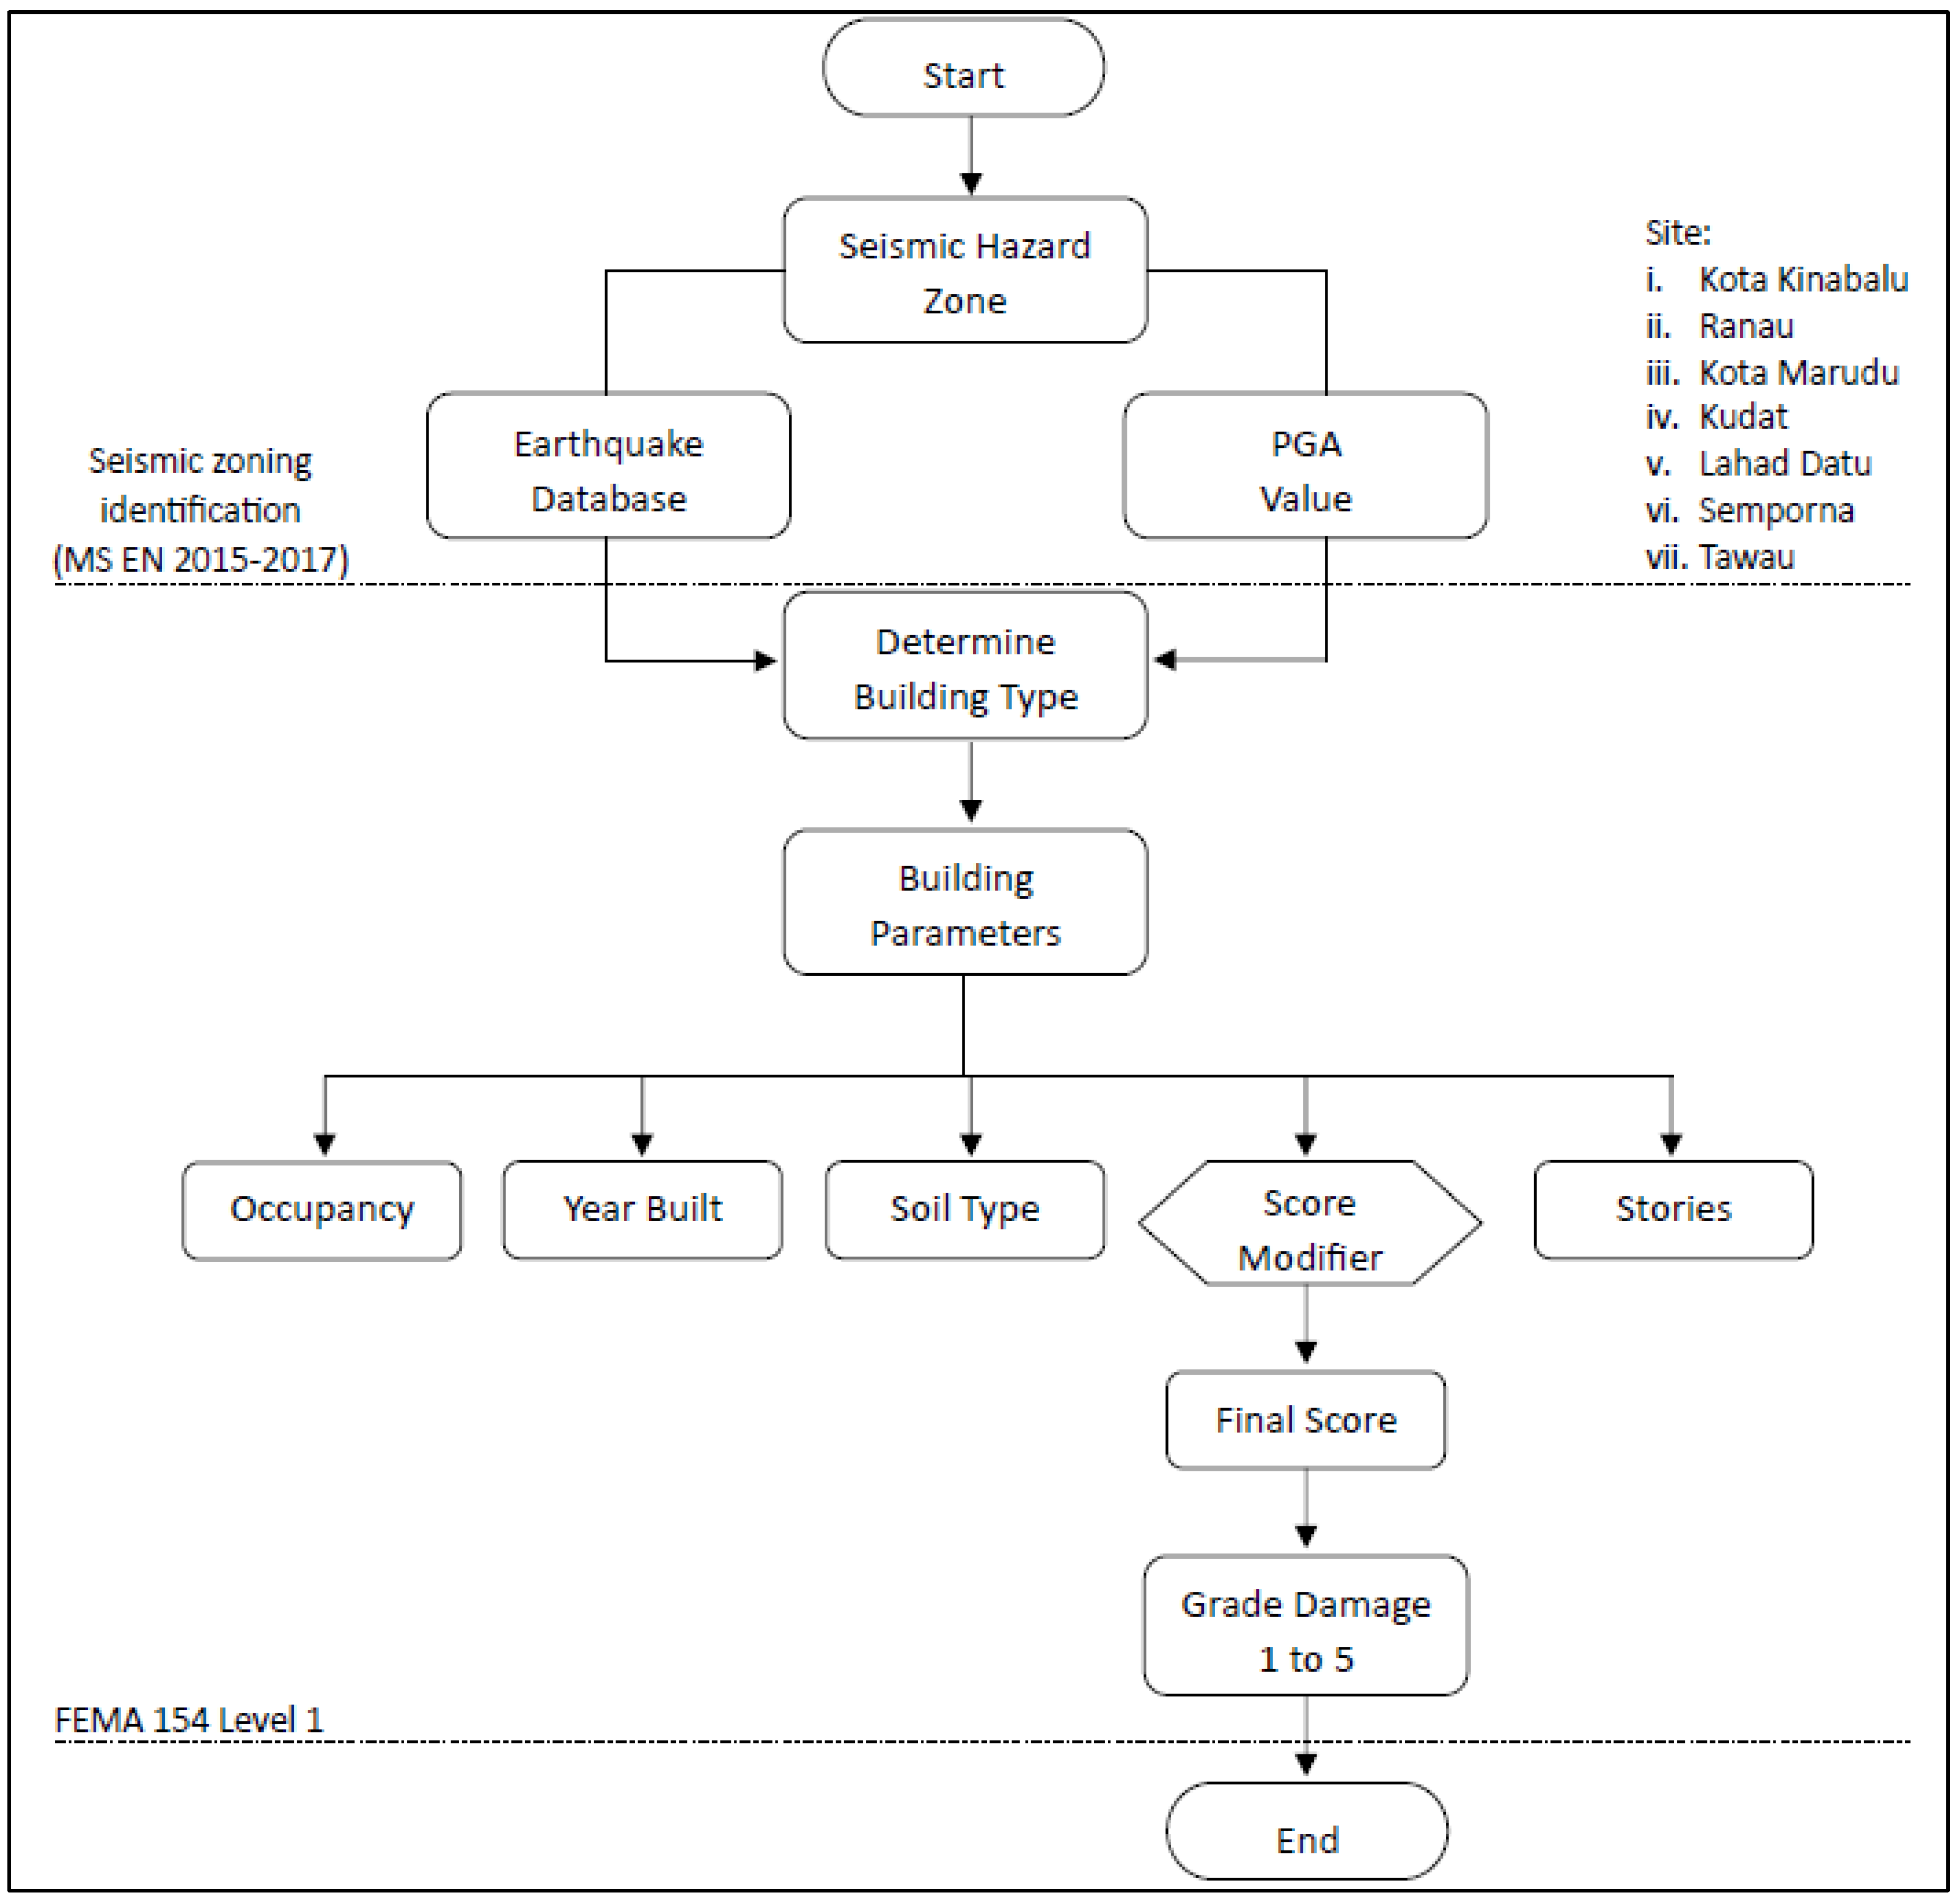
Figure 5 presents the methodologies utilized in this investigation. In the first phase of the earthquake and seismic hazard condition assessment, a review of earthquake activity was conducted in the study region, in accordance with MS EN1998-1:2015 [23], to assess the hazard risk in both study areas (Ranau and Lahad Datu). Multiple databases on earthquakes or seismicity were compiled from a large dataset provided by numerous national and international organizations. These international agencies included the United States Geological Survey/National Earthquake Information Center (USGS/NEIC), the Advanced National Seismic System (ANSS), the International Seismological Center (ISC), the National Geophysical Data Center (NGDC), the Harvard Centroid Moment Tensor (CMT), and the Malaysian Meteorological Department (MetMalayisa). The site condition was determined based on the soil characteristics listed in Mohd Zainudin et al. [20]’s geological map of Sabah.
In addition, the second step of the process comprised a preliminary analysis and the planning of structural information. This phase aimed to assist the activities during the site visit and was incredibly effective in decreasing the overall time spent in the field. During this phase, one of the activities was an assessment of earthquake-related damage. Among the outputs of the earthquake damage survey were the identification of structural failure types and causes, as well as the occasional ability of the evaluator to forecast the assessment of anomalies. The 2015 Ranau earthquake damaged 61 structures, including schools, hospitals, and mosques [24]. In addition, one of the buildings sustained earthquake damage due to the soft story irregularity. As a result of the Lahad Datu earthquake of 1976, cracks emerged in other buildings, including the Fire Department Flat, Telecom building, and low-cost flats, whereas the walls of the new police complex’s ground floor were severely damaged [18].
After completing the building information section of the data collection form, the critical parameters of the final RVS score were selected for the seismic vulnerability phase of the approach. The final RVS score determines the varying degrees of possible damage for each type of structure. The grades were displayed on a GIS map to illustrate the distribution of structures’ susceptibility to damage in this study area. Aerial reconnaissance of Ranau and Lahad Datu was conducted to determine their susceptibility to seismic activity. During the site visit, the Rapid Visual Screening Data Collection Form FEMA P-154 [25] was utilized to locate, inventory, and screen buildings. The screener subtracted abnormalities from the baseline value based on building type, to calculate the final level score for the buildings (SL1). According to Ningthoujam and Nanda [26], a score between 2.0 and 2.5 denotes medium injury with the possibility of grade 1 and 2 damage. These damage grades do not require a thorough inspection; only modest repairs are required. With grades 3, 4, and 5, a score of less than 2 results in moderate to severe structural damage.

3.1. RVS Survey

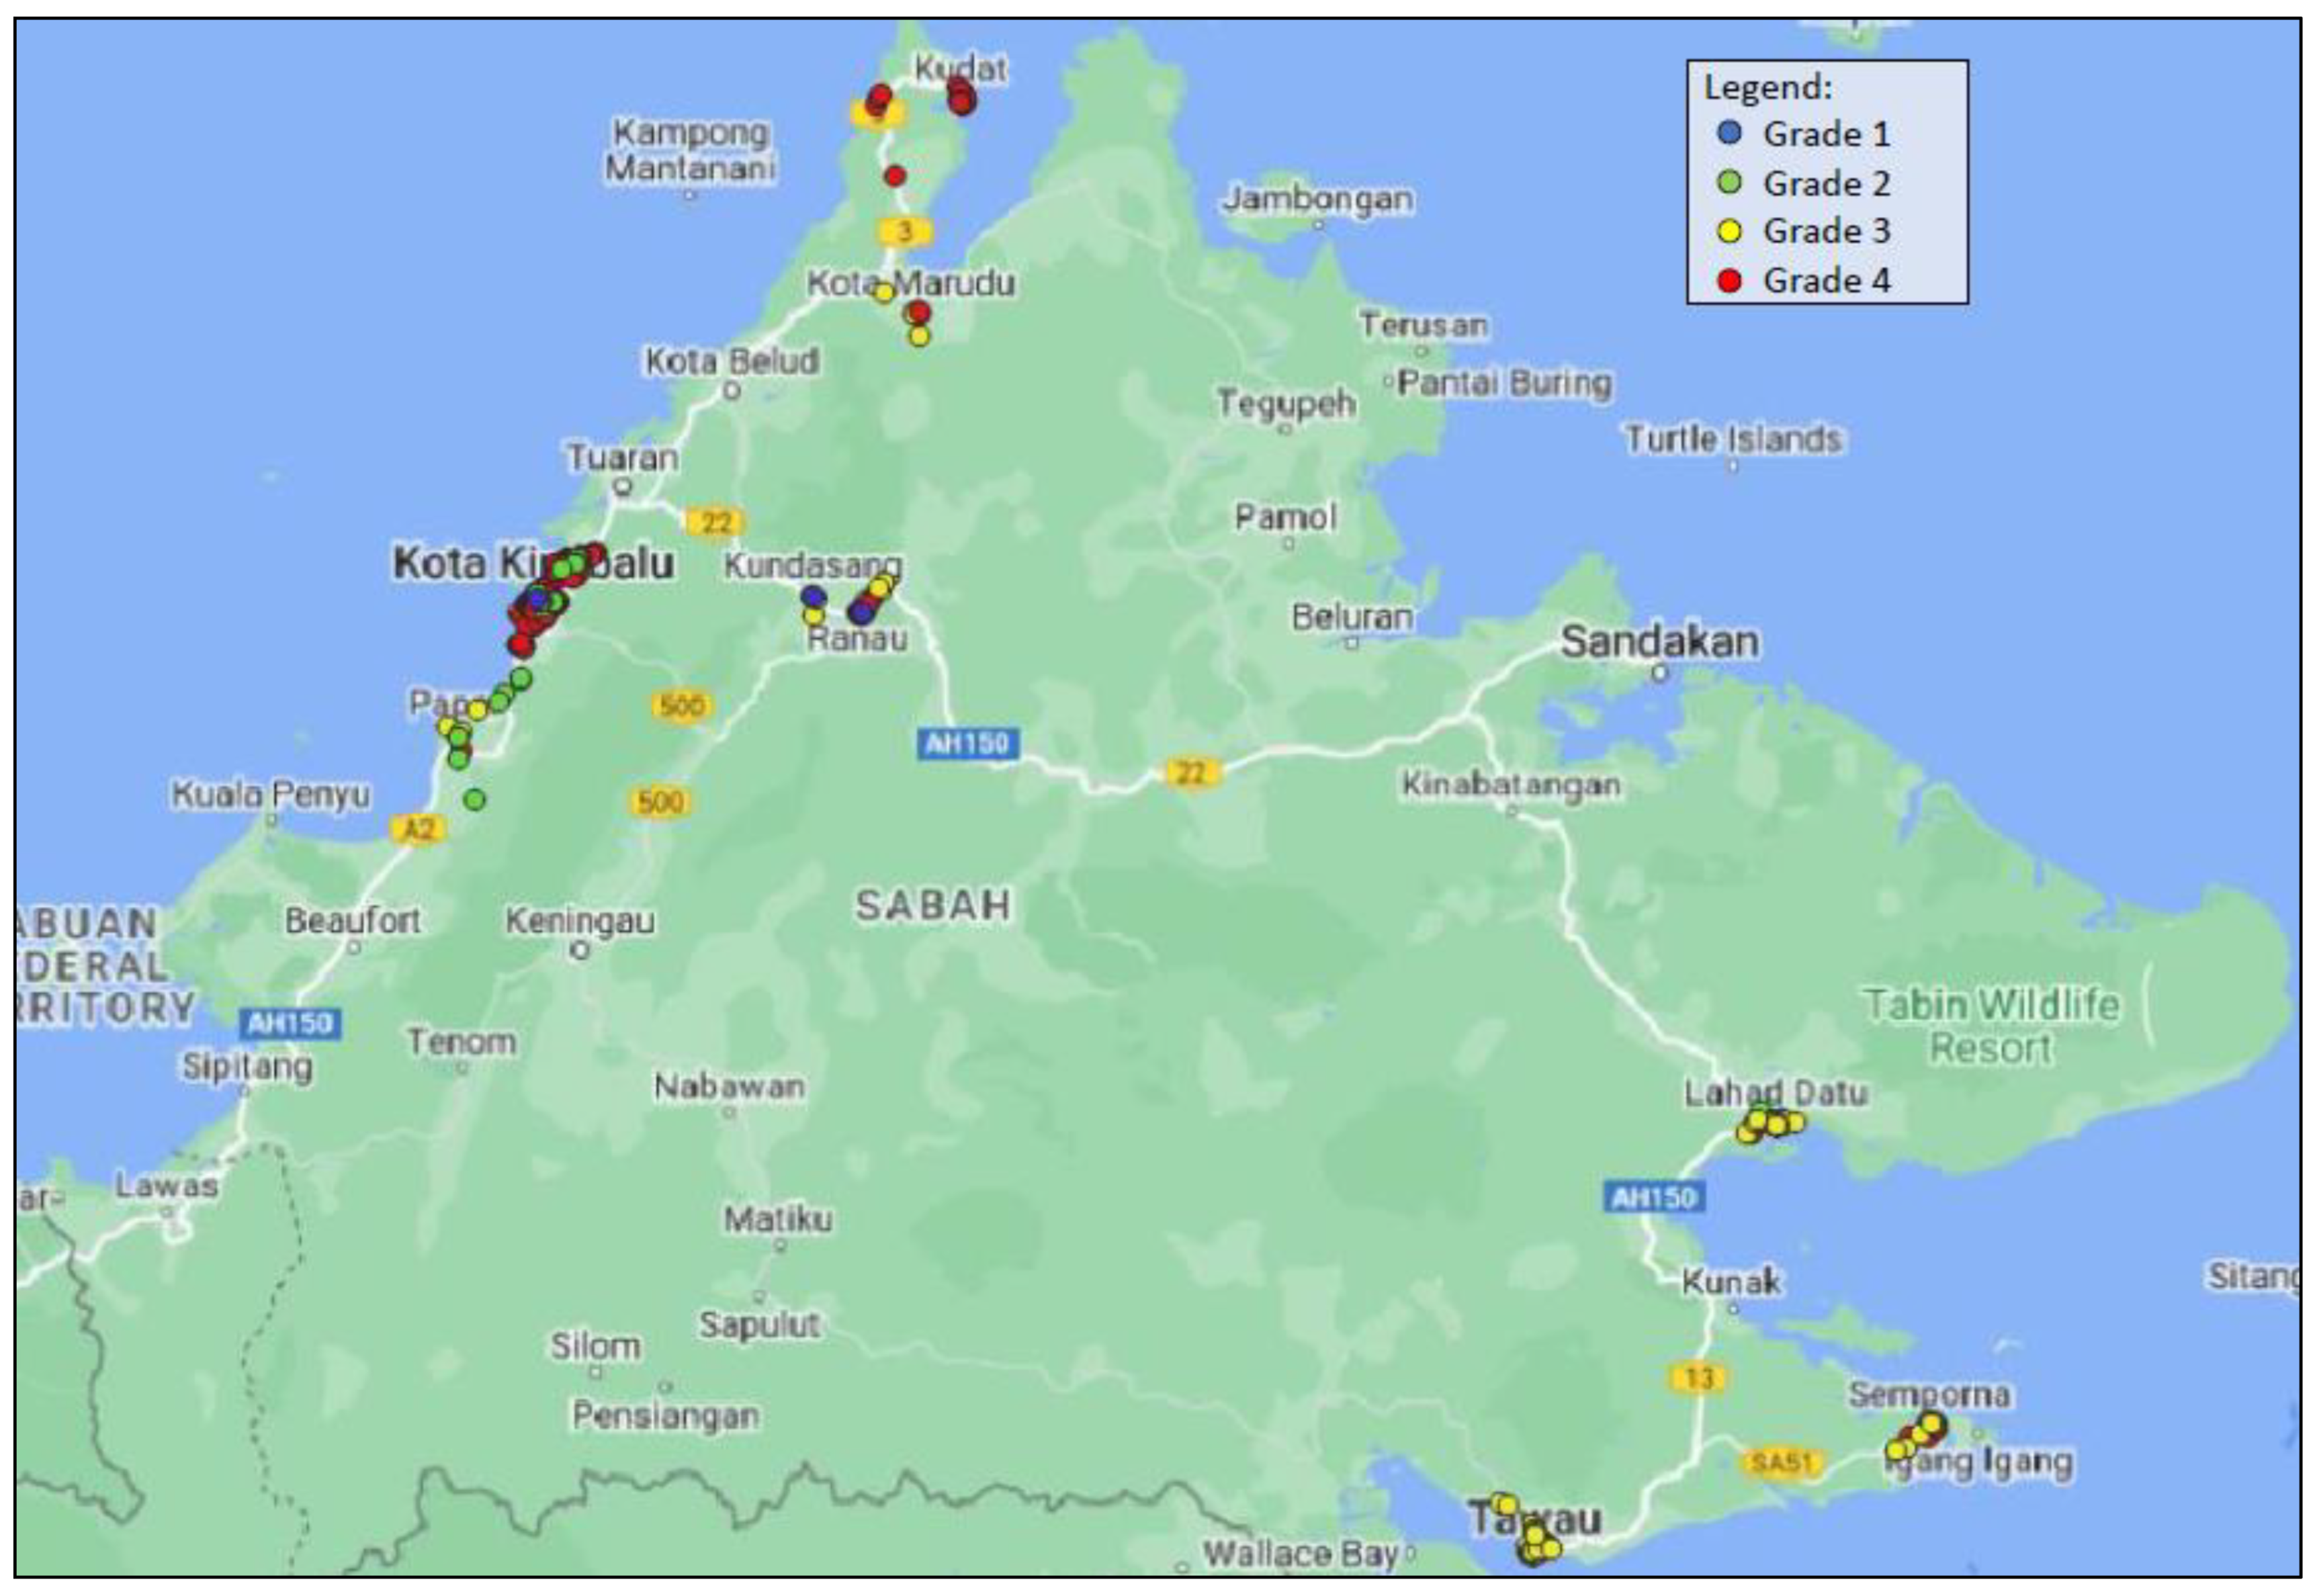
A total of 555 buildings were analyzed using the FEMA P-154 [25] Data Collection form to establish the seismic susceptibility of buildings in Sabah. Kota Kinabalu, Ranau, Kudat, Kota Marudu, Tawau, Lahad Datu, and Semporna were the seven districts in Sabah studied as in Figure 6. These identified districts represent urban and sub-urban centers with a high density of clusters of buildings within a 10–30 km radius. The population living in vertical space is concentrated at a high rate, mirroring the high density of the building clusters. This may result in a higher risk to life. The Rapid Visual Screening (RVS) method was utilized in this paper and implemented by other researchers in their studies [5,13,27,28,29]. This method is based only on visual evaluation and does not involve structural calculations. Furthermore, buildings were evaluated using FEMA P-154 [25] data collection forms, which are classified into three categories based on the area’s seismicity: low, moderate, and high seismic risk. The best way to discover the soil type was during the planning stage, as visual techniques in the field cannot instantly discover it. The soil type is determined based on the map by the European Soil Data Center (ESDAC), as shown in Figure 7. During the sidewalk survey, the Rapid Visual Screening approach started with determining building inventory statistics including the number of stories, the occupancy, and the building irregularities. The year of construction was obtained from the local building authority, which focuses on structures that have been in service for 20 to 50 years. A study conducted by Karapetrou et al. [30] can be linked to the aging effects noticed in buildings that have been in use for many years. The study investigates the impacts of aging on reinforced concrete (RC) buildings, with a particular emphasis on performance decline over time. It implies that buildings designed purely for gravity loads are expected to be more vulnerable to increased fragility over time than structures developed in compliance with seismic code regulations.

3.2. Score Modifier

The basic score modifier is the list of key point parameters that represent the observed buildings. Stage 1/level 1 is considered a preliminary assessment. This phase included identifying the Building Irregularities, which include vertical and horizontal irregularities. The Screen Level 1 Score, SL1, was finalized for a given building type by adding the Score Modifier for that building to the Basic Score for the building. The most important aspect of the RVS approach is determining the damage degree for the building, which is graded from 1 to 5 (Table 2). The five grades of building damage are defined in the previous study by Ningthoujam and Nanda [26], with Grade 1 damage encompassing fine cracks in plaster and the fall of small pieces of plaster, while Grade 2 damage involves small cracks in walls, the fall of relatively larger pieces of plaster, pantiles slip off, and cracks in chimneys and the fall of chimneys. Additionally, Grade 3 damage is described as the buildings containing large and deep cracks in the walls and the fall of chimneys. Grade 4 damage has gaps in walls with parts of buildings collapsing, separate parts of the buildings losing their cohesion, and inner walls collapsing. For Grade 5, there has been a total collapse of the building.
Based on the final score, a map with the potential damage grades for each building was generated. Calculating the final level score is a crucial step in grouping surveyed buildings into their respective potential damage groups and it is determined using Equation (1). This involves adding the Score Modifiers for the building to the Basic Score, which takes into account various parameters such as irregularities, building code compliance, benchmarks, and soil type. Engineers and researchers can better evaluate a building’s susceptibility to damage in the event of a natural disaster by carefully considering these factors. An example of the FEMA P-154 Data Collection Form evaluation is shown in Figure 8.
Final Score (S) = Basic Score (BS) + Score Modifier (SM)

4. Results

4.1. Typical Building Constructions in Sabah

There are seven types of buildings commonly found in Sabah, based on references provided in FEMA P-154 [25]. The buildings that are classified into the seven types include C1, C2, C3, PC2, S1, S4, and W1, as described in Table 3. As shown in Figure 9, the assessed buildings in the seven districts are divided into three major types: C1 (Moment-resisting concrete frame structures), C2 (Buildings with concrete shear walls), and C3 (Unreinforced masonry infill walls in concrete frame buildings). With a percentage of 62%, the C1 category has the most buildings (347). The C3 category has the second-highest number of buildings, with a value of 26%. There are 145 buildings in the C3 class in total. The C2 building type accounts for 8% of the total number of structures. PC2 (Precast concrete structures), S1 (Buildings with steel moment-resisting frames), S4 (Shear walls composed of cast-in-place concrete in steel frame buildings), and W1 (Residential and industrial structures with a light wood frame of 500 square feet or less) were the four minor building types found in the seven districts. The percentages for PC2, S1, S4, and W1 types are 2% (10 buildings), 1% (5 buildings), 1% (4 buildings), and 0.36% (2 buildings), respectively.

4.2. Damage Potential for Buildings in Sabah

There are 555 buildings in the study areas (compiled from seven different districts) to be analyzed for their damage predictions. Grade 1 to Grade 4 damage can be seen amongst the buildings but, fortunately, no Grade 5 category damage was found in the Sabah buildings. Figure 10 shows the map with the plotted damage level for the compiled observations of buildings in the seven study areas. Many medium- to high-rise buildings located in the main city of Kota Kinabalu accumulated about 50% of the overall total of surveyed buildings.
The detailed number of buildings surveyed in the study areas breaks down into the seven districts summarized in Figure 11. Based on the findings, three buildings have been observed with predicted Grade 1 damageability. One building is located in Kota Kinabalu and two buildings are located in Ranau. The predicted damage of Grade 2 can be found in all study areas, except for Kota Marudu and Kudat, with 49 buildings. The district with the highest number of Grade 2 buildings is Kota Kinabalu. The total number of buildings accumulated under Grade 3 damageability is more than 260 buildings. Similarly, Kota Kinabalu has the most buildings under this grade, with a total of 93 buildings. Most buildings are categorized under Grade 4 (a total of 234 buildings). Since most of the buildings surveyed were in Kota Kinabalu, the total is 145 buildings. Surprisingly, Grade 4 damageability is found to be the highest number among the other grades. Based on preliminary observations, Kota Kinabalu is among the fastest developing districts because its main city has been actively growing. A city’s quick development can mostly benefit society, but it can also put lives in danger since the implementation of seismic design (Malaysia building standard, MS EN1998: 2015, first published in 2017) is still new. Subsequently, as there were a rapidly growing number of medium- to high-rise buildings in this city, the seismic design can be applied to new buildings. In the current study, the buildings that were built since the 1970s are surveyed, and the Grade 4 buildings need to be looked at in further detailed analysis.
The limits of the RVS method in relation to the results obtained including the seismic force-resisting system cannot be identified because the structure is covered by architectural finishes. In more detailed evaluation methods, drawings and calculations are reviewed, providing a more refined understanding of the individual building’s structural characteristics [25]. The drawing review makes it possible to spot known deficiencies and concerns that are invisible to the RVS survey for seismic evaluation. Meanwhile, the calculations are used to identify how demands on members relate to their capacity and whether they should be expected to exhibit more desirable ductile behaviors or less desirable nonductile behaviors. However, due to the time-consuming detailed evaluation and the lack of complete drawings, the RVS method used in this study does not include calculations. As a result, the seismic evaluation is made based on more general considerations related to building type, geometric irregularities, and site soil conditions. In addition, errors have been taken care of by asking professional structural engineers, especially regarding the condition and parameters of the buildings. Some of the buildings are difficult to enter due to restrictions by the local authorities. Therefore, the building will be observed by using Google Maps [31] as the second option.
As depicted in Figure 12, most of the buildings are concentrated in North Kota Kinabalu and a few are located along the South shoreline. Most of the buildings in the North area of Kota Kinabalu are medium- to high-rise buildings. According to the final surveyed results, Grade 4 recorded the most buildings (with a total of 145) and the final score ranges from 0.3 to 0.7. Next, Grade 3 damageability applied to a total of 93 buildings. In comparison with Grade 1, only one building in the study area has a final score of more than 2.5; Grade 2 has 19 buildings. In summary, buildings in Kota Kinabalu can be seen to be affected by Grade 4, followed by Grade 3 and then Grade 2. The de-aggregation analysis on Kota Kinabalu shows that moderate magnitudes (>M 5.0) at close proximity, in the range of 40–50 km earthquake sources, predictably affect the buildings. The contribution of this type of earthquake affecting the buildings is 25%. The de-aggregation analysis was carried out based on the previous earthquakes recorded within the area and performed using seismic hazard assessment with a 50-year design period and a 475-year return period, as illustrated in Figure 13.
Based on the statistics for Ranau, given in Figure 14, Grade 3 damage was recorded as the highest value, with 20 out of 28 buildings. In addition, Grade 4 damage was recorded as the second highest number with five buildings, followed by Grade 1 with two buildings. Meanwhile, Grade 2 damage recorded the lowest value, with one building.
In the study areas of Kota Marudu and Kudat, there are a total of 33 buildings. The generated map of damage potential for structures in Kudat and Kota Marudu is shown in Figure 15. According to the data, most structures have a damage potential of Grade 4 (0.3 to 0.7), accounting for 57.6% of the total. Grade 3 damage potential has the second largest number of buildings (14). According to the research, no structures in the area have a Grade 1, 2, or 5 damage potential. The de-aggregation analysis on Kudat shows that small magnitude (<M 5.0), close proximity (20 km) sources tend to dominate the PGA hazard. Kota Marudu shows a moderate magnitude (>M 5.0) at close proximity (50 km) and sources tend to overlook the PGA hazard (Figure 16).
Figure 17, Figure 18 and Figure 19 represent maps of damage potential for buildings in Lahad Datu, Semporna, and Tawau, respectively. The total number of buildings in all three study areas is 236. Most structures acquired a final score of 0.7 to 2.0, indicating Grade 3 damage potential. The distribution for the buildings with Grade 3 is 60%, 51%, and 64.3% for Lahad Datu, Semporna, and Tawau, respectively. Meanwhile, Grade 4 damage potential was recorded as the second highest value, with 33.3% in analyses in Lahad Datu, 36.7% for buildings in Semporna, and 19.6% for Tawau. The overall number of buildings with Grade 2 damage is five for Lahad Datu, six buildings for Semporna, and 18 structures for Tawau. This grade was recorded as the lowest in all three districts. Grade 1 damage potential contributes 0%, as none of the examined buildings in those three locations received a score higher than 3.0. The de-aggregation analysis on Semporna (Figure 20) shows moderate magnitude (>M 5.0) at close proximity (30–40 km) and high magnitude (M 6.0–7.0) at long distance (400 km) sources tending to dominate the PGA hazard. The de-aggregation analysis on Tawau shows small magnitude (<M 5.0) at close proximity (10–30 km) sources tending to dominate the PGA hazard (Figure 21).
The overall analysis shows that the majority of the surveyed buildings are classified as C1 building types and grouped as Grade 3 damage potential. The previous study using the same RVS method, conducted by Haryanto et al. [32], evaluated nine buildings of C1 and C3 types in Indonesia. They showed that most of the buildings were of the C1 type, with the lowest number belonging to the C3 category, with basic scores of 1.7 and 1.4, respectively. Therefore, this study concludes that a combination of both types of buildings is grouped into substantial to heavy damage (or Grade 3). Clemente and Concha [33] studied another seismically active country, the Philippines, and found that, among 139 surveyed buildings, the C1 building type was more numerous than the C2 building type.
In addition, the study conducted by Sreerama et al. [34] also proved that reinforced concrete (RC) buildings in India (approximately 80% of buildings) suffered moderate damage and around 73% of RC buildings tended to have slight damage. The most frequent RC structural damage in this area was the earthquake impact on infill walls, which caused cracking and wall collapse. For instance, an investigation by Adiyanto et al. [35] on the aftershock of the 2015 Ranau earthquake found that it caused damage to structural elements such as infill walls. This is because structures with ground floors were left open for parking and there are open spaces on that floor without infill walls, which resulted in a top-heavy and soft ground-floor system. Consequently, this structural element can affect a soft-story collapse mechanism due to horizontal acceleration and inter-story drift.
Alih and Vafaei [36] studied the performance of reinforced concrete buildings during the Sabah earthquake in Malaysia. The Mw 6.0 Ranau earthquake caused substantial damage to most RC buildings in the affected area. One of the reasons for these circumstances is the shortage of transverse reinforcement. This was widely observed in many investigated RC structures, especially in the plastic hinge locations. The consequence of this circumstance can be seen in one of the columns; it had separated itself from the supporting beams due to the concrete spalling and substantial damage to its upper side. Other factors contributing to the damage to the buildings were inadequate detailing in the beam-to-column joints and strong-beam weak-column effects. This design is quite popular in RC frame buildings in Malaysia due to the widely used sub-frame analysis method before the introduction of frame modeling and analysis. The comparison between current and previous studies resulted in most RC buildings tending to have moderate damage, with the damage characteristics of extensive large cracks and spalling of the concrete in weaker elements.

5. Conclusions

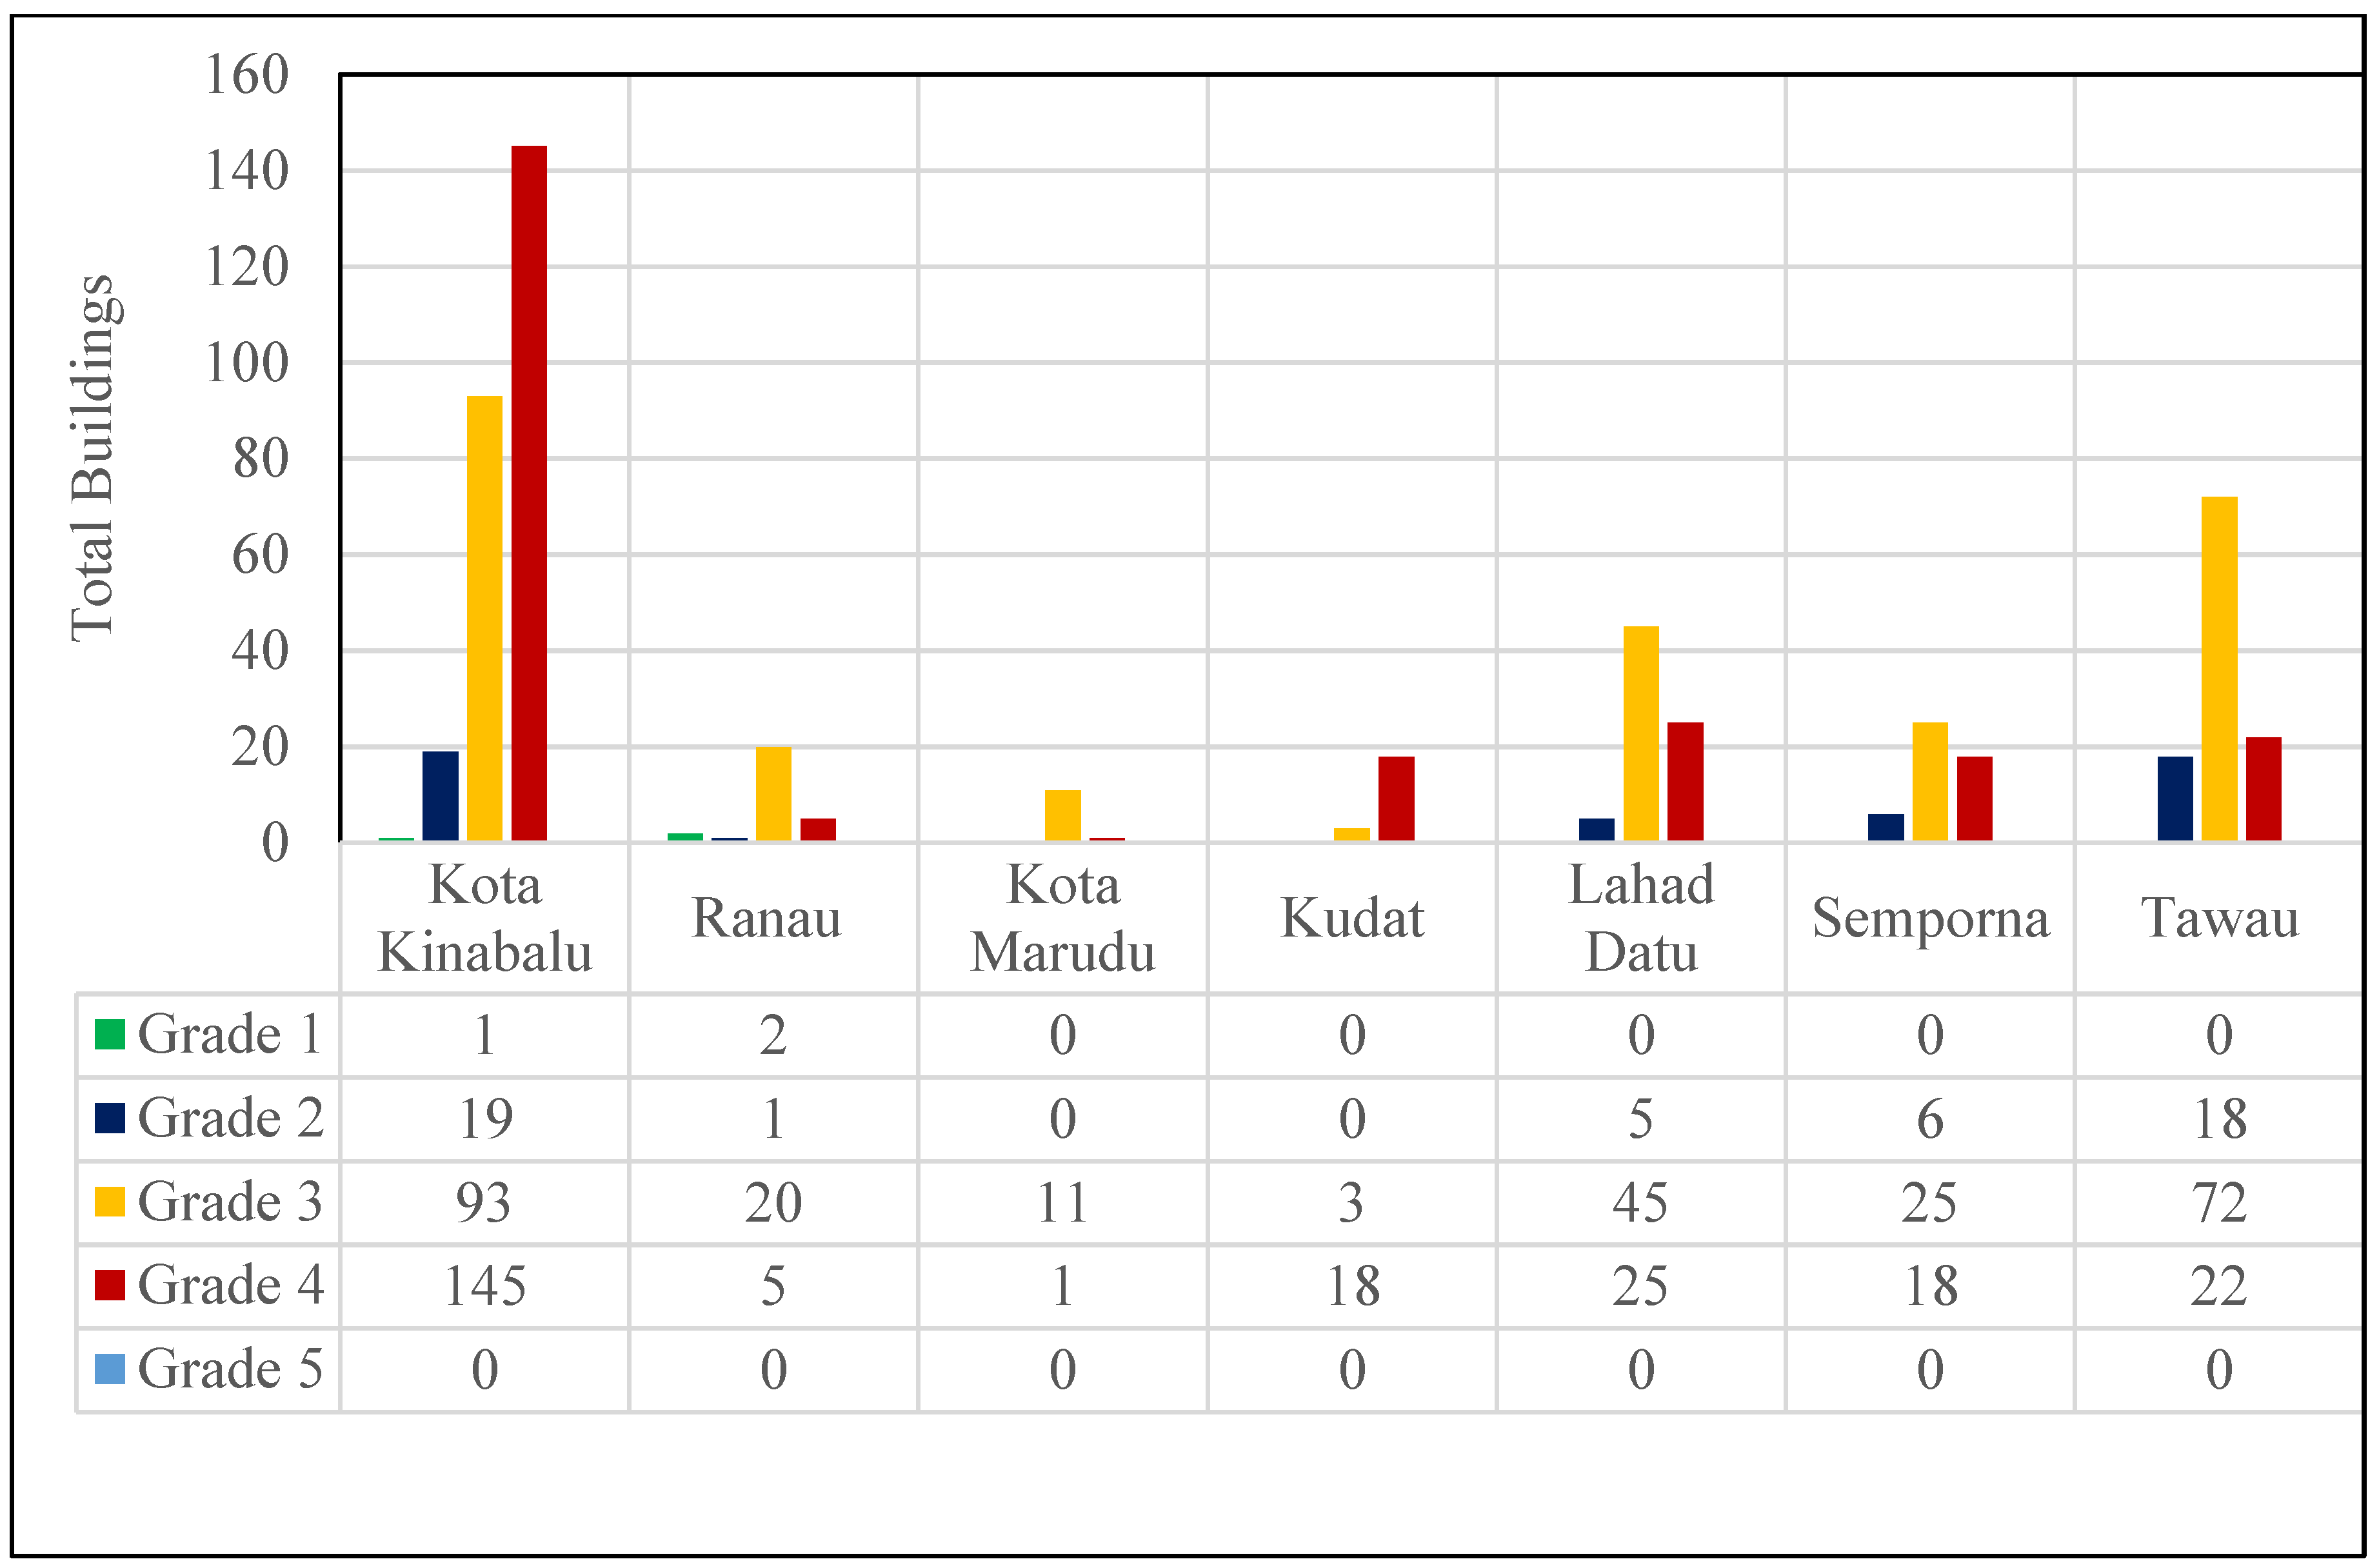
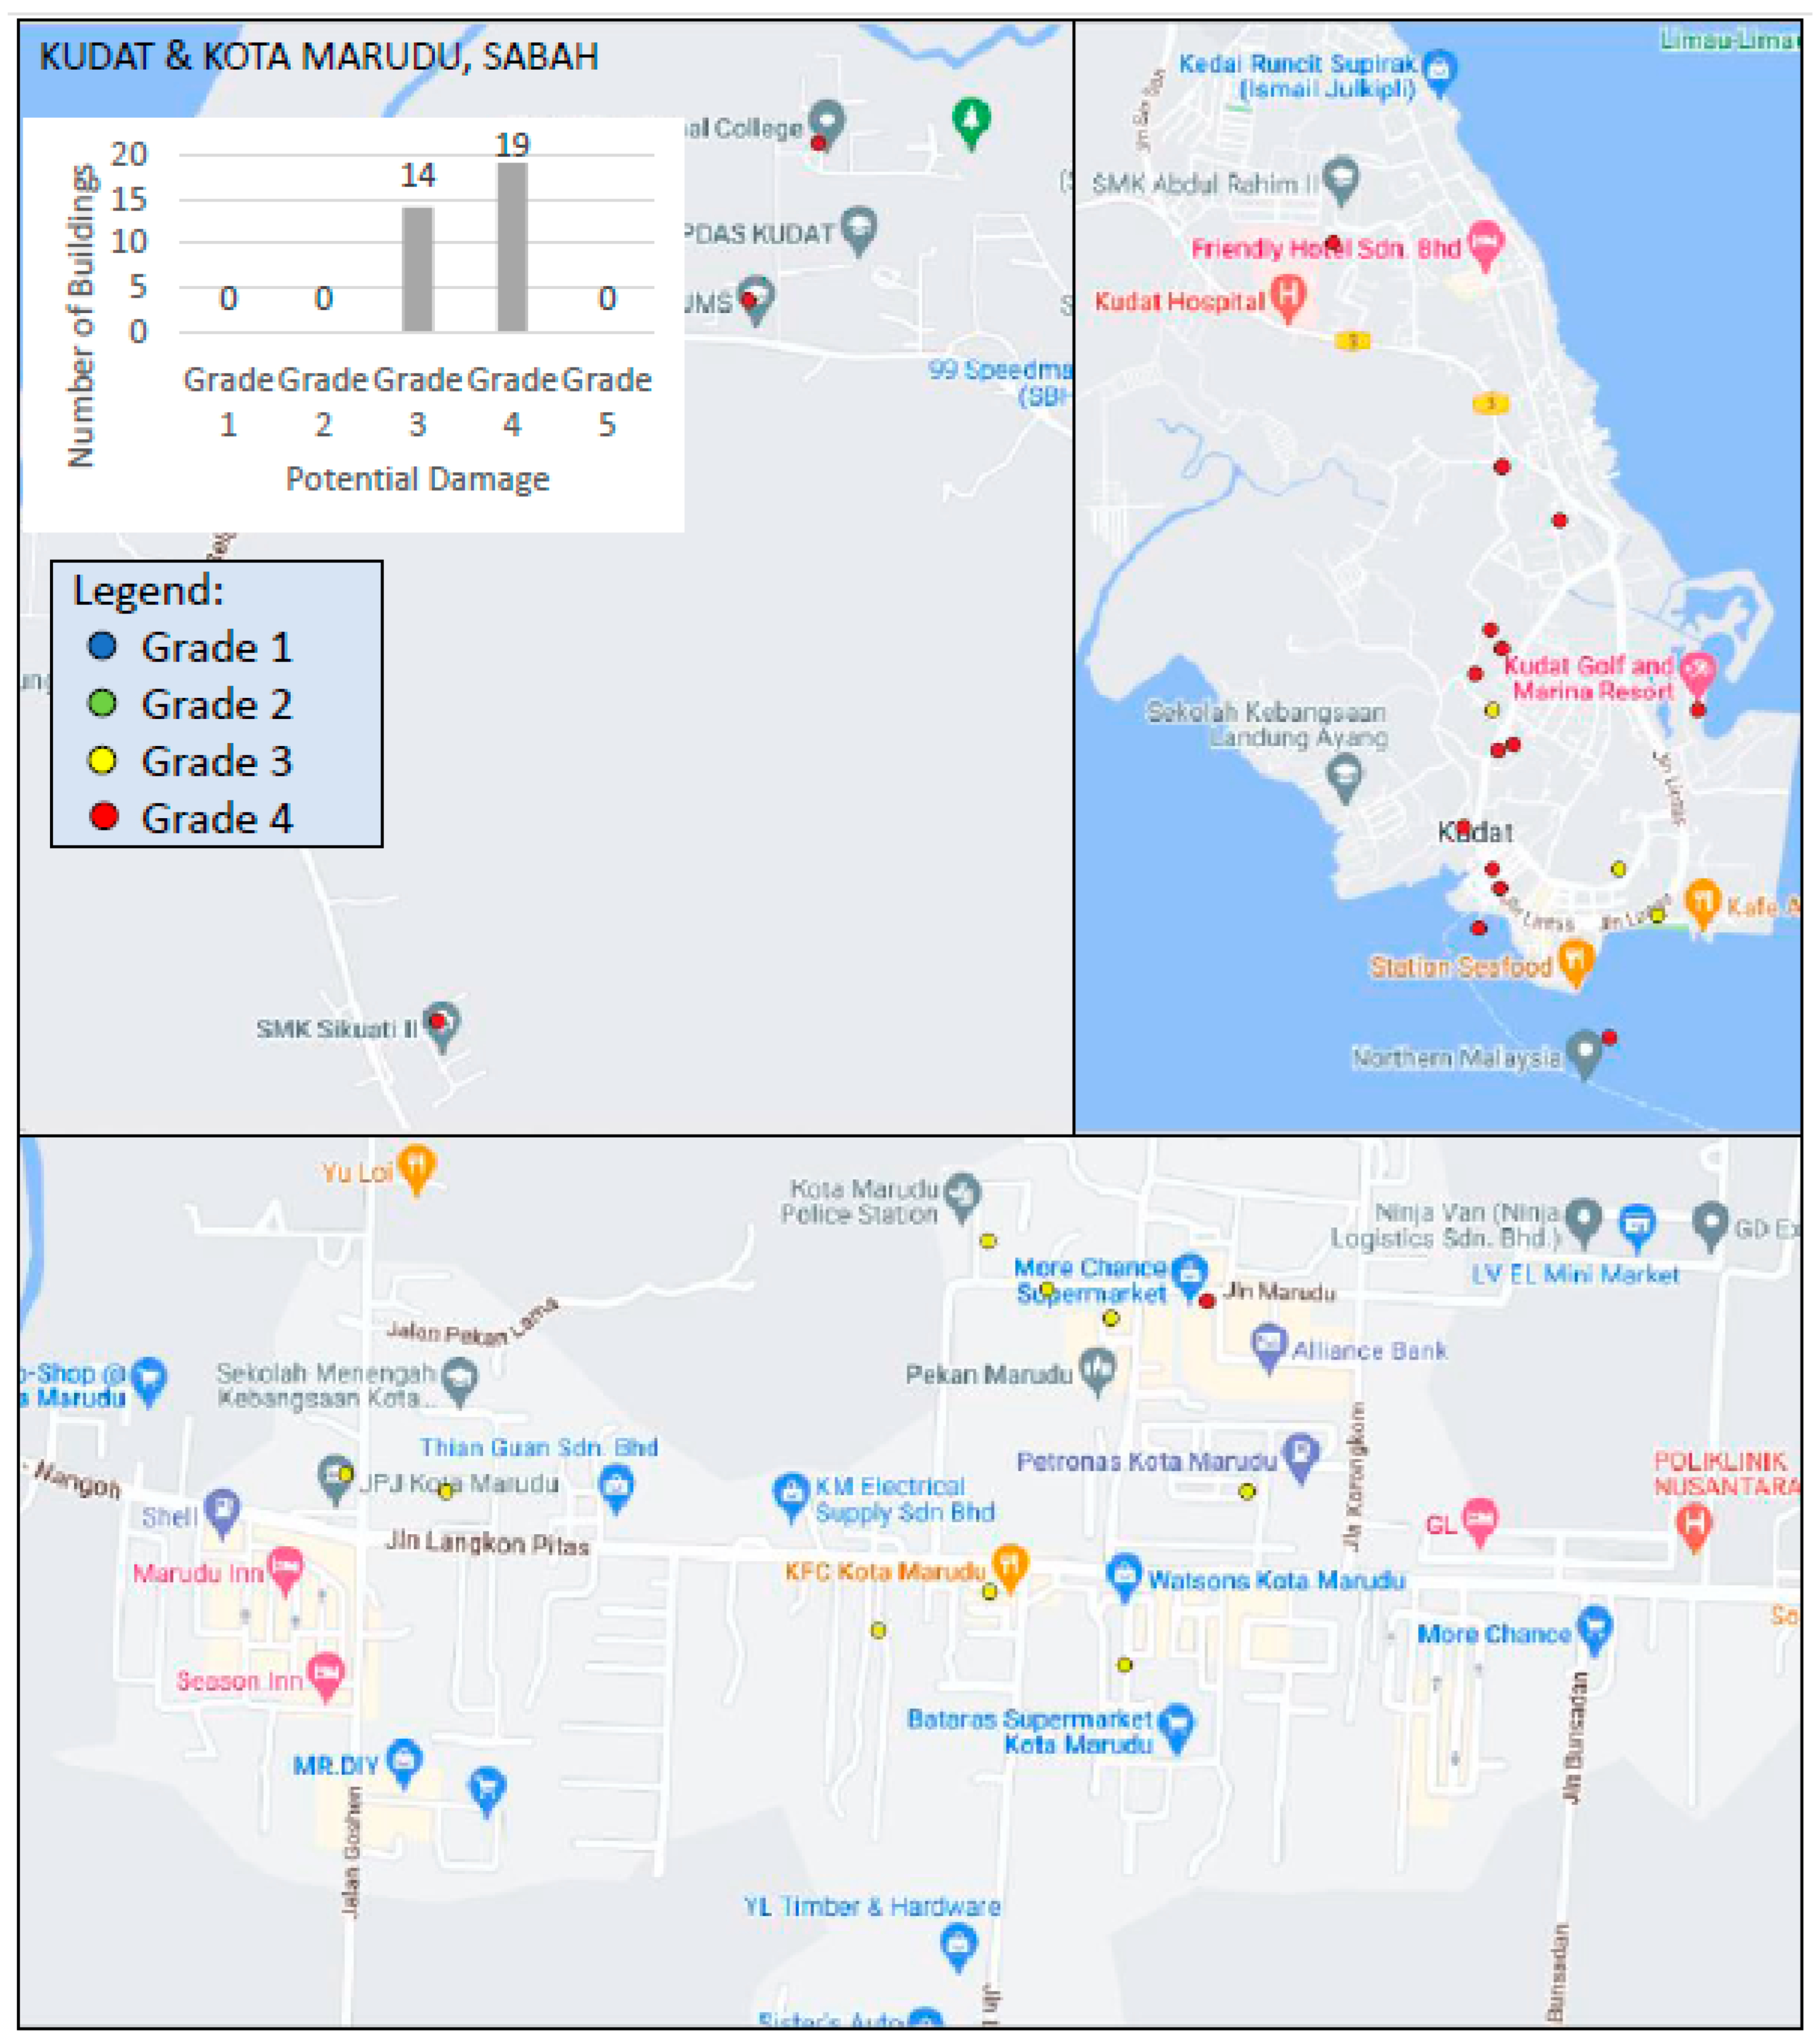
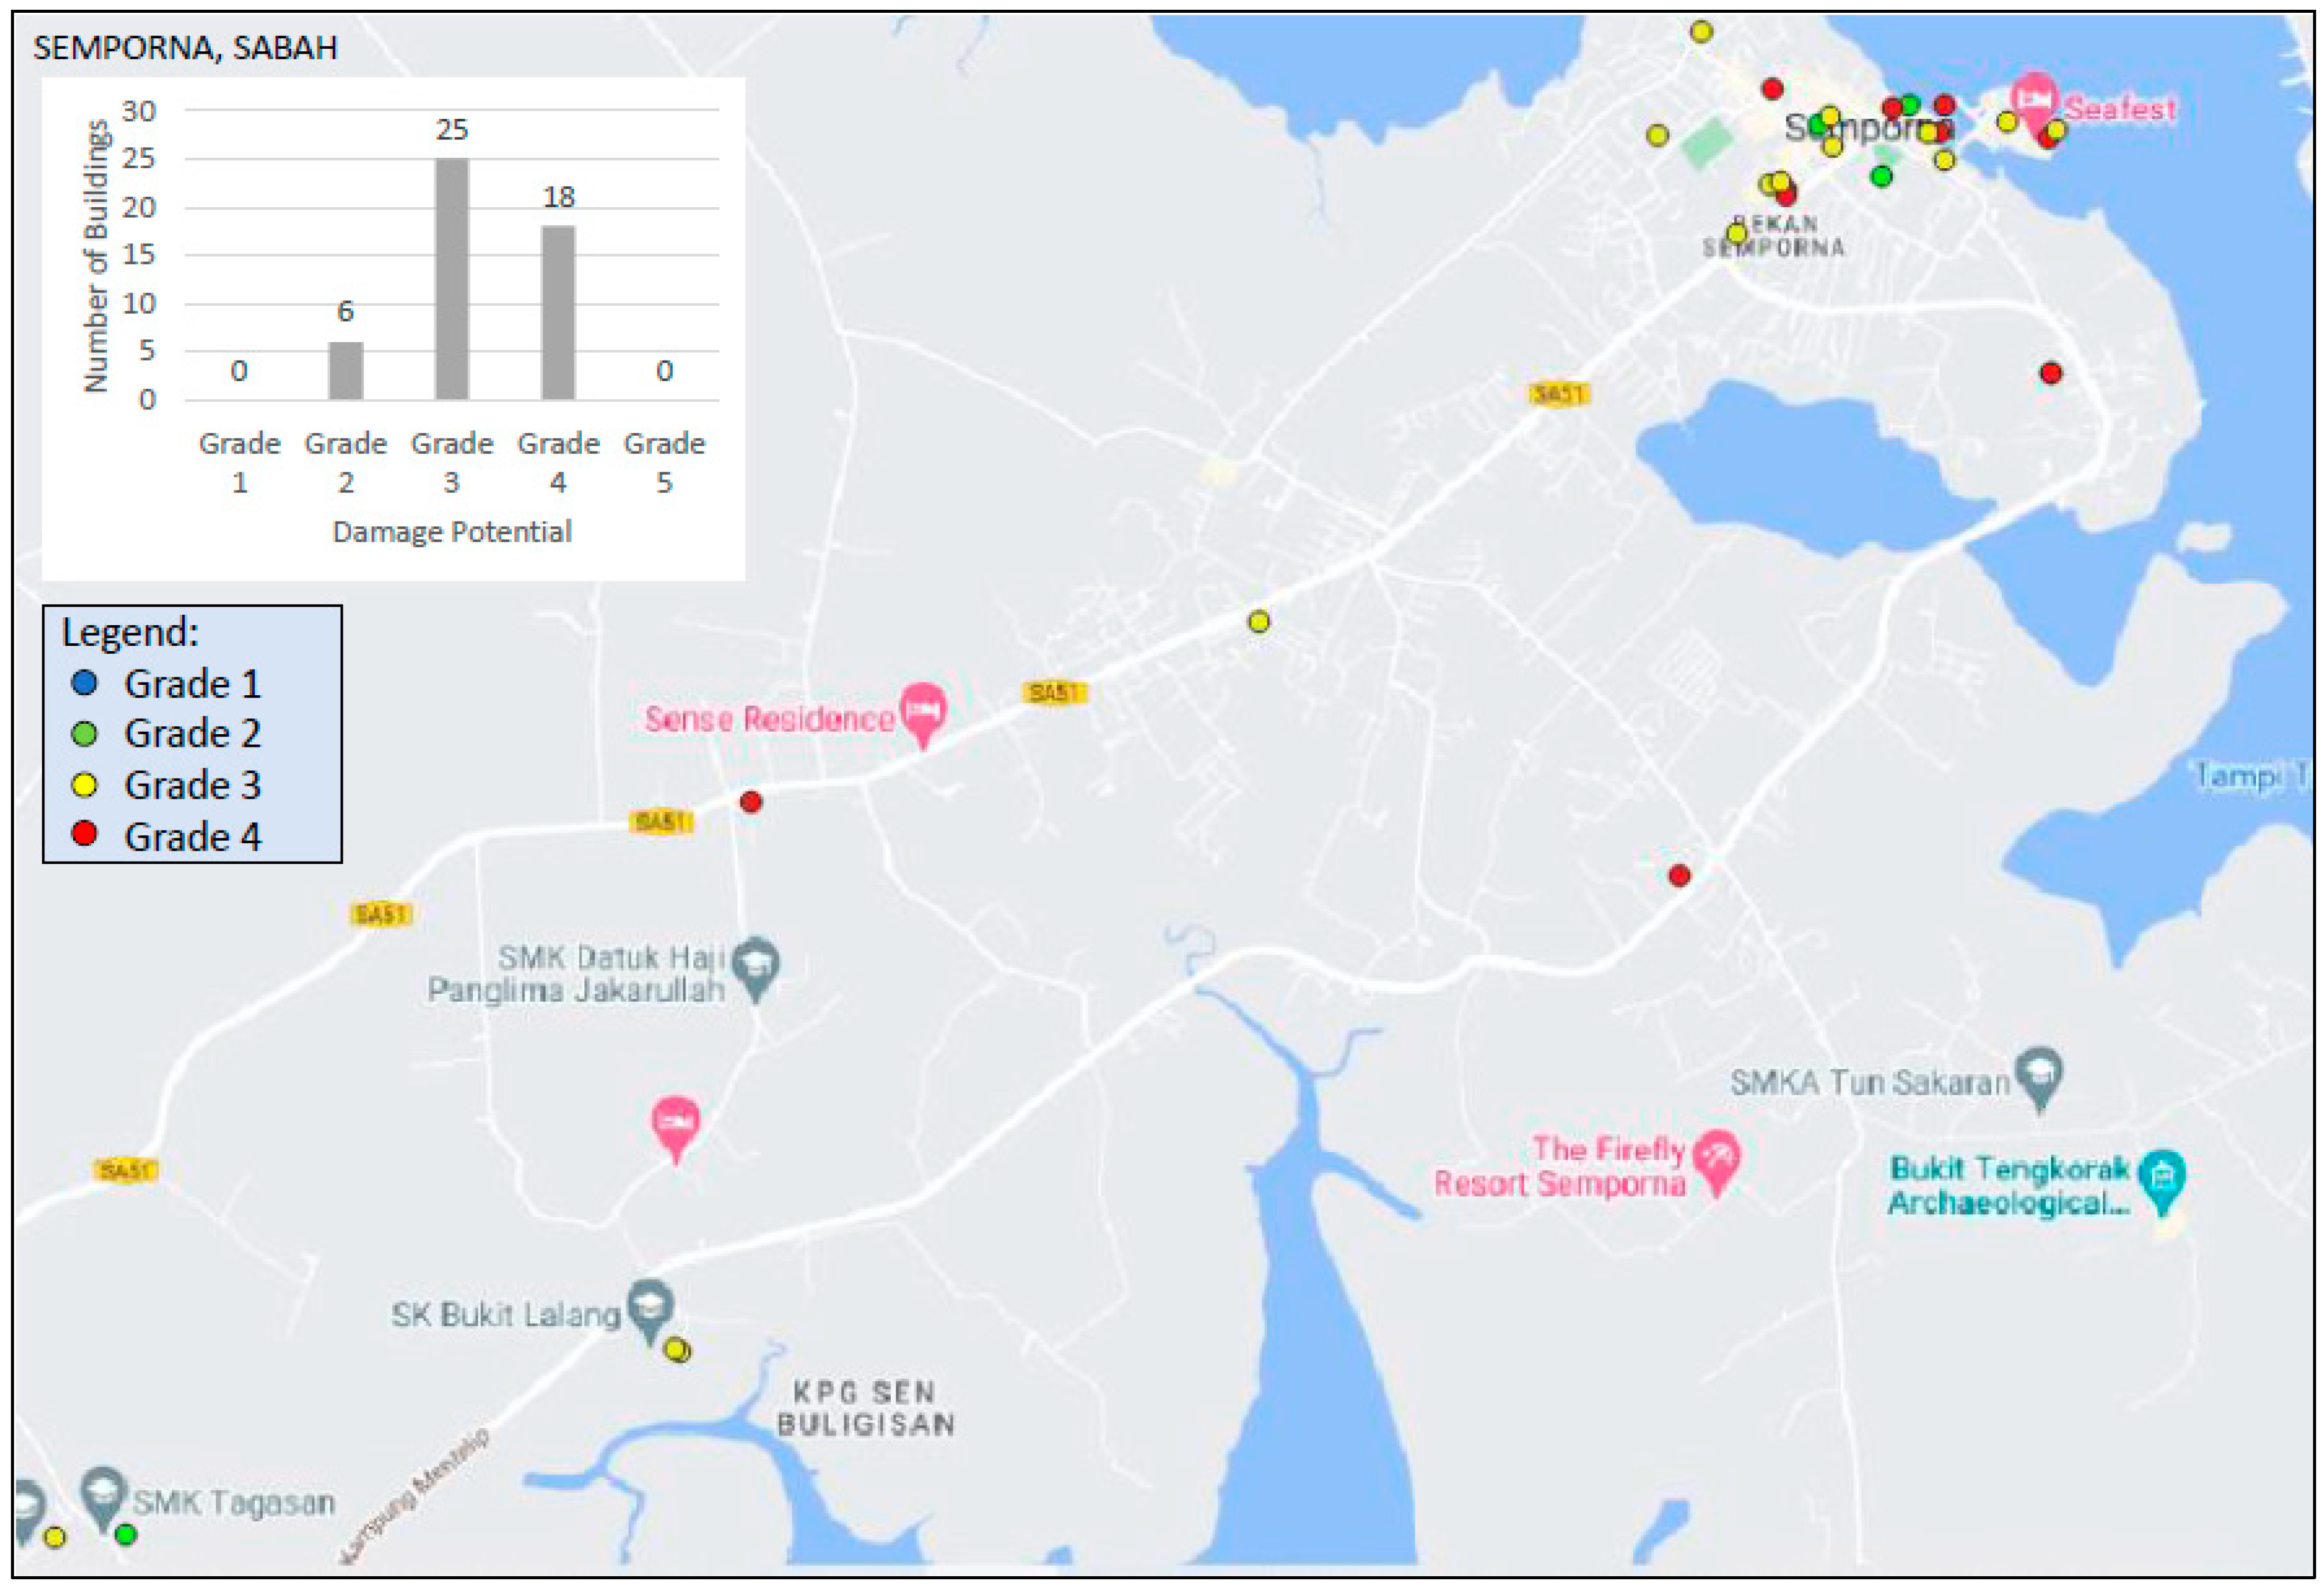
The objectives of this study have been satisfied by the determination of the damage potential of buildings using the Rapid Visual Screening (RVS) method and creating a map with damage potential grades for surveyed buildings in Sabah. The study visually inspected 555 structures to determine their level of vulnerability, including low-, medium-, and high-rise structures in Sabah. However, due to the time-consuming detailed evaluation and the lack of complete drawings, the RVS method does not include complex calculations. As a result, the seismic evaluation is made based on more general considerations related to building type, geometric irregularities, and site soil conditions. According to the survey, it is observed that the overall percentage of 48% of the surveyed buildings recorded the highest damage (Grade 3 to 4) in seven districts of Sabah, including 238 buildings in Kota Kinabalu, has been evaluated. Meanwhile, most of the buildings have a Grade 3 damage potential in the other districts of Ranau, Kota Marudu, Kudat, Tawau, Semporna, and Lahad Datu. To predict the actual structural performance levels under assigned local seismic excitation, a detailed structural evaluation is also recommended for each specific building, using structural analysis software. Furthermore, a parametric building seismic analysis can be used to study the changes in specific parameters which affect the behavior of a system. In the context of earthquake engineering, parametric analysis is used to understand how variations in building characteristics, such as material properties, geometric configurations, and foundation conditions, can impact the structural response of buildings during an earthquake. As a recommendation, the fragility curves will be developed in future studies to get a better damage prediction.

Author Contributions

Conceptualization, N.S.H.H.; methodology, N.S.H.H.; software, N.I.H.H. and S.S.; validation, N.S.H.H., N.M.F.T. and N.A.B.; visualization, N.S.H.H.; N.M.F.T.; N.A.B. and H.M.M.; formal analysis, N.S.H.H., N.I.H.H., S.S. and H.M.M.; investigation, N.S.H.H., N.I.H.H. and S.S.; resources, N.S.H.H. and N.A.B.; data curation, N.I.H.H. and S.S.; writing—original draft preparation, N.S.H.H., N.I.H.H. and S.S.; writing—review and editing, N.S.H.H. and N.M.F.T.; supervision, N.S.H.H. and H.M.M.; project administration, N.S.H.H. and N.M.F.T.; funding acquisition, N.S.H.H. and N.M.F.T. All authors have read and agreed to the published version of the manuscript.

Funding

This research was funded by MINISTRY OF HIGHER EDUCATION MALAYSIA, grant number FRGS/1/2020/TK0/UMS/02/11 and UNIVERSITI MALAYSIA SABAH (UMS) through the Geran Bantuan Penyelidikan Pascasiswazah (UMSGreat), GUG0554-1/2022 and GUG0555-1/2022.

Data Availability Statement

Data available on request due to restrictions eg privacy or ethical. The data presented in this study are available on request from the corresponding author. The data are not publicly available due to ethical concerns.

Acknowledgments

The author would like to acknowledge the Ministry of higher education for funding the project through the Fundamental Grant Scheme (FRGS), FRGS/1/2020/TK0/UMS/02/11, and Universiti Malaysia Sabah (UMS) through the Geran Bantuan Penyelidikan Pascasiswazah (UMSGreat), GUG0554-1/2022 and GUG0555-1/2022.

Conflicts of Interest

The authors declare no conflict of interest.

References

  1. Zucca, M.; Reccia, E.; Longarini, N.; Cazzani, A. Seismic assessment and retrofitting of an historical masonry building damaged during the 2016 Centro Italia seismic svent. Appl. Sci. 2022, 12, 11789. [Google Scholar] [CrossRef]
  2. Blagojević, P.; Brzev, S.; Cvetković, R. Seismic retrofitting of mid-rise unreinforced masonry residential buildings after the 2010 Kraljevo, Serbia earthquake: A case study. Buildings 2023, 13, 597. [Google Scholar] [CrossRef]
  3. Predari, G.; Stefanini, L.; Marinković, M.; Stepinac, M.; Brzev, S. Adriseismic methodology for expeditious seismic assessment of unreinforced masonry buildings. Buildings 2023, 13, 344. [Google Scholar] [CrossRef]
  4. Tongkul, F. Active tectonics in Sabah—Seismicity and active faults. Bull. Geol. Soc. Malays. 2017, 64, 27–36. [Google Scholar] [CrossRef] [Green Version]
  5. Harith, N.S.H.; Jainih, V.; Ladin, M.A.; Adiyanto, M.I. Assessing the vulnerability of Kota Kinabalu buildings. Civ. Eng. Archit. 2021, 9, 68–77. [Google Scholar] [CrossRef]
  6. Mansor, M.N.A.; Siang, L.C.; Ahwang, A.; Saadun, M.A.; Dumatin, J. Vulnerability study of existing buildings due to seismic activities in Sabah. Int. J. Civ. Eng. Geo-Environ. 2017, 137–147. [Google Scholar]
  7. Khan, S.U.; Qureshi, M.I.; Rana, I.A.; Maqsoom, A. Seismic vulnerability assessment of building stock of Malakand (Pakistan) using FEMA P-154 method. SN Appl. Sci. 2019, 1, 1625. [Google Scholar] [CrossRef] [Green Version]
  8. Brun, M.; Reynouard, J.; Jezequel, L.; Ile, N. Damaging potential of low-magnitude near-field earthquakes on low-rise shear walls. Soil Dyn. Earthq. Eng. 2004, 24, 587–603. [Google Scholar] [CrossRef]
  9. Bommer, J.J.; Georgallides, G.; Tromans, I.J. Is there a near-field for small-to-moderate magnitude earthquakes? J. Earthq. Eng. 2001, 5, 395–423. [Google Scholar] [CrossRef]
  10. Polese, M.; Di Ludovico, M.; d’Aragona, M.G.; Prota, A.; Manfredi, G. Regional vulnerability and risk assessment accounting for local building typologies. Int. J. Disaster Risk Reduct. 2020, 43, 101400. [Google Scholar] [CrossRef]
  11. Menegon, S.J.; Tsang, H.H.; Lumantarna, E.; Lam, N.T.K.; Wilson, J.L.; Gad, E.F. Framework for seismic vulnerability assessment of reinforced concrete buildings in Australia. Aust. J. Struct. Eng. 2019, 20, 143–158. [Google Scholar] [CrossRef]
  12. Shah, M.F.; Kegyes, B.O.K.; Ray, R.P.; Ahmed, A.; Al-ghamadi, A. Vulnerability assessment of residential buildings in Jeddah: A methodological proposal. Int. J. GEOMATE 2018, 14, 134–141. [Google Scholar] [CrossRef]
  13. Ghafar, M.; Ramly, N.; Alel, M.; Adnan, A.; Mohamad, E.T.; Yunus, M.Z.M. A simplified method for preliminary seismic vulnerability assessment of existing building in Kundasang, Sabah, Malaysia. J. Teknol. 2015, 72, 1–7. [Google Scholar] [CrossRef] [Green Version]
  14. Roslee, R.; Termizi, A.K.; Indan, E.; Tongkul, F. Earthquake vulnerability assessment (EVAs): A study of physical vulnerability assessment in Ranau area, Sabah, Malaysia. ASM Sci. J. 2018, 11, 66–74. [Google Scholar]
  15. Wang, P.C.; Li1, S.Z.; Guo, L.L.; Jiang, S.H.; Somerville, I.D.; Zhao, S.J.; Zhu, B.D.; Che, J.; Dai, L.M.; Suo, Y.H.; et al. Mesozoic and cenozoic accretionary orogenic processes in Borneo and their mechanisms. Geol. J. 2016, 51 (Suppl. S1), 464–489. [Google Scholar] [CrossRef]
  16. Wong, K.M.; Neo, L. Species richness, lineages, geography, and the forest matrix: Borneo’s ‘Middle Sarawak’ phenomenon. Gard. Bull. Singap. 2019, 71 (Suppl. S2), 463–496. [Google Scholar] [CrossRef]
  17. Jainih, V.; Harith, N.S.H. Seismic vulnerability assessment in Kota Kinabalu, Sabah. In Proceedings of the 2nd International Conference on Civil & Environmental Engineering 2020, Kuala Lumpur, Malaysia, 18–19 November 2020; IOP Publishing Ltd.: Bristol, UK, 2020; Volume 476, p. 012053. [Google Scholar] [CrossRef]
  18. Tongkul, F. Earthquake Science in Malaysia: Status, Challenges and Way Forward; Penerbit Universiti Malaysia Sabah: Kota Kinabalu, Malaysia, 2020. [Google Scholar]
  19. Wannier, M. History of geological mapping in Sabah (late 19th Century-1951). Bull. Geol. Soc. Malays. 2017, 64, 37–49. [Google Scholar] [CrossRef] [Green Version]
  20. Mohd Zainudin, M.S.F.; Zubir, N.; Yan, A.S.W.; Amnan, I.; Among, H.L.; Javino, F. Geological map of Sabah. Miner. Geosci. Malays. 2015, 4, 1. [Google Scholar]
  21. Harith, N.S.H.; Tongkul, F.; Adnan, A. Seismic Hazard Curve as Dynamic Parameters in Earthquake Building Design for Sabah, Malaysia. Buildings 2023, 13, 318. [Google Scholar] [CrossRef]
  22. Majid, T.A.; Adnan, A.; Adiyanto, M.I.; Ramli, M.Z.; Ghuan, T.C. Preliminary damage assessment due to 2015 Ranau earthquake. Int. J. Civ. Eng. Geo-Environ. 2017, 49–54. [Google Scholar]
  23. MSEN1998-1:2015; Malaysia National Annex to Eurocode 8: Design of Structures for Earthquake Resistance—Part 1: General Rules, Seismic Actions and Rules for Buildings. Department of Standards Malaysia: Kuala Lumpur, Malaysia, 2017.
  24. Harith, N.S.H.; Kibata, L.H.C.; Mirasa, A.K.B. Suitability of Dbela methods as seismic vulnerability assessment for buildings in Kota Kinabalu, Sabah. Geol. Behav. (GBR) 2018, 2, 29–31. [Google Scholar] [CrossRef]
  25. Rapid Visual Screening of Buildings for Potential Seismic Hazards: A Handbook, 3rd ed.; FEMA P-154; Federal Emergency Management Agency: Washington, DC, USA, 2015.
  26. Ningthoujam, M.C.; Nanda, R.P. Rapid visual screening procedure of existing building based on statistical analysis. Int. J. Disaster Risk Reduct. 2018, 28, 720–730. [Google Scholar] [CrossRef]
  27. Kassem, M.M.; Beddu, S.; Ooi, J.H.; Tan, C.G.; El-Maissi, A.M.; Nazri, F.M. Assessment of seismic building vulnerability using rapid visual screening method through web-based application for Malaysia. Buildings 2021, 11, 485. [Google Scholar] [CrossRef]
  28. Arash, K.-A.; Alireza, F.; Nasserasadi, K. Statistical quantification of Zanjan City structures based on FEMA 154. MOJ Civ. Eng. 2017, 3, 00065. [Google Scholar] [CrossRef] [Green Version]
  29. Shah, M.F.; Ahmed, A.; Kegyes-Brassai, O.; Alghamdi, A.; Ray, R.P. A case study using rapid visual screening method to determine the vulnerability of buildings in two districts of Jeddah, Saudi Arabia. In Proceedings of the 15th international Symposium on New Technologies for Urban Safety of Mega Cities in Asia 2016, Tacloban, Philippines, 7–9 November 2016. [Google Scholar]
  30. Haryanto, Y.; Hu, H.-T.; Han, A.L.; Hidayat, B.A.; Widyaningrum, A.; Yulianita, P.E. Seismic vulnerability assessment using rapid visual screening: Case study of educational facility buildings of Jenderal Soedirman University, Indonesia. Civ. Eng. Dimens. 2020, 22, 13–21. [Google Scholar] [CrossRef]
  31. Karapetroua, S.T.; Fotopouloua, S.D.; Pitilakisa, K.D. Seismic vulnerability of RC buildings under the effect of aging. Procedia Environ. Sci. 2017, 38, 461–468. [Google Scholar] [CrossRef]
  32. Google Maps. Google Map Sabah. Available online: https://www.google.com/maps/search/google+map+sbah/@5.6614184,116.3693838,8.75z (accessed on 1 August 2022).
  33. Clemente, S.J.C.; Concha, N.C. Assessment of Seismic Vulnerability of Public Schools in Metro Manila within 5 Km from the West Valley Fault Line using Rapid Visual Survey (RVS). In Proceedings of the 2020 IEEE 12th International Conference on Humanoid, Nanotechnology, Information Technology, Communication and Control, Environment, and Management 2020, Manila, Philippines, 3–7 December 2020; IEEE: Piscataway, NJ, USA, 2020; pp. 1–4. [Google Scholar] [CrossRef]
  34. Sreerama, A.K.; Rajaram, C.; Kumar, R.P. Correlation between rapid visual survey score and possible damage of a building. Indian Concr. J. 2017, 91, 1–12. [Google Scholar]
  35. Adiyanto, M.I.; Majid, T.A.; Nazri, F.M. Nonstructural damages of reinforced concrete buildings due to 2015 Ranau earthquake. In AIP Conference Proceedings; AIP Publishing LLC: Melville, NY, USA, 2017; Volume 1865, p. 090002. [Google Scholar] [CrossRef] [Green Version]
  36. Alih, S.C.; Vafaei, M. Performance of reinforced concrete buildings and wooden structures during 2015 Mw 6.0 Sabah earthquake in Malaysia. Eng. Fail. Anal. 2019, 102, 351–368. [Google Scholar] [CrossRef]
Figure 1. Several Sabah earthquakes with a magnitude greater than 2.0 have been reported in each year from 1902 to recently in 2023.
Buildings 13 01500 g001
Figure 2. Active and potentially active faults in Sabah based on the presence of negative lineaments, triangular facets, earthquake epicenters, mud volcanoes, and hot springs [4].
Buildings 13 01500 g002
Figure 3. De-aggregation of the total seismic hazard of Ranau and Lahad Datu, in a 50-year design period for a 475-year return period with total seismic hazard, is discrete in magnitude, distance bins, and percentage contribution to hazard.
Buildings 13 01500 g003
Figure 4. Significant damage due to the 2015 Ranau earthquake [22].
Buildings 13 01500 g004
Figure 5. Flowchart of Sabah buildings’ vulnerability assessment procedure.
Buildings 13 01500 g005
Figure 6. Location of the study area consists of seven districts of Sabah in the Northwest region (Kota Kinabalu, Kudat, Kota Marudu, and Ranau) and in the Southeast region (Lahad Datu, Tawau, and Semporna).
Buildings 13 01500 g006
Figure 7. Soil type based on European Soil Data Center (ESDAC) map.
Buildings 13 01500 g007
Figure 8. An example of the FEMA P-154 Data Collection Form assessment.
Buildings 13 01500 g008
Figure 9. Typical building types in Sabah.
Buildings 13 01500 g009
Figure 10. Damage prediction categorized under Grade 1 to 4 for buildings in the Kota Kinabalu, Kudat, Kota Marudu, Ranau, Lahad Datu, Tawau, and Semporna districts.
Buildings 13 01500 g010
Figure 11. The total number of buildings plotted with the level of damage (Grades 1 to 5) predicted in the study areas: Kota Kinabalu, Kudat, Kota Marudu, Ranau, Lahad Datu, Tawau, and Semporna.
Buildings 13 01500 g011
Figure 12. Building damage prediction in Kota Kinabalu based on surveyed data under moderate earthquakes.
Buildings 13 01500 g012
Figure 13. De-aggregation of the total seismic hazard of Kota Kinabalu in a 50-year design period of a 475-year return period, with a total discrete seismic hazard in terms of magnitude, distance bins, and percentage contribution to hazard.
Buildings 13 01500 g013
Figure 14. Building damage prediction in Ranau based on surveyed data under moderate earthquakes.
Buildings 13 01500 g014
Figure 15. Building damage prediction in Kudat and Kota Marudu based on surveyed data under moderate earthquakes.
Buildings 13 01500 g015
Figure 16. De-aggregation of the total seismic hazard of Kudat and Kota Marudu in a 50-year design period of a 475-year return period with total seismic hazard being discrete in magnitude, distance bins, and percentage contribution to hazard.
Buildings 13 01500 g016
Figure 17. Building damage prediction in Lahad Datu based on surveyed data under moderate earthquakes.
Buildings 13 01500 g017
Figure 18. Building damage prediction in Semporna based on surveyed data under moderate earthquakes.
Buildings 13 01500 g018
Figure 19. Building damage prediction in Tawau based on surveyed data under moderate earthquakes.
Buildings 13 01500 g019
Figure 20. De-aggregation of the total seismic hazard of Semporna in a 50-year design period of 475-year return period with total seismic hazard being discrete in terms of magnitude, distance bins, and percentage contribution to hazard.
Buildings 13 01500 g020
Figure 21. De-aggregation of the total seismic hazard of Tawau in a 50-year design period of a 475-year return period with total seismic hazard being discrete in terms of magnitude, distance bins, and percentage contribution to hazard.
Buildings 13 01500 g021
Table 1. Major earthquakes, damage reports, and peak ground acceleration (PGA) values due to earthquakes in Ranau and Lahad Datu.
Event DateAreas AffectedMagnitudePGA (g)Epicenter
19 May 1966Shaken violently but without damage reported5.30.039–0.092Ranau
26 May 1991Walls collapsed and cracks found in several buildings, columns damaged5.40.039–0.092
5 June 2015Damage to walls, beams, and columns6.00.132
11 August 1923Shaken violently but without damage reported6.30.092–0.18Lahad Datu
26 July 1976Damage to walls, beams, and columns5.80.18–0.34
Table 2. Damage degree according to RVS Score.
RVS ScoreDamage Degree
S < 0.3Grade 5 damage is highly possible, while Grade 4 damage is also very highly probable.
0.3 < S < 0.7Grade 4 damage is highly possible, Grade 3 damage is also very highly probable.
0.7 < S < 2.0Grade 3 damage is highly possible, Grade 2 damage is also very highly probable.
2.0 < S < 3.0Grade 2 damage is highly possible, Grade 1 damage is also very highly probable.
S > 3.0Grade 1 Damage is a possibility.
Table 3. Buildings typically constructed in Sabah based on FEMA 154 classifications.
Types of BuildingDescription
C1Moment-resisting concrete frame structures
C2Buildings with concrete shear walls
C3Unreinforced masonry infill walls in concrete frame buildings
S1Buildings with steel moment-resisting frames
S2Steel-framed buildings that are braced
PC2Structures made of precast concrete
W1Residential and industrial structures with a light wood frame of 500 square feet or less
Disclaimer/Publisher’s Note: The statements, opinions and data contained in all publications are solely those of the individual author(s) and contributor(s) and not of MDPI and/or the editor(s). MDPI and/or the editor(s) disclaim responsibility for any injury to people or property resulting from any ideas, methods, instructions or products referred to in the content.

