
Seismic Fragility Assessment of SMRFs Equipped with TMD Considering Cyclic Deterioration of Members and Nonlinear Geometry

Abstract
:1. Introduction
2. Methodology
2.1. Performance-Based Design
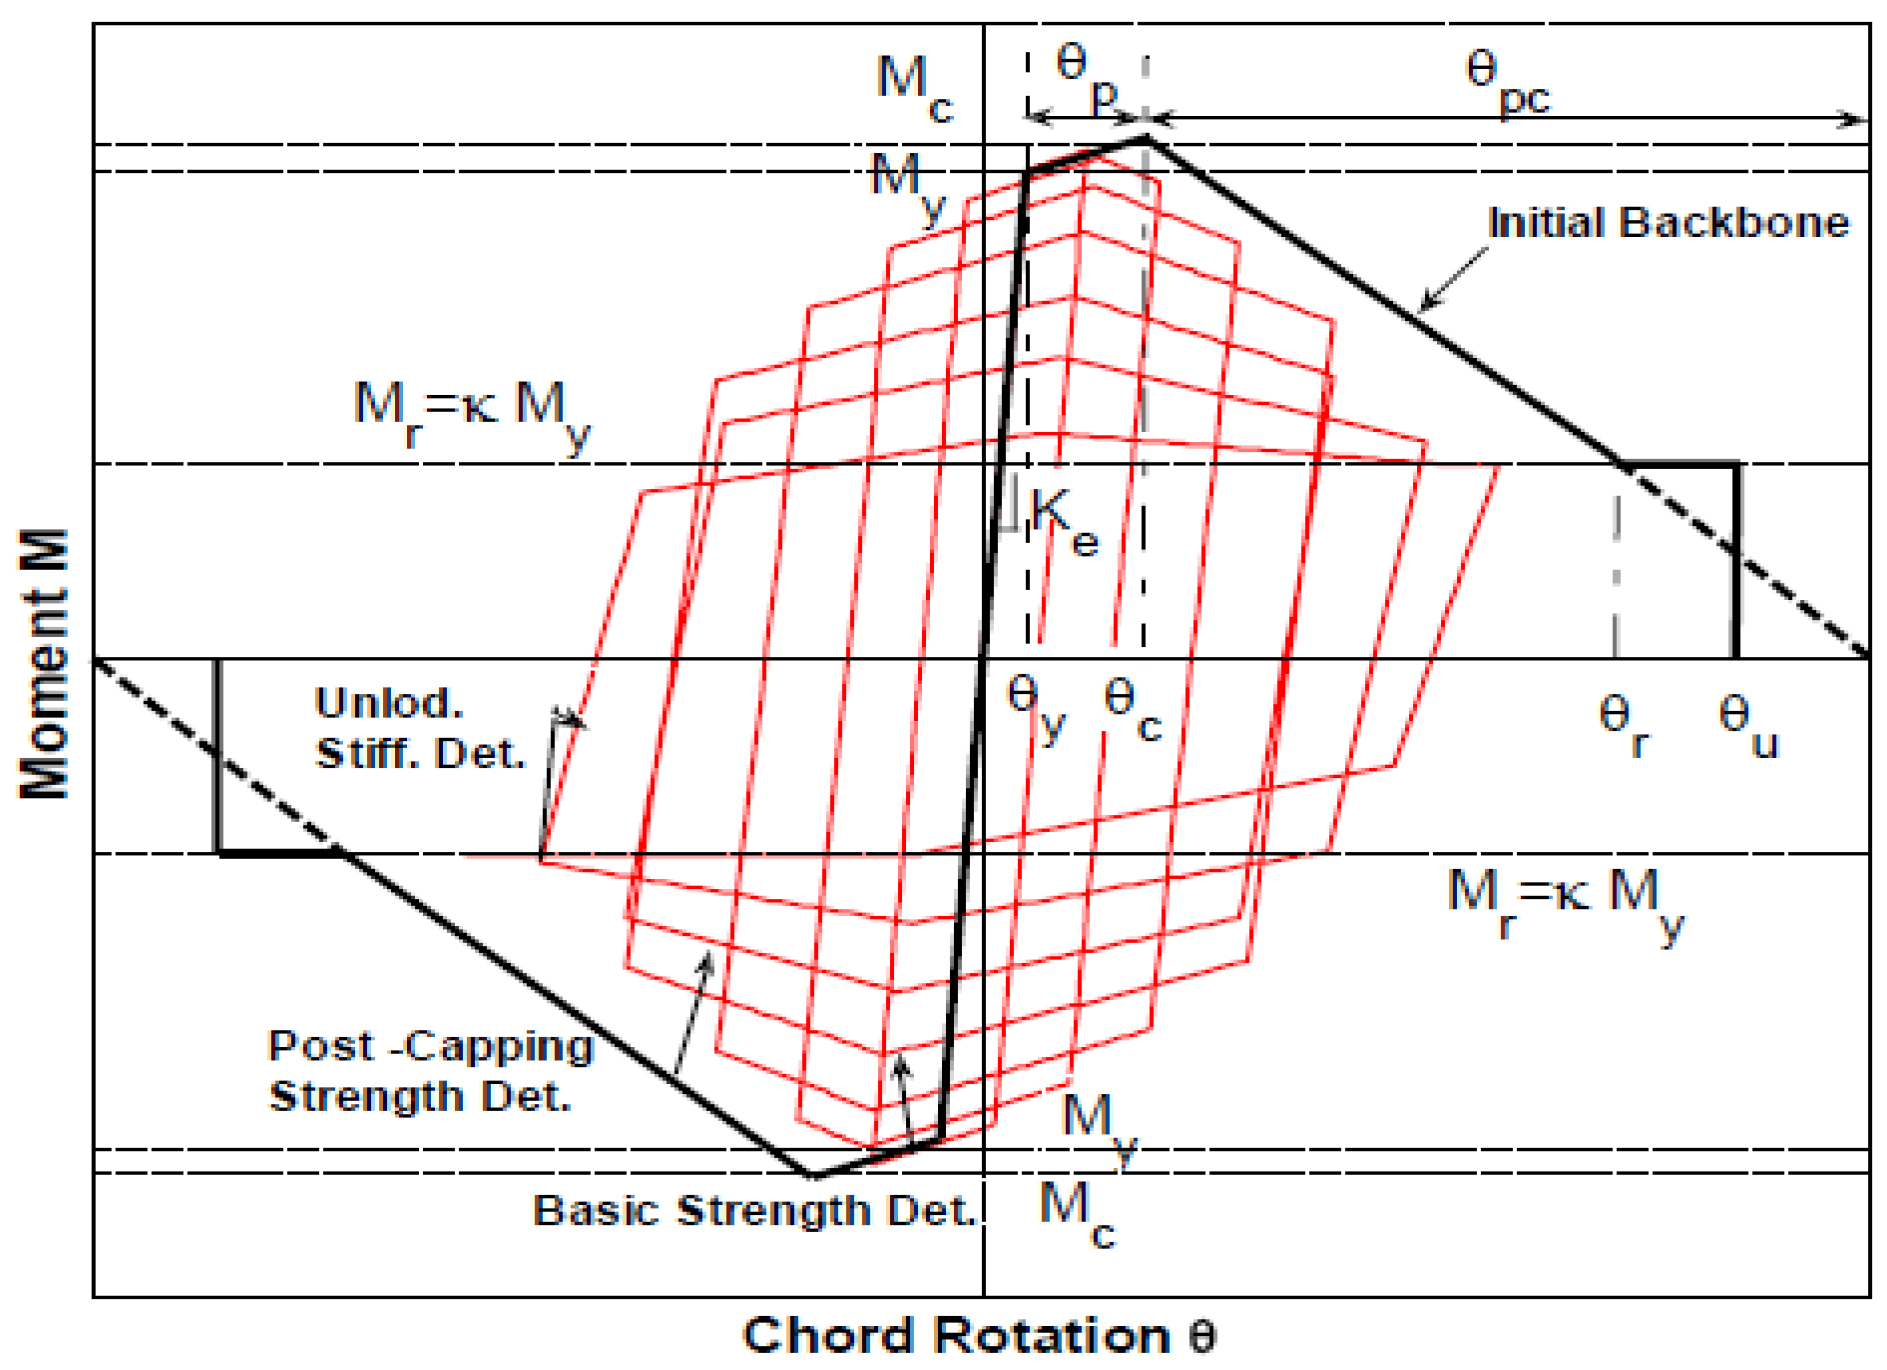
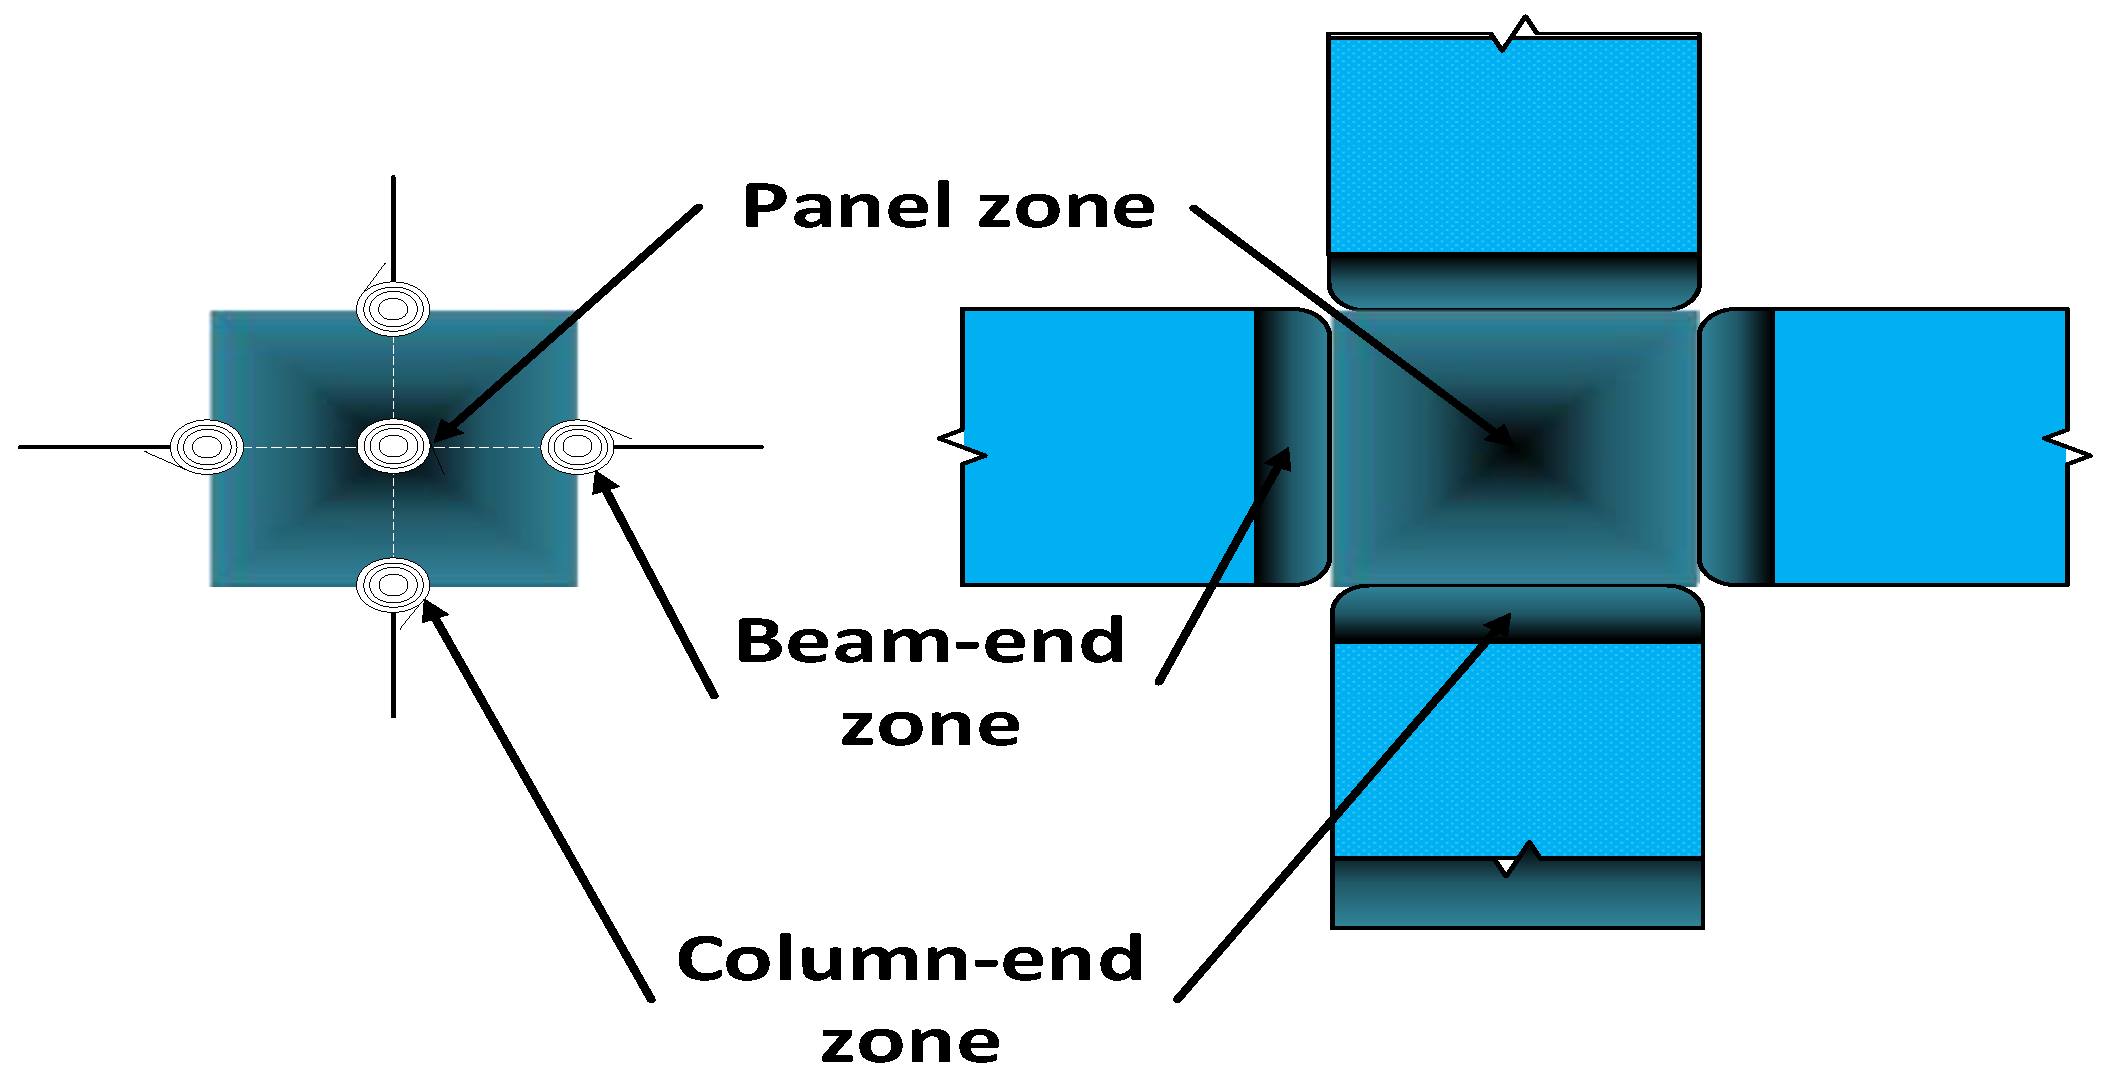
2.2. Modeling
2.3. Ground Motion Record Set and IDA
3. Seismic Performance Evaluation of the Models
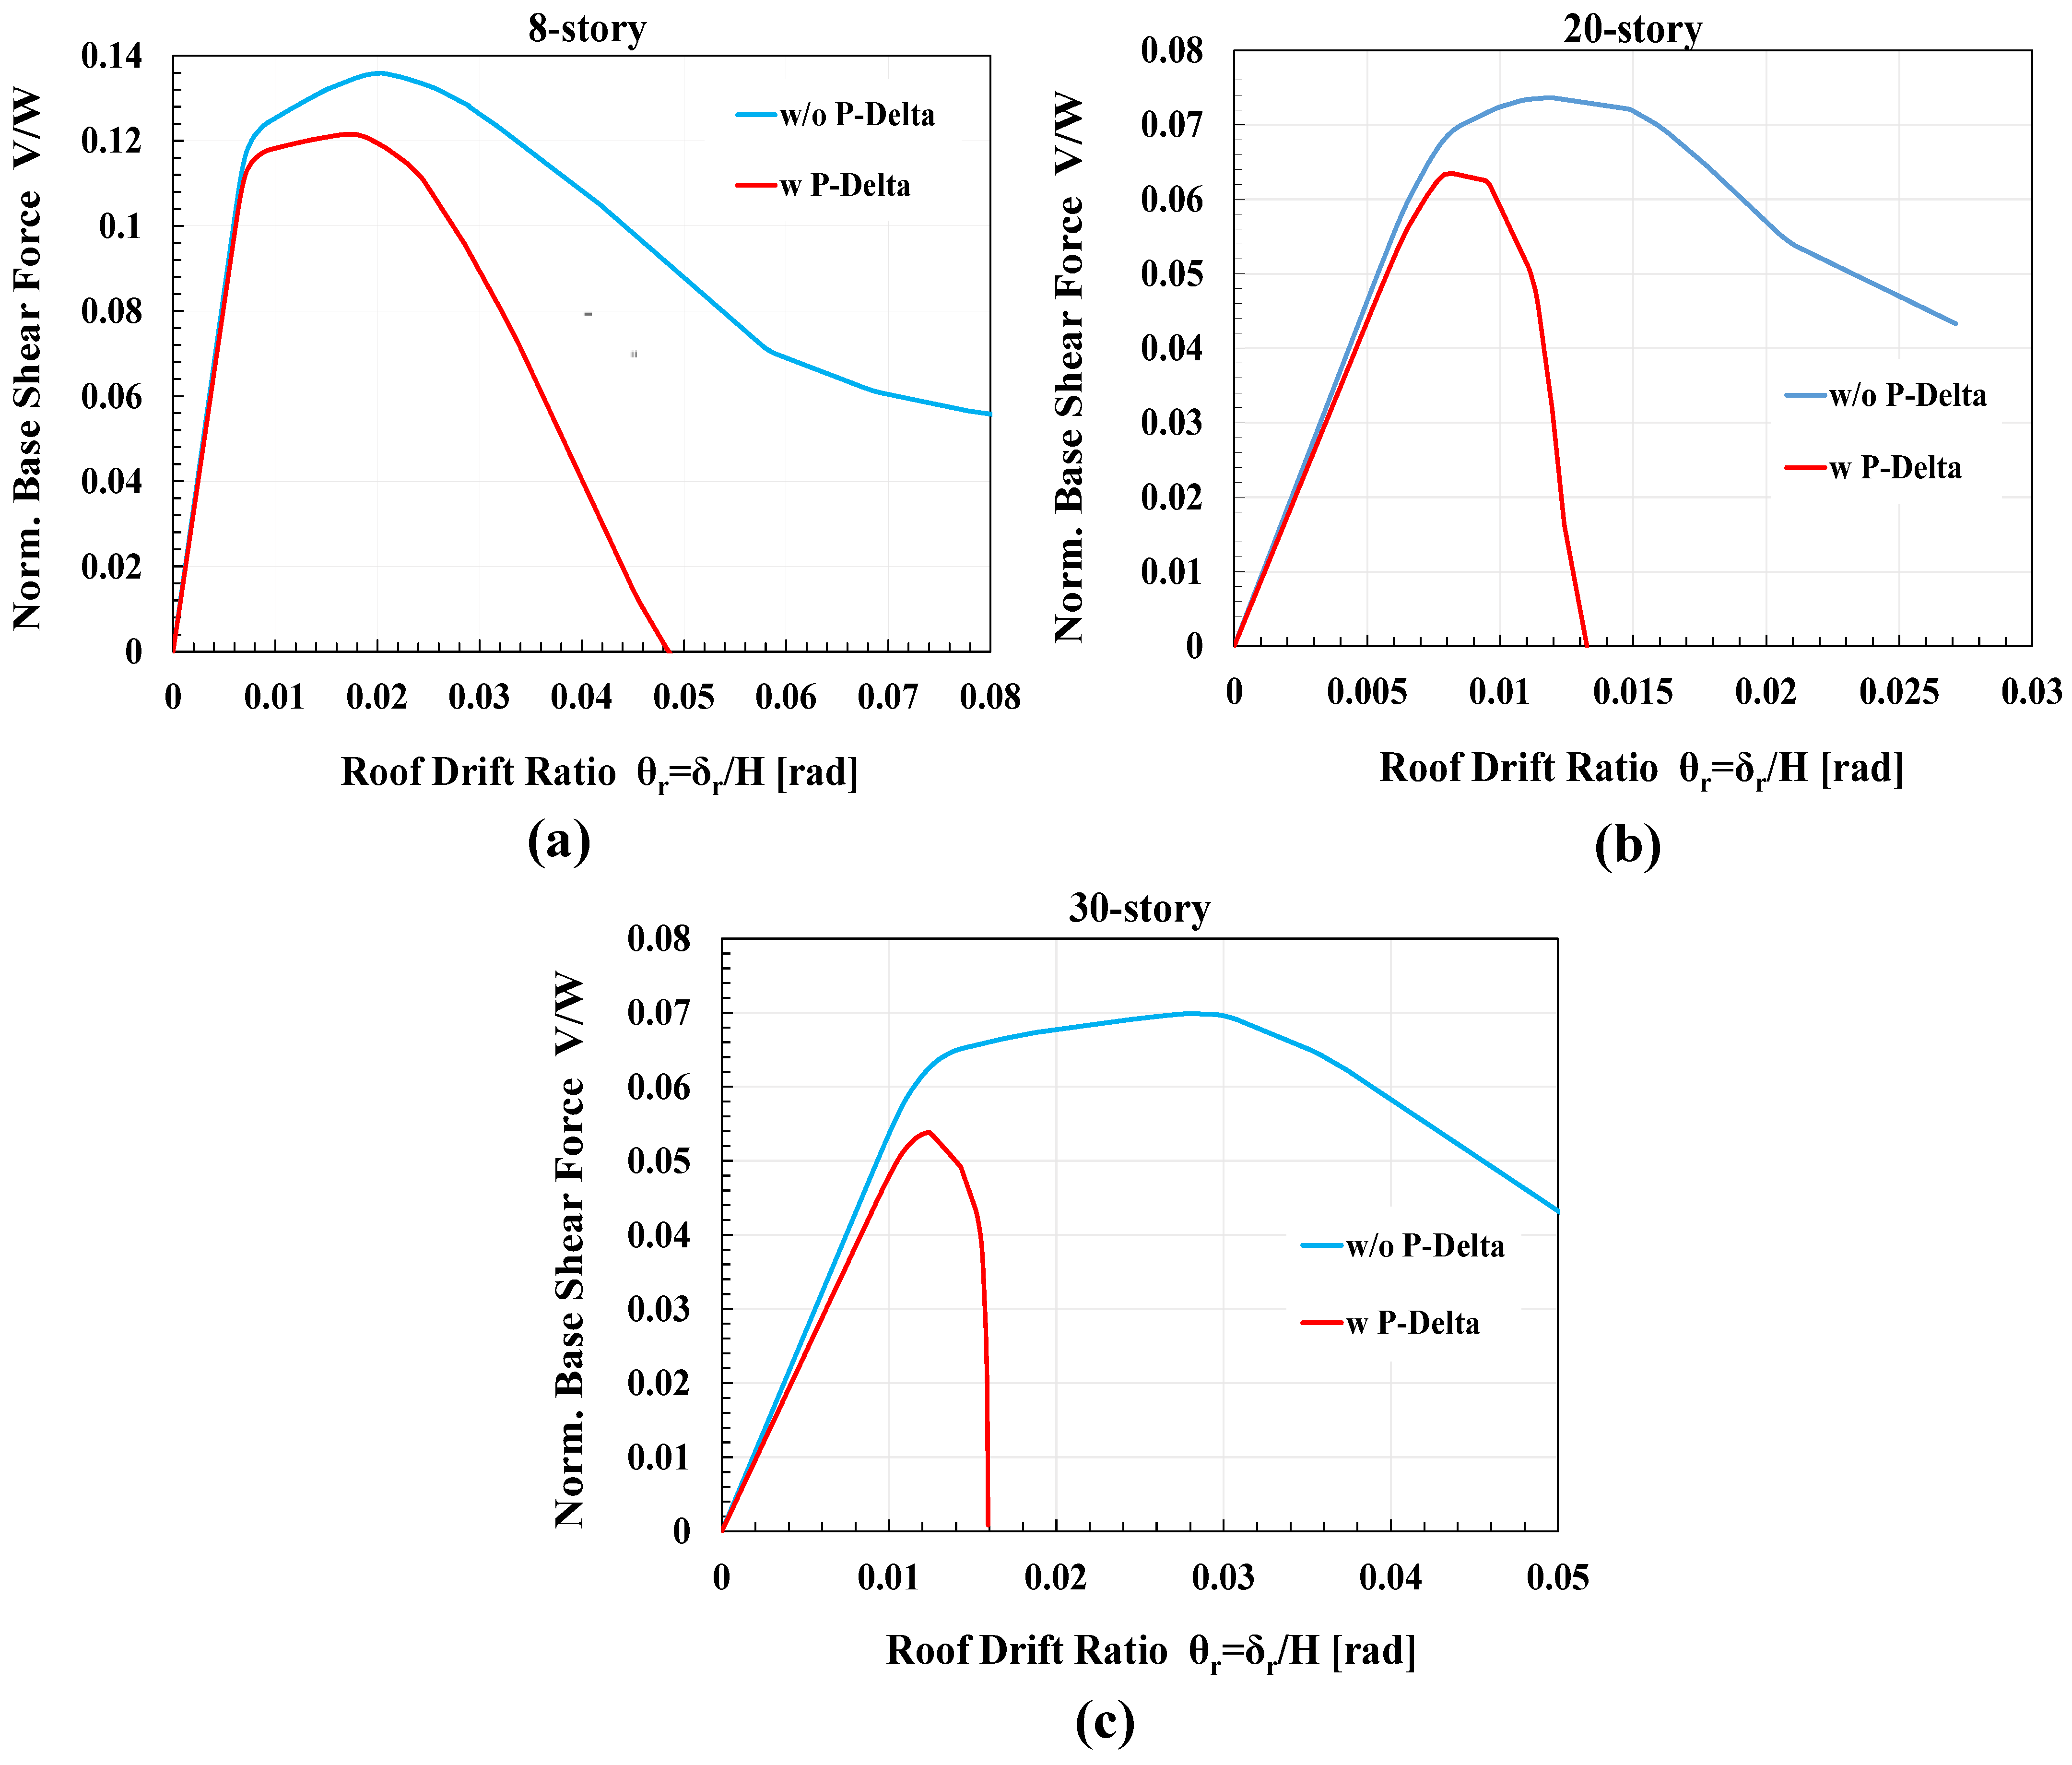
3.1. Modal and Pushover Analysis
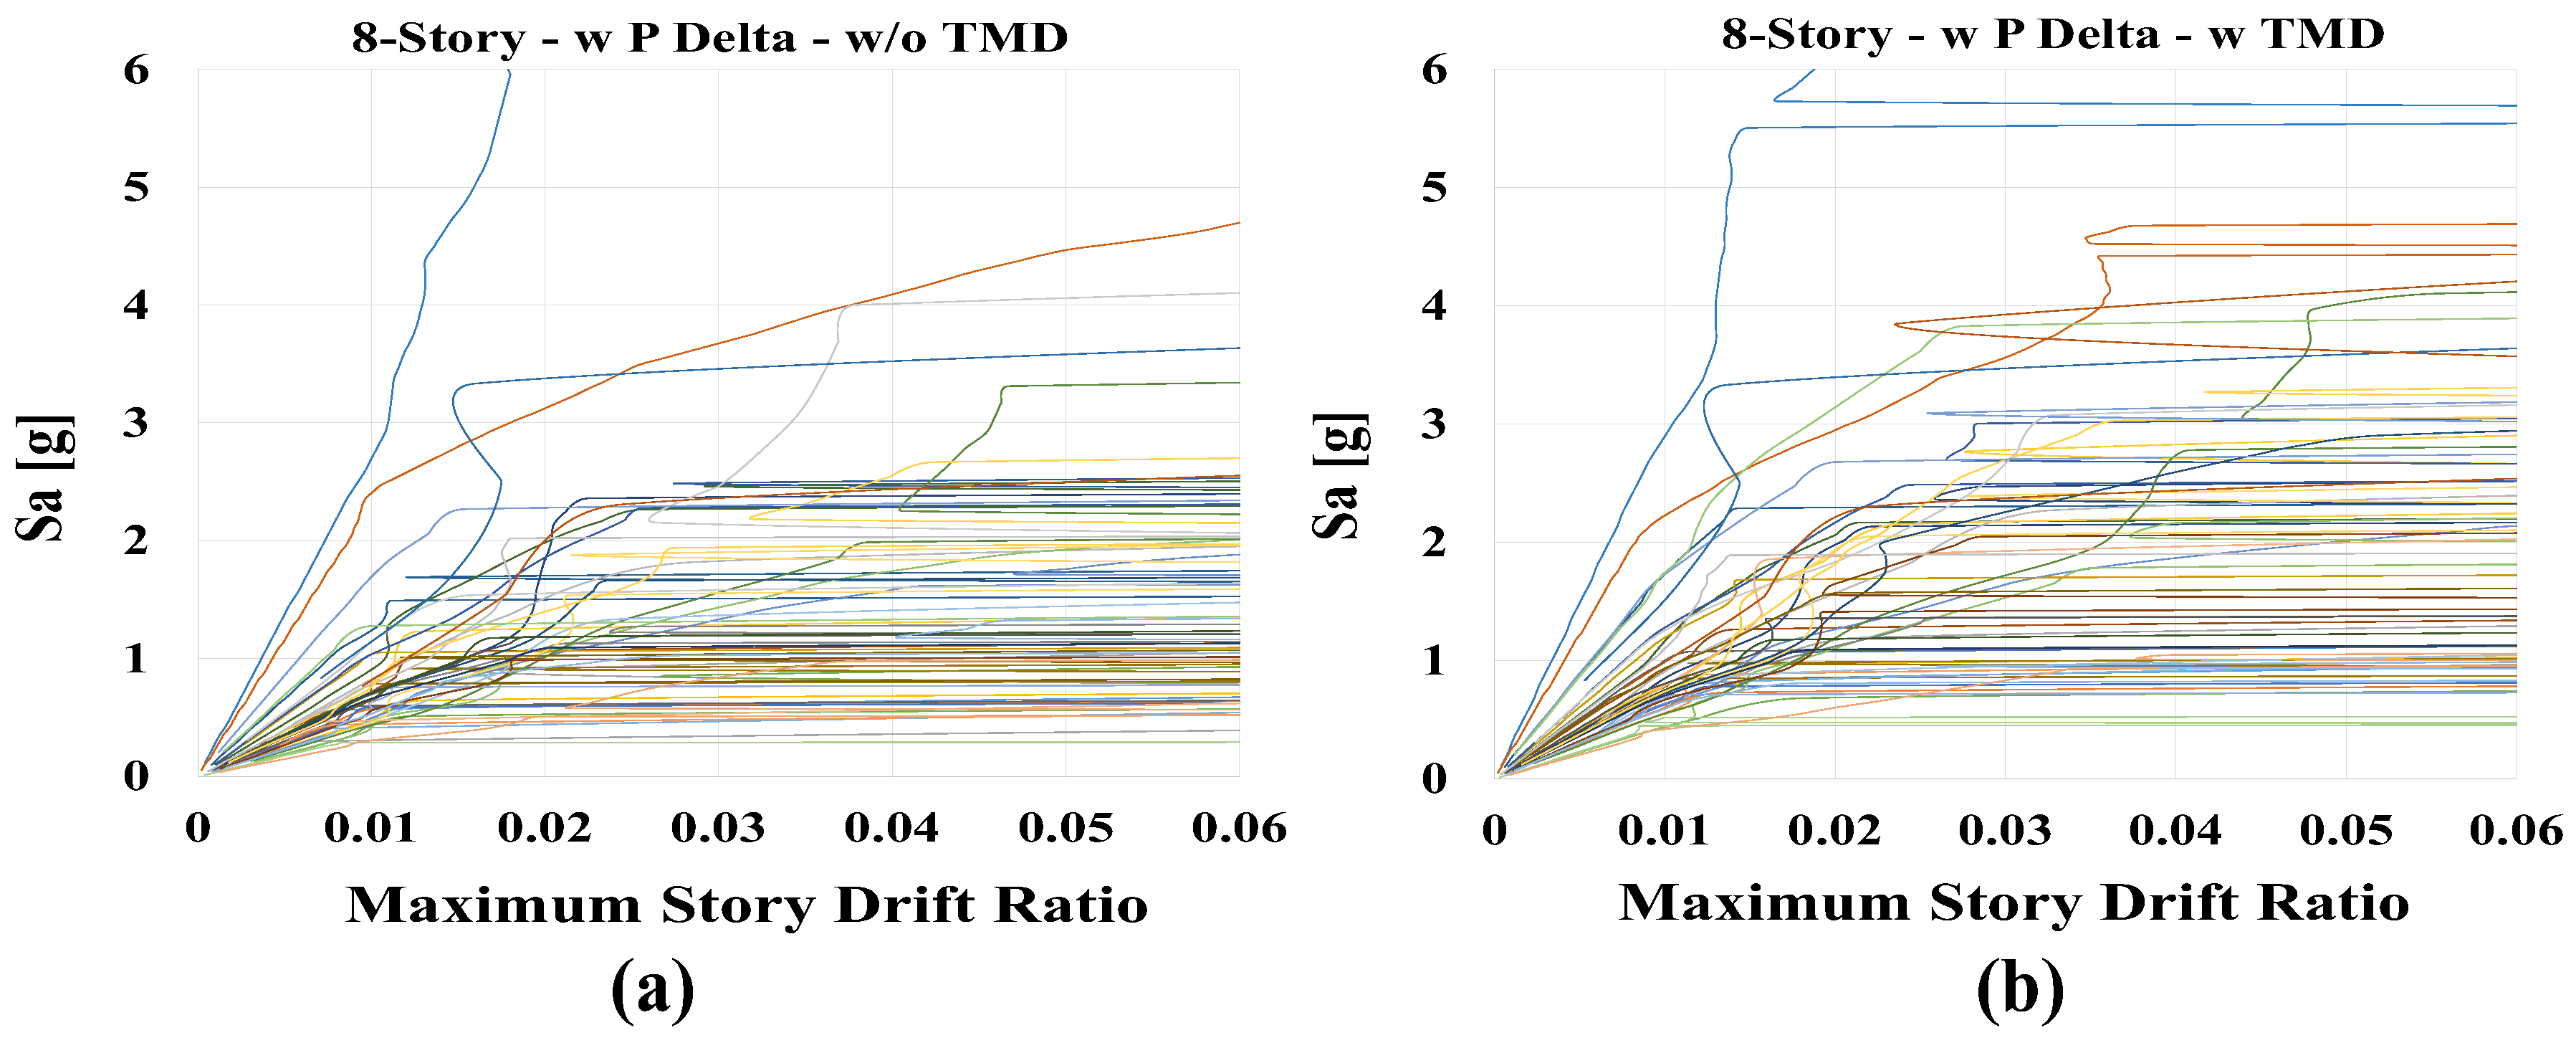
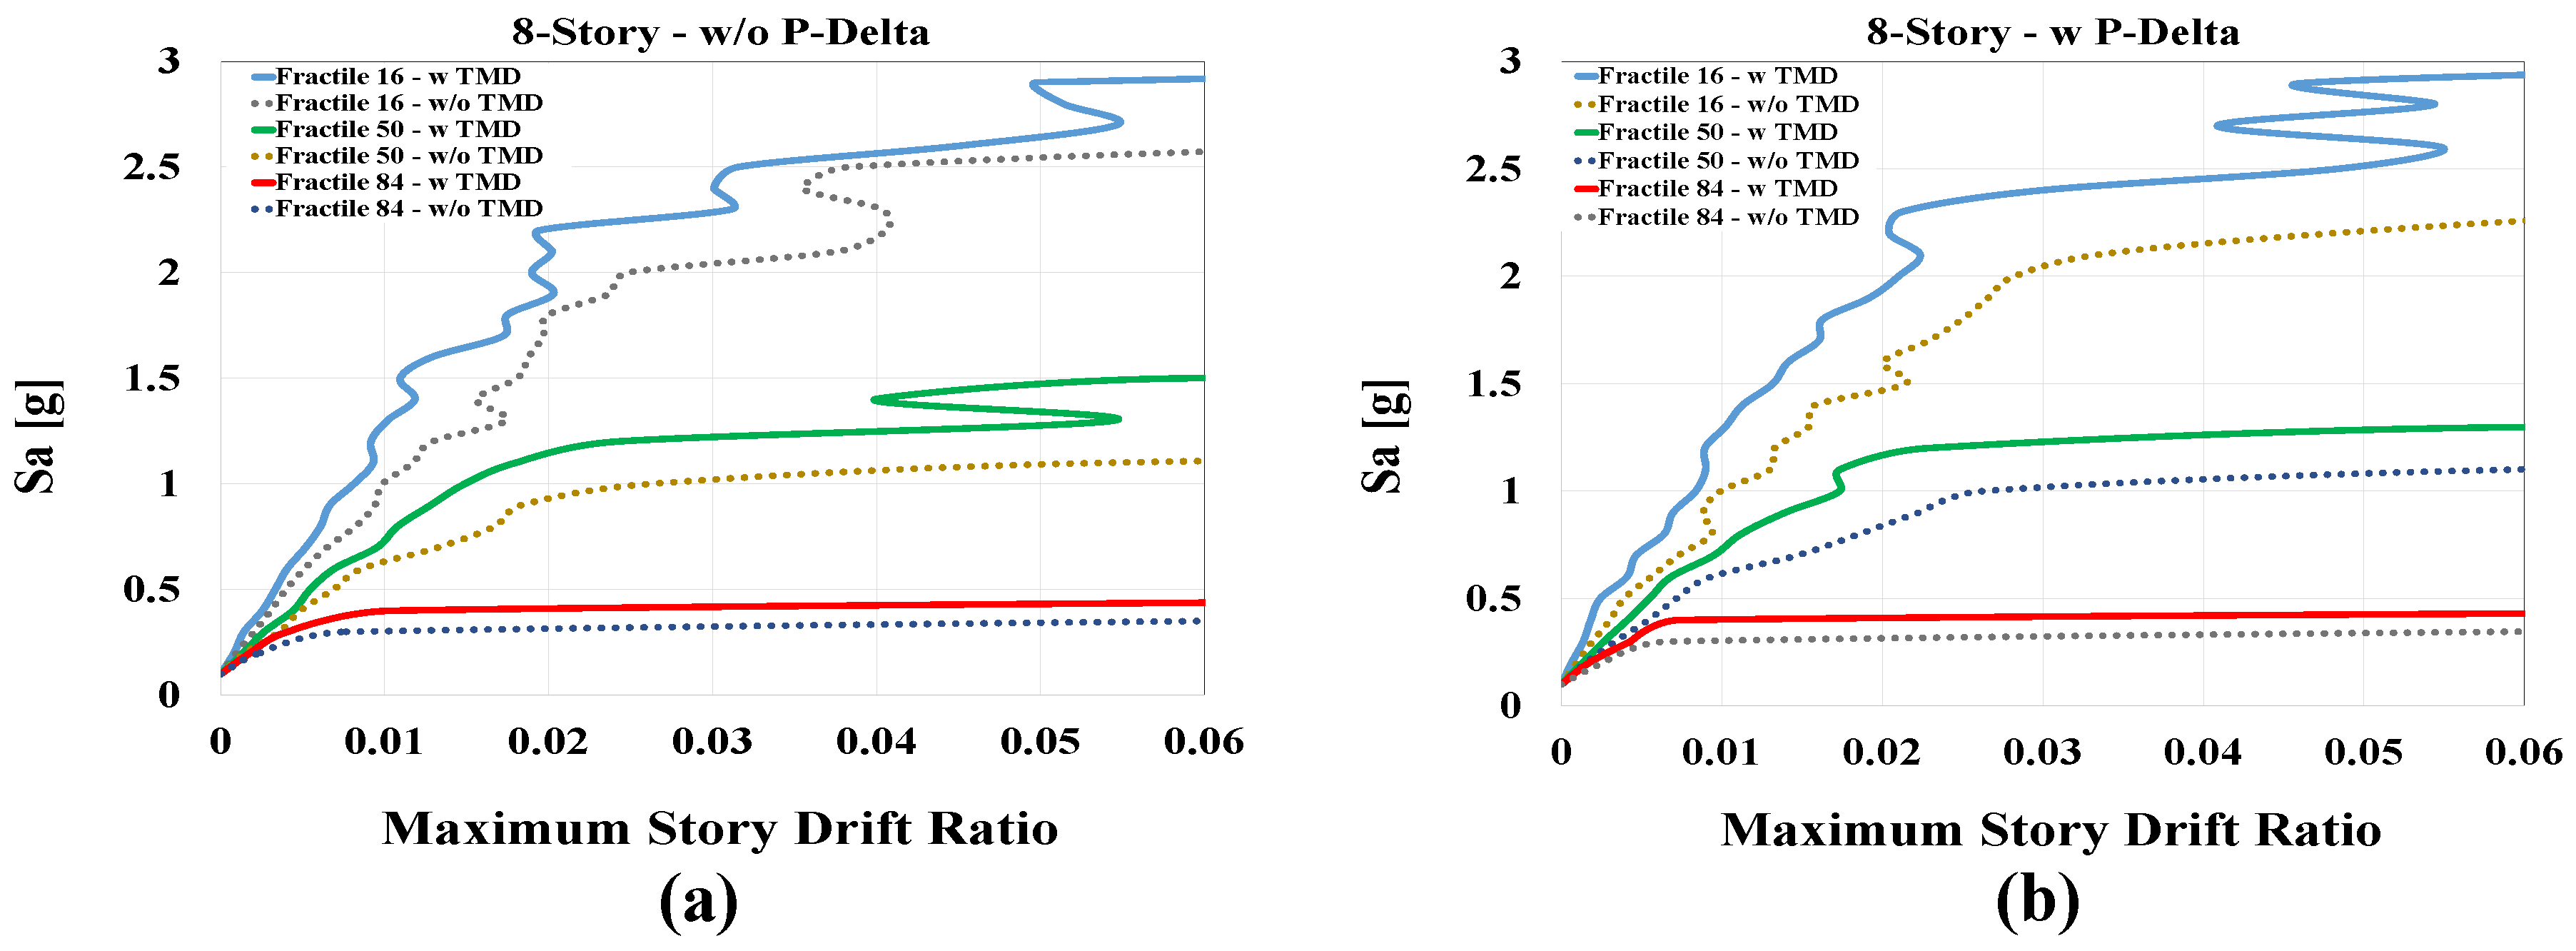
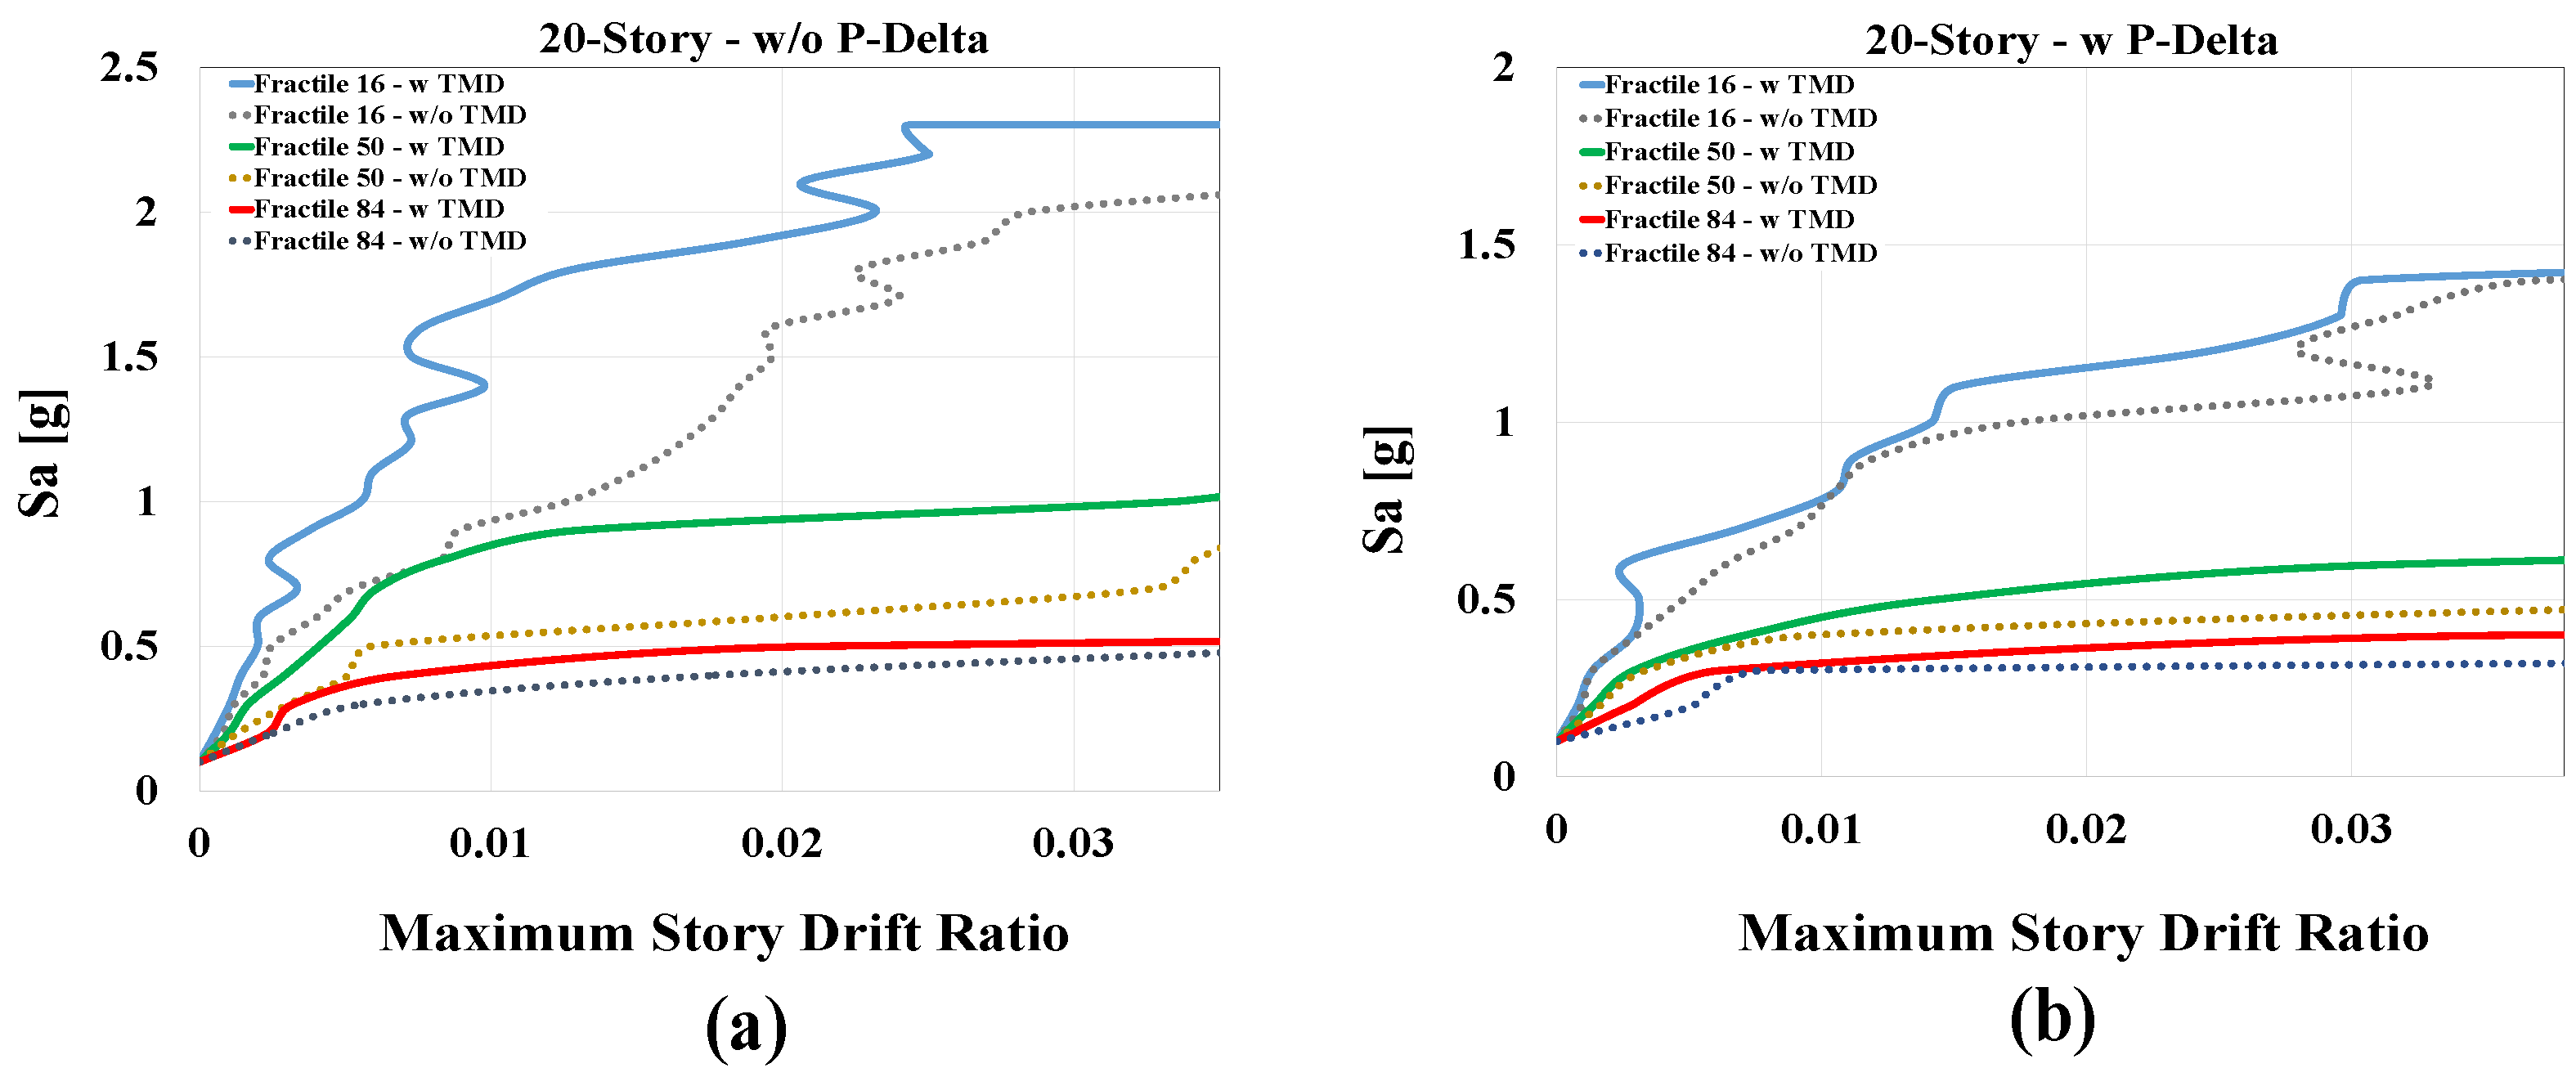
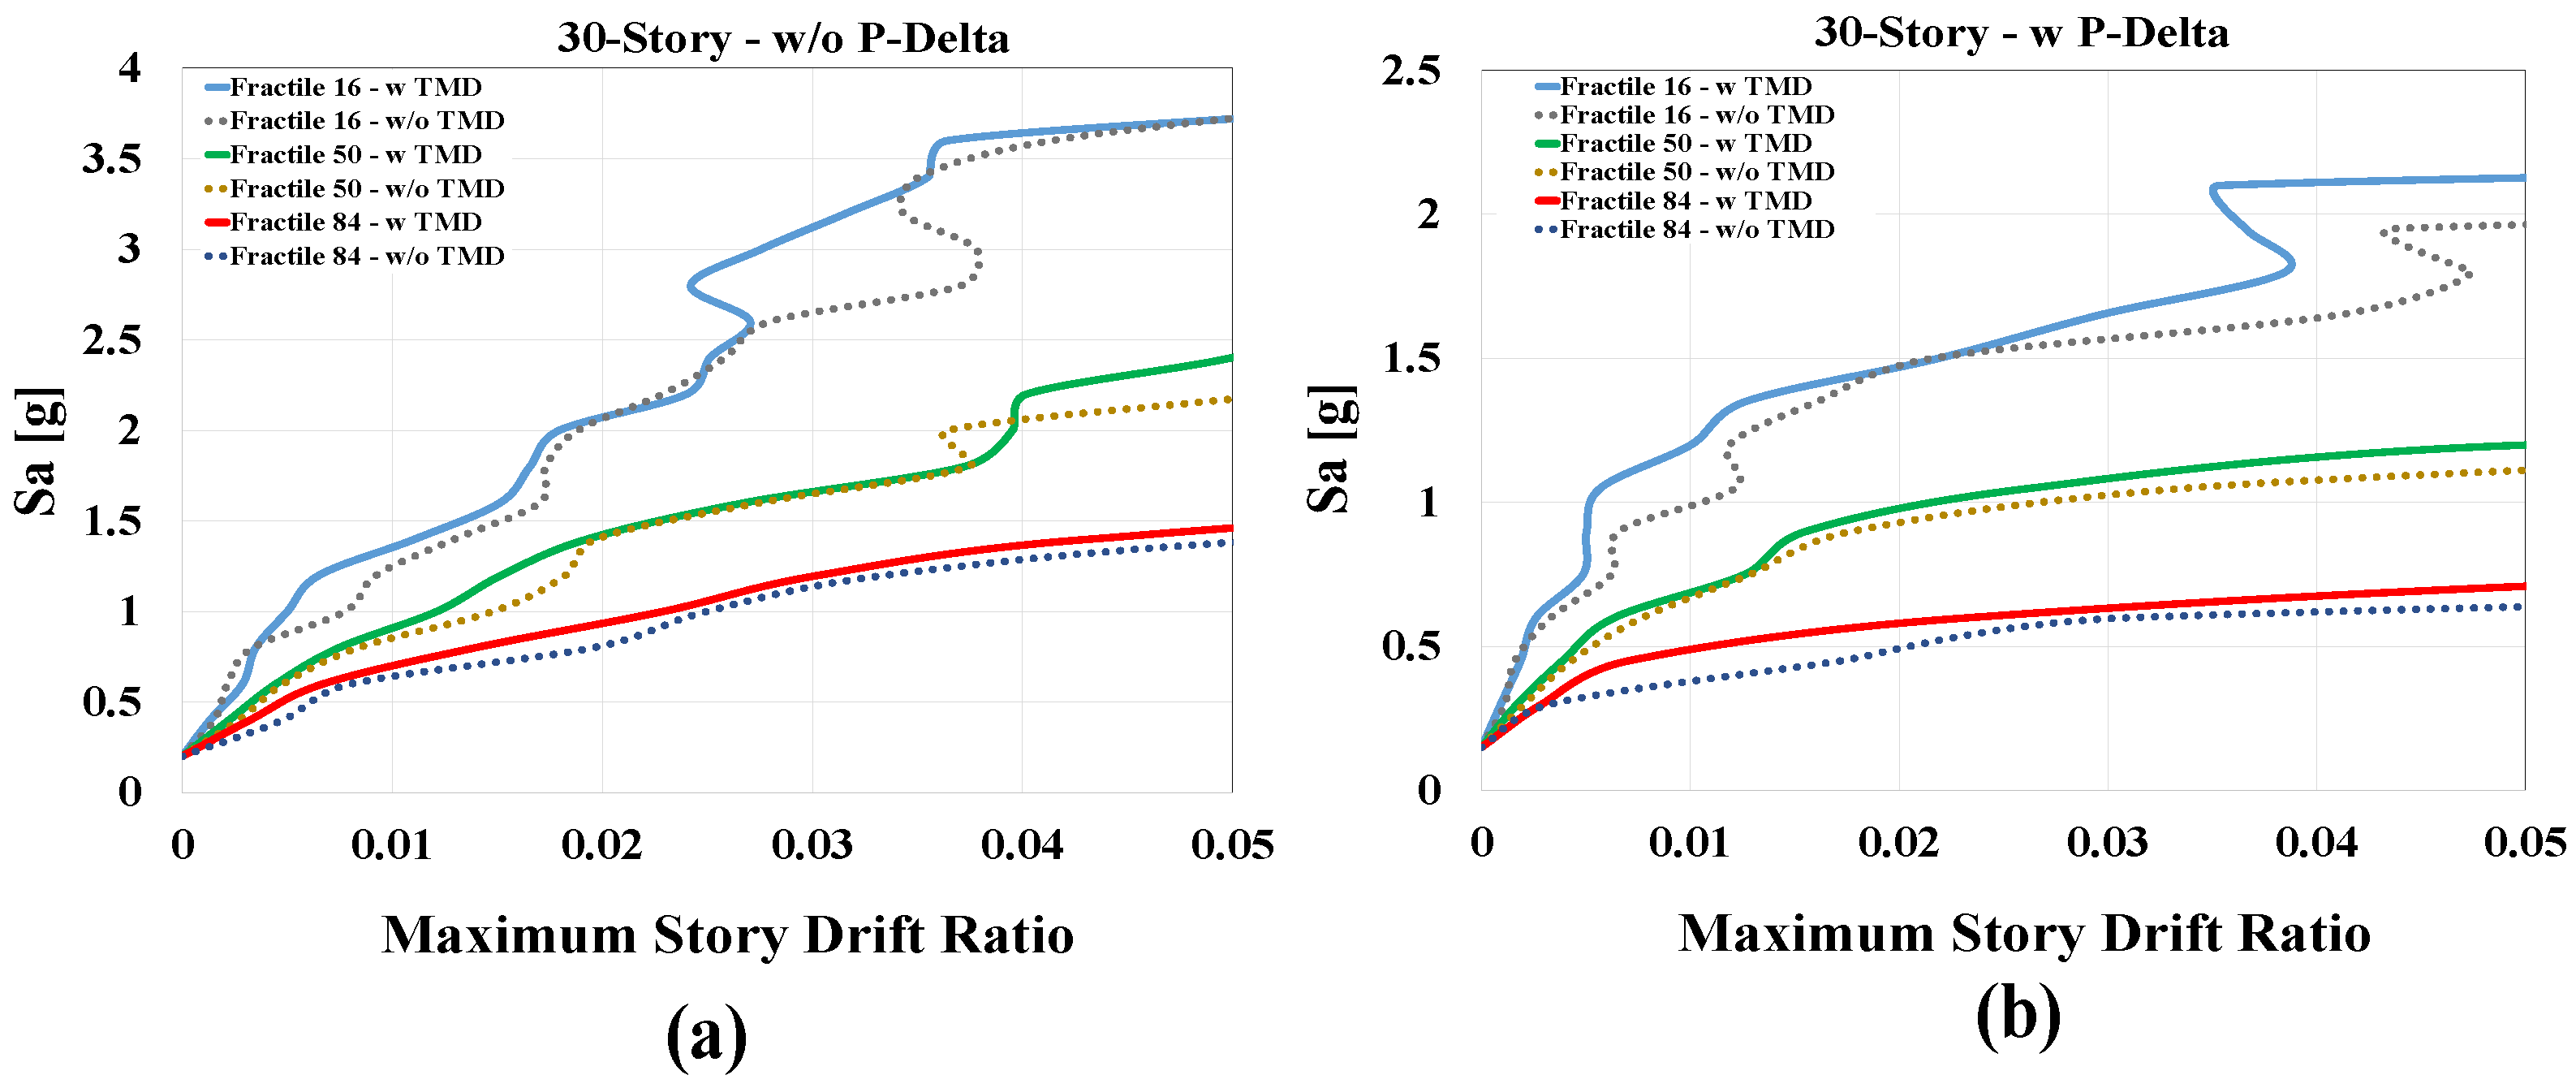
3.2. IDA Curves
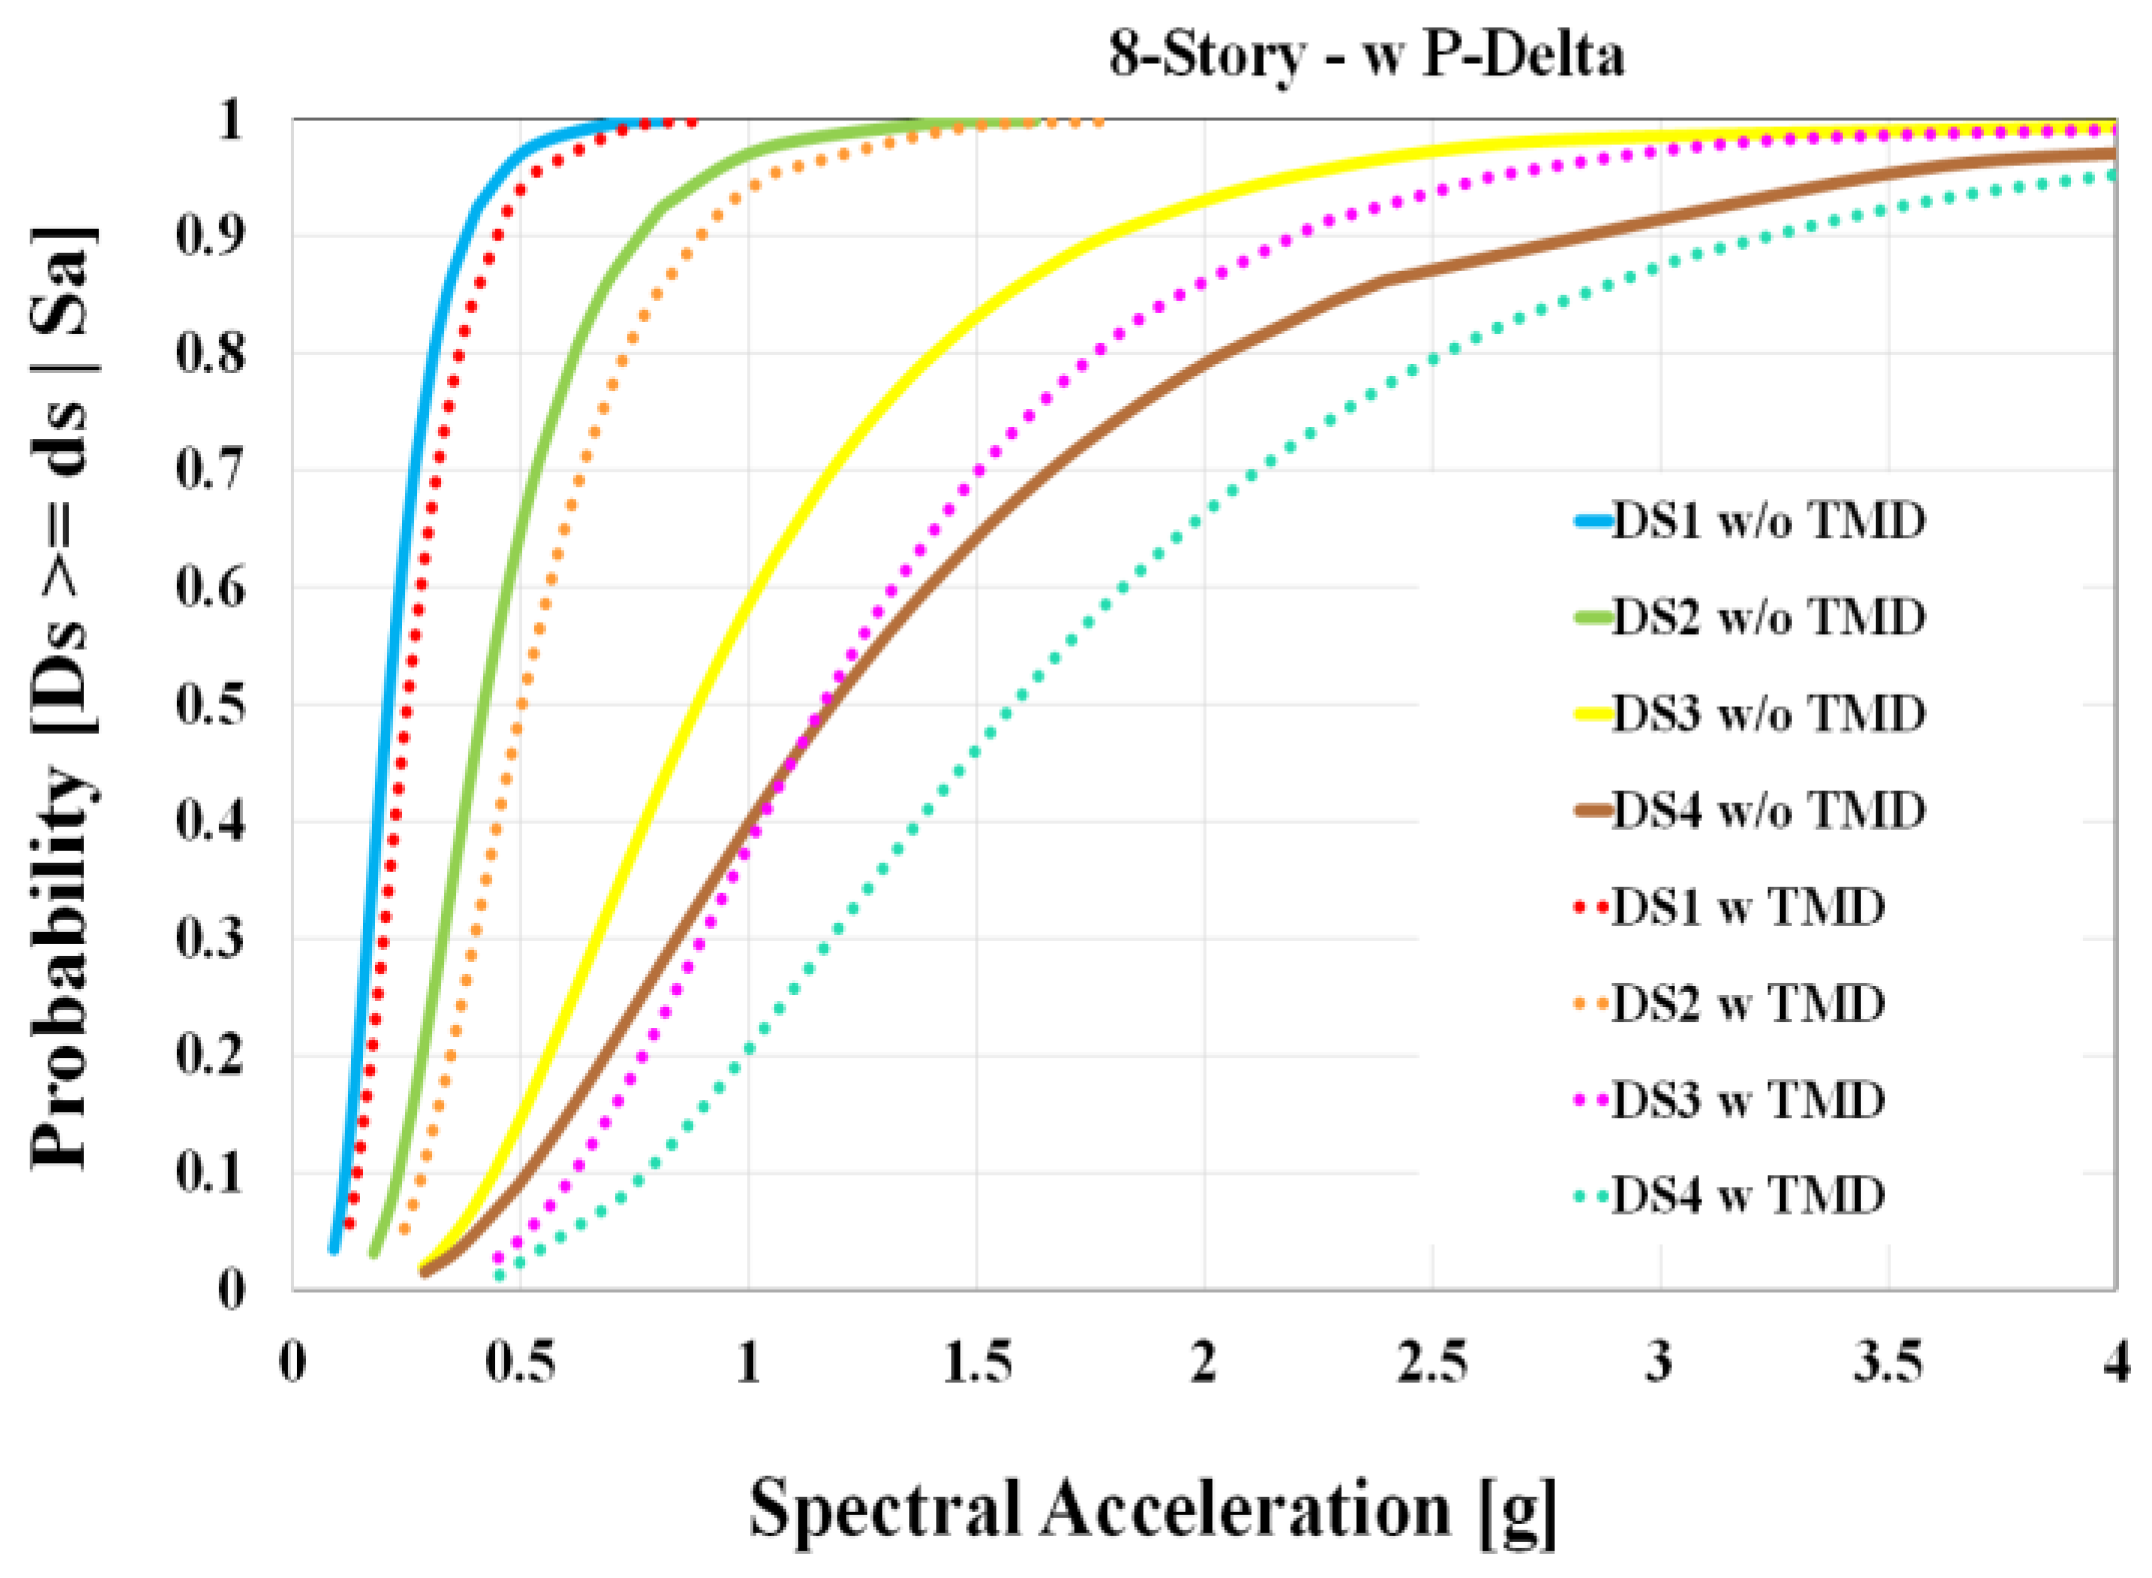
4. Fragility Curves
5. Conclusions
- It is imperative to take into account the nonlinear structural geometry (P-Delta effect) as well as the deterioration of structural elements during loading cycles to accurately simulate and analyze the structure in the nonlinear region.
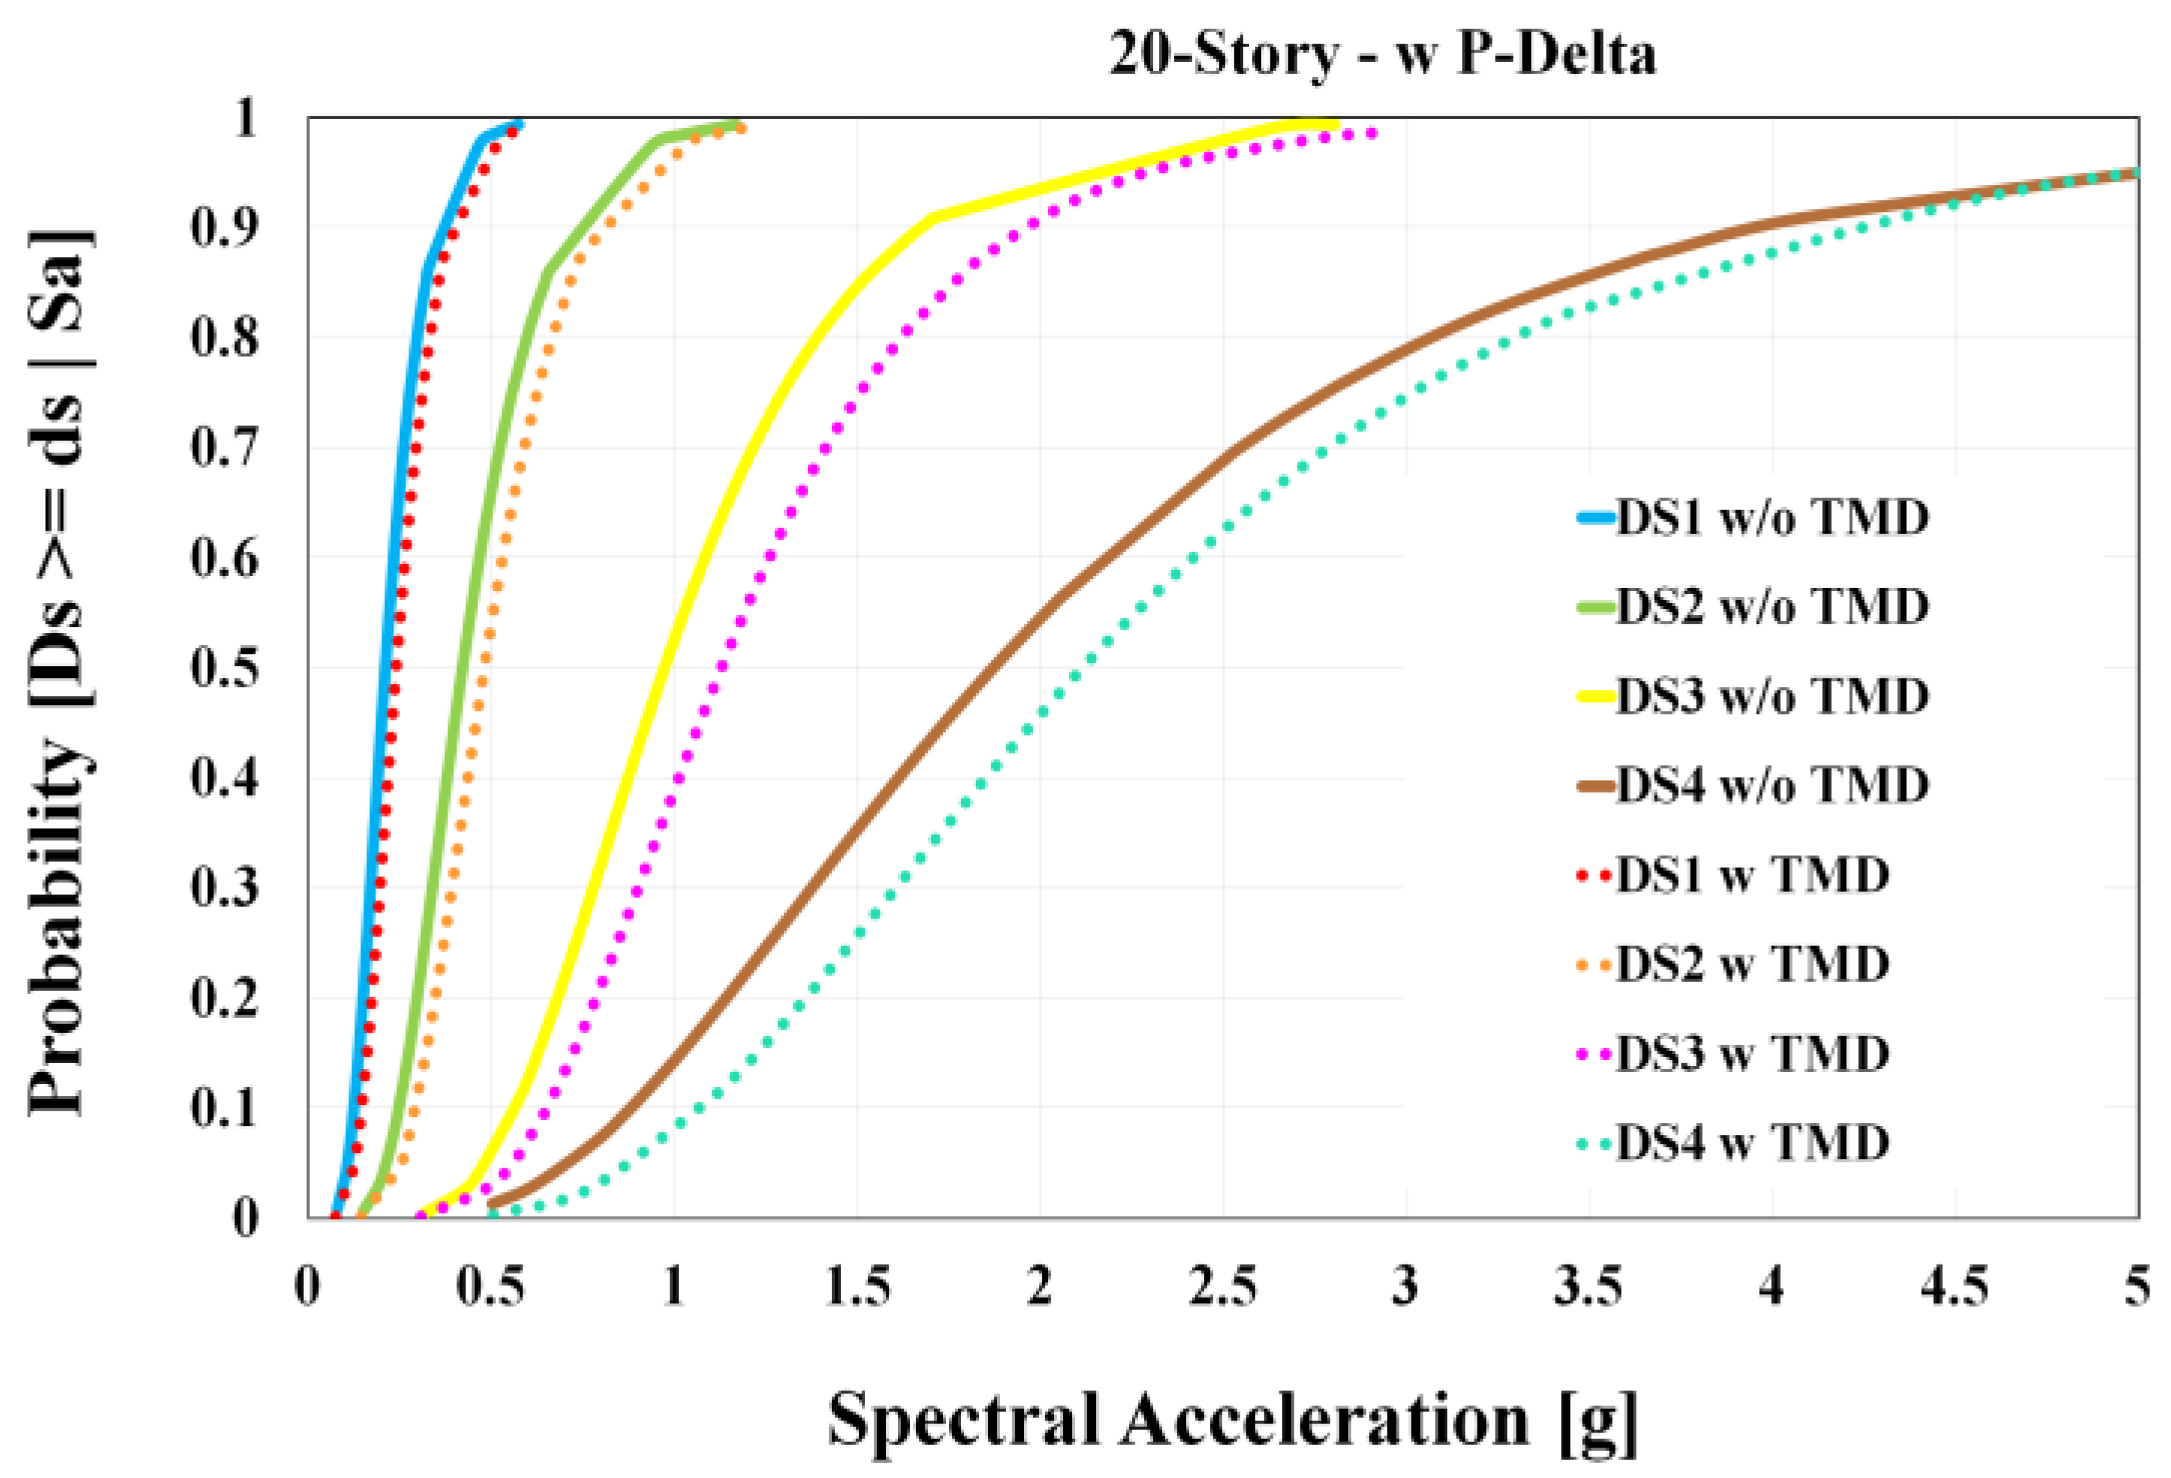
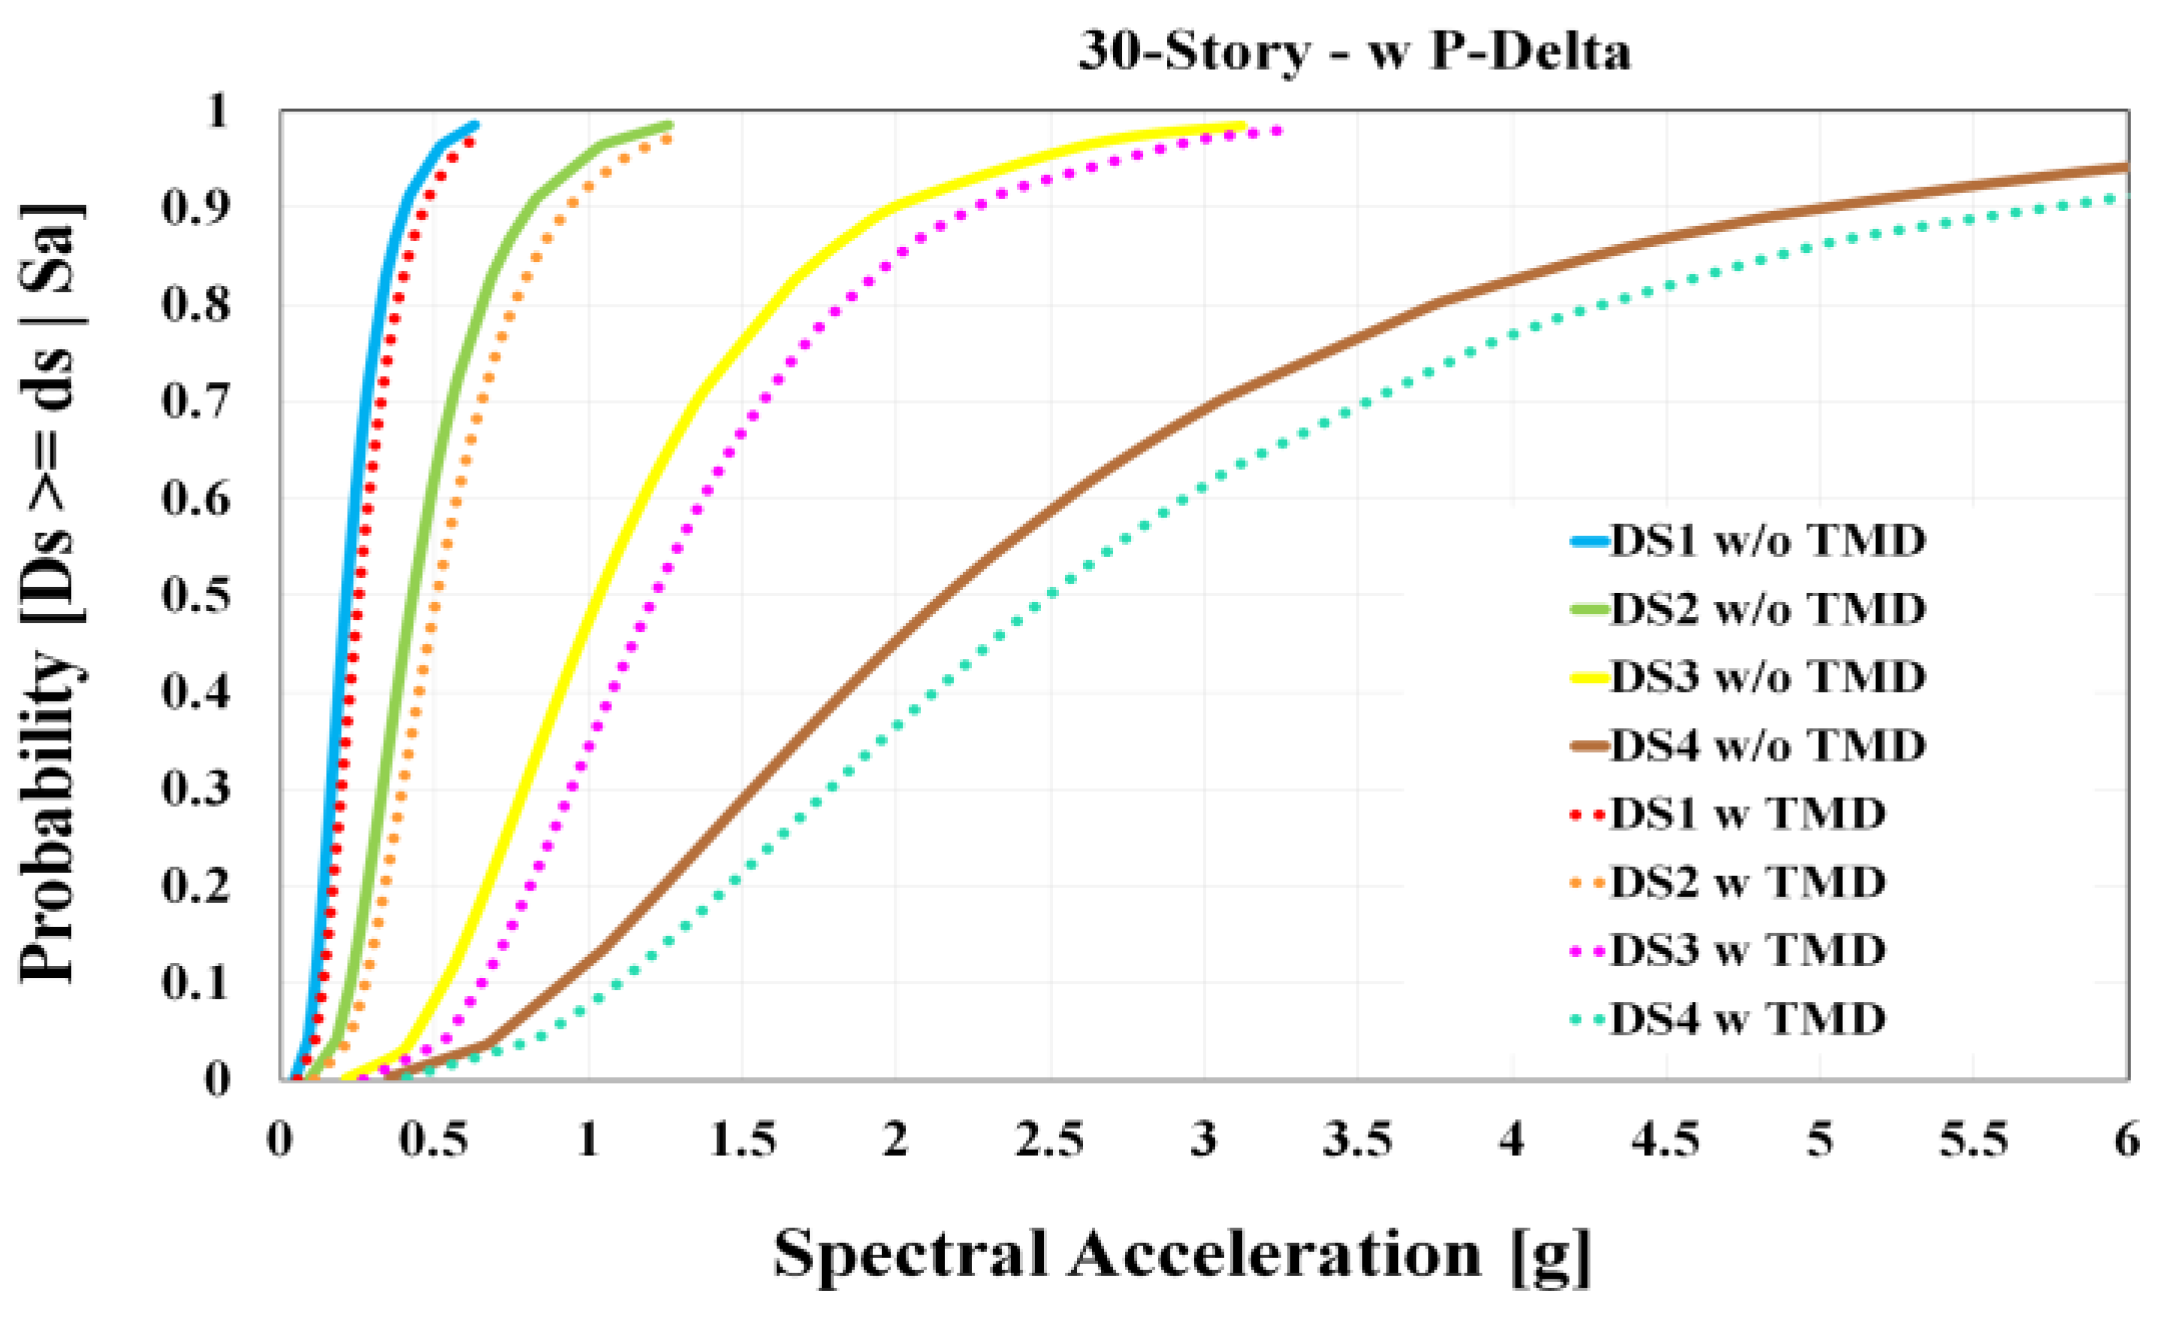
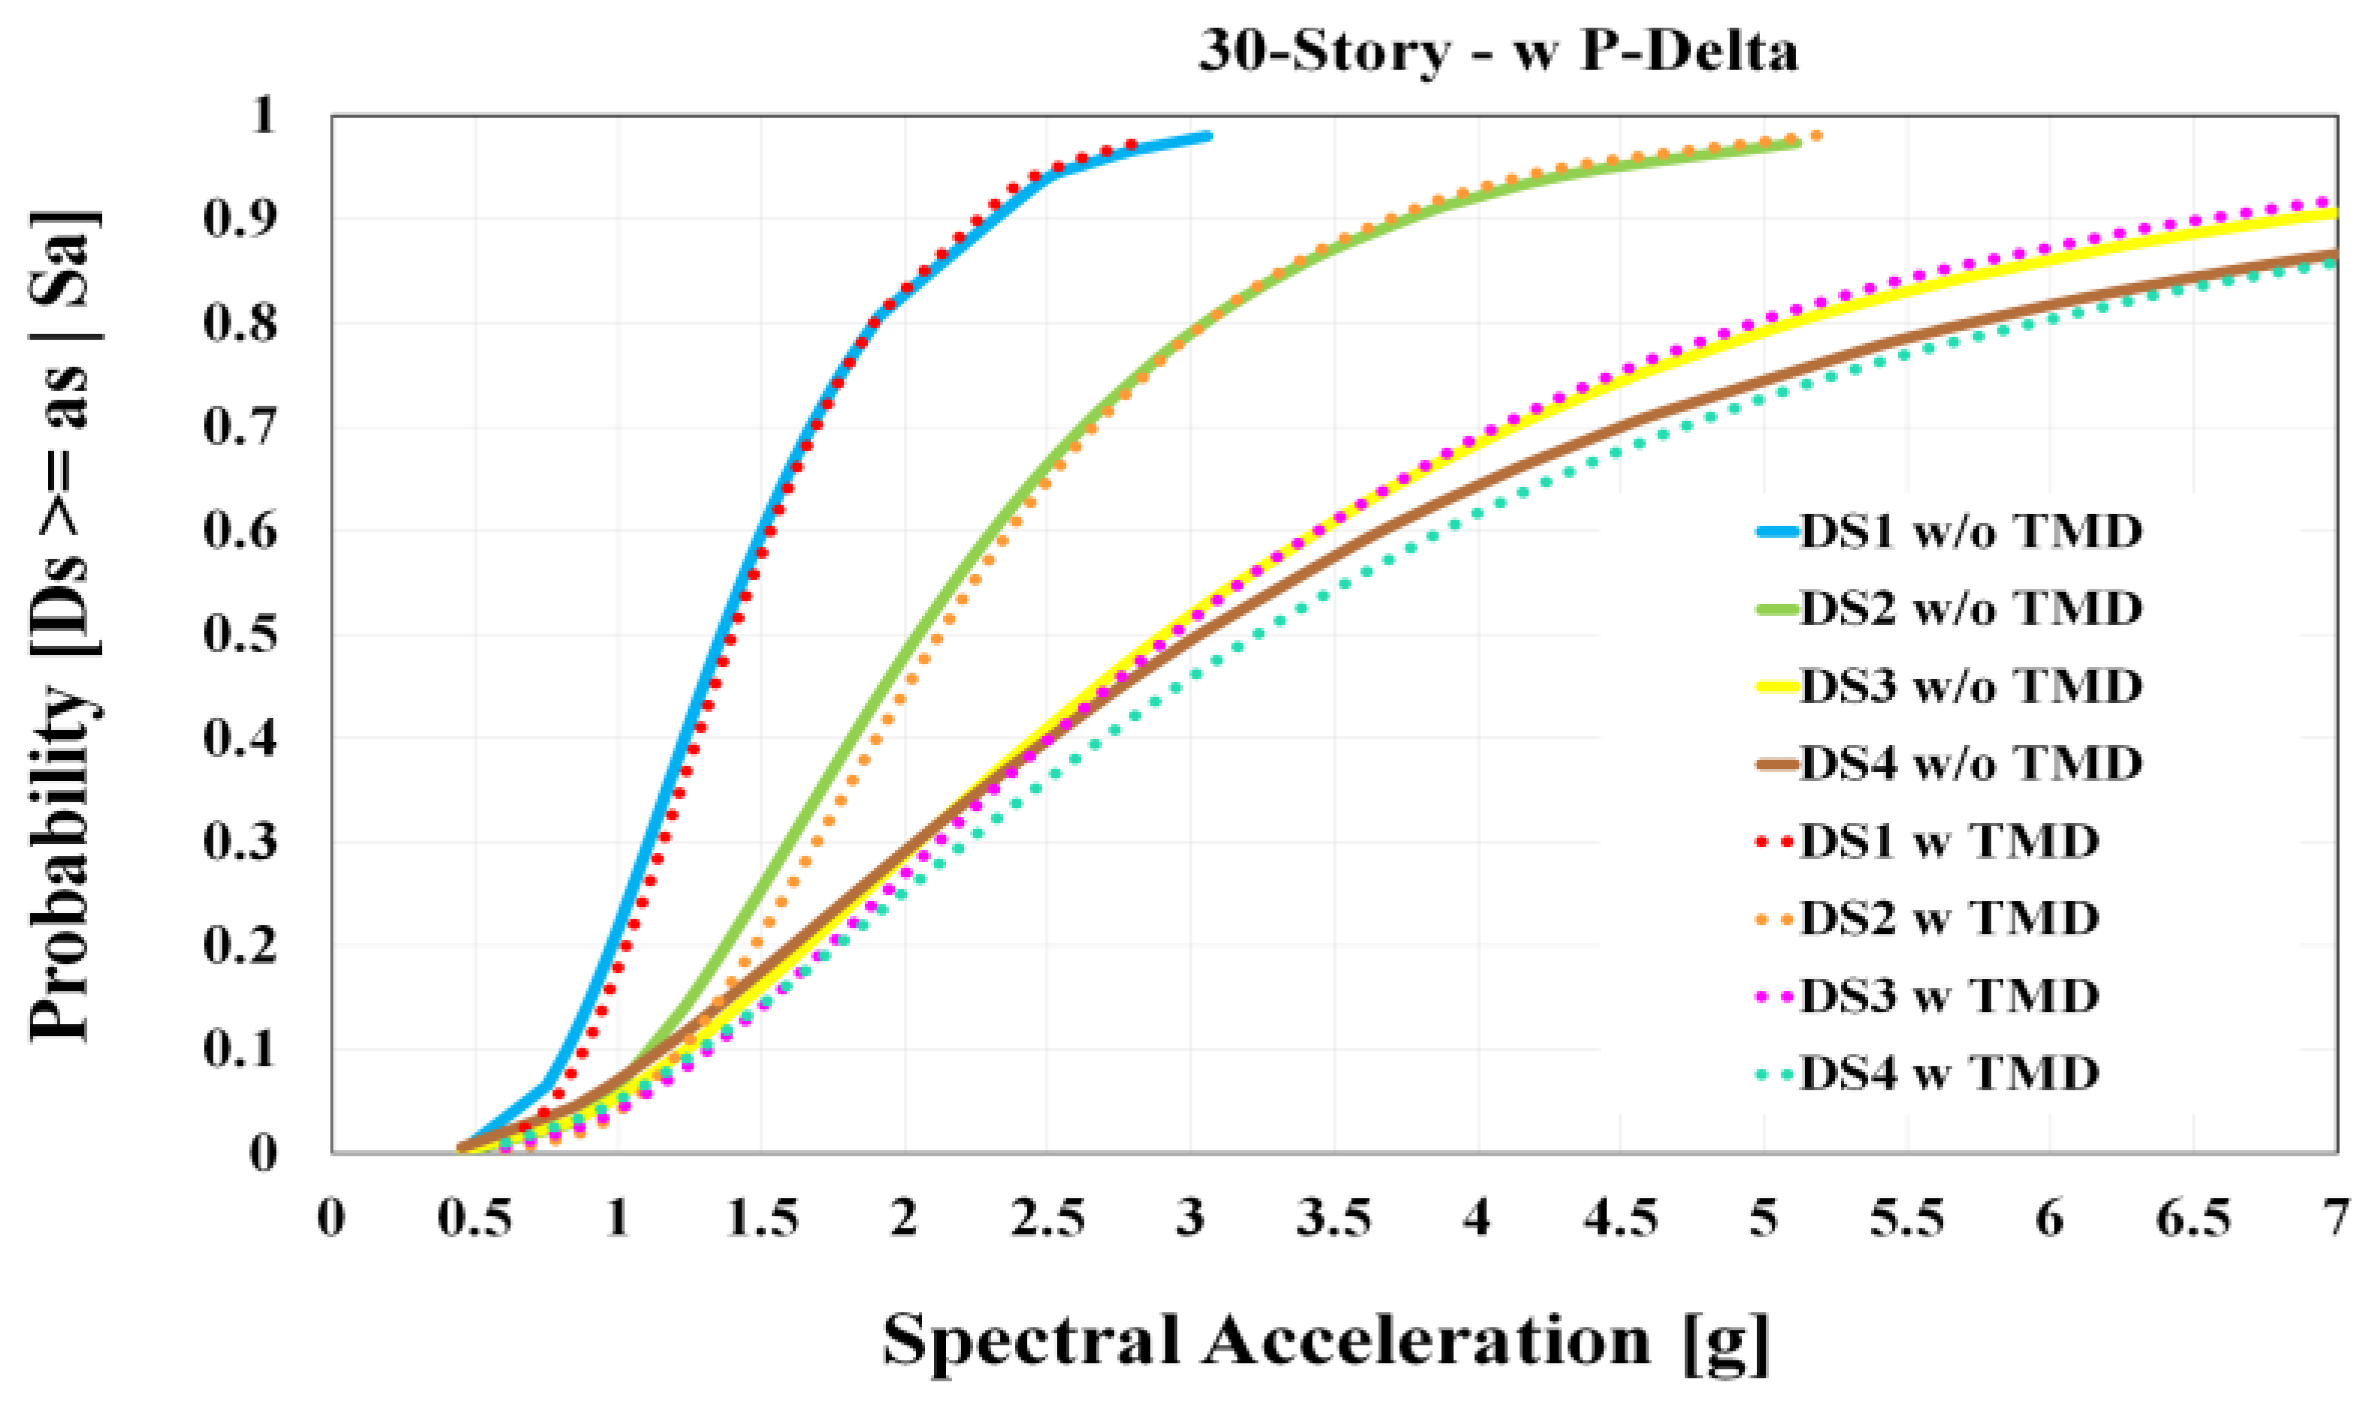
- A TMD can reduce the probability of damage under earthquake excitation not only at intermediate DSs such as slight and moderate but also at high DSs such as extensive and complete.
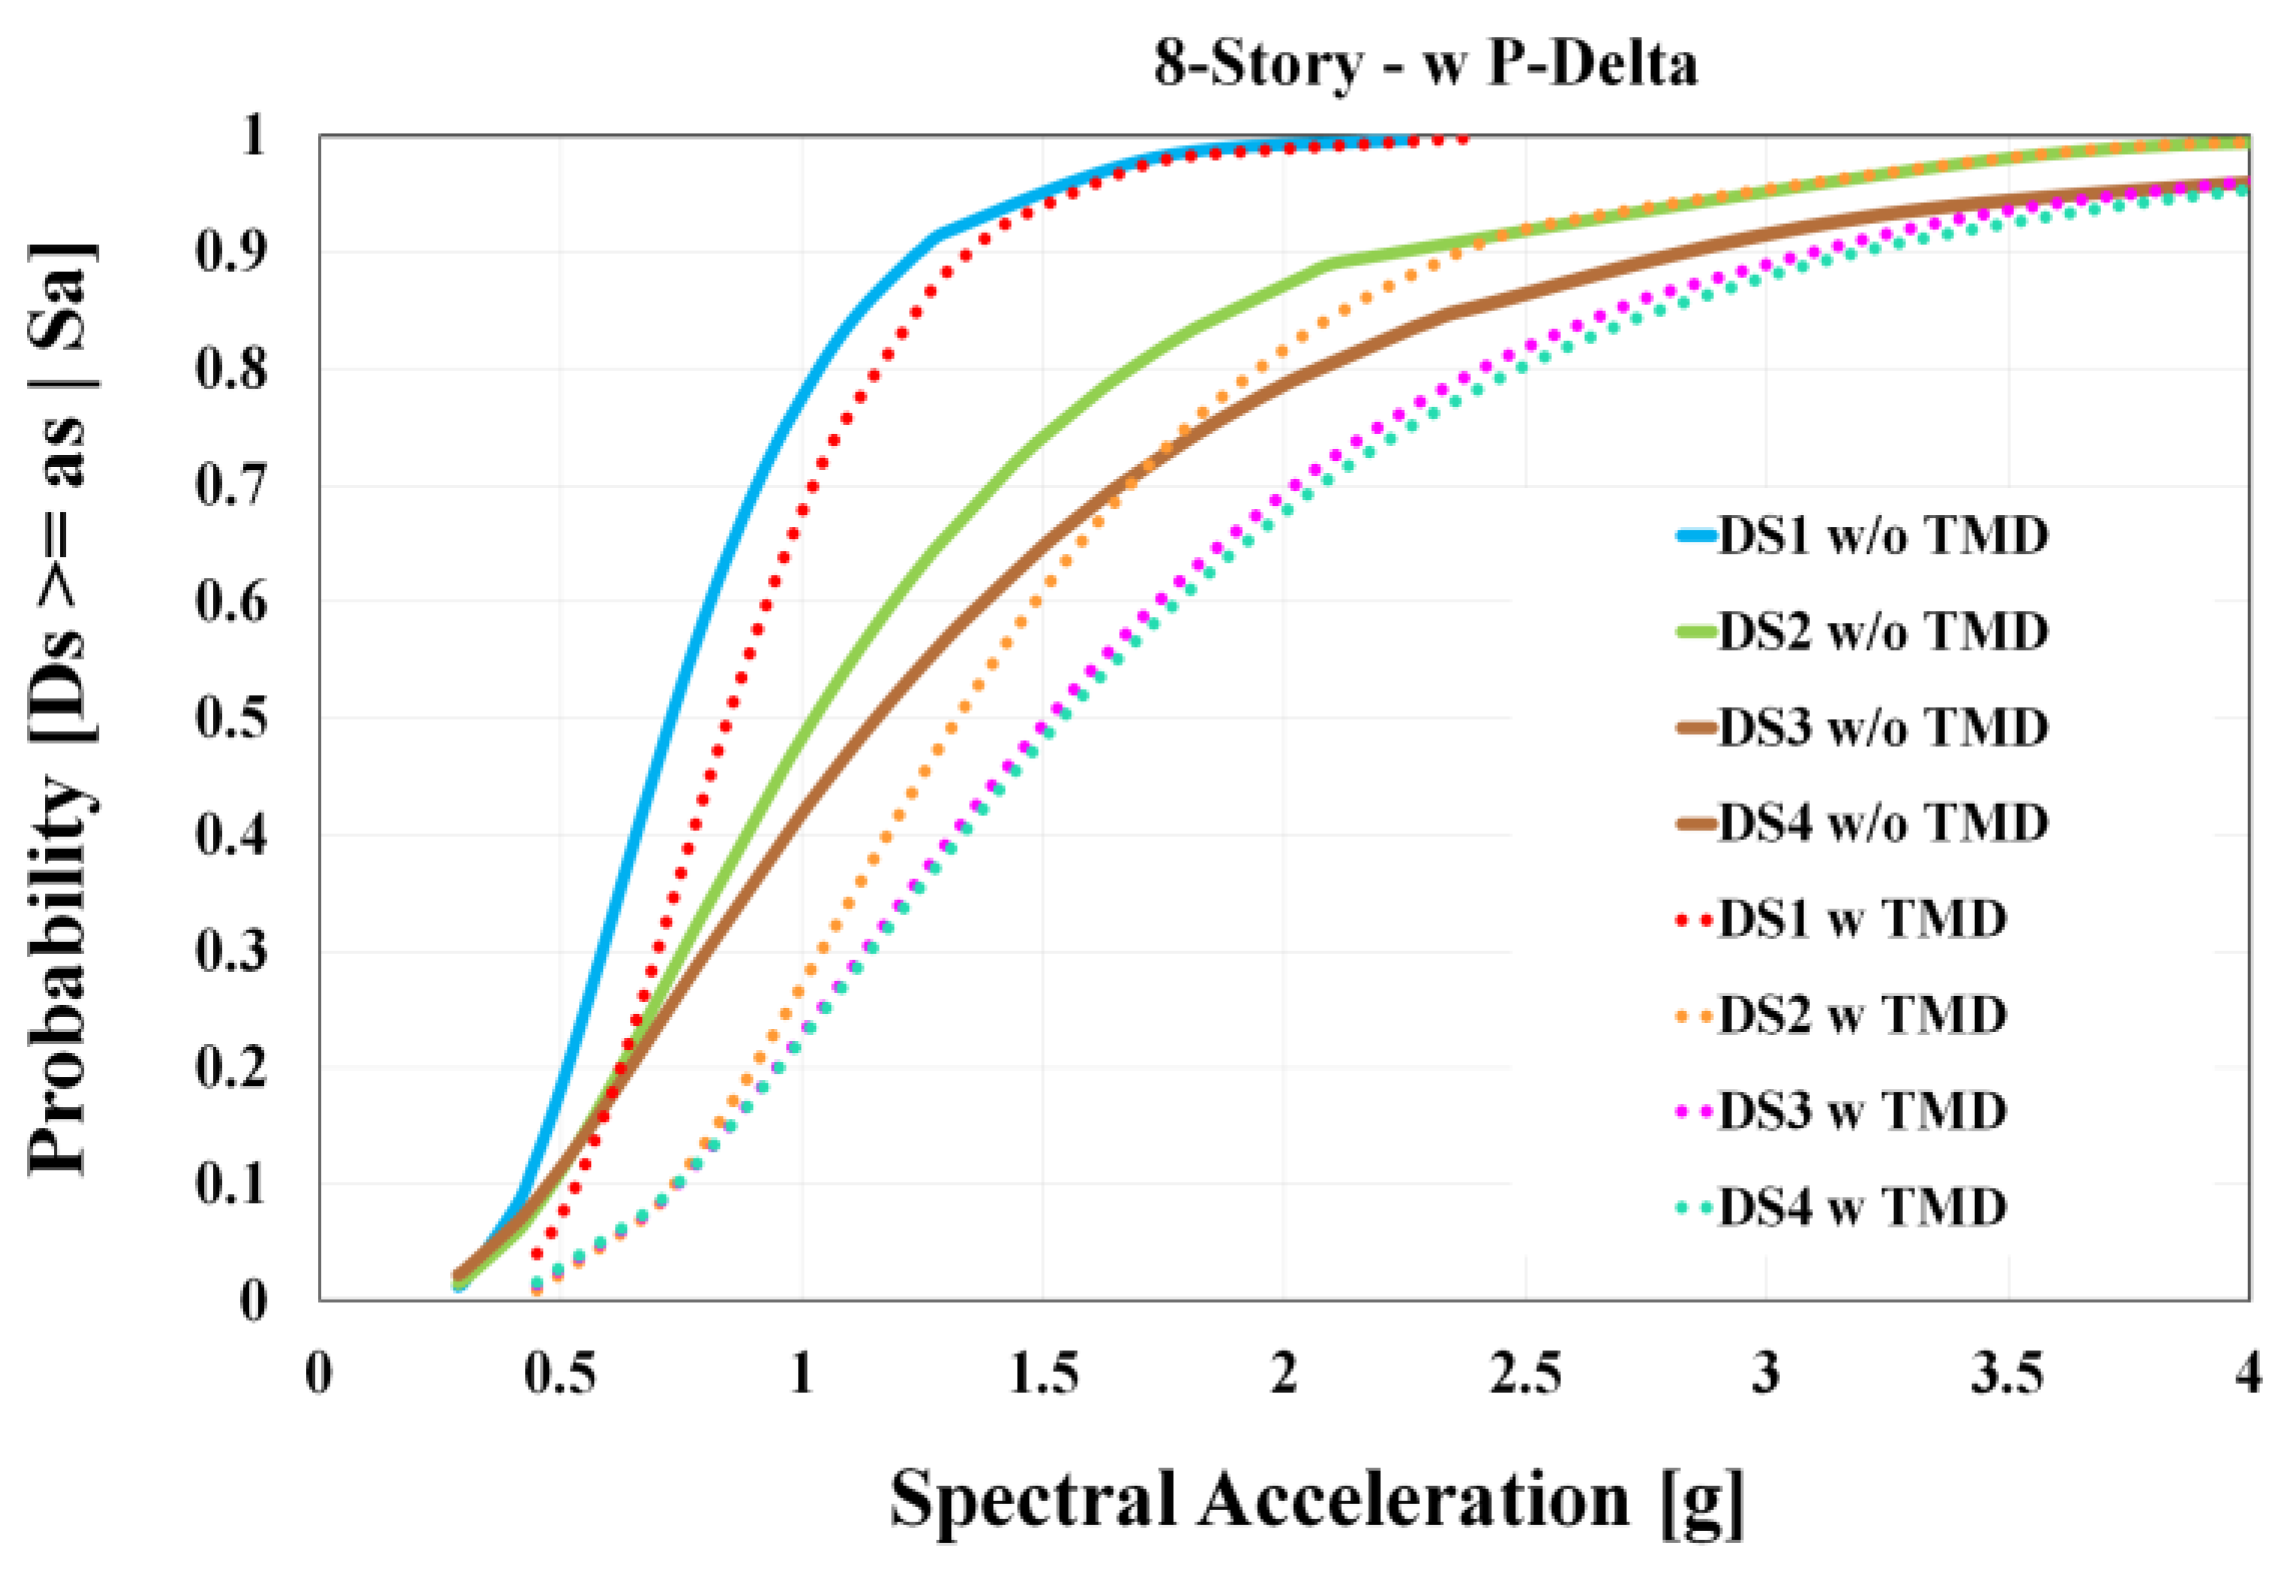
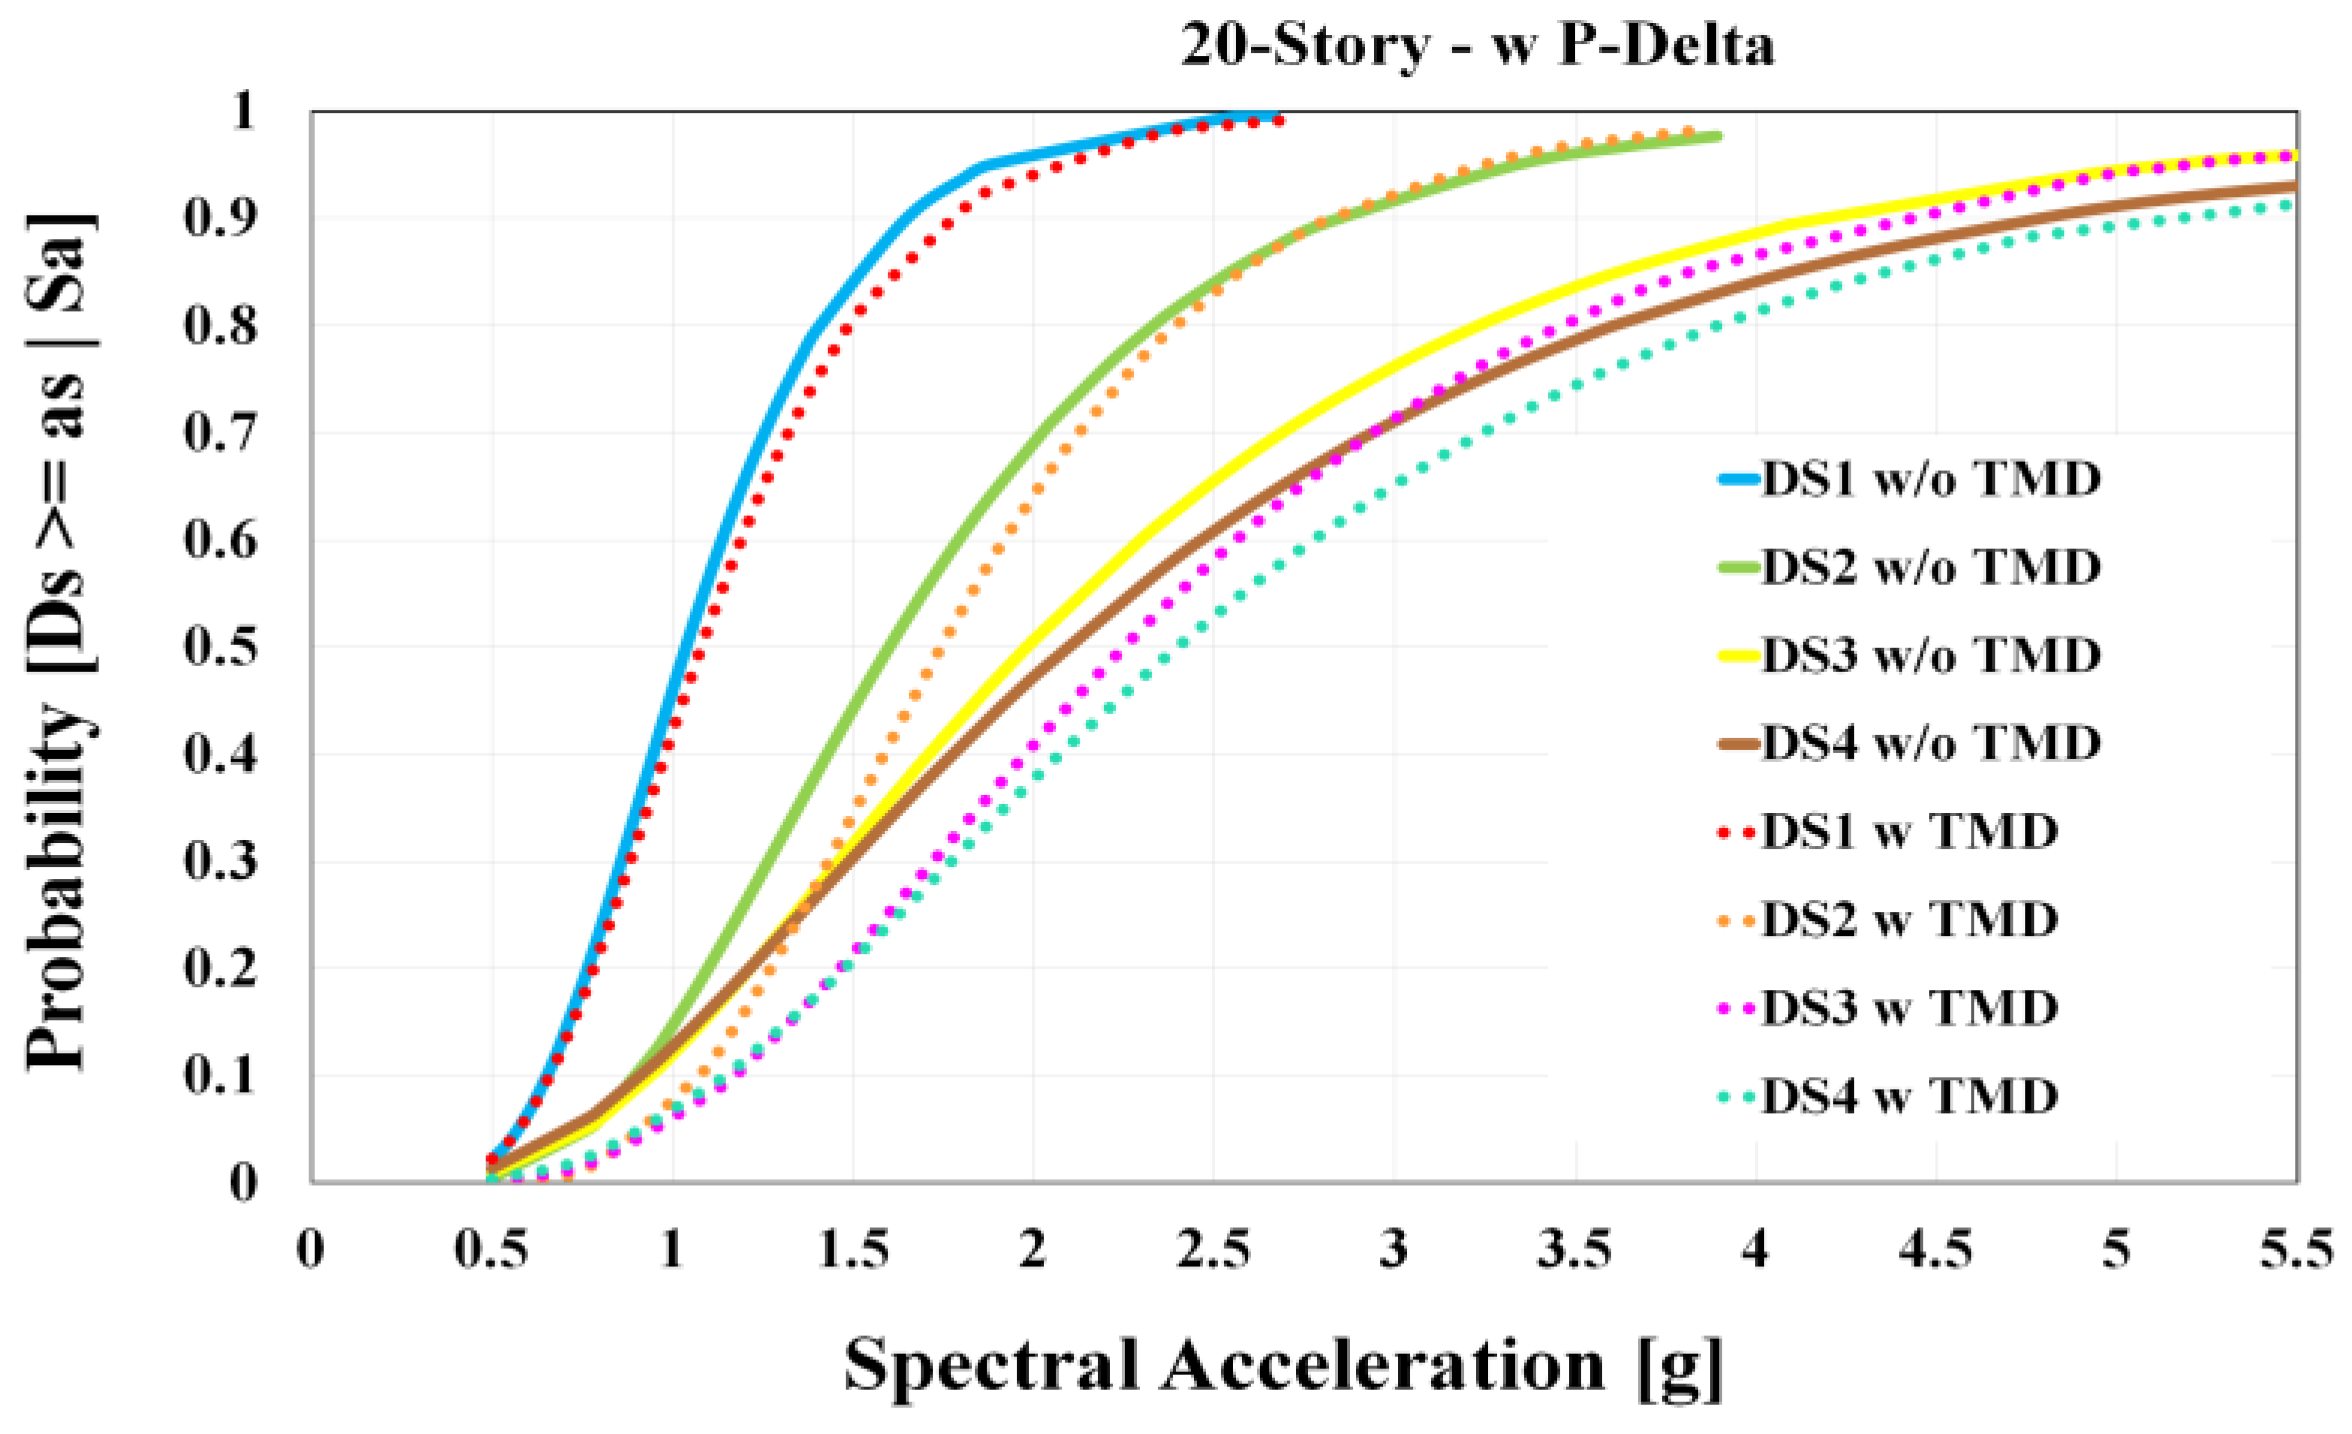
- By considering the inter-story drift and maximum structural floor acceleration as the EDP, a TMD can reduce the probability of structural and non-structural damage from 4.0% to 20.0%.
6. Limitations and Future Works
- In this study, a Single-Tuned Mass Damper concentrated on the structural roof is considered. The use of MTMDs and optimizing their distribution, which involves taking a specific TMD for each structural mode, will be more effective than Single-Tuned Mass Dampers.
- In recent studies, new intensity measures such as average spectral acceleration (Sa,avg) for seismic response assessment of structures were introduced that seem more sophisticated than Sa.
Author Contributions
Funding
Data Availability Statement
Conflicts of Interest
References
- Renzi, E.; De Angelis, M. Optimal semi-active control and non-linear dynamic response of variable stiffness structures. J. Vib. Control. 2005, 11, 1253–1289. [Google Scholar] [CrossRef]
- Soong, T.; Spencer, B., Jr. Supplemental energy dissipation: State-of-the-art and state-of-the-practice. Eng. Struct. 2002, 24, 243–259. [Google Scholar] [CrossRef]
- Agrawal, A.; Tan, P.; Nagarajaiah, S.; Zhang, J. Benchmark structural control problem for a seismically excited highway bridge—Part I: Phase I problem definition. Struct. Control Health Monit. 2009, 16, 509–529. [Google Scholar] [CrossRef]
- Elias, S.; Matsagar, V. Research developments in vibration control of structures using passive tuned mass dampers. Annu. Rev. Control 2017, 44, 129–156. [Google Scholar] [CrossRef]
- Tuan, A.Y.; Shang, G. Vibration control in a 101-storey building using a tuned mass damper. J. Appl. Sci. Eng. 2014, 17, 141–156. [Google Scholar]
- Sacks, M.P.; Swallow, J.C. Tuned mass dampers for towers and buildings. In Structural Engineering in Natural Hazards Mitigation; ASCE: Reston, VI, USA, 1993; pp. 640–645. [Google Scholar]
- Frahm, H. Device for Dampin Vibration of Bodies. U.S. Patent US989958A, 18 April 1909. [Google Scholar]
- Ormondroyd, J. The theory of the dynamic vibration absorber. J. Appl. Mech. 1928, 50, 9–22. [Google Scholar]
- Den Hartog, J.P. Mechanical Vibrations; Courier Corporation: North Chelmsford, MA, USA, 1985. [Google Scholar]
- Randall, S.; Halsted, D., III; Taylor, D. Optimum vibration absorbers for linear damped systems. J. Mech. Des. 1981, 103, 908–913. [Google Scholar] [CrossRef]
- Sadek, F.; Mohraz, B.; Taylor, A.W.; Chung, R.M. A method of estimating the parameters of tuned mass dampers for seismic applications. Earthq. Eng. Struct. Dyn. 1997, 26, 617–635. [Google Scholar] [CrossRef]
- Leung, A.Y.; Zhang, H.; Cheng, C.; Lee, Y. Particle swarm optimization of TMD by non-stationary base excitation during earthquake. Earthq. Eng. Struct. Dyn. 2008, 37, 1223–1246. [Google Scholar] [CrossRef]
- Warburton, G. Optimum absorber parameters for minimizing vibration response. Earthq. Eng. Struct. Dyn. 1981, 9, 251–262. [Google Scholar] [CrossRef]
- Bekdaş, G.; Nigdeli, S.M.; Yang, X.-S. A novel bat algorithm based optimum tuning of mass dampers for improving the seismic safety of structures. Eng. Struct. 2018, 159, 89–98. [Google Scholar] [CrossRef]
- Tsai, H.C.; Lin, G.C. Optimum tuned-mass dampers for minimizing steady-state response of support-excited and damped systems. Earthq. Eng. Struct. Dyn. 1993, 22, 957–973. [Google Scholar] [CrossRef]
- Li, L.; Chen, J.; Wang, W. Evaluation of the Residual Seismic Capacity of Post-Earthquake Damaged RC Columns Based on the Damage Distribution Model. Buildings 2023, 13, 595. [Google Scholar] [CrossRef]
- Pellizzari, F.; Marano, G.; Palmeri, A.; Greco, R.; Domaneschi, M. Robust optimization of MTMD systems for the control of vibrations. Probabilistic Eng. Mech. 2022, 70, 103347. [Google Scholar] [CrossRef]
- Zareian, F.; Lignos, D.; Krawinkler, H. Evaluation of seismic collapse performance of steel special moment resisting frames using FEMA P695 (ATC-63) methodology. In Proceedings of the Structures Congress 2010, Orlando, FL, USA, 15–15 May 2010; pp. 1275–1286. [Google Scholar]
- Kleingesinds, S.; Lavan, O. Gradient-based multi-hazard optimization of MTMDs for tall buildings. Comput. Struct. 2021, 249, 106503. [Google Scholar] [CrossRef]
- Frans, R.; Arfiadi, Y. Designing optimum locations and properties of MTMD systems. Procedia Eng. 2015, 125, 892–898. [Google Scholar] [CrossRef]
- Domizio, M.; Garrido, H.; Ambrosini, D. Single and multiple TMD optimization to control seismic response of nonlinear structures. Eng. Struct. 2022, 252, 113667. [Google Scholar] [CrossRef]
- Ibarra, L.F. Global Collapse of Frame Structures under Seismic Excitations; Stanford University: Stanford, CA, USA, 2004. [Google Scholar]
- Lignos, D.G.; Krawinkler, H. Deterioration modeling of steel components in support of collapse prediction of steel moment frames under earthquake loading. J. Struct. Eng. 2011, 137, 1291–1302. [Google Scholar] [CrossRef]
- HAZUS. Multi-Hazard Loss Estimation Methodology, Earthquake Model HAZUS-MH MR5 Technical Manual; Federal Emergency Management Agency: Washington, DC, USA, 2021. [Google Scholar]
- Del Gaudio, C.; Ricci, P.; Verderame, G.; Manfredi, G. Development and urban-scale application of a simplified method for seismic fragility assessment of RC buildings. Eng. Struct. 2015, 91, 40–57. [Google Scholar] [CrossRef]
- Qin, H.; Mason, M.; Stewart, M.G. Fragility assessment for new and deteriorated portal framed industrial buildings subjected to tropical cyclone winds. Struct. Saf. 2023, 100, 102287. [Google Scholar] [CrossRef]
- Cao, X.-Y.; Feng, D.-C.; Beer, M. Consistent seismic hazard and fragility analysis considering combined capacity-demand uncertainties via probability density evolution method. Struct. Saf. 2023, 103, 102330. [Google Scholar] [CrossRef]
- Tajammolian, H.; Khoshnoudian, F.; Rad, A.R.; Loghman, V. Seismic fragility assessment of asymmetric structures supported on TCFP bearings subjected to near-field earthquakes. Structures 2018, 13, 66–78. [Google Scholar] [CrossRef]
- Zhang, Y.; Wang, Z.; Jiang, L.; Skalomenos, K.; Zhang, D. Seismic fragility analysis of masonry structures considering the effect of mainshock-aftershock sequences. Eng. Struct. 2023, 275, 115287. [Google Scholar] [CrossRef]
- Mashhadi, S.; Homaei, F.; Asadi, A.; Tajammolian, H. Fragility analysis of steel MRFs: Effects of frequency-content components of near-fault pulse-like ground motions and setbacks. Structures 2021, 33, 3655–3666. [Google Scholar] [CrossRef]
- Borhan, S.; Tajammolian, H.; Yazdian, M. Evaluation of seismic performance of rotational-friction slip dampers in near-field and far-filed earthquakes. Earthq. Struct. 2021, 21, 147–159. [Google Scholar]
- Wong, K.K.; Harris, J.L. Seismic damage and fragility analysis of structures with tuned mass dampers based on plastic energy. Struct. Des. Tall Spec. Build. 2012, 21, 296–310. [Google Scholar] [CrossRef]
- Zhang, W.; Liu, S.; Shokrabadi, M.; Dehghanpoor, A.; Taciroglu, E. Nonlinear seismic fragility assessment of tall buildings equipped with tuned mass damper (TMD) and considering soil-structure interaction effects. Bull. Earthq. Eng. 2022, 20, 3469–3483. [Google Scholar] [CrossRef]
- Kircher, C.; Deierlein, G.; Hooper, J.; Krawinkler, H.; Mahin, S.; Shing, B.; Wallace, J. Evaluation of the FEMA P-695 Methodology for Quantification of Building Seismic Performance Factors; National Institute of Standards and Technology: Gaithersburg, MD, USA, 2010. [Google Scholar]
- OpenSEES. Open System for Earthquake Engineering Simulation; University of California: Berkeley, CA, USA, 2008; Available online: https://opensees.berkeley.edu, (accessed on 2 May 2023).
- Kwong, N.S.; Chopra, A.K.; McGuire, R.K. A ground motion selection procedure for enforcing hazard consistency and estimating seismic demand hazard curves. Earthq. Eng. Struct. Dyn. 2015, 44, 2467–2487. [Google Scholar] [CrossRef]
- Kwong, N.S.; Chopra, A.K.; McGuire, R.K. A framework for the evaluation of ground motion selection and modification procedures. Earthq. Eng. Struct. Dyn. 2015, 44, 795–815. [Google Scholar] [CrossRef]
- Ebrahimian, H.; Jalayer, F.; Lucchini, A.; Mollaioli, F.; Manfredi, G. Preliminary ranking of alternative scalar and vector intensity measures of ground shaking. Bull. Earthq. Eng. 2015, 13, 2805–2840. [Google Scholar] [CrossRef]
- Grigoriu, M. Do seismic intensity measures (IMs) measure up? Probabilistic Eng. Mech. 2016, 46, 80–93. [Google Scholar] [CrossRef]
- Lucchini, A.; Franchin, P.; Mollaioli, F. Uniform hazard floor acceleration spectra for linear structures. Earthq. Eng. Struct. Dyn. 2017, 46, 1121–1140. [Google Scholar] [CrossRef]
- Veismoradi, S.; Cheraghi, A.; Darvishan, E. Probabilistic mainshock-aftershock collapse risk assessment of buckling restrained braced frames. Soil Dyn. Earthq. Eng. 2018, 115, 205–216. [Google Scholar] [CrossRef]
- Ramamoorthy, S.K.; Gardoni, P.; Bracci, J.M. Probabilistic demand models and fragility curves for reinforced concrete frames. J. Struct. Eng. 2006, 132, 1563–1572. [Google Scholar] [CrossRef]
- Ramamoorthy, S.K.; Gardoni, P.; Bracci, J.M. Seismic fragility and confidence bounds for gravity load designed reinforced concrete frames of varying height. J. Struct. Eng. 2008, 134, 639–650. [Google Scholar] [CrossRef]
- Silwal, B.; Ozbulut, O.E. Aftershock fragility assessment of steel moment frames with self-centering dampers. Eng. Struct. 2018, 168, 12–22. [Google Scholar] [CrossRef]
- Hatzigeorgiou, G.D.; Beskos, D.E. Inelastic displacement ratios for SDOF structures subjected to repeated earthquakes. Eng. Struct. 2009, 31, 2744–2755. [Google Scholar] [CrossRef]
- Elkady, A.; Lignos, D.G. Modeling of the composite action in fully restrained beam-to-column connections: Implications in the seismic design and collapse capacity of steel special moment frames. Earthq. Eng. Struct. Dyn. 2014, 43, 1935–1954. [Google Scholar] [CrossRef]
- NIST 10-917-8; NIST. Evaluation of the FEMA P-695 Methodology for Quantification of Building Seismic Performance Factors. National Institute of Standards and Technology: Gaithersburg, MD, USA, 2011.
- ASCE 7-10; Minimum Design Loads for Buildings and Other Structures. American Society of Civil Engineers: Reston, VI, USA, 2010.
- AISC 360-10; Specification for Structural Steel Buildings. American Institute of Steel Construction: Chicago, IL, USA, 2020.
- AISC 360-16; Specification for Structural Steel Buildings. American Institute of Steel Construction: Chicago, IL, USA, 2016.
- Ibarra, L.F.; Medina, R.A.; Krawinkler, H. Hysteretic models that incorporate strength and stiffness deterioration. Earthq. Eng. Struct. Dyn. 2005, 34, 1489–1511. [Google Scholar] [CrossRef]
- NIST GCR 17-917-46v2; NIST. Guidelines for Nonlinear Structural Analysis for Design of Buildings Part IIa–Steel Moment Frames. National Institute of Standards and Technology: Gaithersburg, MD, USA, 2017.
- Feng, D.-C.; Cao, X.-Y.; Wang, D.; Wu, G. A PDEM-based non-parametric seismic fragility assessment method for RC structures under non-stationary ground motions. J. Build. Eng. 2023, 63, 105465. [Google Scholar] [CrossRef]
- Vamvatsikos, D.; Cornell, C.A. Incremental dynamic analysis. Earthq. Eng. Struct. Dyn. 2002, 31, 491–514. [Google Scholar] [CrossRef]
- Kayhan, A.H.; Demir, A.; Palanci, M. Multi-functional solution model for spectrum compatible ground motion record selection using stochastic harmony search algorithm. Bull. Earthq. Eng. 2022, 20, 6407–6440. [Google Scholar] [CrossRef]
- Demir, A.; Palanci, M.; Kayhan, A.H. Evaluation of supplementary constraints on dispersion of EDPs using real ground motion record sets. Arab. J. Sci. Eng. 2020, 45, 8379–8401. [Google Scholar] [CrossRef]
- Baker, J.W.; Cornell, C.A. Which spectral acceleration are you using? Earthq. Spectra 2006, 22, 293–312. [Google Scholar] [CrossRef]
- ASCE 7-05; Minimum Design Loads for Buildings and Other Structures. American Society of Civil Engineering: Reston, VI, USA, 2005.


| DS | ||||
|---|---|---|---|---|
| DS1 | DS2 | DS3 | DS4 | |
| Peak floor acceleration | 0.3 g | 0.6 g | 1.2 g | 2.4 g |
| Maximum inter-story drift ratio | 0.003 | 0.006 | 0.015 | 0.040 |
| ID No. | Earthquake | Recording Station | |||
|---|---|---|---|---|---|
| M | Year | Name | Name | Owner | |
| 1 | 6.7 | 1994 | Northridge | Beverly Hills—Mulhol | USC |
| 2 | 6.7 | 1994 | Northridge | Canyon Country-WLC | USC |
| 3 | 7.1 | 1999 | Duzce, Turkey | Bolu | ERD |
| 4 | 7.1 | 1999 | Hector Mine | Hector | SCSN |
| 5 | 6.5 | 1979 | Imperial Valley | Delta | UNAMUCSD |
| 6 | 6.5 | 1979 | Imperial Valley | EL Centro Array #11 | USGS |
| 7 | 6.9 | 1995 | Kobe, Japn | Nishi-Akashi | CUE |
| 8 | 6.9 | 1995 | Kobe, Japn | Shin-Osaka | CUE |
| 9 | 7.5 | 1999 | Kocaeli, Turky | Duzce | ERD |
| 10 | 7.5 | 1999 | Kocaeli, Turky | Arcelik | KOERI |
| 11 | 7.3 | 1992 | Landers | Yermo Fire Station | CDMG |
| 12 | 7.3 | 1992 | Landers | Coolwater | SCE |
| 13 | 6.9 | 1989 | Loma Prieta | Capitola | CDMG |
| 14 | 6.9 | 1989 | Loma Prieta | Gilroy Array #3 | CDMG |
| 15 | 7.4 | 1990 | Manjil, Iran | Abbar | BHRC |
| 16 | 6.5 | 1987 | Superstition Hills | El Centro lmp. Co. | CDMG |
| 17 | 6.5 | 1987 | Superstition Hills | Poe Road (temp) | USGS |
| 18 | 7 | 1992 | Cape Mendocino | Rio Dell Overpass | CDMG |
| 19 | 7.6 | 1999 | Chi-Chi Taiwan | CHY101 | CWB |
| 20 | 7.6 | 1999 | Chi-Chi Taiwan | TCU045 | CWB |
| 21 | 6.6 | 1971 | San Fernando | LA—Hollywood Stor | CDMG |
| 22 | 6.5 | 1976 | Friuli, Italy | Tolmezzo | … |
| Number of Stories | With or without Consideration of P-Delta Effect | Ω | µT | T (s) | T1 (s) | ||
|---|---|---|---|---|---|---|---|
| 8 | w/o P-Delta | 2.98 | 6.25 | 0.135 | 0.045 | 1.65 | 2.02 |
| w P-Delta | 2.66 | 4.94 | 0.121 | ||||
| 20 | w/o P-Delta | 3.34 | 3.90 | 0.073 | 0.022 | 3.40 | 3.95 |
| w P-Delta | 2.87 | 2.58 | 0.063 | ||||
| 30 | w/o P-Delta | 4.36 | 5.01 | 0.069 | 0.016 | 4.69 | 6.22 |
| w P-Delta | 3.36 | 2.38 | 0.054 |
| Number of Stories | 8 | 20 | 30 |
|---|---|---|---|
| 0.71 | 0.66 | 0.71 |
| Number of Stories | With or without Consideration of P-Delta Effect | With or without TMD | SMT (g) | SSF | ŜCT (g) | CMR | ACMR |
|---|---|---|---|---|---|---|---|
| 8 | w/o P-Delta | w TMD | 0.545 | 1.522 | 1.598 | 2.930 | 4.460 |
| w/o TMD | 1.301 | 2.386 | 3.6326 | ||||
| w P-Delta | w TMD | 1.452 | 1.590 | 2.915 | 4.232 | ||
| w/o TMD | 1.195 | 2.192 | 3.182 | ||||
| 20 | w/o P-Delta | w TMD | 0.264 | 1.392 | 2.642 | 9.980 | 16.606 |
| w/o TMD | 3.158 | 11.930 | 13.892 | ||||
| w P-Delta | w TMD | 1.282 | 2.150 | 8.124 | 10.416 | ||
| w/o TMD | 1.887 | 7.129 | 9.221 | ||||
| 30 | w/o P-Delta | w TMD | 0.191 | 1.455 | 2.927 | 15.263 | 22.215 |
| w/o TMD | 2.662 | 13.882 | 20.205 | ||||
| w P-Delta | w TMD | 1.264 | 2.397 | 12.500 | 15.802 | ||
| w/o TMD | 2.116 | 11.034 | 13.949 |
| Number of Stories | 8 | 20 | 30 | |||||||||
|---|---|---|---|---|---|---|---|---|---|---|---|---|
| With or without Consideration of P-Delta Effect | w/o P-Delta | w P-Delta | w/o P-Delta | w P-Delta | w/o P-Delta | w P-Delta | ||||||
| With or without TMD | w TMD | w/o TMD | w TMD | w/o TMD | w TMD | w/o TMD | w TMD | w/o TMD | w TMD | w/o TMD | w TMD | w/o TMD |
| ŜCT in the slight DS (g) | 0.253 | 0.212 | 0.251 | 0.209 | 0.243 | 0.215 | 0.241 | 0.212 | 0.265 | 0.221 | 0.255 | 0.215 |
| ŜCT in the moderate DS (g) | 0.507 | 0.426 | 0.503 | 0.419 | 0.485 | 0.429 | 0.482 | 0.423 | 0.530 | 0.442 | 0.510 | 0.430 |
| ŜCT in the extensive DS (g) | 1.163 | 0.900 | 1.153 | 0.888 | 1.143 | 0.990 | 1.129 | 0.975 | 1.270 | 1.075 | 1.215 | 1.035 |
| ŜCT in the complete DS (g) | 1.582 | 1.249 | 1.577 | 1.183 | 2.490 | 1.950 | 2.116 | 1.874 | 2.991 | 2.639 | 2.497 | 2.162 |
| Number of Stories | 8 | 20 | 30 | |||||||||
|---|---|---|---|---|---|---|---|---|---|---|---|---|
| With or without Consideration of P-Delta Effect | w/o P-Delta | w P-Delta | w/o P-Delta | w P-Delta | w/o P-Delta | w P-Delta | ||||||
| With or without TMD | w TMD | w/o TMD | w TMD | w/o TMD | w TMD | w/o TMD | w TMD | w/o TMD | w TMD | w/o TMD | w TMD | w/o TMD |
| Standard deviation in the slight DS | 0.437 | 0.450 | 0.443 | 0.462 | 0.377 | 0.401 | 0.382 | 0.404 | 0.460 | 0.490 | 0.470 | 0.500 |
| Standard deviation in the moderate DS | 0.438 | 0.452 | 0.444 | 0.463 | 0.378 | 0.406 | 0.386 | 0.412 | 0.462 | 0.491 | 0.473 | 0.502 |
| Standard deviation in the extensive DS | 0.519 | 0.527 | 0.493 | 0.547 | 0.423 | 0.435 | 0.419 | 0.423 | 0.470 | 0.500 | 0.480 | 0.521 |
| Standard deviation in the complete DS | 0.603 | 0.633 | 0.557 | 0.650 | 0.605 | 0.622 | 0.525 | 0.586 | 0.640 | 0.670 | 0.640 | 0.660 |
| Damage State | Number of Stories | Ground Motion Intensity Level (g) | Probability of Damage w/o TMD (%) | Probability of Damage w TMD (%) | TMD Effect (%) |
|---|---|---|---|---|---|
| Slight | 8 | 0.3 | 79 | 60 | 19 |
| 20 | 0.3 | 82 | 71 | 11 | |
| 30 | 0.3 | 76 | 62.5 | 13.5 | |
| Moderate | 8 | 0.5 | 67 | 50 | 17 |
| 20 | 0.5 | 68 | 55 | 13 | |
| 30 | 0.5 | 62 | 48 | 14 | |
| Extensive | 8 | 1.0 | 54 | 38 | 16 |
| 20 | 1.0 | 53 | 42 | 11 | |
| 30 | 1.0 | 48 | 34 | 14 | |
| Complete | 8 | 1.7 | 71 | 55 | 16 |
| 20 | 1.7 | 44 | 33 | 11 | |
| 30 | 1.7 | 36 | 26.5 | 9.5 |
| Damage State | Number of Stories | Ground Motion Intensity Level (g) | Probability of Damage w/o TMD (%) | Probability of Damage w TMD (%) | TMD Effect (%) |
|---|---|---|---|---|---|
| Slight | 8 | 1.0 | 81.0 | 68.0 | 13.0 |
| 20 | 1.0 | 48.5 | 42.0 | 6.5 | |
| 30 | 1.0 | 26.4 | 21.7 | 4.7 | |
| Moderate | 8 | 1.2 | 61.0 | 41.0 | 20.0 |
| 20 | 1.2 | 26.0 | 16.0 | 10.0 | |
| 30 | 1.2 | 13.8 | 9.4 | 4.4 | |
| Extensive | 8 | 2.0 | 79.0 | 69.0 | 10.0 |
| 20 | 2.0 | 50.5 | 40.5 | 10.0 | |
| 30 | 2.0 | 29.1 | 28.5 | 1.1 | |
| Complete | 8 | 2.5 | 86.5 | 80.0 | 6.5 |
| 20 | 2.5 | 61.0 | 53.0 | 8.0 | |
| 30 | 2.5 | 39.9 | 36.4 | 3.5 |
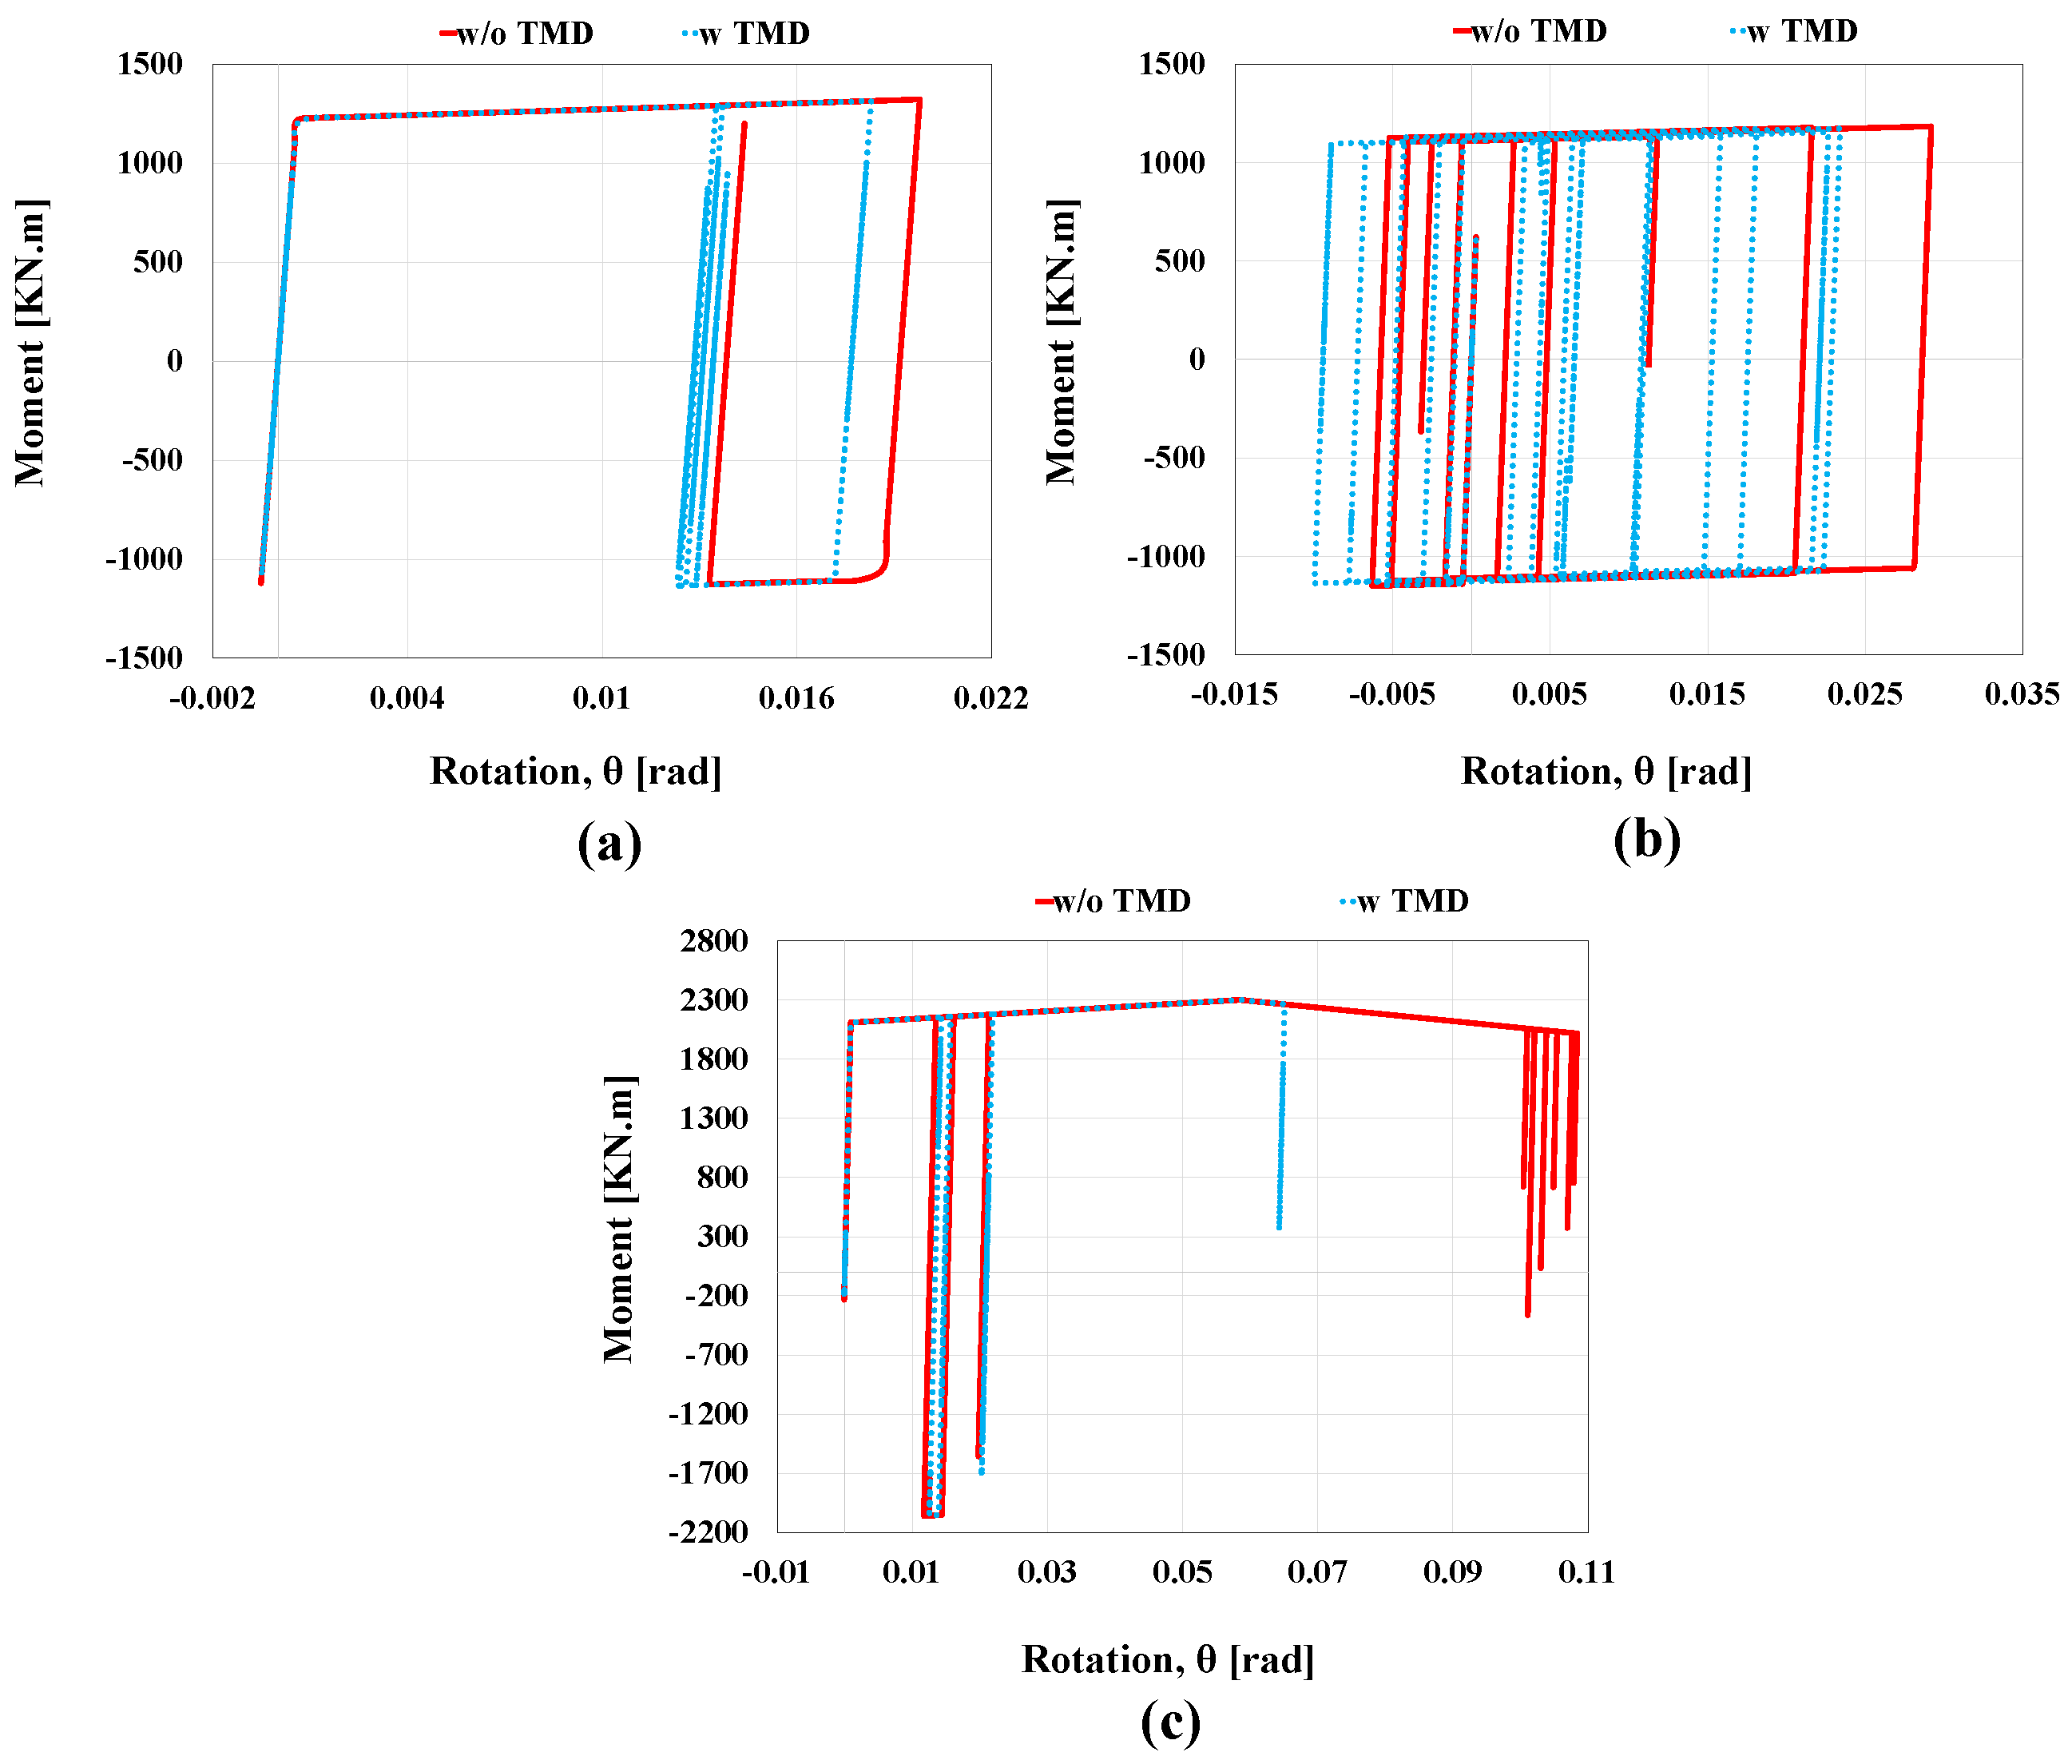
| Number of Stories | Ground Motion Intensity Level (g) | Beam Rotation w/o TMD (rad) | Beam Rotation w TMD (rad) | TMD Effect (%) |
|---|---|---|---|---|
| 8 | 1.36 | 0.0197 | 0.0182 | 7.61 |
| 20 | 3.35 | 0.0292 | 0.0234 | 19.86 |
| 30 | 2.32 | 0.1083 | 0.0650 | 39.98 |
Disclaimer/Publisher’s Note: The statements, opinions and data contained in all publications are solely those of the individual author(s) and contributor(s) and not of MDPI and/or the editor(s). MDPI and/or the editor(s) disclaim responsibility for any injury to people or property resulting from any ideas, methods, instructions or products referred to in the content. |
© 2023 by the authors. Licensee MDPI, Basel, Switzerland. This article is an open access article distributed under the terms and conditions of the Creative Commons Attribution (CC BY) license (https://creativecommons.org/licenses/by/4.0/).
Share and Cite
Hemmati Khollari, M.R.; Asadi, A.; Tajammolian, H. Seismic Fragility Assessment of SMRFs Equipped with TMD Considering Cyclic Deterioration of Members and Nonlinear Geometry. Buildings 2023, 13, 1364. https://doi.org/10.3390/buildings13061364
Hemmati Khollari MR, Asadi A, Tajammolian H. Seismic Fragility Assessment of SMRFs Equipped with TMD Considering Cyclic Deterioration of Members and Nonlinear Geometry. Buildings. 2023; 13(6):1364. https://doi.org/10.3390/buildings13061364
Chicago/Turabian StyleHemmati Khollari, Mohammad Reza, Azita Asadi, and Hamed Tajammolian. 2023. "Seismic Fragility Assessment of SMRFs Equipped with TMD Considering Cyclic Deterioration of Members and Nonlinear Geometry" Buildings 13, no. 6: 1364. https://doi.org/10.3390/buildings13061364