Article

Test Study on the Influence of Foundation Pit Excavation on the Surface Settlement of Sandy Soil Natural Foundation of Adjacent Buildings

School of Resources and Civil Engineering, Northeastern University, Shenyang 110819, China
*
Author to whom correspondence should be addressed.
Buildings 2023, 13(5), 1293; https://doi.org/10.3390/buildings13051293
Submission received: 10 April 2023 / Revised: 8 May 2023 / Accepted: 10 May 2023 / Published: 16 May 2023
(This article belongs to the Special Issue Trends and Prospects in Civil Engineering Structures)

Abstract

:
The excavation of a foundation pit will break the original stress balance and affect the surface settlement of the natural foundation of adjacent buildings, so deformation control is very important. In this paper, numerical simulation results of the additional stress of a natural foundation caused by a foundation pit excavation were compared with experimental results to verify the accuracy of the numerical model of a foundation pit excavation and obtain a reliable ratio of building width to the average particle size of the sand that was not affected by the particle size effect. Then, the distribution and variation law of the surface settlement of a natural foundation caused by excavation was studied by a model test, and the relationship between the deformation of a natural foundation and the depth of a foundation pit excavation and the additional load of building was obtained.

1. Introduction

As the number and scale of underground engineering projects increase greatly, it is necessary to excavate foundation pits of large buildings and open excavation pits of subway stations. An excavation will break the original stress balance and cause a redistribution of the surrounding stress, thus causing an additional deformation in the foundation of the surrounding buildings. It is very important for the safety and stability of the foundation pit and the surrounding buildings to make clear the distribution and change law of the additional deformation caused by an excavation. A natural foundation is the foundation that can meet all the load requirements of the foundation in a natural state without manual treatment. The natural foundation design should be given priority in a foundation engineering design when the surrounding environment allows.
Based on the field monitoring data and numerical calculation, Han Jianyong studied the deformation characteristics of existing buildings and the retaining structure caused by an excavation [1]. Combined with the actual deep foundation pit engineering in Tianjin, Deng Xu studied the influence of excavation on the retaining structure and adjacent structures [2]. Fan studied the variation law of vertical displacement of soil outside the pit with the excavation depth through the combination of a numerical simulation and engineering experience [3]. Based on the field monitoring data of a foundation pit project, Chen Yang made an in-depth study on the horizontal displacement of the pile top, the lateral displacement of the pile body, and the settlement of soil around the foundation pit [4]. Li Zhi studied the displacement, stress, and deformation of a steel pipe pile and its influence on the stability of a foundation pit, and the feasibility of replacing a bored pile with a steel pipe pile through a model test [5]. Guo Chunyan obtained the law of transmission and distribution of axial force of a prestressed anchor and soil nail under different support system conditions through an indoor model test [6]. Jin Xia obtained the interaction and influence law between the stress and deformation of the supporting structure and the settlement of the surrounding building foundation in the process of a foundation pit excavation through a model test [7]. Yan Furong carried out a group of model tests on a sand foundation with a strip foundation, and simulated the whole process of deformation, expansion, and failure of a sand foundation after loading [8]. Zheng Gang (2012) studied the response of buildings with an arbitrary angle adjacent to excavations through finite element analysis [9]. Zheng Gang (2015) studied the influence of different deformation modes of an envelope structure on existing tunnel deformation outside a foundation pit by numerical simulation [10]. Zheng Gang (2007) studied the effect on adjacent piles due to excavation by field observation and finite element numerical simulation [11]. Asker studied the control effect of different protection schemes on surface settlement through a numerical simulation [12].
At present, research mainly focuses on the deformation and mechanical characteristics of the retaining structure and the deformation of adjacent buildings and tunnels, and most research is carried out under the same working conditions. There are few studies on the surface settlement of a sandy soil natural foundation adjacent to a foundation pit, and the relationship between the surface settlement of a natural foundation and the excavation depth of a foundation pit and building load has not been solved and needs further study.
Model testing has always been the most commonly used means to solve complex engineering problems. Undisturbed soil can better reflect the characteristics of the actual engineering foundation materials in a model test, but due to the scale of the structure in contact with the foundation materials, the particle size effect will be produced. Chen Zhaoliang conducted a preliminary study on the particle size effect in a sandy soil foundation through a centrifugal model test and obtained the ratio relationship between foundation size and sand particle size that can ignore the particle size effect under the conditions of the centrifugal test [13]. Yang Junjie discussed the influence of the particle size effect on the test results and gave the ratio relationship that was not affected by the particle size effect [14]. Liu Fei used the evaluation index of the particle size effect to quantitatively discuss the law of the influence of a foundation’s burial depth on the particle size effect [15]. Ovesen found that when the ratio of the foundation diameter to the average sand particle size is greater than 30, the non-shrinkage of the soil material will not have a great impact on the bearing characteristics of the foundation through the test [16]. Craig concluded through a test that the size of various structures in contact with the soil must be more than 40 times of the maximum particle size of the soil for the test results to not be affected [17]. At present, there is no uniform ratio of structure and foundation material that can ignore the particle size effect, and the ratio of the sand soil model test needs to be further studied.
Therefore, in this paper, group of tests were carried out firstly, and then a numerical model under the same conditions as those in the first group of tests was established by using Midas GTS NX2020 finite element software. The test results were compared with the numerical simulation results to study the ratio of structure and foundation material particle size that can ignore the particle size effect in the sand soil model test, so as to provide a reference for a second test. Finally, considering the building load and the excavation depth of a foundation pit, the relationship between the surface settlement of natural ground and the excavation depth of a foundation pit and the additional load of building was studied.
This paper firstly summarizes and analyzes previous studies and then introduces the two research methods adopted in this paper, model test and numerical simulation. Then, the results of the model test and numerical simulation are analyzed. Finally, the research results are discussed and summarized.

2. Research Method

A model test is an effective means to solve complex engineering problems [18,19], and a numerical simulation can provide assistance to and supplement a model test [20]. Therefore, a model test and numerical simulation were compared in this paper.

2.1. Model Test

Two groups of model tests were designed in this paper. The first group of model test results were compared with the numerical simulation results to study the particle size effect. Then, a second group of experiments was used to study the influence of a foundation pit excavation on natural foundation deformation.

2.1.1. The First Group of Tests

(1)
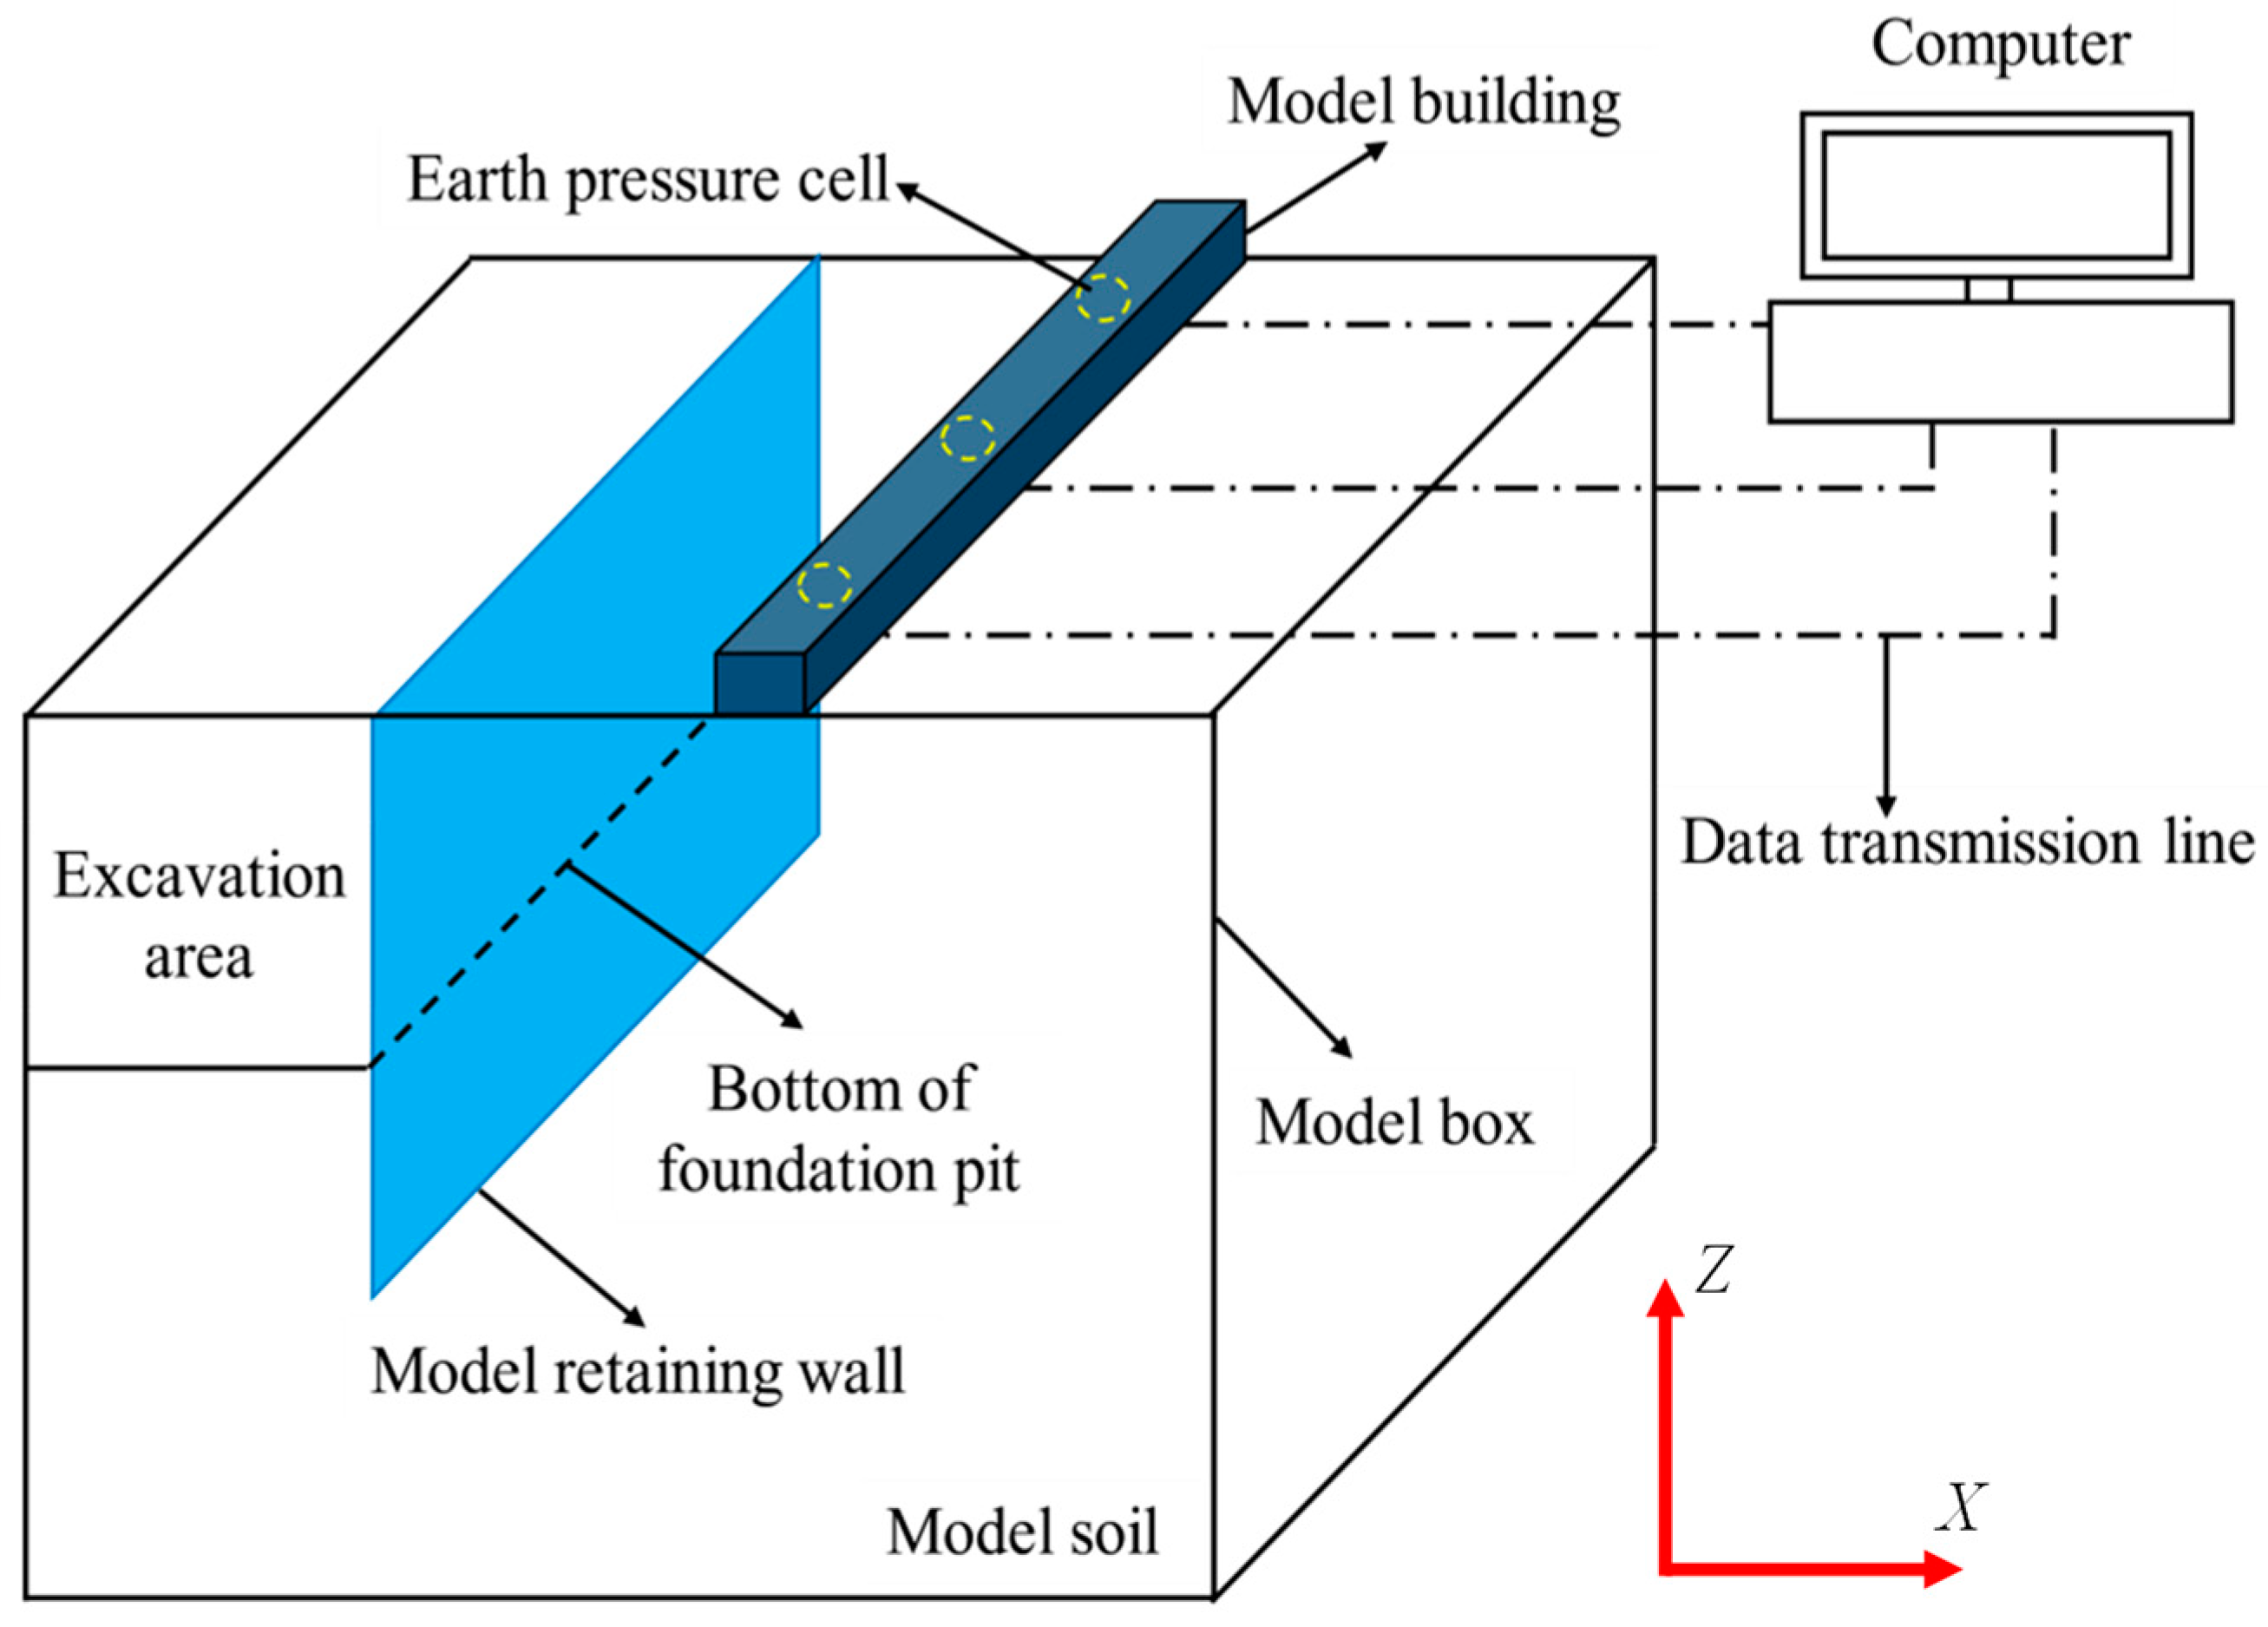
Design of model device
The main purpose of this group of tests was to explore the ratio of structure size and foundation material particle size that was not affected by the particle size effect in a sandy soil model test. In order to get the rule, there was no support inside the foundation pit in this group of tests. The schematic diagram of the first group of tests is shown in Figure 1. In the test, the earth pressure at the bottom of the model building was measured by a micro earth pressure cell with a measuring range of 20 kPa, and the earth pressure was monitored and collected by a data acquisition instrument. Three groups of earth pressure cells were set in the test. There were two earth pressure gauges in each group, one pointing to the direction of the foundation pit and the other to the direction of the building. The horizontal and vertical earth pressure at the bottom of the building during the excavation were measured, respectively. In order to study the effect of the particle size effect better, the analysis was carried out in two directions in this paper, as shown in Figure 1. The X direction refers to the direction parallel to the short side of the pit, and Z direction values were in the vertical direction.
The spatial distribution of the retaining wall, earth pressure cell, and model building in the first group of tests is shown in Figure 2. The first group of earth pressure cells was located in the center of the bottom of the building, and the second and third groups of earth pressure cells were located 150 mm away from the first group of earth pressure cells. The steel plate was located in the middle of the model box, 150 mm away from the retaining wall.
The actual excavation depth was 6 m, the excavation length was 22.5 m, the excavation width was 9 m, and the length similarity ratio was 30. Therefore, in the model test, the excavation depth was 200 mm, the excavation length was 750 mm, and the excavation width was 300 mm. The length, width, and height of the model box were 900 mm, 750 mm, and 600 mm, respectively, and the thickness was 10 mm. The model box was made of plexiglass and had good transparency. In order to reduce the friction between the foundation material and the inner side wall of the model box, a polyethylene film with a thickness of 0.04 mm was pasted around the inner side of the model box. In the test, the steel plate was used to simulate the model building, and the sandpaper was pasted on the bottom of the steel block to increase the friction between the steel plate and the foundation material, which could better simulate the interaction between the sand and the overlying structure in practice.
The actual length of the retaining wall was 22.5 m, the thickness was 0.6 m, the buried depth was 12 m, the elastic modulus was EP = 30 GPa, and the bending stiffness was EpIp = 1.215 × 10⁷ kN·m2. According to the similarity theorem, the bending stiffness of the retaining wall in the model was EmIm = 0.5 kN·m2. Therefore, a thin aluminum plate was selected to simulate the prototype retaining wall. Its elastic modulus was about 68 GPa, and its size was 750 mm × 400 mm × 5 mm.
(2)
Model soil
This group of tests was carried out under a dry sand condition. The model soil was standard sand with uniform gradation purchased on the market. The physical and mechanical parameters of the model soil were obtained through a series of geotechnical tests. Figure 3 and Figure 4 are the schematic diagrams of some geotechnical tests, and the parameters of the model soil are shown in Table 1.
The sand rain method was used to prepare the model stratum layer by layer. The thickness of each layer of sand was 50 mm. After each layer of sand was sprinkled and smoothed, it was left to stand for 20 min to make the sand dense under its own weight, and the thin aluminum plate was embedded in the designated position.
(3)
Test cases and procedures
There were six cases in the first group of tests. In order to ensure the same load on the foundation, steel plates with the same volume and different bottom area were used to simulate the building. The widths of the bottom of the steel plates were 10 mm, 20 mm, 30 mm, 40 mm, 50 mm, and 60 mm, respectively. The test cases are shown in Table 2 below:
Each case was carried out according to the following steps: The excavation depth of the foundation pit was 200 mm, and there were four excavation steps, each step was 50 mm. A transparent film was placed under each layer of excavated soil to facilitate marking and soil sampling. The earth pressure cell indication was recorded before excavation, and then the test was carried out. In the first step of the excavation, the data of the earth pressure cell were recorded when stable, and the steps were repeated until the set excavation depth of the foundation pit was reached. Then, all the earth pressure data were recorded at the end of the test.

2.1.2. The Second Group of Tests

The purpose of this group of tests was to study the influence of excavation depth and additional load on natural foundation deformation. The schematic diagram of the test is shown in Figure 5. A total of nine displacement sensors with a measuring range of 50 mm were set to monitor the surface settlement around the building during the excavation, and the data were collected by the data acquisition instrument.
The spatial distribution of the displacement sensor and the diagram of test device are shown in Figure 6 and Figure 7. S1–S4 was defined as monitoring section A, and S5–S8 as monitoring section B. The surface settlement near the foundation pit was measured by S1 and S5, the surface settlement between the foundation pit and the building was measured by S2 and S6, and the surface settlement around the building was measured by S3, S4, S7, S8, and S9. Triangle in the Figure 6 below show the position of the displacement meter.
The spatial distribution of support, retaining wall, and building in this group of tests is shown in Figure 8. The retaining wall was the same as in the first group of tests, which was simulated by a thin aluminum plate. Four steel plates with length × width × height of 250 mm × 150 mm × 60 mm were used to simulate the model building. The minimum size of the steel plate in contact with the soil was 60 mm, and the ratio of the steel plate to the average particle size of soil was 298. According to the conclusion of the first group of tests, the foundation material in this group of tests could not be shrunk. The model soil was the same as in the first group of tests.
The prototype internal support was a steel pipe with a diameter of 609 mm, thickness of 16 mm, length of 9 m, and spacing of 3 m. Its elastic modulus was EP = 220 GPa, and its compressive stiffness was EpAp = 6.557 × 10⁶ kN. According to the similarity theorem, the compressive stiffness of the inner support in the model was EmAm = 2.428 × 10² kN. In this paper, a PVC pipe was selected as the similar material, and its elastic modulus was about 3 GPa. According to the ring area formula and the size of the model box, the diameter of the PVC pipe was 16 mm, the thickness was 2 mm, the length was 300 mm, and the spacing was 100 mm.
  • Test cases and procedures
This group of tests simulated different additional loads by increasing the number of steel plates. There were four cases in this group of tests. The cases are shown in Table 3:
Each case was carried out according to the following steps: The excavation depth of the foundation pit was 250 mm, and there were five excavation steps, each step was 50 mm. A transparent film was placed under each layer of excavated soil to facilitate marking and soil sampling. The soil excavation method was the same as in the first group of tests. The initial displacement sensor data were recorded before excavation, and then the test was carried out. During the excavation of the third layer of soil, the PVC pipe was arranged and fixed between the aluminum plate and the model box. The PVC pipe was located at the height of 100 mm. The steps were repeated until the set excavation depth of the foundation pit was reached.

2.2. Numerical Simulation

Six groups of numerical models were established by Midas GTS NX software. The size, structure size, soil parameters, and excavation steps of the numerical model were the same as those of the first group of tests. The calculation model is shown in Figure 9.
In the numerical model, the boundary conditions of the model were defined as follows: The top of the model was a free boundary without constraints. The boundary conditions around the model were normal constraints, limiting its normal displacement to 0. The bottom boundary of the model was fixed constraints, limiting its vertical displacement to 0. The physical and mechanical parameters of the soil and structural material are shown in Table 4. The soil was assumed to be an ideal elastic-plastic material, and the failure criterion was a modified Molar Coulomb constitutive. The retaining wall, support structure, and building were assumed to be linear elastic materials that were simulated by an elastic constitutive. The soil and building were modelled using a solid unit, the retaining wall was modelled using a plate unit, and the support structure was modelled using a beam unit. In order to better simulate the interaction between the retaining wall and soil, the interface unit was set between the retaining wall and soil. There were 42,560 elements in the model.

3. Analysis of Results

3.1. Comparison of Test Results and Numerical Results

The numerical results of the six groups of cases were extracted and compared with the test results. Figure 10 is the comparison diagram of the earth pressure along the X direction of the foundation. Figure 11 is the comparison diagram of the earth pressure along the Z direction of the foundation.
It can be seen from Figure 10 that the test value of earth pressure along the X direction of the foundation at the bottom of the building under the six cases was larger than the simulation value, and with the increase of the bottom width of the building, the test value curve of earth pressure along the X direction was gradually closer to the simulation value curve. When the bottom width of the building was 50 mm (Case 5), the test value curve and the simulation value curve tended to coincide. The test values of the earth pressure along the X direction under six cases were 16.05%, 11.1%, 9.86%, 8.03%, 3.96%, and 2.79% higher than the simulation values, respectively. From Figure 11, the variation trend of earth pressure along the Z direction with the excavation depth of the foundation pit was the same as that along X direction. Under six cases, the test value of earth pressure along the Z direction at the bottom of the building was larger than the simulation value, and with the increase of the bottom width of the building, the test value curve of earth pressure along the Z direction was gradually closer to the simulation value curve. The two curves tended to coincide with each other when the bottom width of the building was 50 mm. The test values of earth pressure along the Z direction under the six cases were 11.56%, 10.74%, 10.03%, 6.79%, 3.94%, and 2.28% higher than the simulation values, respectively.
Through comprehensive analysis of Figure 10 and Figure 11, it can be concluded that with the increase of the bottom width of the building, the ratio of the bottom width of the building to the average particle size of soil gradually increased, and the difference between the test value and the simulation value of earth pressure gradually decreased. When the bottom width of building was 50 mm, the curves of the test value and the simulation value of earth pressure along the X direction and Z direction showed a trend of coincidence. At this time, the difference between the test value and the simulation value was less than 4%, which could be ignored. In MIDAS GTS NX, soil was simulated by a solid grid that was tightly connected without gaps, and the soil was a homogeneous continuum. In fact, soil is a particle body. By comparing the test results and the simulation results, it could be concluded that with the gradual increase of the building width, the difference between the test value and the simulation value gradually decreased. When the building width reached a certain value, the test value and the simulation value almost coincided. Therefore, it was considered that the difference between the test value and the simulation value of earth pressure was mainly due to the particle size effect. Moreover, from the difference between the test value and the simulation value, the particle size effect on the test results could be ignored when the ratio of the minimum size of the building in contact with the soil to the average particle size of the soil was greater than 50/0.201 = 248.

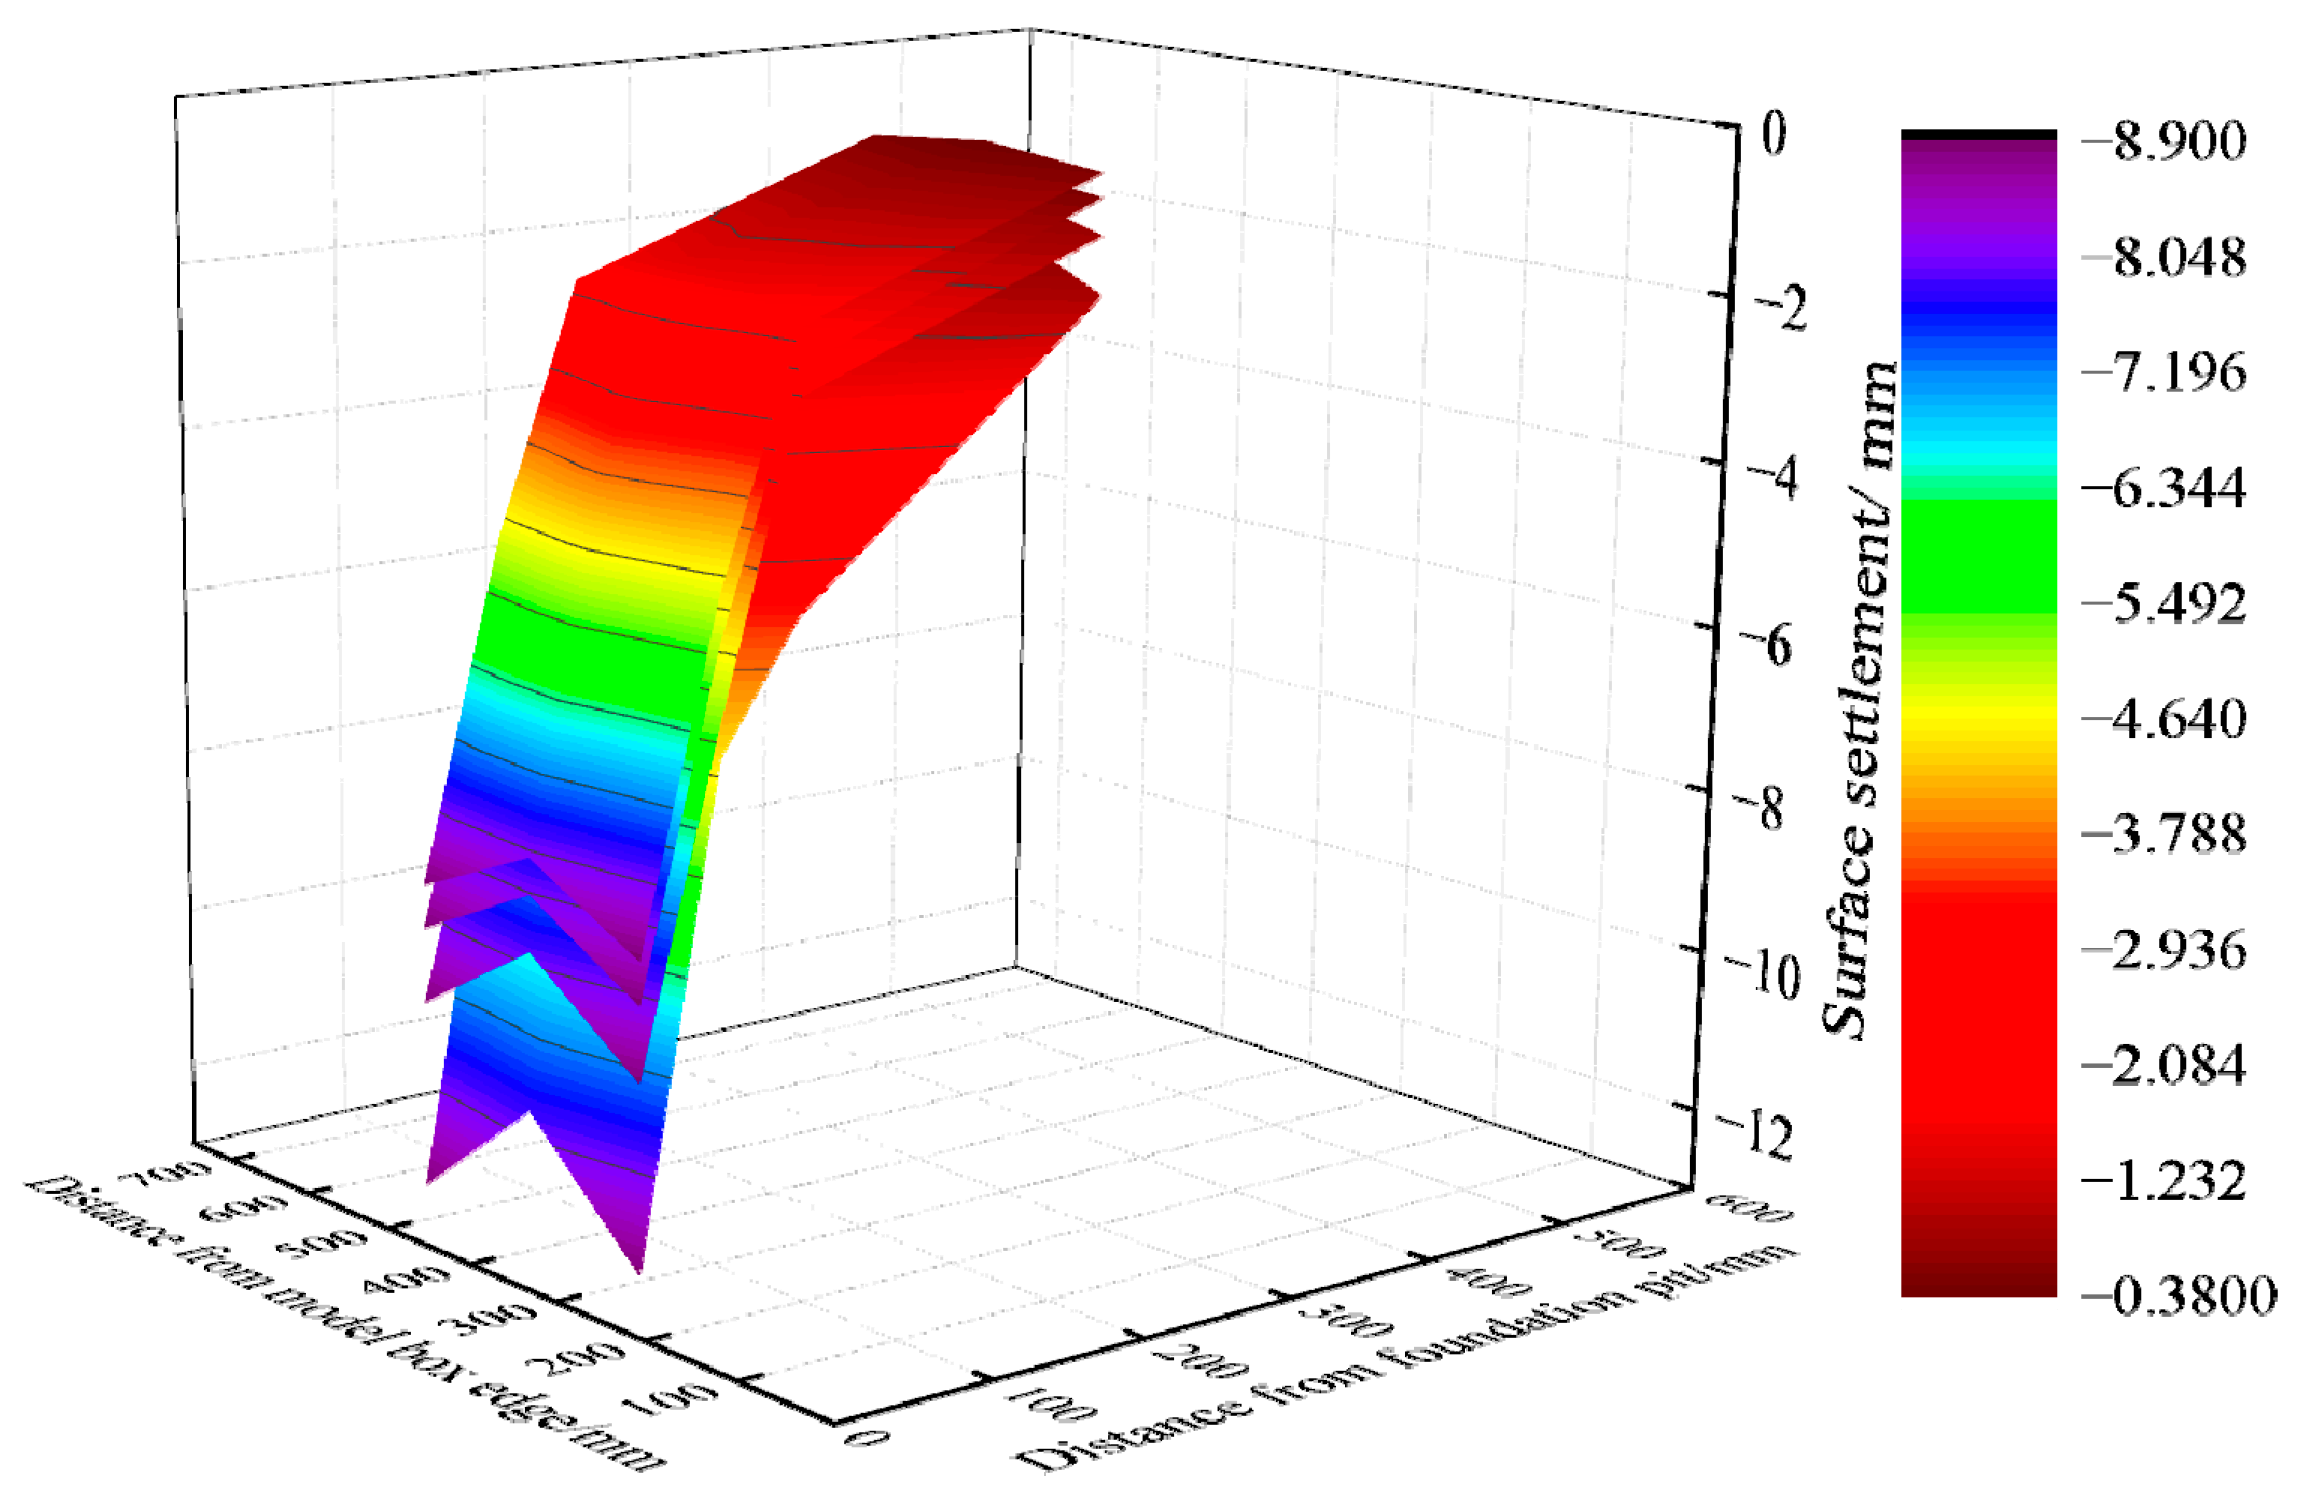
3.2. Relationship between Surface Settlement and Excavation Depth

Figure 12 and Figure 13 show the distribution law of surface settlement of monitoring section A (S1–S4) and monitoring section B (S5–S8), and its variation with the excavation depth of foundation pit in Case 4. The law was obtained under Case 4, and the excavation depth of foundation pit was h.
It can be seen from the Figure 12 and Figure 13 that in section A and section B, with the decrease of the distance from the building, the surface settlement value of the monitoring site also decreased gradually, and the overall change trend of the surface settlement of monitoring section A and monitoring section B were the same, which increased gradually with the increase of the excavation depth of the foundation pit. When the excavation depth of the foundation pit was 50 mm, the surface settlement at the same distance from the foundation pit of section A was 3.87%, 48.48%, 41.02%, and 42.1% larger than that of section B, respectively; When the excavation depth of the foundation pit is 100 mm, the surface settlement of section A is 2.45%, 47.16%, 45.56%, and 27.27% larger than that of section B, respectively; when the excavation depth of the foundation pit was 150 mm, the surface settlement of section A was 14.79%, 19.86%, 37.09%, and 23.21% larger than that of section B, respectively; when the excavation depth of the foundation pit was 200 mm, the surface settlement at the same distance from the foundation pit of section A was 14.79%, 19.86%, 37.09%, and 23.21% larger than that of section B, respectively; when the excavation depth of the foundation pit was 250 mm, the surface settlement at the same distance from the foundation pit of section A was 11.37%, 13.84%, 44.47%, and 36.87% larger than that of section B, respectively. By analyzing these data it can be concluded that the surface settlement of each monitoring point on monitoring section A was greater than that on monitoring section B, and the influence of excavation on the foundation near the corner of the building was greater than that on the foundation near the middle of the building.
According to Figure 12 and Figure 13, the surface settlement was the largest when the distance from the foundation pit was 0.1 h (S1, S5), and the surface settlement changed little when the excavation depth was 150 mm, 200 mm, and 250 mm. The surface settlement was the smallest when the distance from the foundation pit was 1.3 h (S4, S8), and the change range of the surface settlement was small in the whole excavation process. In section A, compared with the maximum surface settlement at S1, the maximum surface settlement at S2, S3, and S4 decreased by 46.58%, 58.34%, and 84.26%, respectively. In section B, compared with the maximum surface settlement at S5, the maximum surface settlement at S6, S7, and S8 decreased by 48.07%, 73.9%, and 88.78% respectively.

3.3. Relationship between Surface Settlement and Additional Load

It can be seen from the analysis in the previous section that the surface settlement increased with the increase of the excavation depth. Therefore, the surface settlement at the excavation depth of 250 mm was selected for analysis. Figure 14 shows the relationship between the surface settlement and the additional load at the same distance from the foundation pit.
It can be seen from Figure 14a that when the distance from the foundation pit was 0.1 h, S1 and S5 increased with the increase of the additional load, the change trend was linear, and the increase amplitude of the surface settlement of both was similar. It can be seen from Figure 14b that when the distance from the foundation pit was 0.3 h, the change rule of the surface settlement of S2 and S6 was the same in the first three cases, and the increase of the surface settlement of S2 was less than that of S6 in Case 4. It can be seen from Figure 14c that when the distance from the foundation pit was 0.5 h, the change trend of the surface settlement of S3, S7, and S9 is the same in the first three cases, and the increase range of the surface settlement was also similar. The increase range of S3 was greater than that of S7 and S9 in Case 4. It can be seen from Figure 14d that when the distance from the foundation pit was 1.3 h, S4 and S8 had the same change rule of surface settlement in Case 1 and Case 2, and the increase range of S4 was greater than that of S8 in Case 3 and Case 4. When additional load increased from 4.71 kPa to 18.84 kPa, the surface settlement of S1, S2, S3, S4, S5, S6, S7, S8, and S9 increased by 41.34%, 39.13%, 172.91%, 266.67%, 37.14%, 65.42%, 106.38%, 160.41%, and 105.16%, respectively. S4 was located at the corner of the building, so it could be concluded that the additional load had a greater impact on the increase of surface settlement of the building’s corner. To sum up, the surface settlement of each monitoring point increased with the increase of additional load, and the overall distribution was linear.
Figure 15 shows the maximum surface settlement distribution of each monitoring point of the natural foundation under different cases. The abscissa is the distance from the foundation pit, the ordinate is the distance from the edge of the model box, and the vertical coordinate is the maximum surface settlement. From top to bottom are Case 1, Case 2, Case 3, and Case 4 in the figure.
It can be seen from Figure 15 that in the horizontal direction, the maximum surface settlement gradually decreased with the increase of the distance from the foundation pit, and the overall distribution was “stepped”. In the longitudinal direction, the maximum surface settlement first decreased and then increased along the length of the building within the width of the building.
The conclusions of this study are drawn in the case of a sandy soil layer, so the conclusions and results of this paper have certain limitations. The next step is to carry out research on the natural foundation deformation law caused by excavation under different stratum conditions and different supporting methods.

4. Conclusions

The influence of the particle size effect in a sandy soil model test was investigated using a comparison of a model test and a numerical simulation. When the ratio of the minimum size of the building to the average particle size of the soil was greater than 248, the effect of particle size on the test results could be ignored. Surface settlement increased as excavation depth and additional load increased, and maximum surface settlement had a linear relationship with additional load.
Based on the ratio of building width to average particle size of the soil obtained in this paper, a suitable model soil for the sandy soil model test could be selected based on building size, which provides a reference for the selection of materials for the model test. Furthermore, the natural foundation deformation law caused by excavation has a significant impact on the design and construction of foundation pit engineering. This paper derives the positions of natural foundations that are affected more by excavation. As a result, precautions can be taken ahead of time to ensure safety during actual construction.

Author Contributions

Methodology, Q.B.; software, B.W.; supervision, W.Z.; writing—original draft, writing—review and editing, J.D. All authors have read and agreed to the published version of the manuscript.

Funding

This research was funded by the National Natural Science Foundation of China grant number (51878127).

Data Availability Statement

Not applicable.

Conflicts of Interest

The authors declare no conflict of interest.

References

  1. Han, J.-Y.; Zhao, W.; Guan, Y.-P.; Jia, P.-J. Deformation Characteristics and Key Parameters of Deep Excavation Adjacent to Buildings with Shallow Foundations. J. Northeast. Univ. (Nat. Sci.) 2018, 39, 1463–1468. [Google Scholar]
  2. Deng, X.; Zheng, H.; Song, Z.-H.; Wang, J. Deformation Analysis of Deep Excavation Adjacent to the New Subway Station. Chin. J. Undergr. Space Eng. 2018, 14 (Suppl. S1), 270–277. [Google Scholar]
  3. Fan, F.; Chen, J.-J.; Zhang, H.-B.; Wang, J.-H. Simplified method to predict settlements of adjacent buildings due to deep excavation. Chin. J. Geotech. Eng. 2015, 37 (Suppl. S2), 61–64. [Google Scholar]
  4. Chen, Y.; Zhao, W.; Jia, P.-J.; Han, J.-Y. Stability Assessment and Mechanical Effects Analysis on Deep Foundation Pit in Sandy Soil. J. Northeast. Univ. (Nat. Sci.) 2018, 39, 1353–1357. [Google Scholar]
  5. Li, Z. Model Test and Numerical Simulation of Stability of Steel Pipe Pile Foundation Pit Support. Master’s Thesis, China University of Mining and Technology, Xuzhou, China, 2017. [Google Scholar]
  6. Guo, C.-Y. Indoor Model Test and Numerical Simulation of Composite Soil Nailing in Foundation Pit; North University of China: Taiyuan, China, 2012. [Google Scholar]
  7. Jin, X. Model Test Study on Interaction between Deep Foundation Pit Excavation and Adjacent Foundation; Lanzhou Jiaotong University: Lanzhou, China, 2013. [Google Scholar]
  8. Yan, F.; Fan, W.; Wang, Y.; He, T. Model Test on Disruptive Mode of Strip Sandy Soil Foundation. J. Disaster Pervention Mitig. Eng. 2010, 2, 159–164. [Google Scholar]
  9. Zheng, G.; Li, Z.-W. Finite element analysis of response of buildings with arbitrary angle adjacent to excavations. Chin. J. Geotech. Eng. 2012, 34, 615–624. [Google Scholar]
  10. Zheng, G.; Wang, Q.; Deng, X.; Du, Y.M. Comparative analysis of influences of different deformation modes of retaining structures on deformation of existing tunnels outside excavations. Chin. J. Geotech. Eng. 2015, 37, 1181–1194. [Google Scholar]
  11. Zheng, G.; Yan, Z.-X.; Lei, H.-Y.; Lei, Y. Field observation and finite element numerical simulation analysis of effect on adjacent piles due to excavation. Chin. J. Geotech. Eng. 2007, 29, 638–643. [Google Scholar]
  12. Asker, K.; Fouad, M.T.; Bahr, M.; El-Attar, A. Numerical analysis of reducing tunneling effect on viaduct piles foundation by jet grouted wall. Min. Miner. Depos. 2021, 15, 75–86. [Google Scholar] [CrossRef]
  13. Chen, Z.-L. Influence of Relative Density on Foundation Size Effect in Foundation Bearing Capacity Experiment. Master’s Thesis, Ocean University of China, Qingdao, China, 2009. [Google Scholar]
  14. Yang, J.-J.; Liu, F.; Toyoswa, Y.; Horiyi, N.; Itoh, K. Particle size effects on bearing capacity of sandy ground in centrifugal tests. Chin. J. Geotech. Eng. 2007, 29, 477–483. [Google Scholar]
  15. Liu, F.; Zheng, X.-L.; Yang, J.-J.; Toyosawa, Y.; Nobuyuki, H. Influence of foundation depth on particle size effects in centrifuge tests on bearing capacity. Chin. J. Geotech. Eng. 2010, 32, 1621–1627. [Google Scholar]
  16. Ovesen, N.K. The Use of Physical Model in Design: The Scaling Law Relationships. In Proceedings of the 7th European Conference on Soil Mechanics and Foundation Engineering, Brighton, UK, September 1979; Volume 4, pp. 318–323. [Google Scholar]
  17. Craig, W.H. Simulation of Foundations for Offshore Structures Using Centrifuge Modelling. In Developments in Soil Mechanics and Foundation Engineering—Model Studies; Applied Science Publishers Ltd.: London, UK, 1983; pp. 1–27. [Google Scholar]
  18. Lü, X.; Zhou, Y.; Huang, M.; Zeng, S. Experimental study of the face stability of shield tunnel in sands under seepage condition. Tunn. Undergr. Space Technol. 2018, 74, 195–205. [Google Scholar] [CrossRef]
  19. Sun, X.; Chen, F.; Miao, C.; Song, P.; Li, G.; Zhao, C. Physical modeling of deformation failure mechanism of surrounding rocks for the deep-buried tunnel in soft rock strata during the excavation. Tunn. Undergr. Space Technol. 2018, 74, 247–261. [Google Scholar] [CrossRef]
  20. Jia, P.; Nie, Y.; Shi, P.; Jiang, X.; Lu, B.; Zhao, W. Flexural performance of a novel pipe-roof structure and optimization of key parameters. J. Constr. Steel Res. 2022, 199, 107594. [Google Scholar] [CrossRef]
Figure 1. Schematic of the first group of tests.
Buildings 13 01293 g001
Figure 2. First test’s model box size (unit: mm).
Buildings 13 01293 g002
Figure 3. Direct shear test equipment.
Buildings 13 01293 g003
Figure 4. Consolidation test equipment.
Buildings 13 01293 g004
Figure 5. Schematic of the second group of tests.
Buildings 13 01293 g005
Figure 6. Position diagram of the displacement sensor.
Buildings 13 01293 g006
Figure 7. Diagram of the test device.
Buildings 13 01293 g007
Figure 8. Second test’s model box size (unit: mm).
Buildings 13 01293 g008
Figure 9. Plot of the numerical model.
Buildings 13 01293 g009
Figure 10. Comparison of test and simulation values of earth pressure along the X direction of the foundation.
Buildings 13 01293 g010
Figure 11. Comparison of test and simulation values of earth pressure along the Z direction of the foundation.
Buildings 13 01293 g011
Figure 12. Variation of surface settlement of S1–S4 with depth of the foundation pit of Case 4.
Buildings 13 01293 g012
Figure 13. Variation of surface settlement of S5–S8 with depth of the foundation pit of Case 4.
Buildings 13 01293 g013
Figure 14. Relationship between surface settlement and additional load. (a) 0.1 h. (b) 0.3 h. (c) 0.5 h. (d) 1.3 h.
Buildings 13 01293 g014
Figure 15. Maximum surface settlement distribution.
Buildings 13 01293 g015
Table 1. Physical and mechanical parameters of the model soil.
Dry Density
ρd/g/cm3
Cohesion
c/kPa
Elastic Modulus
E0/MPa
Average Particle Size
D50/mm
Internal Friction Angle
φ
1.6452.737.90.20135.5
Table 2. Cases of the first group of tests.
CaseLength × Width × Height/mm
1750 × 10 × 150
2750 × 20 × 75
3750 × 30 × 50
4750 × 40 × 37.5
5750 × 50 × 30
6750 × 60 × 25
Table 3. Cases of the second group of tests.
CaseSteel Plate NumberAdditional Load/kPa
114.71
229.42
3314.13
4418.84
Table 4. Physical and mechanical parameters of soil and structural material.
Material Weight Density
γ/kN·m−3
Elastic Modulus
E0/MPa
Poisson’s Ratio
μ
Cohesion
c/kPa
Internal Friction Angle
φ
Soil16.4537.90.32.735.5
Retaining wall27.0268,0000.32
Steel78.5210,0000.3
Disclaimer/Publisher’s Note: The statements, opinions and data contained in all publications are solely those of the individual author(s) and contributor(s) and not of MDPI and/or the editor(s). MDPI and/or the editor(s) disclaim responsibility for any injury to people or property resulting from any ideas, methods, instructions or products referred to in the content.

