

Friction and Cohesion Interface Shear Factors of Ultra-High-Performance Concrete (UHPC) Cast on Hardened Conventional Concrete

Abstract
:1. Introduction
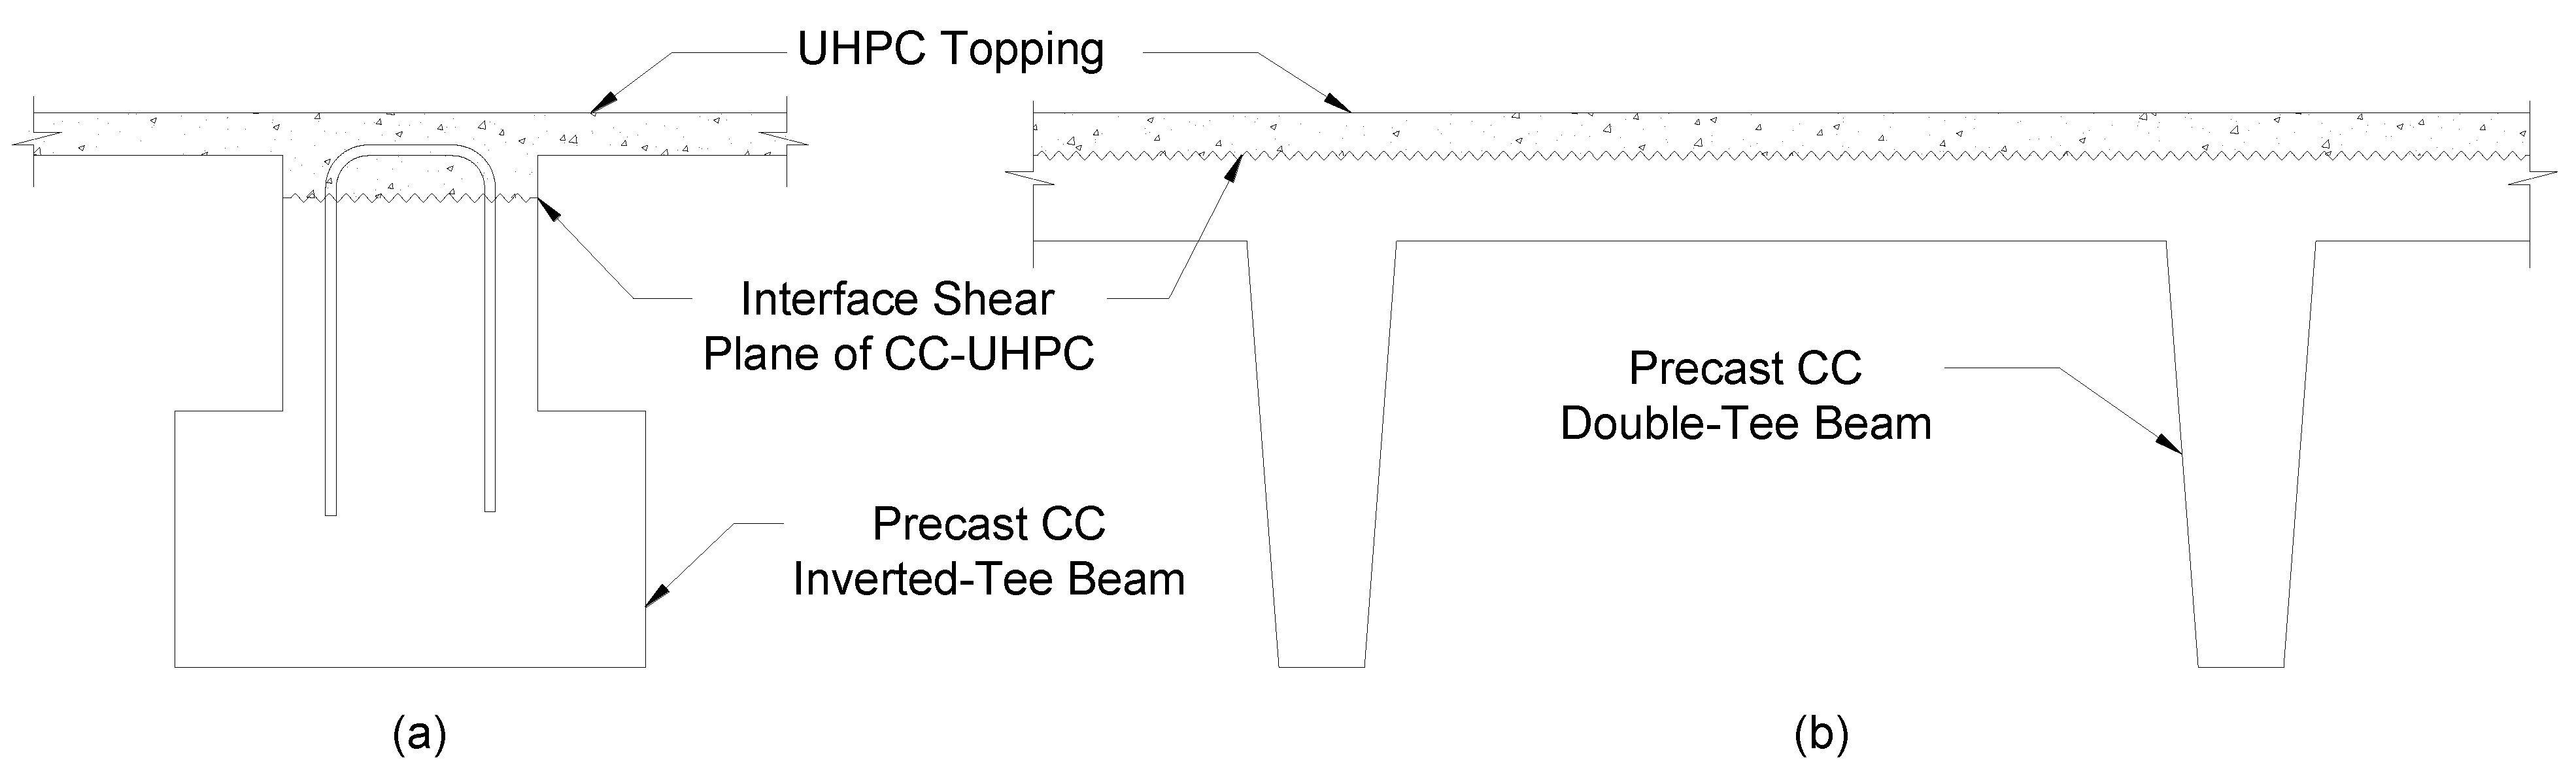
- Fresh UHPC cast on hardened CC (CC–UHPC);
- Fresh CC cast on hardened UHPC (UHPC–CC);
- Fresh UHPC cast on hardened UHPC (UHPC–UHPC);
- UHPC cast monolithically (MON-UHPC).
2. Literature Review
2.1. Shear Friction Theory
2.2. Code Provisions
2.3. UHPC Interface Shear
3. Material Properties
4. Model Development
5. Model Validation
6. Design Example
7. Conclusions
- The interface shear resistance of CC–UHPC can be predicted using the shear friction model. However, the cohesion and friction factors stated in AASHTO LRFD 2020, Draft AASHTO 2023, ACI 318-19, Eurocode 2, and CSA A23.3-14 provisions are very conservative;
- Interface shear resistance of CC–UHPC with surface roughening of 6 mm (1/4 in.) amplitude can be predicted using a cohesion factor of 3.45 MPa (0.50 ksi) and shear friction factor of 1.0. The shear friction factor is adopted from the current codes, and the cohesion factor is more than double the ones for conventional concrete;
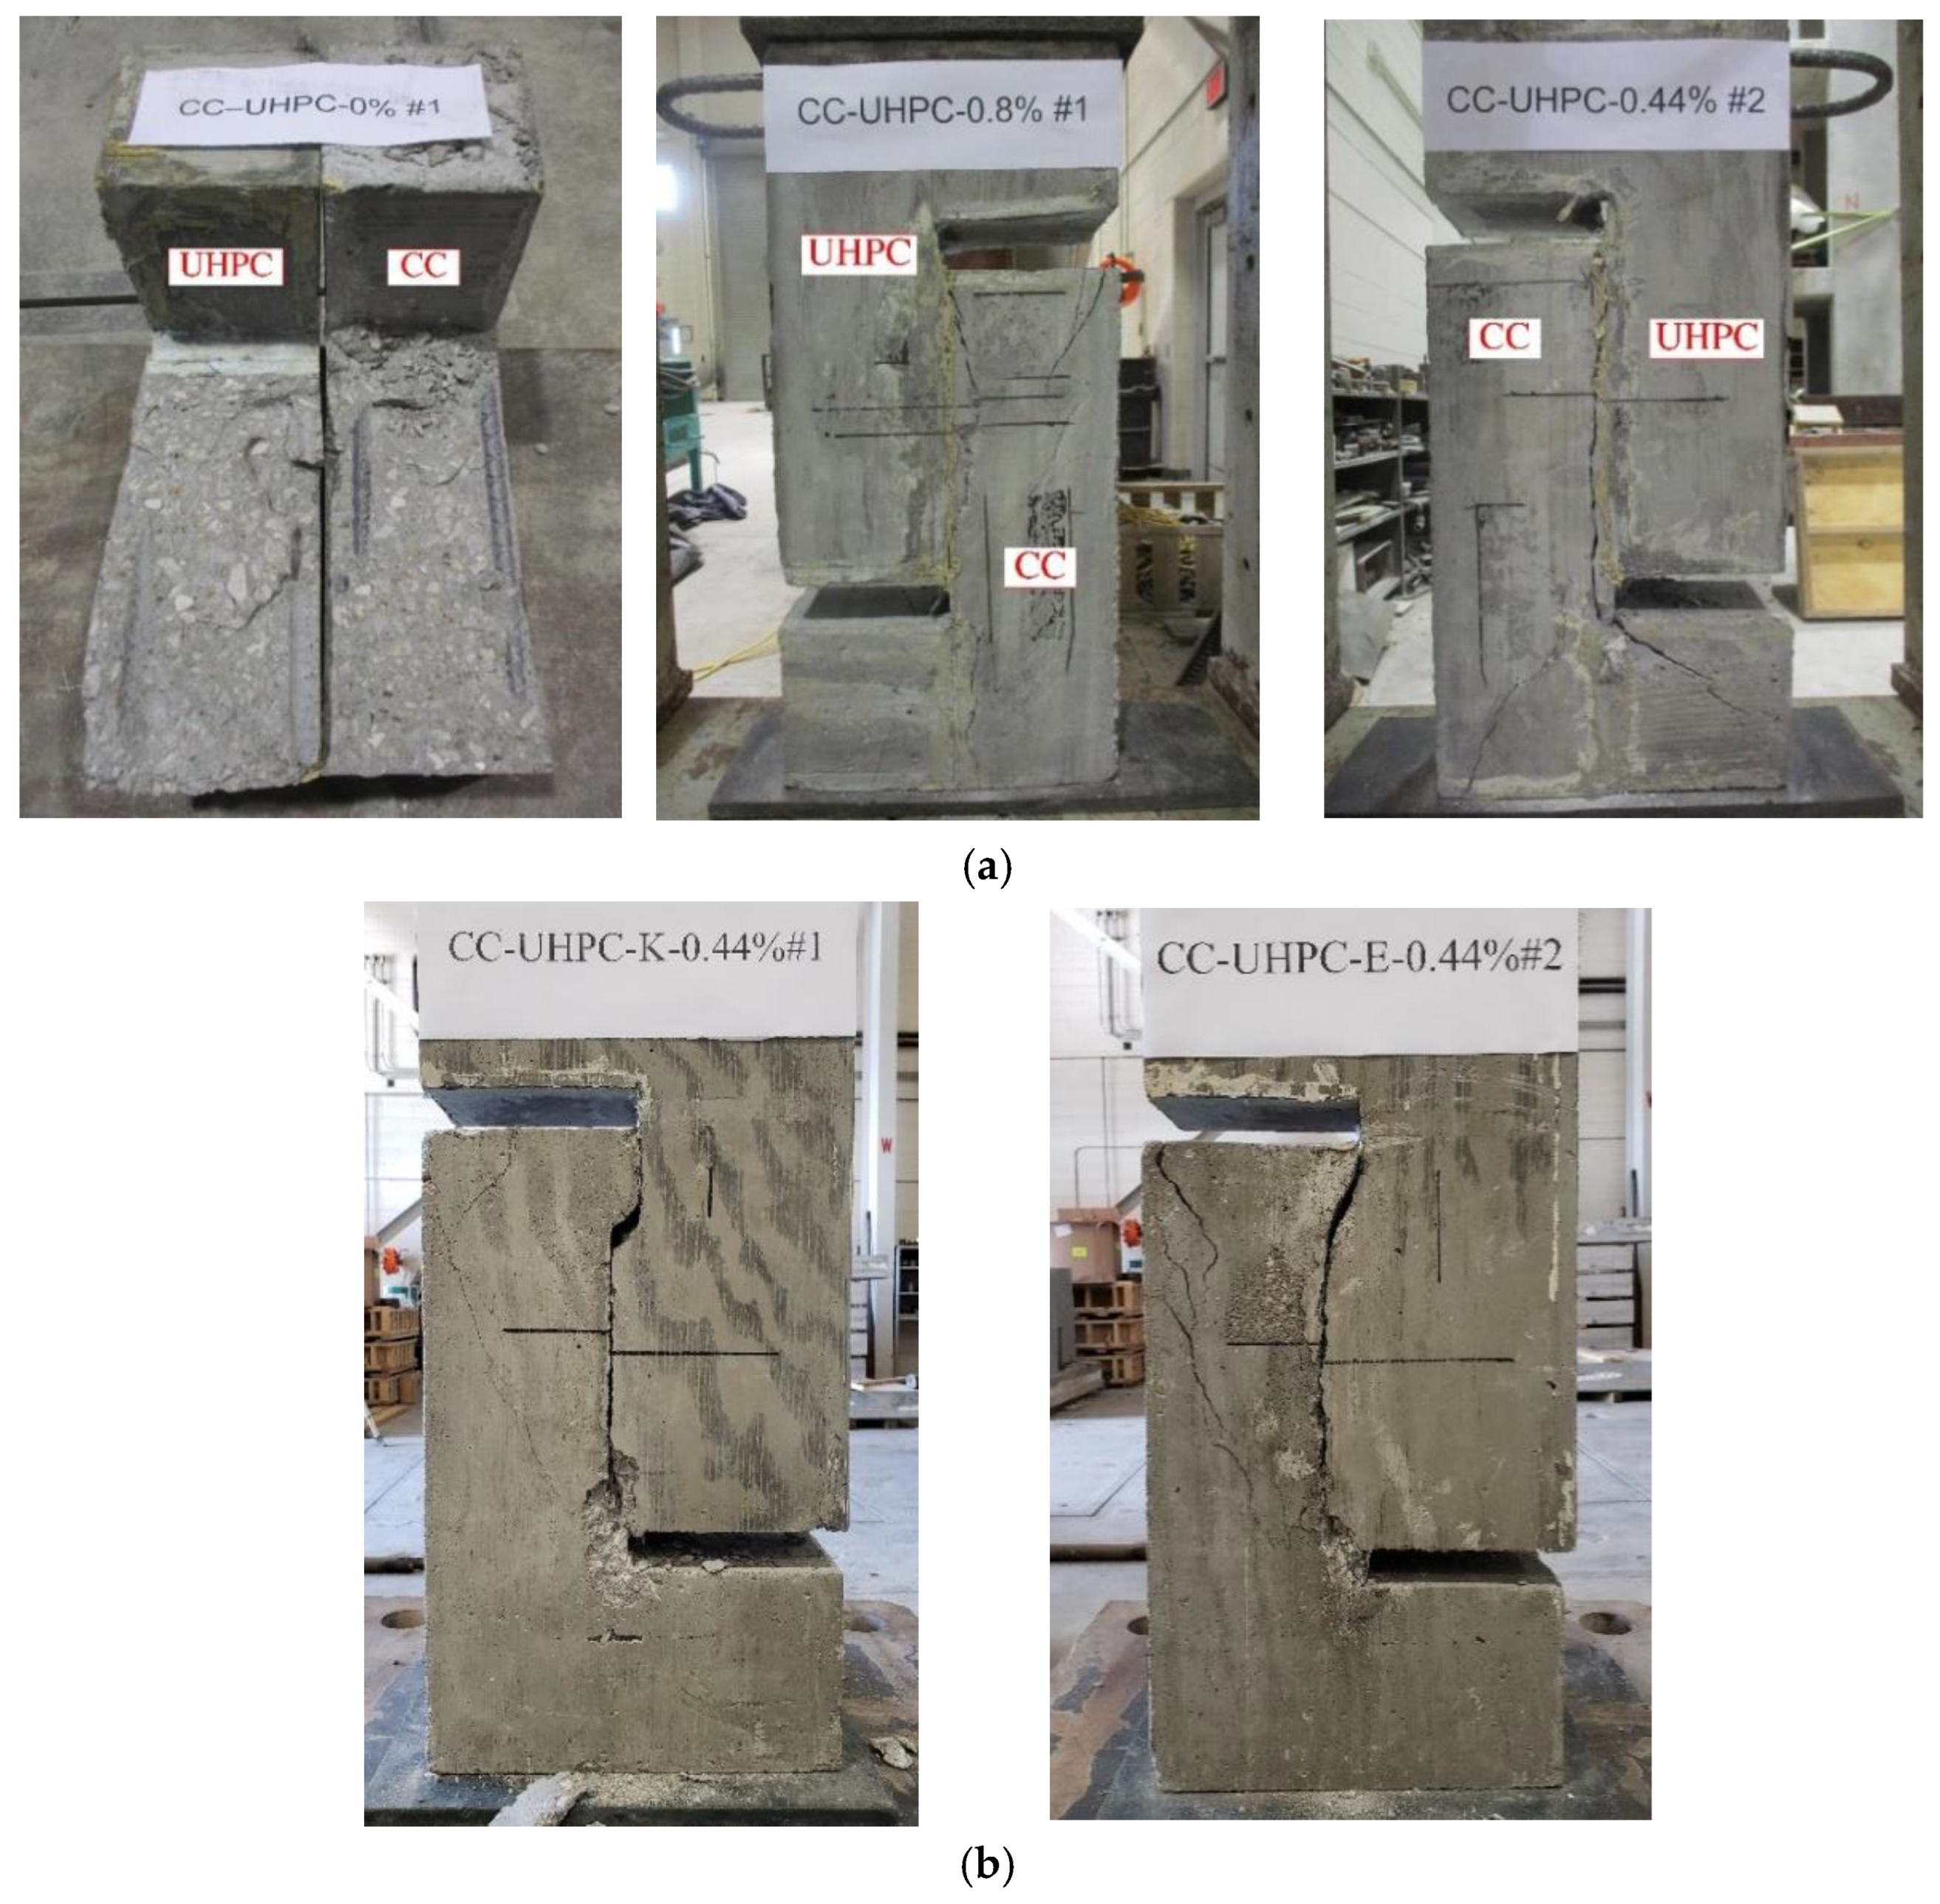
- The addition of interface shear reinforcement with ratios of 0.44%, and 0.80% resulted in higher interface shear resistance and more ductile failure compared to the specimens without interface shear reinforcement, which had brittle failure;
- The interface shear resistance increases with the increase in UHPC compressive strength only for surfaces that are not intentionally roughened. However, for intentionally roughened surfaces, where failure occurs in CC, the interface shear resistance increases with the increase in CC compressive strength. These observations were based on the compressive strength of CC and UHPC, ranging from 35.9 MPa (5.2 ksi) to 56.8 MPa (8.24 ksi) and 80.6 MPa (11.69 ksi) to 187.4 MPa (27.2 ksi), respectively;
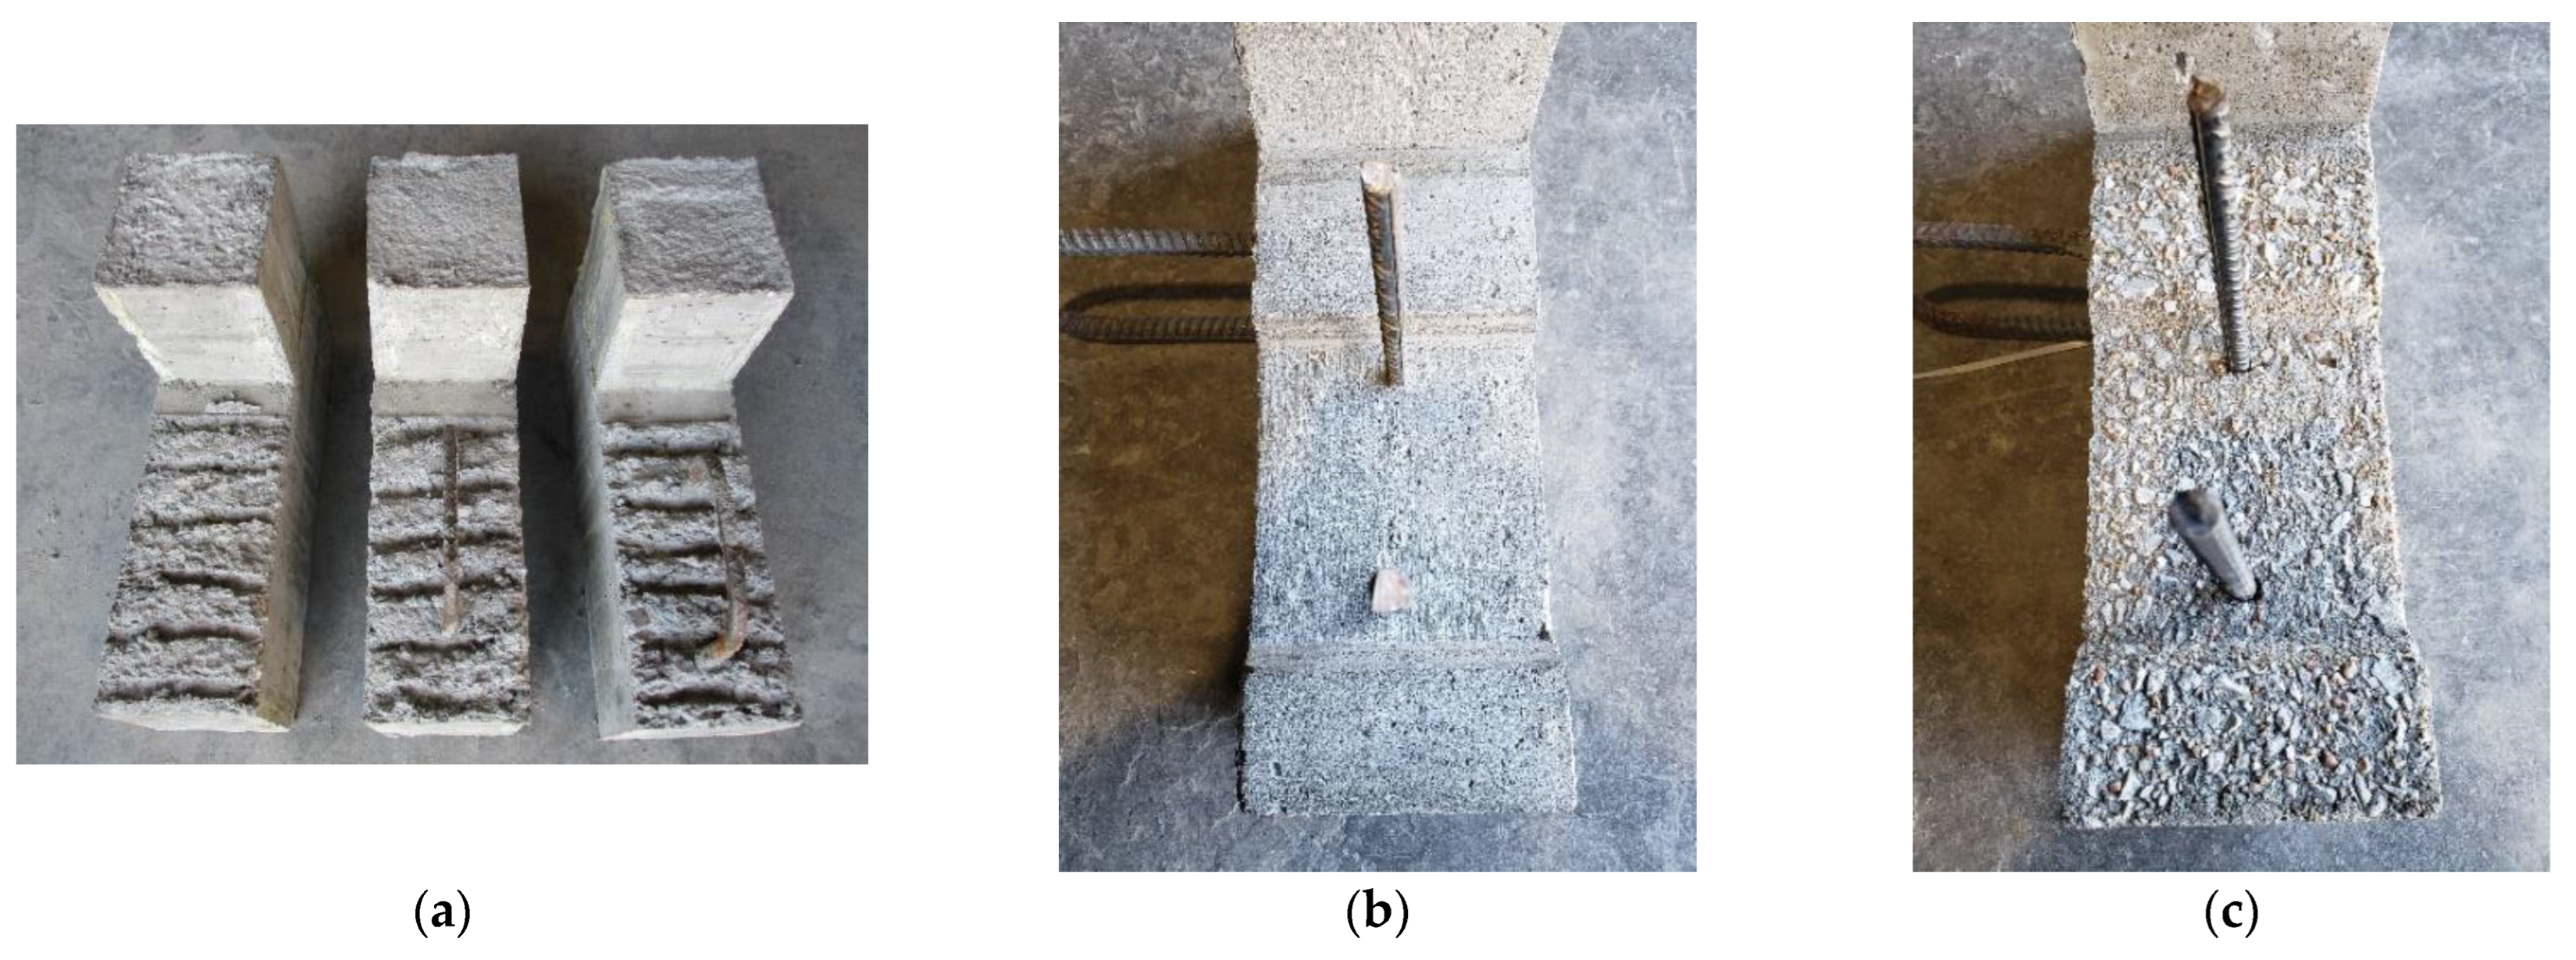
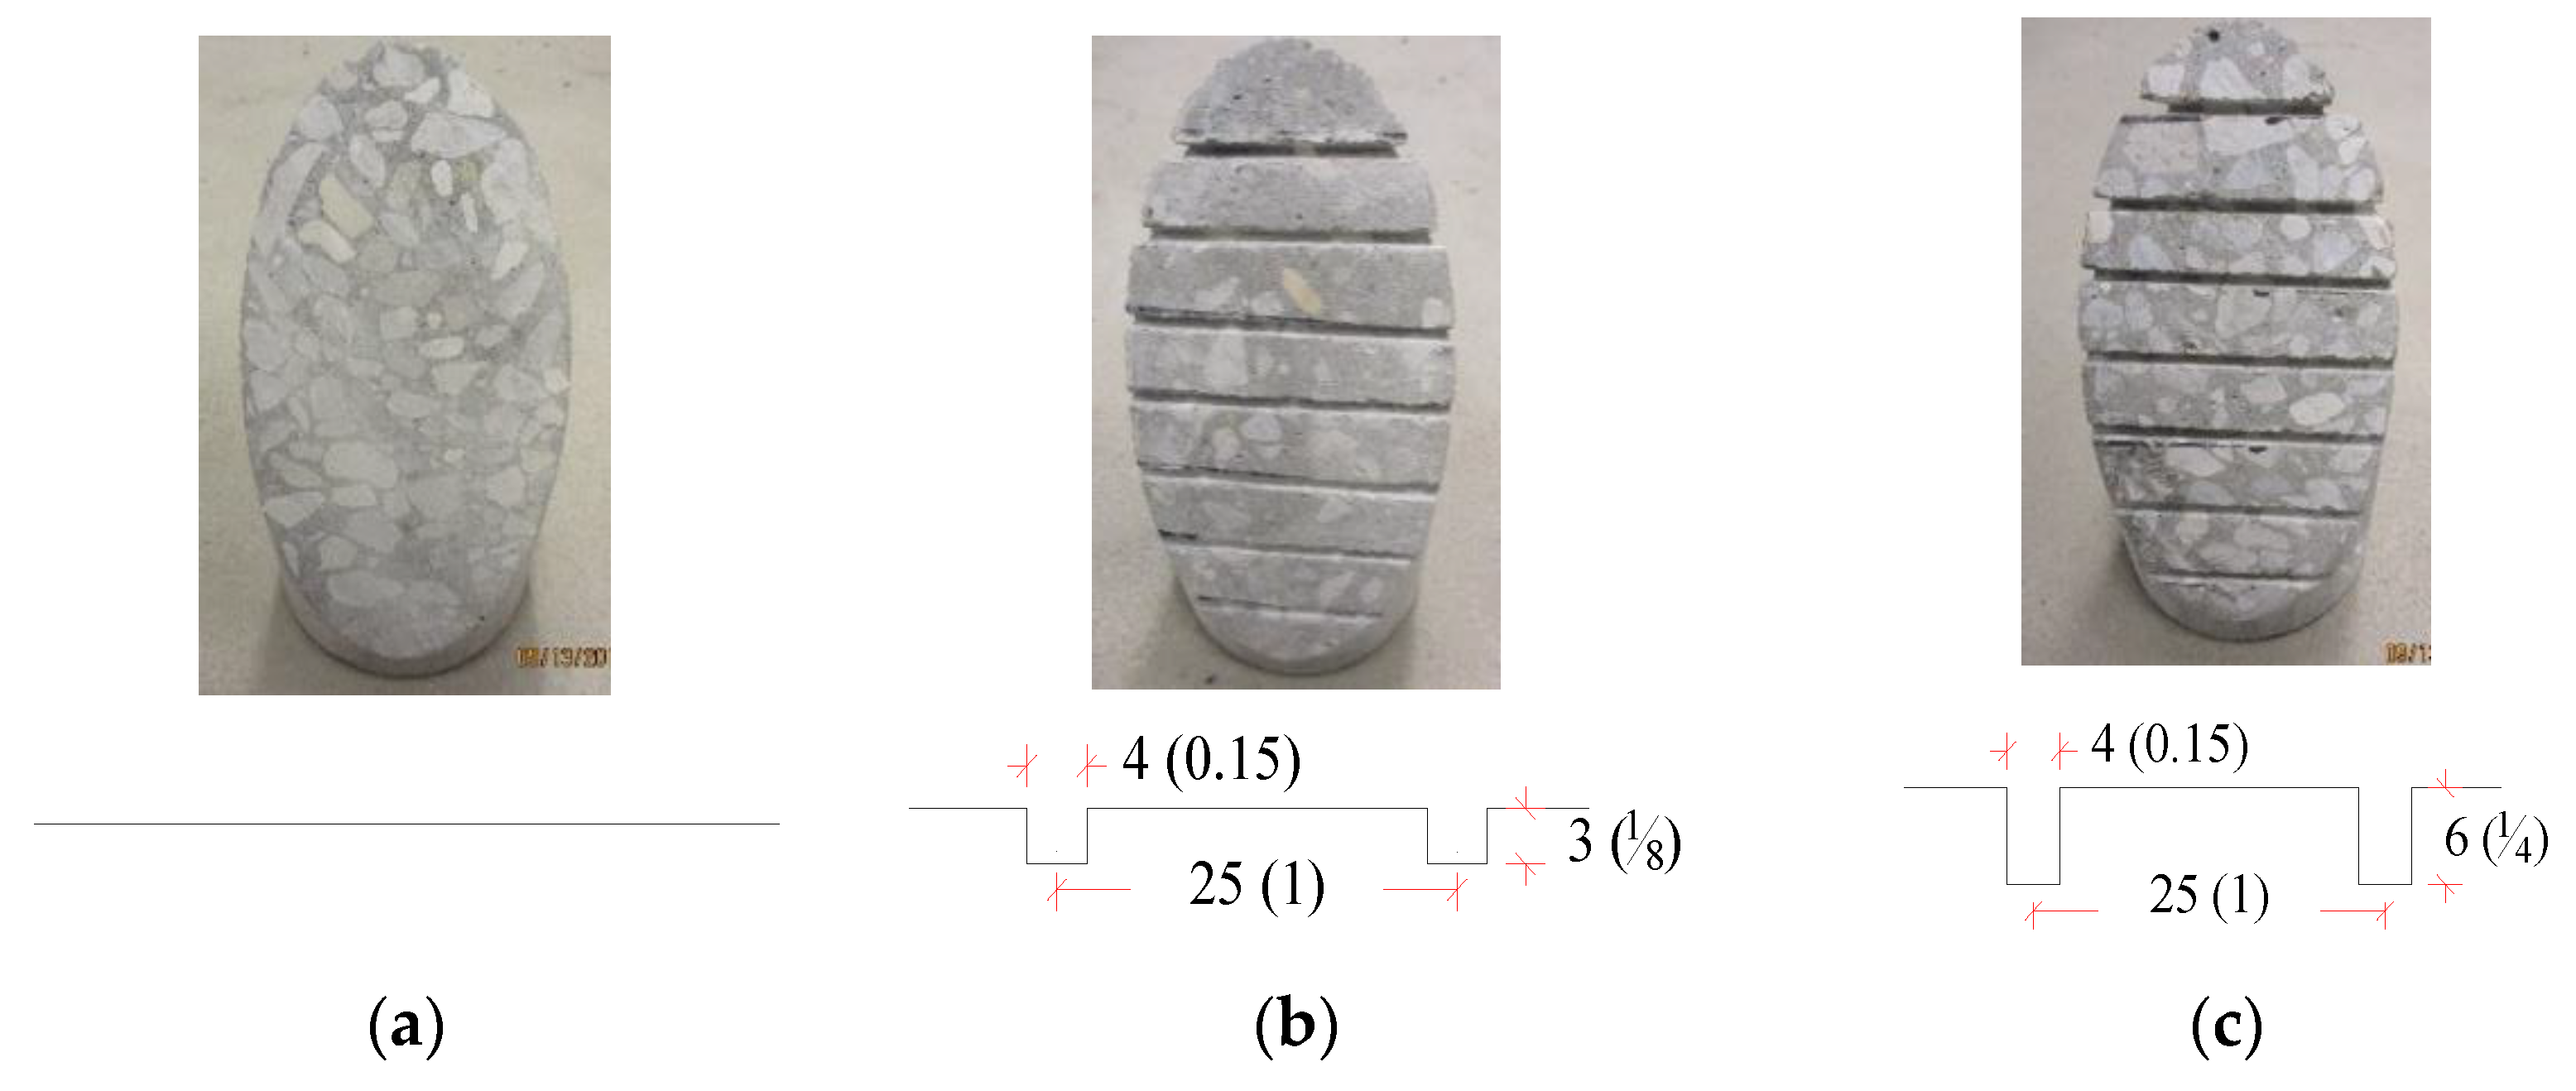
- All slant shear and L-shape shear specimens with surface roughening of 6 mm (1/4 in.) amplitude exhibited CC failure, while slant shear specimens with surface roughening of 3 mm (1/8 in.) amplitude exhibited failure in both CC and interface plane;
- The presence of fibers in UHPC does not have a significant effect on the interface shear resistance of CC–UHPC.
Author Contributions
Funding
Institutional Review Board Statement
Informed Consent Statement
Data Availability Statement
Acknowledgments
Conflicts of Interest
References
- ASTM C1856/C1856M-17; Standard Practice for Fabricating and Testing Specimens of Ultra-High-Performance Concrete. ASTM (American Society for Testing and Materials): West Conshohocken, PA, USA, 2017.
- Tadros, M.; Lawler, J.; Abo El-Khier, M.; Gee, D.; Kurt, A.; Lucier, G.; Wagner, E. Implementation of Ultra-High-Performance Concrete in Long-Span Precast Pretensioned Elements for Concrete Buildings and Bridges; PCI (Precast/Prestressed Concrete Institute): Chicago, IL, USA, 2021. [Google Scholar]
- Graybeal, B.A. Design and Construction of Field-Cast UHPC Connections; FHWA-HRT-14-084; FHWA: Washington, DC, USA, 2014. Available online: https://rosap.ntl.bts.gov/view/dot/28283 (accessed on 1 February 2023).
- Ng, K.; Garder, J.; Sritharan, S. Investigation of ultra high performance concrete piles for integral abutment bridges. Eng. Struct. 2015, 105, 220–230. [Google Scholar] [CrossRef]
- Honarvar, E.; Sritharan, S.; Rouse, J.M.; Aaleti, S. Bridge Decks with Precast UHPC Waffle Panels: A Field Evaluation and Design Optimization. J. Bridg. Eng. 2016, 21, 4015030. [Google Scholar] [CrossRef]
- Abo El-Khier, M.; Morcous, G. Precast concrete deck-to-girder connection using Ultra-High Performance Concrete (UHPC) shear pockets. Eng. Struct. 2021, 248, 113082. [Google Scholar] [CrossRef]
- ACI (American Concrete Institute) Committee 318. Building Code Requirements for Structural Concrete (ACI 318-19) and Commentary; ACI 318-19; ACI: Farmington Hills, MI, USA, 2019. [Google Scholar]
- AASHTO (American Association of State Highway and Transportation Officials). AASHTO LRFD Bridge Design Specifications, 9th ed.; AASHTO: Washington, DC, USA, 2020. [Google Scholar]
- British Standards Institution. Eurocode 2: Design of Concrete Structures—Part 1-1: General Rules and Rules for Buildings; BS EN 1992-1-1; CEN: London, UK, 2004. [Google Scholar]
- CSA (Canadian Standards Association). Design of Concrete Structures; CSA A23.3-14; CSA Group: Toronto, ON, Canada, 2014. [Google Scholar]
- AFNOR (Association Française de Normalization). National Addition to Eurocode 2–Design of Concrete Structures: Specific Rules for Ultra-High-Performance Fiber-Reinforced Concrete (UHPFRC); NF-P-18-710-UHPC; AFNOR: Paris, France, 2016; pp. 18–710. [Google Scholar]
- Birkeland, P.W.; Birkeland, H.W. Connections in precast concrete construction. ACI J. Proc. 1966, 63, 345–368. [Google Scholar]
- Hofbeck, J.A.; Ibrahim, I.O.; Mattock, A.H. Shear transfer in reinforced concrete. ACI J. Proc. 1969, 66, 119–128. [Google Scholar]
- Mattock, A.H.; Hawkins, N.M. Shear transfer in reinforced concrete—Recent research. PCI J. 1972, 17, 55–75. [Google Scholar] [CrossRef]
- Paulay, T.; Park, R.; Phillips, M.H. Horizontal construction joints in cast-in-place reinforced concrete. ACI Spec. Publ. 1974, 42, 599–616. [Google Scholar]
- Mattock, A.H.; Li, W.K.; Wang, T.C. Shear transfer in lightweight reinforced concrete. PCI J. 1976, 21, 20–39. [Google Scholar] [CrossRef]
- Wairaven, J.; Frenay, J.; Pruijssers, A. Influence of Concrete Strength and Load History on the Shear Friction Capacity of Concrete Members. PCI J. 1987, 32, 66–84. [Google Scholar] [CrossRef]
- Loov, R.E.; Patnaik, A.K. Horizontal Shear Strength of Composite Concrete Beams With a Rough Interface. PCI J. 1994, 39, 48–69. [Google Scholar] [CrossRef]
- Mattock, A.H. Shear friction and high-strength concrete. ACI Struct. J. 2001, 98, 50–59. [Google Scholar]
- ASTM C882/C882M-13a; Standard Test Method for Bond Strength of Epoxy-Resin Systems Used with Concrete by Slant Shear. ASTM (American Society for Testing and Materials): West Conshohocken, PA, USA, 2013.
- Harris, D.K.; Sarkar, J.; Ahlborn, T.M. Characterization of Interface Bond of Ultra-High-Performance Concrete Bridge Deck Overlays. Transp. Res. Rec. J. Transp. Res. Board 2011, 2240, 40–49. [Google Scholar] [CrossRef]
- Rangaraju, P.R.; Kizhakommudom, H.; Li, Z.; Schiff, S.D. Development of High-Strength/High Performance Concrete/Grout Mixtures for Application in Shear Keys in Precast Bridges; FHWA-SC-13-04a; FHWA: McLean, VA, USA, 2013.
- Tayeh, B.A.; Abu Bakar, B.; Johari, M.M.; Voo, Y.L. Mechanical and permeability properties of the interface between normal concrete substrate and ultra high performance fiber concrete overlay. Constr. Build. Mater. 2012, 36, 538–548. [Google Scholar] [CrossRef]
- Carbonell Muñoz, M.Á. Compatibility of Ultra-High-Performance Concrete as Repair Material: Bond Characterization with Concrete under Different Loading Scenarios. Master’s Thesis, Michigan Technological University, Houghton, MI, USA, 2012. Available online: https://digitalcommons.mtu.edu/etds/225 (accessed on 1 February 2023).
- Aaleti, S.; Sritharan, S. Investigation of a suitable shear friction interface between UHPC and normal strength concrete for bridge deck applications. Bridge 2017, 515, 294–8103. Available online: https://trid.trb.org/view/1470040 (accessed on 1 February 2023).
- Jang, H.-O.; Lee, H.-S.; Cho, K.; Kim, J. Experimental study on shear performance of plain construction joints integrated with ultra-high performance concrete (UHPC). Constr. Build. Mater. 2017, 152, 16–23. [Google Scholar] [CrossRef]
- Feng, S.; Xiao, H.; Liu, M.; Zhang, F.; Lu, M. Shear behavior of interface between normal-strength concrete and UHPC: Experiment and predictive model. Constr. Build. Mater. 2022, 342, 127919. [Google Scholar] [CrossRef]
- Banta, T.E. Horizontal Shear Transfer between Ultra High-Performance Concrete and By Horizontal Shear Transfer between Ultra High-Performance Concrete. Master’s Thesis, Virginia Polytechnic Institute and State University, Blacksburg, VA, USA, 2005. [Google Scholar]
- Crane, C.K. Shear and Shear Friction Of Ultra-High Performance Concrete Bridge Girders. Ph.D. Thesis, Georgia Institute of Technology, Atlanta, GA, USA, 2010. [Google Scholar]
- Graybeal, B.A.; Baby, F. Tension Testing of Ultra-High-Performance Concrete; FHWA-HRT-17-053; FHWA: Washington, DC, USA, 2019. Available online: https://rosap.ntl.bts.gov/view/dot/40091 (accessed on 1 February 2023).
- Abo El-Khier, M.; Morcous, G.; Hu, J. Interface Shear Resistance of Ultra-High Performance Concrete (UHPC). Int. Interact. Symp. Ultra-High Perform. Concr. 2019. [Google Scholar] [CrossRef]
- PCI (Precast/Prestressed Concrete Institute). PCI Design Handbook, 8th ed.; PCI: Chicago, IL, USA, 2017. [Google Scholar]


| Code | Interface Shear Resistance Prediction Equation | Interface Shear Upper Bound |
|---|---|---|
| ACI 318-19 (Section 22.9.4), MPa [7] | ||
| AASHTO LRFD 9th. Ed. (Section 5.7.4.3), MPa [8] | ||
| Eurocode 2 (Section 6.2.5), MPa [9] | ||
| CSA A23.3-14 (Section 11.5), MPa [10] |
| Interface Type | Smooth | Low-Roughened Surface (an Amplitude of at Least 3 mm (0.12 in.)) | High-Roughened Surface (an Amplitude 6 mm (0.25 in.)) | |||
|---|---|---|---|---|---|---|
| c, MPa (ksi) | µ | c, MPa (ksi) | µ | c, MPa (ksi) | µ | |
| ACI 318-19 (Section 22.9.4) [7] | - | 0.6 | - | 0.6 | - | 1 |
| AASHTO LRFD 9th Ed. (Section 5.7.4.3) [8] | 0.52 (0.075) | 0.6 | 0.52 (0.075) | 0.6 | 1.93 (0.28) * 1.65 (0.24) | 1 |
| Eurocode 2 (Section 6.2.5) [9] | 0.20 fctd ** | 0.6 | 0.40 fctd ** | 0.7 | 0.50 fctd ** | 0.9 |
| CSA A23.3-14 (Section 11.5) [10] | 0.25 (0.036) | 0.6 | 0.25 (0.036) | 0.6 | 0.5 (0.073) | 1 |
| Mechanical Property | Standard | Specimen Type | Specimen Dimension, mm (in.) | Value, MPa (ksi) |
|---|---|---|---|---|
| Compressive strength | ASTM C1856 [1] | Cylinder | 76 × 152 (3x6) | 161 (23.3) |
| Modulus of elasticity | ASTM C469/C469M | Cylinder | 102 × 203 (4 × 8) | 56,300 (8170) |
| Peak flexural strength | ASTM C1609/C1609M | Prism | 76 × 76 × 346 (3 × 3 × 14) | 28 (4.05) |
| Splitting tensile strength | ASTM C496 | Cylinder | 102 × 203 (4 × 8) | 16.6 (2.4) |
| Direct tensile strength | FHWA-HRT-17-053 [30] | Prism | 51 × 51 × 610 (2 × 2 × 24) | 11.9 (1.73) |
| Material | Cement (Type 1PF) | Sand | Coarse Aggregate * | Water | HRWR ** | AE *** |
|---|---|---|---|---|---|---|
| Unit Weight, kg/m3 (Ib/cy) | 453 (763) | 760 (1280) | 855 (1440) | 165 (278) | 10 (5.93) | 0.08 (0.13) |
| Interface Surface Texture | Interface Area, Acv mm2 (in.2) | Interface Reinforcement | Interface Reinforcement Ratio, ρ= Avf /Acv (%) | Label | CC Compressive Strength (MPa(ksi)) | UHPC Compressive Strength (MPa(ksi)) |
|---|---|---|---|---|---|---|
| Deep-grooved (>6 mm (1/4 in.) depth) | 32,258 (50) | None | 0.0 | CC–UHPC-G-0% | 45.5 (6.60) | 144.0 (20.84) |
| 2-Leg No. 10 (#3) Stirrup | 0.44 | CC–UHPC-G-0.44% | ||||
| 2-Leg No. 13 (#4) Stirrup | 0.80 | CC–UHPC-G-0.8% | ||||
| As-Cast Shear Key (19 mm (3/4 in.) deep) | 2-Leg #3 Stirrup | 0.44 | CC–UHPC-K-0.44% | 115 (16.71) | ||
| Shear Key with Aggregate Exposed (19 mm (3/4 in.) deep) | 2-Leg #3 Stirrup | 0.44 | CC–UHPC-E-0.44% |
| Specimen Label | Maximum Shear Stress (MPa (ksi)) | Average Shear Stress (MPa (ksi)) | Standard Dev. (MPa (ksi)) | Failure Location |
|---|---|---|---|---|
| CC–UHPC-G-0% #1 | 5.66 (0.82) | 5.79 (0.84) | 0.93 (0.13) | CC |
| CC–UHPC-G-0% #2 | 6.78 (0.98) | |||
| CC–UHPC-G-0% #3 | 4.94 (0.72) | |||
| CC–UHPC-G-0.44% #1 | 9.25 (1.34) | 8.25 (1.20) | 1.04 (0.15) | CC |
| CC–UHPC-G-0.44% #2 | 7.18 (1.04) | |||
| CC–UHPC-G-0.44% #3 | 8.32 (1.21) | |||
| CC–UHPC-G-0.8% #1 | 9.12 (1.32) | 8.78 (1.27) | 0.31 (0.04) | CC |
| CC–UHPC-G-0.8% #2 | 8.67 (1.26) | |||
| CC–UHPC-G-0.8% #3 | 8.53 (1.24) | |||
| CC–UHPC-K-0.44% #1 | 5.52 (0.80) | 5.65 (0.82) | 0.25 (0.04) | Interface |
| CC–UHPC-K-0.44% #2 | 6.00 (0.87) | |||
| CC–UHPC-K-0.44% #3 | 5.58 (0.81) | |||
| CC–UHPC-E-0.44% #1 | 7.93 (1.15) | 7.79 (1.13) | 0.22 (0.03) | Interface |
| CC–UHPC-E-0.44% #2 | 7.52 (1.09) | |||
| CC–UHPC-E-0.44% #3 | 7.93 (1.15) |
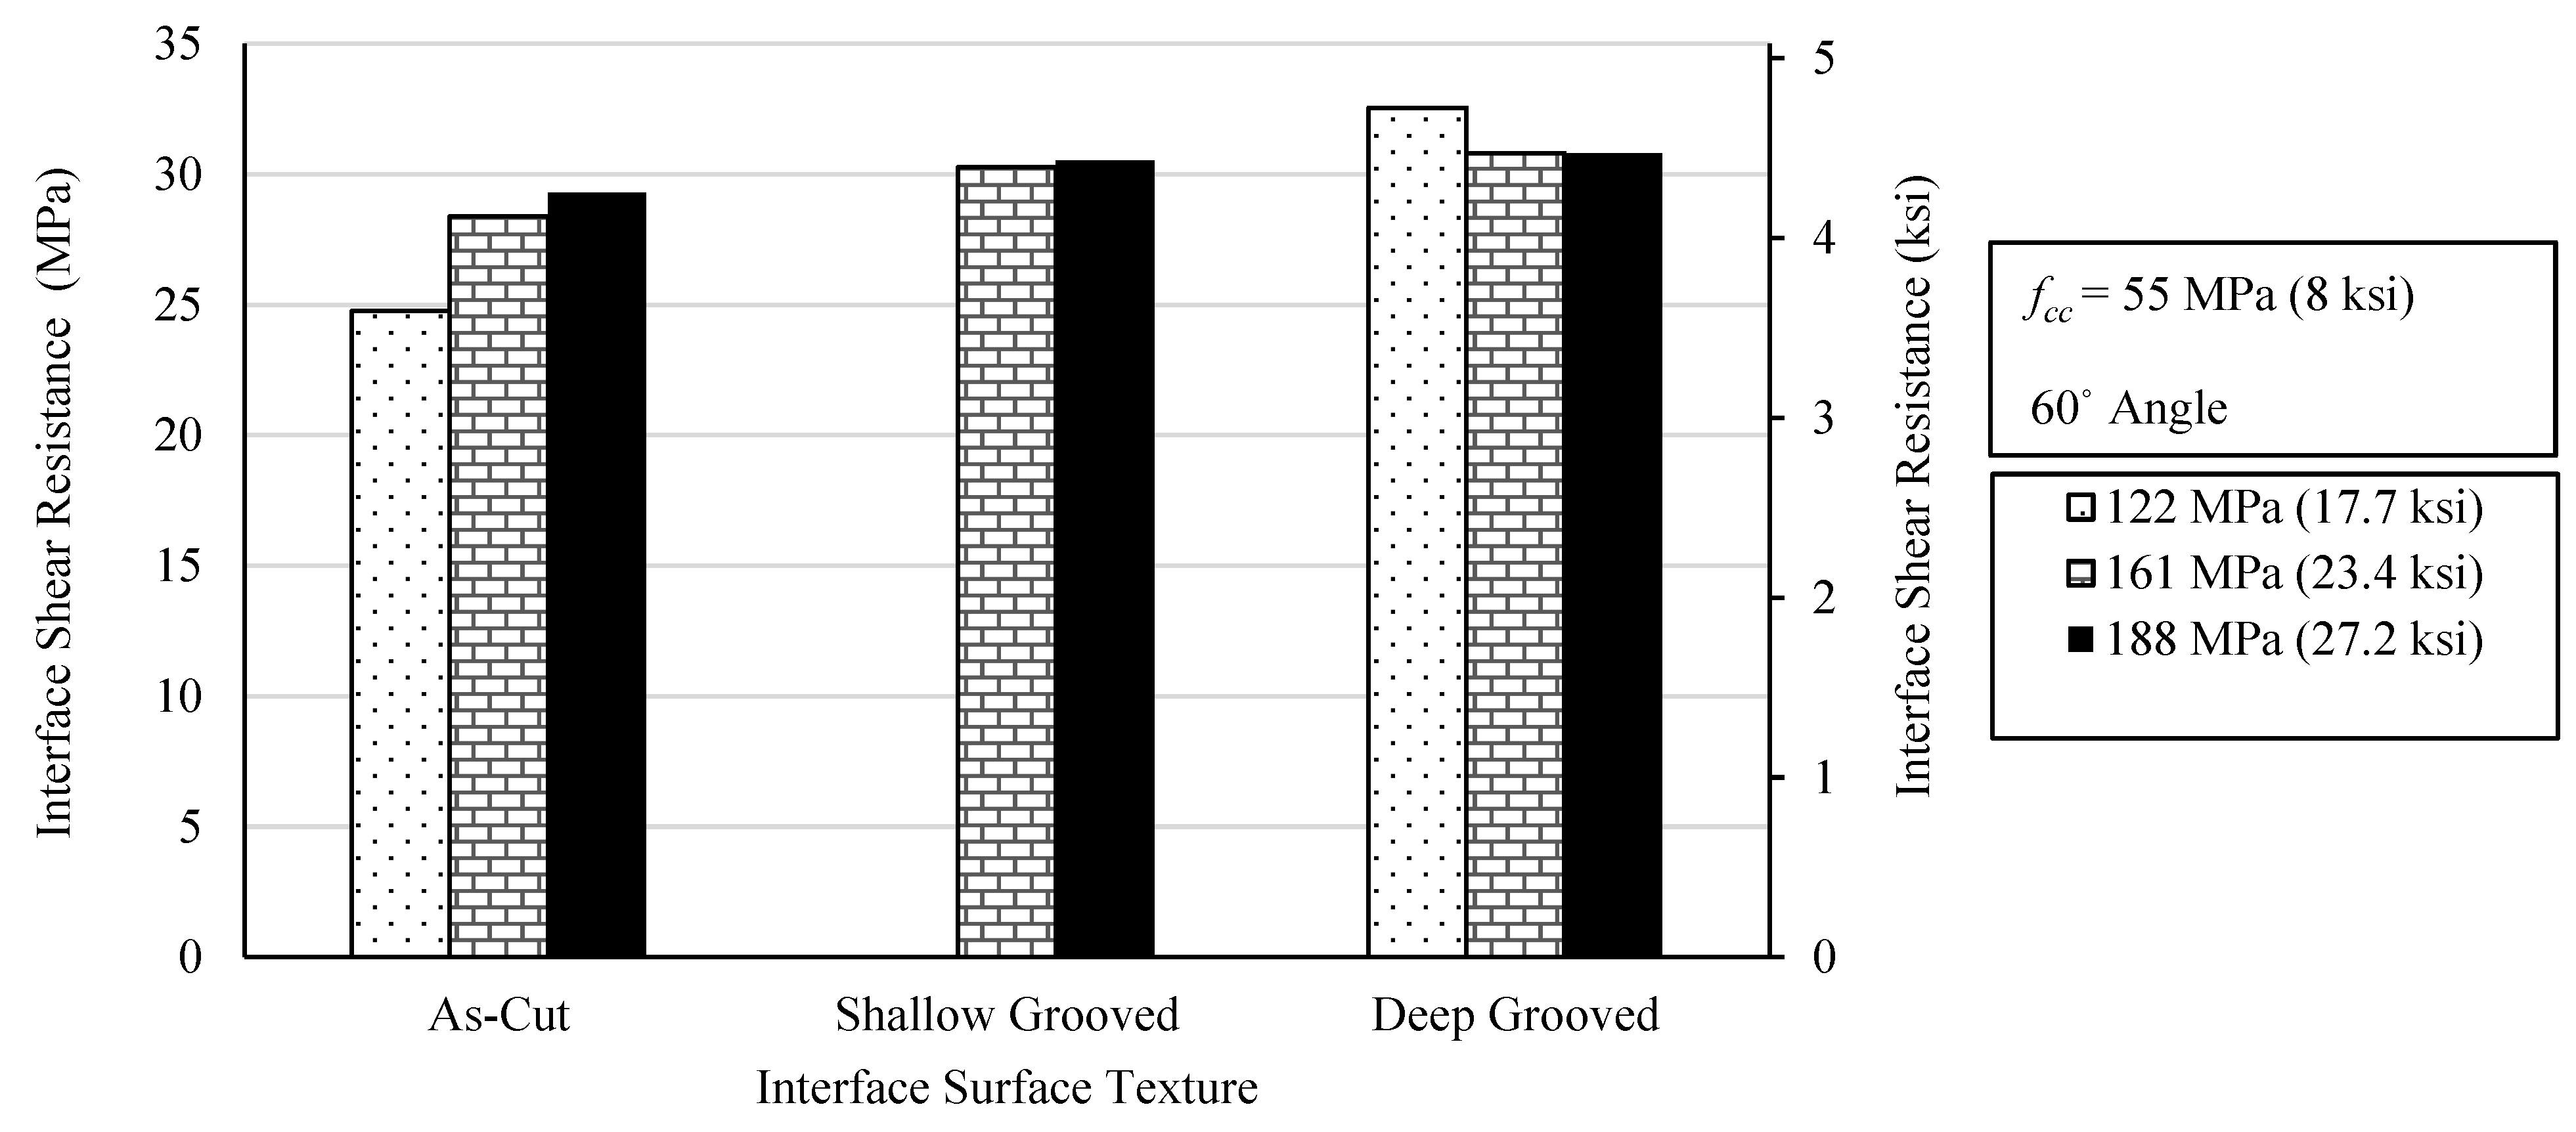
| Interface Surface Texture of Hardened CC | fUHPC = 122 MPa (17.7 ksi) | fUHPC = 161 MPa (23.4 ksi) | fUHPC = 188 MPa (27.2 ksi) | |||
|---|---|---|---|---|---|---|
| vni, MPa (ksi) | Failure Location | vni, MPa (ksi) | Failure Location | vni, MPa (ksi) | Failure Location | |
| As-Cut | 23.5 (3.4) | Interface | 29.4 (4.3) | Interface | 28.4 (4.1) | Interface |
| 27.0 (3.9) | Interface | 28.6 (4.2) | Interface | 29.2 (4.3) | Interface | |
| 23.9 (3.5) | Interface | 27.1 (3.9) | Interface | 30.3 (4.4) | Interface | |
| Average | 24.7 (3.6) | 28.4 (4.1) | 29.3 (4.3) | |||
| COV% | 7.75 | 4.08 | 3.32 | |||
| Shallow-Grooved | - | - | 32.0 (4.7) | Interface & CC | 30.6 (4.4) | Interface & CC |
| - | - | 28.7 (4.2) | Interface & CC | 32.3 (4.7) | Interface & CC | |
| - | - | 30.1 (4.4) | CC | 28.6 (4.2) | CC | |
| Average | - | 30.3 (4.4) | 30.5 (4.4) | |||
| COV% | - | 5.50 | 6.05 | |||
| Deep-Grooved | 30.7 (4.7) | CC | 31.5 (4.6) | CC | 30.8 (4.5) | CC |
| 33.6 (4.9) | CC | 29.6 (4.3) | CC | 32.3 (4.7) | CC | |
| 33.4 (4.8) | CC | 31.3 (4.5) | CC | 29.3 (4.3) | Interface& CC | |
| Average | 32.6 (4.7) | 30.8 (4.5) | 30.8 (4.5) | |||
| COV% | 4.94 | 3.31 | 4.85 | |||
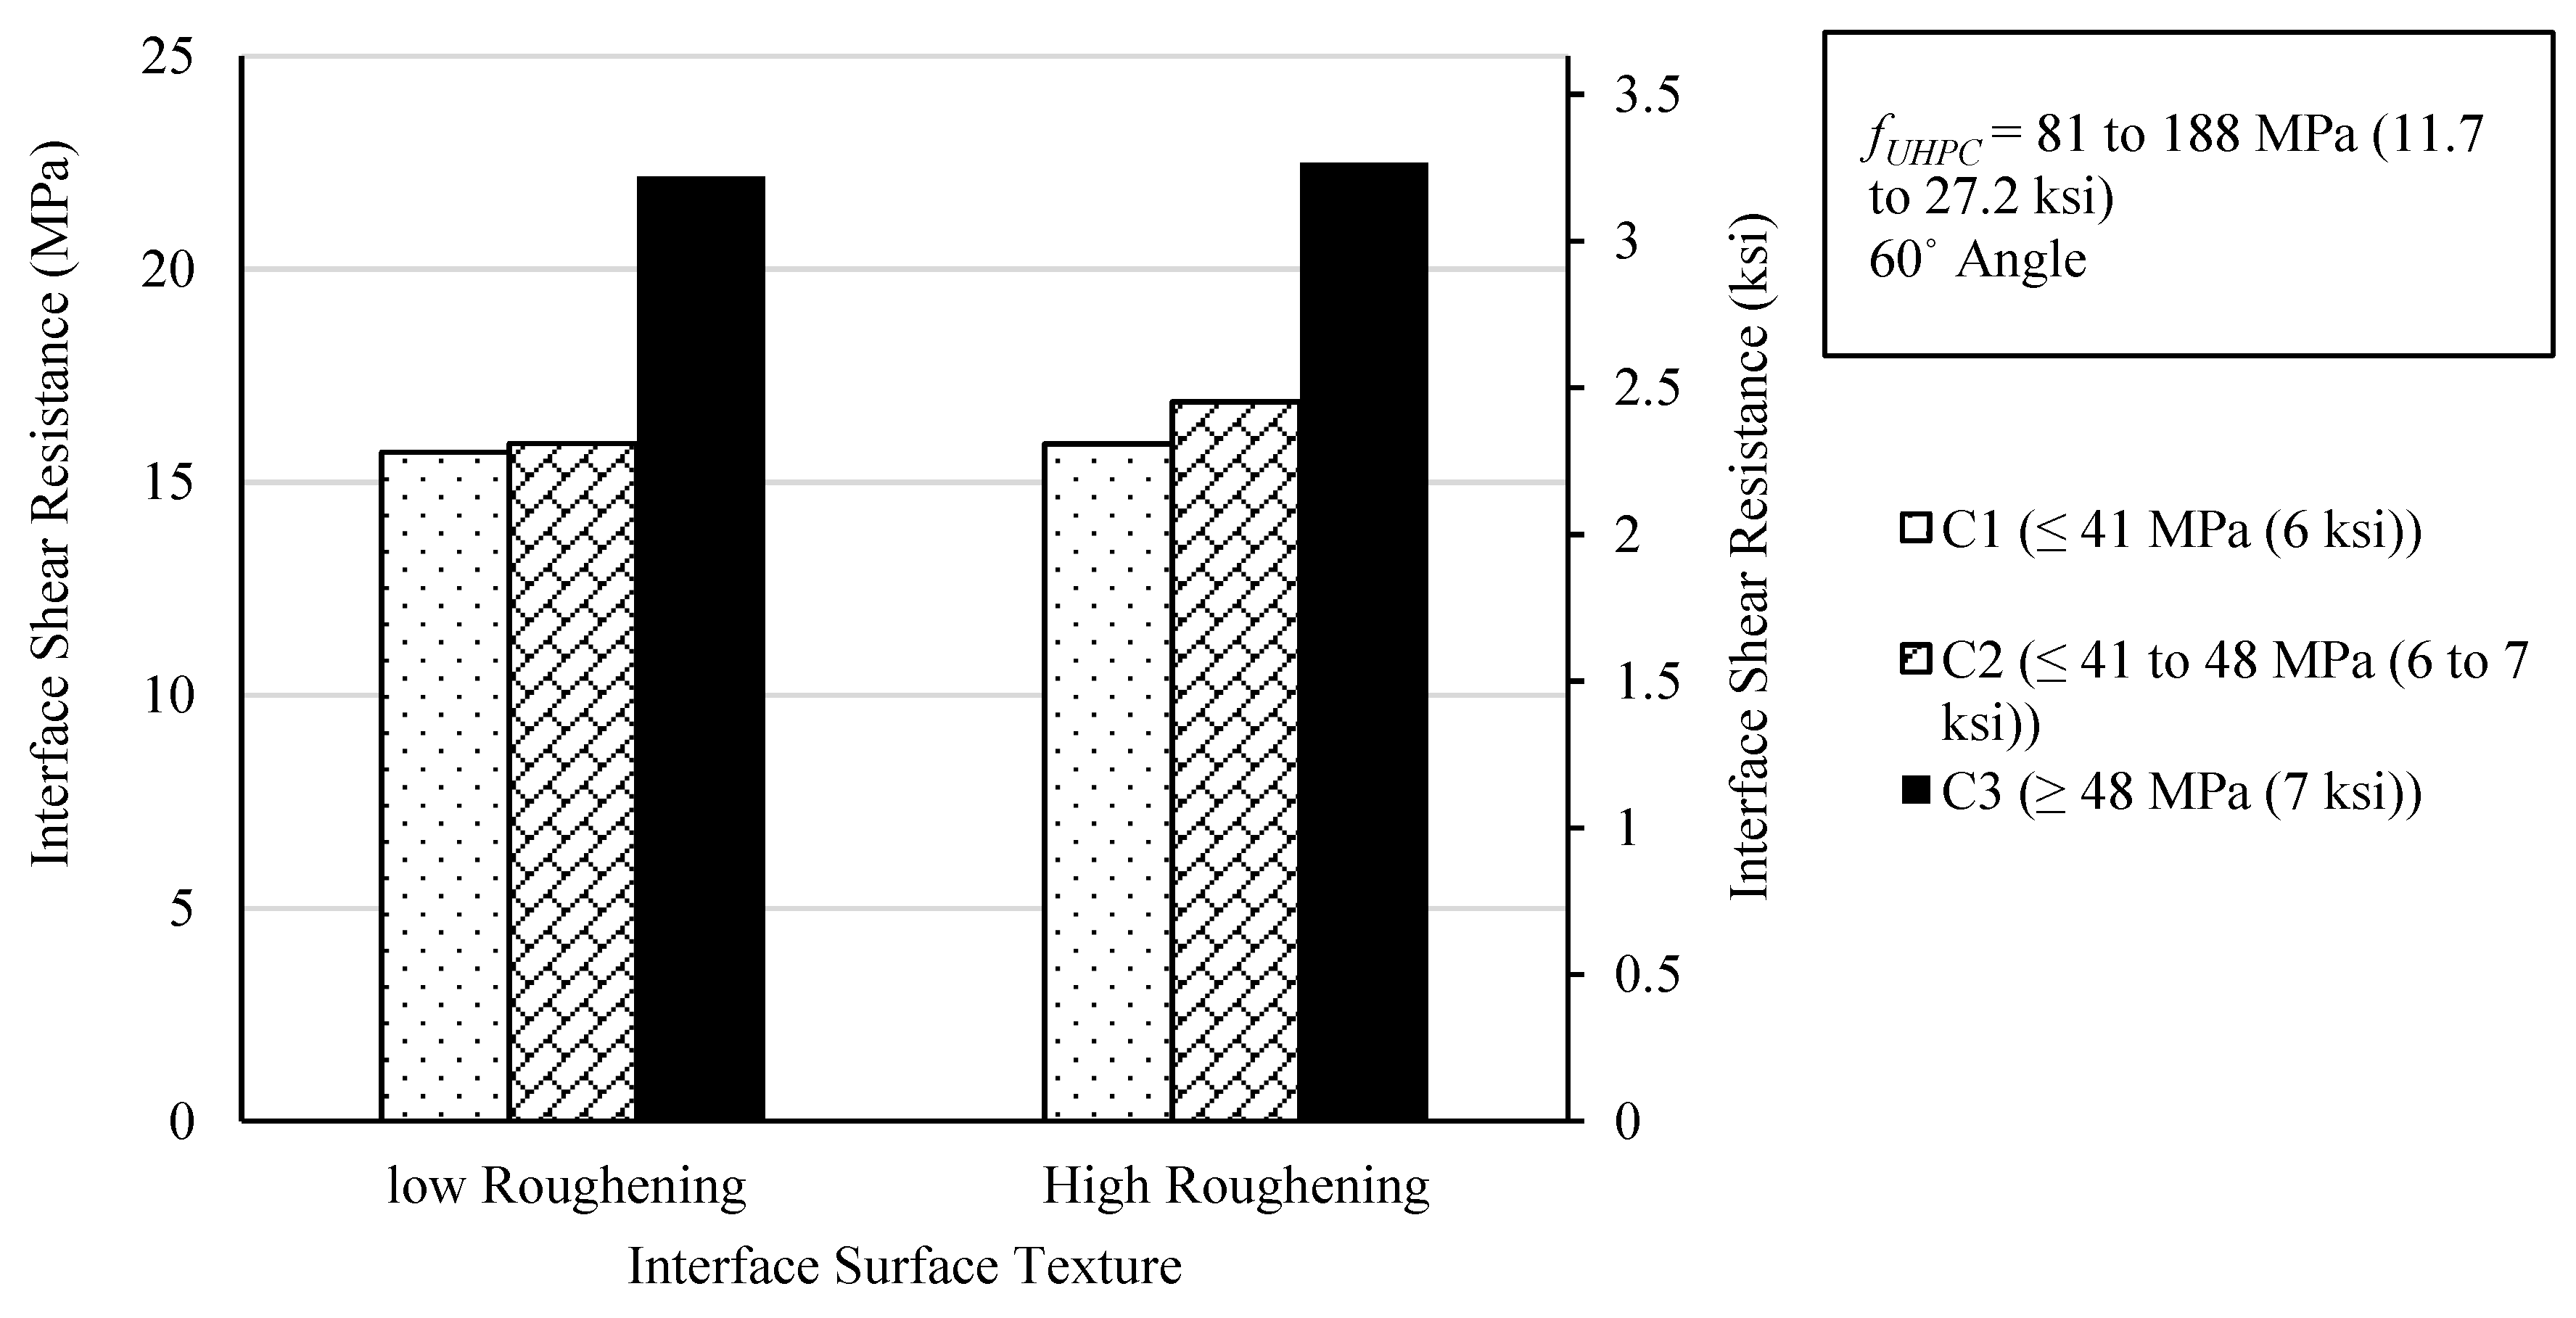
| Surface Texture Category | Reference | Surface Preparation | fcc (MPa) | fUHPC (MPa) | vni (MPa) | σn (MPa) | Failure Location |
|---|---|---|---|---|---|---|---|
| Low-Roughened Surface | Harris et al., 2011 [21] | Wire-Brushed | 34 | 103 | 12.53 | 7.23 | Interface & Mortar |
| Carbonell Muñoz 2012 [24] | Brushed | 45 | 105 | 16.12 | 9.34 | CC | |
| 45 | 105 | 12.13 | 4.23 | Interface | |||
| 57 | 85 | 17.85 | 12.80 | CC | |||
| 56 | 81 | 15.30 | 8.41 | CC | |||
| 56 | 81 | 5.71 | 4.28 | UHPC | |||
| 46 | 81 | 5.18 | 3.71 | UHPC | |||
| Tayeh et al., 2012 [23] * | Wire-Brushed | 45 | 170 | 11.04 | 6.37 | Interface & CC | |
| 45 | 83 | 9.90 | 5.71 | Interface & CC | |||
| 45 | 83 | 10.06 | 5.82 | Interface & CC | |||
| Aaleti and Sritharan 2017 [25] ** | Form Liner (1.59 mm deep ribs) | 36 | 124 | 15.78 | 11.85 | Interface | |
| 51 | 124 | 25.06 | 18.81 | CC | |||
| 44 | 124 | 21.79 | 16.36 | Interface | |||
| Form Liner (1.26 mm deep broom finish) | 36 | 124 | 12.88 | 9.67 | Interface | ||
| 51 | 124 | 21.86 | 16.41 | Interface | |||
| 44 | 124 | 17.87 | 13.42 | Interface | |||
| Form Liner (3 mm deep linear pattern) | 36 | 124 | 18.67 | 14.02 | CC | ||
| 51 | 124 | 26.53 | 19.92 | CC | |||
| 44 | 124 | 20.50 | 15.40 | Interface | |||
| High-Roughened Surface | Harris et al., 2011 [21] | Grooved | 34 | 103 | 14.95 | 8.61 | Mortar |
| Carbonell Muñoz 2012 [24] | Grooved | 45 | 105 | 17.57 | 10.00 | CC | |
| 45 | 105 | 11.23 | 4.33 | CC | |||
| 56 | 78 | 9.51 | 3.09 | Interface & CC | |||
| Roughened (Aggregate Exposed) | 46 | 123 | 17.02 | 9.37 | CC | ||
| 46 | 123 | 12.20 | 4.26 | CC | |||
| 50 | 85 | 16.74 | 12.02 | CC | |||
| 50 | 85 | 9.65 | 3.83 | CC | |||
| Tayeh et al., 2012 * [23] | Grooved | 45 | 170 | 12.05 | 6.96 | CC | |
| 45 | 83 | 12.02 | 6.94 | Interface & CC | |||
| 45 | 83 | 12.00 | 6.93 | Interface & CC | |||
| Aaleti and Sritharan 2017 [25] ** | Form Liner (6.5 mm deep fluted ribs) | 36 | 124 | 16.03 | 12.04 | CC | |
| 51 | 124 | 25.96 | 19.49 | CC | |||
| 44 | 124 | 24.69 | 18.54 | CC | |||
| Form Liner (5 mm deep round flutes) | 36 | 124 | 16.74 | 12.57 | CC | ||
| 51 | 124 | 24.53 | 18.42 | CC | |||
| 44 | 124 | 28.64 | 21.50 | CC |
| Code Provisions | c, MPa (ksi) | µ | µfyρ, MPa (ksi) | Avf, mm2/m (in.2/ft) | Spacing of 2 No. 13 (#4) (cm (in.)) ** |
|---|---|---|---|---|---|
| Proposed Model | 3.45 (0.50) | 1.0 | - | 270 (0.13) * | 61 (24) |
| ACI 318-19 (Section 22.9.4) | - | 1.0 | 2.55 (0.37) | 1656 (0.78) | 15 (5.9) |
| AASHTO LRFD (Section 5.7.4.3) | 1.65 (0.24) | 1.0 | 0.90 (0.13) | 583 (0.28) | 44 (17.3) |
| Eurocode 2 (Section 6.2.5) | 0.73 (0.11) | 0.9 | 1.81 (0.26) | 1310 (0.62) | 19 (7.5) |
| CSA A23.3-14 (Section 11.5) | 0.5 (0.07) | 1.0 | 2.05 (0.30) | 1331 (0.63) | 19 (7.5) |
Disclaimer/Publisher’s Note: The statements, opinions and data contained in all publications are solely those of the individual author(s) and contributor(s) and not of MDPI and/or the editor(s). MDPI and/or the editor(s) disclaim responsibility for any injury to people or property resulting from any ideas, methods, instructions or products referred to in the content. |
© 2023 by the authors. Licensee MDPI, Basel, Switzerland. This article is an open access article distributed under the terms and conditions of the Creative Commons Attribution (CC BY) license (https://creativecommons.org/licenses/by/4.0/).
Share and Cite
Abo El-Khier, M.; Morcous, G. Friction and Cohesion Interface Shear Factors of Ultra-High-Performance Concrete (UHPC) Cast on Hardened Conventional Concrete. Buildings 2023, 13, 1253. https://doi.org/10.3390/buildings13051253
Abo El-Khier M, Morcous G. Friction and Cohesion Interface Shear Factors of Ultra-High-Performance Concrete (UHPC) Cast on Hardened Conventional Concrete. Buildings. 2023; 13(5):1253. https://doi.org/10.3390/buildings13051253
Chicago/Turabian StyleAbo El-Khier, Mostafa, and George Morcous. 2023. "Friction and Cohesion Interface Shear Factors of Ultra-High-Performance Concrete (UHPC) Cast on Hardened Conventional Concrete" Buildings 13, no. 5: 1253. https://doi.org/10.3390/buildings13051253