

Laboratory Test Study on Pile Jacking Penetration Mechanism Considering Different Diameter and Length Based on Photoelectric Integration Technology
Abstract
:1. Introduction
2. Test Preparation
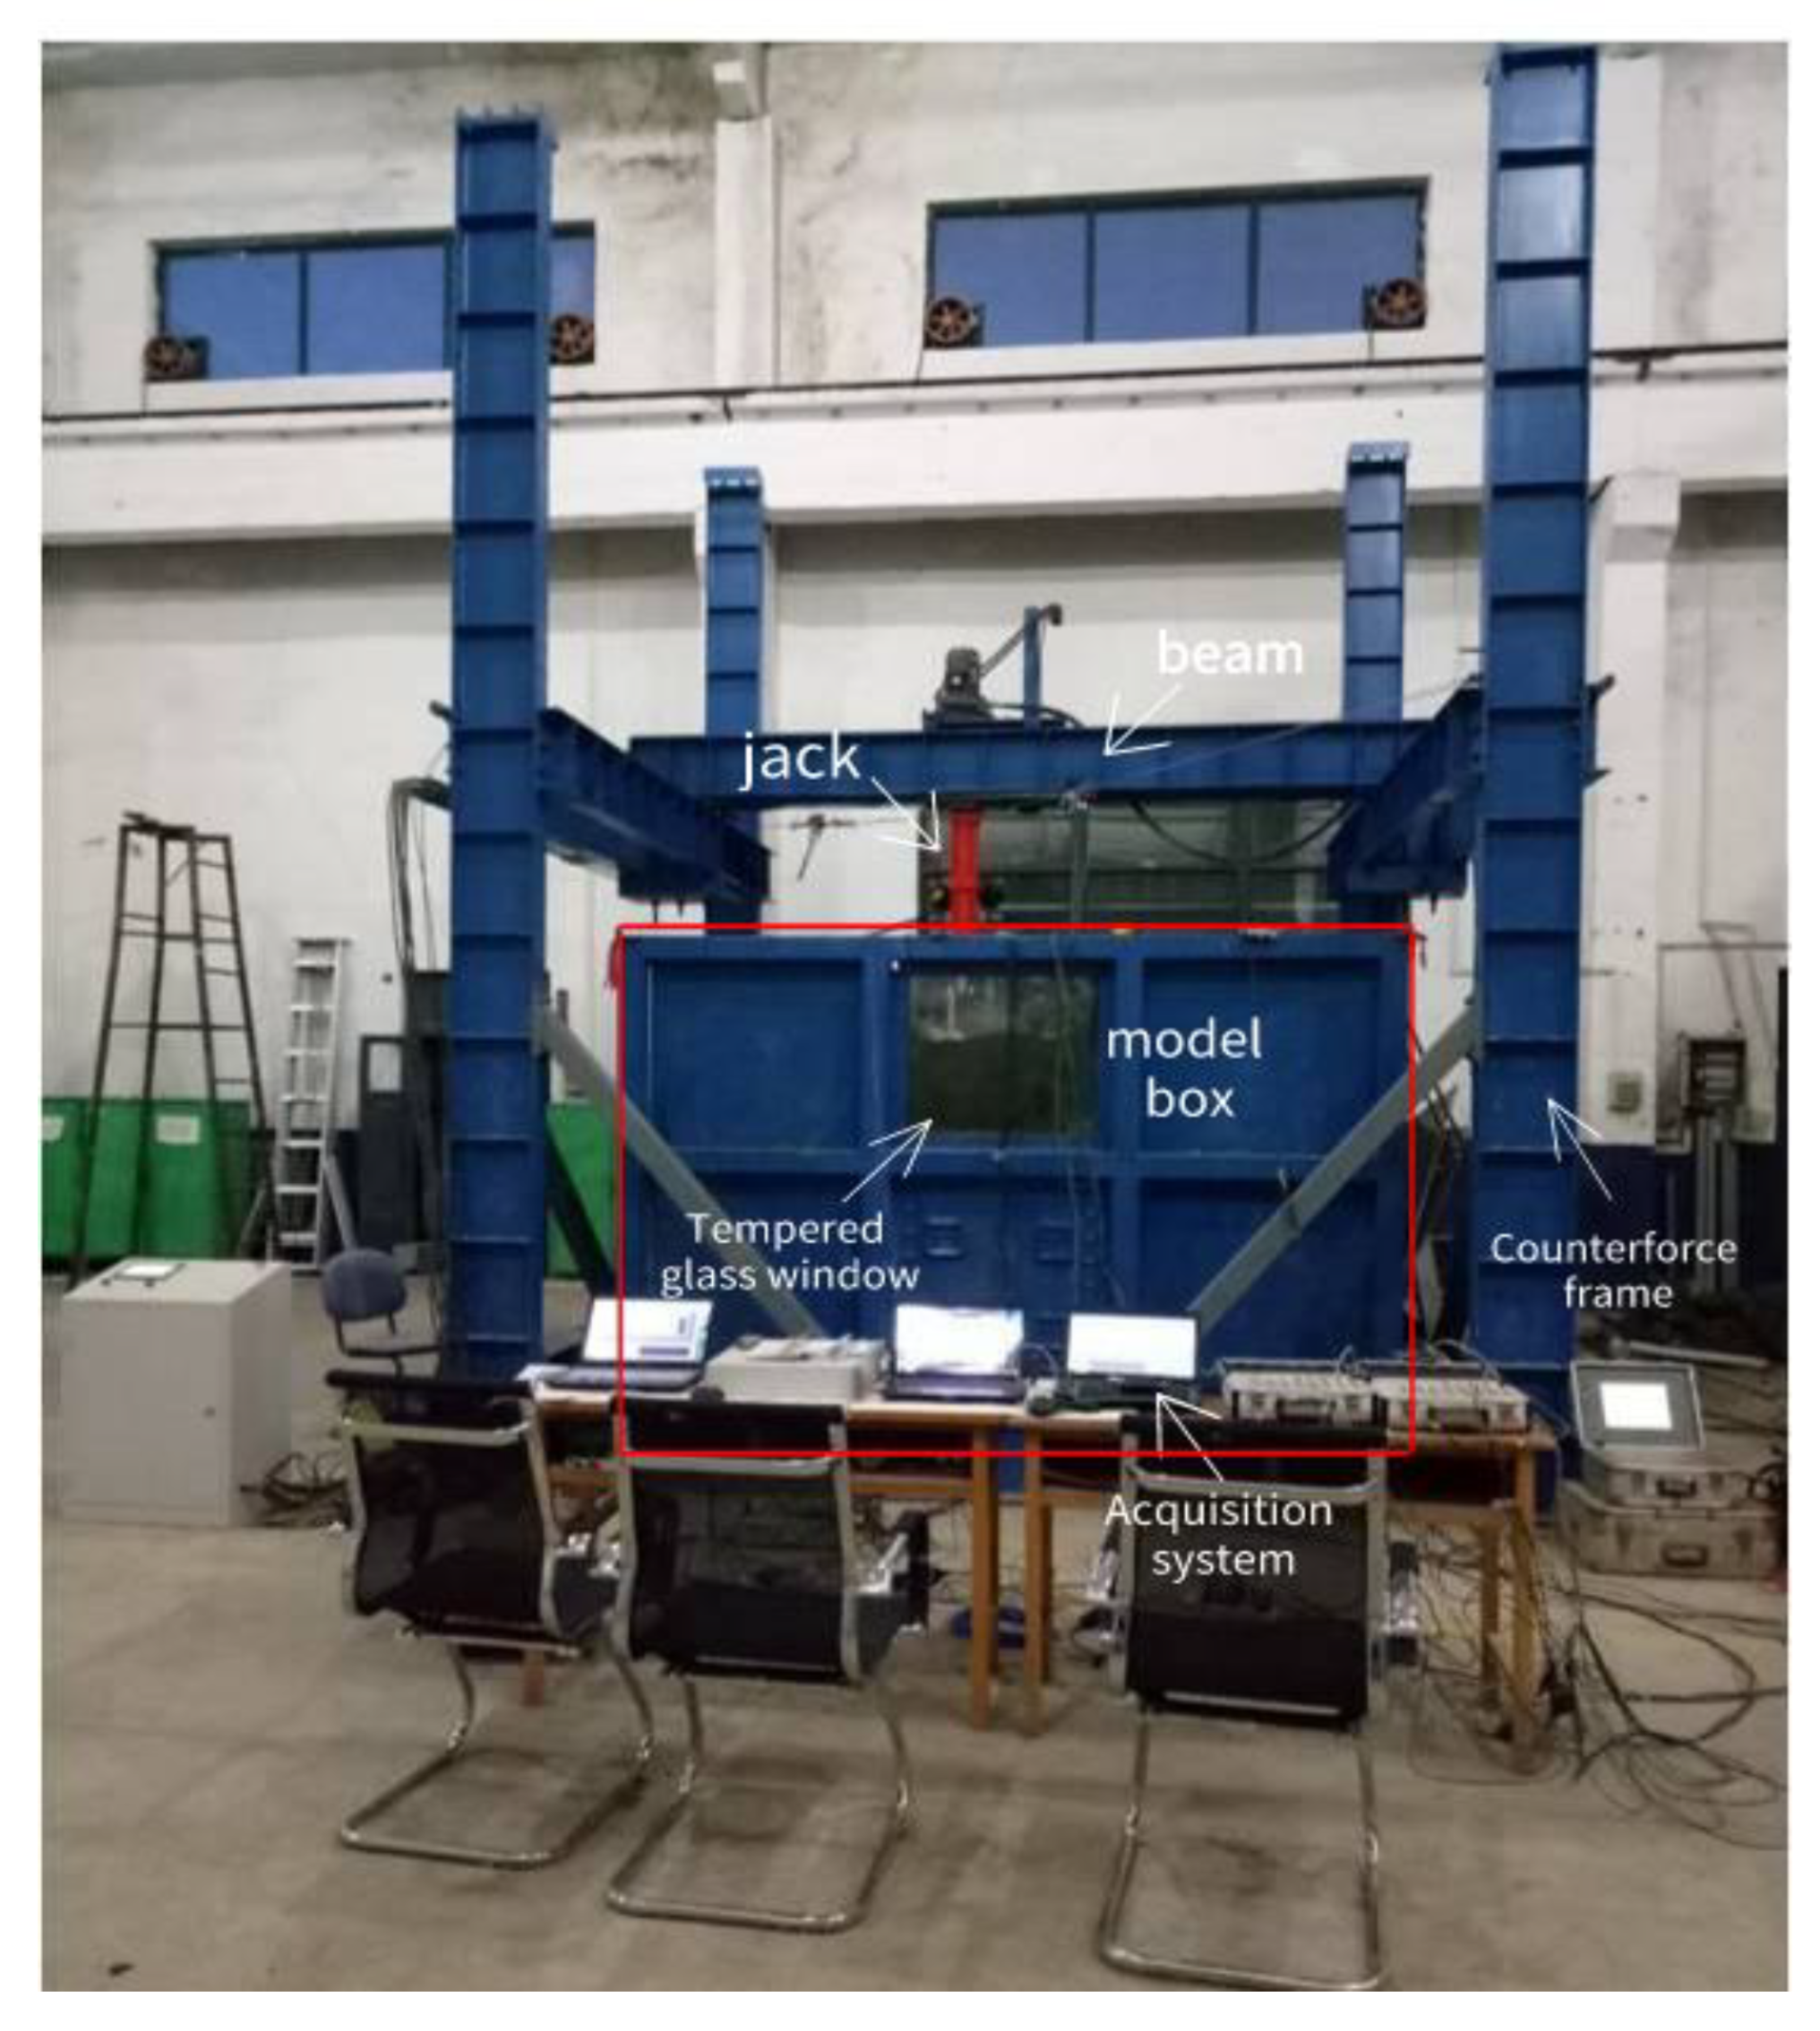
2.1. Test System
2.2. Test Soil Samples
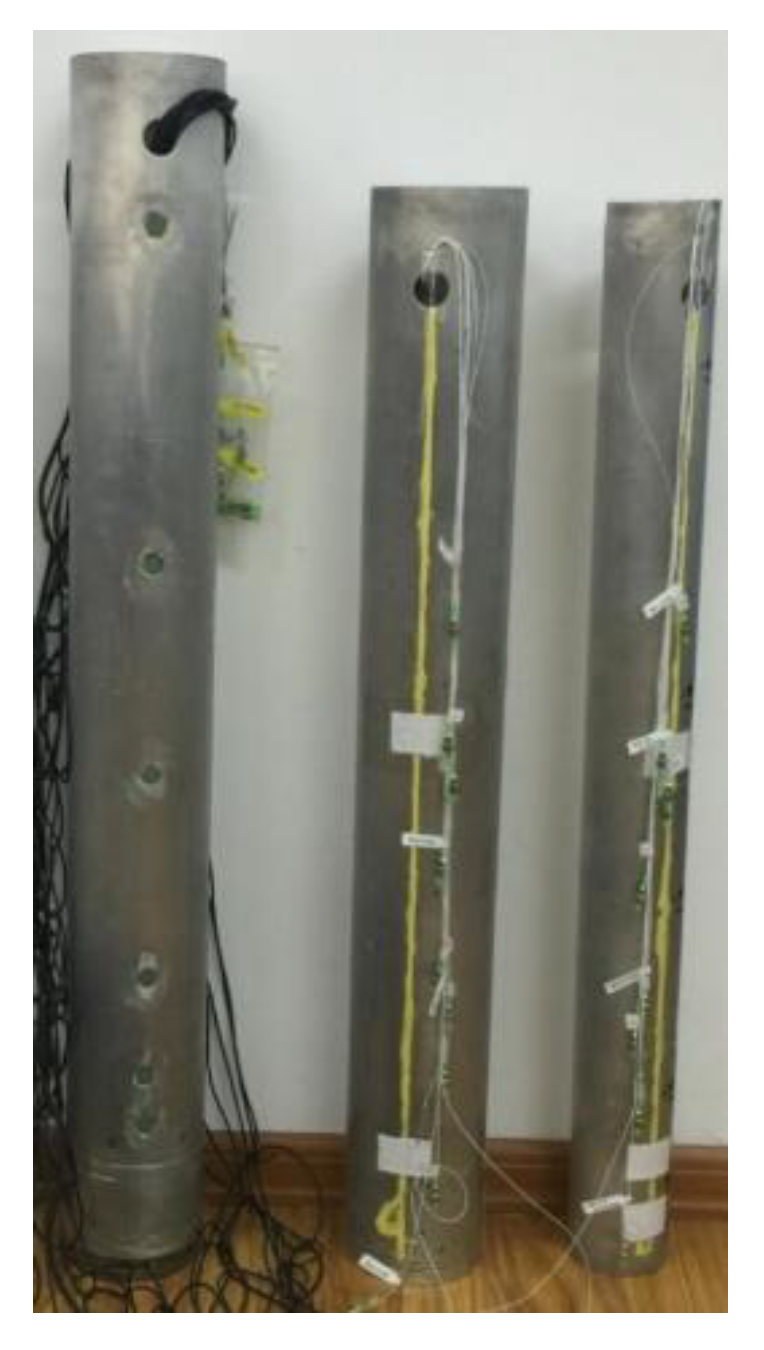
2.3. Introduction of Model Pile
3. Introduction of Model Sensor
3.1. Sensitized Microfiber Sensing
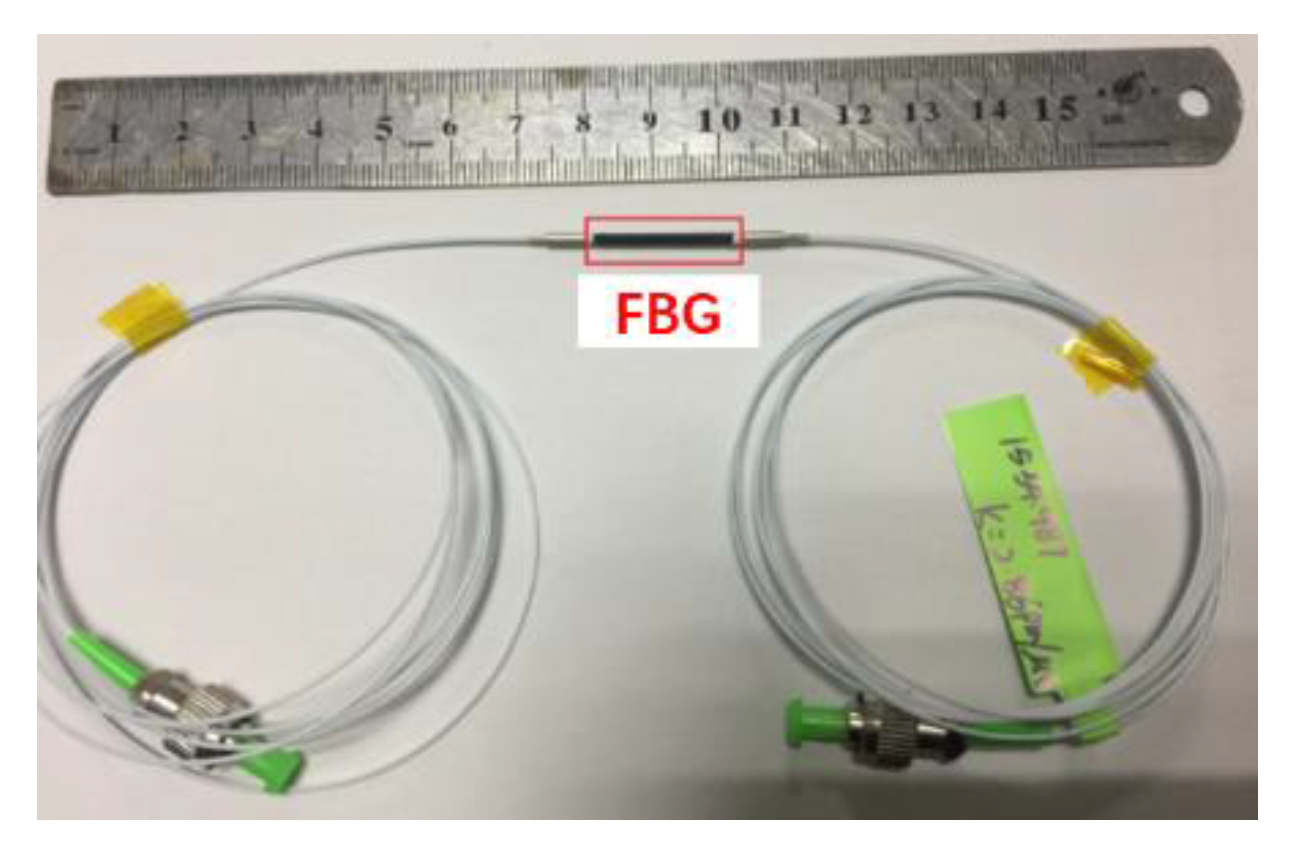
3.2. FBG Fiber-Optic Sensing Principle
3.3. Deployment of Fiber-Optic Grating Sensors
- (1)
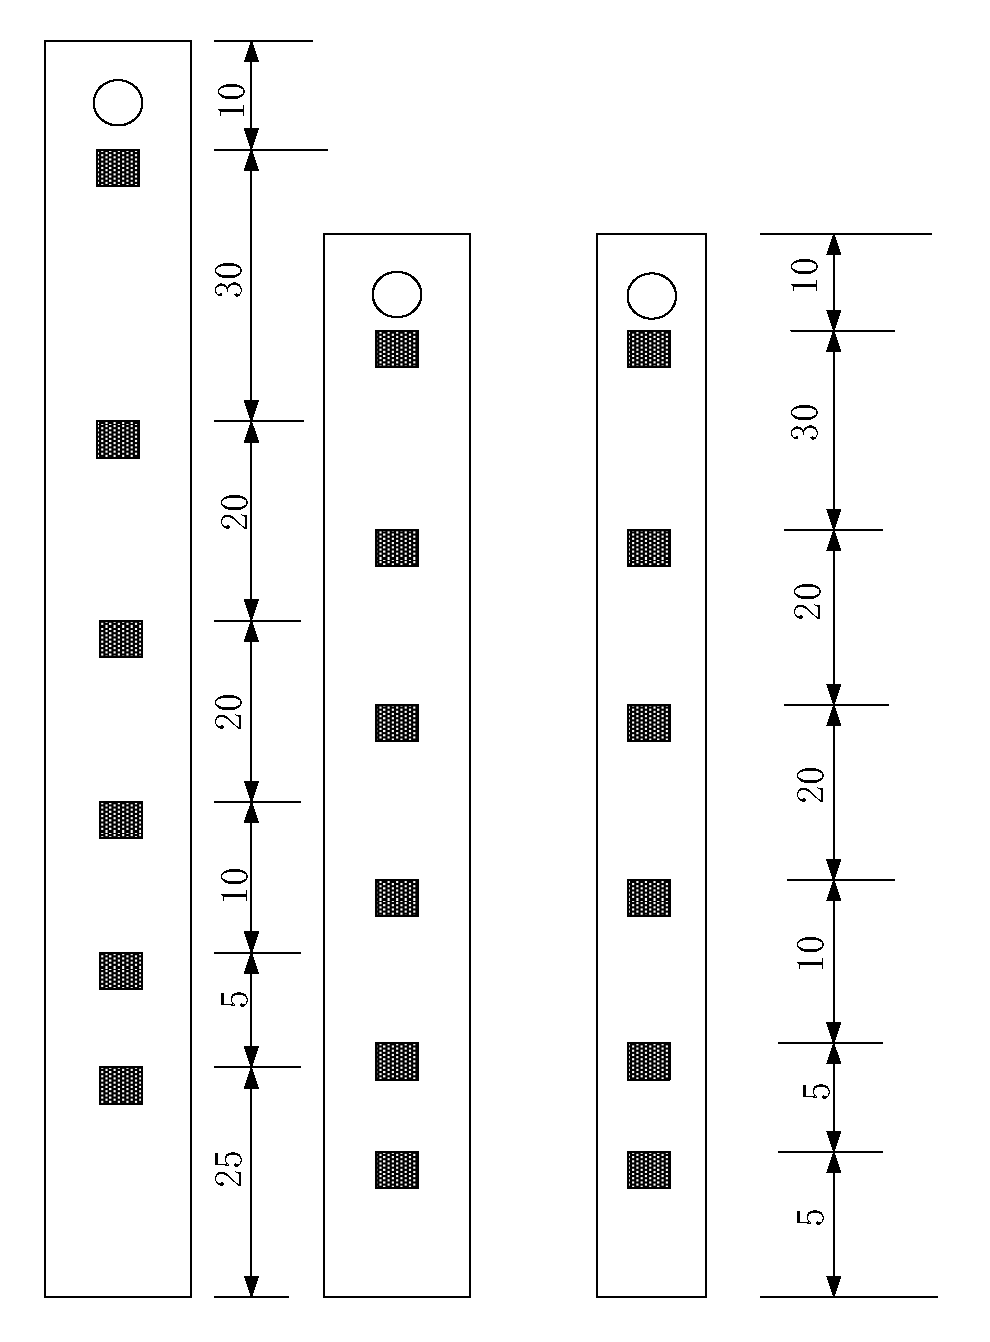
- Measuring and positioning: Using a black water-based pen, mark the pre-installation site of the FBG sensor on piles at the spacing indicated in Figure 4. Number the sensors from the bottom to the top of the pile as 1#–6#.
- (2)
- Slotting: A shallow slot of 2 mm × 2 mm (width × depth) is cut into the surface of the outer tube.
- (3)
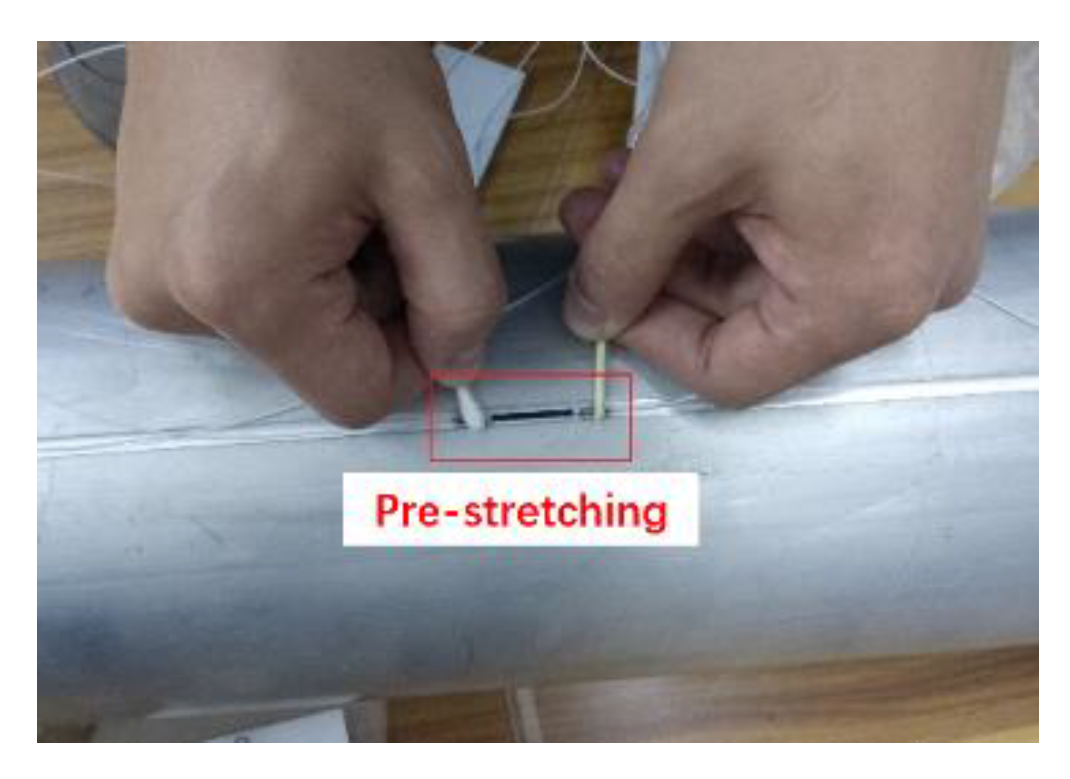
- Adhesive sensor: first, paste one end of the fiber grating, clamp both ends of the fiber grating with cotton swabs, then move the unbonded end for pre-stretching; when the wavelength increases around 2 nm, stop pre-stretching, and fix the free end with glue, as shown in Figure 5.
- (4)
- Connect the collector and check the survival rate: After cleaning the sensor’s FC connector, connect the collector to the demodulator to check the survival rate. From the results, all of the sensors are alive.
- (5)
- Package protection: the FBG sensor is encapsulated with epoxy resin to flush its surface with the pile surface.


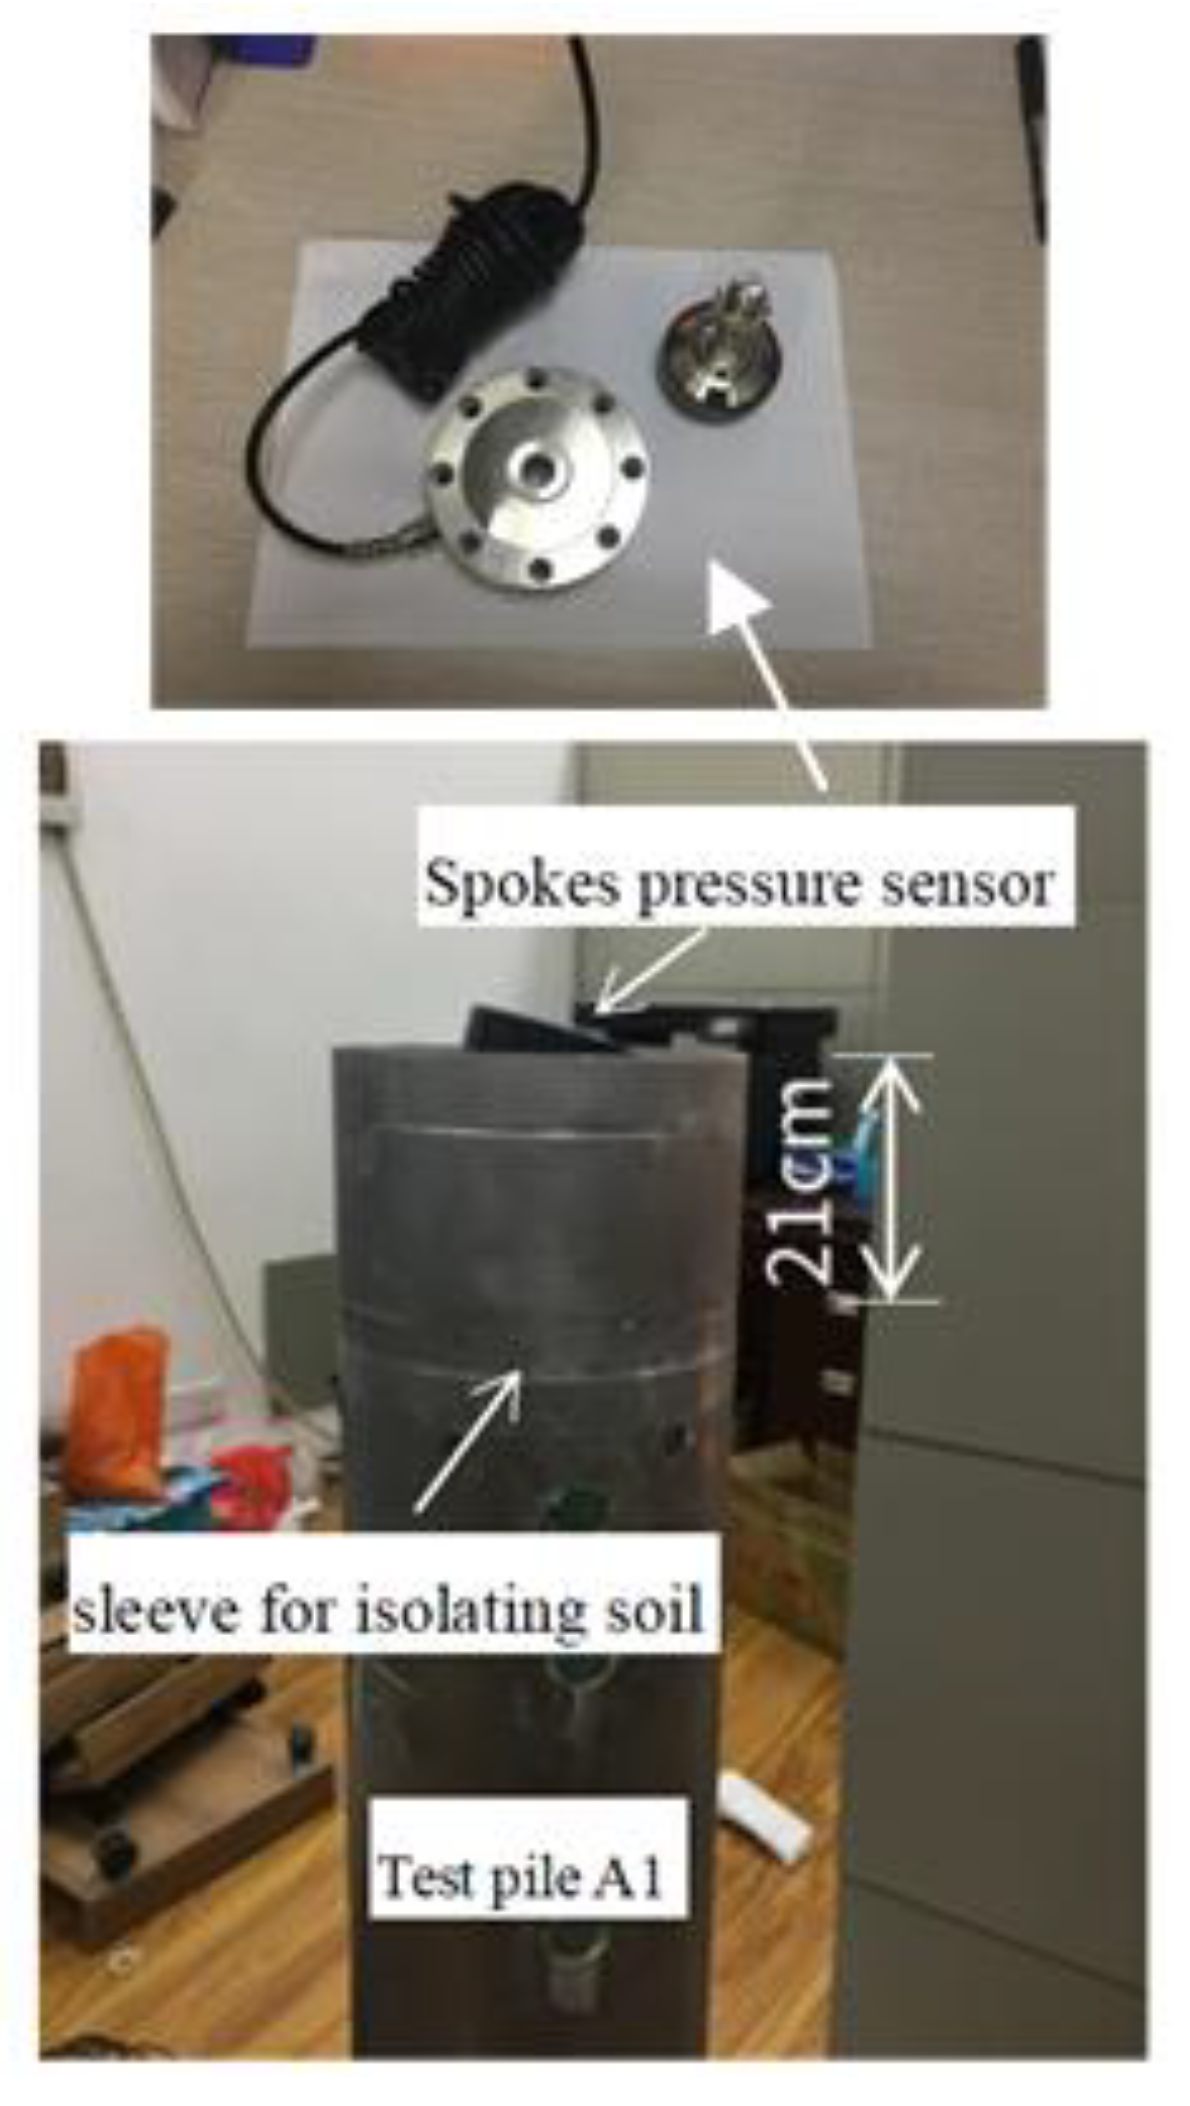
3.4. Wheel and Spoke Pressure Sensor
3.5. Brief Introduction of Pile Top Pressure Sensor
3.6. Principle of Pile Top Pressure Sensor
3.7. Installation Guarantee of Test Sensor
4. Static Pile-Sinking Test
4.1. Experiment Overview
4.2. Selection of Pile Position
4.3. Loading and Measurement of the Test
5. Analysis of Static Pile-Sinking Test Results
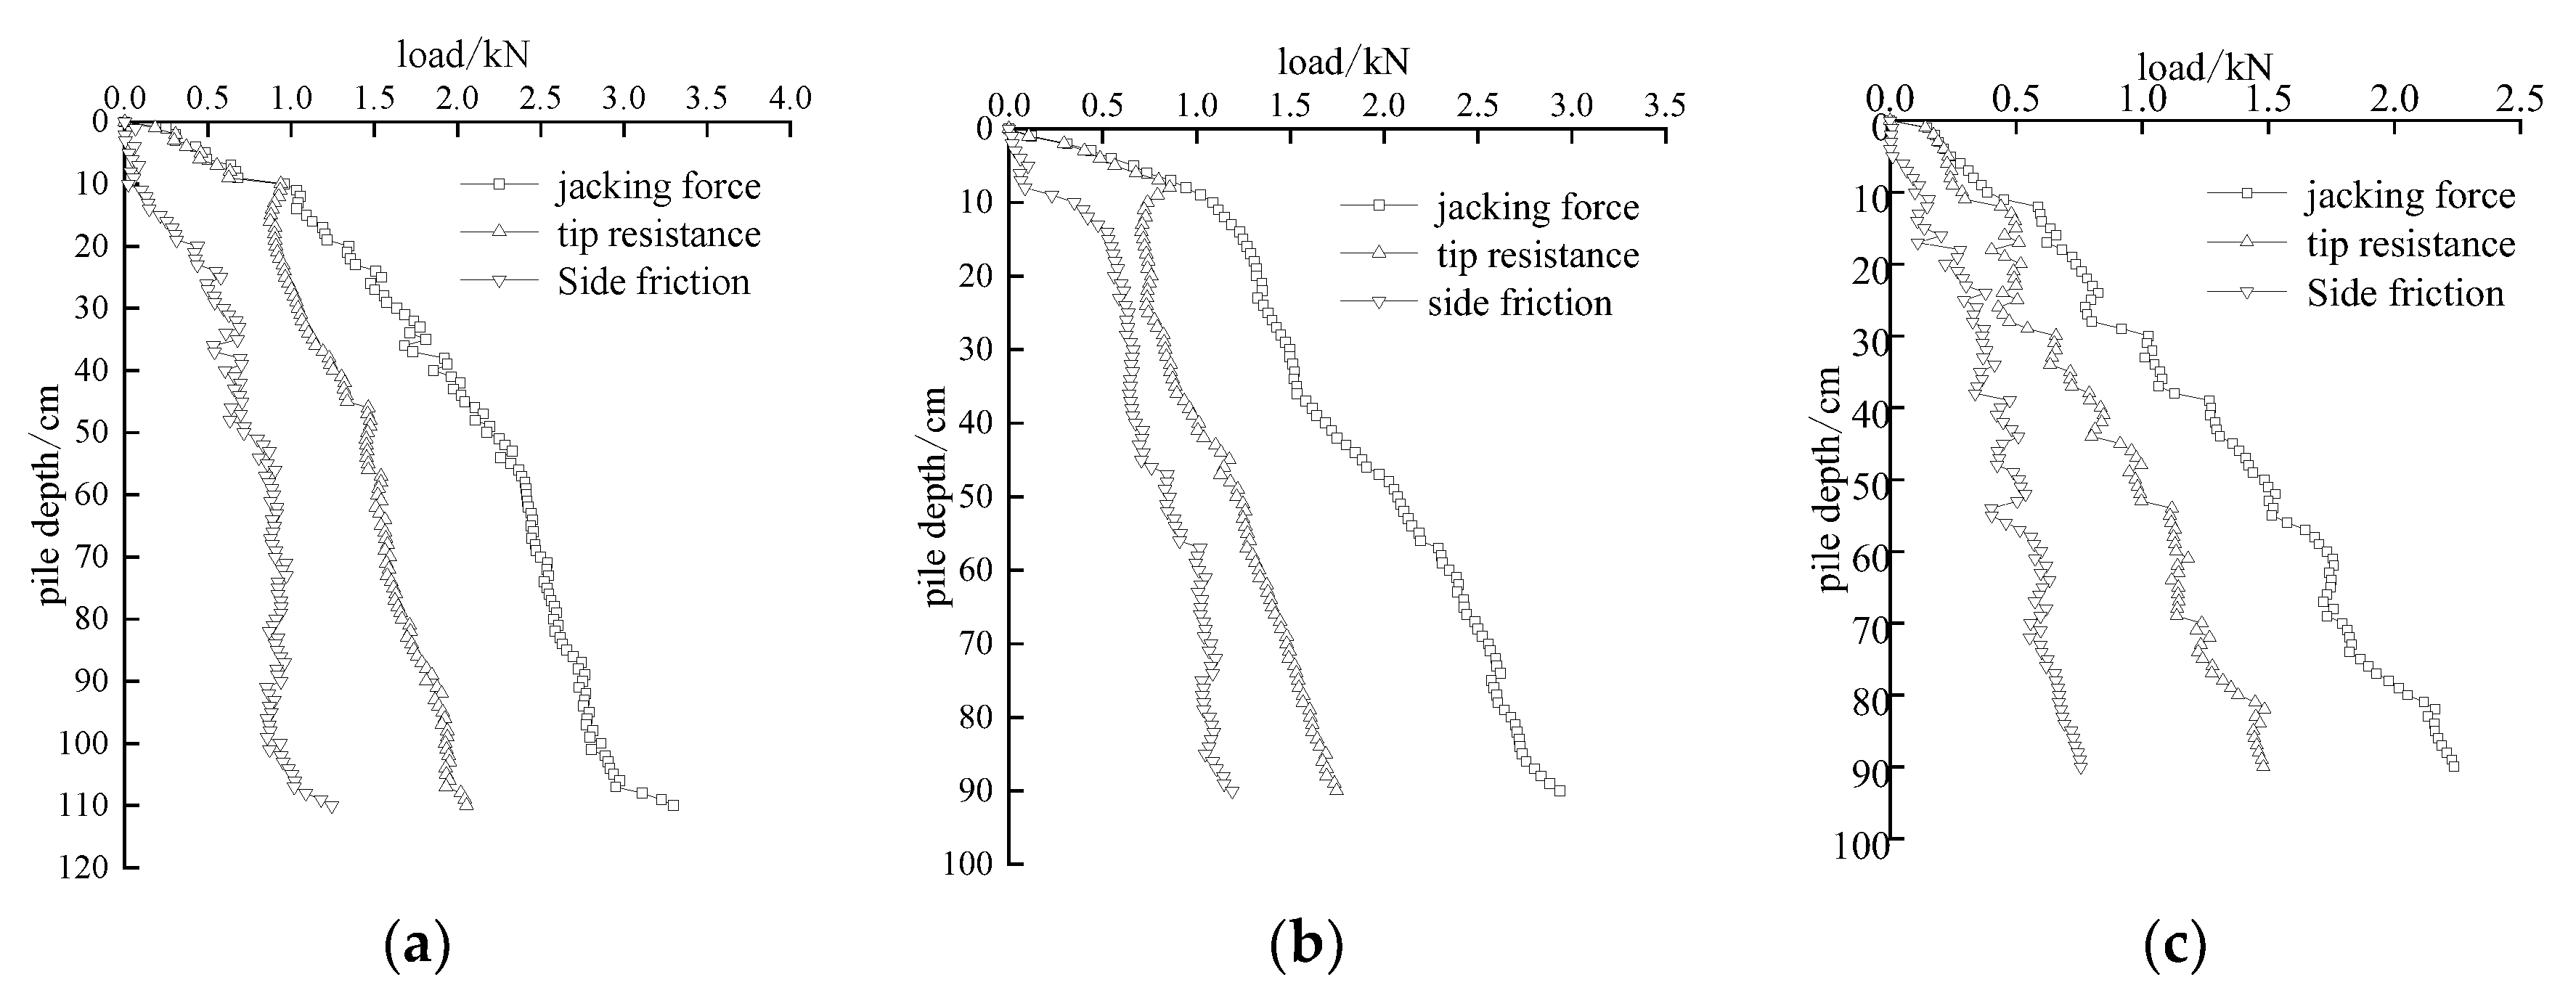
5.1. Analysis of Force Traits during Pile Sinking
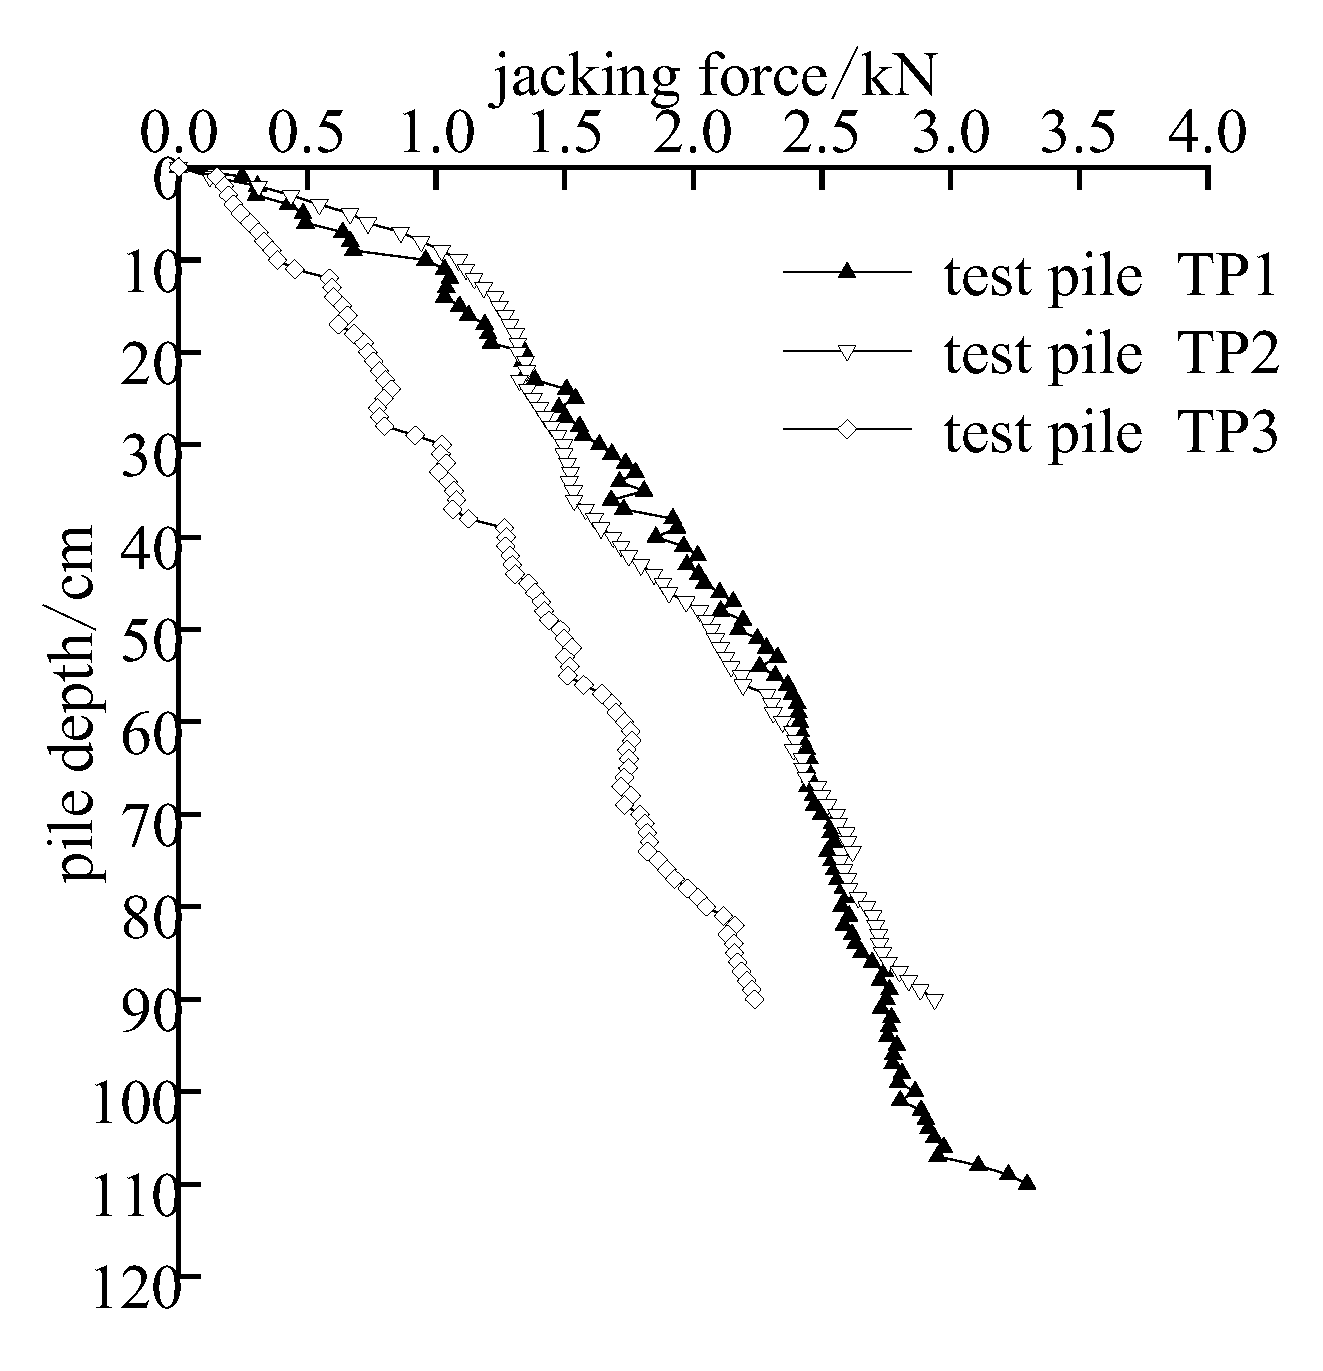
5.2. Analysis of Piling Force during Pile Sinking
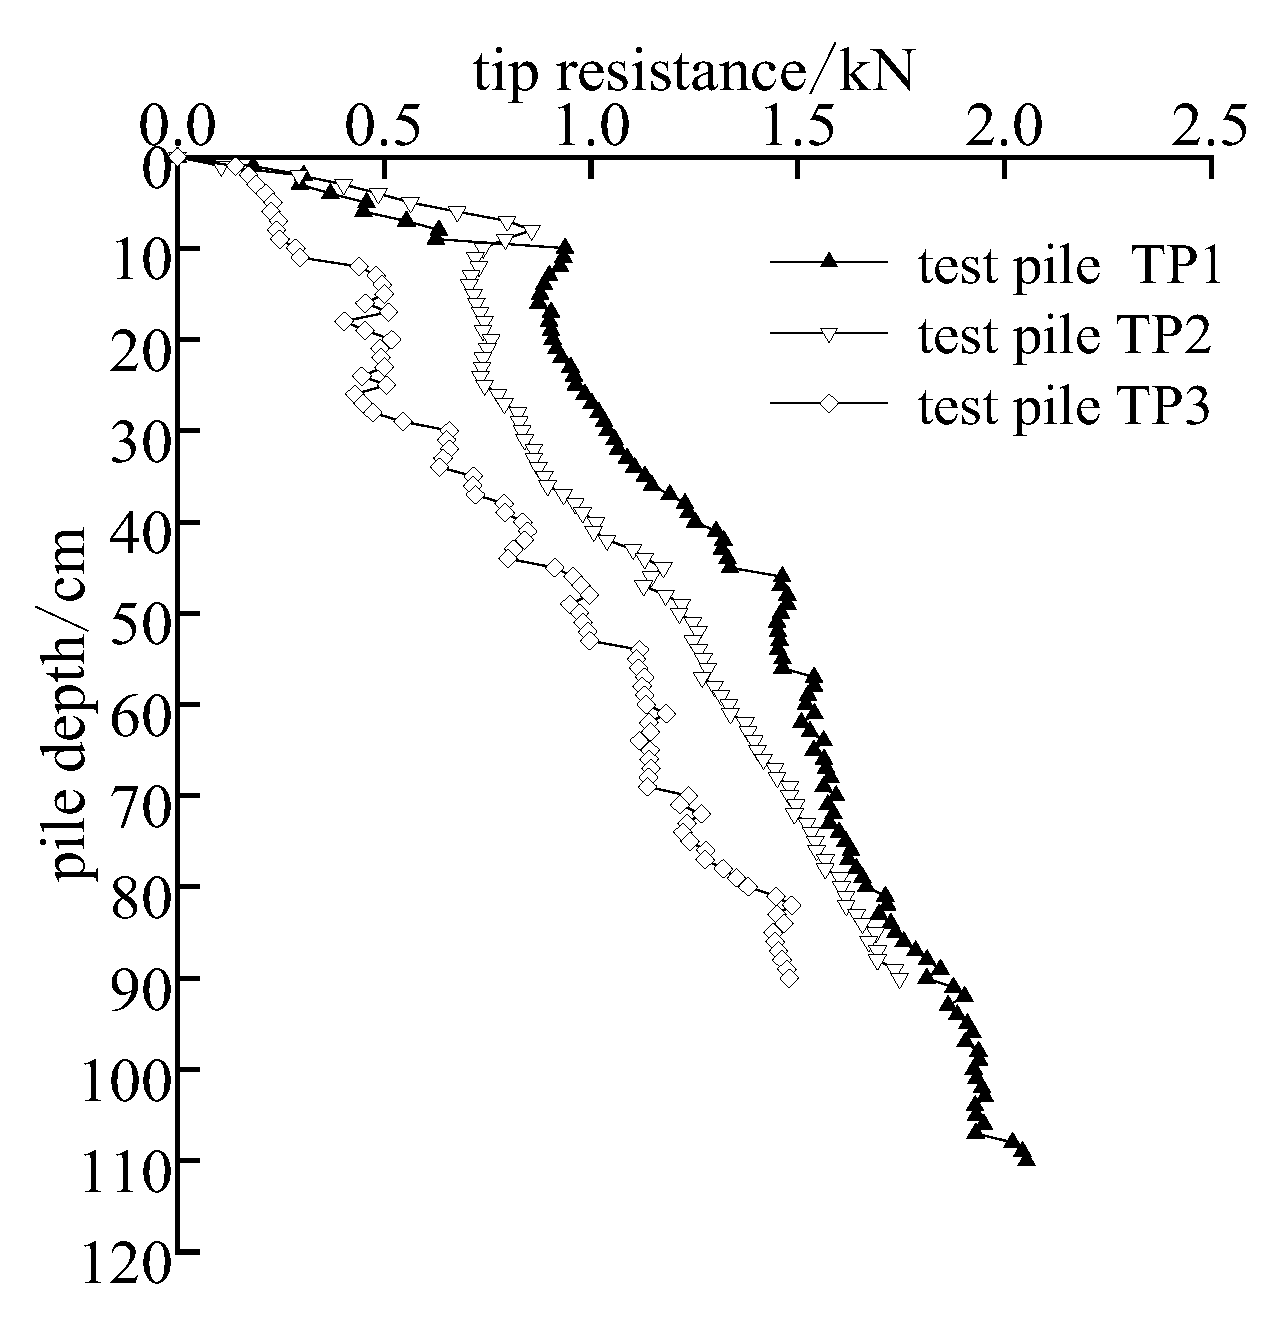
5.3. Analysis of Pile End Resistance during Pile Sinking
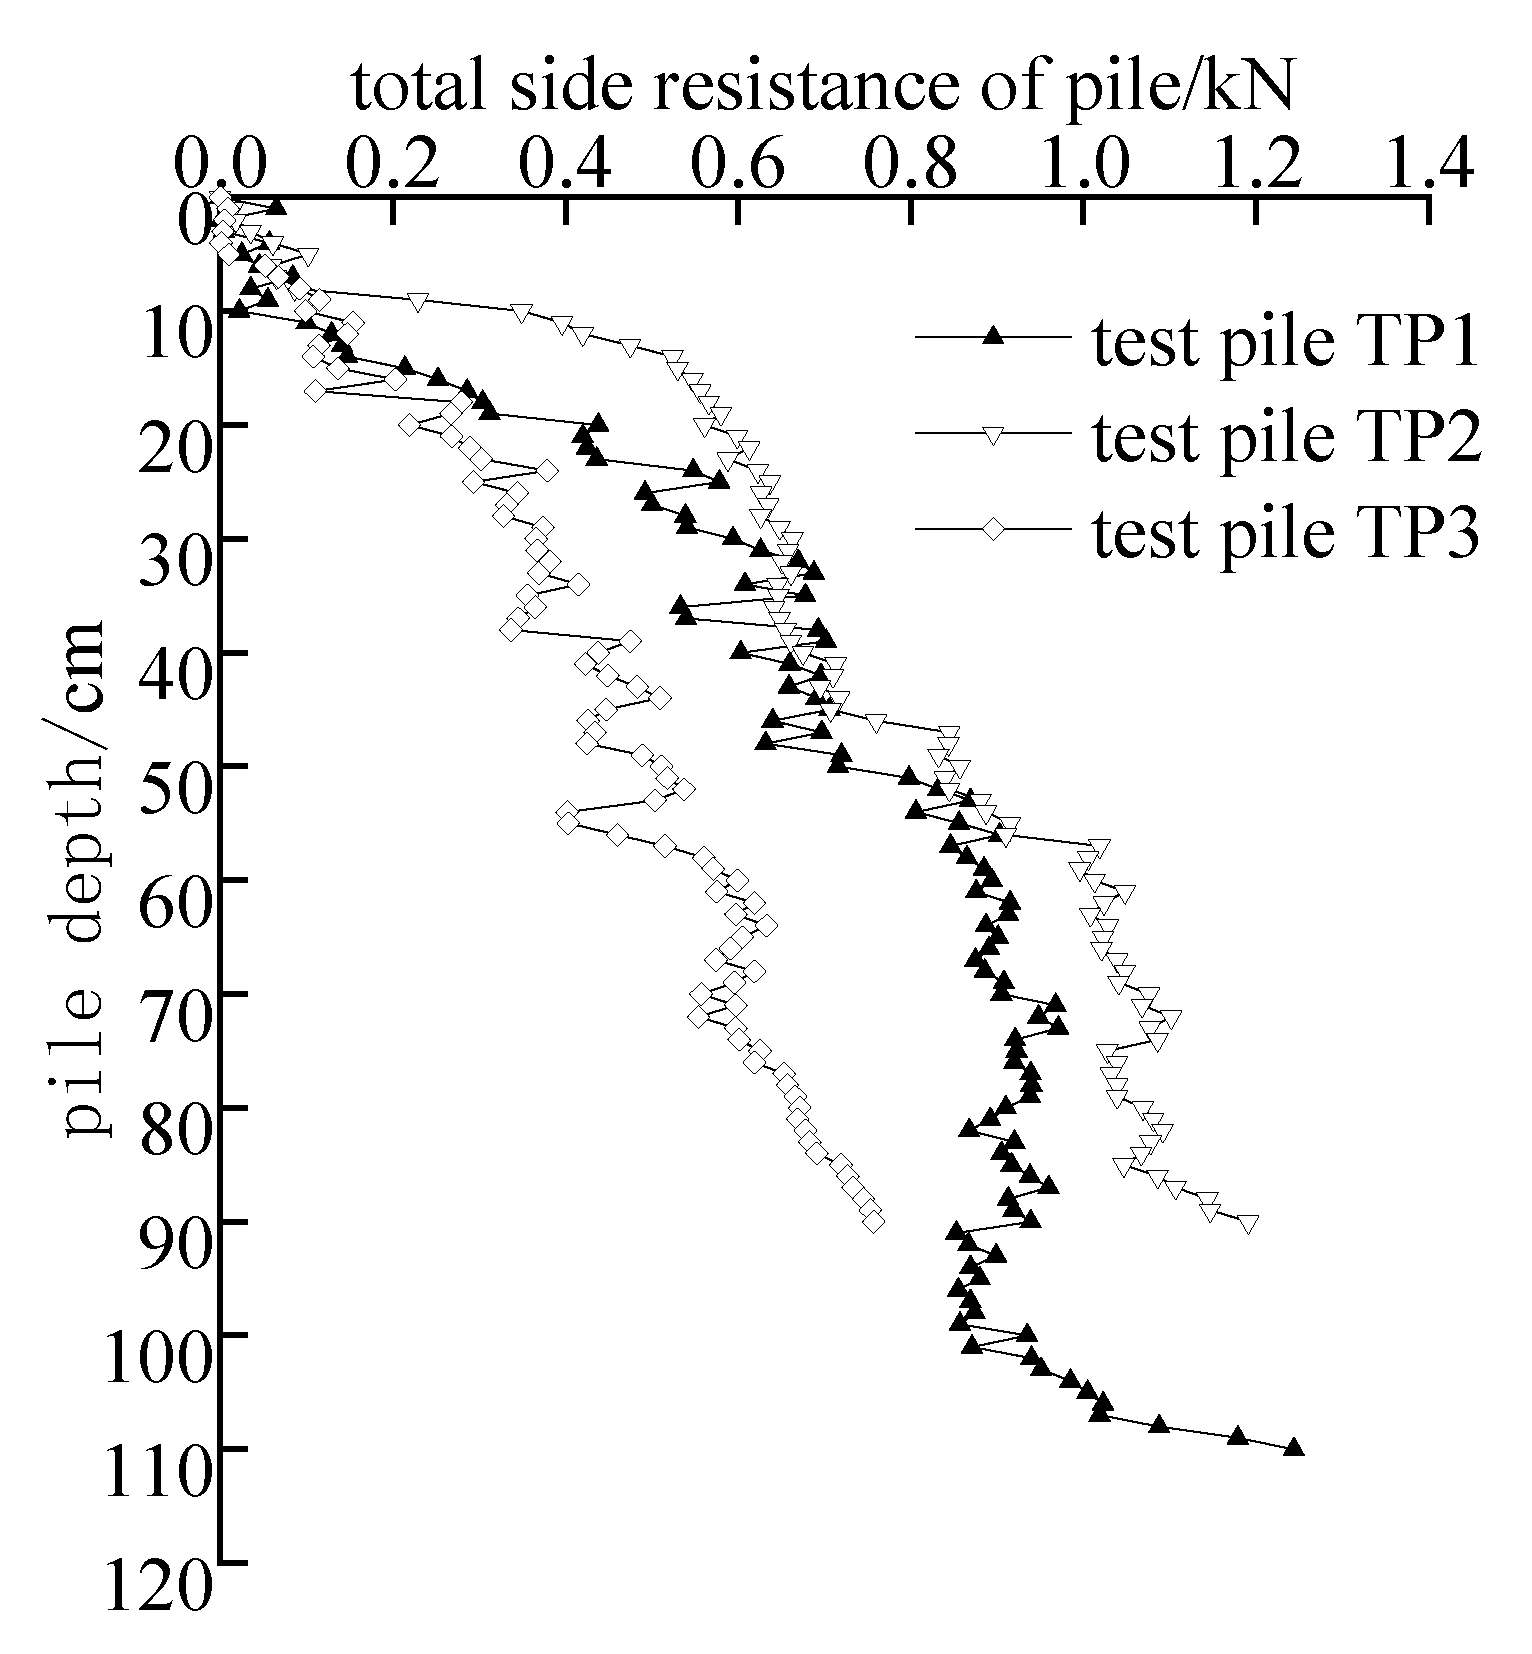
5.4. Analysis of Pile Side Friction Resistance during Pile Sinking
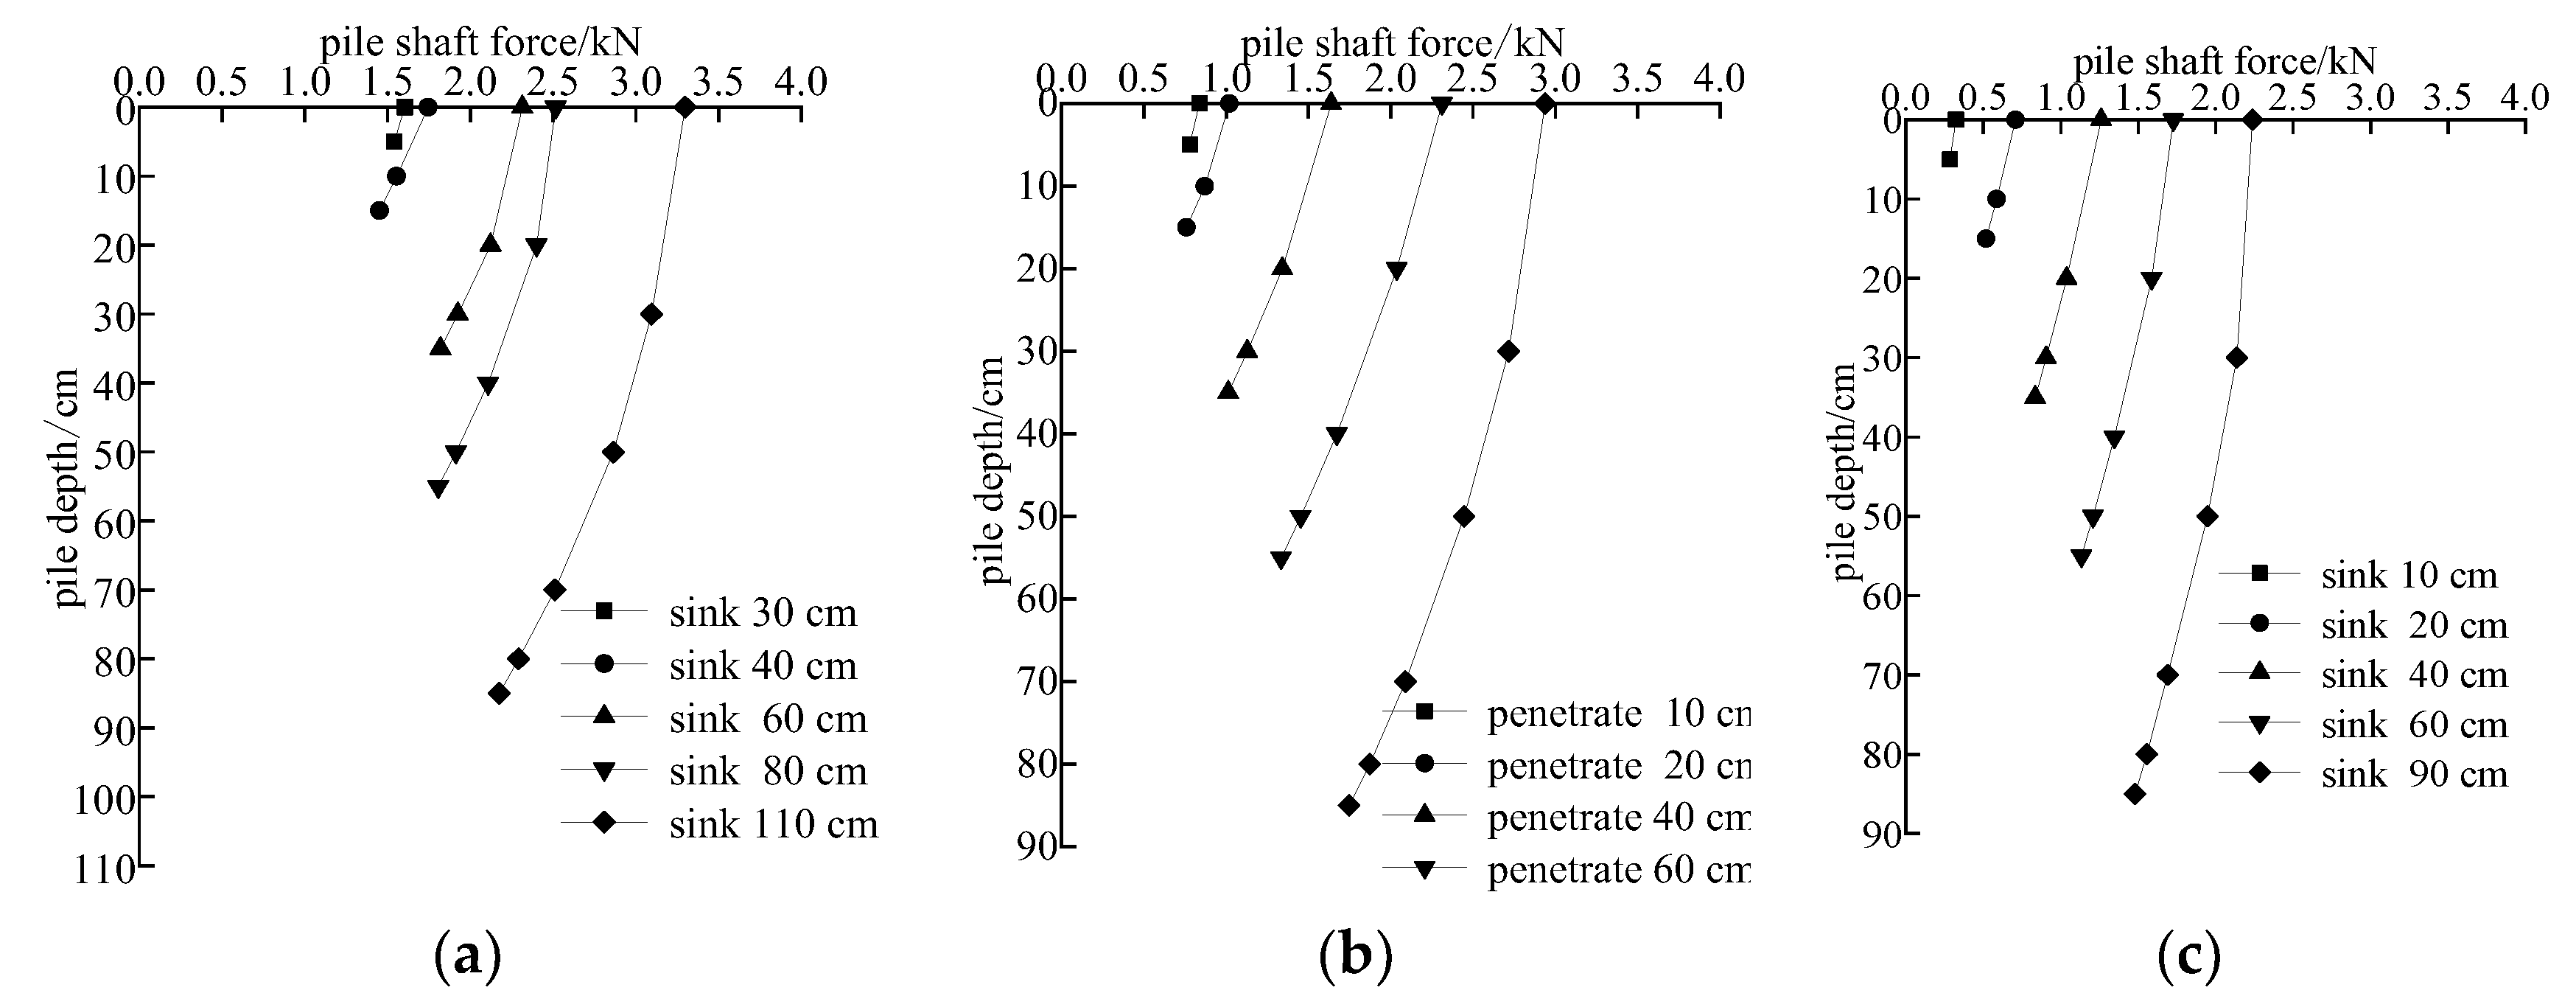
5.5. Analysis of Test Pile Axial Force Results
5.6. Analysis of the Results of the Unit Frictional Resistance of the Test Pile Side of the Pile
6. Conclusions
Author Contributions
Funding
Data Availability Statement
Conflicts of Interest
References
- Liu, J.W. Study Pile Driving Process and Static Pressure Pile Bearing Capacity; Qingdao University of Technology: Qingdao, China, 2008. [Google Scholar]
- Murthy, D.S.; Robinson, R.G.; Rajagopal, K. Formation of soil plug in open-ended pipe piles in sandy soils. Int. J. Geotech. Eng. 2018, 15, 519–529. [Google Scholar] [CrossRef]
- Li, J.P.; Li, L.; Sun, D.A.; Tang, J.H. Theoretical study on sinking resistance of jacked piles in saturated soft clay. Chin. J. Geotech. Eng. 2015, 37, 1454–1461. [Google Scholar] [CrossRef]
- Sagaseta, C.; Whittle, A.J.; Santagata, M. Deformation analysis of shallow penetration in clay. Int. J. Numer. Anal. Methods Geomech. 1997, 21, 687–719. [Google Scholar] [CrossRef]
- Zhang, M.Y.; Deng, A.F. Experimental study on jacked precast piles in layered soil. Chin. J. Geotech. Eng. 2000, 22, 490–492. [Google Scholar] [CrossRef]
- Ma, H.L. Field test on time effect of bearing capacity on end-open pile and end-closed pile. Chin. J. Rock Mech. Eng. 2008, 27, 3349–3353. [Google Scholar] [CrossRef]
- Kou, H.L.; Zhang, M.Y.; Liu, J.W. Bearing capacity efficiency mechanism analysis of jacked pile based on optical fiber sensing technology. Rock Soil Mech. 2013, 34, 1082–1088. [Google Scholar] [CrossRef]
- Kou, H.L.; Zhang, M.Y. Penetration mechanism of jacked PHC pipe piles based on pile stress measurement. Rock Soil Mech. 2014, 35, 1295–1302. [Google Scholar] [CrossRef]
- Li, Y.N.; Barry, M.L.; Liu, Q.B. Centrifuge modeling of jacked pile in clay. Chin. J. Eng. 2018, 40, 285–292. [Google Scholar] [CrossRef]
- Nicola, A.D.E.; Randolph, M.F. Centrifuge modelling of pipe piles in sand under axial loads. Geotechnique 1999, 49, 295–318. [Google Scholar] [CrossRef]
- Hassan, N.S.; Ibrahim, A.; Alias, R.; Hasbollah, D.Z.A.; Ramli, A.B. Assessment of ultimate bearing capacity of the pile for jacking & rotary piling method. Phys. Chem. Earth 2023, 129, 103331. [Google Scholar]
- Lee, C.Y.; Poulous, H.G. Jacked model pile shafts in offshore calcareous soils. Mar. Georesour. Geotechnol. 1988, 7, 247–274. [Google Scholar] [CrossRef]
- Statkus, T.; Norkus, A.; Mikolainis, M. Experimental Investigation of Settlement in Sand Soil of Jacked Pile Subjected by Vertical Compressive Cyclic Loading. Procedia Eng. 2017, 172, 1053–1058. [Google Scholar] [CrossRef]
- Wang, Y.; Li, J.; Li, L. Settlement of jacked piles in clay: Theoretical analysis considering soil aging. Comput. Geotech. 2020, 122, 103504. [Google Scholar] [CrossRef]
- Yang, Q.G.; Liu, J.; He, J.; Luo, S.H. Comparative research on penetration resistance of jacked tapered piles and uniform section piles. Chin. J. Geotech. Eng. 2013, 37, 897–901. [Google Scholar]
- Gu, H.W.; Kong, G.Q.; Che, P.; Ren, L.W.; Peng, H.F. Comparative model tests on bearing capacities of tapered pile and equal section pile. J. Cent. South Univ. (Sci. Technol.) 2017, 194–200. [Google Scholar]
- Kou, H.L.; Li, W.; Chu, J.; Yang, D.L. Model tests on open-ended concrete pipe piles jacked in sand. Mar. Georesour. Geotechnol. 2019, 38, 939–946. [Google Scholar] [CrossRef]
- Hu, Y.Q.; Tang, L.S.; Li, Z.Z. Experimental Study on Variation and Time Effect of Shaft Resistance of Jacked Pile Installation. Acta Sci. Nat. Univ. Sunyatseni 2015, 54, 130–135. [Google Scholar] [CrossRef]
- Li, Y.; Zhu, W.; Zheng, W.; He, J. Surrounding rock mass stability monitoring of underground caverns in a geomechanical model test using FBG sensors. In Proceedings of the Second International Conference on Smart Materials and Nanotechnology in Engineering, Weihai, China, 8–11 July 2009; p. 7493. [Google Scholar]
- You, R.; Ren, L.; Song, G. A novel fiber Bragg grating (FBG) soil strain sensor. Measurement 2019, 139, 85–91. [Google Scholar] [CrossRef]
- Zhu, Y.Q.; Zhu, H.H.; Sun, Y.J.; Shi, B. Model experiment study of pipe pile driving into soil using FBG-BOTDA sensing monitoring technology. Rock Soil Mech. 2014, 35, 695–702. [Google Scholar] [CrossRef]
- GB/T 50123-1999; Industry Standard Compilation Group of the People’s Republic of China. Standard for Geotechnical Test Methods. China Planning Press: Beijing, China, 1999.
- JGJ 94-2008; Technical Specifications for Building Pile Foundations. Technical Code for Building Pile Foundation. China Building and Building Press: Beijing, China, 2008.
- Ovesen, N.K. The scaling law relationship-Panel Discussion. In Proceedings of the 7th European Conference on Soil Mechanics and Foundation Engineering, Brighton, UK, September 1979; pp. 319–323. [Google Scholar]
- Xu, G.M.; Zhang, W.M. Study on particle size effect and boundary effect in centrifugal model. Chin. J. Geotech. Eng. 1996, 18, 80–86. [Google Scholar]
- Liu, J.W.; Zhang, M.Y.; Yu, F.; Bai, X.Y. Experimental study on interface shear fatigue between soils and PHC pipe piles. Chin. J. Geotech. Eng. 2013, 34, 1037–1040. [Google Scholar]


| Relative Density ds | Weight Density γ/(kN/m3) | Moisture Content w/% | Liquid Limit wL/% | Plastic Limit wp/% | Plasticity Index Ip/% | Cohesion c/kPa | Internal Friction Angle φ/(°) | Modulus of Compression Es1-2/MPa |
|---|---|---|---|---|---|---|---|---|
| 2.73 | 18.0 | 34.8 | 34.8 | 21.2 | 13.6 | 14.4 | 8.6 | 3.3 |
| No. | External Diameter/mm | Pile Length/mm | Pipe Thickness/mm | Form of Pipe End | Elasticity Modulus/GPa | Poisson’s Ratio |
|---|---|---|---|---|---|---|
| TP1 | 140 | 1200 | 3 | close | 72 | 0.3 |
| TP2 | 140 | 1000 | 3 | close | 72 | 0.3 |
| TP3 | 100 | 1000 | 3 | close | 72 | 0.3 |
| Parameter Type | Wavelength Interval/nm | Central Wavelength/nm | Range/με | Resolution Ratio/με | Usage Temperature/(°C) |
|---|---|---|---|---|---|
| numerical value | ±3 | 1510~1590 | ±1500 | 1 | −30~120 |
| No. | Total Pile Length/mm | Pile Diameter/mm | Form of Pile End | Pile Depth /mm | Pile Driving Speed/(mm/min) | FBG Sensor/Number | Pile Top Pressure Sensor/Number | Pile End Spoke Pressure Transducer/Number |
|---|---|---|---|---|---|---|---|---|
| TP1 | 1200 | 140 | close | 1100 | 300 | 6 | 1 | 1 |
| TP2 | 1000 | 140 | close | 900 | 300 | 6 | 1 | none |
| TP3 | 1000 | 100 | close | 900 | 300 | 6 | 1 | none |
| No. | Jacking Force/kN | Tip Resistance/kN | Percentage/% | Side Friction/kN | Percentage/% |
|---|---|---|---|---|---|
| TP1 | 3.298 | 2.054 | 62.3 | 1.244 | 37.7 |
| TP2 | 2.938 | 1.747 | 59.5 | 1.191 | 40.5 |
| TP3 | 2.238 | 1.480 | 66.2 | 0.757 | 33.8 |
Disclaimer/Publisher’s Note: The statements, opinions and data contained in all publications are solely those of the individual author(s) and contributor(s) and not of MDPI and/or the editor(s). MDPI and/or the editor(s) disclaim responsibility for any injury to people or property resulting from any ideas, methods, instructions or products referred to in the content. |
© 2023 by the authors. Licensee MDPI, Basel, Switzerland. This article is an open access article distributed under the terms and conditions of the Creative Commons Attribution (CC BY) license (https://creativecommons.org/licenses/by/4.0/).
Share and Cite
Wang, L.; Zhang, S.; Li, S.; Wang, J.; Niu, X.; Wang, D.; Wang, Y. Laboratory Test Study on Pile Jacking Penetration Mechanism Considering Different Diameter and Length Based on Photoelectric Integration Technology. Buildings 2023, 13, 1247. https://doi.org/10.3390/buildings13051247
Wang L, Zhang S, Li S, Wang J, Niu X, Wang D, Wang Y. Laboratory Test Study on Pile Jacking Penetration Mechanism Considering Different Diameter and Length Based on Photoelectric Integration Technology. Buildings. 2023; 13(5):1247. https://doi.org/10.3390/buildings13051247
Chicago/Turabian StyleWang, Lifeng, Shuo Zhang, Shiqiang Li, Jun Wang, Xunlong Niu, Donglei Wang, and Yonghong Wang. 2023. "Laboratory Test Study on Pile Jacking Penetration Mechanism Considering Different Diameter and Length Based on Photoelectric Integration Technology" Buildings 13, no. 5: 1247. https://doi.org/10.3390/buildings13051247