Article

Improving School Reconstruction Projects Satisfaction Outcomes Using Fuzzy Quality Function Deployment (FQFD)

1
Graduate School of Engineering Science and Technology, National Yunlin University of Science and Technology, Douliou 64002, Taiwan
2
Department of Civil and Construction Engineering, National Yunlin University of Science and Technology, Douliou 64002, Taiwan
3
Department of Civil Engineering, Politeknik Negeri Kupang, Kupang 85361, Indonesia
4
Department of Civil Engineering and Engineering Management, National Quemoy University, Jinning 89250, Taiwan
5
Economic Construction Division, Nanzhi District Office, Kaohsiung City 11507, Taiwan
*
Author to whom correspondence should be addressed.
Buildings 2023, 13(5), 1239; https://doi.org/10.3390/buildings13051239
Submission received: 9 March 2023 / Revised: 1 May 2023 / Accepted: 5 May 2023 / Published: 9 May 2023

Abstract

:
School buildings and facilities constitute essential educational infrastructure and have a formative impact on the safety, development, and socialization of students. However, many existing school buildings are increasingly aging and deteriorating, requiring urgent refurbishment, raising the need to assess and develop a quality function to propose strategies for improved school building reconstruction. Apart from the initial planning phase, the reconstruction design process usually requires detailed information regarding owner/user demands and is often presented in terms of user dissatisfaction. This paper applies fuzzy quality function deployment (FQFD) to transform actual user needs into an improved technical strategy that can be realized by the design unit through the sequence of the matrix method. The resulting framework identifies a total of eight major components of user dissatisfaction, along with three key school-design improvement strategies, including the use of environmentally sound materials, overall quality of design and planning, and playground planning. In terms of technology improvement strategies, the prioritized design improvement strategies for increasing school reconstruction satisfaction include considerations of practicality and constructability, planning use points and maintenance methods, designing the site according to the local terrain, and using materials that match the layout of the environment. The approach proposed in this study can be used to enhance the efficiency of the reconstruction of aging buildings and the research results can also augment ontological knowledge on the reconstruction of aging campus buildings.

1. Introduction

Formal education in schools requires the provision of school buildings that are safe, comfortable, and well-suited to school activities [1]. The quality and safety of school facilities have a direct impact on student health and behavior, requiring effective and continuous management of the school environment. Aging buildings that pose potential safety concerns require structural reinforcement, refurbishment, or replacement to ensure a learning environment that is healthy, safe, and comfortable.
In the design of school buildings, function is prioritized above form [2], but considers the need for educational success such as child achievement. Aging and poorly maintained school buildings have a negative significant influence on children’s behavior and achievement [3]. In addition to contributing to accidents and physical security concerns [4], failure to maintain school buildings properly and effectively can also negatively impact student health and safety [5]. As such, aging school buildings must be maintained and periodically renewed to ensure a healthful and effective learning environment. The regular maintenance, renovation, and reconstruction of school buildings extends the service life of such educational infrastructures. Such maintenance must also consider responses to disasters or construction flaws.
As with any construction project, reconstruction usually begins with the design phase overseen by the architects and designers, followed by project delivery and construction execution overseen by the contractors. The final result of the construction project is then turned over to the user, and ends with the operation and maintenance phases [6]. These stages represent the building construction project life cycle. The level of user satisfaction with school building construction is assessed based on the expectations of users and school facility managers in comparison to actual conditions. The resulting level of user satisfaction can be influenced by the implementation of planning, design, and construction.
Reconstruction projects are much more complex than general new construction projects in terms of complexity due to the limitations imposed by the existing structures. The current users of facilities slated for reconstruction provide important insight into the function of such buildings through their rich usage experience. In addition, user satisfaction of reconstructed facilities is more difficult to achieve than that of general users. This study aims to enhance the quality function of school building design in Taiwan, using fuzzy quality function deployment (FQFD). In this study, FQFD is used to measure user satisfaction with a school reconstruction project. The developed model seeks to make the quality function more systematic, enabling it to meet real user needs better. The approach uses the matrix method to transform the outputs into a sequence of improved technical strategies. This study introduces the concept of fuzzy theory, and ranks technology improvement strategies based on their respective levels of ambiguity, in order to help decision-makers identify the improvement plan best suited to their priorities.

2. Literature Review
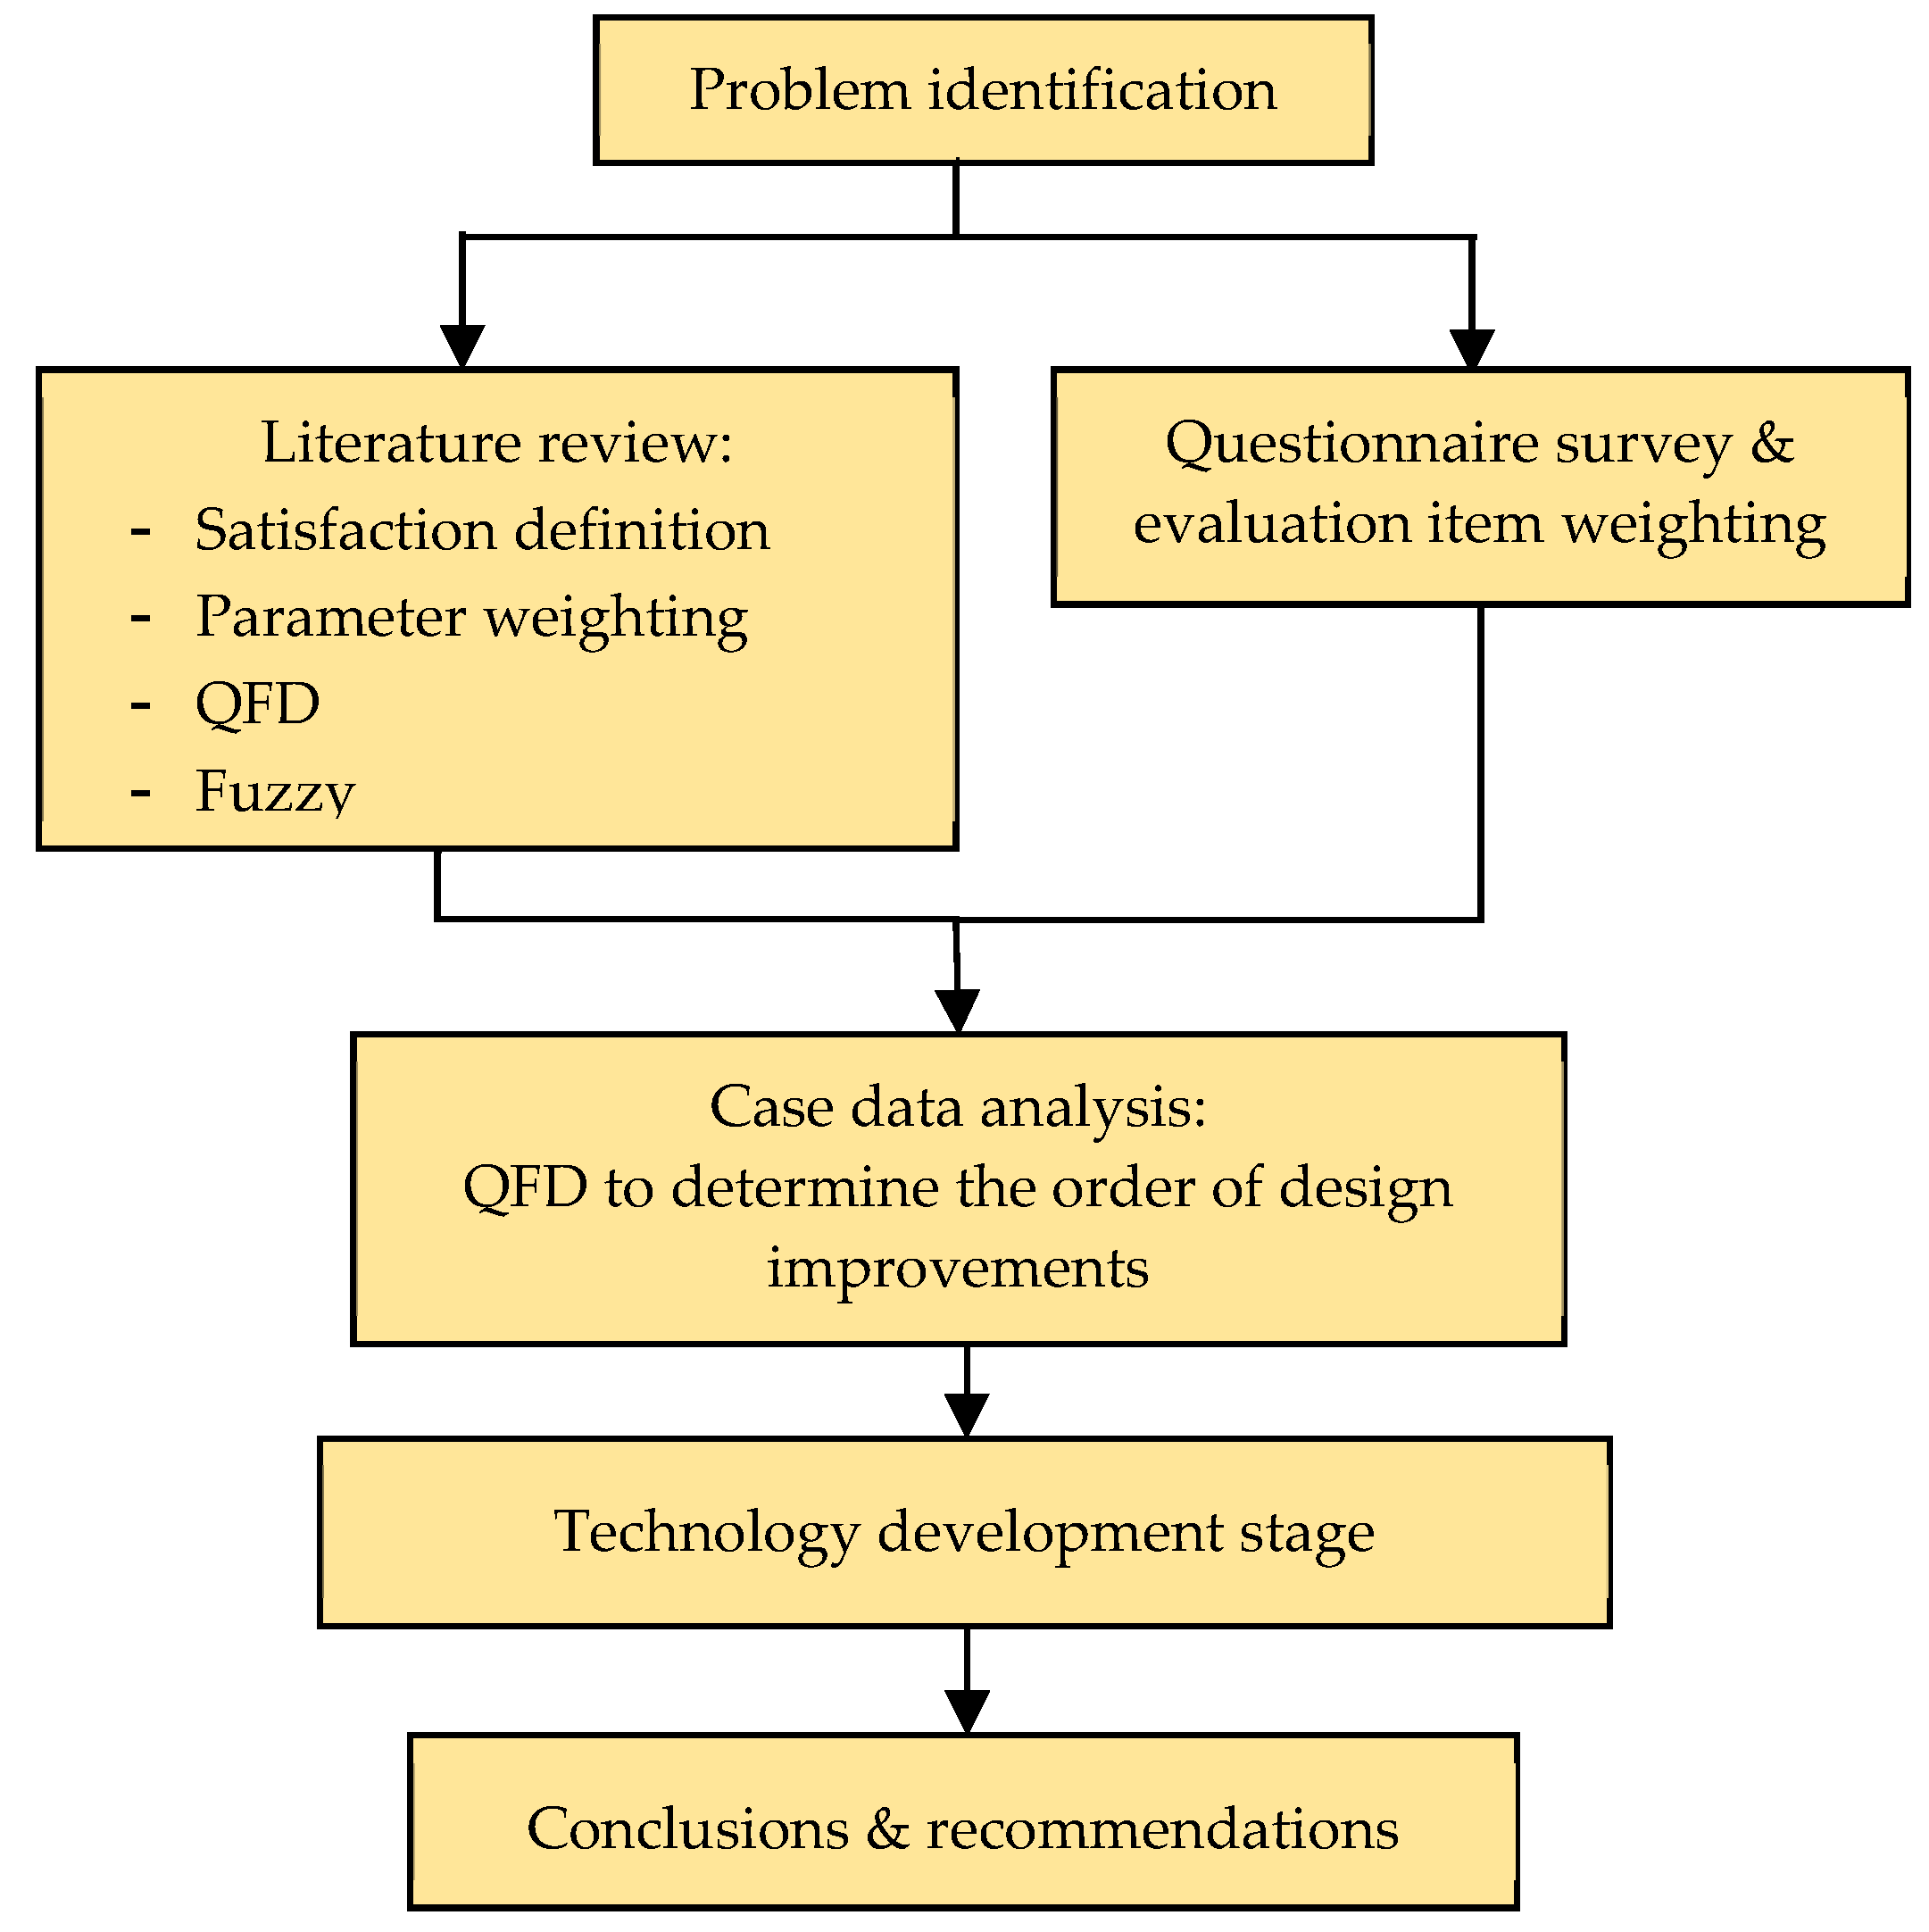
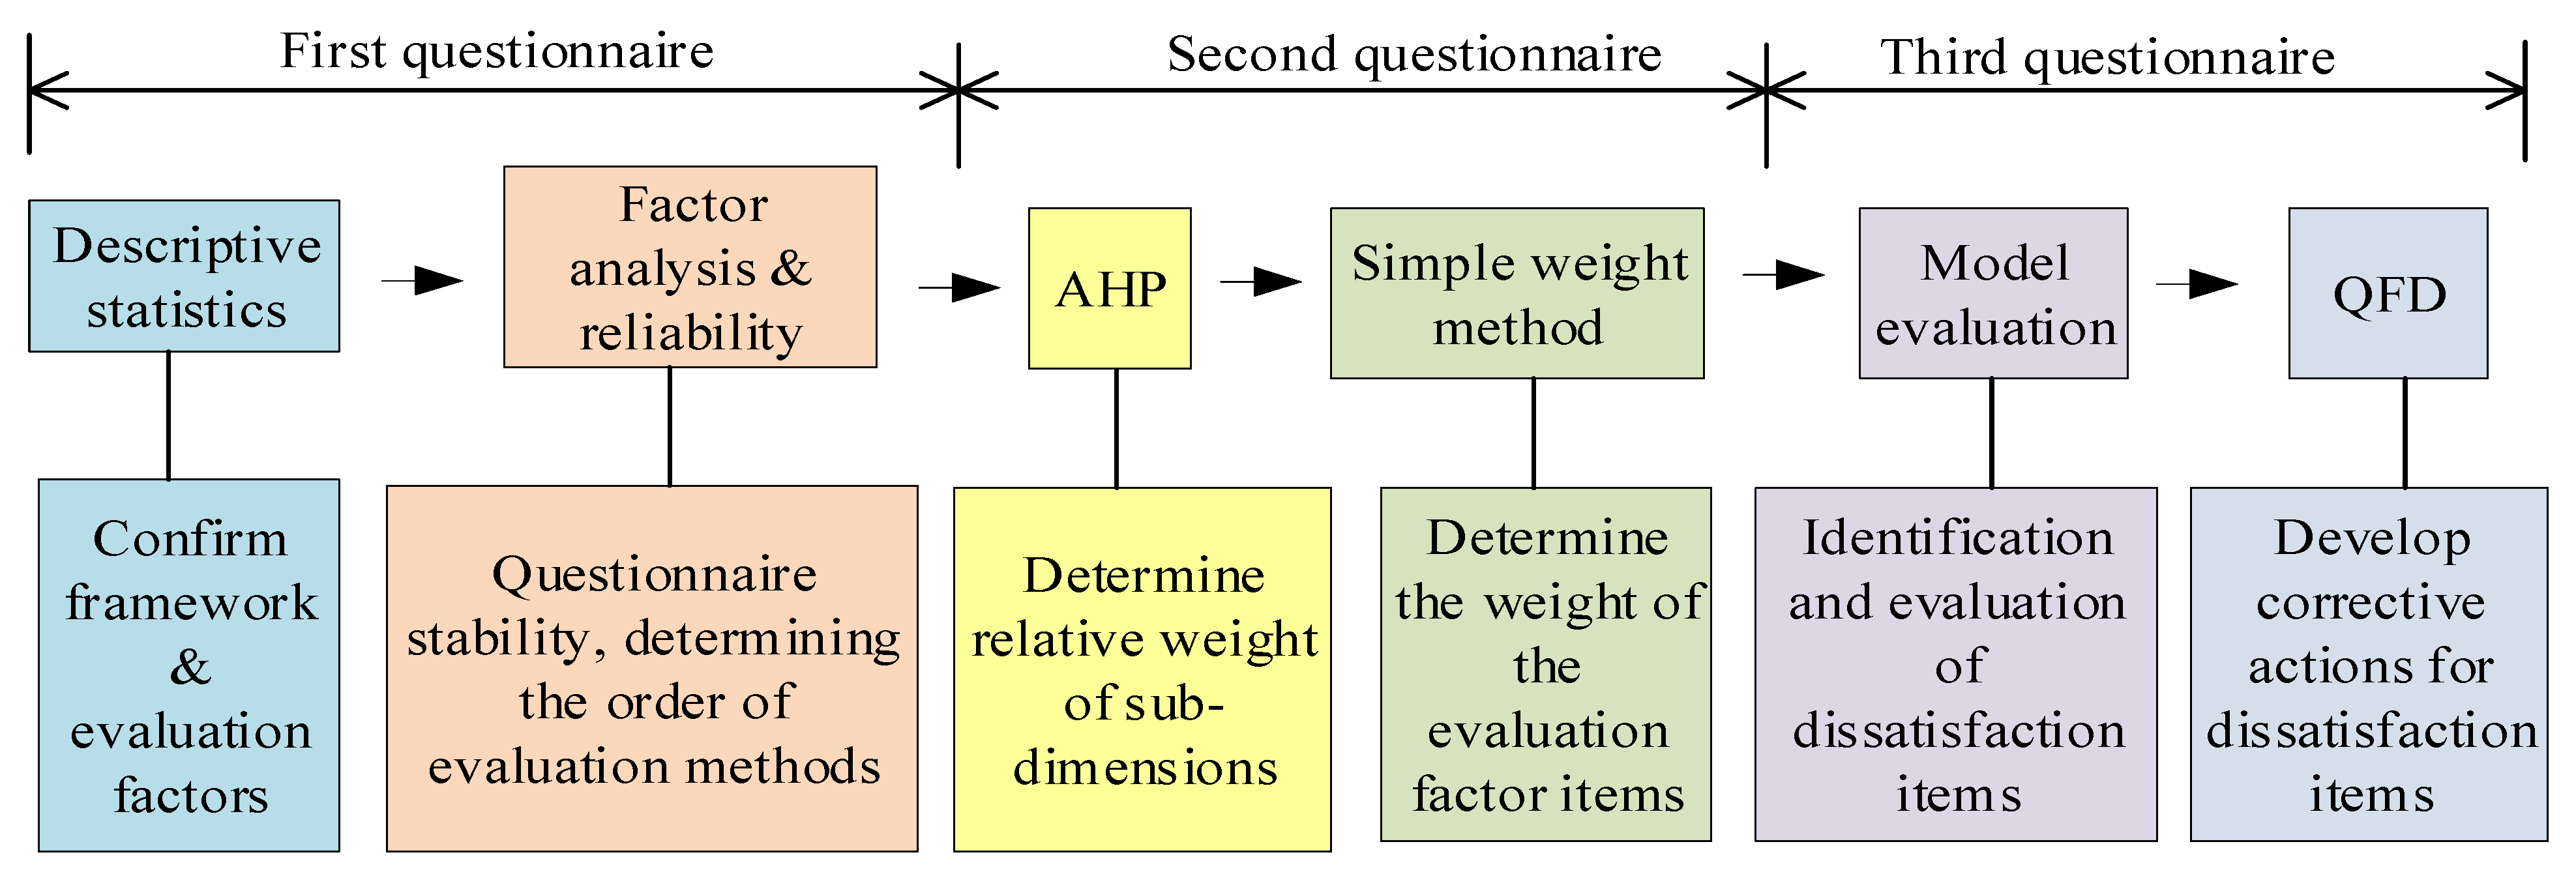
The performance requirements of school buildings are determined by the needs of the owners and users. There are at least two main aspects when evaluating school facility performance: technical (e.g., thermal comfort, visual and acoustic performance, and air quality) and functional (design of various spaces including assembly areas, classrooms, hallways, and restroom) [7,8,9]. User needs should play a significant role in determining the design of school facilities. For example, a classroom with a standard area of 63.80 m2 provides sufficient space for the classroom-centered learning of 22 students [5]. The results of a user satisfaction survey may indicate the need to redesign a facility such as a library due to changes in usage as a result of the proliferation of online library services [10,11]. In addition to spatial layout, the choice of construction materials can directly impact the brightness of a room, along with the thermal environment and humidity [12,13], thus affecting user satisfaction [14].
The satisfaction of building users (also referred to as “customers”) is a function of the difference between their initial performance expectations and the actual final performance [15]. Yi and Nataraajan [16] refer to this as “positive disconfirmation” and “negative disconfirmation”. A provider of goods/services needs to satisfy their customer’s needs and provide desired benefits, for example by bringing in new customers for the service providers [17]. Furthermore, in construction projects, there is a close relationship between the user and owner’s satisfaction and the work quality provided by the contractor and designer [15,18,19]. Quality is measured in terms of product durability, while satisfaction describes the fulfilment of needs through the timely execution of the planning, delivery, and construction processes. This study measures customer satisfaction based on a concept developed at the Ross School of Business, University of Michigan [20]. The concept starts from extracting information about customer expectations and perceived quality, which produces any perceived value. In the end, it boils down to whether the customer either complains about the resulting product or develops loyalty to them (Figure 1).
In the construction project cycle, the design phase is sometimes overlooked and lacks detailed supervision. Chen et al. [21] developed a model for evaluating client satisfaction using professional construction management (PCM) services based on elementary school reconstruction projects. They concluded that PCM services should focus primarily on the planning and design phases of school building reconstruction projects. Ahmed et al. [22] evaluated the performance of three post-occupancy school buildings in the UK to improve the contractor and designer understanding of client satisfaction, based on the argument that designers and contractors should be responsible for post-handover and post-occupancy evaluation (POE). After finding that such handovers were rarely carried out for school buildings, focus moved to the provision of building services (such as heating, lighting, air conditioning, and ventilation) and it was found that the design process provided adequate client satisfaction. These findings were consistent with those of Roberts et al. [23], who specifically proposed improved collaboration between architects, designers, and contractors with the post-construction (handover) facilities management (FM) team in order to conduct POE throughout the building life cycle [24].
The clients referred to in this study are managers and users of school facilities (buildings). In Taiwan, the principal/general director has full authority to supervise and evaluate school building performance, and is responsible for the overall management of school building reconstruction projects [25]. However, user satisfaction must also be explored from the perspective of school staff and students, as they are the parties most deeply impacted by the day-to-day usability of school facilities. In New Zealand, the property management of all school assets (building structures, services, and infrastructure) is conducted by a school board consisting of the principal, staff representatives, and parent representatives [26,27]. This includes a full review of the role of technical and maintenance staff. Such staff are frequently overlooked in the school architectural design stage, despite their close knowledge of critical financial, pedagogic, and hygienic considerations [2]. In a study on the school building renovation process, Farsäter and Olander [28] emphasized the importance of including the perspective of school building users when determining renovation project goals during the goal formulation and design stages, thereby better managing user expectations and optimizing user satisfaction. School project sustainability is also typically understood from the project contractor and manager perspectives, rather than that of the client [29], although the design process should begin by identifying and defining client needs [30].
Several studies have sought to measure user satisfaction for property and related services, including building facilities and school buildings, using data collected comes from the surveys (questionnaires and interviews) of customers, users, owners, and consumers [21,31,32,33], as well as designers, manufacturers, and contractors [34,35]. Kärnä et al. [36] surveyed 831 construction projects to identify seven clusters of factors that typically drive customer satisfaction, finding that management quality and cooperation are the most important factors, indicating a shift in construction towards a service orientation by adopting modern service management methods. However, “soft” measurement tools, such as customer satisfaction, are still relatively underdeveloped in the construction domain, and key construction project stakeholders (e.g., clients and contractors) do not always agree on how to define “satisfaction” and its determinants [37]. Aluko et al. [38] found that perceived service quality has a significant impact on client satisfaction in construction projects, with design economy, budget compliance, and timely delivery being significant determinants of perceived service quality, as well as effectiveness of management collaboration and coordination, integrity and trust, regular site visits, and project management knowledge and skills. Thus, service delivery process factors should focus on enhancing overall client satisfaction, and the technical expertise and skills of project architects should be continuously upgraded through training in order to better understand the project environment. Most of the existing literature on customer satisfaction focuses on new structures, with little or no focus on reconstruction projects. This results in significant gaps in relevant knowledge in this area of construction ontology.
For data analysis, some studies have used QFD to translate customer requirements into final products within the product development life cycle of general products [39] and specifically in building design [30,40]. QFD is a series of activities related to product development, process planning, and production planning oriented toward customer needs. QFD has been used to understand user needs, thus reducing product requirement uncertainty among designers and engineers [41]. The quality function is then used to transform user requirements into improved technologies. The systematic use of the quality function can effectively transform owner needs into design elements through House of Quality (HoQ) operations as a central position in QFD [42]. Figure 2 presents a conceptual diagram of the extension of the quality function. The needs of the owner and user are tracked by collecting data to identify items of need and satisfaction. Furthermore, the data are used in the expansion of functions by the HoQ, and a design product is produced as the output.
In general, the process of distributing the quality function can be divided into four stages as described by Govers [43] with the visualization developed by Yang et al. [30], as presented in Figure 3. The stages are sequential, namely: (1) product planning—using the HoQ to develop customer requirements into detailed product engineering features; (2) component expansion—product engineering characteristics are extended to component characteristics; (3) process planning—extending component characteristics to process operations; and (4) job planning—deploying process operations to the framework of the operation. Figure 4 depicts House of Quality, which is the main tool for implementing QFD, as developed by Akao [43,44]. HoQ is used to process the input data of user requirements and the technical requirements (specifications) using the matrix method to produce a priority order of technical items. Therefore, the HoQ matrix is complex enough to translate user needs and the resulting outputs answer those needs.
Fuzzy numbers have been widely applied to QFD as FQFD [32,33,35,45] because they are considered more applicable to nonlinear real-world systems. Furthermore, FQFD has been hybridized with other approaches such as evidential reasoning (ER), for example in prioritizing transportation designs in the development of interaction trapezoidal weights [46]. On the other hand, FQFD has also been combined with the Kano model to provide an integrated framework to increase satisfaction levels [34], while the combination with quantitative Kano (QKNO) also provides the same results [44]. A hybrid combining FQFD and fuzzy grey relational analysis (FGRA) was implemented to increase satisfaction with advertising services, using user survey questionnaire data [31]. Finally, a hybrid of fuzzy logic, QFD, and genetic algorithm (GA) was used to select the best combination of priority projects to provide business benefits [47].

3. Methodology

This study started with a perception of user dissatisfaction with school reconstruction projects. A review of the relevant literature was followed by questionnaire distribution to collect information on user dissatisfaction with school facilities. An analysis was performed to determine the appropriate weight of each evaluation item, followed by the expansion of the design quality function. This case served to develop two aspects: the design and construction quality functions. However, the paper only focused on the development of the design quality function. The technology development stage was carried out via sensitivity analysis. Next, the architect determined the correlation matrix to discover the correlation between customer requirements and technical improvement strategies. After determining the sequence of design improvement technical strategies, the next step was to introduce fuzzy concepts to eliminate the need for architects. Analysis of the correlation matrix uncertainty using different values improved the order of the technical strategy. The implementation stages of this study are introduced in Figure 5.
Figure 6 shows the data collection and confirmation process, followed by data analysis (complete with the tools used). We started by determining the evaluation framework and factors, followed by the weights of the evaluation items and the level of user satisfaction, and then developed corrective actions for user dissatisfaction.
The HoQ concept was applied for quality development through the following steps [40]:
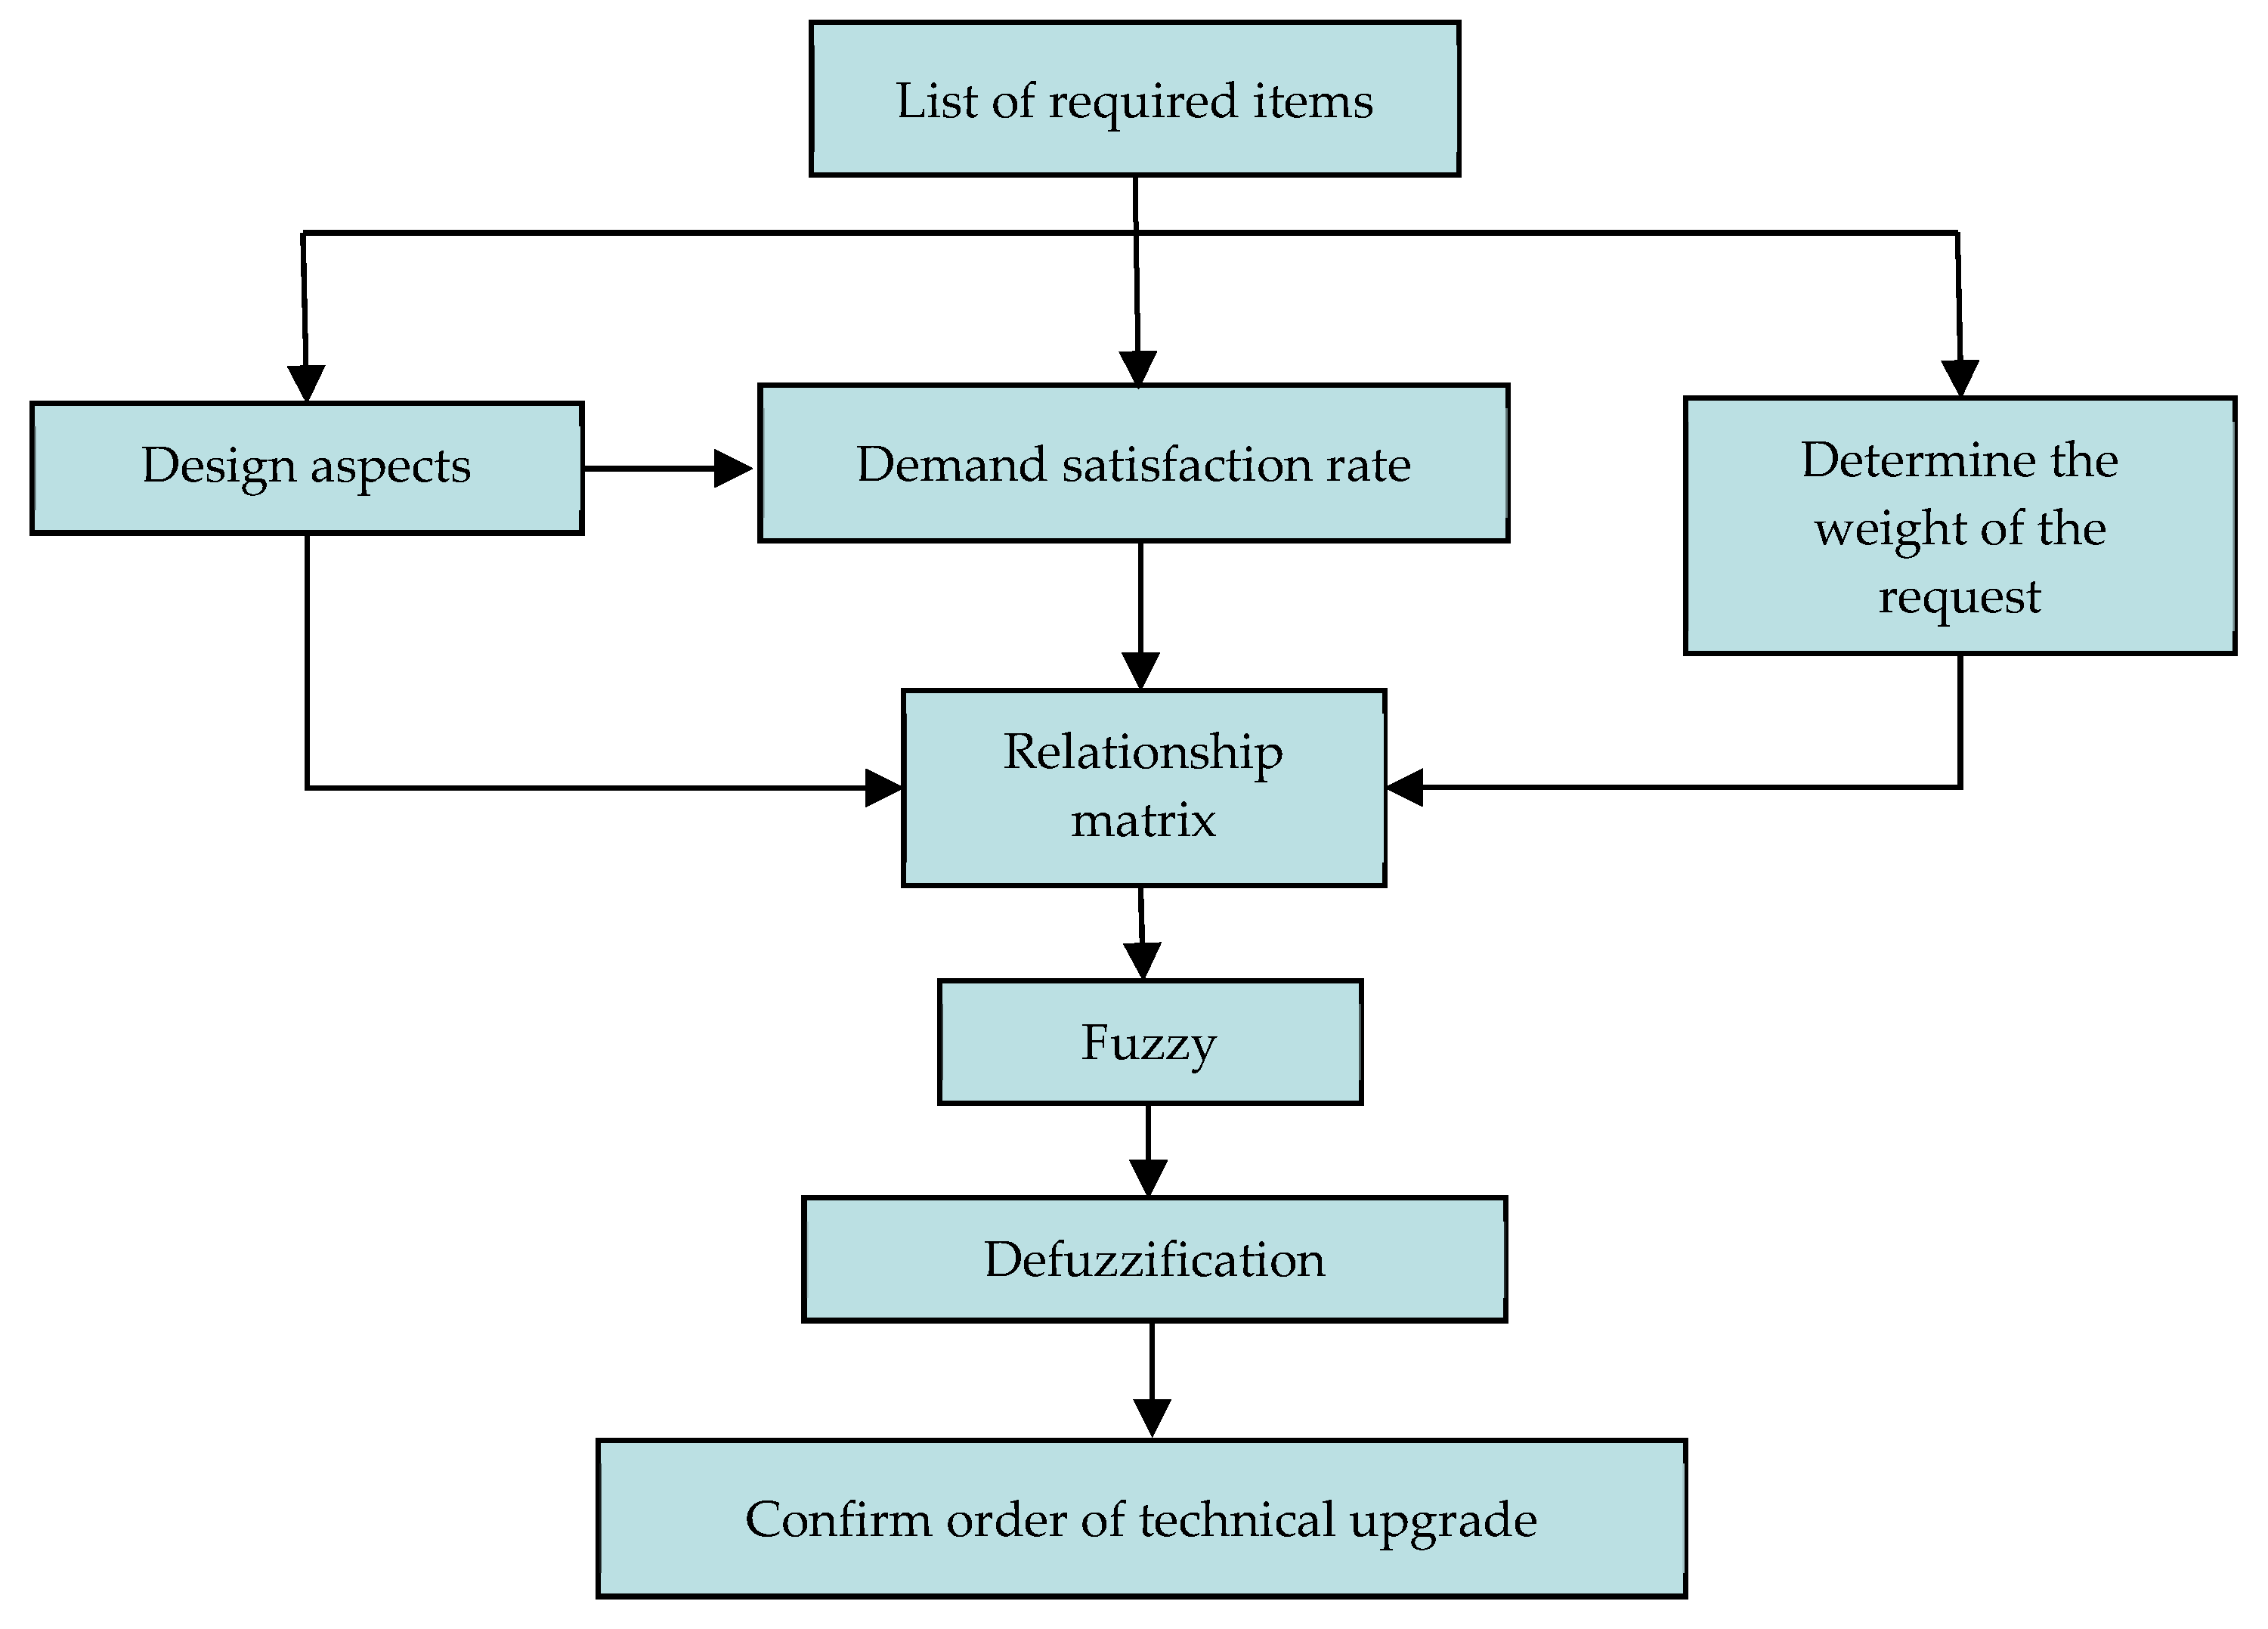
  • Step 1: List customer requirements (What)—what do customers want? Customer-demand information is sourced through a questionnaire with guidance from contractor staff. The questionnaire is used to investigate and analyze customer actions to understand quality requirements and to review previous customer requests and complaints.
  • Step 2: Glossary of technical terms (How)—how to achieve the requirements? Any technical statement must directly affect the customer’s perception of the product and must be stated in measurable terms.
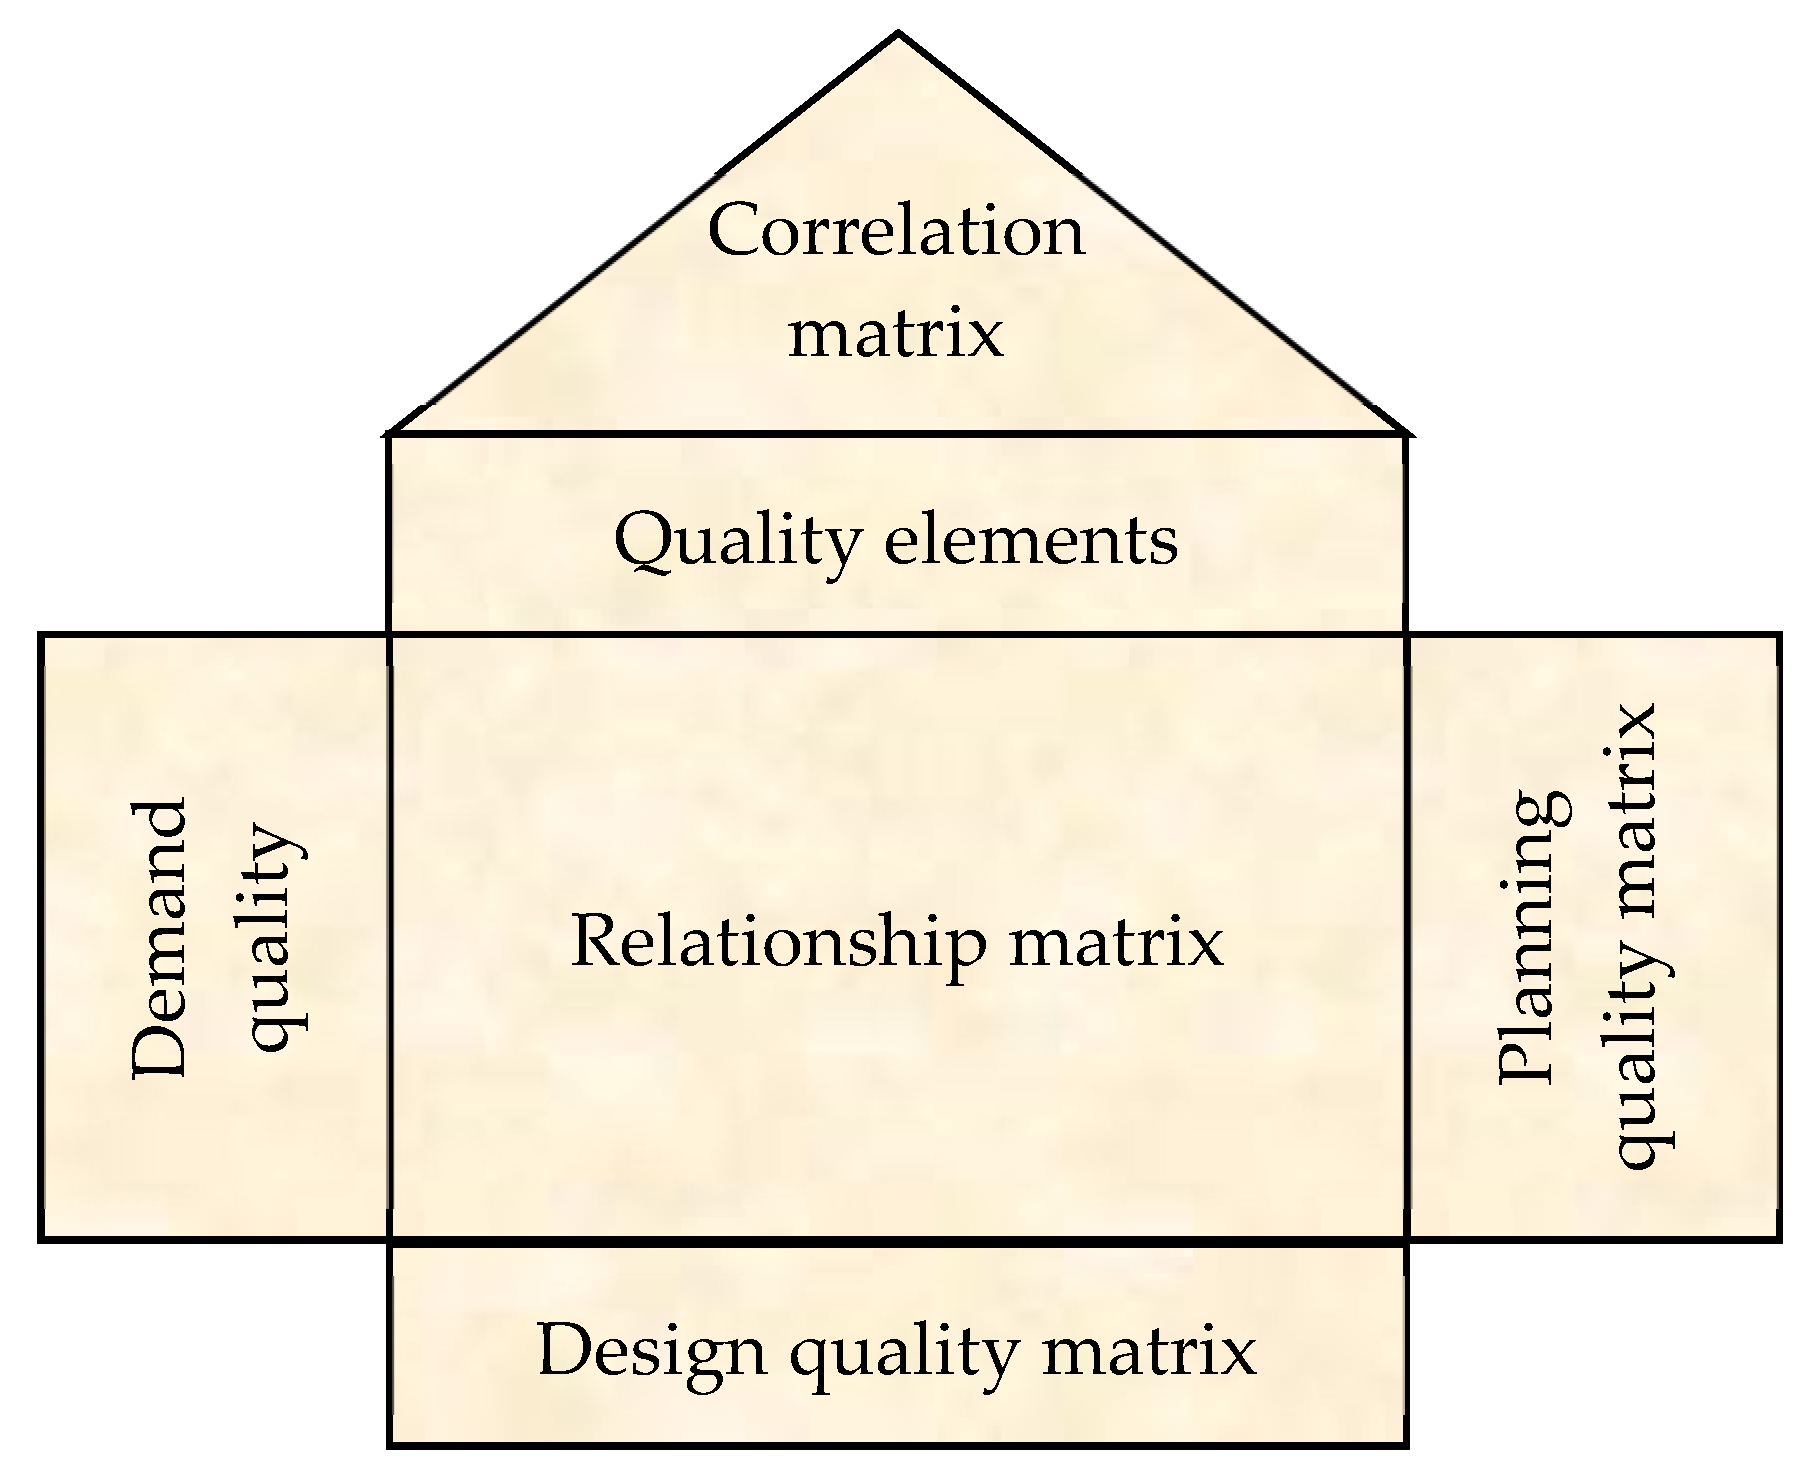
  • Step 3: Develop a matrix of relationships between customer requirements and technical characteristics. The relationship matrix must correctly describe the degree of mutual influence between quality requirements and quality elements. Given the large number of quality requirements and elements, this step may take some time.
  • Step 4: Develop relationships between technical terms (How). The squares in the triangular table (on the roof of the quality house) represent the degree of interrelationship between the technical term items and the degrees can be represented by symbols. For example, “○○” represents a strongly positive relationship, “○” represents a positive relationship, “×” represents a negative relationship, and “××” represents a strongly negative relationship.
  • Step 5: Prioritize customer needs. After market research and customer feedback, we provide a score for each customer’s request, representing the relative importance of the request to the customer compared with all of the other product demand items.
  • Step 6: Prioritize technical statements. The quality function development team needs to determine what needs must be met and which technical requirements must be improved. The priority list of technical terms consists of the following four items: (1) identify technical difficulties, (2) set the target value, (3) calculate the absolute score, and (4) calculate the relative score. The method of assessing the order of priority of the technical statement items depends on the purpose of solving the problem.
Fuzzy theory [48] shows that the α-cut set of fuzzy sets is a clear set of fuzzy set, which is the α-cut set for the confidence interval of fuzzy numbers. The α is the membership strength of the fuzzy number (α value is from 0 to 1). The larger the value, the higher the membership strength [49]; the higher the threshold quality, the more accurate the definite value, and the less the value in the corresponding interval. Otherwise, it means judgment is more ambiguous. The range it forms is as follows [50,51]:
  • A = { x X | μ A ~ ( x ) > α } , α 0 
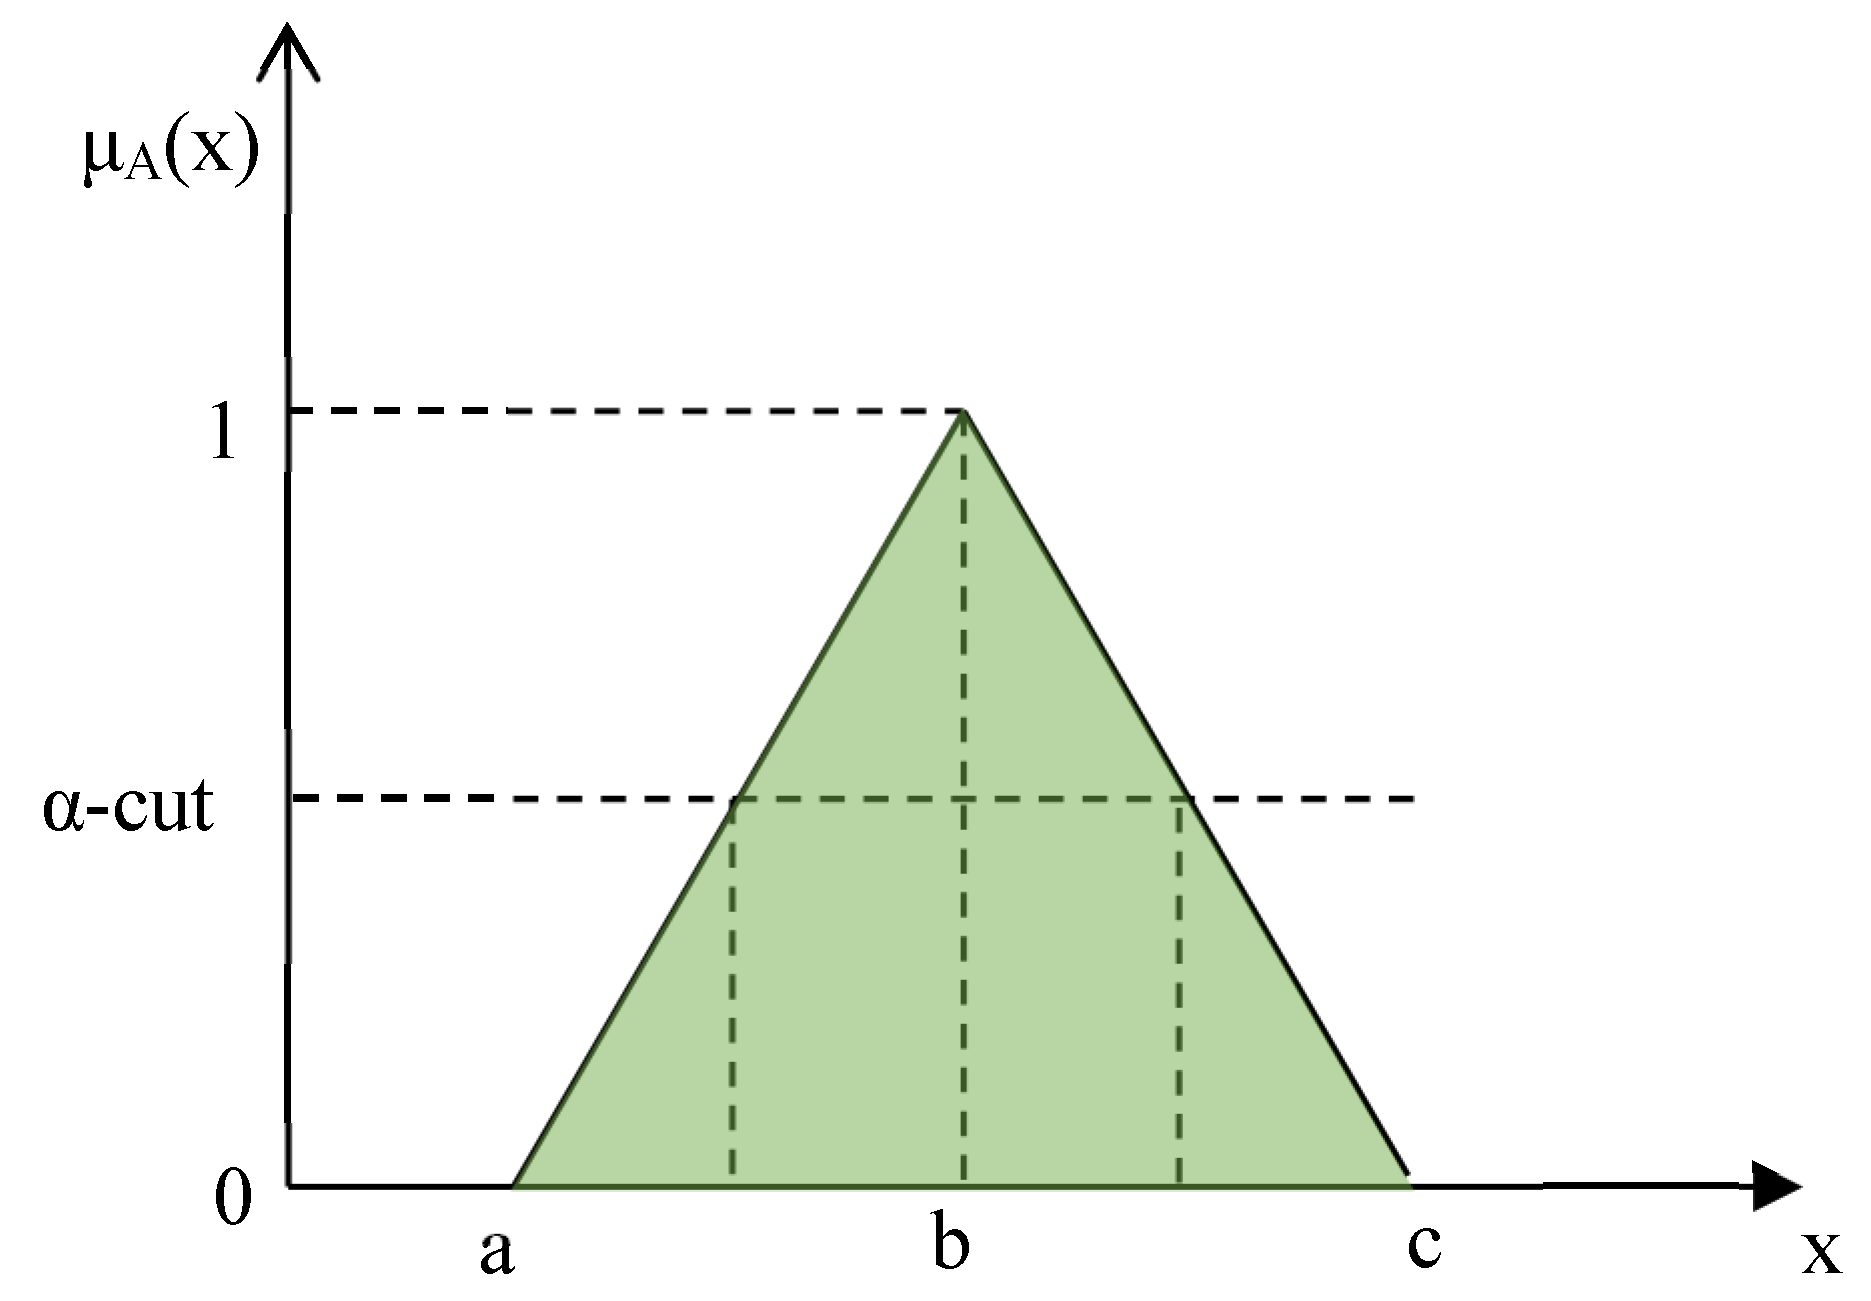
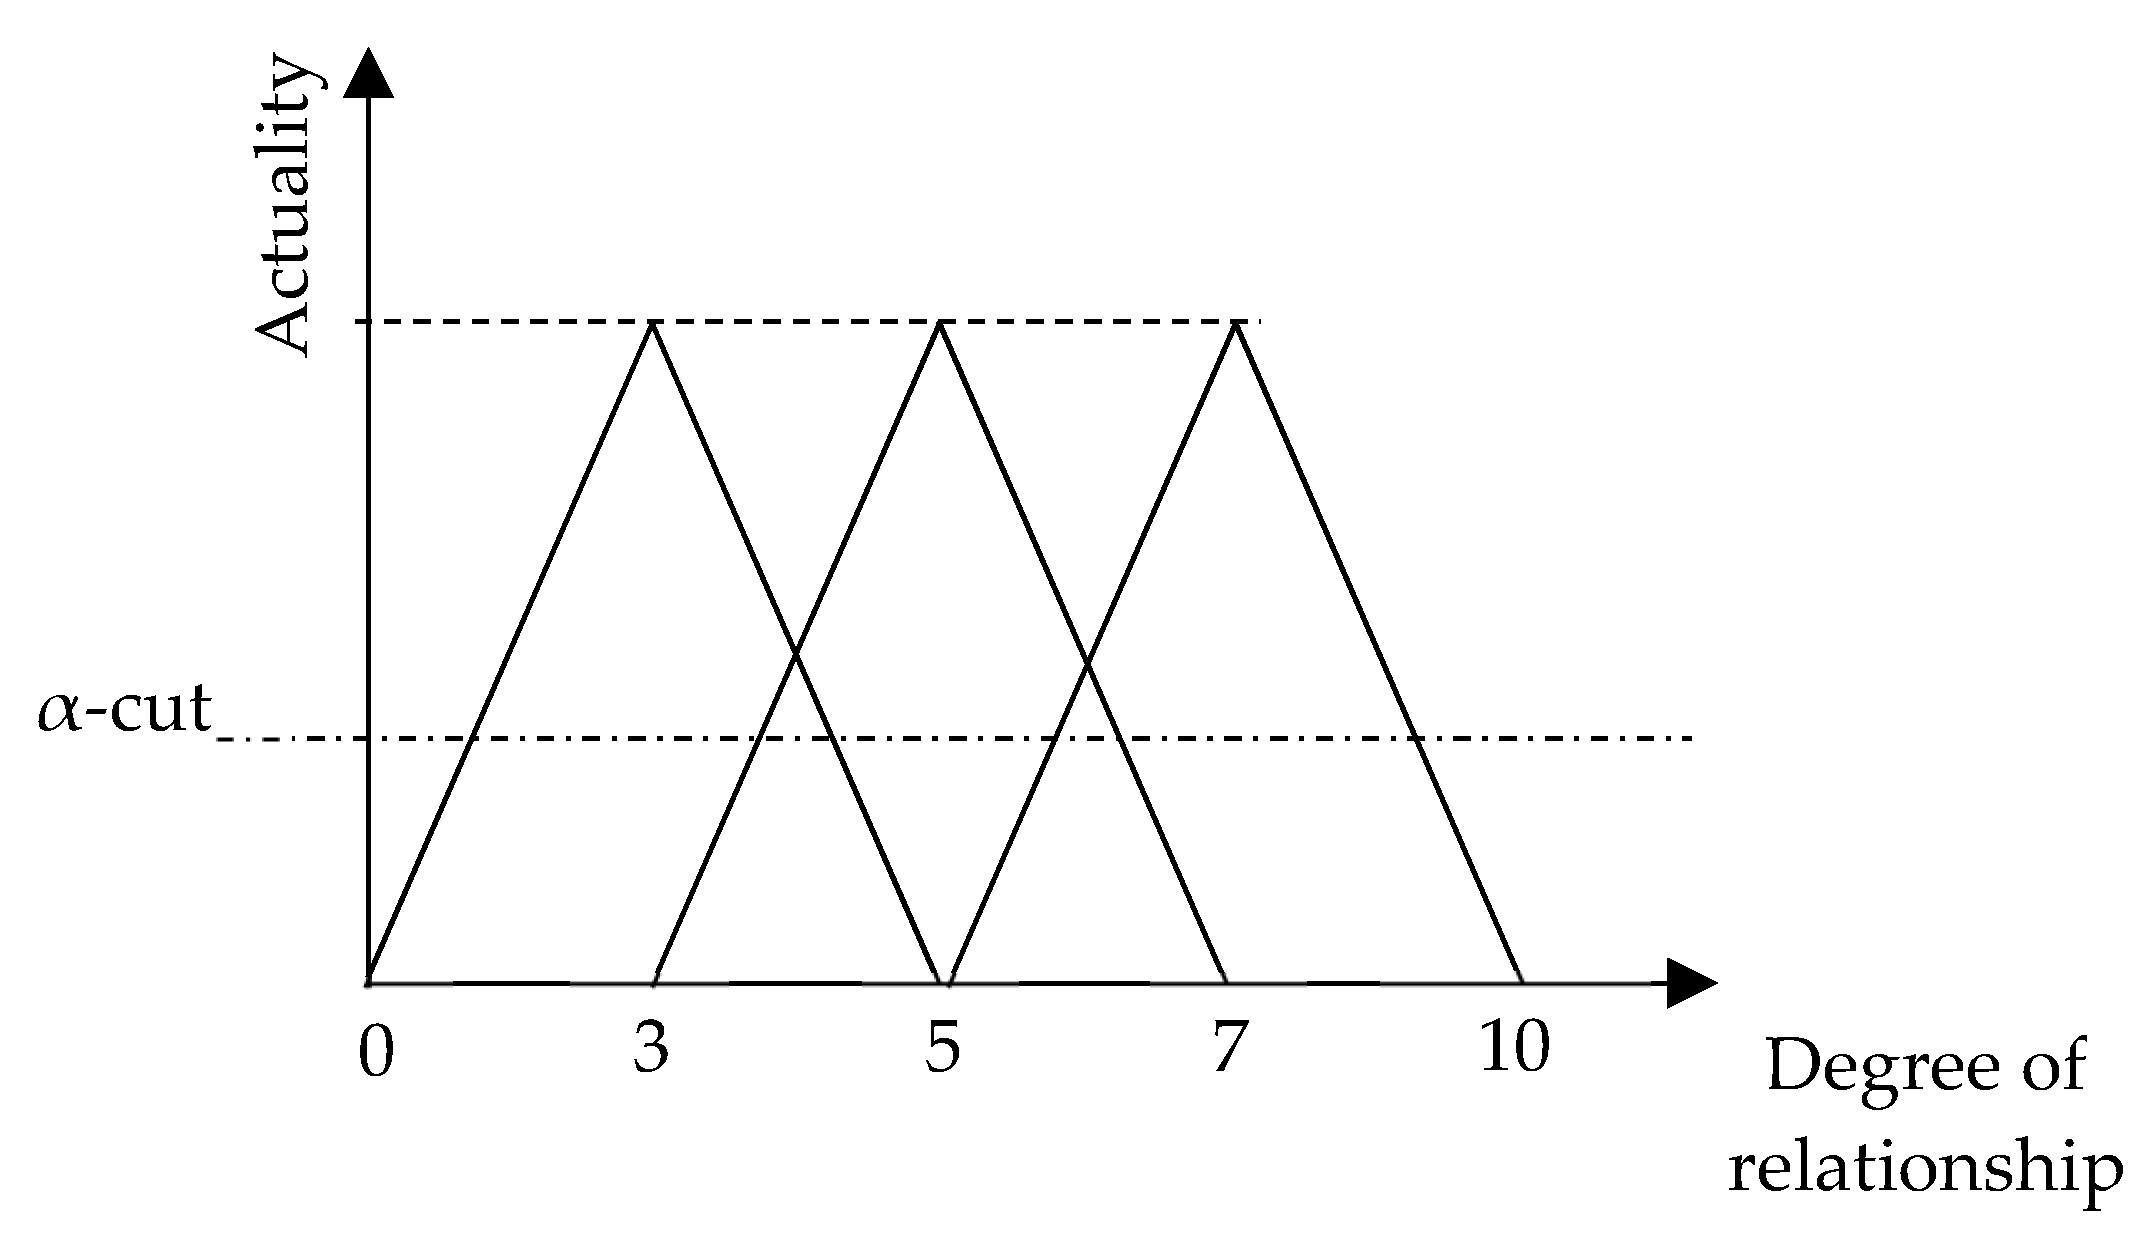
is the cut set of A;
  • When α ≤ µ ≤ 1, X ∈ A (α), and α is a threshold value;
The type of triangular fuzzy number is represented by three numerical values (a, b, and c), where b is the representative of the fuzzy set (mode or middle number), and the degree of membership is the largest; (b) = 1, α-cut is equal to 1, and the corresponding value is a single real value; a and c are the upper and lower limits of fuzzy numbers, with the lowest membership degree, with α-cut equal to 0 (shown in Figure 7).
The upper limit of the α-cut set is 1 and the lower limit is 0. The larger the value, the higher the membership strength, thus the clearer the decision-making environment and the more accurate the selected results. Therefore, the larger the α-cut set used, the smaller the interval. When α = 1, the corresponding value is a single real value (β). α-cut is an important concept of the fuzzy set because it converts a fuzzy set into a clear set. As these elements (α, β, γ) are set in a fuzzy environment, this limit concept is α-cut. The main use of α-cut is to find a clear set of fuzzy sets as a reference value for decision making.
In this study, α-cuts in the fuzzy analysis method are used to represent changes in decision making, and semantic variables are divided into several different degrees (11 α-cuts) to represent the variability of the decision-making environment. The results of the selection will be analyzed and described in detail to determine the priority sequence for technical project improvements. Figure 8 summarizes the sequence of quality technology deployment strategies.

4. Results and Discussion

4.1. Determining the Evaluation Factor Weight

The review of the related literature was used to define the evaluation factors for the school project design satisfaction. The initial questionnaire design contained 19 evaluation factors, and was reviewed by multiple subject matter experts who helped improve the design. The results analysis included descriptive statistical analysis and tests of the stability and consistency of the questionnaire. Further factor analysis and reliability analysis were used to confirm the framework and factors of the satisfaction assessment, extract common elements, and name evaluation factors. The results of these analyzes were verified against the correlation of evaluation factors to determine the order of evaluation modes and the number of items.
When performing factor analysis, we initially used the KMO (Kaiser−Meyer−Olkin), where a value above 0.9 indicates good suitability for factor analysis. Based on the factor analysis and assessment, 19 item evaluation factors were organized into three groups with eigenvalues greater than or equal to 1. This study also compiled the factor loadings of the 19 items and extracted three sub-dimensions for the assessment of school design satisfaction: (1) overall design of classroom space, (2) campus planning and design, and (3) implementation of equipment and environmental protection concepts. Each sub-dimension had a Cronbach’s alpha value greater than 0.7, indicating high reliability.
The completed questionnaire containing 19 satisfaction evaluation items was distributed to school principals and general administrators supervising school reconstruction projects. The questionnaire measured school reconstruction project design satisfaction using a five-point Likert scale, from 5 “very important” to 1 “not at all important”. Of the 293 questionnaires distributed, a total of 148 valid responses were received.
To determine the relative weight of each sub-dimension, we performed a weight analysis using the pair-wise comparison method using the analytic hierarchy process (AHP) method, in the same way as Gorgani et al. [52]. Once the eigenvector weights of each sub-dimension had been determined, the consistency index (CI) and consistency ratio (CR) were found to have values below 0.1, indicating consistency in respondent answers [41,53]. Therefore, the weight value of each sub-dimension has reference significance and can be applied for the construction of evaluation weights. The relative weights of the resulting design satisfaction were 0.265, 0.352, and 0.383 for the three sub-dimensional sequences, respectively. Meanwhile, the weight of each evaluation factor item was determined using a simple weighting method after integrating the average value of the evaluation items in the questionnaire and assigning it based on the sub-dimensional weights of the AHP results. Table 1 summarizes the weights of the school design satisfaction evaluation model.

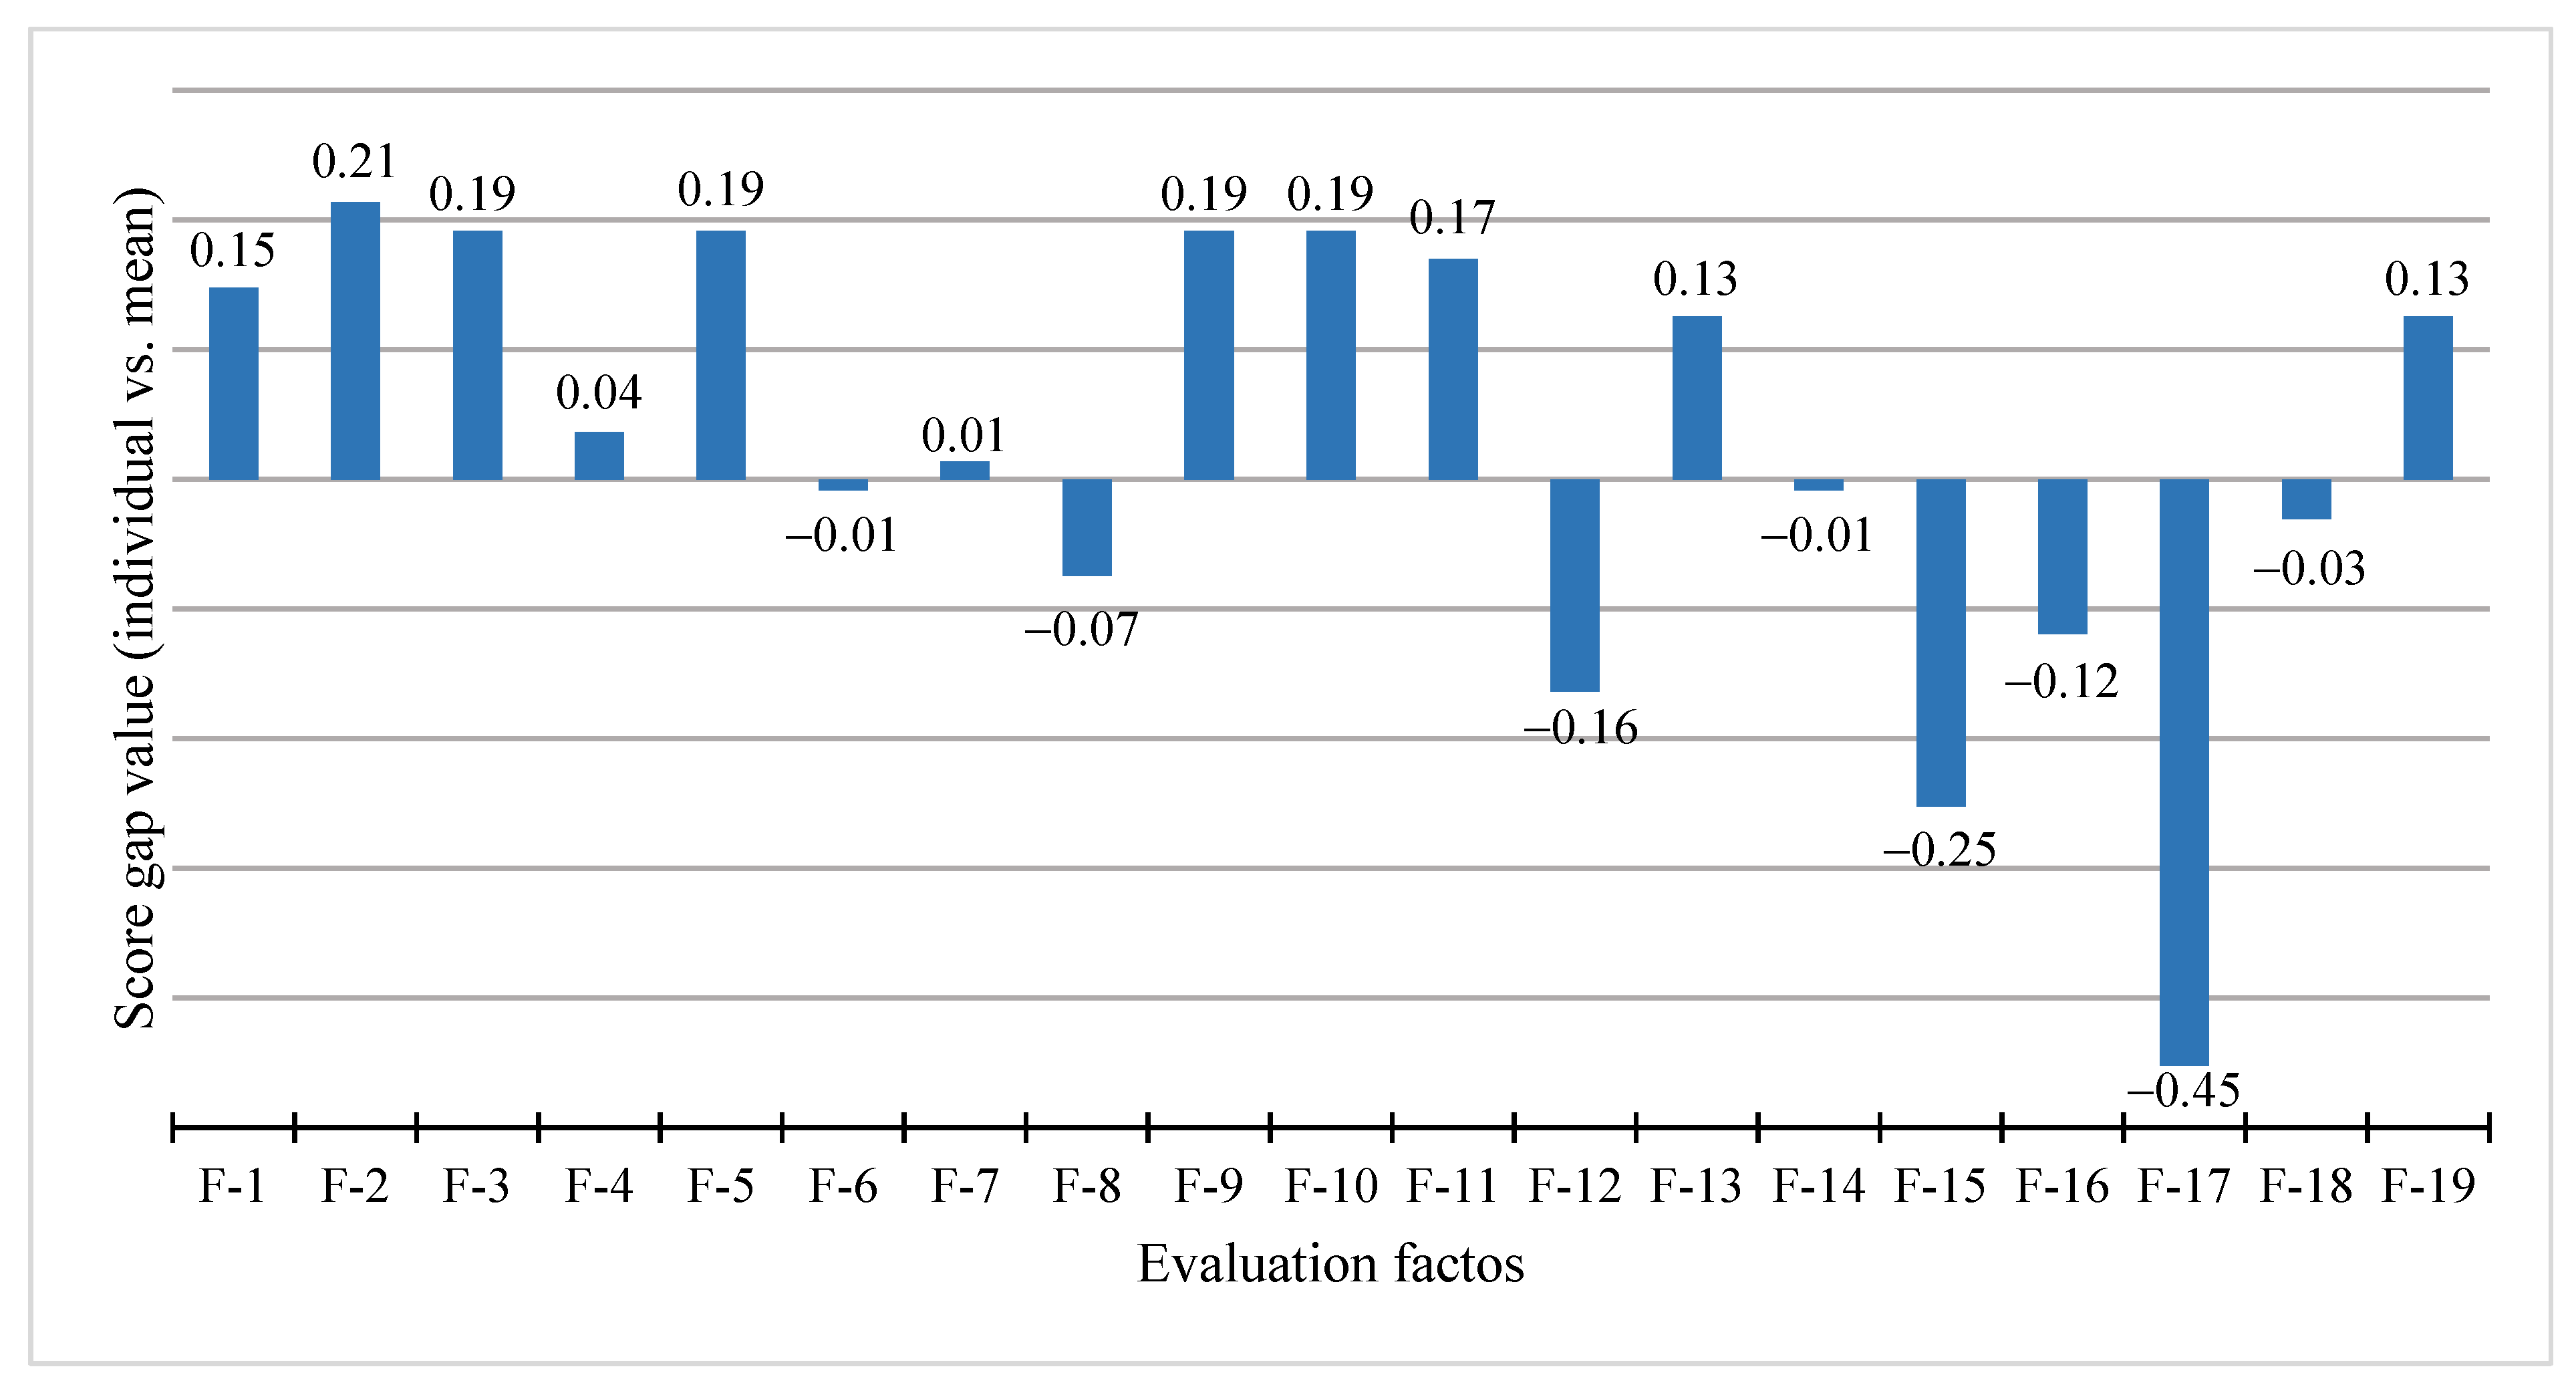
4.2. Satisfaction Valuation

A total of 19 evaluation factors were used to measure project satisfaction. We calculated the satisfaction score based on the respondents’ rate of satisfaction with the design quality (i.e., satisfaction score = evaluation factor weight × satisfaction rating based on the Likert scale score). Finally, the satisfaction scores of each evaluation factor were summed to produce a satisfaction score of each evaluation factor (see Table 1). The average value of satisfaction was then used as the evaluation standard. If the evaluation item was higher than the average, this meant that the item met the user’s needs. If not, the item needed to be improved.
School reconstruction projects frequently overlook the needs of users and maintenance staff. Fully considering and integrating user needs into building design will increase user comfort and overall reconstruction project satisfaction. The design aspect satisfaction results were found to be lower than the overall mean value, indicating the need for further attention and improvement from the designing architect. A total of eight design evaluation items had negative values (Figure 9), all of which fell under the design quality requirements of the House of Quality development. Thus, the architects will need to provide a technical strategy to upgrade the facilities of the new school project.
These results establish design satisfaction as the main consideration for user needs. We then used quality characteristic ratings to measure user satisfaction with school facilities, and user needs were then prioritized based on ranking quality characteristics, where a smaller difference with the overall average indicated a higher priority. After ranking quality characteristics based on the items in Figure 9, the priority order of items for improvement was determined, as shown in Table 2. Table 2 shows that “use of environmentally friendly materials”, “overall quality of design and planning”, and “playground planning” were the top three priorities for school design improvement.

4.3. Technical Improvement Strategies for School Satisfaction with HoQ

Based on the literature review and analysis of the collected data, we proposed improvement strategies to address user dissatisfaction with project facility design quality. In addition to user data, this study also referenced improvement strategies proposed by the architects to increase user satisfaction. Referring to user needs and the quality technology development results, this research developed a House of Quality focused on describing the relationship matrix defining the degree of correlation between quality expansion and technical strategy expansion. House of Quality was used to determine implementation prioritization of the technical strategy components and to determine the technology improvement strategy.
A relationship matrix was jointly created by the architects, school principals, and administrators of other relevant units. The data acquisition matrix was part of the architect’s subjective experience assessment. This study applied four levels of correlation to the implementation of quality and implementation of technical strategies. A 0 score indicated no correlation, while a three-point score indicated a low correlation between user needs and technical strategies, suggesting that technology implementation could only slightly improve on current user dissatisfaction. A five-point score indicated a good correlation, while a seven-point score indicated a strong correlation.
This study explored user satisfaction with school reconstruction projects by allowing architects to fill out a functional House of Quality questionnaire related to the design aspects. This step was implemented to determine the correlation between “user quality requirements” and “technology improvement strategies”. A total of 34 valid questionnaire responses were received, and were used to develop a technology improvement strategy.

4.4. Fuzzy Quality Function Expansion Method

The strength of the relationship between dissatisfied items and corrective actions is a semantic value that needs to be quantified to be measured, and so it is more appropriately described using fuzzy numbers [54,55,56] (see Table 3). This study used the semantic values of triangular fuzzy numbers and membership functions (see Figure 10). α-cut indicates the accuracy factor of the correlation matrix. The higher the α-cut, the more accurate the information obtained, and vice versa. The accuracy of the information obtained was used to determine the sequence of technical improvement strategies to optimize school reconstruction project satisfaction effectively.
Fuzzy numbers were used to express the strength of the relationship between unsatisfactory items in the school reconstruction projects and technical improvement measures. Next, the product design attribute fuzzy number was calculated. By integrating the results of the 34 architect questionnaires and multiplying the weights, the average fuzzy number for design improvement and defuzzification technology (α = 0) could be obtained, as shown in Table 4. Defuzzification was calculated using the formula for the fuzzy integral value of the triangle, as shown in Equations (1) and (2). Based on the defuzzification results shown in Table 4, the graph presents school design items in descending order of importance, with the top five items identified as strategic priorities.
I ( s ˜ ) = ( 1 + α ) 0 1 [ a + ( b a ) ] d y + α 0 1 [ c + ( b c ) y ] d y ,
I ( s ˜ ) = 1 2 [ ( 1 α ) ( a + b ) + α ( b + c ) ] ,
An example of one of the calculations is as follows
I ( s ˜ ) = 1 2 [ ( 1 0 ) ( 2.2 + 3.6 ) + 0 ( 3.6 + 5.2 ) ] = 2.90

4.5. Discussions

In the satisfaction assessment results, the three items from the design aspect that were found to be in greatest need of improvement are “using of environmentally friendly materials”, “overall quality of design and planning”, and “playground planning”. The use of environmentally friendly materials has emerged as an important discourse among researchers and stakeholders, and the overall quality of design and planning must be considered in efforts to protect and improve school environment quality [57]. Hwang et al. [58] proposed using energy-saving materials and room thermal comfort on the roofs of school buildings in Taiwan. Playgrounds are integrated into campus facilities to shape and develop student character, discipline, and morality [59], and must be improved in the school design phase. In fact, schools can be seen as an adequate playground from the perspective of economic and social sustainability [60]. The findings of this study demonstrate the need to improve playground design, where the post-disaster reconstruction of some of the schools surveyed had playgrounds that were not designed according to pre-disaster conditions.
The quality technology implementing strategy in school design is satisfactory if it motivates stakeholders to improve the effectiveness of the school infrastructure, as was achieved in this study. This argument is in line with studies that examined the concept of the relationship between the functionality and aesthetic appearance of school buildings [2], as well as school building renovation decisions [28]. These studies finally encouraged the integration of a comprehensive way of thinking to accommodate the priorities of the client (school) as the user and the architect as the designer. Poor school building maintenance management results from schools and technical teams not being simultaneously involved in the design and construction phase [61]. The present study focused on developing a strategy for the effective implementation of technology based on school users other than the architects through the development of HoQ.
Of the three sub-dimensional school design assessments, “implementation of equipment and environmental protection concepts” and “campus planning and design” were found to be the most urgent sub-dimensions in need of improvement. Through the use of defuzzification techniques, this research prioritized the implementation of quality technology deployment strategies, deriving five key quality improvement suggestions:
  • Consideration of practicality
    Analysis results favor this strategy, indicating that the architect’s lack of understanding of the school’s basic operational needs result in the designed facilities failing to maximize practical functionality. Before approving a school reconstruction project, the architect should actively solicit input from school users regarding their needs, which are then integrated as much as possible into the actual project design. Architects should also better understand the unique usage characteristics of school buildings as opposed to general public buildings. Aside from aesthetic considerations, school facilities must meet needs determined by pedagogic-administrative logic [2].
  • Planning use points and maintenance methods
    Some of the schools surveyed had historical experience of post-disaster reconstruction using inappropriate designs and materials to accelerate reconstruction. In addition, suppliers (e.g., lighting fixtures) often provided discontinued stock items, which complicated future replacement. Architects should give greater consideration to long-term sustainable use and guide school users in maximizing facility lifespans through regular and appropriate maintenance and repair.
  • Design the site according to the local terrain
    Prior to the design stage, the architect must have a strong understanding of the school location and the surrounding environment, thus ensuring that the ensuing design makes full use of the terrain to maximize cost and energy savings. Architects must seek to preserve pre-existing resources in the school area (e.g., natural resources in the form of water, grass, and trees), and potential energy sources around the site must be protected for future use. In principle, architects should explore green building concepts further in the design process [60] in consultation with school users.
  • Use materials that match the layout of the environment
    The choice of materials needs to account not only for building codes, but also for actual usage patterns. Today’s architects should have a sufficient understanding of environmental, economic, and social sustainability concepts and practices, as well as the wide array of green construction materials and technologies that are available for use. Extreme temperature changes can negatively impact building material quality, but conversely, the selection of building materials can also affect room temperature and thus building energy efficiency. Currently, all parties, including designers and contractors, are required to participate in minimizing negative environmental impacts due to construction. It is important to note that environmental performance and building comfort are interrelated and mutually influential [3].
  • Consideration of constructability
    Architects not only produce designs in the form of building and landscape drawings, but must consider construction costs and design feasibility. Furthermore, overall project planning encompasses environmental planning, work methods, and the necessary models. Therefore, the architect must maintain a close relationship with on-site construction managers during the entire reconstruction project, thereby maximizing the efficacy of problem resolution [62].

5. Conclusions and Recommendation

User satisfaction is a key driver for user retention, and is widely seen as a key challenge for quality improvement in the construction industry, which must develop improved strategies for understanding client concerns and priorities, thereby optimizing the deployment of capital and other resources.
This study explores user satisfaction with school reconstruction outcomes in central Taiwan. While satisfaction is determined by both construction and design quality, this research focuses on the quality of school design. Questionnaires were distributed to teachers, school administrators, and architects to collect data that were then analyzed using the quality function expansion method to prioritize technical improvement strategies. Fuzzy concepts were utilized to eliminating the uncertainty of the correlation matrix, thereby enhancing the extension of the quality function. When calculating the weight of quality requirements, characteristic evaluation is utilized to rank priorities for school design improvement. The fuzzy concept can reduce the fuzzy degree of the correlation matrix from 0 to 1.
School reconstruction projects often fail to account for the actual requirements of facilities users and maintenance, thus reducing user comfort and overall project satisfaction, which is measured using 19 evaluation factors. For school reconstruction design improvement, the top three priorities are “using of environmentally friendly materials”, “overall quality of design and planning”, and “playground planning”. The present study focuses on identifying strategies for optimizing the implementation of technologies using HoQ to integrate the views of the architect as a project user. Defuzzification is used to prioritize quality technology deployment strategies, producing five key quality improvement suggestions: (1) consideration of practicality, (2) planning use points and maintenance methods, (3) design the site according to the local terrain, (4) use materials that match the layout of the environment, and (5) consideration of constructability.
To improve school design quality, this paper suggests certain quality technology deployment strategies: adopt designs that consider practicality based on actual school users’ needs, prioritize the use of materials and components with reliable future supply, design schools according to local terrain characteristics to maximize efficiency, consider ease of construction in school design, and prioritize the use of environmentally friendly construction materials. In addition to improving user satisfaction, these proposed strategies will also provide concrete environmental benefits. Moreover, formalizing architect and designer consultation with users and owners in the design stage will help manage user expectations and maximize user satisfaction.
While not typically used in traditional design approaches, the QFD method can be used to reduce design errors effectively and is thus worthy of further exploration. In terms of QFD operations, this study did not consider constraints such as resources, budgets, and schedules. Given the importance of such considerations in the effective implementation of technology improvement strategies, further research should consider resource limitations so as to increase the practicality of the Ho Q approach.
The proposed approach could be used to enhance the efficiency of the reconstruction of aging buildings in Taiwan and elsewhere, and the present research results can also address ontological gaps regarding the reconstruction of aging campus buildings. The data collected in this study are specific to central Taiwan and thus the findings can not necessarily be generalized to the rest of Taiwan; therefore, additional research is warranted. In addition, although the main clients of this study are school principals and administrators, schools have other types of stakeholders who can provide useful insight. Students, for example, are intimately familiar with facilities and equipment design, and their parents and nearby residents also have a high degree of interest in school facilities and equipment. Therefore, future work should seek to include data from such stakeholders to capture relevant and detailed user feedback for integration into future facility design decisions.

Author Contributions

Conceptualization, W.-T.C.; methodology, W.-T.C. and C.-H.K.; software, K.-H.L. and F.N.L.; validation, W.-T.C. and C.-H.K.; formal analysis, F.N.L., M.M. and K.-H.L.; investigation, K.-H.L., M.M. and F.N.L.; resources, W.-T.C.; data curation, F.N.L.; writing—original draft preparation, W.-T.C. and F.N.L.; writing—review and editing, W.-T.C. and C.-H.K.; visualization, K.-H.L.; supervision, W.-T.C.; project administration, K.-H.L., M.M. and F.N.L. All authors have read and agreed to the published version of the manuscript.

Funding

This research received no external funding.

Data Availability Statement

The data used in this study are available from the corresponding author upon request.

Conflicts of Interest

The authors declare no conflict of interest.

References

  1. Tijanić Štrok, K.; Marenjak, S.; Car-Pušić, D. Analysis of the current maintenance management process in school buildings: Study area of Primorje-Gorski Kotar County, Republic of Croatia. Front. Built Environ. 2022, 8, 912326. [Google Scholar] [CrossRef]
  2. Töpper, D.; Isensee, F. From ‘school building’ to ‘school architecture’—School technicians, grand school buildings and educational architecture in Prussia and the USA in the nineteenth century. Hist. Mem. Educ. 2021, 13, 375–423. [Google Scholar] [CrossRef]
  3. Katić, D.; Krstić, H.; Marenjak, S. Energy performance of school buildings by construction periods in federation of Bosnia and Herzegovina. Buildings 2021, 11, 42. [Google Scholar] [CrossRef]
  4. Liu, S.S.; Arifin, M.F.A. Preventive maintenance model for national school buildings in Indonesia using a constraint programming approach. Sustainability 2021, 13, 1874. [Google Scholar] [CrossRef]
  5. Norazman, N.; Che-Ani, A.I.; Ja’afar, N.H.; Khoiry, M.A. Standard compliance and suitability of classroom capacity in secondary school buildings. J. Facil. Manag. 2019, 17, 238–248. [Google Scholar] [CrossRef]
  6. Chen, W.T. Design Satisfaction Measurement. Int. J. Inf. Technol. Proj. Manag. 2013, 4, 75–91. [Google Scholar] [CrossRef]
  7. Becker, R.; Goldberger, I.; Paciuk, M. Improving energy performance of school buildings while ensuring indoor air quality ventilation. Build. Environ. 2007, 42, 3261–3276. [Google Scholar] [CrossRef]
  8. Hassanain, M.A.; Mathar, H.; Aker, A. Post-occupancy evaluation of a university student cafeteria. Archit. Eng. Des. Manag. 2016, 12, 67–77. [Google Scholar] [CrossRef]
  9. Hassanain, M.A.; Iftikhar, A. Framework model for post-occupancy evaluation of school facilities. Struct. Surv. 2015, 33, 322–336. [Google Scholar] [CrossRef]
  10. Hassanain, M.A.; Mudhei, A.A. Post-occupancy evaluation of academic and research library facilities. Struct. Surv. 2006, 24, 230–239. [Google Scholar] [CrossRef]
  11. Li, L.H.; Wu, F.; Su, B. Impacts of library space on learning satisfaction—An empirical study of University Library Design in Guangzhou, China. J. Acad. Librariansh. 2018, 44, 724–737. [Google Scholar] [CrossRef]
  12. Da Silva, M.B.C.; Giacometti Valente, M.; Petroli, A.; Detoni, D.; Milan, G.S. Perceived quality of built environment, service, satisfaction and value in use, in the context of residential buildings. J. Facil. Manag. 2020, 18, 451–468. [Google Scholar] [CrossRef]
  13. Du, X.; Zhang, Y.; Lv, Z. Investigations and analysis of indoor environment quality of green and conventional shopping mall buildings based on customers’ perception. Build. Environ. 2020, 177, 106851. [Google Scholar] [CrossRef]
  14. Jonsson, R. Increasing the competitiveness of wood in material substitution: A method for assessing and prioritizing customer needs. J. Wood Sci. 2006, 52, 154–162. [Google Scholar] [CrossRef]
  15. Torbica, Z.M.; Stroh, R.C. Customer satisfaction in home building. J. Constr. Eng. Manag. 2001, 127, 82–86. [Google Scholar] [CrossRef]
  16. Yi, Y.; Nataraajan, R. Customer satisfaction in Asia. Psychol. Mark. 2018, 35, 387–391. [Google Scholar] [CrossRef]
  17. Elyna Myeda, N.; Nizam Kamaruzzaman, S.; Pitt, M. Measuring the performance of office buildings maintenance management in Malaysia. J. Facil. Manag. 2011, 9, 181–199. [Google Scholar] [CrossRef]
  18. Forsythe, P.J. Construction service quality and satisfaction for a targeted housing customer. Eng. Constr. Archit. Manag. 2016, 23, 323–348. [Google Scholar] [CrossRef]
  19. Nahmens, I.; Ikuma, L.H. Discovering the variables that influence new home-buyer service satisfaction. Int. J. Consum. Stud. 2009, 33, 581–590. [Google Scholar] [CrossRef]
  20. The Science of Customer Satisfaction. American Customer Satisfaction Index. Available online: https://www.theacsi.org/company/the-science-of-customer-satisfaction/ (accessed on 29 September 2022).
  21. Chen, W.T.; Liao, S.L.; Lu, C.S.; Mortis, L. Evaluating satisfaction with PCM services for school construction: A case study of primary school projects. Int. J. Proj. Manag. 2010, 28, 296–310. [Google Scholar] [CrossRef]
  22. Ahmed, H.; Edwards, D.J.; Lai, J.H.K.; Roberts, C.; Debrah, C.; Owusu-Manu, D.G.; Thwala, W.D. Post occupancy evaluation of school refurbishment projects: Multiple case study in the UK. Buildings 2021, 11, 169. [Google Scholar] [CrossRef]
  23. Roberts, C.J.; Edwards, D.J.; Hosseini, M.R.; Mateo-Garcia, M.; Owusu-Manu, D.G. Post-occupancy evaluation: A review of literature. Eng. Constr. Archit. Manag. 2019, 26, 2084–2106. [Google Scholar] [CrossRef]
  24. Preiser, W.F.E. Post-occupancy evaluation: How to make buildings work better. Facil. J. 2006, 13, 19–28. [Google Scholar] [CrossRef]
  25. Le, A.T.H.; Domingo, N.; Rasheed, E.O.; Park, K. Maturity model of building maintenance management for New Zealand’s state schools. Build. Res. Inf. 2022, 50, 438–451. [Google Scholar] [CrossRef]
  26. Le, A.T.H.; Domingo, N.; Rasheed, E.O.; Park, K. Building and property management framework for state schools in New Zealand. Facilities 2021, 39, 172–195. [Google Scholar] [CrossRef]
  27. Le, A.T.H.; Domingo, N.; Rasheed, E.O.; Park, K. Strategic collaboration in managing existing buildings in New Zealand’s state schools: School managers’ perspectives. Constr. Manag. Econ. 2022, 40, 173–185. [Google Scholar] [CrossRef]
  28. Farsäter, K.; Olander, S. Early decision-making for school building renovation. Facilities 2019, 37, 981–994. [Google Scholar] [CrossRef]
  29. Damoah, I.S.; Tingbani, I.; Kumi, D.K.; Akwei, C.C.; Amoako, I.O. Factors influencing school building construction projects abandonment. Int. J. Constr. Manag. 2022, 22, 961–976. [Google Scholar] [CrossRef]
  30. Yang, Y.Q.; Wang, S.Q.; Dulaimi, M.; Low, S.P. A fuzzy quality function deployment system for buildable design decision-makings. Autom. Constr. 2003, 12, 381–393. [Google Scholar] [CrossRef]
  31. Chou, T.Y. Using FQFD and FGRA to enhance the advertising effectiveness of cross-regional e-commerce platforms. Mathematics 2020, 8, 650. [Google Scholar] [CrossRef]
  32. Kurtulmuşoğlu, F.B.; Pakdil, F.; Atalay, K.D. Quality improvement strategies of highway bus service based on a fuzzy quality function deployment approach. Transp. A Transp. Sci. 2016, 12, 175–202. [Google Scholar] [CrossRef]
  33. Lin, L.Z.; Chen, W.C.; Chang, T.J. Using FQFD to analyze island accommodation management in fuzzy linguistic preferences. Expert Syst. Appl. 2011, 38, 7738–7745. [Google Scholar] [CrossRef]
  34. Lin, L.Z.; Yeh, H.R.; Wang, M.C. Integration of Kano’s model into FQFD for Taiwanese Ban-Doh banquet culture. Tour. Manag. 2015, 46, 245–262. [Google Scholar] [CrossRef]
  35. Yang, W.S.; Liang, G.S.; Ding, J.F. Identifying solutions for adding service value to international port logistics centers in Taiwan. Marit. Econ. Logist. 2013, 15, 395–415. [Google Scholar] [CrossRef]
  36. Kärnä, S.; Junnonen, J.; Sorvala, V. Modelling structure of customer satisfaction with construction. J. Facil. Manag. 2009, 7, 111–127. [Google Scholar] [CrossRef]
  37. Alshihre, F.; Chinyio, E.; Nzekwe-Excel, C.; Daniel, E.I. Pursuing alignment of clients’ and contractors’ perceptions of client satisfaction in Saudi Arabian projects. Built Environ. Proj. Asset Manag. 2022; ahead-of-print. [Google Scholar] [CrossRef]
  38. Aluko, O.R.; Idoro, G.I.; Mewomo, M.C. Relationship between perceived service quality and client satisfaction indicators of engineering consultancy services in building projects. J. Eng. Des. Technol. 2021, 19, 557–577. [Google Scholar] [CrossRef]
  39. Yuen, K.K.F. A hybrid fuzzy quality function deployment framework using cognitive network process and aggregative grading clustering: An application to cloud software product development. Neurocomputing 2014, 142, 95–106. [Google Scholar] [CrossRef]
  40. Zhang, Y.; Chen, Y.; Li, X. Integrated framework of knowledge-based decision support system for user-centered residential design. Expert Syst. Appl. 2022, 216, 119412. [Google Scholar] [CrossRef]
  41. Kürüm Varolgüneş, F.; Canan, F.; Del Río-Rama, M.d.l.C.; Oliveira, C. Design of a thermal hotel based on AHP-QFD Methodology. Water 2021, 13, 2109. [Google Scholar] [CrossRef]
  42. Mao, L.X.; Liu, R.; Mou, X.; Liu, H.C. New approach for Quality Function Deployment using Linguistic Z-Numbers and EDAS method. Informatica 2021, 32, 565–582. [Google Scholar] [CrossRef]
  43. Govers, C.P.M. QFD not just a tool but a way of quality management. Int. J. Prod. Econ. 2001, 69, 151–159. [Google Scholar] [CrossRef]
  44. Shan, H.; Fan, X.; Long, S.; Yang, X.; Yang, S. An Optimization design method of express delivery service based on quantitative Kano model and Fuzzy QFD model. Discret. Dyn. Nat. Soc. 2022, 2022, 5945908. [Google Scholar] [CrossRef]
  45. Liang, G.S.; Chou, T.Y.; Kan, S.F. Applying fuzzy quality function deployment to identify service management requirements for an ocean freight forwarder. Total Qual. Manag. Bus. Excell. 2006, 17, 539–554. [Google Scholar] [CrossRef]
  46. Habibi, H.M.; Mirzahossein, H.; Afandizadeh Zargari, S. Hybrid approach of technical requirements prioritizing to meet the needs of road high-demand public transportation under uncertainty conditions: A case study of Arba’een trips. Case Stud. Transp. Policy 2021, 9, 681–692. [Google Scholar] [CrossRef]
  47. Beseiso, M.; Kumar, G. A fuzzy computational approach for selecting interdependent projects using prioritized criteria. J. Intell. Fuzzy Syst. 2021, 40, 11341–11354. [Google Scholar] [CrossRef]
  48. Zadeh, L.A. Fuzzy Sets. Inf. Control. 1965, 8, 338–353. [Google Scholar] [CrossRef]
  49. Ahmad, M.; Cheng, W. A novel approach of fuzzy control chart with fuzzy process capability indices using alpha cut triangular fuzzy number. Mathematics 2022, 10, 3572. [Google Scholar] [CrossRef]
  50. Zhang, Z.X.; Wang, L.; Wang, Y.M.; Martínez, L. A novel alpha-level sets based fuzzy DEMATEL method considering experts’ hesitant information. Expert Syst. Appl. 2023, 213, 118925. [Google Scholar] [CrossRef]
  51. Wang, Y.M. Centroid defuzzification and the maximizing set and minimizing set ranking based on alpha level sets. Comput. Ind. Eng. 2009, 57, 228–236. [Google Scholar] [CrossRef]
  52. Gorgani, H.H.; Jahazi, A.; Pak, A.J.; Shabani, S. A hybrid algorithm for adjusting the input parameters of the wirecut EDM machine in order to obtain maximum customer satisfaction. SN Appl. Sci. 2023, 5, 37. [Google Scholar] [CrossRef]
  53. Saaty, T.L. How to make a decision: The Analytic Hierarchy Process. Eur. J. Oper. Res. 1990, 48, 9–26. [Google Scholar] [CrossRef]
  54. Zadeh, L.A. Quantitative fuzzy semantics. In Fuzzy Sets, Fuzzy Logic, and Fuzzy Systems: Selected Papers; Klir, G.C., Yuan, B., Eds.; World Scientific: Singapore, 1996; Volume 6, pp. 105–122. [Google Scholar]
  55. Ghoushchi, S.J.; Osgooei, E.; Haseli, G.; Tomaskova, H. A novel approach to solve fully fuzzy linear programming problems with modified triangular fuzzy numbers. Mathematics 2021, 9, 2937. [Google Scholar] [CrossRef]
  56. Nasiboglu, R.; Nasibov, E. WABL method as a universal defuzzifier in the fuzzy gradient boosting regression model. Expert Syst. Appl. 2023, 212, 118771. [Google Scholar] [CrossRef]
  57. Alhilli, H.K.; Burhan, A.M. Developing a system for assessing the sustainability in school building projects. Environ. Dev. Sustain. 2021, 23, 17483–17502. [Google Scholar] [CrossRef]
  58. Hwang, R.L.; Chen, B.L.; Chen, W.A. Analysis of incorporating a phase change material in a roof for the thermal management of school buildings in hot-humid climates. Buildings 2021, 11, 248. [Google Scholar] [CrossRef]
  59. Chowdhury, T.A.; Synthia, I.J. Determinants of school choice and their relation to success to the institution: A comparative study between public and private schools in Bangladesh. Int. J. Educ. Manag. 2021, 35, 217–231. [Google Scholar] [CrossRef]
  60. Cory Gallo, W.; Seymour, M.W. Environmental considerations of green school grounds. In Marketing the Green School: Form, Function, and the Future; Chan, T.C., Ed.; IGI Global: Hershey, PA, USA, 2015; pp. 129–142. [Google Scholar]
  61. Wuni, I.Y.; Agyeman-Yeboah, S.; Boafo, H.K. Poor Facility Management in the Public Schools of Ghana: Recent Empirical Discoveries. J. Sustain. Dev. Stud. 2018, 11, 1–30. [Google Scholar]
  62. Simmons, M. The Evolution of a Specialised Practice: Consulting and Contracting in the Integrated Envelope Delivery Industry. Archit. Des. 2020, 90, 24–31. [Google Scholar] [CrossRef]
Figure 1. Customer satisfaction architecture diagram [20].
Buildings 13 01239 g001
Figure 2. Concept map of QFD.
Buildings 13 01239 g002
Figure 3. Four stages of QFD [30].
Buildings 13 01239 g003
Figure 4. House of Quality [43,44].
Buildings 13 01239 g004
Figure 5. Research flow chart.
Buildings 13 01239 g005
Figure 6. Stages and analysis tools.
Buildings 13 01239 g006
Figure 7. Triangular ambiguity.
Buildings 13 01239 g007
Figure 8. Technology strategy sequence pattern flow chart.
Buildings 13 01239 g008
Figure 9. Design quality satisfaction.
Buildings 13 01239 g009
Figure 10. Related ambiguous graphs.
Buildings 13 01239 g010
Table 1. Weights of design satisfaction evaluation factors.
Sub-DimensionsFactor CodeEvaluation FactorEvaluation
Factor Weights *
Average ValueStandard Deviation
Overall design of classroom space (0.265)F-1Floor layout of the classroom0.0383.7780.795
F-2Building evaluation of the classroom0.0393.8440.824
F-3Classroom equipment design0.0373.8220.716
F-4Classroom color use0.0383.6670.798
F-5Classroom natural lighting design0.0383.8220.806
F-6Classroom flooring and wall materials0.0383.6220.650
F-7Classroom electricity and lighting0.0373.6440.484
Campus Planning and Design
(0.352)
F-8Landscaping design configuration0.0433.5560.586
F-9Project construction schedule0.0443.8220.535
F-10Building exterior material design0.0473.8220.535
F-11Design incorporates local opinions0.0433.8000.548
F-12Playground planning0.0423.4670.505
F-13Overall style of school buildings0.0463.7560.484
Implementation of equipment and environmental protection concepts
(0.383)
F-14Barrier-free environment design0.0423.6220.535
F-15Overall quality of design and planning0.0453.3780.490
F-16Auxiliary teaching equipment0.0993.5110.549
F-17Using of environmentally friendly materials0.0983.1780.535
Mean3.630
* Evaluation factor weight = relative weight of sub-dimension × average value of items ÷ sum of average value of items in the sub-dimension.
Table 2. School design satisfaction ranking.
Factor CodeEvaluation FactorGapRanking
F-6Classroom flooring and wall materials−0.017
F-8Landscaping design configuration−0.075
F-12Playground planning−0.163
F-14Barrier-free environment design−0.017
F-15Overall quality of design and planning−0.252
F-16Auxiliary teaching equipment−0.124
F-17Using of environmentally friendly materials−0.451
F-18Using of reclaimed water−0.036
Table 3. Relationship of semantic values with fuzzy numbers.
Semantic IntentSlight CorrelatedSlightly RelevantHighly Correlated
Fuzzy numbers L ˜ = (0, 3, 5) M ˜ = (3, 5, 7) H ˜ = (5, 7, 10)
Fuzzy equationμ( L ˜ ) = { x 3 , 0 x 3 5 x 3 , 3 x 5 μ( M ˜ ) = { x 2 , 3 x 5 7 x 2 , 5 x 7 μ( H ˜ ) = { x 5 2 , 5 x 7 10 x 3 , 7 x 10
Table 4. Design improvement technique for average fuzzy number and defuzzification.
No. CodeDesign Quality Technology Improvement StrategiesAverage Fuzzy NumberDefuzzification
(α = 0)
AMaterials that match the layout of the environment(2.2, 3.6, 5.2)2.90
BPlanning use points and maintenance methods(2.6, 4.1, 5.9)3.38
CSelect alternative materials and solutions(1.9, 3.4, 4.9)2.62
DDesign location according to local terrain(2.3, 3.8, 5.4)3.04
EReview of school premises(1.8, 3.1, 4.6)2.47
FConsider the suitability of access and interior space(1.3, 2.6, 3.8)1.97
GConsider detailed sound and light effects(1.1, 2.2, 3.2)1.64
HPlanning indoor and outdoor venues(1.3, 2.5, 3.6)1.89
IConsider versatility(1.5, 2.6, 3.8)2.04
JPlanning to separate the site(1.1, 1.9, 2.8)1.47
KOverall quality of pipeline planning(1.6, 2.6, 3.8)2.08
LConsideration of practicality(2.7, 4.2, 6.1)3.46
MConsideration of ecological diversity and biological characteristics(1.1, 1.8, 2.6)1.42
NReplace inappropriate tree species(0.7, 1.1, 1.7)0.90
OConsideration of the current situation and improve according to the specifications(1.2, 2.2, 3.2)1.70
PDesign considers constructability(2.2, 3.6, 5.3)2.90
Buildings 13 01239 i001
Disclaimer/Publisher’s Note: The statements, opinions and data contained in all publications are solely those of the individual author(s) and contributor(s) and not of MDPI and/or the editor(s). MDPI and/or the editor(s) disclaim responsibility for any injury to people or property resulting from any ideas, methods, instructions or products referred to in the content.

