Article

Experimental and Numerical Study on Axial Compression Cold-Formed Steel Composite Wall under Concentrated Loads

1
Guiyang Engineering Corporation Limited of Power China, Guizhou 550081, China
2
School of Civil Engineering, Chongqing University, Chongqing 400045, China
3
Key Laboratory of New Technology for Construction of Cities in Mountain Area (Chongqing University), Ministry of Education, Chongqing 400045, China
*
Author to whom correspondence should be addressed.
Buildings 2023, 13(5), 1232; https://doi.org/10.3390/buildings13051232
Submission received: 21 April 2023 / Revised: 26 April 2023 / Accepted: 2 May 2023 / Published: 7 May 2023

Abstract

:
This paper presents the experimental and numerical studies in the investigation of the concentrated compressive behaviors of cold-formed steel-foam concrete composite wall. The failure modes, load–displacement curves, and load–strain curves of the specimens were obtained from the experiments. The infilled specimen failed due to distortional buckling of the end stud and cracking of the concrete near the corner of the wall. The strength of the high strength cold-formed steel was not being fully utilized. A finite element model was established by ABAQUS software and validated by the test results to investigate the effect of the concrete strength, steel strength, the spacing between stud openings, and the thickness of the concrete protective layer on the behaviors of the composite wall. The results indicate that the improvement of concrete strength has the most obvious effect on the bearing capacity of the composite wall, while the changes in steel strength, concrete cover thickness, and hole spacing have limited effects.

1. Introduction

The cold-formed thin-walled steel structure residential system plays a critical role in residential architecture, which has been widely used in countries and regions such as Australia, North America, and China. In recent years, cold-formed thin-walled steel structure has been applied widely throughout the whole world, for the advantages of excellent mechanical performance, green prefabricated construction and economic benefit [1,2,3]. Compared to traditional concrete and masonry structures, the advantages of cold-formed thin-walled steel structure include the following: (a) Simple and fast construction, reducing construction costs; (b) lightweight and high-strength, with good seismic performance; (c) green and recyclable ability, in line with sustainable development needs.
Typical cold-formed thin-walled steel composite wall is composed of C-shaped (crimped channel section wall frame column) cold-formed thin-walled steel members, U-shaped (ordinary channel section top beam and bottom beam) cold-formed thin-walled steel members, and gypsum boards or oriented strand boards (OSB board) connected by self-tapping screws. This cold-formed thin-walled steel composite wall system enables fast construction and easy industrialization of buildings [4]. The current research conducted experimental research and theoretical analysis on cold-formed thin-walled steel composite walls, clarifying the influence of factors such as column spacing, construction method, screw spacing, and wall aspect ratio on the mechanical performance of composite walls [5,6]. Vieira et al. [7] studied the effect of different wall panel types on the axial compression performance of cold-formed thin-walled steel composite walls, and the results showed that when the flanges on both sides of the skeleton are connected to the wall panel, that is, both sides of the wall are covered with the wall panel, the failure mode of the cold-formed steel skeleton is mainly due to local buckling, independent of the type of wall panel on both sides. Shi et al. [8] conducted shear bearing capacity tests on cold-formed thin-walled steel structure composite walls, and used the finite element method to analyze the effects of different wall panel materials, steel grades, wall frame column spacing, and screw spacing on the shear bearing capacity of the composite wall. The skeleton curve of the composite wall under reciprocating loads was proposed. Sun et al. [9] carried out experimental studies on the reinforced straw-bale plaster sheathed cold-formed steel-framed shear walls. They found that the straw and the CFS keel without blocking and flat strap have limited in-plane resistance but can still provide lateral support, ensuring that the thin sheathing experiences shear failure instead of premature buckling failure. Zhang et al. [10] conducted experimental and numerical studies on the cold-formed thin-walled steel walls sheathed by paper straw board. They found that the existence of paper straw board and by adding diagonal braces to the CFS frame can significantly improve the shear capacity of CFSSB composite walls.
The cold-formed thin-walled steel lightweight concrete composite wall is one of the important components of the cold-formed thin-walled steel structure residential system. Wang et al. [11] found that the axial bearing capacity and compressive stiffness of cement-based lightweight polymer material wall are significantly higher than those of the gypsum-based composite material wall. The test results showed that the wall studs, infilled material, and wall sheathing together resisted the axial compression. Xu et al. [12,13,14] also carried out shear test research on light steel high-strength foam concrete composite walls. The test results showed that because of the compressive strength of high-strength foam concrete, the limiting effect of the steel frame, and the bond slip between high-strength foam concrete and columns, the composite wall was superior to the traditional cold-formed thin-walled steel shear wall in terms of bearing capacity, ductility, stiffness, and energy dissipation. Liu et al. [15] studied the lateral resistance performance of gypsum-based material filled cold-formed thin-walled steel composite walls. The results showed that, compared with traditional walls, the shear bearing capacity of these composite walls was improved to a certain extent. These composite walls have good energy consumption capacity, and filling with gypsum-based material could improve the ductility of these walls. In addition, an analysis model and a calculation method were proposed for the lateral stiffness, shear bearing capacity, and hysteresis performance of the gypsum-based material filled cold-formed thin-walled steel composite wall. Prabha et al. [16] conducted axial compression tests and theoretical analysis on the cold-formed thin-walled steel composite wall filled with foam concrete. The research results showed that the ductility and bearing capacity of the wall were improved due to the filling of the foam concrete, and the cold-formed thin-walled steel keel was not subject to premature local buckling. A formula for calculating the axial compression bearing capacity of cold-formed steel composite wall filled with foam concrete was proposed. Xu et al. [17] conducted an experimental study on the compression performance of high-strength foam concrete filled cold-formed thin-walled steel composite wall with straw fiber board as the panel. The test results showed that the use of foam concrete as the filling material changed the failure mode of the wall from shear failure of the panel to local buckling failure of the column. The constraint effect of foam concrete on the light steel frame improves the compression bearing capacity of the wall. Wu et al. [18] conducted full-scale specimen study and analysis on the stress characteristics of CFTS composite shear walls filled with lightweight flue gas desulfurization gypsum through shear performance tests. The failure mode, load displacement response, deformation capacity, and energy absorption capacity of the specimen were studied. Improving the density and compressive strength of gypsum filling materials could effectively improve the lateral stiffness and shear strength of CFTS composite shear wall.
Currently, research on the compression of foam concrete composite walls is primarily focused on uniform compression, with relatively less attention given to concentrated compression. However, in actual structures, the wall mainly bears concentrated loads from the beam. Therefore, it is of great significance to study the concentrated compression performance of the wall. To address this gap, this paper conducted experiments on the concentrated compressive behavior of cold-formed thin-walled steel foam concrete composite walls. A secondary distribution beam was used in the experiments to apply the load in order to simulate the actual stress state of the wall. A finite element model was established and validated for further parameter analysis.

2. Experimental Programs

2.1. Specimens Design

A total of three concentrated compression composite walls were designed in this paper, each having a width of 1.2 m and a height of 3.0 m, as presented in Table 1. The typical composite wall (specimen CFSW-1) was comprised of a CFS frame wall, infilled foam concrete, and two gypsum boards, as depicted in Figure 1a. The CFS frame comprised of studs, tracks, and horizontal bracings, which were all made of Q550 cold-formed thin-walled steel. The studs and horizontal bracings were a C-shaped cross-section, with a web of 160 mm, flanges measuring 60 mm, a 20 mm lip, and a thickness of 1.0 mm. Meanwhile, the tracks were a U-shaped cross-section, which incorporated a web measuring 160 mm, flanges measuring 60 mm, and a thickness of 1.0 mm. The end stud of the wall had a back-to-back section connected by double-row self-drilling screws with a space less than 300 mm. The CFS frame wall was connected using ST4.8 self-drilling screws. The concrete cover on both sides of the wall was 30 mm thick. The calcium silicate board was attached to the concrete surface and fixed to the concrete and CFS frame with ST4.8 self-drilling screws with a space less than 300 mm according to JGJ 227-2011 [19]. The two calcium silicate boards were spliced together at the horizontal bracings. Compared with specimen CFSW-1, specimen CFSW-2 had perforated studs, as shown in Figure 1b,c. Since the end studs were more susceptible to local buckling failure [11,17], the opening rate of the end stud was smaller than that of the interior studs. In order to study the effect of foam concrete on the behavior of the composite wall, a specimen CFSW-3 without concrete was designed and 60 mm × 30 mm × 30 mm battens were placed under each screw to replace the concrete cover, as shown in Figure 1d.

2.2. Material Properties

According to GB/T 228.1-2010 [20], five tensile coupons were cut from CFS framing members to obtain the mechanical properties of S550 cold-formed thin-walled steel. The average yield strength, ultimate strength, and elastic modulus were 594.36 MPa, 601.75 MPa, and 212 GPa, respectively.
The mix proportion of foam concrete is shown in Table 2. Three concrete cubes (100 mm × 100 mm × 100 mm) were cast and tested according to JG/T 266-2011 [21]. The test results revealed an average apparent density of 1042.0 g/cm3 and a cube compression strength of 4.80 MPa at 28 days, as shown in Table 3.

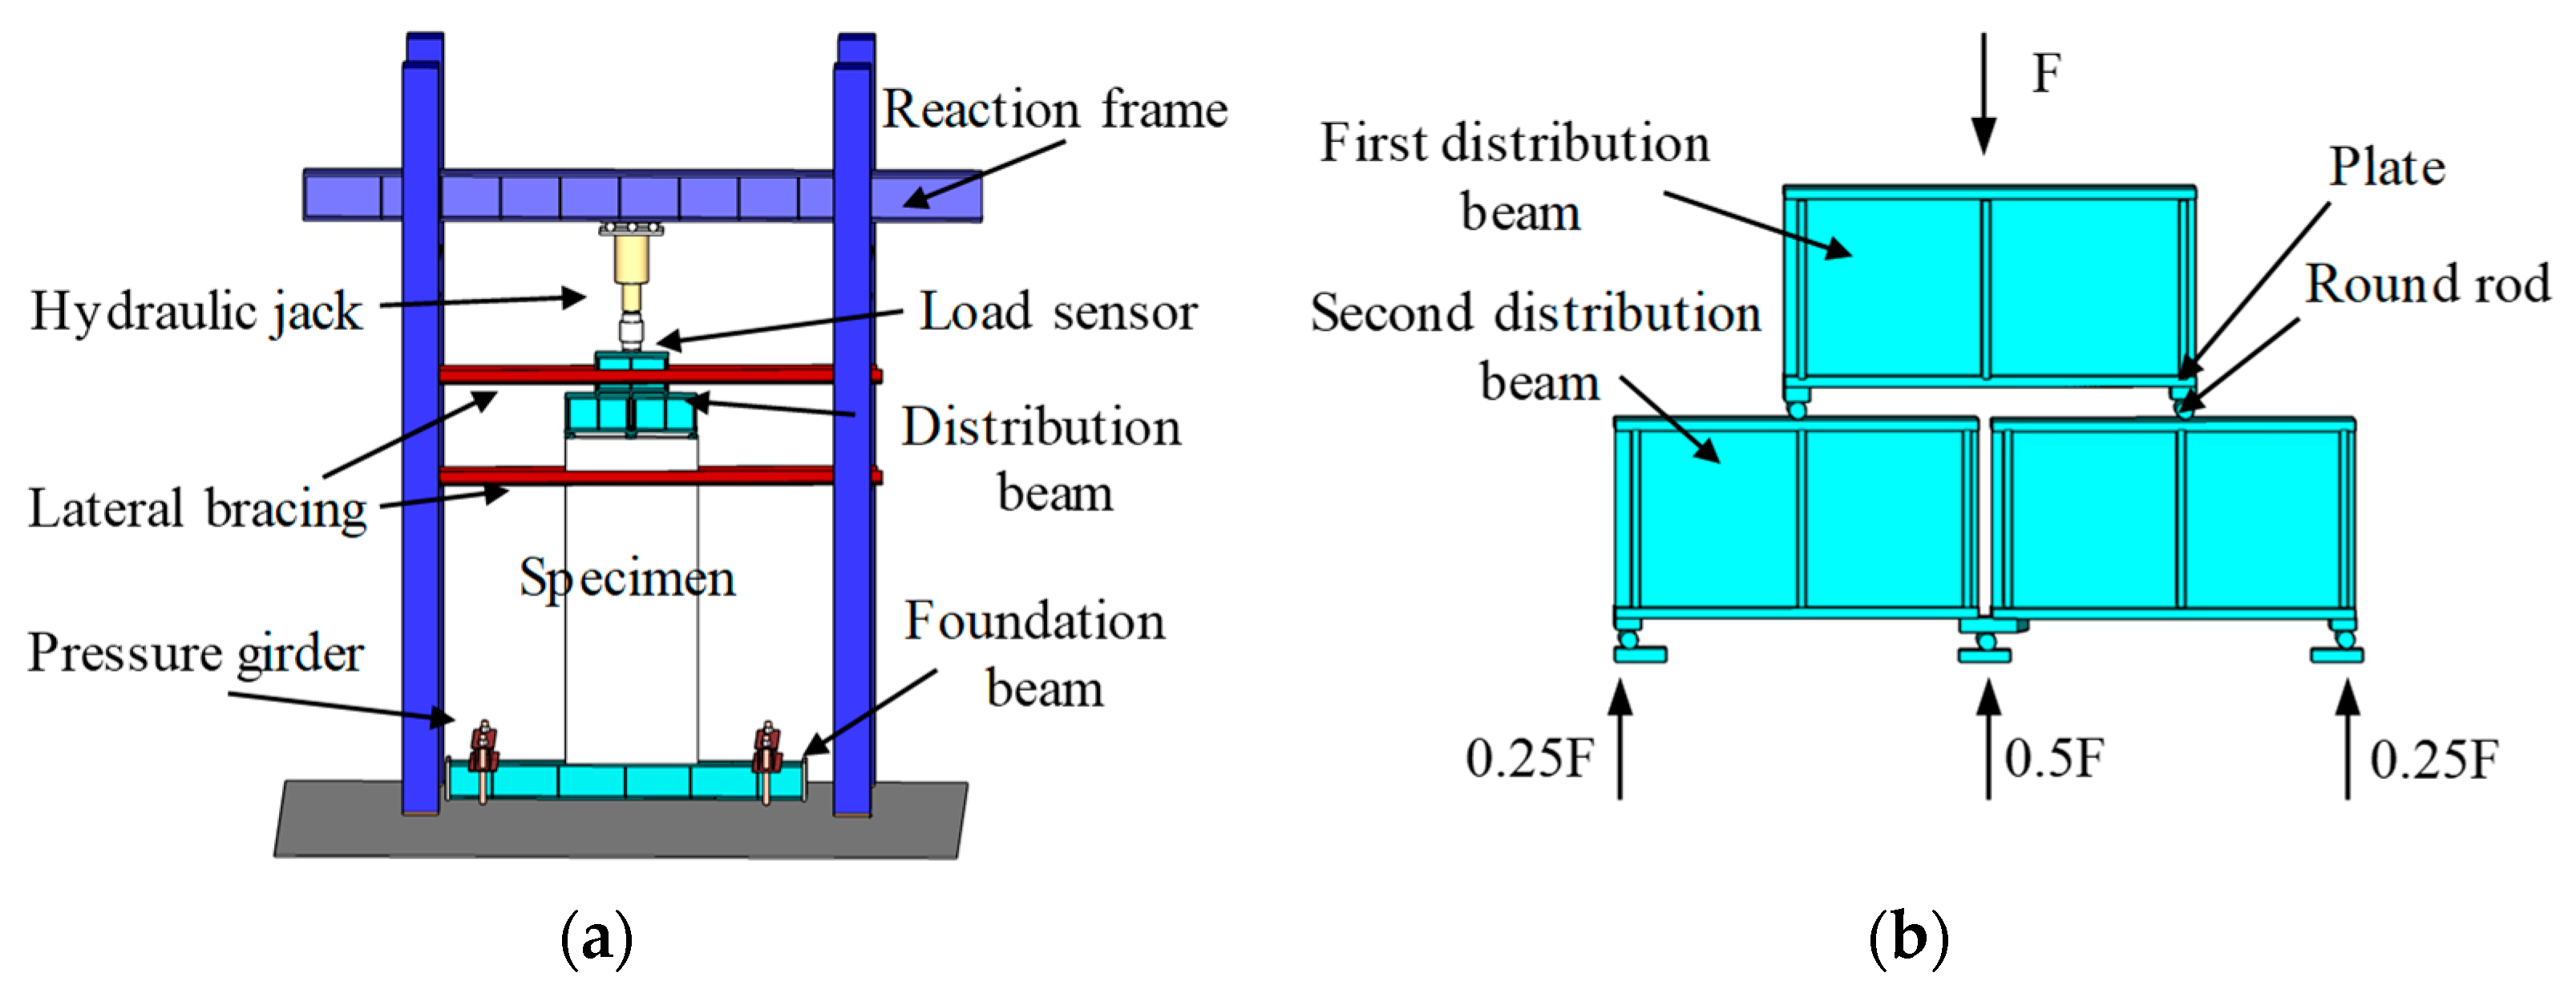
2.3. Test Setup and Load Method

The test setup of the specimen is shown in Figure 2a. The concentrated compressive load was applied to the specimen though a 2000 kN vertical hydraulic jack. The concentrated loading was realized by a secondary distribution beam, as shown in Figure 2b. The load is transmitted from the first distribution beam to the second level distribution beam, and then to the wall through the steel plate. The support of the distribution beam is hinged, so that the load on the interior stud is 0.5 F, and the load on the end stud is 0.25 F, where F is the applied vertical load. The bottom of the specimen was fixed to the foundation beam by four M24 bolts and four horizontal angle steels were located on the specimen’s top side and both sides of the distribution beam to restrain the out-of-plane displacement.
The location of the six displacement sensors is shown in Figure 3a. Two displacement sensors (D1 and D2) were placed at the corners of the wall to measure the vertical displacement of the end stud. Two displacement sensors (D3 and D4) were placed at the top of the wall to measure the vertical displacement of the interior stud. It is worth noting that the four displacement sensors (D1, D2, D3, and D4) were all installed on the foundation beam. Therefore, the measured displacement was directly the deformation of the wall. Two displacement sensors (D5 and D6) were also located at the middle height of the specimen to measure the out-of-plane displacement of the specimen. Moreover, a total of 30 strain gauges were placed on the web to track the train of studs, as shown in Figure 3b.
The force-controlled method was employed for the test. At the outset of the loading process, the specimen was subjected to a load of 10% of the estimated ultimate capacity, as determined through numerical analysis, to ensure that the loading equipment and measuring devices were functioning properly. Following preloading, the specimen was subjected to monotonic compressive loading, incrementally increasing by 10% of the ultimate load. The loading sequence was terminated when the load dropped to 85% of the ultimate load. Each load level was held for a duration of 3 min to observe the failure mode.

3. Experimental Results and Discussion

3.1. Failure Mode

Specimen CFSW-1: The failure mode of specimen CFSW-1 is shown in Figure 4. At a load of 400 kN, a slight wavy bulging was observed in the end stud web plate. As the load was increased to 500 kN, the concrete cover at the corners of the specimen started to peel off. The calcium silicate plate at the top of the specimen then cracked and peeled off as the load approached the maximum value of 951 kN. Further loading resulted in local concrete crushing failure and local buckling failure of the end stud web. After the experiment, the calcium silicate board was removed and the concrete was chiseled open. It was observed that the concrete at the top of the specimen was crushed, but the interior stud did not buckle, indicating that the concrete protective layer effectively restrained the deformation of the interior stud.
Specimen CFSW-2: The failure mode of specimen CFSW-2 is shown in Figure 5. At a load of 600 kN, there was a discernible protrusion at the upper end of the end stud. As the load increased to 700 kN, the bulging phenomenon of the end stud became more pronounced. The concrete cover at the corners of the specimen began to peel off, and longitudinal cracks appeared in the calcium silicate plate near the interior stud. At the same time, oblique cracks emerged on the calcium silicate plate at the top of the wall, while the calcium silicate plate at the bottom of the wall bulged outward. Ultimately, the specimen lost its bearing capacity due to the distortion and buckling of the end stud.
Specimen CFSW-3: The failure mode of specimen CFSW-3 is shown in Figure 6. At a load of 150 kN, the specimen exhibited significant out-of-plane bending. When the load was increased to 225 kN, wavy bulging was observed on both sides of the end column web plates. As the load was further increased to 395 kN, the calcium silicate board at the top of the specimen suddenly ruptured. This failure resulted in a sudden decrease in the wall’s bearing capacity, as indicated by a steep drop in the load–displacement curve. Continuing to load the specimen ultimately led to the distortion and buckling of the columns, resulting in a complete loss of bearing capacity.

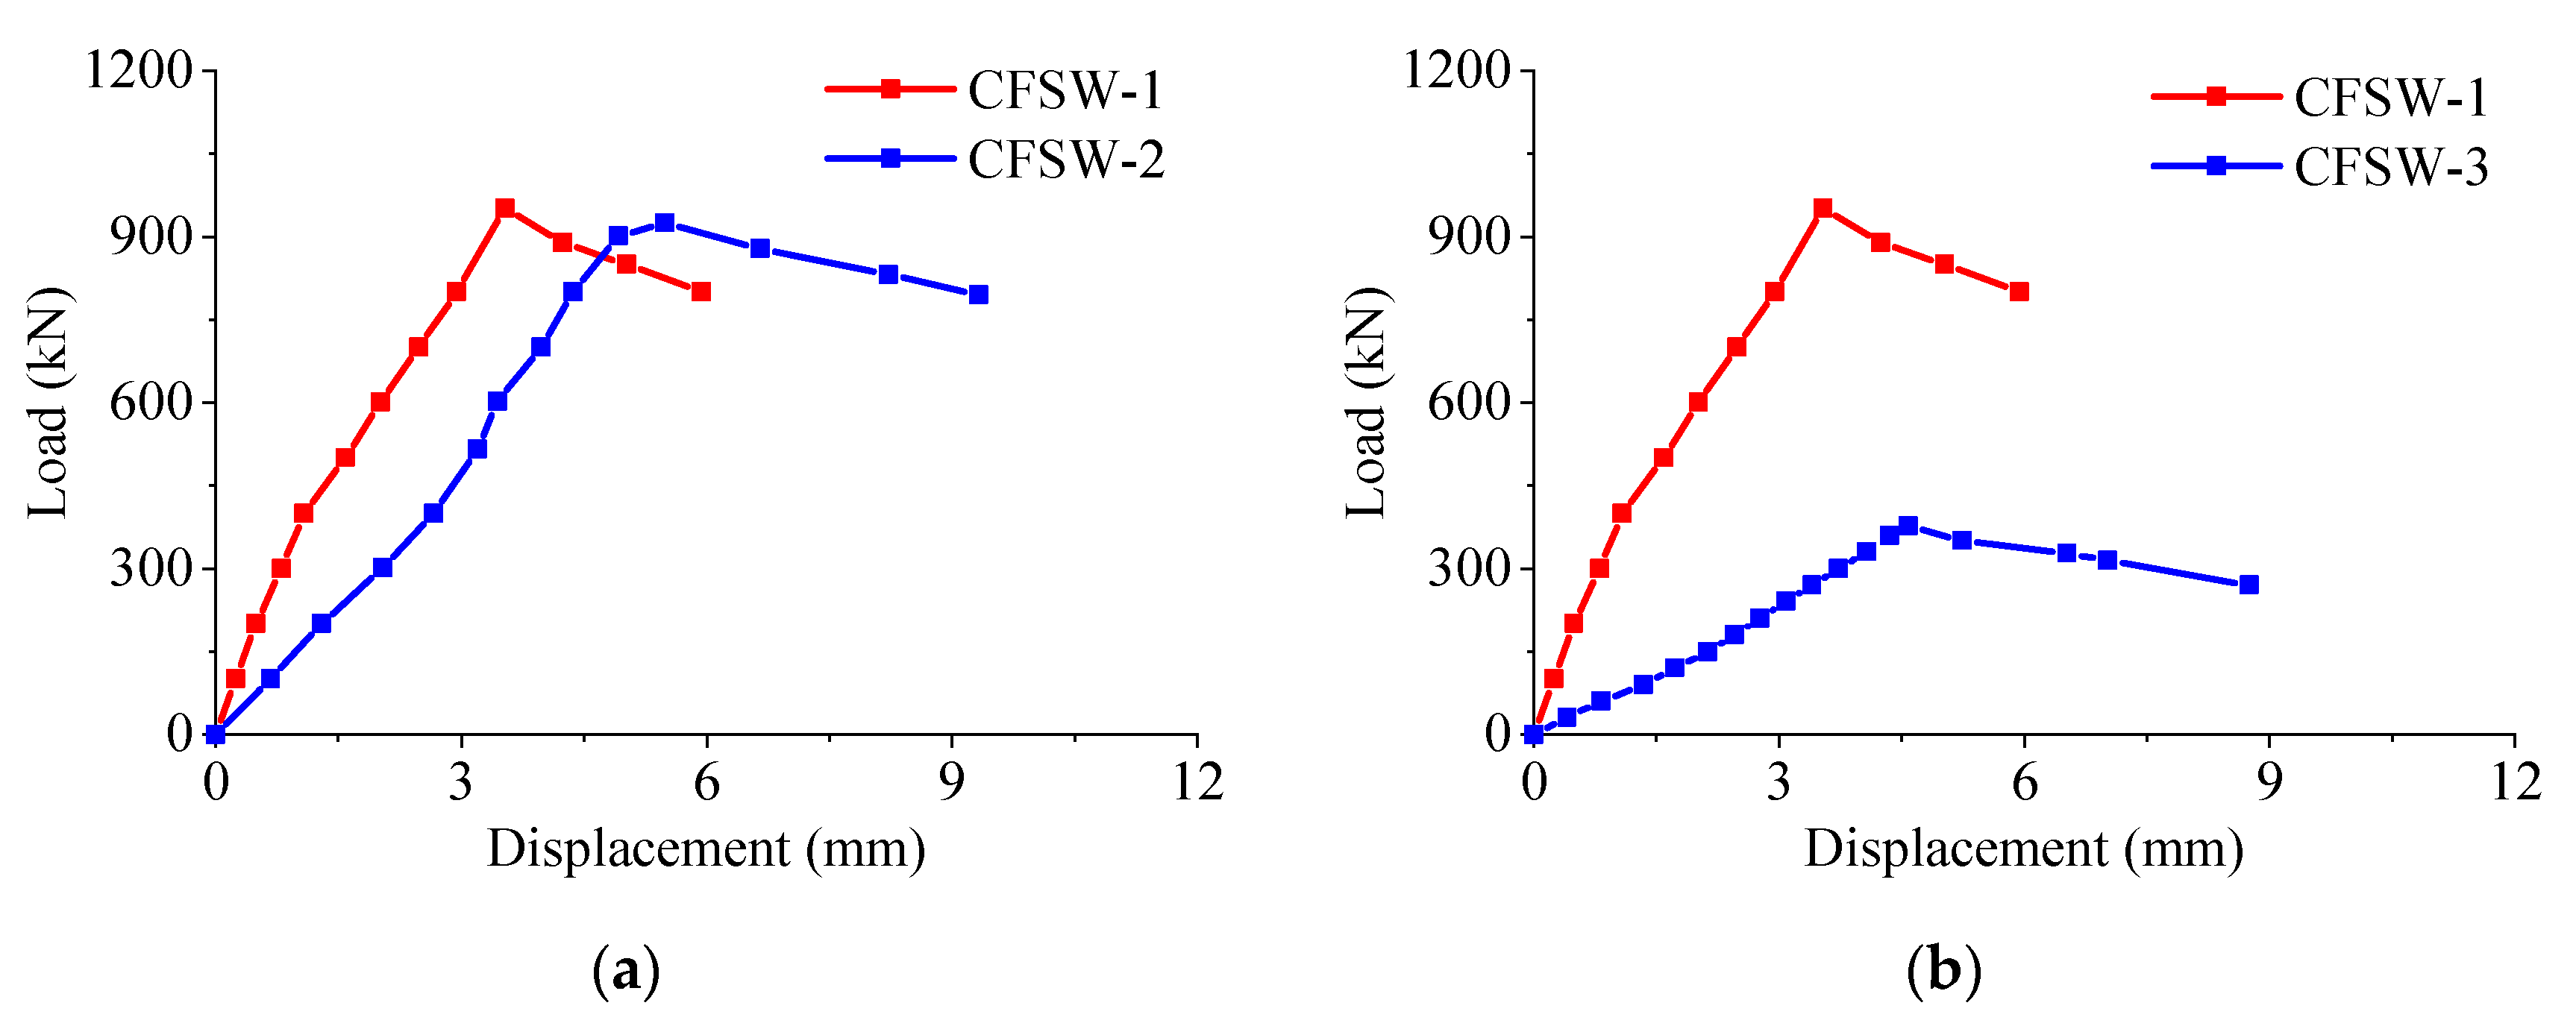
3.2. Axial Load—Longitudinal Displacement Relationships

The measurement of the displacement near the wall corner had significant errors due to the severe damage suffered during the experiment. Therefore, the axial deformation value was calculated based on the deformation of the interior stud of the specimen, as shown in Equation (1):
= 3 + 4 2
where Δ is the axial deformation of wall, Δ3 and Δ4 are the measured displacement of the displacement sensors D3–D4, respectively.
Figure 7a shows the comparison of load–displacement curves between specimen CFSW-1 and CFSW-2. As we can see, there appears to be a decrease in the stiffness of the rising section of the load–displacement curve for specimen CFSW-1, which could be attributed to the buckling of the end stud and the cracking of foam concrete. On the other hand, the stiffness of the rising section of the load–displacement curve for specimen CFSW-2 increased, possibly due to the presence of initial gaps in the specimen. Specimen CFSW-1, which had no perforations, had an ultimate bearing capacity of 951.7 kN. On the other hand, specimen CFSW-2, which had perforations, had an ultimate bearing capacity of 925.3 kN. This shows a reduction of 3.2% in bearing capacity for the perforated specimen. However, the deformation capacity of the perforated specimen was higher than that of the non-perforated specimen. Therefore, it can be concluded that the presence of stud openings did not significantly reduce the bearing capacity, but actually increased the deformation capacity of the wall.
Figure 7b shows the comparison of load–displacement curves between specimen CFSW-1 and CFSW-3. The presence of foam concrete has a significant positive impact on the bearing capacity of the composite wall. Specimen CFSW-1, which was filled with foam concrete, exhibited an ultimate bearing capacity of 951.7 kN, which is 153% higher than the ultimate bearing capacity of the unfilled specimen CFSW-3 (376.3 kN).

3.3. Load versus Strain Behaviour

Figure 8 shows the load–strain curves of the typical section of composite wall. In the specimens filled with concrete, the strain of the interior stud exhibits a linear relationship with the external load without any sudden changes, indicating that the foam concrete provides effective support to the interior stud, preventing local buckling. On the other hand, sudden and nonlinear changes in strain with the external load were observed in the end studs, indicating the occurrence of local buckling in these areas. For specimens without concrete filling, it was observed that both the end and interior stud sections experienced sudden changes in strain, indicating local buckling.
Moreover, the maximum strain of the interior stud in the unperforated specimen CFSW-1 is 1000 uƐ, and the corresponding maximum stress is 212 MPa, which is only 36% of the yield stress. In the perforated specimen CFSW-1, the maximum strain of the interior stud is 1061 uƐ, and the corresponding stress is 225 MPa, which is also 38% of the yield stress. These results show that even if the load borne by the interior stud is twice that of the end stud, its stress remains a long way from reaching the yield strength of the steel.

4. Numerical Analysis
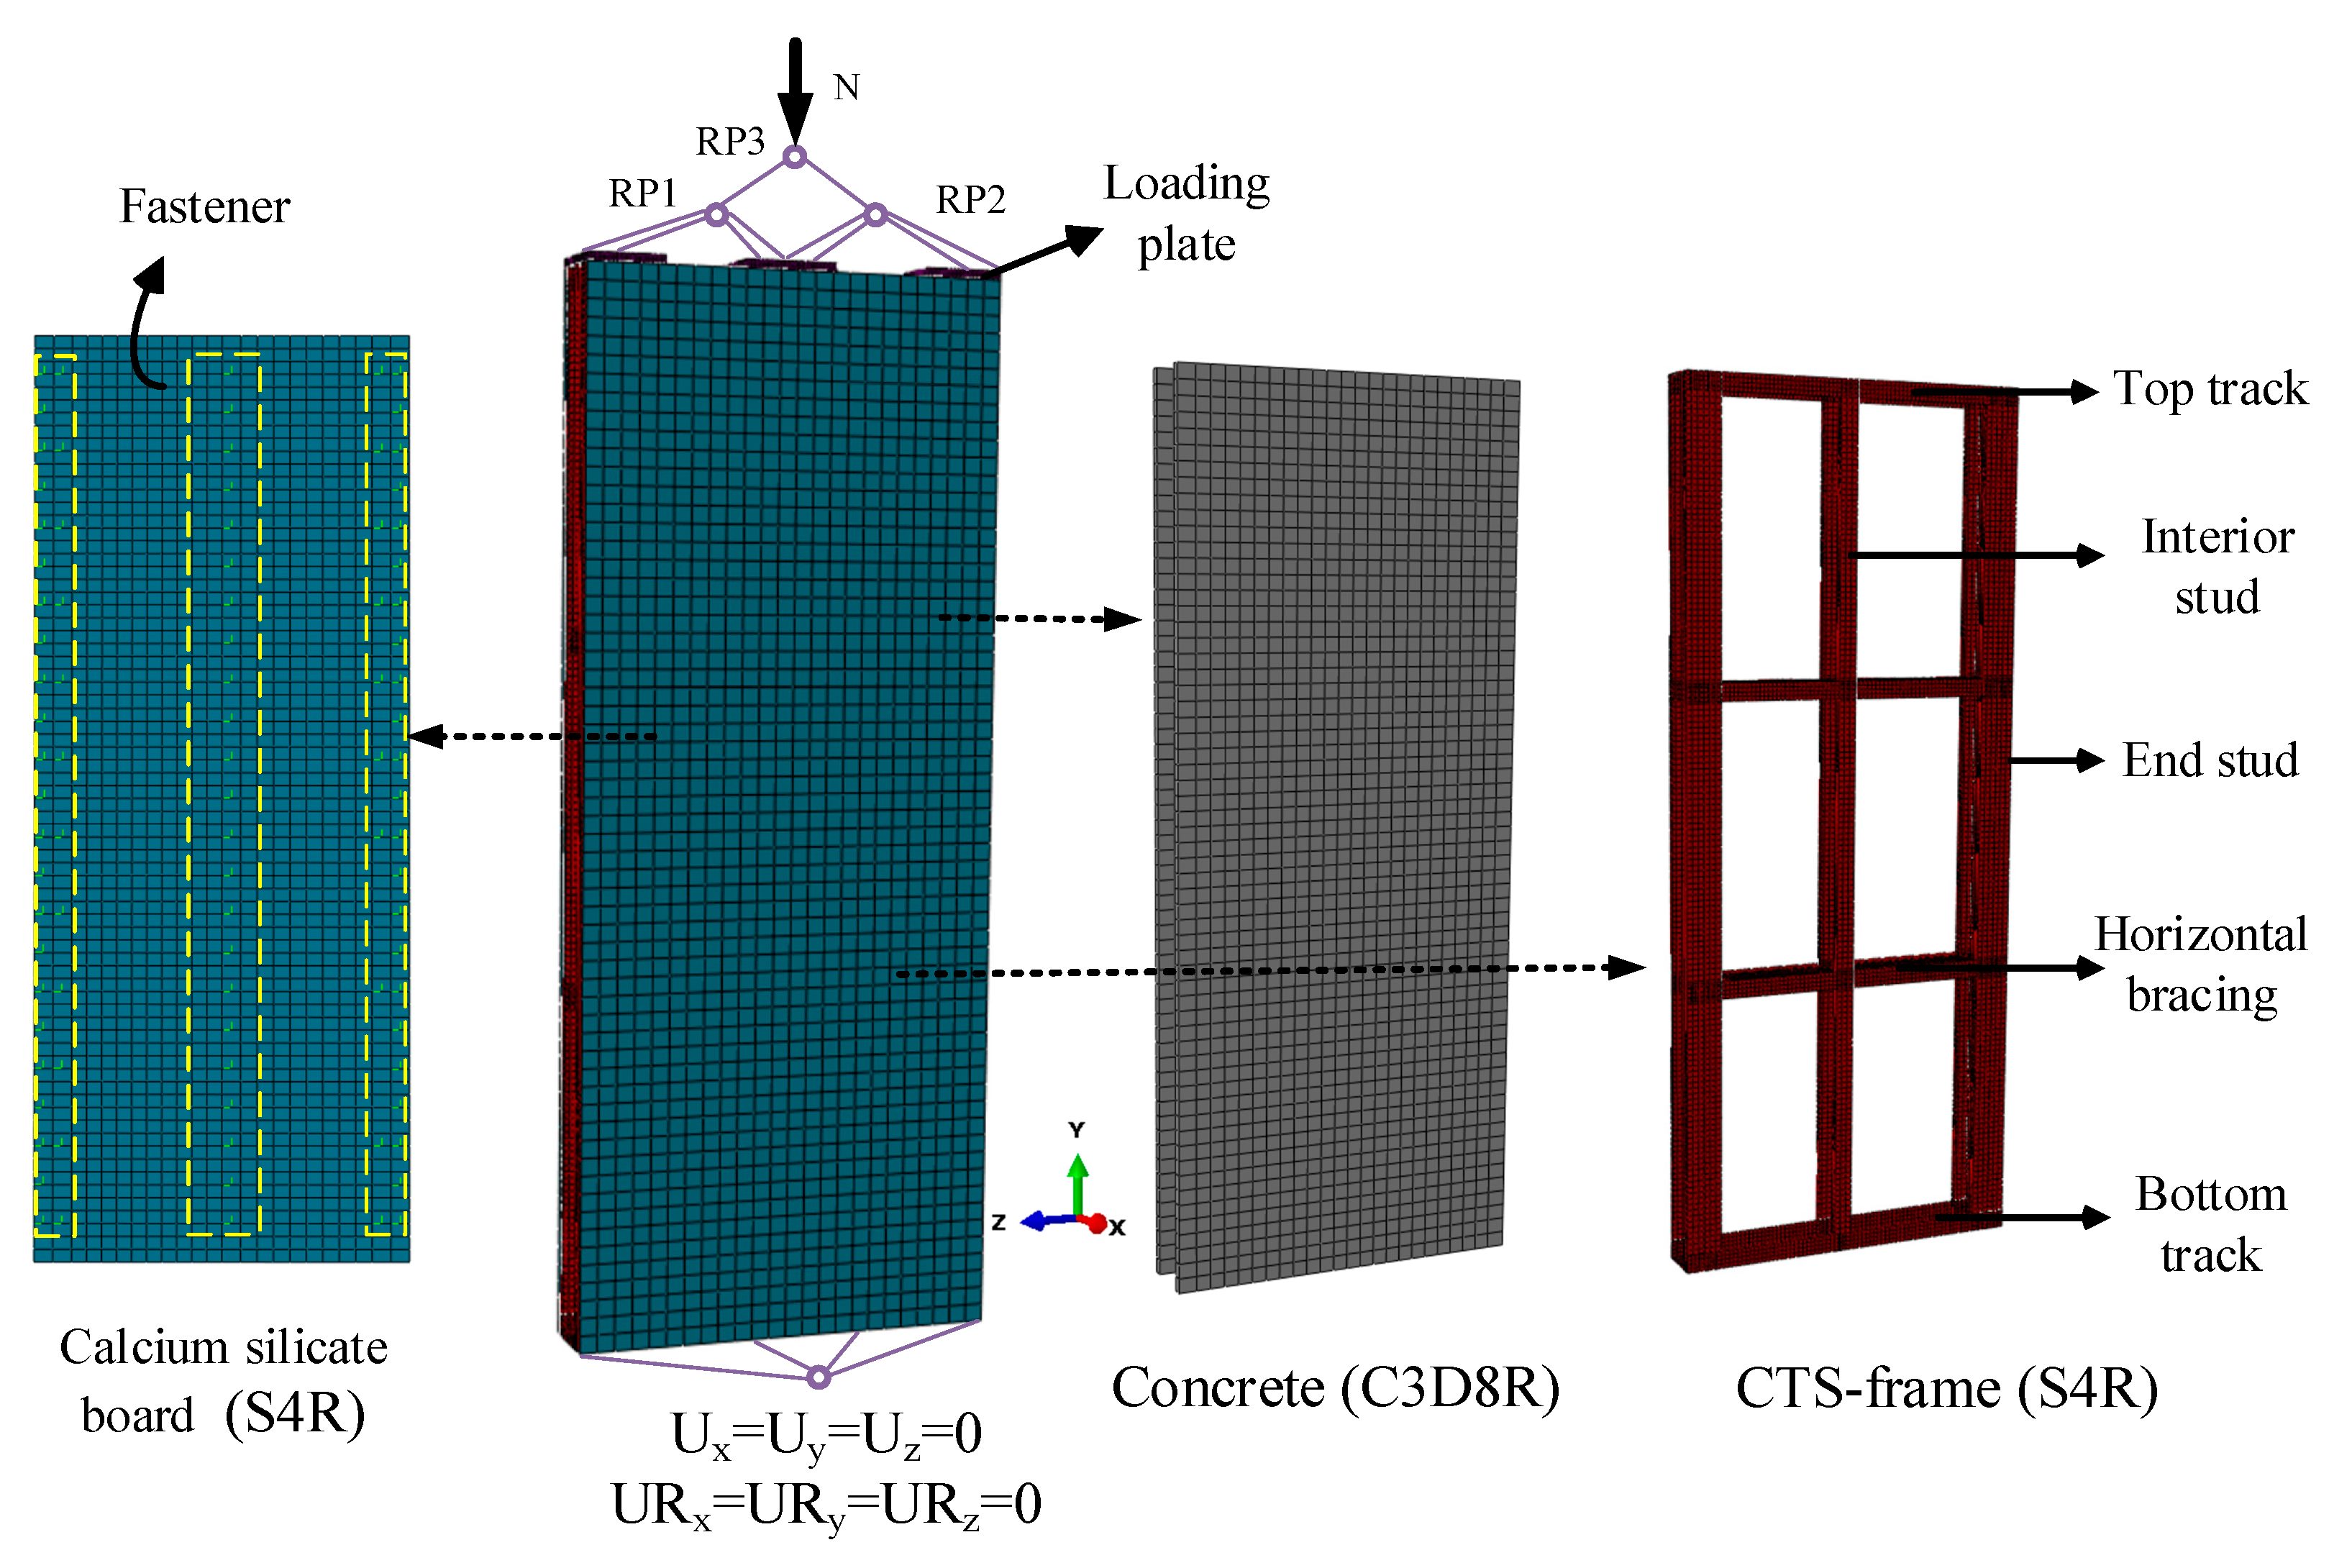
4.1. FE Modelling

This section aims to investigate the axial compression performance of CFS composite walls under concentrated loads, utilizing the finite element software ABAQUS. The finite element model, as depicted in Figure 9, comprises three main components: concrete, CFS frame, and calcium silicate board. Furthermore, to ensure that the concentrated load is applied to the keel stub, a loading plate with infinite stiffness is provided at the upper end of each stub.

4.1.1. Element Types and Cell Meshing

In CFS composite walls, the concrete should be modelled by the eight-node linear reduced integration solid element (C3D8R). The CFS frame is made of cold-formed thin-walled section steel, and according to a literature study [22], it is advisable to use a four-node reduced integration shell element (S4R) to predict its stress response. In addition, the S4R was also applied in the calcium silicate plate because of its thin-walled structural form. The reduced integration elements C3D8R and S4R have only one integral point, which leads to lower computational cost compared with the corresponding fully integrated elements C3D8 and S4. The default hourglass stiffness was selected to suppress the hourglass phenomenon caused by the reduced integration element. Based on the mesh sensitivity analysis presented in Table 4, the mesh size of concrete, CFS frame, and calcium silicate plate were all determined to be 20 mm, considering computational efficiency and accuracy.

4.1.2. Boundary Condition

The boundary conditions in the finite element model should be the same as that in the test to ensure accuracy. The load applied on the middle loading plate of the secondary distribution beam should be twice that of the load applied on the side loading plates, as mentioned in Section 2.3. The displacement controlled load was adopted in ABAQUS, considering the convergence of the model. Therefore, the proportional relationship between forces at different loading plates can be achieved through the distributing coupling method. The distributing coupling method enables control of the transmission of loads through weight factors at the coupling nodes [23]. The resultants of the forces at the coupling nodes are equivalent to the forces at the reference node. For the CFS composite walls under concentrated load, the following conditions are set: (1) The distributed coupling is used to couple the left loading plate and the middle loading plate through RP1; the same set-up would also be used for the right loading plate and the middle loading plate with the coupling point RP2. (2) Coupling of RP1 and RP2 to the point RP3 through the distributing coupling method is carried out. (3) A vertical displacement is applied to RP3 to simulate longitudinal loading, while the other degree of freedoms are restrained (Ux = Uz = URx = URy = URz = 0). In this way, the composite wall demonstrated excellent convergence under displacement-controlled loading, while the force applied to the middle loading plate was twice that of the side loading plates.
In addition, the bottom of the wall is coupled through RP4 to constrain its full translational displacement and rotational displacement. The detailed arrangement of the boundary conditions can be seen in Figure 9.

4.1.3. Contact Interaction

The contact between the CFS frame and FC was complex, and the following contact behaviour was set up to be simulated: The interface between HFC and end studs was simulated using the normal hard contact and tangential penalty function, and the friction coefficient was selected as 0.3 [17]. Additionally, the contact between the track and FC can be simulated with the frictionless contact option since there was no slip between the slide rail and FC, according to the literature [17]. Then, the rest of the CFS frame and FC employed embedded behaviour. Furthermore, shell-solid coupling was utilized to contact the FC and calcium silicate plates. For the specimen CFSW-3, a fastener connector was applied to simulate the behaviour between the calcium silicate board and the frame, and the connector was defined as the planar type.

4.1.4. Initial Imperfection
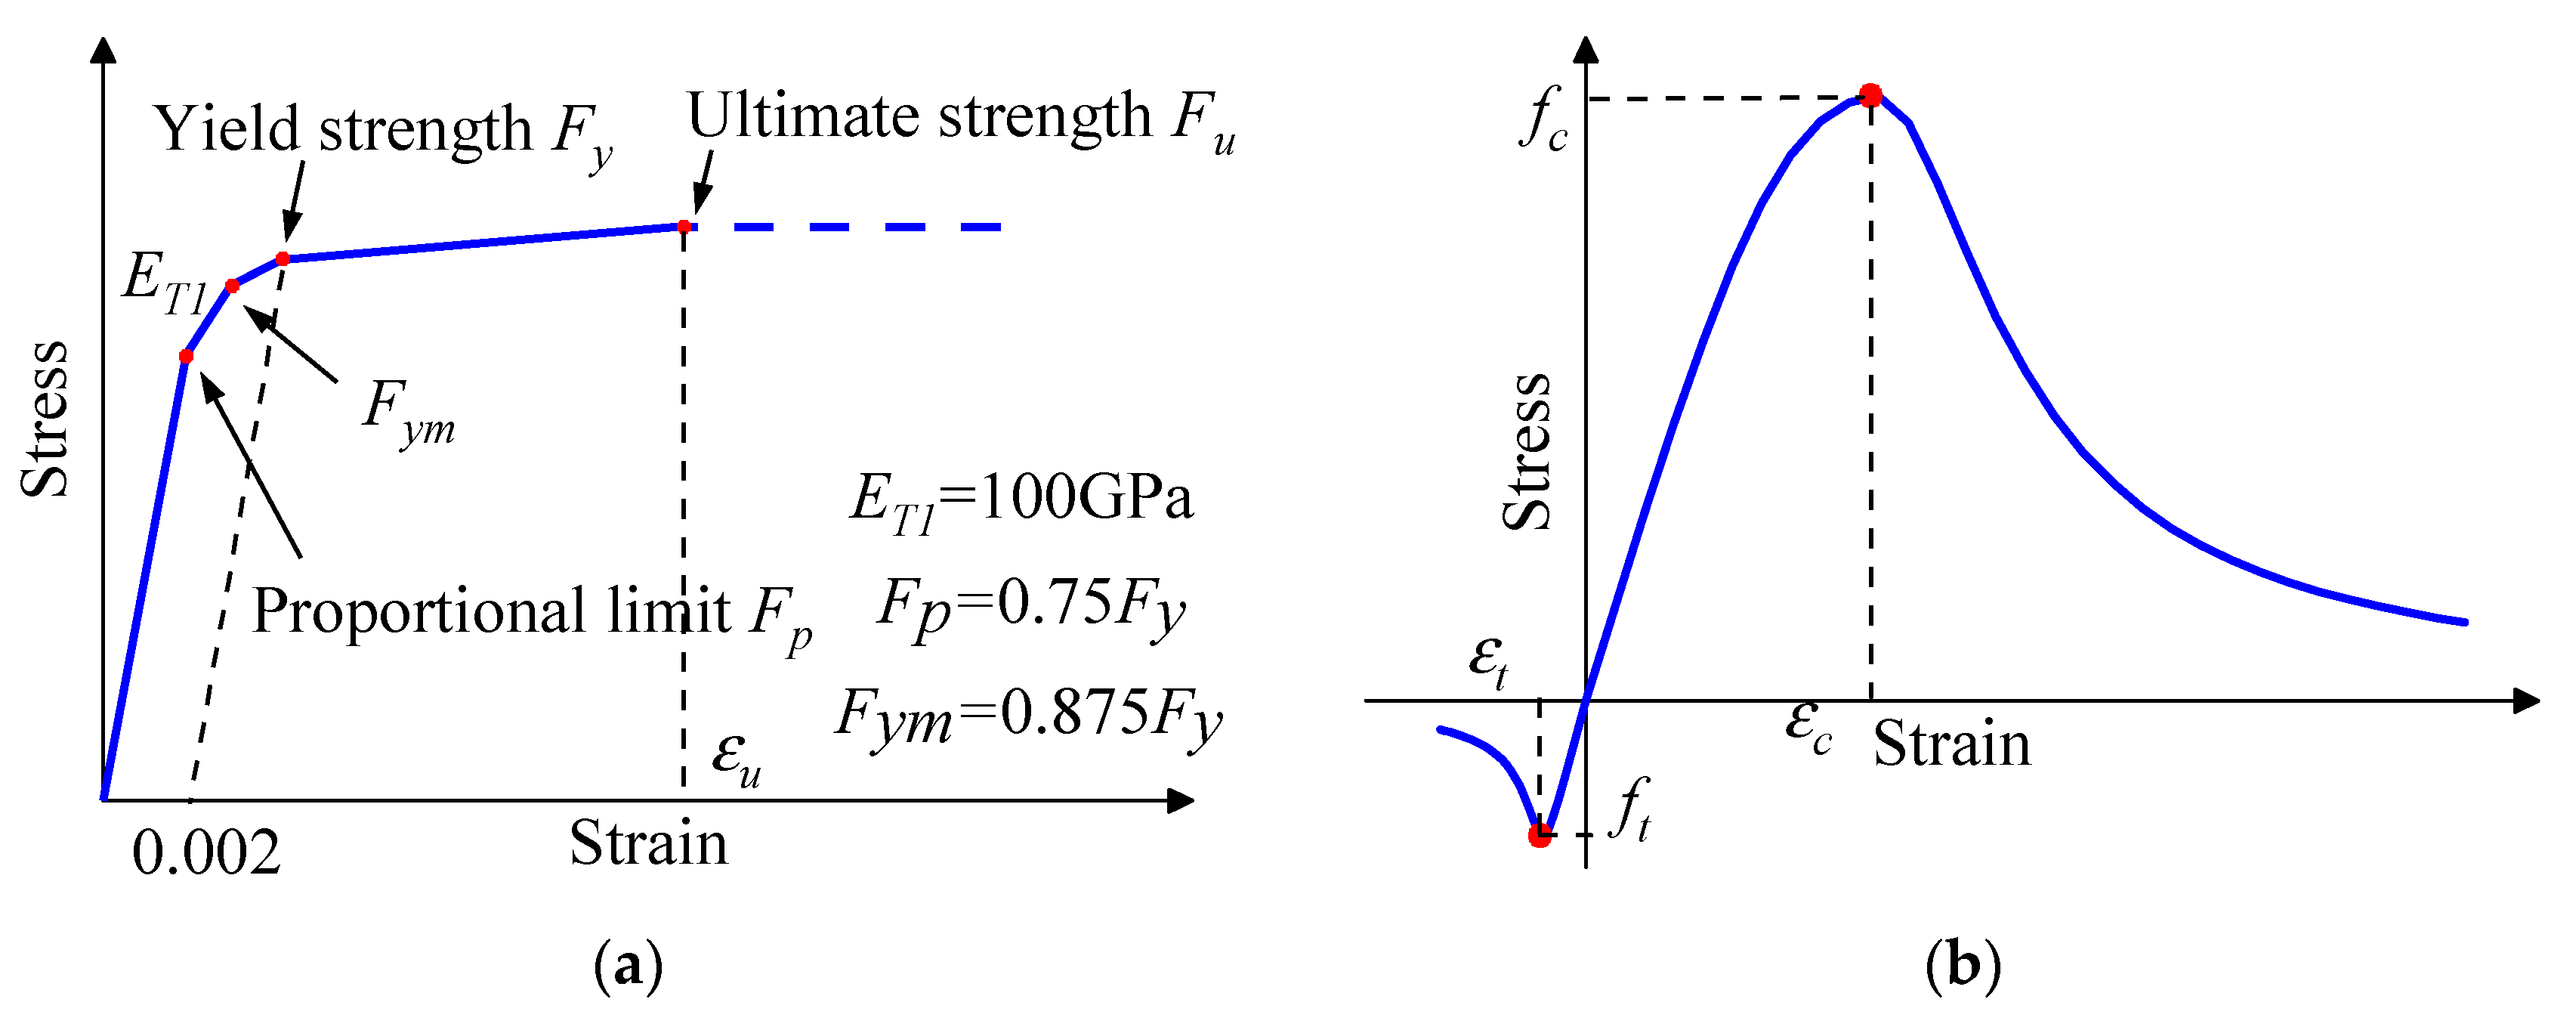
The local initial imperfection of the stud in the CTS frame was taken as a first order buckling mode and the amplitude was calculated by the following equation [17]:
δ cr = 0.0453 ( D   or   B t ) + 0.9101
where δcr is the amplitude of the initial imperfection; t is the thickness of the stub; D and B are the width of the web and flange in the stub.

4.2. Material

The precise four-stage constitutive model applies to cold-formed steel [24], as shown in Figure 10a. The Poisson’s ratio was valued as 0.3 for cold-formed steel. According to Xu’s research [13], the constitutive relationship of ordinary concrete is almost the same as foam concrete. Therefore, the stress–strain curve (including compression and tensile properties) suggested in GB50010-2010 [25] was used to simulate the foam concrete, as shown in Figure 10b. The ideal elastoplastic model was adopted to simplify the constitutive of calcium silicate plates [17,22], as shown in Figure 10c. The material properties of the steel and concrete are discussed in Section 2.2. The axial compressive strength and axial tensile strength were adopted in ABAQUS, which could be calculated by Equations (3) and (4) according to GB50010-2010 [25]. The elastic modulus of foam concrete was calculated by Equation (5) based on Rowe et al. [26]. Based on a previous study [27], the elastic modulus and yield strength of the calcium silicate board were determined as 7450 MPa and 14.04 MPa, respectively:
fc = 0.76fcu
f t = 0.395 f c u 0.55
E = 1.70 × 10 6 ρ 2 f c 0.33
where fc, fcu, and ft are axial compressive strength, cube compressive strength, and axial compressive strength of foam concrete, respectively and ρ is the density of the foam concrete.

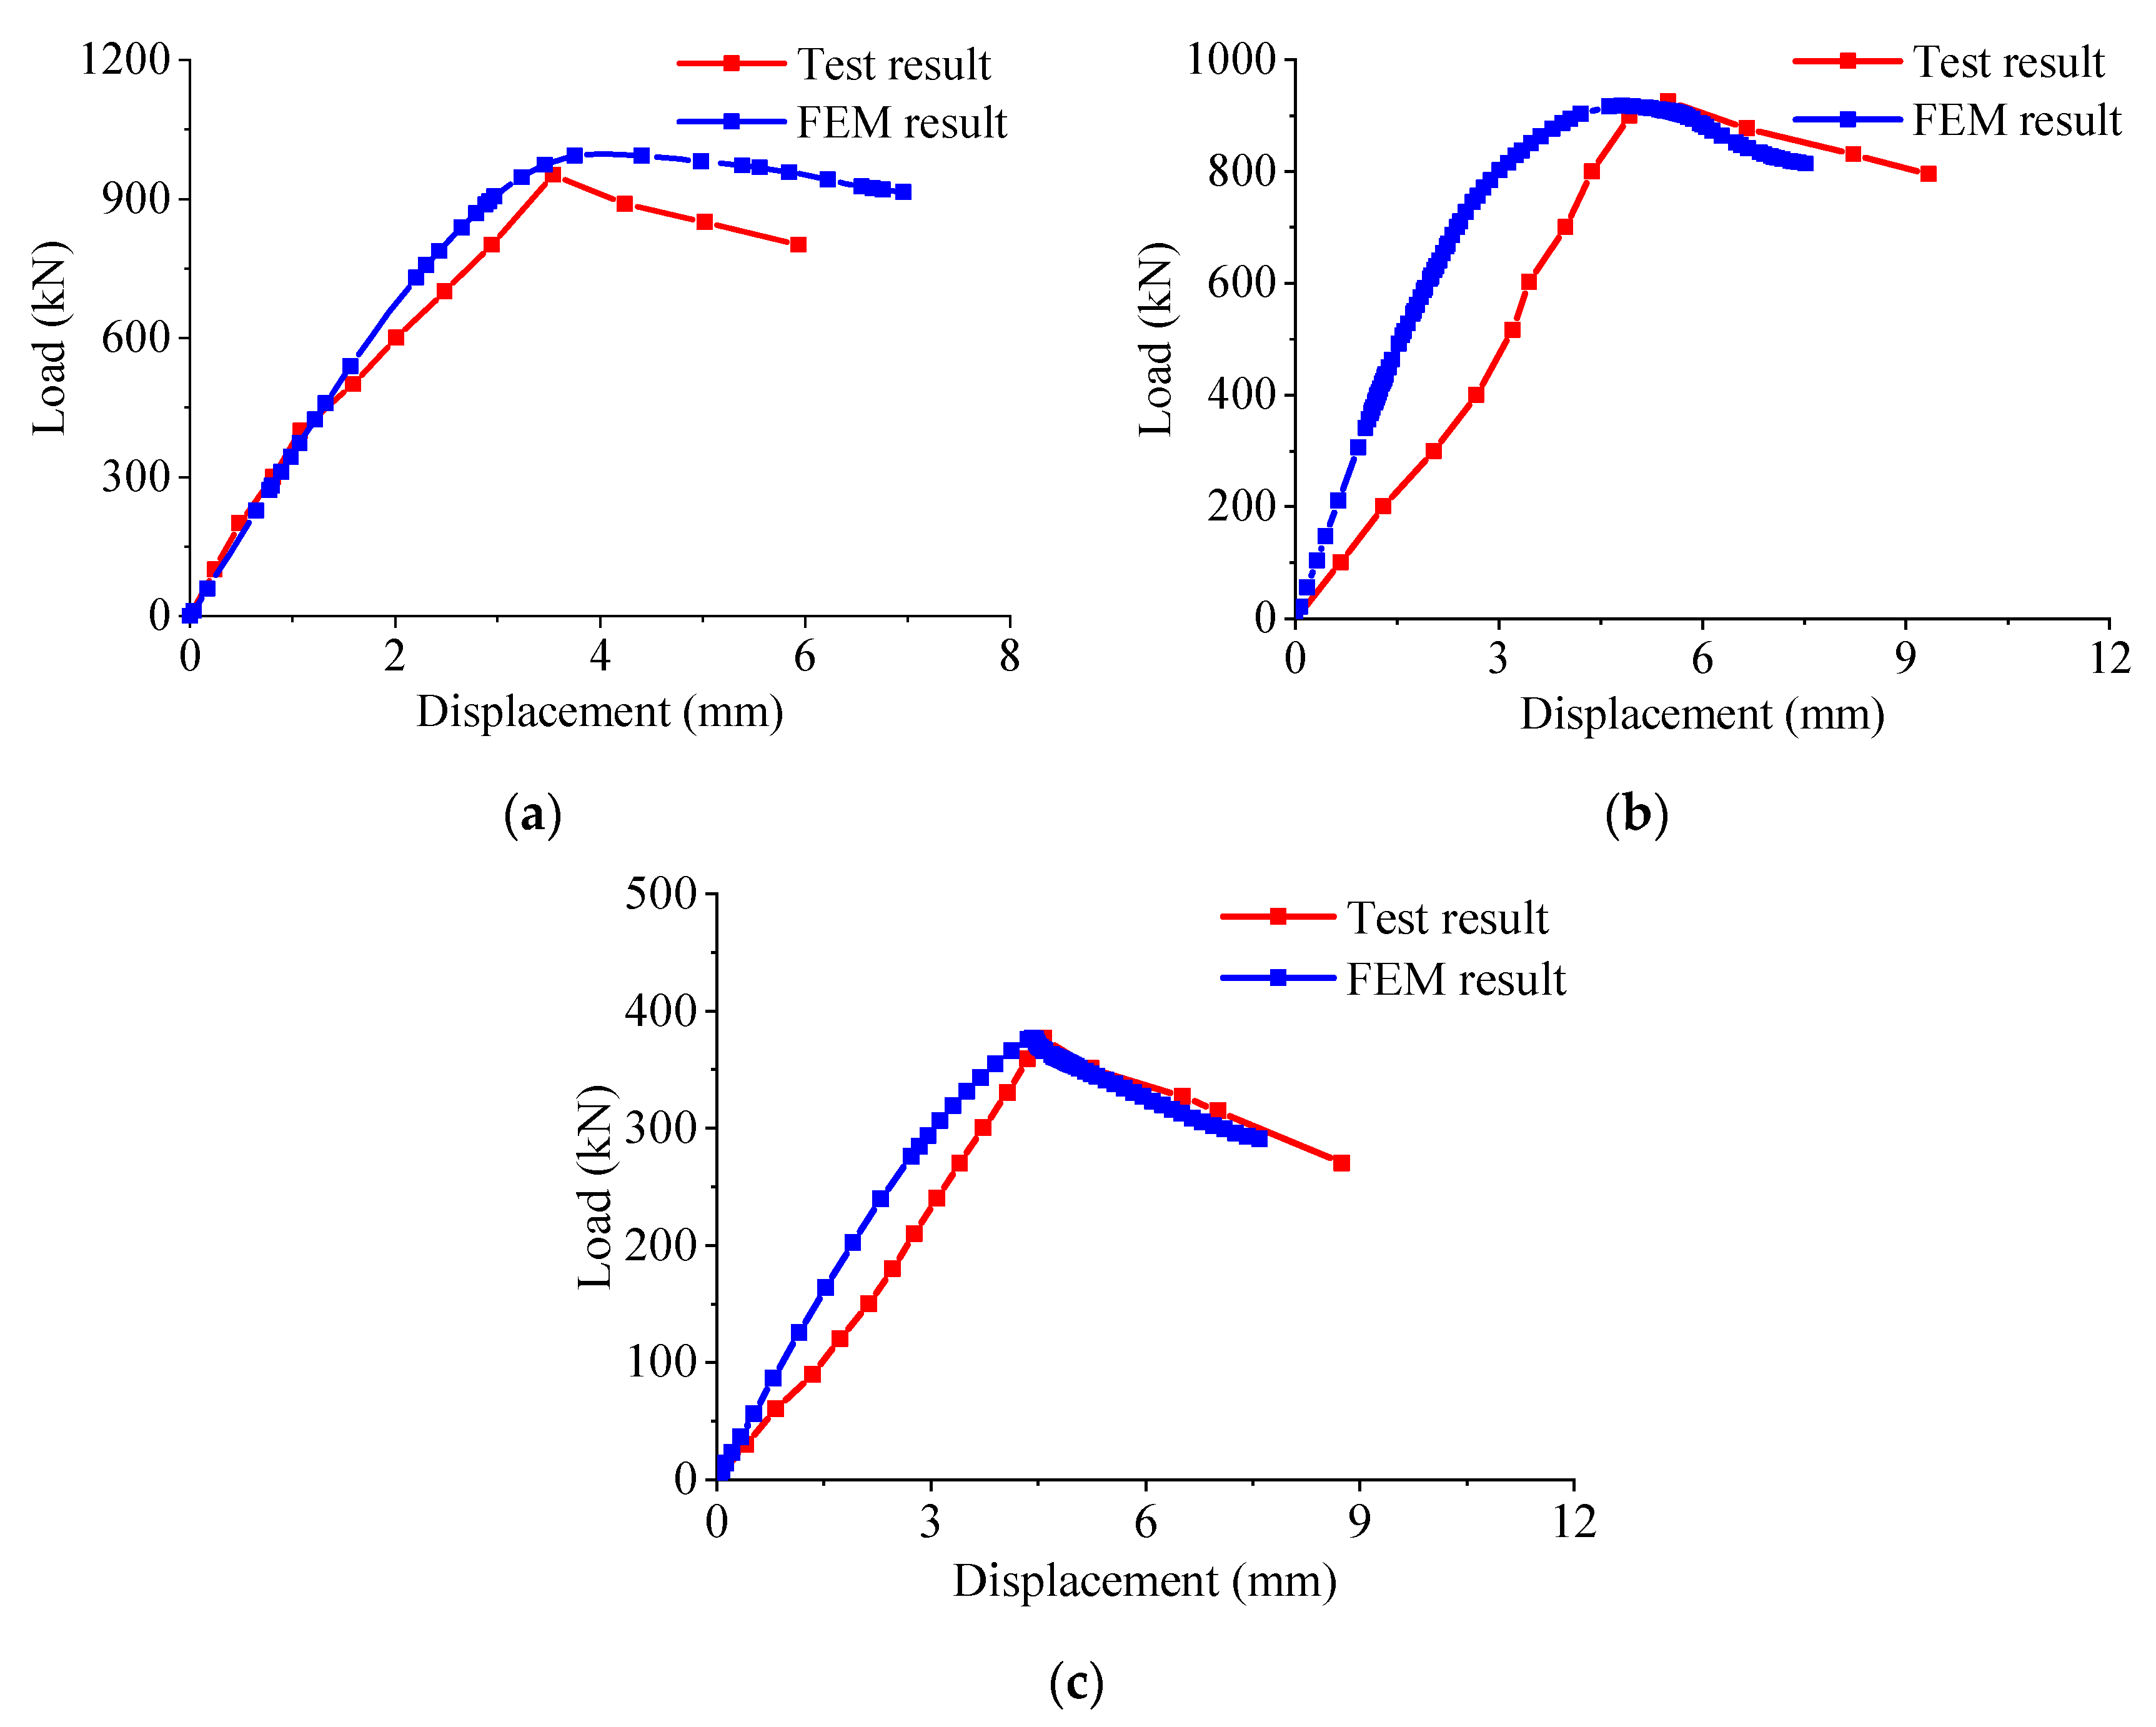
4.3. Verification of FE Model

The finite element model of the CFS composite wall was established with the following above provisions and then compared to the prediction results with the test. The comparison with the failure mode is shown in Figure 11. It can be seen that the finite element model has simulated well the corner collapse failure of the wall and the distorted buckling of the end stud. The failure mode of the finite element had high matching with the test. The comparison of load–displacement curves is shown in Figure 12. The peak displacement obtained from Abaqus for specimens CFSW-2 was smaller than that obtained from the experiments, which was attributed to the fact that the finite element model did not take into account the initial gap in the specimen. Overall, the predictions are in good agreement with the test curve. In summary, the accuracy of the modelling method of the CFS composite wall was verified by comparing the prediction results with the failure mode and load–displacement curve, and can be used for the parameter analysis.

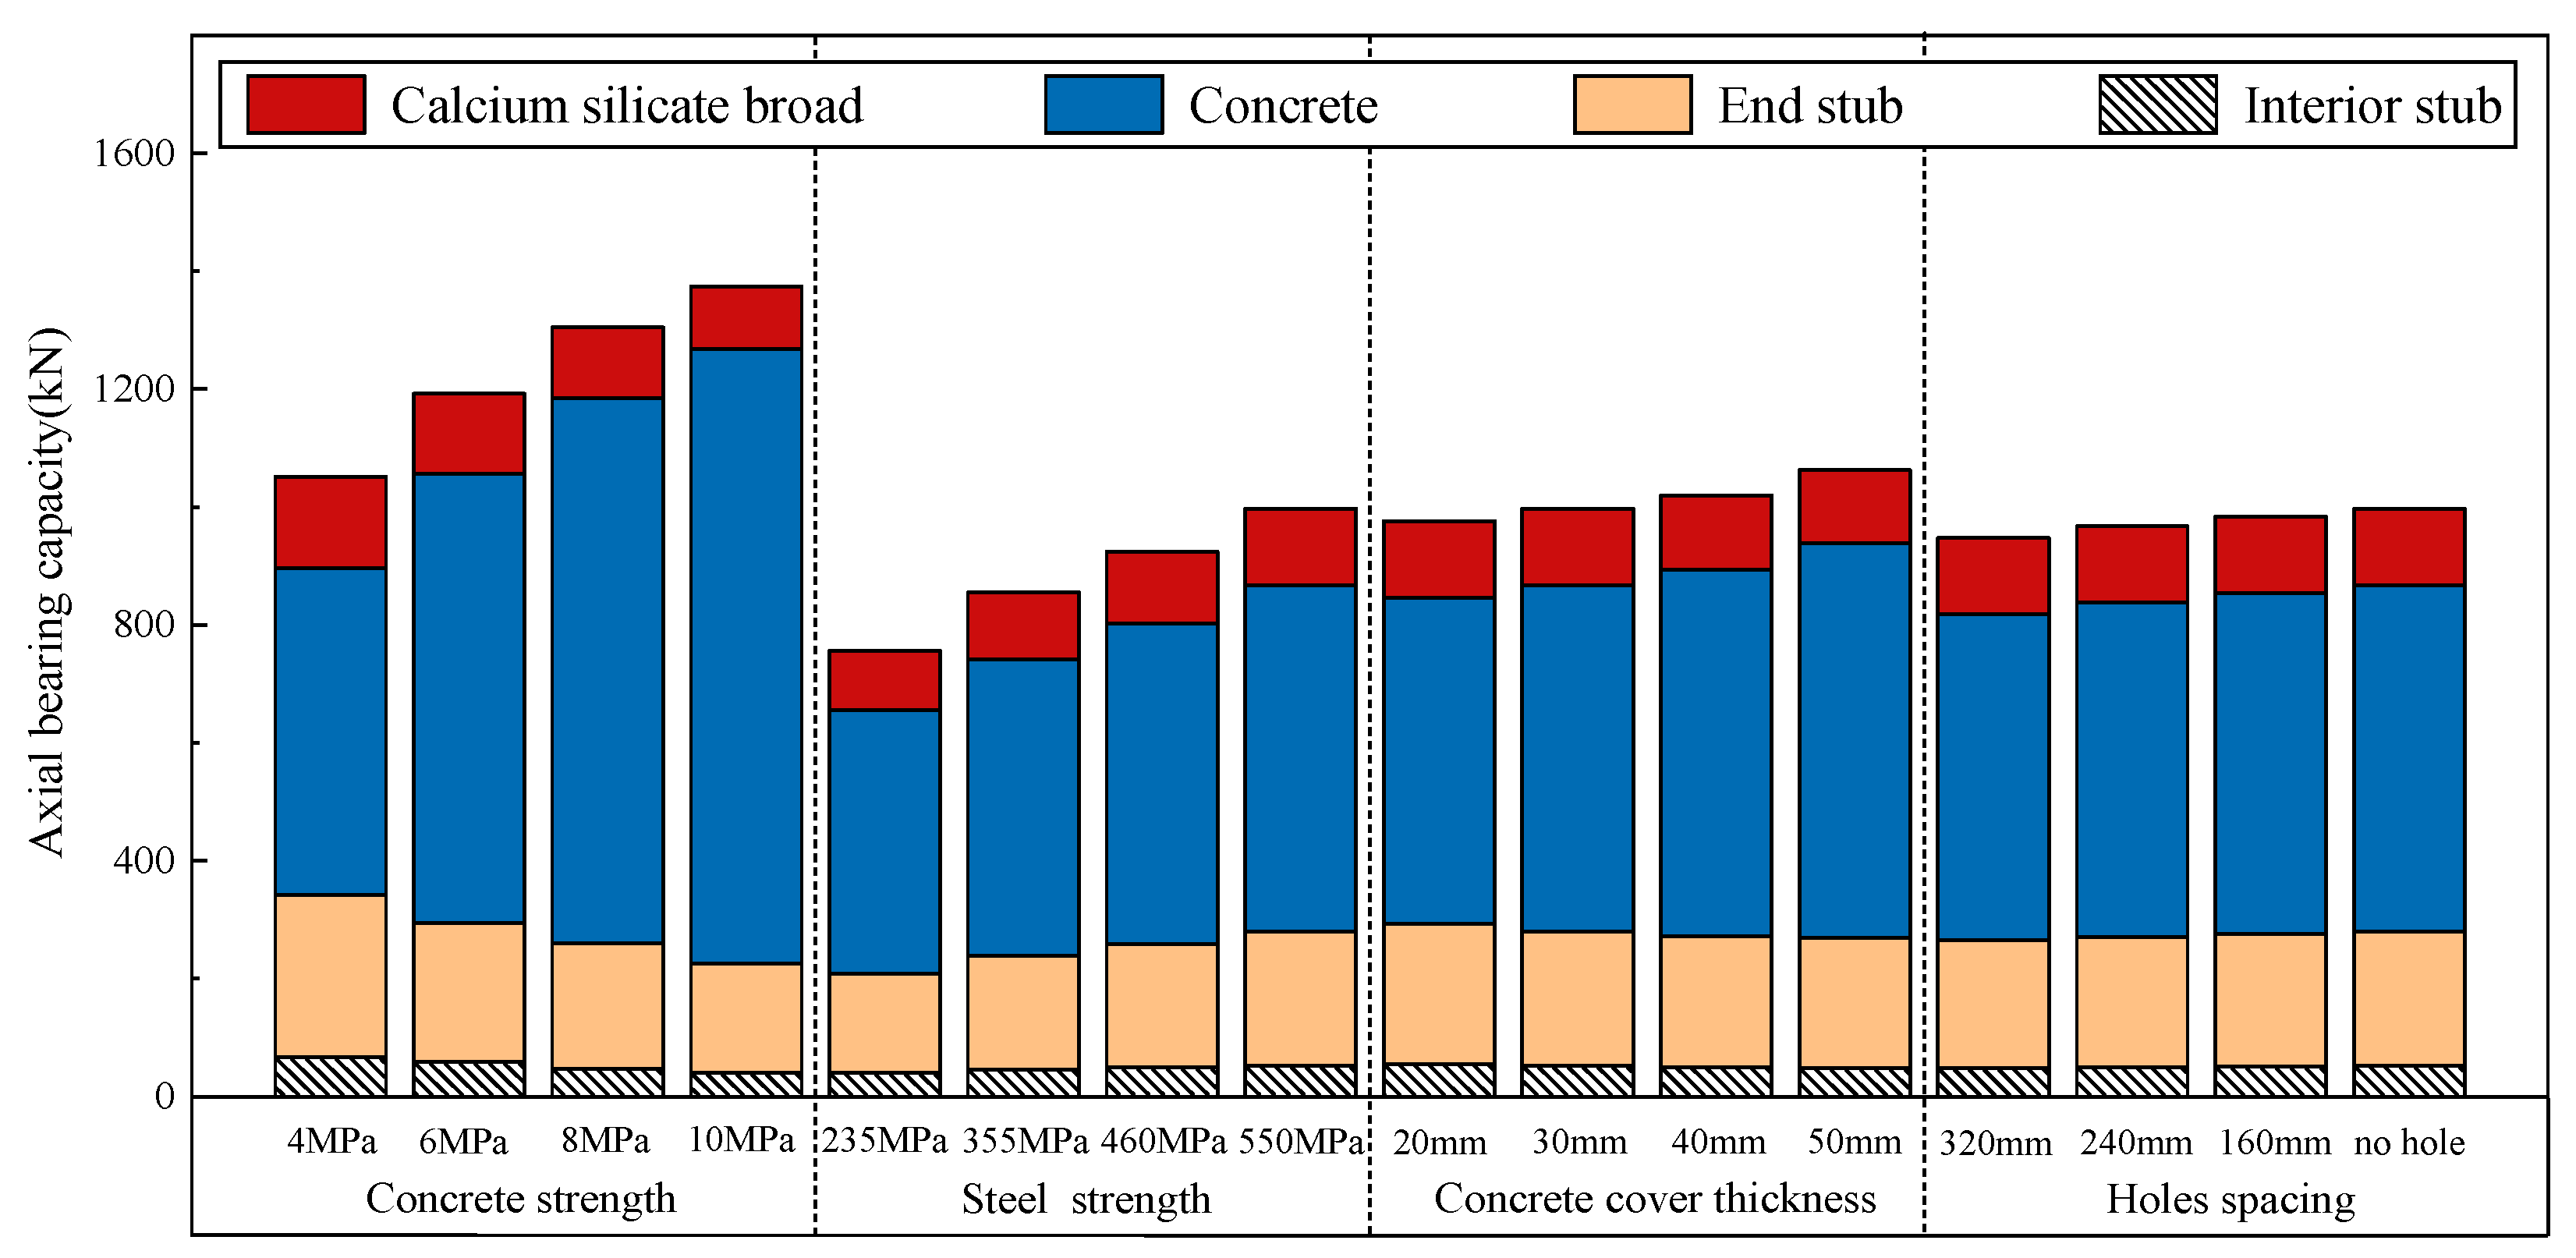
4.4. Parameter Analysis on Axial Resistance Capacity

The parametric analysis of the CFS composite was carried out on the axial bearing capacity of the wall under a concentrated load. Additionally, the load contribution of the components in the CFS composite wall will be further discussed. The model’s size is based on specimen CFSW-2, and the parameters include concrete strength, steel strength, covering layer thickness, and hole spacing. The detailed information of the model is shown in Table 5.
The axial compression capacity of the CFS composite wall under concentrated load and the load contribution of components are summarized in Table 5 and Figure 13. It can be seen that the concrete was critical to the CFS composite wall, and its load contribution accounted for more than half of the total bearing capacity. The two end stubs were the secondary bearing structures; most of their load contribution exceeded 20%. In addition, the role of the calcium carbonate slab is not negligible, and its load contribution exceeded 10% in most specimens. However, the load contribution of the interior columns to the walls is limited, with a load contribution ratio of around 5%. The possible reason is that the interior stub was subjected to local buckling under concentrated load, leading to its strength being significantly lower than the material failure strength. Thus, a conservative method that ignores the effect of the internal column can be made to calculate the bearing capacity of the wall under a concentrated load.

4.4.1. The Effect of Concrete Strength

The load carrying capacity and load contribution would vary with different steel strengths. As shown in Figure 13 and Table 5, an increase in concrete strength resulted in enhanced bearing capacity of the column due to the bolstered bearing capacity provided by the concrete. With an increase in concrete strength from 4 MPa to 6 MPa, 8 MPa, and 10 MPa, the bearing capacity increased by 13.5%, 24.2%, and 30.8% respectively. Moreover, the contribution ratio of concrete also increased from 52.9% to 75.7%.

4.4.2. The Effect of Steel Strength

The impact of varying steel strength of the CFS composite wall is illustrated in Figure 13 and Table 5. Increasing the steel strength improved the axial load capacity of the wall by increasing the load provided by the end columns. With an increase in steel strength from 235 MPa to 355 MPa, 460 MPa, and 550 MPa, the load-carrying capacity of the CFS combination wall increased by 41.4%, 41.4%, and 80.5%, respectively. Additionally, the bearing capacity of the corner columns increased from 446.9 MPa to 582.6 MPa.

4.4.3. The Effect of Concrete Cover Thickness

The load carrying capacity and load contribution with different concrete cover thicknesses are shown in Figure 13 and Table 5. It can be seen that the increasing concrete cover thickness would enhance the bearing capacity of the CFS composite wall due to the increase in the concrete area. With an increase in concrete cover thickness from 20 mm to 30 mm, 40 mm, and 50 mm, the bearing capacity increased by 13.5%, 24.2%, and 30.8%, respectively. Additionally, the contribution of concrete also increased from 52.9% to 75.7%. Generally, thickening the concrete cover increases the wall’s bearing capacity, but its impact is less than increasing the concrete strength.

4.4.4. The Effect of Hole Spacings

The mechanical properties of the CFS frame wall with varying hole spacings are illustrated in Figure 13 and Table 5. Although an increase in concrete cover thickness had a minimal effect on the contribution ratio of components, it positively affected the load-bearing capacity of components, thereby increasing the load-bearing capacity of the wall. Increasing the hole spacing from 320 mm to 160 mm increased the bearing capacity from 554.1 MPa to 578.3 MPa (concrete), 216.4 MPa to 224.4 MPa (end stubs), 128.5 MPa to 129.3 MPa (calcium silicate board), and 48.3 MPa to 50.99 MPa (interior stub), respectively. Overall, the effect of the openings on the bearing capacity is minimal.

5. Conclusions

Axial compression of the CFS composite wall under concentrated loads was carried out to determine the impact of filled concrete and stub opening. Then, the FE model of the composite wall, validated by the test, was established, and a parameter analysis was carried out to investigate the contribution of components to the bearing capacity. The following conclusions were drawn from this study:
(1) For the composite wall without concrete, failure occurred as a result of the distortional buckling of both the interior and end studs. However, the composite wall filled with foam concrete experienced failure due to local buckling of the end stud, despite the interior stud bearing twice the load compared to the end stud.
(2) The addition of foam concrete significantly enhances the bearing capacity of composite walls. Notably, the presence of stud openings has no significant impact on the bearing capacity of the composite wall. The specimen filled with foam concrete demonstrated a bearing capacity 2.53 times greater than that of the unfilled specimen. Furthermore, the introduction of column openings only marginally decreased the composite wall’s bearing capacity by 3%.
(3) The steel strength was not being fully utilized. The maximum stress of the interior stud was 36% of its yield strength for the infilled specimen and 38% for the unfilled specimen.
(4) The concrete was critical to the CFS composite wall, contributing to more than half the total bearing capacity. The end stubs were the secondary bearing structures whose contribution ratio exceeded 20%. In addition, the interior column plays a minor role and can be ignored.
(5) The parameter analysis of the CFS composite wall shows that improving the strength of concrete, steel, and concrete cover thickness can improve the bearing capacity of the wall. Among them, the improvement of concrete strength has the most obvious effect. In addition, changes in steel strength, concrete cover thickness, and hole spacing have limited effects.

Author Contributions

Writing-original draft, B.Y.; Formal analysis, H.F.; Investigation, Z.Q.; Validation, Q.W.; J.S., Data curation; Supervision, W.W. All authors have read and agreed to the published version of the manuscript.

Funding

This research was funded by Guiyang Engineering Corporation Limited of Power China grant number [YJZD2019-01].

Data Availability Statement

The data presented in this study are available on request from the corresponding author.

Conflicts of Interest

The authors declare no conflict of interest.

References

  1. AISI S213; North American Standard for Cold-Formed Steel Framing—Lateral Design 2007 Edition with Supplement No.1. American Iron and Steel Institute: Washington, DC, USA, 2012.
  2. AS/NZS 4600:2005; Cold-Formed Steel Structures; AS/NZS. Australian/New Zealand Standard: Sydney, Australia, 2005.
  3. BSEN 1993-1-3; Eurocode 3: Design of Steel Structures General Rules—Supplementary Rules for Cold-Formed Members and Sheeting. European Committee for Standardization: Brussels, Belgium, 2006.
  4. Cao, S.P.; Zhou, Q.F.; Peng, Y.L.; Li, G.X. Effects of expansive agent and steel fiber on the properties of the fly ash ceramsite lightweight aggregate concrete. Appl. Mech. Mater. 2013, 357, 1332–1336. [Google Scholar] [CrossRef]
  5. Ke, Y.; Beaucour, A.L.; Ortola, S.; Dumontet, H.; Cabrillac, R. Influence of volume fraction and characteristics of lightweight aggregates on the mechanical properties of concrete. Constr. Build. Mater. 2009, 23, 2821–2828. [Google Scholar] [CrossRef]
  6. Hwang, C.L.; Hung, M.F. Durability design and performance of self-consolidating lightweight concrete. Constr. Build. Mater. 2005, 19, 619–626. [Google Scholar] [CrossRef]
  7. Vieira, L.C.M., Jr.; Shifferaw, Y.; Schafer, B.W. Experiments on sheathed cold-formed steel studs in compression. J. Constr. Steel Res. 2011, 67, 1554–1566. [Google Scholar] [CrossRef]
  8. Shi, Y.; Luo, Z.; Xu, Y.; Zou, Y.; Xu, L.; Ma, Q. Experimental study on the seismic behavior of high-performance cold-formed steel plate shear walls. Eng. Struct. 2022, 251, 113552. [Google Scholar] [CrossRef]
  9. Sun, H.; Cao, B.; Chen, Z.; Du, Y. Shear behaviour of reinforced straw-bale plaster sheathed cold-formed steel-framed shear walls. Biosyst. Eng. 2022, 221, 54–68. [Google Scholar] [CrossRef]
  10. Zhang, X.; Zhang, E.; Zhang, Y. Study on shear performance of cold-formed thin-walled steel walls sheathed by paper straw board. Eng. Struct. 2021, 245, 112873. [Google Scholar] [CrossRef]
  11. Wang, W.; Wang, J.; Zhao, P.; Ja, L.; Pan, G. Axial compressive experiments and structural behaviour estimation of CFS composite walls sprayed with LPM. J. Build. Eng. 2020, 30, 101305. [Google Scholar] [CrossRef]
  12. Xu, Z.; Chen, Z.; Osman, B.H.; Yang, S. Seismic performance of high-strength lightweight foamed concrete-filled cold-formed steel shear wall. J. Constr. Steel Res. 2018, 143, 148–161. [Google Scholar] [CrossRef]
  13. Xu, Z.; Chen, Z.; Yang, S. Effect of a new type of high-strength lightweight foamed concrete on seismic performance of cold-formed steel shear walls. Constr. Build. Mater. 2018, 181, 287–300. [Google Scholar] [CrossRef]
  14. Xu, Z.; Chen, Z.; Yang, S. Seismic behavior of cold-formed steel high-strength foamed concrete shear walls with straw boards. Thin-Walled Struct. 2018, 124, 350–365. [Google Scholar] [CrossRef]
  15. Liu, X.; Wu, H.; Sang, L.; Sui, L.; Xu, C. Estimation of inelastic interstorey drift for OSB/Gypsum sheathed cold-formed steel structures under collapse level earthquakes. Adv. Mater. Sci. Eng. 2019, 2019, 2896938. [Google Scholar] [CrossRef]
  16. Prabha, P.; Marimuthu, V.; Saravanan, M.; Palani, G.S.; Lakshmanan, N.; Senthil, R. Effect of confinement on steel-concrete composite light-weight load-bearing wall panels under compression. J. Constr. Steel Res. 2013, 81, 11–19. [Google Scholar] [CrossRef]
  17. Xu, Z.; Zhang, J.; Chen, Z.; Yang, S.; Li, J. Axial compressive behavior of new HFC-filled CTS composite walls sheathed with straw-fiber boards. Structures 2020, 28, 2582–2595. [Google Scholar] [CrossRef]
  18. Wu, H.; Chao, S.; Zhou, T. Cold-formed steel framing walls with infilled lightweight FGD gypsum Part I: Cyclic loading tests. Thin-Walled Struct. 2018, 132, 759–770. [Google Scholar] [CrossRef]
  19. JGJ227-2011; Technical Specification for Low-Rise Cold-Formed Thin Wall Steel Buildings. Ministry of Housing and Urban-Rural Development of P.R. China: Beijing, China, 2011. (In Chinese)
  20. GB/T 228.1-2010; Metallic Materials-Tensile Testing-Part 1: Method of Test at Room Temperature. China Architectural and Building Press: Beijing, China, 2010. (In Chinese)
  21. JG/T266-2011; Foamed Concrete. Ministry of Housing and Urban–Rural Development of P.R. China: Beijing, China, 2011. (In Chinese)
  22. Zhang, X.; Zhang, E.; Li, C. Study on axial compression mechanical behavior of cold-formed thin-walled C-shaped steel composite wall sheathed with straw board on both sides. Structures 2021, 33, 3746–3756. [Google Scholar] [CrossRef]
  23. ABAQUS. Analysis User’s Manual, Version 6.14; Dassault Systemes SIMULIA Corp.: Providence, RI, USA, 2014. [Google Scholar]
  24. Abdel-Rahman, N.; Sivakumaran, K.S. Material Properties Models for Analysis of Cold-Formed Steel Members. J. Struct. Eng. 1997, 123, 1135–1143. [Google Scholar] [CrossRef]
  25. GB 50010–2010; Code for Design of Concrete Structures. Architecture & Industry Press of China: Beijing, China, 2010. (In Chinese)
  26. Rowe, R.E.; Somerville, G.; Beeby, A.W. BS8110; Handbook to British Standard BS8110: 1985: Structural Use of Concrete. Palladian Publications: London, UK, 1987.
  27. Liu, B.; Hao, J.P.; Zhong, W.H. Performance of cold-formed steel-framed shear walls sprayed with lightweight mortar under reversed cyclic loading. Thin-Walled Struct. 2016, 98, 312–331. [Google Scholar] [CrossRef]
Figure 1. Configuration of the specimens. (a) Front view of composite wall; (b) opening of end stud; (c) opening of interior stud; (d) section of composite wall without concrete; (e) section of composite wall with concrete.
Buildings 13 01232 g001
Figure 2. Test device. (a) Test setup; (b) secondary distribution beam.
Buildings 13 01232 g002
Figure 3. Instrumentation of specimens. (a) Displacement sensors; (b) strain gauges.
Buildings 13 01232 g003
Figure 4. Failure mode of specimen CFSW-1.
Buildings 13 01232 g004
Figure 5. Failure mode of specimen CFSW-2.
Buildings 13 01232 g005
Figure 6. Failure mode of specimen CFSW-3.
Buildings 13 01232 g006
Figure 7. Load–displacement curves. (a) Comparison between CFSW-1 and CFSW-2. (b) Comparison between CFSW-1 and CFSW-3.
Buildings 13 01232 g007
Figure 8. Load–strain curves. (a) CFSW-1; (b) CFSW-2; (c) CFSW-3.
Buildings 13 01232 g008
Figure 9. FE modelling of CFS composite walls under concentrated load.
Buildings 13 01232 g009
Figure 10. Stress–strain model of material. (a) Cold-formed steel; (b) foam concrete; (c) calcium silicate board.
Buildings 13 01232 g010aBuildings 13 01232 g010b
Figure 11. Comparison of failure mode between test results and FEM results. (a) Distortional buckling of the end stud; (b) cracking of foam concrete.
Buildings 13 01232 g011
Figure 12. Comparison of load–displacement curves between test results and FEM results. (a) CFSW-1; (b) CFSW-2; (c) CFSW-3.
Buildings 13 01232 g012
Figure 13. The load contribution of components in CFS composite wall.
Buildings 13 01232 g013
Table 1. Test specimens.
SpecimensInfilled MaterialOpenings
CFSW-1Foamed concrete-
CFSW-2Foamed concrete160 mm spacing
CFSW-3--
Table 2. Mix proportion of foam concrete.
Cement
(g)
Desert Sand
(g)
Water
(g)
Foam Volume
(L)
Water-Reducing
Agents (g)
Polypropylene
Fiber (g)
Water–Cement Ratio
45015012613.60.90.28
Table 3. Material properties of foamed concrete.
SpecimensApparent Density (g/cm3)Compression Strength (MPa)
C11021.05.15
C21046.95.08
C31058.24.16
Average1042.04.80
Table 4. Results of mesh sensitivity analysis for specimen CFSW-1.
Mesh Size (mm)Number of ElementsTotal Run Time (min)Error (%)
15364,3992843.8
20192,8861624.1
25103,032825.0
3076,615666.2
Note: the error refers to the difference between FEM results and test results.
Table 5. Detail of the CFS composite wall in parametric analysis.
Specimen fc
(MPa)
fy
(MPa)
t
(mm)
s
(mm)
Bearing CapacityContribution RatioNFE
(kN)
Nic
(kN)
Nec
(kN)
Ncc
(kN)
Ncb
(kN)
ξic
(%)
ξec
(%)
ξcc
(%)
ξcb
(%)
W-C44594.430/66.85274.7555.4153.96.4 26.1 52.9 14.6 1050.8
W-C66594.430/59.11235.4761.3136.55.0 19.7 63.9 11.4 1192.3
W-C88594.430/47.4212.2924.8120.53.6 16.3 70.9 9.2 1304.9
W-C1010594.430/40.5185.81041.0107.02.9 13.5 75.7 7.8 1374.3
W-S2353.6523530/40.4168.3446.91015.322.259.113.3756.6
W-S3553.6535530/45.4193503.6112.95.322.658.913.2854.9
W-S4603.6546030/49.1209.1544.4121.35.322.658.913.1923.9
W-S5503.6555030/52.3217.8582.6130.45.322.259.313.1983.1
W-t203.65594.420/54.9237.5553.8129.85.624.356.713.3976.0
W-t303.65594.430/52.3227.8586.6130.45.222.858.813.1997.1
W-t403.65594.440/50.1221.1621.7126.54.921.761.012.41019.4
W-t503.65594.450/48.6220.2670123.44.620.763.111.61062.2
W-s3203.65594.43016048.3216.4554.1128.55.1 22.8 58.5 13.6 947.3
W-s2403.65594.43024049.9220.6567.3129.35.2 22.8 58.7 13.4967.1
W-s1603.65594.43032050.9224.4578.3130.25.2 22.8 58.8 13.2 983.8
Note: fc is the compression strength of the concrete. fy is the yield strength of the steel. t is the thickness of the concrete cover. s is the distance of the adjacent holes. Nic, Nec, Ncc and Ncb are the load bearings of the interior stub, end stub, concrete, and calcium silicate board, respectively. ξic, ξec, ξcc, ξcb are the load contribution ratios of the interior stub, end stub, concrete, and calcium silicate board, respectively.
Disclaimer/Publisher’s Note: The statements, opinions and data contained in all publications are solely those of the individual author(s) and contributor(s) and not of MDPI and/or the editor(s). MDPI and/or the editor(s) disclaim responsibility for any injury to people or property resulting from any ideas, methods, instructions or products referred to in the content.

