Article

The Unintended Consequences of COVID-19 Economic Responses on First Home Buyers? Evidence from New South Wales, Australia

1
School of Built Environment, University of Technology Sydney, P.O. Box 123, Ultimo, NSW 2007, Australia
2
School of Built Environment, University of New South Wales, High Street, Kensington, NSW 2052, Australia
3
Track Financial, Sydney Office, Level 36, Gateway Tower, 1 Macquarie Place, Sydney, NSW 2000, Australia
*
Author to whom correspondence should be addressed.
Buildings 2023, 13(5), 1203; https://doi.org/10.3390/buildings13051203
Submission received: 1 April 2023 / Revised: 28 April 2023 / Accepted: 29 April 2023 / Published: 1 May 2023
(This article belongs to the Special Issue Property Economics in the Post-COVID-19 Era)

Abstract

:
As in many other nations, the Australian Government implemented monetary and fiscal policies in response to the COVID-19 pandemic to aid economic recovery. Among these policies were specific measures to assist first home buyers (FHBs) in entering the housing market. However, these unprecedented economic policies might have other direct and indirect implications on FHBs, which have yet to be thoroughly explored in the literature. To fill this gap, through a survey, we collected information via public and online mortgage broker platforms from 61 FHBs who successfully entered the housing market or were actively searching during the pandemic. The results found COVID-19 economic responses counterproductive for FHBs, pushing them to a more disadvantaged position due to an overheated property market. In addition, since the onset of the pandemic, property prices have risen significantly, exacerbating housing inequality as FHBs increasingly rely on intergenerational family support, take on more financial risk, and relocate to regional areas due to fear of missing out. The study highlights the need for macroeconomists and housing policymakers to consider these unintended consequences in formulating policies that minimise the adverse effects of economic stimulus measures.

1. Introduction

There has been a significant increase in real house price growth in most advanced economies since the 1970s. Kishor and Marfatia [1] found a steady increase in average real house price growth in 15 OECD countries, with Australia showing the highest average quarterly growth of 0.74% between March 1975 and December 2013. More recently, Australia’s average quarterly house price growth of 2.77% ranked above Canada (2.33%), the Netherlands (2.55%), the United Kingdom (1.28%), and the United States (2.55%) over March 2020 and December 2021 [2]. Factors such as the rapid growth in house prices across advanced markets, increasing neoliberal housing policies, and the recent issue of housing financialisation, especially in countries with a capitalist sociopolitical background, have resulted in a significant decline in the homeownership rate. In the United States, for instance, the homeownership rate was below other advanced economies during 2000–2018 [3], and this has caused heterogeneous effects among households in the country [4]. According to a report by the Local Government Association [5], homeownership rates among young people in the United Kingdom have decreased compared to 20 years ago. Similarly, an Australian Parliament report prepared by Hall and Thomas [6] shows that home ownership rates significantly declined between 1971 and 2016, particularly for the age group of 22–34, which dropped from 57% to 44.6%. Various factors have accounted for this worsening home ownership. Acolin et al. [7], for instance, highlighted rigid lending criteria as a critical barrier to entry. Bourassa and Shi [8] (2017) identified borrowing constraints and ethnicity as contributing factors to the declining home ownership rate. The issue of income growth failing to catch up with rising house prices was raised by Bourassa and Shi [8], Blundell et al. [9], and Bangura and Lee [10,11]. Moreover, the use of housing investment for speculative wealth generation has been evident recently [12].
The COVID-19 pandemic exacerbated the issue of home ownership, culminating in the development of significant economic stimulus packages, some of which were targeted at first home buyers (FHBs) either directly or indirectly [13]. In the United Kingdom, the central bank reduced the cash rate by 65 basis points to 0.1% and the government introduced a new mortgage guarantee scheme from April 2021 for home buyers with a deposit of almost 5% on homes with a cap value of GBP 600,000, together with the extension of the stamp duty land tax exemption until June 2021 (International Monetary Fund (IMF) [14]). Further, the Coronavirus Act 2020 offered more protection to social and private tenants by delaying the period that landlords can evict tenants [15]. According to IMF [14], the COVID-19 response policies of Fannie Mae and Freddie Mac in the United States include providing mortgage forbearance for a period of 12 months and waiving related late fees, suspending reporting to credit bureaus of delinquency that is related to forbearance, extending foreclosure sales and evictions of borrowers to 60 days, and providing loan modification options. In Australia, policies such as early superannuation withdrawal in two separate cases of AUD 10,000 each, home lending rate reduction, first home loan deposit scheme, and Homebuilder, a cash grant to new home builders or significant renovators, are considered to have a direct relationship with first home buyers (FHBs) [16], while income supplementary programs such as JobKeeper and JobSeeker, as well as a moratorium on evictions, and mortgage payment pauses are not directly targeted at FHBs, but they may have some financial implications for this cohort in the housing market (economic responses to the COVID-19 recession with direct and indirect benefits to FHBs are summarised in Appendix A). The Homebuilder program was introduced by the former Commonwealth Minister for Housing, former Commonwealth Treasurer, and the former Prime Minister of Australia on 4 June 2020 to propel economic growth and boost jobs in the housing construction sector during the COVID-19 pandemic. Homebuilder provides eligible owner–occupiers a grant to build a new home or substantially renovate an existing home. A grant of AUD 25,000 was offered to those contracts entered between 4 June 2020 and 31 December 2020, and later, an AUD 15,000 grant was offered to eligible contracts entered between 1 January 2021 and 31 March 2021. The Treasury initial forecast of the Homebuilder was around 27,000 grants at a total cost of approximately AUD 678.3 million across the country. However, by 24 June 2022, Homebuilder had successfully offered a total of 100,214 grants to eligible recipients, with an approximate value of AUD 2.3 billion in total grant funding. This discrepancy can be attributed to the resulting overheated residential construction industry caused by heightened construction activities that culminated in significant material, land, and labour supply issues (Australian Department of the Treasury (ADT) [17]). In the context of global cities, such policies will help to mitigate the vulnerability that cities are prone to during external shocks [18].
Despite the variation in the nature and scope of COVID-19 policy interventions across nations, as argued by Blundell et al. [9], it is still glaring that the crisis will continue to escalate inequalities among households. This raises questions around the success and externalities of these intervention policies on potential FHBs. To address these questions, we conducted a case study of New South Wales (NSW), Australia’s most populous state, where affordable entry-level housing has declined significantly [11,19]. Further, Sydney, the capital of NSW is the least affordable city of Australia in terms of housing and the second least affordable globally [10,11,20]. This means that, being a highly urbanised city, Greater Sydney will continue to experience what Ribeiro and Gonçalves [21] described as new and continuing challenges in providing housing and other essential services. These reasons make NSW an interesting case study. Our study focuses on the external impacts of stimulus packages on first home buyers (FHBs) during the COVID-19 pandemic. We assess the effectiveness of these policies in promoting entry into the housing market and investigate whether they provided direct or indirect assistance to FHBs in competing against other market participants, such as investors or cash buyers.
This study contributes to the literature in the following ways. First, to the best of our knowledge, the study is likely the first attempt to evaluate the effectiveness of economic stimulus packages aimed at facilitating FHBs’ entry into the housing during the COVID-19 pandemic. Even though extensive studies have examined the effects of government policies, such as fiscal stimulus and monetary policy interventions to aid economic recovery [9,22,23], limited research has been carried out on the association between such policies and FHBs. Given the decline in housing affordability, we examine whether government policies assist or hinder FHBs in entering the housing market. The findings are strongly linked to cities’ resilience by highlighting the challenges that FHBs face in accessing affordable housing during a global shock, such as the COVID-19 pandemic. Housing affordability is an essential component of urban resilience as it affects a city’s ability to attract and retain a diverse workforce, sustain local economies, and support social cohesion [3,18]. The study’s emphasis on the unintended consequences of economic stimulus policies, such as inflating property prices and exacerbating inequality, could inform policymakers in developing more effective housing policies that promote urban resilience. By promoting more equitable access to affordable housing, cities can become more resilient to withstand global shocks [19].
Second, this study differs from previous COVID-19 research as it employs a qualitative analysis, rather than quantitative modelling on empirical data, to investigate the externalities of economic stimulus packages on FHBs for the first time. By using this approach, the study can gain insights into the perceptions and experiences of FHBs regarding COVID-19 policies, which can reveal the complexity and subtlety of their perspectives. Through this in-depth exploration of the issues, the study can develop a thorough understanding of the subject matter, particularly the potential externalities of these packages on FHBs [24]. Specifically, FHBs may have unique experiences and perspectives on COVID-19 related policies that may not be fully captured by quantitative modelling. A qualitative analysis can provide a more comprehensive understanding of their experiences. Further, a qualitative analysis can help to uncover the diversity of these effects. By exploring the experiences of FHBs, the study can shed light on the specific challenges and opportunities faced by this group during the pandemic. By understanding the perceptions and experiences of FHBs, policymakers and practitioners can develop more effective interventions and policies that address the unique challenges faced by this group.
The rest of the paper is structured as follows. Section 2 presents the related literature, while Section 3 discusses the data and methodology of the study. The findings and analyses of the results are presented in Section 4, and Section 5 summarises the findings and presents the policy implications.

2. Literature Review

2.1. The Affordability Crisis

The number of FHBs in the market has fluctuated in recent years, despite the multiple stimulus packages provided by State and Federal Governments. In times of economic distress, FHBs are provided with an opportunity to purchase at potentially subdued prices and benefit from increased government stimulus. Examples can be seen in first home ownership loan commitments spikes during the post-global financial crisis (GFC) recession and again after the COVID-19 recession (Australian Bureau of Statistics [ABS] 25). While these increases are significant, they were short-lived, as sharp increases are followed by sharp corrections [25], suggesting that the underlying affordability issues remain [16]. These affordability issues continue for FHB and can be linked to limited wage growth since the GFC in 2008 [26]. Disinflation, deregulation, and a surge in home lending have continued to fuel house price growth [27], exacerbating the difficulty to entry [12]. Pawson et al. [12] stated that a critical global indicator of declining affordability is an increasing house price to income ratio, in which Australia, particularly Sydney, has seen dramatic increases [28]. Over time, the home loan interest rate reduction and, more importantly, the home lending assessment rate reduction, has increased individual borrowing capacity [12]. As expected, house prices increased accordingly, further intensifying the difficulty of entry or increasing “the deposit gap” [12]. Kohl [29] suggests that even if this gap is bridged, young people today are often still worse off than their parents due to house prices reaching unpredictably high levels. Sydney, in particular, has become a near-impossible market to enter for FHB without significant assistance, with the median house price over 54% higher than the national average at $1,410,133 (Real Estate Institute of New South Wales (REINSW) [30]).
First home ownership in Australia has become increasingly complex, with considerable research reviewing deteriorating affordability [10,11,12,19,31,32]. Young people, in particular, have struggled to obtain home ownership, with many accepting that the situation will likely remain unchanged for the foreseeable future [32,33]. A recent survey by Genworth [34] further supports this sentiment, with FHBs continuing to “adjust their expectations” and even conceding that their first home purchase will not be their ideal home but rather a way of entering the market. An uneven playing field contributes, with investors receiving substantial tax benefits when holding or selling property, leaving first home buyers unable to compete [19]. Bangura and Lee [11] found that an uneven playing field exists between first home buyers, with affordability rates more sensitive to determinants within different geographical submarkets, such as Western Sydney compared to the Eastern Suburbs. While initial research suggested that supply and demand are some of the main determinants of housing affordability [10], further research proposes that an increase in supply would improve rates of affordability to various degrees depending on geographic locations, such as Western Sydney versus the inner-west [11]. Conversely, post-GFC, as apartment construction boomed, Sydney continued to experience strong asset price inflation [35].

2.2. The Financialisation of Housing

Financialisaton of housing means housing is being treated as a commodity instead of a social good and, as such, it has become a significant investment option and a vehicle to generate wealth [36]. The financialisation of housing has also fuelled investors’ shares of new home lending, as investor home loans surpassed owner–occupier home loans for the first time in NSW in 2017, which indicates strong housing investment activities [37]. Whilst this trend was subdued in more recent years due to the Australian Prudential Regulation Authority (APRA) restrictions on investment lending [38], mid-2021 saw a resurgence of investors in the market [39], whilst the number of FHB fell significantly [25]. Continued financialisation, encouraged through economic motivators such as favourable tax policies or financial deregulation, promotes further price inflation as property is used as a speculative wealth generator [12,19,40]. The effectiveness of housing as an investment vehicle compared with major asset classes such as stocks further promotes the financialisation of housing as a wealth generator [41]. Further, numerous studies also suggested that property is an effective investment vehicle with strong inflation-hedging capacity [42,43]. Even though the financialisation of housing would encourage investors’ involvement in this sector, it could also cause unprecedented house price volatility and periodic booms and busts [44]. Importantly, Bangura and Lee [45] offered some empirical evidence to suggest that areas with high level of housing investor activities (e.g., Western Sydney) are prone to housing price bubble as housing investors tend to engage in speculation activities. Neoliberal economic policies such as negative gearing intensifies investor demand and worsens the housing affordability crisis [46]. Morris [19] posits that, while every government policy supports housing financialisation, affordability issues continue. Cook and Ruming [47] expand further in suggesting that financialisation also involves financialised home ownership in which owner–occupiers would band together to influence planning and development outcomes to maximise their returns. Contrary to standard expectations, this mode of financialisation occurs through the restriction of densification, with owner–occupier’s influence on planning authorities limiting housing supply [47], which in turn can inflate an area’s property prices.
From 1996 to 2006, financialisation increased significantly as lending deregulation occurred, resulting in significant house price appreciation [40]. In the literature on housing financialisation, while some studies supported further financialisation as a route to increased home ownership, the vast majority found financialisation to be a driver of increased inequality with significant negative externalities such as the global financial crisis and great recession [12,19,36,48]. Yanotti and Wright [40] found that a 1% increase in average gross income or current rental income is linked to a 12.8% and 18.7% increase in the likelihood of residential property investment, respectively. This suggests that due to a mindset of continued financialisation, increased wages may work against first home buyer affordability. The analysis gives credence to the inadequacies in market-driven solutions to economic crisis raised by [22], causing varying economic consequences across Australia. Wealth disparity resulting from the financialisation of housing, for example, was seen in Canada from 1996 to 2010 and again from 2011 to 2017, where significant wealth inequality caused an increase in asset prices and household debt-to-income ratios [48]. Pawson et al. [12] described this characteristic of financialisation in the developed world as the reconstruction of welfare.

2.3. The COVID-19 Economic Crisis

The onset of the COVID-19 pandemic has had a significant impact on the broader economy and property markets [49,50]. As the COVID-19 pandemic began to affect global economies, governments across advanced economies developed substantial economic stimulus programs. Australia’s stimulus packages are centred on the premise of economic recovery, predominantly supporting businesses in maintaining payroll by issuing additional cash support through small business cash boosts, tax waivers, and government-supported business loans [51]. Other supports included extraordinary superannuation withdrawals for individuals in hardship and first home buyers’ support through government finance guarantees and new home building grants. This suite of policies looked to maintaining employment under the ideology of promoting businesses as the way out of Australia’s first recession in close to 30 years [51]. Further fiscal support was provided through quantitative easing and the continued reductions in the cash rate to record low levels [52]. The efficacy of budgetary support is well known and supported during times of deep economic recession. However, to dampen interest rate risks, a lengthened debt maturity structure is considered [53]. The unprecedented level of government debt required to support these stimulus measures will thus become an additional concern for young people today, who will inevitably be tasked with repaying the resultant debt [32]. Further, expansionary fiscal policy in historically low interest rates, whilst driving the economic recovery back to full employment [36], favours property investors to the detriment of first home buyers, as house prices will continue to escalate [12].
The significant effort in maintaining control of the COVID-19 virus, combined with extensive financial stimulus, provided the basis for a solid V-shaped economic recovery [54]. With Australia’s GDP back to pre-COVID levels [55], stimulus measures may have been, in some instances, excessively similar to the GFC responses, which later resulted in an interest rate rise from 3% to 4.75% to cool an overheated economy [56]. Although solid growth in the first home buyer segment was seen in the December 2020 quarter, likely due to stimulus packages and the Homebuilder Grant, this has since declined, with a fall of 1.9% in April 2021 [57]. O’Callaghan and McGuirk [58] suggested that financial crises, such as the COVID-19 recession, act as accelerants to financialisation, while Hall [59] posited that these problems facilitate accumulation by dispossession via the transfer of assets as reduced cost for future profit. As asserted by Harvey [60], accumulation by dispossession is becoming a threat to the very existence of urban life and cities. Sassen [61] added that, in expanding the operational space for advanced capitalism, people are at risk of losing possessions and poverty levels are likely to increase. This can also be observed through the aforementioned neoliberalised workforce and the emergence of the “gig” employee [33]. The casualisation of employment is prevalent in industries employing younger workers [23], and yet, many of these casual workers received little from the government JobKeeper support program [33], favouring multibillion-dollar businesses, many of which did not experience the required 30% drop in revenue [13].
Further stimulus was provided through continued expansionary monetary policy. In the COVID-19 recession, Australia’s interest rates were at historically low levels, yet were reduced a further three times through 2020 to 0.10% in 2021 (Reserve Bank of Australia (RBA) [62]). As the actual depth of the recession developed, the RBA further announced a quantitative easing program consisting of AUD 100 billion in state and federal bond purchases [63]. By controlling the money supply, the RBA effectively ensured interest rates remained at historically low levels to reduce the cost of borrowing, therefore supporting the economy [63]. Given the stimulus being provided, Australia consequently enjoyed a strong V-shaped recovery [54]. However, these policies might not necessarily enhance housing affordability of FHBS. In fact, FHBs could potentially find it harder to purchase a property due to the rapid increase in housing prices and the increased competition from housing investors.
Even though the financialisation of housing has become prevalent, it has not been examined in the context of the economic responses to COVID-19, especially with regard to first home buyer externalities in NSW. This research reviews how economic policies have shaped the landscape for first home buyers through the COVID-19 financial crisis, contributing to the literature on monetary policy and first home buyers.

2.4. Conceptual Framework

Following the literature review, we adopted a conceptual framework that links government economic policies with the financialisation of the housing market to highlight the externalities of COVID-19 economic responses. As illustrated in Figure 1, government intervention through tax and other policies is often used to stabilise the economy, but this may have some unintended consequences in the housing market. Even though Australia’s COVID-19 economic responses stimulated business activities that led to relative business stability, these policy actions might have caused wealth generation and other inadvertent effects in the housing market. We, therefore, examine these policies and highlight the concerning externalities for first home buyers in NSW.
The government often intervenes in the economy through policies such as taxation, but this can potentially have unintended consequences in the housing market. Current taxation policies of discount capital gains tax and negative gearing are encouraging the assetisation of housing [64], promoting investor activity and further pressuring house prices [46]. In addition to these tax benefits, monetary policy, such as quantitative easing and the persistent reduction in the cash rate to record-low levels, can be a further stimulus for investing, with approximately 80% of investors financing their investments [40,52], which provides additional tax benefits. Such policies can be depicted as additional protection from the risk presented to property owners, promoting an already increasing inequality [35]. Even though expansionary monetary and fiscal policies can be viewed as effective government policy instruments for stimulating productivity during times of economic crisis [65,66], concurrently, overstimulating an economy can lead to increased inequality, creating unintended barriers for first home buyers due to the ever-increasing deposit gap associated with these economic policies [12,67].
Further, the state’s role in the property market has evolved from the welfare state crisis in the housing sector to a more neoliberal paradigm of governance. Seminal work by Harvey [68] has traced the genesis of these transformations in urban governance as a passage from administrativism/management to entrepreneurship/urban entrepreneurship in the early 1970s, built on the consensus that those cities adopting a more entrepreneurial posture would have greater positive benefits for their populations. Urban governments offered incentives to attract external sources of financing, new direct investments, or sources of employment, often at the risk of the public sector and benefit of the private sector [68]. This is also evident in the financialisation of the housing market [36].
As discussed earlier, the financialisation of the housing market refers to the treatment of housing as a commodity for wealth accumulation, financial asset, or profit maximisation via financial speculation, leading to a rapid increase in housing prices [69,70]. The term financialisation is also used to describe the growth in influence of financial actors around the globe as well as the socioeconomic transformations that this growth has produced. The prevalence of this use has conditioned access to housing and housing security for populations, increasing inequalities in living conditions, causing socioterritorial segregation and increasing poverty levels (Ng et al.) [71]. This trend has been driven by a shift in investment strategies following the global financial crisis of 2008 and it has resulted in ongoing housing affordability challenges in many countries, including Australia.
Given its financialisation, housing is seen as a gateway to financial security via the accumulation of land and generation of wealth [48,64]. Aalbers [69] asserts that the financialisation of housing has become a significant driver of housing market dynamics worldwide. The author highlights that the global financial crisis of 2008 was a turning point in the financialisation of housing, as it marked the moment when investors and speculators began to turn to real estate as a safe haven for investment. This shift resulted in a significant increase in housing prices, which has continued to this day. Similarly, Murry and Collins [70] suggest that the financialisation of housing has contributed to the ongoing housing affordability crisis in Australia. The authors argue that the commodification of housing has led to a focus on profit maximisation rather than meeting the housing needs of the population, resulting in rapidly rising housing prices that make it difficult for many Australians to access affordable housing. This was intensified by the removal of investor restrictions in 2018 [38].
Based on the information presented, it can be concluded that the financialisation of housing for profit has become a common practice in the housing market. However, fiscal and monetary policies implemented to address the COVID-19 economic crisis are likely to exacerbate the existing affordability crisis, potentially to the detriment of first home buyers. Taxation policies currently in place encourage investor activity and further drive up house prices, while monetary policies such as interest rate reductions incentivise investing, contributing to increasing inequality.

3. Data and Methodology

3.1. Primary Data Collection

Primary data were collected from currently active, or recently successful, first home buyers across NSW, with a complete list of survey questions in Appendix B. The respondents must have been looking or have purchased after March 2020, when significant COVID-19-related economic policies and stimuli began to take effect. Survey response data were stored online. However, all participants remain anonymous. The initial questionnaire was pretested with five anonymous respondents. The pretesting of the drafted instrument resulted in several question-flow adjustments, creating more clarity, improving the consistency of the results given the precise nature of the questions, and supporting the survey results’ dependability. According to Flick [72], this ensures the data and information are “congruent with the purpose of the research”.

Primary Data Sampling

The total number of new first home buyers with loan commitment ranges from AUD 2104 to AUD 3640 per month, from March 2020 to August 2021, is 55,202 [25]. The sample population is estimated to be many times higher given the number of unsuccessful home buyers in the market each month, along with new prospective first home buyers. The total population was estimated firstly by analysing the total possible number of property buyers, being singles and couples aged between 20 and 55 years old. Buyers outside this age bracket are deemed outliers due to the difficulties they would generally face in obtaining finance, lack of income or work experience, or proximity to retirement. As displayed in Table 1, ABS data were used to estimate a total purchasing population of 3,867,147. Of this population, 25% are estimated to be living as couples [73], reducing the number of buyers, singles, and couples to 2900,360. Finally, the latest home lending indicators show that first home buyers make up 31.4% of all new lending commitments. In the absence of statistics on the number of would-be first home buyers, we used this figure to proxy the percentage of potential first home buyers, both looking and successful, being 910,713. While this figure aims to include potential first home buyers over a broad age spectrum, the average age bracket of FHLDS participants is between 25 to 29, with one in nine recipients under 40 years of age (National Housing Finance and Investment Corporation [NHFIC] [74]), potentially due to income or property requirement restrictions.
Respondents, first home buyers across NSW, were accessed and sourced through the mortgage broking industry and a public online platform. Given the sample population size, distribution of indicators, and geographically spread nature of possible respondents, along with feasibility and budgetary constraints, the study used purposive nonprobability sampling [75]. To ensure participant anonymity, the survey link was distributed publicly, and online mortgage brokers were requested to distribute the survey instrument to possible participants to voluntarily complete the questions. The study consisted of 61 respondents from both platforms across the determined subgroups throughout NSW, and the summary statistics of the respondents are presented in Table 2. Even though we obtained a good variegation of respondents, time and funding constraints created a limitation to the number of survey responses captured and the reproducibility of the results

3.2. Data Analysis Methods

Following Creswell and Poth [76], a qualitative approach was used to analyse the collected data. This approach offers a deeper and more meaningful understanding of the research questions. We used the Nvivo software to conduct the qualitative analysis of the survey responses by creating thematic, multipart stratification, complemented by some descriptive statistics such as averages and percentages. In using Nvivo nodes, initial deductive codes were created to begin the analysis. Significant parent, child, and second child codes are listed in Table 3. Once analysis started, additional inductive codes were added to increase the variegation, forming data-driven themes [77]. Additional literature on the subject topic, such as industry publications, financial press, and complementary research papers, supplemented the data collection.

4. Findings and Analysis

We developed several themes both deductively and inductively to analyse and provide insight into the study. As represented in Figure 2, themes emerged around increasing house prices and inequality, and this is linked to many of the main Nvivo nodes. Many child nodes bore relation back to the two main themes, which can be closely related to affordability. Subthemes were also identified, such as increased reliance on Bank of Mum and Dad (BMD), housing to support market growth (financialisation), and the increasing deposit gap. Through the analysis of both primary and secondary data, these themes are represented and investigated through the number of references to their parent nodes.

4.1. Property Prices Increased Significantly since the Pandemic

A key theme identified in the analysis was the significant role that house price gains played over the course of the research period. Nvivo parent nodes relating to increasing property price movements represents a significant theme, as outlined in Table 4. While no single factor adequately explains the acute price changes, the most frequently referenced driver was interest rate, with almost 28 direct references, and more indirect references. As a result of the sustained astronomical increase in housing prices, 23 references noted that they had to relocate for relative affordability. Further, 18 surveyed respondents stated they reduced their expectations of the property type due to the increase in house prices.
One of the respondents stated “The first homeowner grant is capped at AUD 70,000 which in Sydney is almost nothing in any area. It is like you get disadvantaged for working hard and having a well-paying job”. Another respondent stated “Sydney home buyers should have more appropriate grants because nothing is cheap”. One more noted that “there is no reversal in the trend of housing prices making home ownership a mere pipedream”. The responses generally indicate that the rapid increase in housing prices during the pandemic is correlated to low interest rate, which poses a serious challenge for first home buyers. The RBA utilised monetary policy as an economic stimulus measure, reducing the overnight cash rate to 0.10% and implementing a significant bond-buying program [78]. The low overnight cash rate is an impetus for lending institutions to offer home loans at the lowest housing interest rates in 40 years. While the aim of the government is to support household and business cashflow through the COVID-19 recession [78], existing homeowners have also experienced a significant increase in their personal wealth. From March 2020, the total market value of Australian property market increased from approximately AUD 7.3 trillion to almost AUD 9 trillion by June 2021, with over 40% of this value located in NSW [25]. This occurred despite initial consensus that house prices would experience significant decline due to the COVID-19 recession, including estimated losses of up to two-thirds in some instances [57]. With tightened lending criteria since May 2022, housing market dynamics in 2021–2022 differ from the 2020–2021 situation, with less first home owner activity and increased competition between owner–occupiers and investors [79].
Further, as initially suggested by Pawson et al. [12], one of, the barriers, if not the main barrier, to entry for FHBs is the “deposit gap”, which has increased dramatically with house prices. ABS statistics from the June quarter of 2020 to the June quarter of 2021 demonstrate that Sydney alone has seen property price increases by nearly 20% (ABS 25), with ANZ Bank forecasting further rises into 2023 [80]. In response, the Minister for Housing in Australia “expand the New Home Guarantee for a second year, providing an additional 10,000 places in 2021–2022. First home buyers seeking to build a new home or purchase a newly built home will be able to do so with a deposit of as little as five per cent” [81]. Our findings clearly support previous studies and policy statements that highlighted the excessive increase in house price in Sydney during the pandemic.

4.2. An Uneven Playing Field Promotes Inequality

Inequality was by far the most referenced category in the FHB surveys, with almost 48% of participants attributing the difficulties faced by FHBs to investors and existing homeowners receiving significant advantages. Of note are references to the inability to compete with “investors” or “cash buyers”, who are seen to easily outbid FHBs. Further, removal of neoliberal economic policies, such as negative gearing and capital gains tax waivers, were often promoted as possible solutions to FHBs affordability. One respondent specified that “negative gearing and concessions on capital gains are giving undue advantage to investors”. The Nvivo parent nodes relating to inequality are represented in Table 5. These results reflect the findings of Adkins et al. [69], who argued that such inequality is the byproduct of expansionary economic policies, with inflating house prices being the single largest driver of consumer demand in the Australian economy. These findings are also consistent with Gallent and Madeddu [82], who highlighted the widening inequalities in the distribution of housing wealth prompted by COVID-19. These inequalities are expected to have varying and long-term effects in terms of housing wealth [83].
The rapid growth of house prices during the pandemic was also documented by Hughes [84]. They found that prices have increased with unbridled volatility, and that up to 5% of buyers could not resist capitalising on the gains by selling their property within the first 12 months. While such windfall gains benefit existing homeowners, it highlights that prospective FHBs are hampered as their affordability reduces. Further, the significant “deposit gap” raised by Pawson et al. [12] expands along with house prices, which has resulted in FHBs taking between 2 to 9 months longer to save a deposit [85] (Powell 2021). As such, only 27.2% of prospective FHBs are considering paying a 20% deposit, down from 34.1% in 2020 and 40.7% through 2019 [34]. The growing inequality raised in this study is consistent with previous findings, suggesting that prospective home buyers are taking on increased financial risk for the benefit of existing homeowners looking to capitalise on market conditions.

4.3. First Home Buyers, Government Grants, and the Bank of Mum and Dad

From the Nvivo parent nodes relating to government grants and the Bank of Mum and Dad in Table 6, of the survey respondents, 72% were potentially within the qualification criteria for government assistance of some form, and yet only almost 30% were able to access the support. This highlights the importance of government assistance to FHBs [16]. Further supporting the sentiment, over 70% of responses do not believe the government is adequately supporting FHB, with suggestions that government grants are just inflating property prices, fuelling the issues further [86]. Utilisation of the “Bank of Mum and Dad” continues to play a key role, with 21% of respondents receiving a gift to assist with their deposit, and just under 12% receiving a guarantee. These findings are supported by a recent study of FHB in which over 22% of respondents asked their parents for direct financial assistance, and 12% discussed family guarantees [34]. Similar findings were reported in the UK by Druta and Ronald [87], who found that parents were more willing to offer more significant amounts for entry to the market than for any other purpose. Further, whilst FHB participation numbers have increased overall, the experience continues to be a difficult one. Over 71% of survey respondents noted that their purchase price range had increased through the research period, and over 83% of respondents noted that the process has become harder. As stated in previous studies, this situation remains bleak for FHB, with the potential to own a home continuing to be linked to the financial status of one’s parents [88].

4.4. Additional Themes for First Home Buyers

Developing on top of predetermined deductive codes, additional themes and commonalities were identified as reported in Table 7. Our results that 23 respondents noted the need to relocate for affordability reasons and 18 reduced their expectations for their first property. This is supported by statistics provided by the National Housing Finance and Investment Corporation [74], as they noted that buyers under the New Home Guarantee (NHG) are mostly concentrated in outer Sydney rings or greenfield locations, where significant new homes are being built, some up to 90 kilometres away from their previous residences [74]. This is also consistent with Bangura and Lee [10], as they highlighted that some priced-out residents tend to move to other parts of Greater Sydney with relative affordability such as Western Sydney and cities that are closer to Greater Sydney and commute to work. While COVID-19 has promoted relocating for lifestyle reasons, such as additional space, or work from home flexibility [89], the research focused more on affordability issues faced by FHB. In correlation to FHB statistics on migration for affordability [90], it was commonly noted that FHB expectations of their borrowing ability have been reducing, with most conceding they are unable to purchase their “ideal” property [34]. Research conducted by Genworth [34] found that in the current climate, 77% of FHB believe it is more important to purchase “any kind” of property, not just their “ideal” home. The sentiment is further supported by Powell [85] who found that more FHB will compromise on the type of property and location, likely driven by “fear of missing out” (FOMO). Externalities identified throughout the research relate mainly to FHB disadvantages due to an intensifying property market, overheated by expansionary monetary and fiscal policies. While positive outcomes do exist, such as the momentary increase to first home buyer participation, or slight increase in affordability due to lower interest rates [34], many would-be FHBs are left feeling that they will never bridge the gap to homeownership [91].

5. Conclusions and Implications

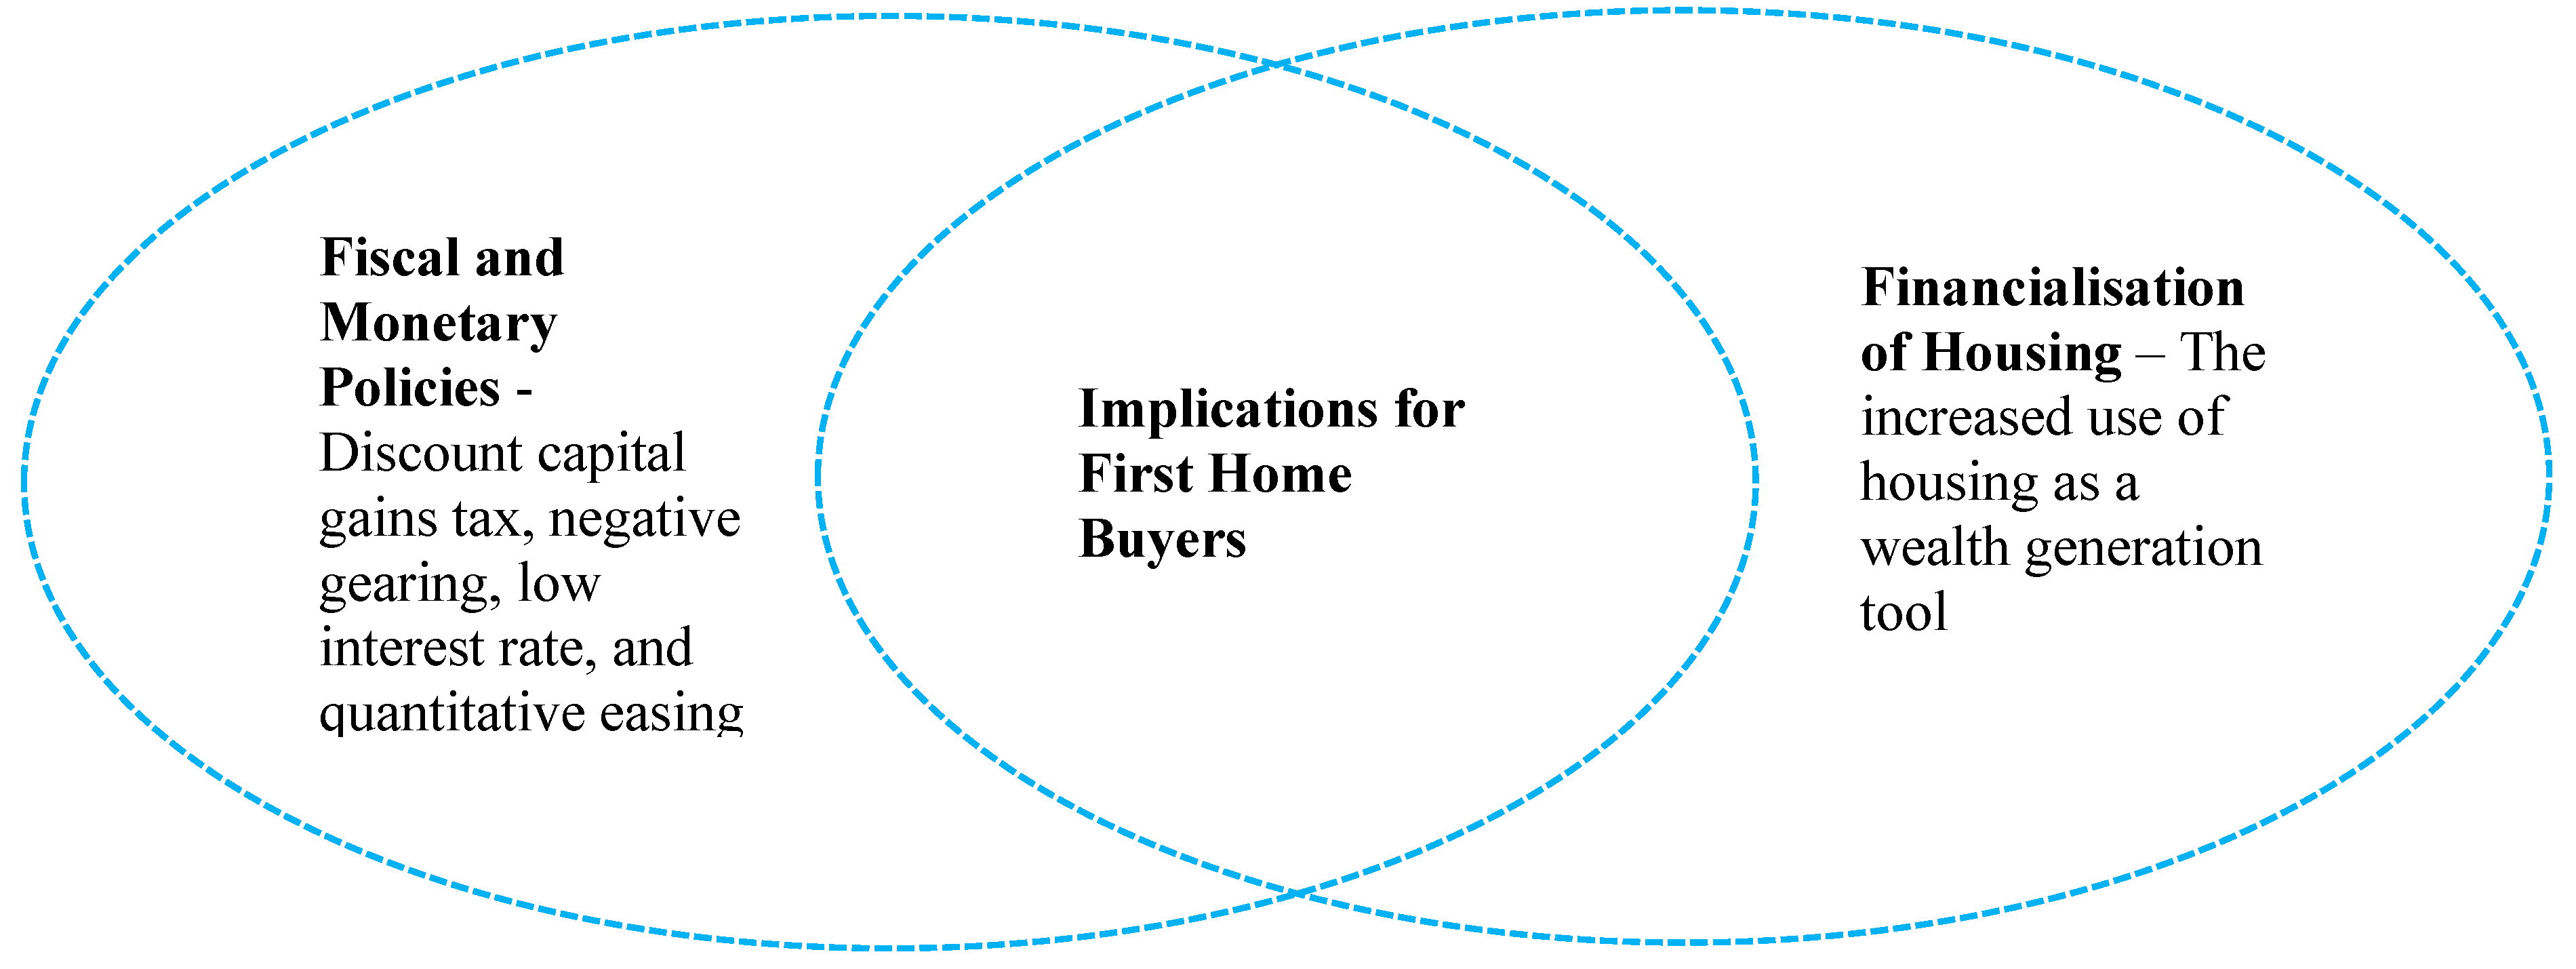
The COVID-19 pandemic led to Australia’s first recession in 30 years, prompting the government to implement significant monetary and fiscal stimulus measures that facilitated a rapid economic recovery. However, these measures had both direct and indirect effects on first home buyers (FHBs) in NSW, raising questions around the link between COVID-19 and economic stimulus packages on FHBs, their effectiveness in promoting entry into the housing market, and their role in supporting FHBs amid competition from investors and cash buyers. To address these questions, a conceptual framework was developed, drawing on the housing financialisation to explore the externalities of COVID-19 economic policy responses. The study utilised a qualitative design with primary data sources to provide a comprehensive understanding of the issue at hand.
Primary data were collected via an anonymous survey of FHB who had been actively looking or had completed a purchase since March 2020. A total of 61 respondents were sourced through a public platform and the mortgage broking industry, which were categorised into various demographics, such as financial capacity, location, level of government assistance, or purchase price. To facilitate the analysis, Nvivo software was used to generate a deductive and inductive coding structure. By examining the gaps highlighted, we make the following contributions to the literature with three important findings.
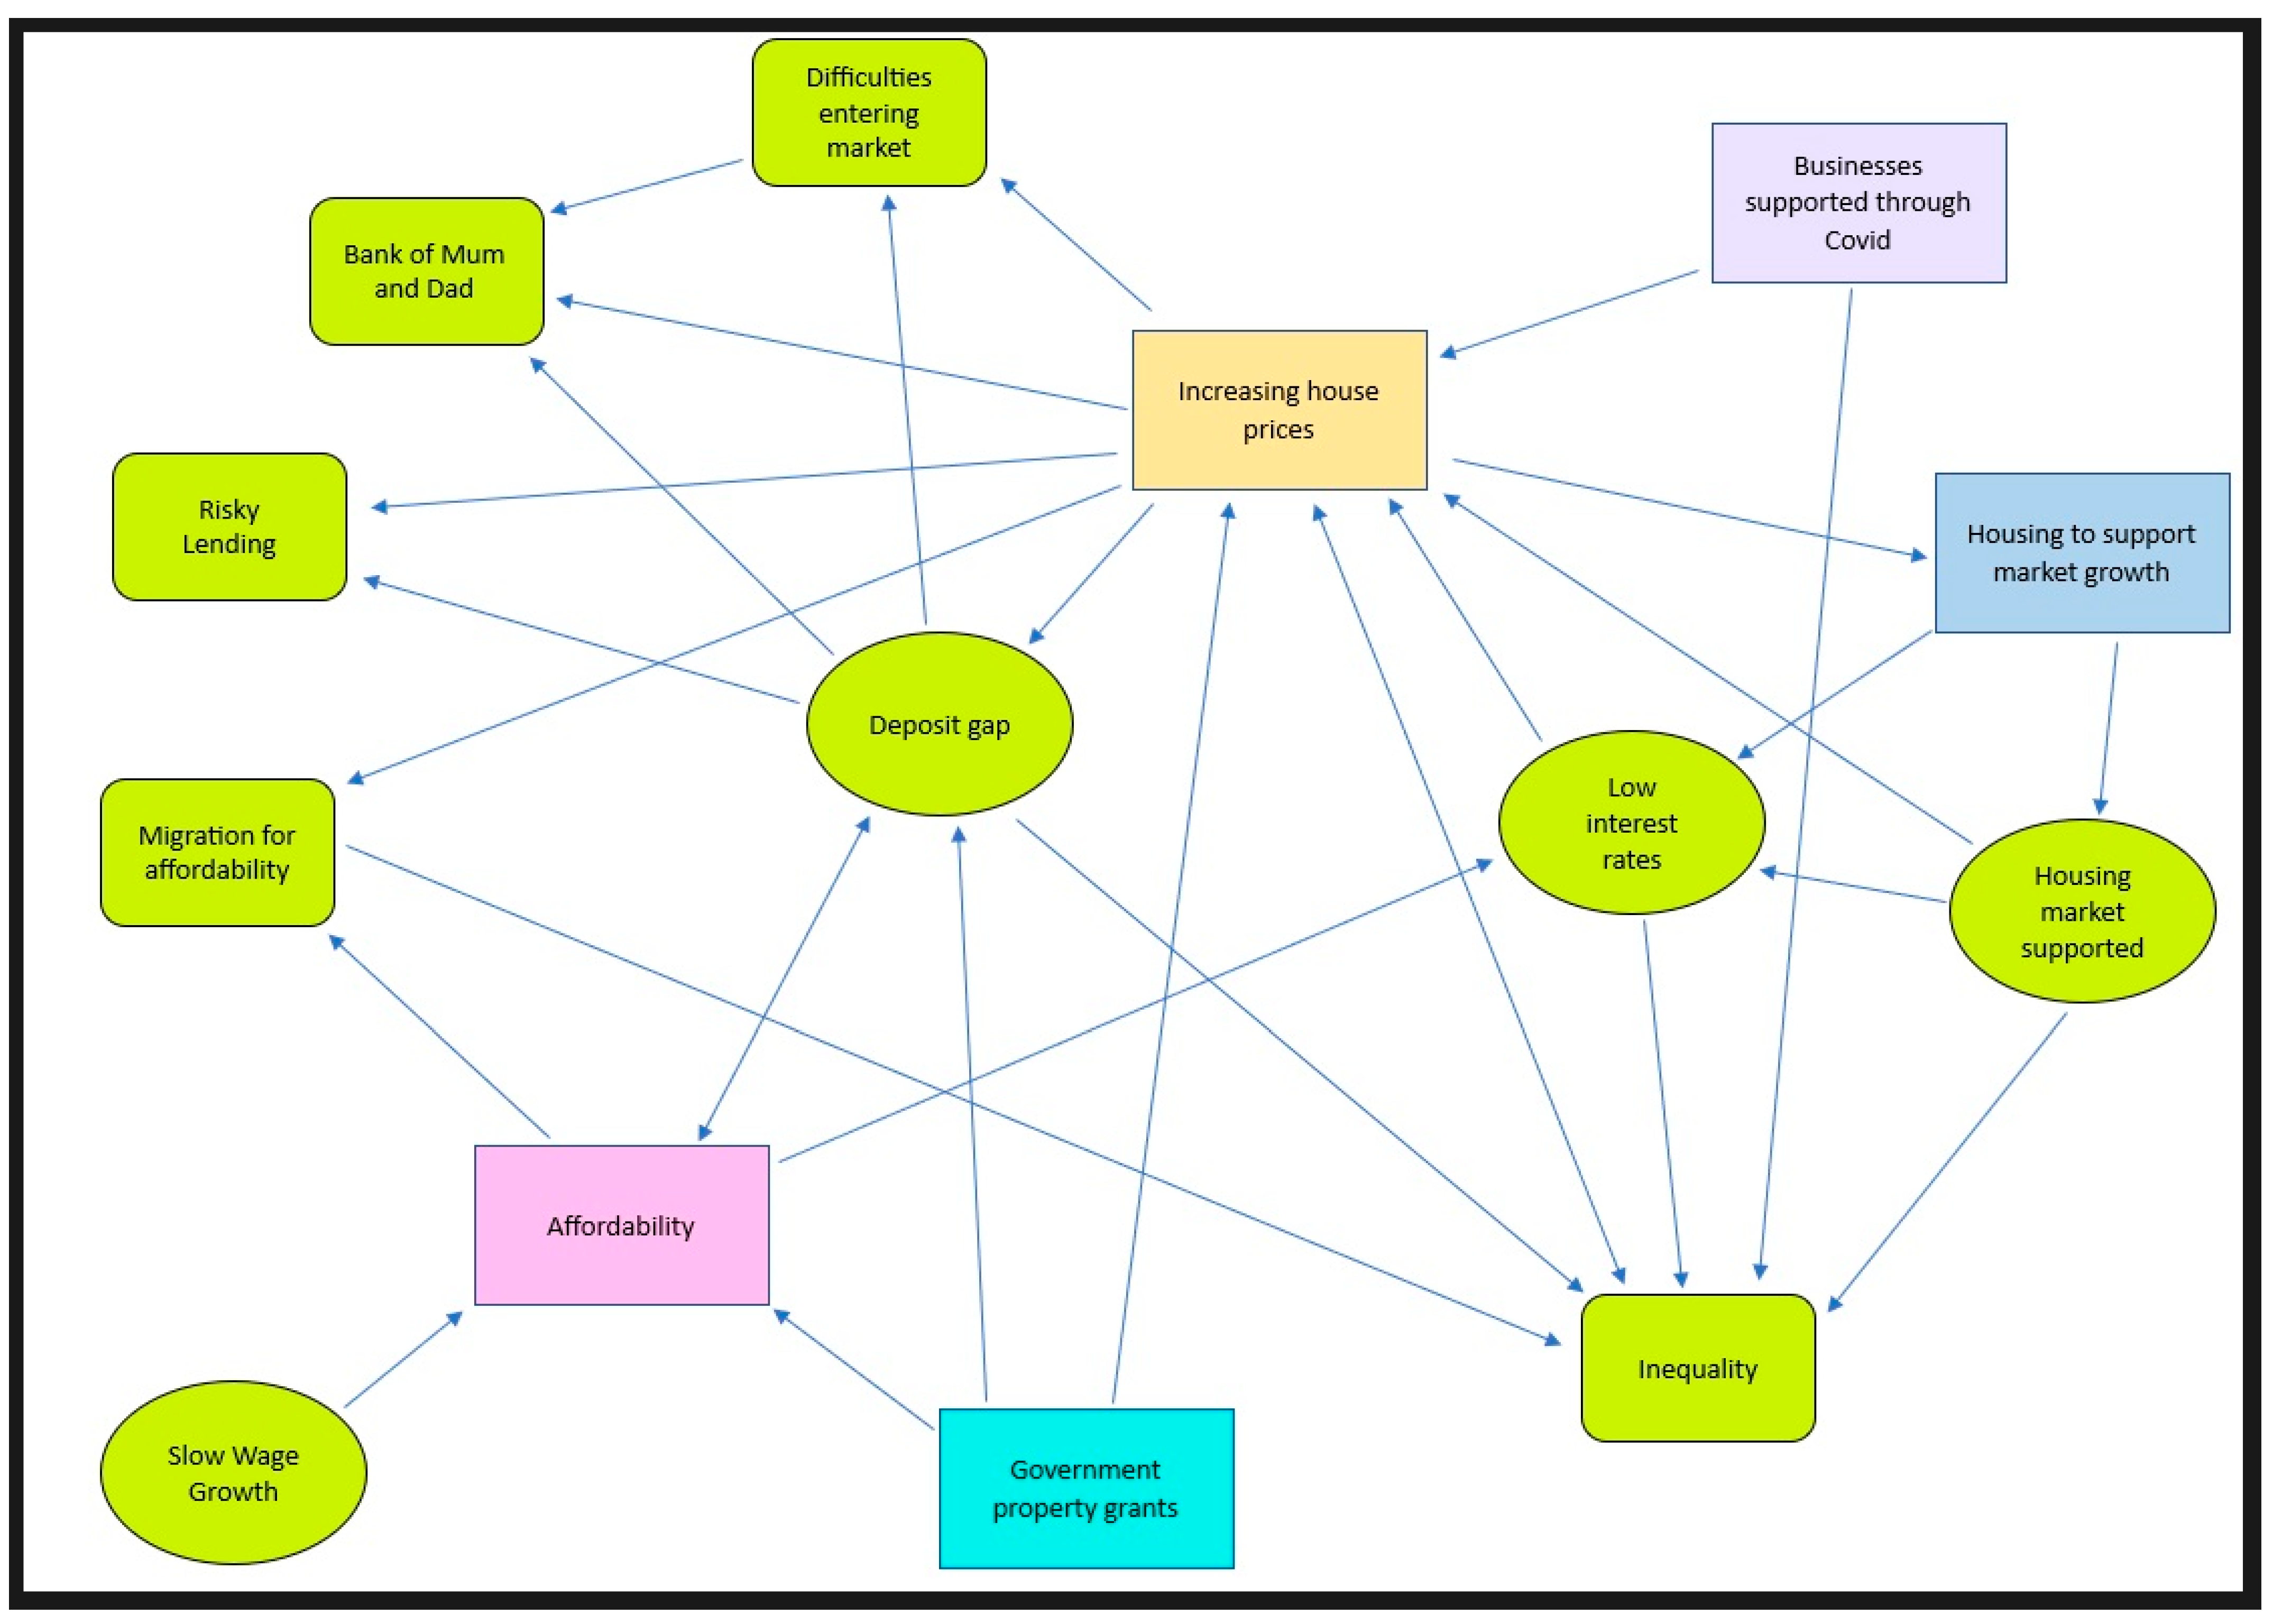
This study provides a novel exploration of the relationship between COVID-19 and economic stimulus packages on first home buyers (FHBs) and reveals that the externalities of these policies are having unexpected consequences. Despite some positive outcomes, such as short-term increases in FHB participation due to lower interest rates, the overheated property market fuelled by expansionary fiscal and monetary policies is disadvantageous for many prospective FHBs, who fear they may never be able to afford homeownership. Consequently, FHBs with FOMO are modifying their expectations and behaviours, such as relocating to more affordable regions or taking on higher levels of debt or risking rushing into a property without completing thorough due diligence, only to find issues with the property once they moved in. This study’s findings have implications for policymakers and macroeconomists, highlighting the need to mitigate the unintended negative consequences of economic stimulus policies on potential FHBs.
Second, this study is likely one of the first to evaluate the effectiveness of economic stimulus packages aimed at facilitating FHBs’ entry into the housing market during the COVID-19 pandemic. More than 71% of the survey participants noted a rise in purchase prices during the study period. Furthermore, 83% of respondents claimed that the process has become more complex, making it more difficult to access homeownership. Although 72% of those surveyed were potentially eligible for government assistance in some way, just 30% were able to obtain support. Over 70% of respondents believed that the government does not provide sufficient assistance to FHBs, suggesting that government grants only inflate property prices, exacerbating the issue. These findings raise questions about the long-term efficacy of such packages in assisting FHBs. These results can be used to develop future economic stimulus packages or other housing policies aimed at facilitating FHBs’ entry into the housing market, particularly during global shocks.
The study’s third finding reveals an imbalanced property acquisition field for FHBs during the COVID-19 pandemic despite several economic stimulus packages aimed at promoting homeownership. The FHBs’ surveys emphasised inequality as the primary challenge faced by FHBs, with 48% of participants attributing the difficulties to investors and existing homeowners’ significant advantages. Policies such as negative gearing and capital gains tax waivers could intensify the issue of market entry. Expansionary monetary policies also contribute to inequality by inflating house prices and driving consumer demand. In turn, excessive property deflation is quickly addressed by governments, as seen at the start of the COVID-19 pandemic. Consequently, FHBs have had to relocate, lower their expectations, take on additional financial risks, or rely on intergenerational support. These unintended consequences could trigger policy reversal to combat the financialisation of the housing market to promote affordable housing and renting for FHBs. These findings can also guide international housing policymakers in supporting FHBs in a market with strong investor presence. While the study focuses on Australia, the results offer valuable insights into delivering effective government stimulus policies, allowing policymakers to allocate resources more judiciously.
Even though we examined the unintended consequences of COVID-19 economic policies on first home buyers, our study has some limitations, which include the sample size, the study period that was only limited to post-March 2020 when significant COVID-19-related economic policies and stimuli began to take effect, and the study being limited to the state of NSW only. Therefore, future research can expand the scope of this research topic by examining various housing markets and targeting diverse demographics.

Author Contributions

Conceptualisation was done by B.S. and M.B.; Data, Methodology and software was done by M.B., B.S. and C.L.L.; Formal Analysis and Investigation was done by M.B. and C.L.L.; Conclusion, Reviewing and Editing is done by M.B., C.L.L. and B.S. All authors have read and agreed to the published version of the manuscript.

Funding

This research received no external funding.

Institutional Review Board Statement

Not applicable.

Informed Consent Statement

Not applicable.

Data Availability Statement

The responses are unavailable due to privacy or ethical restrictions.

Conflicts of Interest

The authors declare no conflict of interest.

Appendix A

Table A1. Economic Policies Implemented due to Covid-19 and their Effects to FHB.
Policy Description Effect
JobKeeperPayments to businesses to support employmentIndirect
JobSeekerPayments to individuals to support incomeIndirect
Small business cashflow boostPayments to businesses to support employmentIndirect
Moratorium on evictionsTenants could not be evictedIndirect
Mortgage repayment pausesMortgage holder could pause repaymentsIndirect
Government business loan guaranteeGovernment guaranteed loans to small businessesIndirect
Early superannuation withdrawalEarly access to superannuation in lump sums of $10,000Direct
Interest rate reductionsReduction of interest rates to historically low levelsDirect
Government bond purchasingReduction in fixed interest mortgage rates to historically low levelsDirect
First home loan deposit schemeGovernment guarantee of first home buyer mortgagesDirect
New home guaranteeGovernment guarantee for new home buying first home buyersDirect
HomeBuilderCash grants to new home builders or significant renovatorsDirect

Appendix B. First Home Buyer Survey

First Home Buyers in New South Wales
Q1 Have you purchased your first home since March 2020?
Yes (1)
No (2)
Display This Question:
If Have you purchased your first home since March 2020? = Yes
Q1a What was your previous postcode?
____________________________________________________________
Display This Question:
If Have you purchased your first home since March 2020? = No
Q1b What is your current postcode?
____________________________________________________________
Display This Question:
If Have you purchased your first home since March 2020? = Yes
Q2a What is your new postcode?
____________________________________________________________
Display This Question:
If Have you purchased your first home since March 2020? = No
Q2b What postcode are you looking to purchase in? If multiple choices, please enter your preferred postcode.
____________________________________________________________
Q3 What type(s) of property did you purchase, or are you looking to purchase?
  • Fully detached house (1)
  • Semi detached house/Townhouse (2)
  • Unit or apartment (3)
  • Land and construction/Home and land package (4)
  • Off the plan (5)
  • Land only (6)
  • Other (7) ___________________________
Q4 What was your final purchase price range, or estimated future purchase price range?
  • Less than $500,000 (1)
  • Between $500,001 and $650,000 (2)
  • Between $650,001 and $800,000 (3)
  • Between $800,001 and $1,000,000 (4)
  • Between $1,000,001 and $1,250,000 (5)
  • Between $1,250,001 and $1,500,000 (6)
  • Between $1,500,001 and $2,000,000 (7)
  • $2,000,000 and above (8)
Q5 Has your price range changed since March 2020?
  • Greatly increased (1)
  • Somewhat increased (2)
  • The same (3)
  • Somewhat decreased (4)
  • Greatly decreased (5)
Q6 Are you a sole purchaser or do you have a partner(s)?
  • Sole purchaser (1)
  • Two purchasers (2)
  • More than two purchasers (3)
Q7 What is your household pre-tax income bracket? (I.e combined income if you have a partner/s)
  • Less than $100,000 (1)
  • Between $100,001 to $150,000 (2)
  • Between $150,001 and $200,000 (3)
  • Between $200,001 and $250,000 (4)
  • Between $250,001 and $300,000 (5)
  • Between $350,001 and $400,000 (6)
  • $400,001 and above. (7)
Q8 What is your employment type?
  • Full-time employee (1)
  • Part-time employee (2)
  • Casual employee (3)
  • PAYG contractor (4)
  • Self-employed (5)
  • Not currently working (6)
  • Other (7) ___________________________
Q9 What was your total deposit, or estimated total deposit if you have not yet purchased?
  • Less than $50,000 (1)
  • Between $50,001 and $75,000 (2)
  • Between $75,001 and $100,000 (3)
  • Between $100,001 and $125,000 (4)
  • Between $125,001 and $150,000 (5)
  • Between $150,001 and $200,000 (6)
  • Between $200,001 and $250,000 (7)
  • Between $250,001 and $300,000 (8)
  • Between $300,001 and $400,000 (9)
  • More than $400,000 (10)
Q10 Did you, or will you, be using a family guarantee?
  • Yes (1)
  • No (2)
  • Unsure (3)
Q11 Did you, or will you, be receiving a gift to assist with your deposit?
  • Yes (1)
  • No (2)
  • Unsure (3)
Q12 Do you have any dependent children?
  • No (1)
  • Yes, 1 (2)
  • Yes, 2 (3)
  • Yes, more than 2 (4)
Q13 Did you qualify for government assistance?
  • First Homer Owners Grant (1)
  • First Home Owners stamp duty concessions (2)
  • First Home Loan Deposit Scheme (3)
  • New Home Guarantee (for new homes only) (5)
  • Home Builders Grant (4)
  • Family Home Guarantee (for single parents) (6)
  • First Home Super Saver Scheme (7)
  • None (9)
  • Other (8) ___________________________
Q14 Did you understand all the government assistance options that were available?
  • Definitely not (1)
  • Not really (2)
  • Unsure (3)
  • Somewhat yes (4)
  • Definitely yes (5)
Q15 If received, was government assistance easy to access?
  • Definitely not (1)
  • Not really (2)
  • Unsure (3)
  • Somewhat (4)
  • Definitely yes (5)
  • Not applicable—Did not receive (6)
Q16 How long were you, or how long have you been, trying to purchase a property?
  • Less than 3 months (1)
  • Between 3 to 6 months (2)
  • Between 6 to 12 months (3)
  • Between 12 to 18 months (4)
  • Between 18 to 24 months (5)
  • Over 24 months (6)
Q17 Do you feel it has become easier or more difficult to purchase a property since March 2020?
  • Much more difficult (1)
  • More difficult (2)
  • About the same (3)
  • Easier (4)
  • Much easier (5)
Q18 Were you able to, or have you been able to, save more of a deposit in the last 18 months?
  • Definitely not (1)
  • Not really (2)
  • About the same (3)
  • Somewhat yes (4)
  • Definitely yes (5)
  • Not applicable to me (6)
Q19 Did you access any government Covid-19 support policies?
  • JobKeeper (1)
  • JobSeeker (2)
  • Early superannuation withdrawal (3)
  • Moratorium on evictions (4)
  • NSW disaster payment (5)
  • ATO cashflow or small business boost (6)
  • Debt repayment pause (7)
  • Instant asset write-off (9)
  • None (10)
  • Other (8) ___________________________
Q20 Do you feel the government provides adequate assistance to first home buyers?
  • Definitely not (1)
  • Not really (2)
  • Unsure (3)
  • Somewhat yes (4)
  • Definitely yes (5)
Q21 In your opinion, what else do you think the government could do to assist first home buyers?
  • ______________________________________________________________________________

References

  1. Kishor, N.K.; Marfatia, H.A. The dynamic relationship between housing prices and the macroeconomy: Evidence from OECD Countries. J. Real Estate Financ. Econ. 2016, 54, 237–268. [Google Scholar] [CrossRef]
  2. OECD. Analytical House Prices Indicators. 2022. Available online: https://stats.oecd.org/Index.aspx?DataSetCode=HOUSE_PRICES (accessed on 20 January 2023).
  3. Goodman, L.S.; Mayer, C. Homeownership and the American Dream. J. Econ. Perspect. 2018, 32, 31–58. [Google Scholar] [CrossRef]
  4. Lin, Z.; Liu, Y.; Xie, J. Banking deregulation and homeownership. J. Hous. Econ. 2021, 52, 101749. [Google Scholar] [CrossRef]
  5. Local Government Association, Young People Today Half as likely to get on Nation’s ‘Broken’ Housing Ladder. 2019. Available online: https://www.local.gov.uk/about/news/young-people-today-half-likely-get-nations-broken-housing-ladder (accessed on 20 January 2023).
  6. Hall, A.; Thomas, D. Declining Home Ownership Rates in Australia, Parliament of Australia 2019. Available online: https://www.aph.gov.au/About_Parliament/Parliamentary_Departments/Parliamentary_Library/pubs/BriefingBook46p/HomeOwnership (accessed on 20 December 2022).
  7. Acolin, A.; Bricker, J.; Calem, P.; Wachter, S. Borrowing Constraints and Homeownership. Am. Econ. Rev. 2016, 106, 625–629. [Google Scholar] [CrossRef]
  8. Bourassa, S.C.; Shi, S. Understanding New Zealand’s decline in homeownership. Hous. Stud. 2017, 32, 693–710. [Google Scholar] [CrossRef]
  9. Blundell, R.; Costa Dias, M.; Joyce, R.; Xu, X. COVID-19 and Inequalities. Fisc. Stud. 2020, 41, 291–319. [Google Scholar] [CrossRef]
  10. Bangura, M.; Lee, C. The differential geography of housing affordability in Sydney: A disaggregated approach. Aust. Geogr. 2019, 50, 295–313. [Google Scholar] [CrossRef]
  11. Bangura, M.; Lee, C. The determinants of homeownership affordability in Greater Sydney: Evidence from a submarket analysis. Hous. Stud. 2023, 38, 206–232. [Google Scholar] [CrossRef]
  12. Pawson, H.; Milligan, V.; Yates, J. Housing Policy in Australia: A Case for System Reform; Springer Nature: Berlin/Heidelberg, Germany, 2020. [Google Scholar]
  13. Khadem, N. It’s the Public’s Money’: Outrage Grows as $6.2b JobKeeper ‘Sugar Hit’ for Bigger Businesses Revealed. 2021. Available online: https://www.abc.net.au/news/2021-09-21/jobkeeper-subsidy-turnover-small-business-COVID-pandemic-pbo/100477492 (accessed on 15 December 2022).
  14. International Monetary Fund [IMF]. Policy responses to COVID-19. 2022. Available online: https://www.imf.org/en/Topics/imf-and-covid19/Policy-Responses-to-COVID-19#U (accessed on 10 February 2023).
  15. Government of United Kingdom. Guidance for Landlords and Tenants. 2022. Available online: https://www.gov.uk/government/publications/COVID-19-and-renting-guidance-for-landlords-tenants-and-local-authorities/coronavirus-COVID-19-guidance-for-landlords-and-tenants (accessed on 10 February 2023).
  16. Lee, C.L.; Reed, R.G. The relationship between housing market intervention for first-time buyers and house price volatility. Hous. Stud. 2014, 29, 1073–1095. [Google Scholar] [CrossRef]
  17. Australian Department of the Treasury. Homebuilder National Partnership Agreement Review. 2022. Available online: https://federalfinancialrelations.gov.au/sites/federalfinancialrelations.gov.au/files/2022-11/HomeBuilder-npa-review-report.pdf (accessed on 10 February 2023).
  18. Sharif, R.A.; Pokharel, S. Smart City Dimensions and Associated Risks: Review of literature. Sustain. Cities Soc. 2022, 77, 103542. [Google Scholar] [CrossRef]
  19. Morris, A. An impossible task? Neoliberalism, the financialisation of housing and the City of Sydney’s endeavours to address its housing affordability crisis. Int. J. Hous. Policy 2019, 21, 23–47. [Google Scholar] [CrossRef]
  20. Demographia. International Housing Affordability. 2022. Available online: http://www.demographia.com/dhi.pdf (accessed on 15 December 2022).
  21. Ribeiro, P.J.G.; Pena Jardim Gonçalves, L.A. Urban resilience: A conceptual framework. Sustain. Cities Soc. 2019, 50, 101625. [Google Scholar] [CrossRef]
  22. Andrew, J.; Baker, M.; Guthrie, J.; Martin-Sardesai, A. Australia’s COVID-19 public budgeting response: The straitjacket of neoliberalism. J. Public Budg. Account. Financ. Manag. 2020, 32, 759–770. [Google Scholar] [CrossRef]
  23. Churchill, B. COVID-19 and the immediate impact on young people and employment in Australia: A gendered analysis. Gend. Work. Organ. 2020, 28, 783–794. [Google Scholar] [CrossRef] [PubMed]
  24. Creswell, J.; Clark, V. Designing and Conducting Mixed Methods Research; Sage: Los Angeles, CA, USA, 2018. [Google Scholar]
  25. Australian Bureau of Statistics [ABS]. Lending Indicators. 2021. Available online: https://www.abs.gov.au/statistics/economy/finance/lending-indicators/latest-release#first-home-buyers (accessed on 10 December 2022).
  26. Australian Bureau of Statistics [ABS]. Wage Price Index, Australia. 2021. Available online: https://www.abs.gov.au/statistics/economy/price-indexes-and-inflation/wage-price-index-australia/latest-release (accessed on 10 December 2022).
  27. Kohler, M.; van der Merwe, M. Long-run Trends in Housing Price Growth|Bulletin—September Quarter 2015. Available online: https://www.rba.gov.au/publications/bulletin/2015/sep/3.html (accessed on 29 June 2021).
  28. Bunny, M. Inside ‘Generation Rent’s’ Property Grind. 2021. Available online: https://www.westpac.com.au/news/in-depth/2021/06/inside-generation-rents-property-grind/ (accessed on 8 January 2023).
  29. Kohl, S. More mortgages, more homes? The effect of housing financialization on homeownership in historical perspective. Politics Soc. 2018, 46, 177–203. [Google Scholar] [CrossRef]
  30. Real Estate Institute of New South Wales. REIA’s Real Estate Market Facts show Housing Prices Blew out by almost 20%. 2021. Available online: https://www.reinsw.com.au/Web/News/Media_Releases/2021/09_September/REIA%E2%80%99s_Real_Estate_Market_Facts_show_housing_prices.aspx (accessed on 10 February 2023).
  31. Kupke, V.; Rossini, P. Housing affordability in Australia for first home buyers on moderate incomes. Prop. Manag. 2011, 29, 357–370. [Google Scholar] [CrossRef]
  32. O’Keeffe, P.; Johnson, B.; Daley, K. Continuing the precedent: Financially disadvantaging young people in “unprecedented” COVID-19 times. Aust. J. Soc. Issues 2021, 57, 70–87. [Google Scholar] [CrossRef]
  33. O’Keeffe, P.; Papadopoulos, A. The Australian government’s business-friendly employment response to COVID-19: A critical discourse analysis. Econ. Labour Relat. Rev. 2021, 32, 453–471. [Google Scholar] [CrossRef]
  34. Genworth. Genworth First Home Buyer Report 2021. Available online: https://helia.com.au/media/lc5kl12m/genworth_fhb2021_whitepaper_210820-web.pdf (accessed on 20 January 2023).
  35. Adkins, L.; Cooper, M.; Konings, M. Class in the 21st century: Asset inflation and the new logic of inequality. Environ. Plan. A Econ. Space 2019, 53, 548–572. [Google Scholar] [CrossRef]
  36. Morris, A.; Beer, A.; Martin, J.; Horne, S.; Davis, C.; Budge, T.; Paris, C. Australian local governments and affordable housing: Challenges and possibilities. Econ. Labour Relat. Rev. 2019, 31, 14–33. [Google Scholar] [CrossRef]
  37. Australian Bureau of Statistics [ABS]. Lending Indicator. 2022. Available online: https://www.abs.gov.au/statistics/economy/finance/lending-indicators/jan-2022 (accessed on 20 January 2023).
  38. Australian Prudential Regulation Authority [APRA]. Residential Mortgage Lending: Interest-Only Benchmark. 2018. Available online: https://www.apra.gov.au/sites/default/files/letter_residential_mortgage_lending_interest-only_benchmarks.pdf (accessed on 10 November 2022).
  39. Le May, R. Worrying Trend’ Emerges on House Prices. 2021. Available online: https://www.theaustralian.com.au/news/latest-news/fears-first-home-buyers-will-be-priced-out-of-the-market-as-investors-return-in-droves/news-story/b29870a6a9626ba31e90fd79b70f9670 (accessed on 10 November 2022).
  40. Yanotti, M.; Wright, D. Residential property in Australia: Mismatched investment and rental demand. Hous. Stud. 2021; 1–22, ahead-of-print. [Google Scholar]
  41. Lee, C.L. Housing in Australia as a portfolio investment. Int. J. Hous. Mark. Anal. 2008, 1, 352–361. [Google Scholar]
  42. Lee, C.L.; Lee, M.L. Do European real estate stocks hedge inflation? Evidence from developed and emerging markets. Int. J. Strateg. Prop. Manag. 2014, 18, 178–197. [Google Scholar] [CrossRef]
  43. Tang, J.; Ye, K.; Qian, Y. Rethinking the relationship between housing prices and inflation: New evidence from 29 large cities in China. Int. J. Strateg. Prop. Manag. 2019, 23, 142–155. [Google Scholar] [CrossRef]
  44. Waldron, R. Capitalizing on the State: The Political Economy of Real Estate Investment Trusts and the ‘Resolution’ of the Crisis. Geoforum 2018, 90, 206–218. [Google Scholar] [CrossRef]
  45. Bangura, M.; Lee, C.L. Housing price bubbles in Greater Sydney: Evidence from a submarket analysis. Hous. Stud. 2022, 37, 143–178. [Google Scholar] [CrossRef]
  46. Wyatt, K.; McDonald, J.; Nandha, M. Negative gearing and housing affordability for first home buyers. J. Aust. Tax. 2005, 8, 150–180. [Google Scholar]
  47. Cook, N.; Ruming, K. The financialisation of housing and the rise of the investor-activist. Urban Stud. 2021, 58, 2023–2039. [Google Scholar] [CrossRef]
  48. Kalman-Lamb, G. The financialization of housing in Canada: Intensifying contradictions of neoliberal accumulation. Stud. Political Econ. 2017, 98, 298–323. [Google Scholar] [CrossRef]
  49. Ling, D.C.; Wang, C.; Zhou, T. A first look at the impact of COVID-19 on commercial real estate prices: Asset-level evidence. Rev. Asset Pricing Study 2020, 10, 669–704. [Google Scholar] [CrossRef]
  50. Wang, S.; Lee, C.L.; Song, Y. The COVID-19 Sentiment and Office Markets: Evidence from China. Buildings 2022, 12, 2100. [Google Scholar] [CrossRef]
  51. Morrison, S. $130 Billion Jobkeeper Payment to Keep Australians in a Job. 2020. Available online: https://www.pm.gov.au/media/130-billion-jobkeeper-payment-keep-australians-job (accessed on 18 November 2022).
  52. Debelle, G. Monetary Policy During COVID|Speeches, Reserve Bank of Australia. 2021. Available online: https://www.rba.gov.au/speeches/2021/sp-dg-2021-05-06.html (accessed on 18 November 2022).
  53. Edmond, C.; Holden, R.; Preston, B. Should we worry about government debt? Thoughts on Australia’s COVID-19 Response. Aust. Econ. Rev. 2020, 53, 557–565. [Google Scholar] [CrossRef]
  54. Rumbens, D.; Mullins, W. Australia’s V-Shaped Recovery. 2021. Available online: https://www2.deloitte.com/au/en/blog/economics-blog/2021/australia-v-shaped-recovery.html (accessed on 18 November 2022).
  55. Karp, P. Highly Disproportionate’: Australia’s Casual Workers Bear Brunt of Job Losses Amid Lockdowns. 2021. Available online: https://www.theguardian.com/australia-news/2021/oct/04/highly-disproportionate-australias-casual-workers-bear-brunt-of-job-losses-amid-lockdowns (accessed on 18 November 2022).
  56. Inchauspe, J. Fiscal policy dynamics under a consolidation constraint: Evidence from a sign-restricted SVAR with orthogonalized business cycle and monetary policy for Australia. Appl. Econ. 2021, 53, 3992–4016. [Google Scholar] [CrossRef]
  57. Owen, E. Housing Finance Data Highlights a Continued Shift in the Buyer Profile, Formal Changes to Mortgage Lending Policy Unlikely over the near Term. 2021. Available online: https://www.corelogic.com.au/news/housing-finance-data-highlights-continued-shift-buyer-profile-formal-changes-mortgage-lending (accessed on 18 November 2022).
  58. O’Callaghan, C.; McGuirk, P. Situating financialisation in the geographies of neoliberal housing restructuring: Reflections from Ireland and Australia. Environ. Plan. A Econ. Space 2020, 53, 809–827. [Google Scholar] [CrossRef]
  59. Hall, D. Primitive accumulation, accumulation by dispossession and the global land grab. Third World Q. 2013, 34, 582–1604. [Google Scholar] [CrossRef]
  60. Harvey, D. The right to the city: From capital surplus to accumulation by dispossession. In Accumulation by Dispossession; SAGE: Los Angeles, CA, USA, 2010; pp. 17–32. [Google Scholar]
  61. Sassen, S. A Savage Sorting of Winners and Losers: Contemporary Versions of Primitive Accumulation. Globalizations 2010, 7, 23–50. [Google Scholar] [CrossRef]
  62. Reserve Bank of Australia [RBA]. Cash Rate Target. 2021. Available online: https://www.rba.gov.au/statistics/cash-rate/ (accessed on 10 December 2022).
  63. Cranston, M. RBA Cuts Rates, starts $100b-plus QE, Australia Financial Review. 2020. Available online: https://www.afr.com/policy/economy/rba-cuts-interest-rates-to-0-10-starts-100b-qe-20201103-p56b11 (accessed on 10 December 2022).
  64. Ward, C.C.; Swyngedouw, E. Neoliberalisation from the ground up: Insurgent capital, regional struggle, and the assetisation of land. Antipode 2018, 50, 1077–1097. [Google Scholar] [CrossRef]
  65. Li, S.; Spencer, A. Effectiveness of the Australian fiscal stimulus package: A DSGE analysis. Econ. Rec. 2015, 92, 94–120. [Google Scholar] [CrossRef]
  66. Irandoust, M. The effectiveness of monetary policy and output fluctuations: An asymmetric analysis. Aust. Econ. Pap. 2020, 59, 161–181. [Google Scholar] [CrossRef]
  67. Hodkinson, S.; Watt, P.; Mooney, G. Introduction: Neoliberal housing policy—Time for a critical re-appraisal. Crit. Soc. Policy 2013, 33, 3–16. [Google Scholar] [CrossRef]
  68. Harvey, D. From Managerialism to Entrepreneurialism: The Transformation in Urban Governance in Late Capitalism. Geogr. Annaler. Ser. B Hum. Geogr. 1989, 71, 3–17. [Google Scholar] [CrossRef]
  69. Aalbers, M.B. The Financialization of Housing: A Political Economy Approach, 1st ed.; Routledge: London, UK, 2016. [Google Scholar] [CrossRef]
  70. Murry, C.; Collins, J. We Lost Control of Australian House Prices. Now is the Time to get Them Back. 2020. Available online: https://www.abc.net.au/news/2020-08-18/house-prices-how-we-lost-control-of-the-market/12566552 (accessed on 10 December 2022).
  71. Ng MK, M.; Roper, J.; Lee, C.L.; Pettit, C. The Reflection of Income Segregation and Accessibility Cleavages in Sydney’s House Prices. ISPRS Int. J. Geo-Inf. 2022, 11, 413. [Google Scholar]
  72. Flick, U. The SAGE Handbook of Qualitative Data Analysis; SAGE Publications, Limited: London, UK, 2013. [Google Scholar]
  73. Australian Bureau of Statistics [ABS]. Household and Family Projections, Australia, 2016–2041. 2021. Available online: https://www.abs.gov.au/statistics/people/population/household-and-family-projections-australia/latest-release#states-and-territories (accessed on 10 December 2022).
  74. National Housing Finance and Investment Corporation [NHFIC]. First Home Loan Deposit Scheme and New Home Guarantee. Trends and Insights 2020-21; Australian Government. 2021. Available online: https://www.nhfic.gov.au/research/fhlds-trends-and-insights-report-2021-22 (accessed on 10 February 2023).
  75. Babbie, E. The Practice of Social Research, 14th ed.; Cengage Learning: Boston, MA, USA, 2015. [Google Scholar]
  76. Creswell, J.W.; Poth, C.N. Qualitative Inquiry & Research Design: Choosing Among Five Approaches, 4th ed.; SAGE: Los Angeles, CA, USA, 2018. [Google Scholar]
  77. Nowell, L.; Norris, J.; White, D.; Moules, N. Thematic analysis. Int. J. Qual. Methods 2017, 16, 60940691773384. [Google Scholar] [CrossRef]
  78. Reserve Bank of Australia [RBA]. Supporting the Economy and Financial System in Response to COVID-19. 2021. Available online: https://www.rba.gov.au/COVID-19/ (accessed on 15 December 2022).
  79. Nguyen, V.H.; Robinson, T.; Tsiaplias, S. The Australian Economy in 2021–2022: The Virus Strikes Back. Aust. Econ. Rev. 2022, 55, 5–24. [Google Scholar] [CrossRef]
  80. Heagney, M. House Prices are Rising Higher than Weekly Wages Keeping Buyers out of the Market. 2021. Available online: https://www.domain.com.au/news/house-prices-set-to-rise-faster-than-wages-next-year-even-as-property-market-slows-and-incomes-pick-up-1105819/ (accessed on 15 December 2022).
  81. Government of Australia Improving Opportunities for Home Ownership. 2021. Available online: https://formerministers.dss.gov.au/19396/improving-opportunities-for-home-ownership/ (accessed on 15 December 2022).
  82. Gallent, N.; Madeddu, M. COVID-19 and London’s Decentralising Housing Market—What are the Planning Implications? Plan. Pract. Res. 2021, 36, 567–577. [Google Scholar] [CrossRef]
  83. Tajaddini, R.; Gholipour, H.F.; Arjomandi, A. Working from home and long-term housing wealth inequality in large cities of advanced economies. Int. J. Hous. Mark. Anal. 2023, 16, 100–115. [Google Scholar] [CrossRef]
  84. Hughes, D. Buyers ‘Flipping’ Properties for Quick Profits as Markets Soar. 2021. Available online: https://www.afr.com/wealth/personal-finance/buyers-flipping-properties-for-quick-profits-as-markets-soar-20211020-p591lg (accessed on 15 December 2022).
  85. Powell, N. 2021 Domain First Home-Buyer Report. 2021. Available online: https://www.domain.com.au/research/2021-domain-first-home-buyer-report-1065359/ (accessed on 23 November 2021).
  86. Mizen, R. Low Interest Rates Fuel Intergenerational Inequality: RBA. 2021. Available online: https://www.afr.com/policy/economy/low-interest-rates-fuelling-intergenerational-inequality-rba-20211115-p598zv (accessed on 15 December 2022).
  87. Druta, O.; Ronald, R. Young adults’ pathways into homeownership and the negotiation of intrafamily support: A home, the ideal gift. Sociology 2017, 51, 783–799. [Google Scholar] [CrossRef]
  88. Cook, J. Keeping it in the family: Understanding the negotiation of intergenerational transfers for entry into homeownership. Hous. Stud. 2021, 36, 1193–1211. [Google Scholar] [CrossRef]
  89. Nygaard, C.; Parkinson, S. Analysing the impact of COVID-19 on urban transitions and urban-regional dynamics in Australia. Aust. J. Agric. Resour. Econ. 2021, 65, 878–899. [Google Scholar] [CrossRef]
  90. Bangura, M.; Lee, C.L. Spatial connectivity and house price diffusion: The case of Greater Sydney and the regional cities and centres of New South Wales (NSW) in Australia. Habitat Int. 2023, 132, 102740. [Google Scholar] [CrossRef]
  91. Rogers, D.; Power, E. The global pandemic is accelerating housing crises. Int. J. Hous. Policy 2021, 21, 315–320. [Google Scholar] [CrossRef]
Figure 1. Conceptual framework.
Buildings 13 01203 g001
Figure 2. Thematic analysis structure diagram.
Buildings 13 01203 g002
Table 1. Primary data population calculations.
DescriptionCalculationData Source
APopulation of NSW between 25 and 55 years old3,867,147(ABS 2021c)
BReduction to account for 25% being couples966,787(ABS 2021d)
CPossible FHB adjusted for couples (A–B) 2,900,360n/a
DFHB make up 31.4% of new lending commitments (C × 31.4%)910,713(ABS 2021a)
Table 2. Summary statistics of respondents.
Panel A: Dwelling TypesPercentage
Units56%
Houses44%
Panel B: Price RangePercentage
Between AUD 500,001 and AUD 800,00035%
Between AUD 800,001 and AUD 1,000,00033%
Between AUD 1,000,001 and AUD 1,250,00010%
Between AUD 1,250,001 and AUD 1,500,00020%
Above AUD 1,500,0012%
Panel C: Employment StatusPercentage
Full-time employee73%
Self employed17%
Part-time employee5%
Unemployed5%
Panel D: Household Pre-tax IncomePercentage
Less than AUD 100,00014%
Between AUD 100,001 to AUD 150,00030%
Between AUD 150,001 and AUD 200,00029%
Between AUD 200,001 and AUD 250,00010%
Between AUD 250,001 and AUD 300,00010%
More than AUD 300,00017%
Panel E: Total DepositPercentage
Less than AUD 100,00018%
Between AUD 100,001 and AUD 150,00032%
Between AUD 150,001 and AUD 200,00016%
Between AUD 200,001 and AUD 250,00014%
More than AUD 250,00120%
Table 3. Significant code connections.
Parent Codes Significant Child Codes Significant Second Child Codes
1—Which Economic policies are of significance to FHB?Business supported through COVID-19JobKeeper payments
Neoliberal economics
Record low interest rates
2—Are first home buyer policies relevant to the target demographic?FHOG statisticsFalling FHBs number
NHG statistics
FHLDS statistics
3—What are the externalities of COVID-19 economic responses for FHB?Property as a wealth generatorReal estate as a driver of the economy
Decreasing affordabilityDeposit gap
Slow or no wage growth
FHB sentimentReduced expectations for first property
Negative attitude towards market sentiment
Bank of Mum and Dad
Inequality
Increasing property prices
Migration for affordability
Table 4. NVivo parent nodes relating to house price increases.
Parent Node Node Description References
Decrease in affordabilityOverall references to decreasing affordability across multiple child nodes, such as a deposit gap, slow wage growth and APRA servicing rate changes.[46]
Record low interest ratesLinks between record low interest rates, affordability, and increasing house prices. [28]
Property as a wealth generatorReferences to the use of housing to generate wealth. Child nodes include reference to flipping, renovating for profit, and financial speculation. [22]
Migration to assist purchaseReferences to moving out of an existing location to assist with purchasing (cheaper locations). [23]
Increasing property pricesDirect discussion on increasing property prices.[21]
Reduced expectations of FHBsReferences to FHBs having to reduce their expectations of the type of property they can afford.[18]
[Survey] Government grant asset/income caps not appropriateSurvey responses on the appropriate asset caps considering Sydney house price levels.[14]
Table 5. Nvivo parent nodes relating to inequality.
Parent Node Node Description References
InequalityReferences to inequality relating to FHBs.[9]
Taking extra financial risksFHBs taking additional risks to expedite their purchases, due to affordability and the fear of mission out (FOMO). [14]
Increasing delays to purchaseIncreasing time required to save a deposit.[10]
Bank of Mum and DadDiscussions relating to BMD, and their increasing involvement in the home buying process. [18]
[Survey] Not a level playing fieldReferences to the uneven market conditions faced by FHBs compared to existing homeowners, specifically wealthy investors. [18]
Neoliberal economicsReferences to neoliberal economic policies.[16]
Table 6. Nvivo parent nodes relating to government grants and BMD.
Parent Node Node Description References
First home buyer statisticsStatistical references to changes in FHB market composition.[14]
Bank of Mum and DadReferences to the use of the “Bank of Mum and Dad”, including attitudes towards asking for financial assistance.[18]
Accessibility to FHB governmentReferences to both positive and negative FHB outcomes in relation to accessing government support.[22]
[Survey] Attitudes towards government support Cumulative FHB attitudes towards government support adequacy and accessibility.[23]
Table 7. Nvivo parent nodes relating to FHB externalities.
Parent Node Node Description References
Migration for affordability or lifestyleReferences to FHBs needing to move out of their desired areas to afford to purchase the property they want or need.[23]
Reduced expectations for first propertyFHB attitudes towards purchasing a home have been realigned to fit affordability measures.[18]
FHB sentimentReferences to varying FHB sentiment towards current market conditions.[21]
Disclaimer/Publisher’s Note: The statements, opinions and data contained in all publications are solely those of the individual author(s) and contributor(s) and not of MDPI and/or the editor(s). MDPI and/or the editor(s) disclaim responsibility for any injury to people or property resulting from any ideas, methods, instructions or products referred to in the content.

