Article

Thermal Diagnosis of Ventilation and Cooling Systems in a Sports Hall—A Case Study

Faculty of Energy and Environmental Engineering, Silesian University of Technology, Konarskiego 20, 44-100 Gliwice, Poland
*
Author to whom correspondence should be addressed.
Buildings 2023, 13(5), 1185; https://doi.org/10.3390/buildings13051185
Submission received: 31 March 2023 / Revised: 21 April 2023 / Accepted: 25 April 2023 / Published: 29 April 2023
(This article belongs to the Special Issue Healthy, Digital and Sustainable Buildings and Cities)

Abstract

:
Air conditioning systems in buildings consume a significant part of the world’s energy, and yet there are cases wherein users are not satisfied with the quality of the thermal environment. Examples of such special cases are sports halls, which require different thermal conditions within a single zone. Thermal diagnostics for buildings can be used to diagnose problems. The aim of the paper was to analyse the effectiveness of the ventilation and cooling systems of a sports hall with a cubature of 16,300 m3 and to check the possibility of managing the hall’s cooling demands via the existing air conditioning system. Diagnostic measurements were performed, including in situ measurements of ventilation air flows from the diffusers and their temperatures, visualization of the supply air flows, and monthly registration of the indoor temperature in the hall at different set temperatures of the supply and exhaust air. Additionally, a numerical analysis, using EnergyPlus simulations, of cooling demand was performed with regard to the varying uses of the hall. The analysis based on measurement and simulation showed that it is not possible to remove heat gains from the hall with the current available ventilation air flow.

1. Introduction

Maintaining appropriate thermal conditions and satisfactory air quality in buildings requires a significant amount of energy, with the literature stating that it accounts for about 40% of the total energy produced [1,2]. Despite high energy expenditure, it is not always possible in some existing buildings to obtain the required conditions of the internal environment. The reasons for such a situation may lie with the building itself, the way it is used, but also in the incorrect adoption of HVAC solutions at the design stage and/or their improper operation and regulation. Without identifying these causes, it is difficult to find a solution to the problem. Thermal diagnostic methods are a useful tool that allow for the systematic analysis and identification of observed problems.
Thermal diagnostics of a building includes the identification and assessment of all factors affecting its heat consumption in the building. These include heating, ventilation, air conditioning (HVAC) and hot water systems; building envelope; indoor environment; and building operation. Appropriately integrated partial diagnoses lead to the determination of the heat consumption of the entire building and provide data for the determination of improved solutions. When assessing energy consumption, attention should be paid to the quality of the indoor environment, as energy savings must not cause its deterioration. Two phases can be distinguished in the diagnostic procedure: inspections and diagnostic measurements. The main purpose of the inspection is to assess the technical condition of the systems and to compare the compliance of those systems with the designer’s documentation. Diagnostic measurements are performed to evaluate the operation of the installations in situ under real conditions. Popiolek et al. [3] have proposed a comprehensive method of evaluating the physical envelope, HVAC systems and indoor environment [3]. Case studies of thermal diagnoses of building systems are presented in [4,5,6,7]. Comprehensive in situ measurements, including building envelope, ventilation with heat recovery, heating, and domestic hot water systems, were performed in two single-family houses in [4,5], while thermal diagnostics of ventilation systems and cooling sources for air conditioning systems carried out in office buildings are presented in [6] and [7], respectively.
Examples of particularly complex cases are large-volume facilities. These include sports halls in which thermal loads vary across a wide range. The ventilation and air-conditioning of sport halls requires a large number of air exchanges, especially during sports events attended by many spectators. The airflow pattern should be well planned and controlled to ensure acceptable indoor air quality and thermal comfort in the occupied zone for users with different activities, such as those of athletes and spectators. In addition, energy consumption should be taken into account.
Energy efficient ventilation of large enclosures, including sports halls, was the subject of the international research project IEA Annex 26 [8]. In the ventilation of these rooms, problems with undesirable thermal stratification, local overheating, drafts or spread of pollutants were observed. Ref. [8] provides an overview of techniques to measure and model air distribution in large, ventilated spaces.
Many research centres around the world have been dealing with energy efficient HVAC systems in sports halls. The indoor environment in sport halls has been evaluated according to air quality [8,9,10,11,12,13,14,15,16,17], microbiological pollution [18], dust pollution [19] and thermal comfort [10,14,20,21,22]. There has been an ongoing search for a proper ventilation and night cooling strategy [10,21,23] and various solar shading systems, which reduce solar heat gains [24], and lighting systems [25,26] have been analysed. For dynamic building simulation, the TRNSYS [10] and DesignBuilder [19] programmes were used. Air distribution inside sport halls was calculated using CFD codes: ANSYS [27] and IES Virtual Environment [28]. The temperature distributions for different HVAC systems in a training hall have been predicted using the FloVENT CFD code [14]. However, in the above-mentioned papers, no information on comprehensive thermal diagnosis of the cooling system in sports hall was found.
This paper presents thermal diagnostic tests performed in a sports hall for which users complained about overheating during the summer due to the ineffective operation of the air conditioning system. A retrofitting of an HVAC system cannot be undertaken without determining the reasons of such overheating. The aim of this paper was to analyse the effectiveness of the ventilation and cooling systems in a sports hall and to check the possibility of managing the cooling demands via its existing air conditioning system. The scope of the study included inspection of ventilation and cooling systems, in situ measurements of ventilation air volume flows from the diffusers and the temperature of the air supplied to the hall, visualisation of the supply air flows, and registration of the indoor temperature in the hall at different set temperatures of the supply and exhaust air flows. Temperatures in the different points of the hall and AHU were measured and registered continuously for about 30 days. On the basis of these measurements, the total and sensible power of the cooling system and the sensible power removed from the hall were determined. This method of cooling power determination can be useful in thermal diagnostics of HVAC systems in buildings. Additionally, a numerical analysis of cooling demand was performed for various operation scenarios of the hall. The effects of additional actions, such as the use of window roller shades and the introduction of additional sun control films on windows, were also examined.

2. Methods

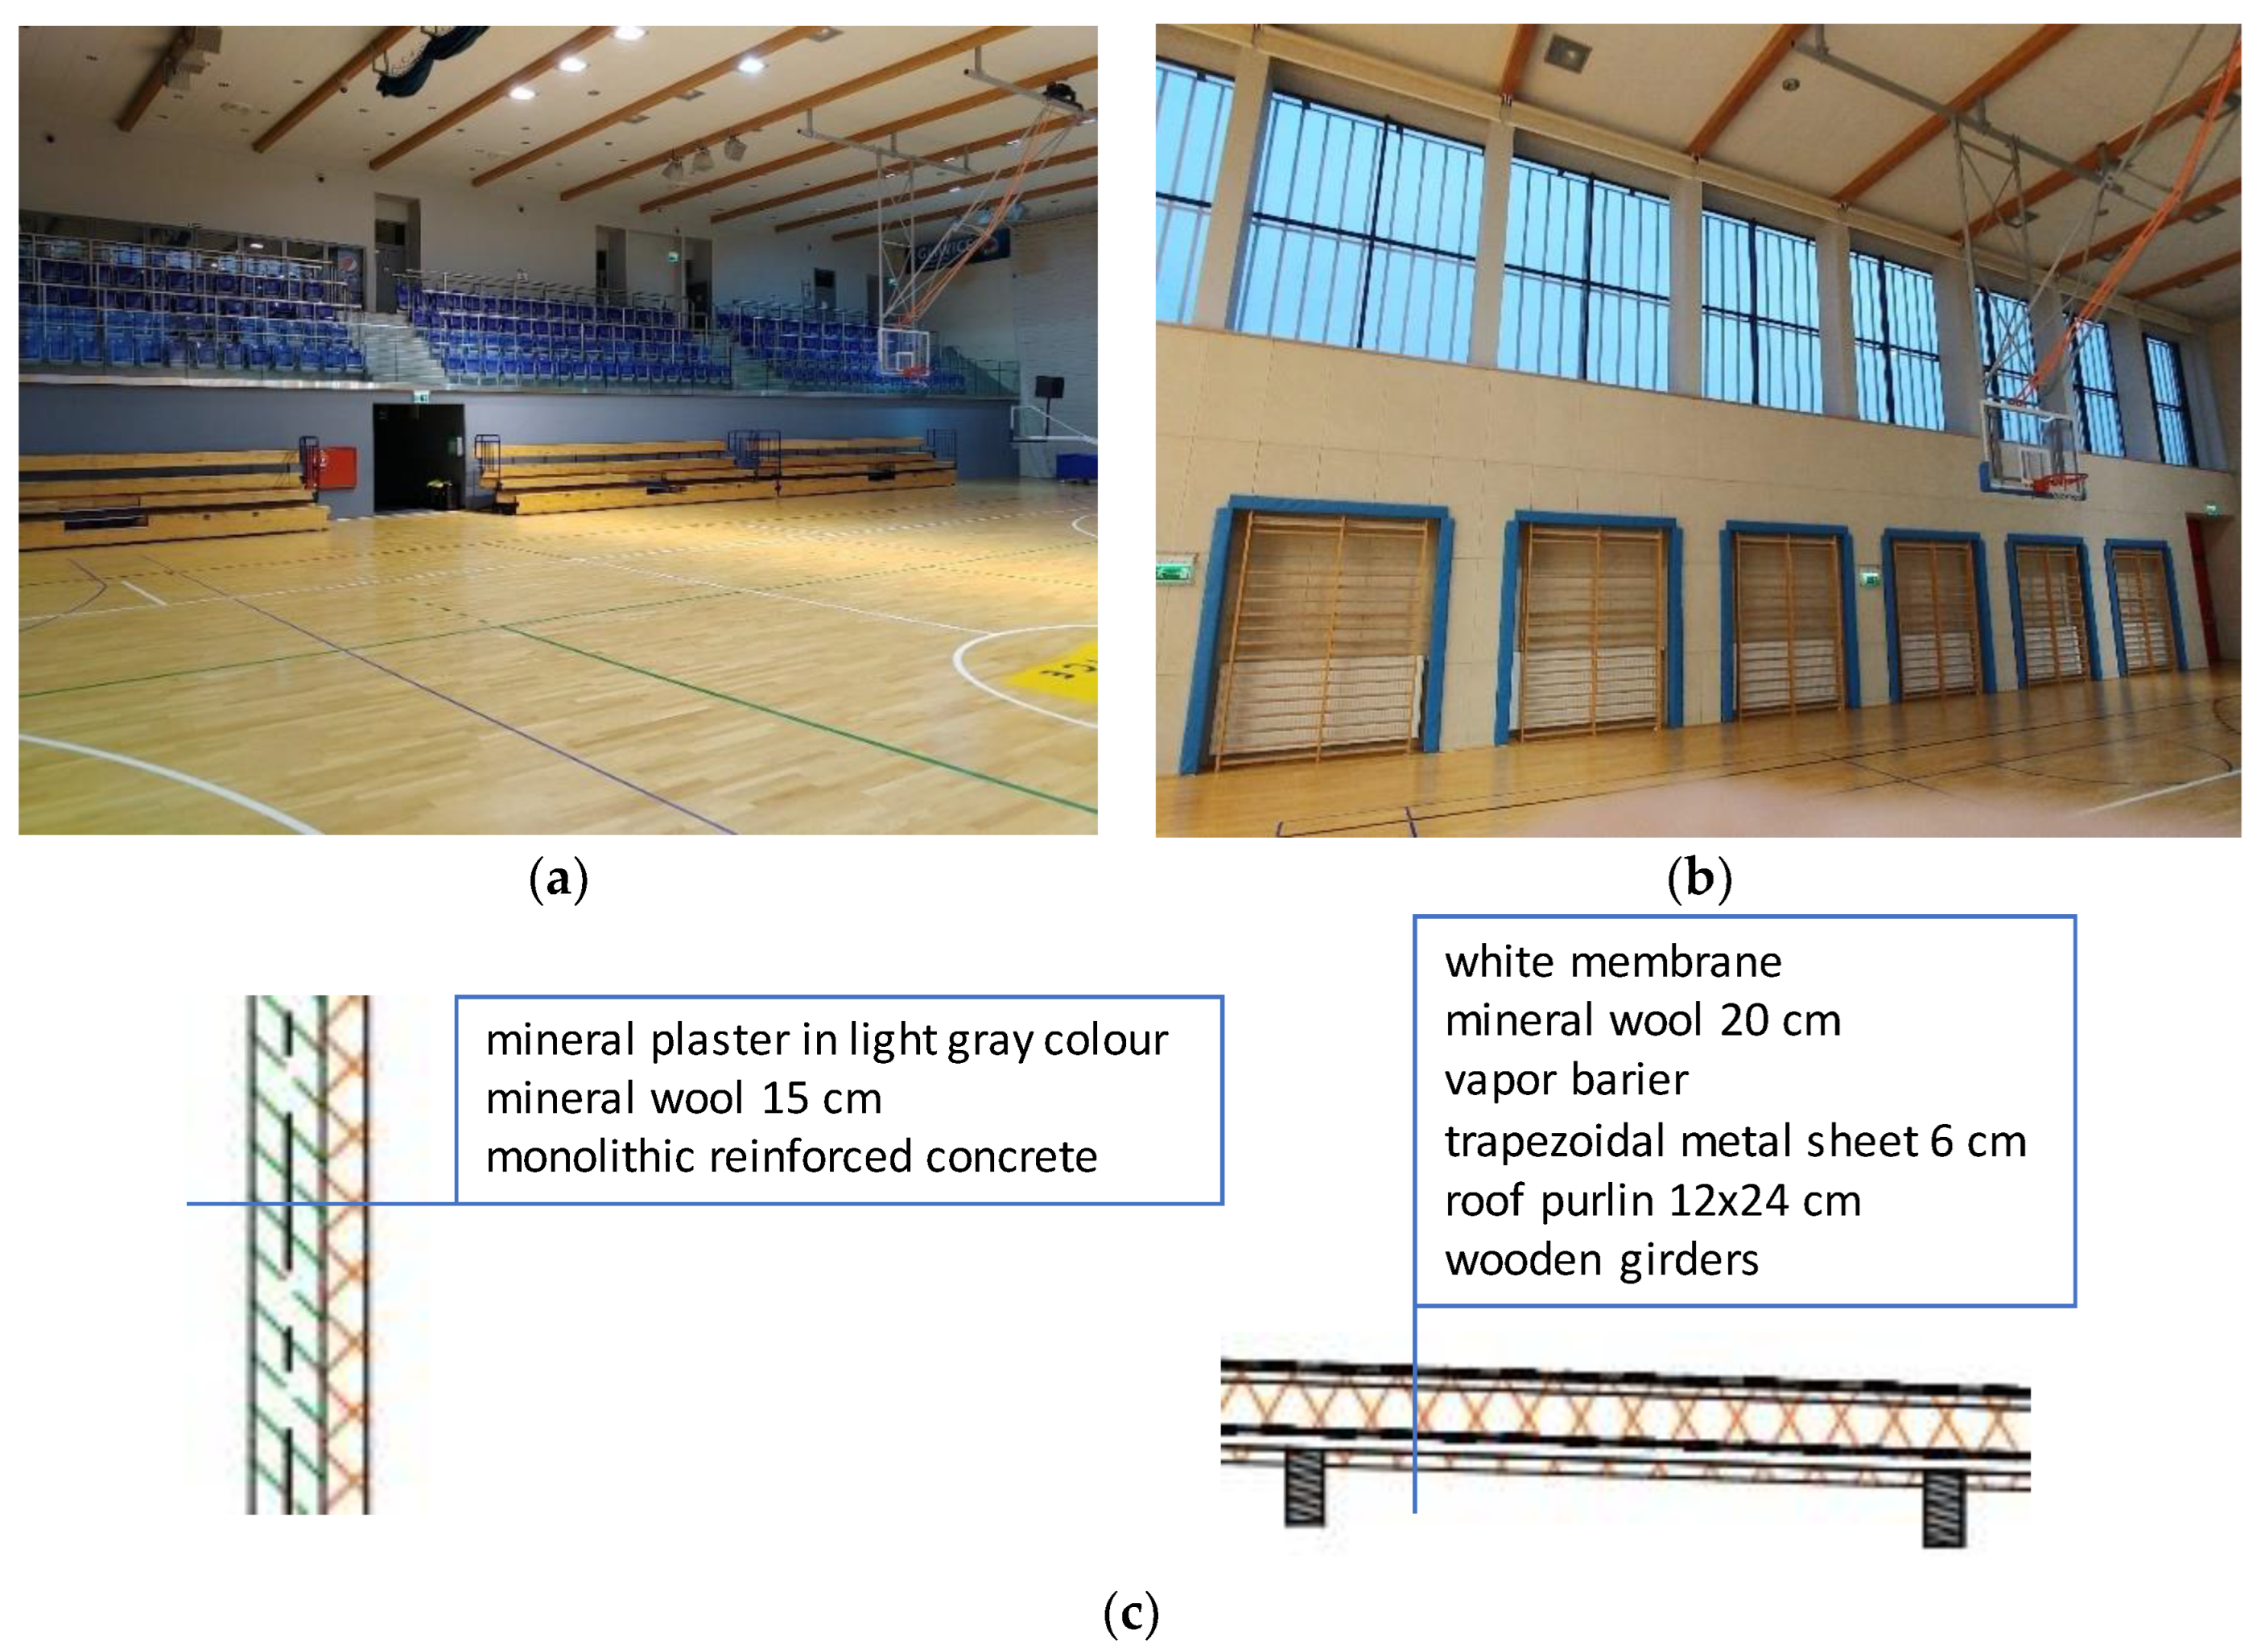
2.1. Tested Building
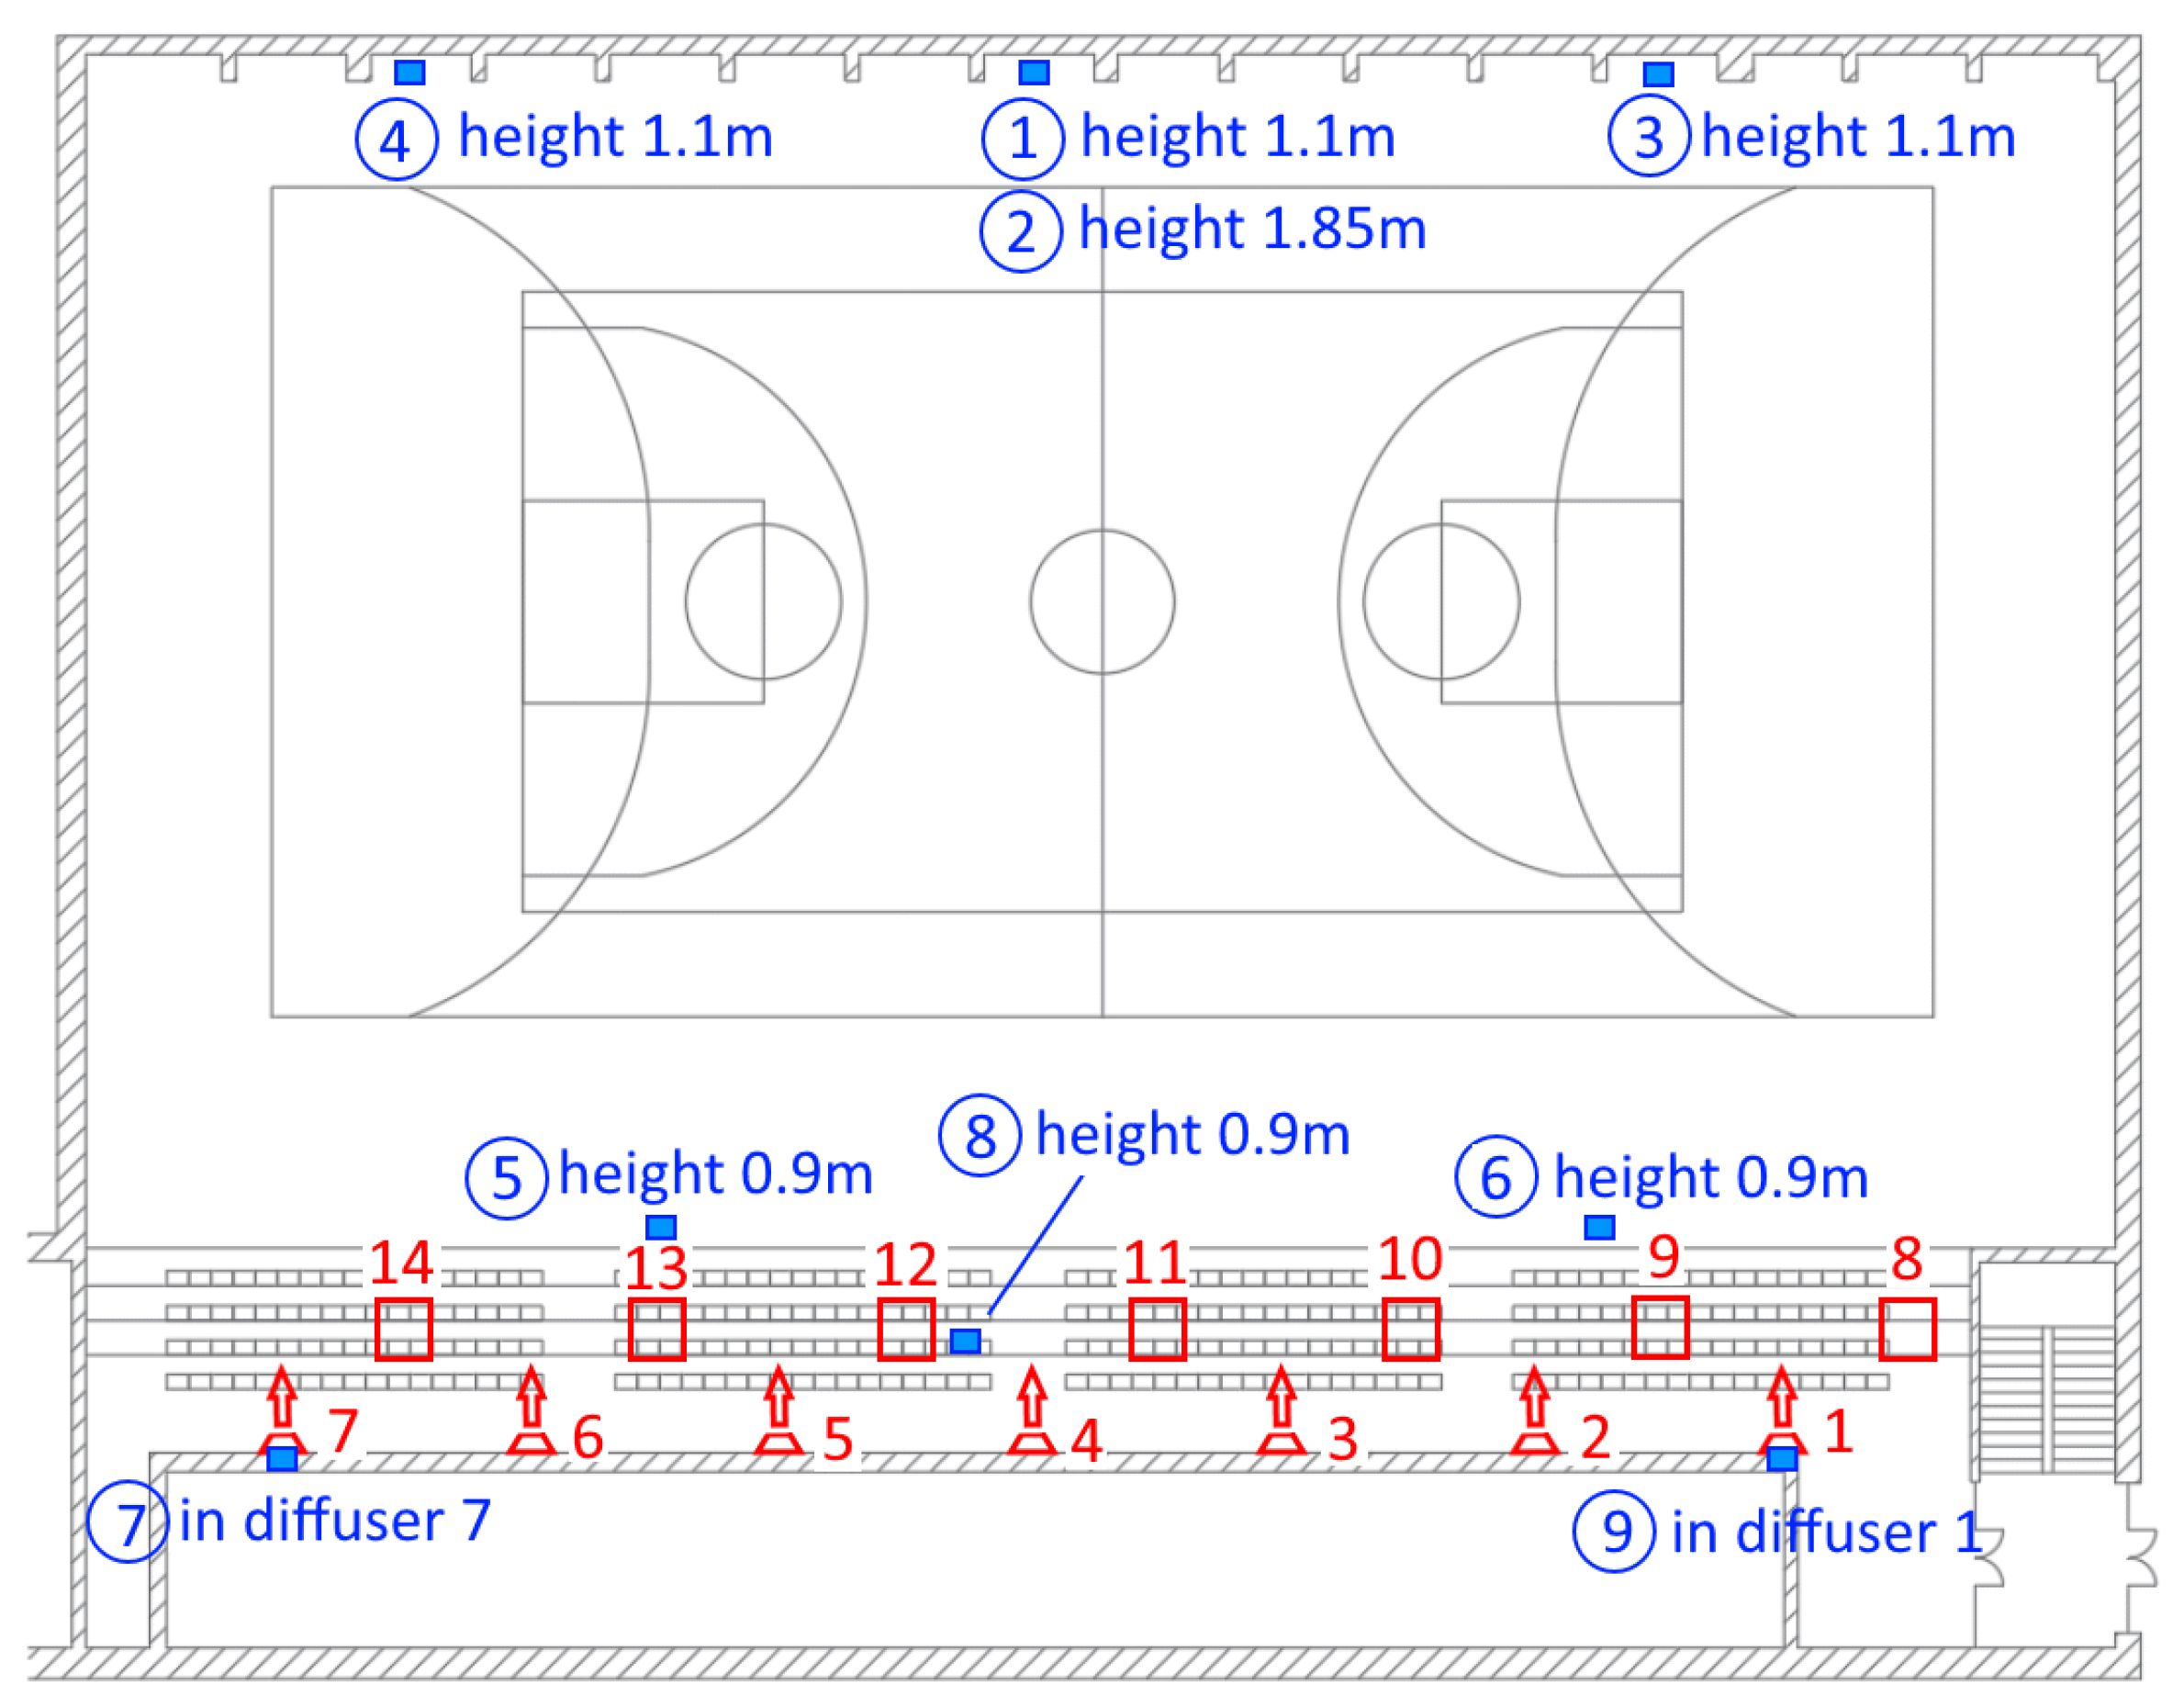
The research was carried out in a sports hall with a cubature of 16,300 m3, which includes a sports field with an area of 1387 m2 and a height of 10 m, a fixed stands with an area of 152 m2 for 288 people, and movable stands for 112 people (Figure 1a,b). The hall is located in southern Poland, which is characterized by a transitional temperate climate, between the continental and Atlantic climates, with relatively cold winters and warm summers (the Dfb class according to the Köppen–Geiger classification).
The walls of the hall have a monolithic reinforced concrete structure. The wooden roof is covered with a white membrane (Uwall = 0.20 W/(m2∙K), Uroof = 0.15 W/(m2∙K) (Figure 1c). There are large windows in the external walls on the N, E and S sides (Uglass = 1.1 W/(m2∙K)). The light-coloured internal roller shades have been installed on the windows, the positions of which are electrically controlled by a manually operated actuator. Some of the windows (N and S side) can be tilted.
The room is air-cooled with a supply-exhaust system. This system originally served only as ventilation and as additional heating of the hall above the standby temperature of 8 °C. In the second stage of the investment, the system was upgraded to cool the sports hall. The design air temperature in the hall is 24–26 °C. The air handling unit (AHU) is located on the roof and is equipped with a water heater and a water cooler. The constant air volume (CAV) system supplies air (11,500 m3/h) above the sports field with seven long-range air supply nozzles and to the stand area with seven swirl diffusers with a plenum box. According to the building documentation, the nozzles are set at angles of −29° to the axis of the ventilation duct (which was confirmed by inspection), and this is the recommended angle setting for the heating function. The angle was not changed when the system was upgraded to perform the cooling function. Air is removed from the ceiling of the hall through exhaust grilles. Thus, it is a classic mixing ventilation system.
A monoblock chiller with R-410A refrigerant is located on the roof of the building next to the AHU. The chiller is equipped with two compressors, one of which has an inverter to ensure the necessary adjustments to the cooling capacity. The temperatures of the coolant (40% water solution of ethylene glycol) at the inlet and outlet of the cooling coil are 6 °C and 12 °C, respectively.
According to technical data, for a ventilation airflow of 11,500 m3/h, the nominal total power of the cooling coil is 74.5 kW and the sensible power Q s | s u p o   is 54 kW (when outdoor air is cooled to 14 °C, from outdoor air temperature to = 32 °C to air temperature at the cooler outlet equal to the supply air temperature tc ≅ tsup = 18 °C). The sensible power Q s | s u p o can be calculated from the formula:
Q s | c o = V · ρ · c p · t o t c = 11500 3600 · 1.2 · 1.005 · 14 = 54   kW .
Assuming that the temperature of exhausted air is equal to the average air temperature in the hall, ti = 25 °C, the maximum sensible heat flux removed from the hall is:
Q s | s u p i = V · ρ · c p · t i t s u p = 11500 3600 · 1.2 · 1.005 · 7 = 27   kW .
The sensible heat gains assumed at the design stage were 69 kW. Thus, the sensible heat flux removed from the hall is approximately 2.6 times lower. This means that the ventilation airflow of 11,500 m3/h at a temperature of 18 °C will not ensure the air temperature in the hall at the level of 24 to 26 °C.
The controller maintains the temperature in the room at the set level. The system can operate in day or night mode. The operation of the automation system consists of regulating the supply temperature based on the readings of the temperature sensors of the outside air and the air exhausted from the room. The control system compares the set temperature with the current reading of the exhaust air temperature sensor.

2.2. Measurements

The tests performed included:
  • measurement of airflows supplied to the hall with simultaneous measurement of the air temperature;
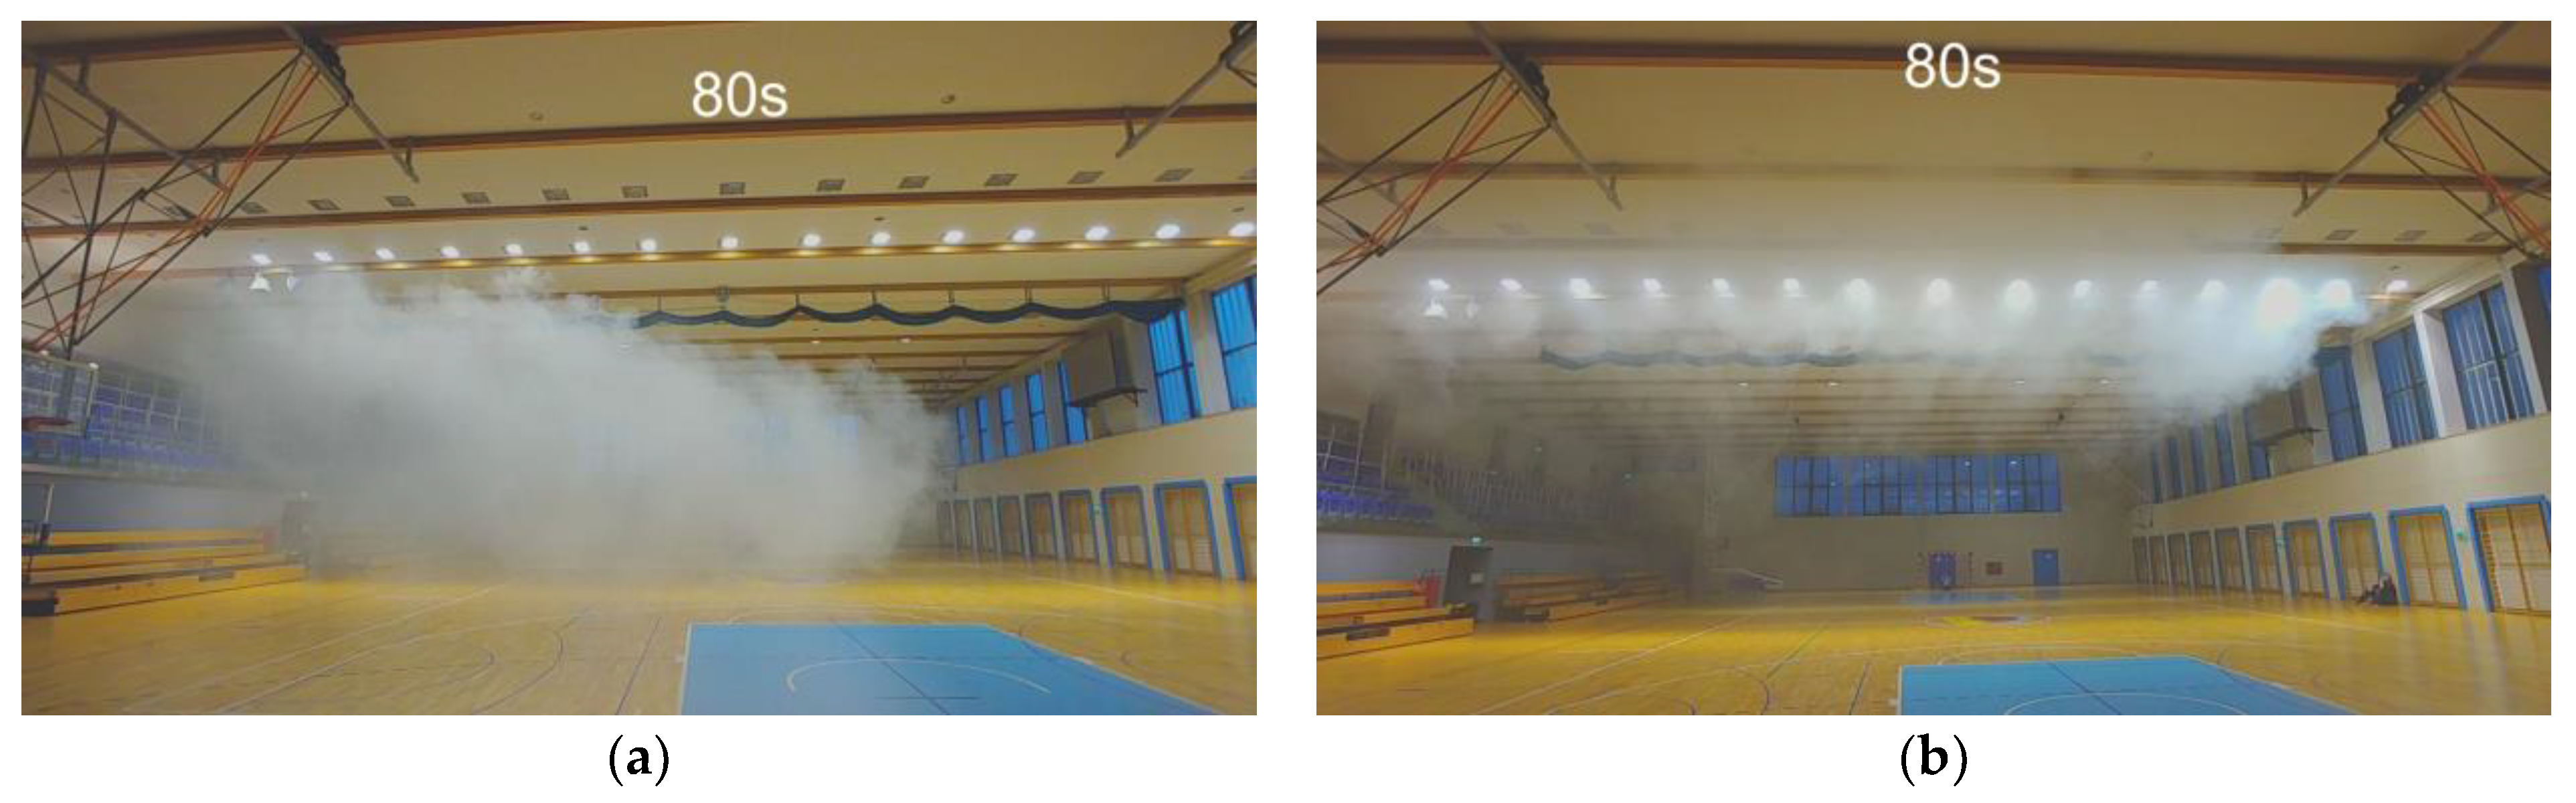
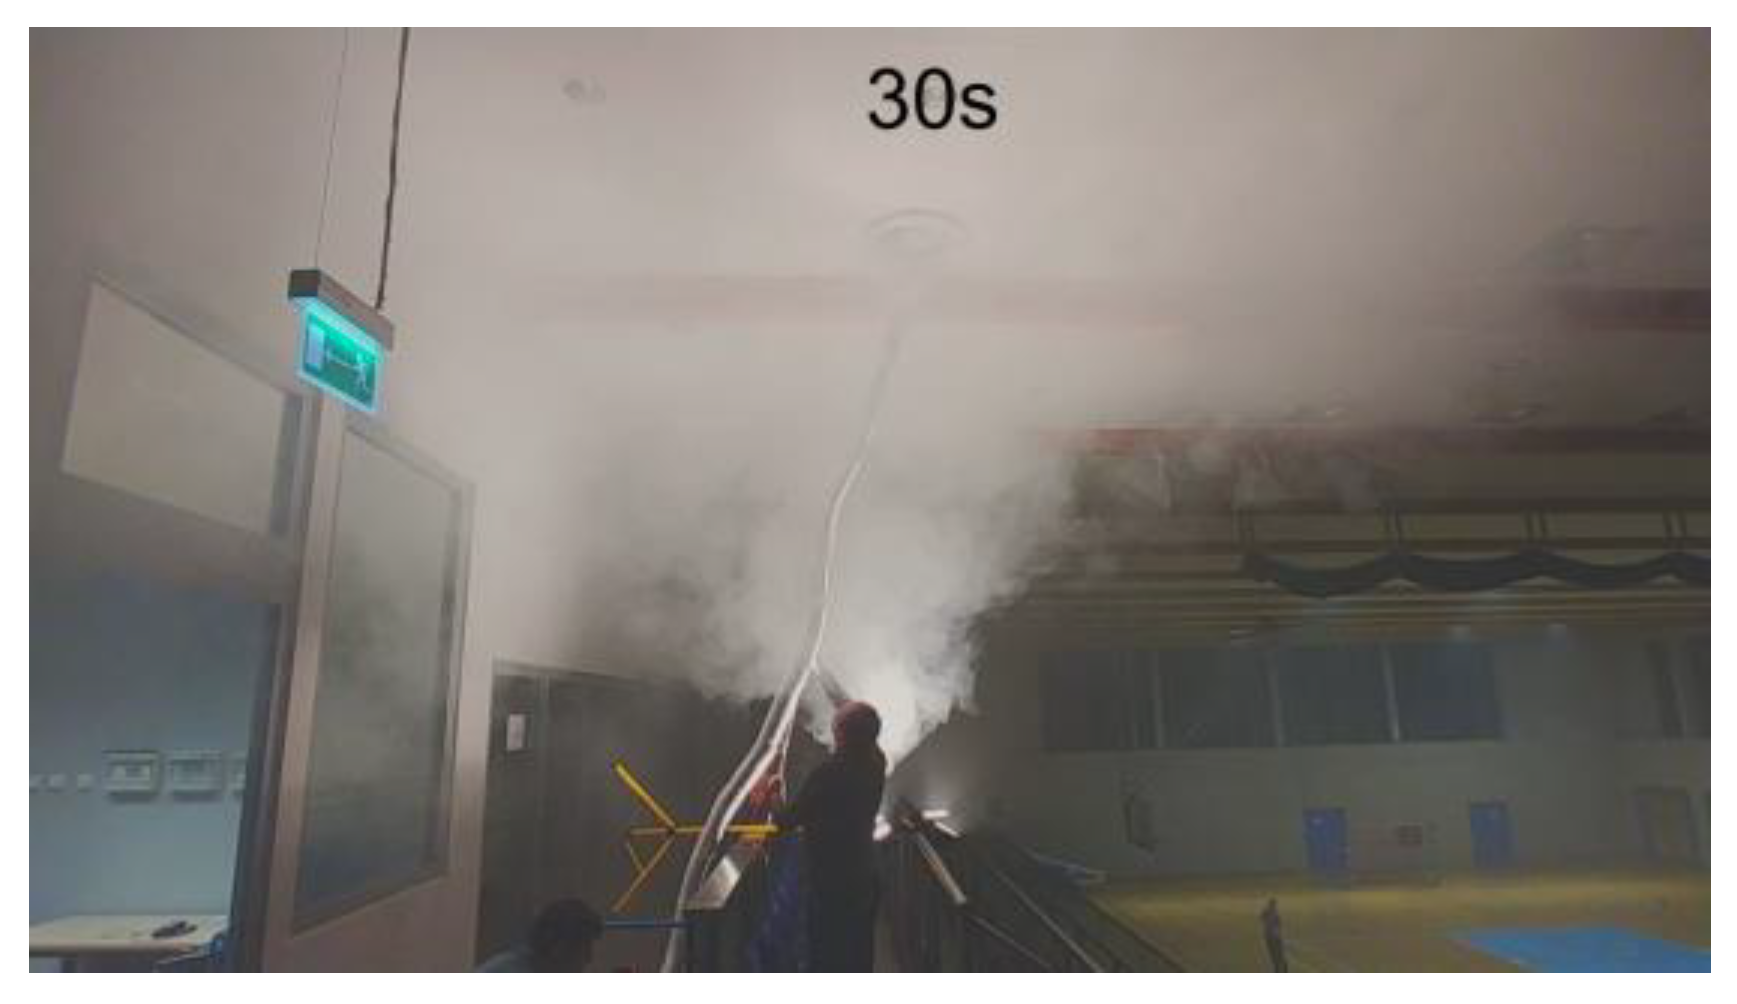
  • visualisation of the supplied jets and determination of their throw length;
  • continuous measurement and recording of temperature and humidity of the supplied air, exhausted air and air at the inlet and outlet of the cooling coil in AHU;
  • continuous measurement and recording measurement of air temperature at the selected points in the occupied zone.
A list of measuring instruments with their range and measurement uncertainty is presented in Table 1. Additionally, meteorological data from a meteorological station located 6 km from the building were used for the analyses.
The measurement results were used to evaluate the thermal conditions in the room and to determine the total and sensible power of the cooling system at different temperatures, the humidity of the outside air, and the different values of the air temperature inside the hall, as set on the thermostat.

2.2.1. Measurements of Temperature and Volume Flux of the Supplied Air

Measurements of volume flux and temperature of the air supplied to the hall from all fourteen diffusers were performed once. The arrangement of the diffusers in the hall is shown in Figure 2. The long-range nozzles are marked with numbers 1 to 7, and the swirl diffusers are marked with numbers 8 to 14.

2.2.2. Visualisation of Supply Jets

In order to determine the throw length of the jets, they were visualised by adding smoke generated by the smoke generator to the supply air. Smoke dosing was carried out separately for one supply nozzle and one swirl diffuser. The air volume fluxes from the same type of diffusers were very similar; therefore, it can be assumed that the air velocity distributions are also similar.
Because the visualization may affect visibility, it was performed in an empty hall, late in the evening. The average outdoor air temperature of the 24 h preceding the measurements was 14.2 °C, and the daytime sun exposure did not exceed 300 W/m2. Under these outdoor conditions the indoor air temperature in the hall was 21 °C.

2.2.3. Long-term Measurements of Air Temperature and Humidity

The tests of the efficiency of the cooling system were conducted in the warmest period of the year, i.e., in July and August. Continuous measurements and recording of air temperature and relative humidity were made at seven points located in the occupied zone. Data loggers 1, 2, 3 and 4 were placed near the external wall opposite the stands, data loggers 5 and 6 at the seats under the stands, and data logger 8 at the seat in the stands. Two data loggers placed in diffusers 1 and 7 (the data loggers marked 7 and 9 in Figure 2) measured the parameters of the air supplied to the hall. The locations of the data loggers in the hall are shown in Figure 2. The measurements in the occupied zone and in the diffusers were carried out from 27 July to 25 August 2021. In the period from 6 August to 25 August 2021, air temperature and humidity were measured at two points located in the AHU: the data logger located behind the cooler measured the parameters of the supplied air at the inlet of the supply fan, and the data logger placed at the inlet of the recuperator measured the parameters of the air removed from AHU. Due to technical reasons, the measurements of temperature and air humidity in the AHU started ten days later than measurements in the occupied zone and in the supplied jets. This period was sufficient to determine the cooling capacity of the HVAC system.
During the entire measurement period, the hall was used sporadically due to COVID restriction, so it can be assumed that internal heat gains were negligible. Measurement results were recorded with a time step of 5 min.

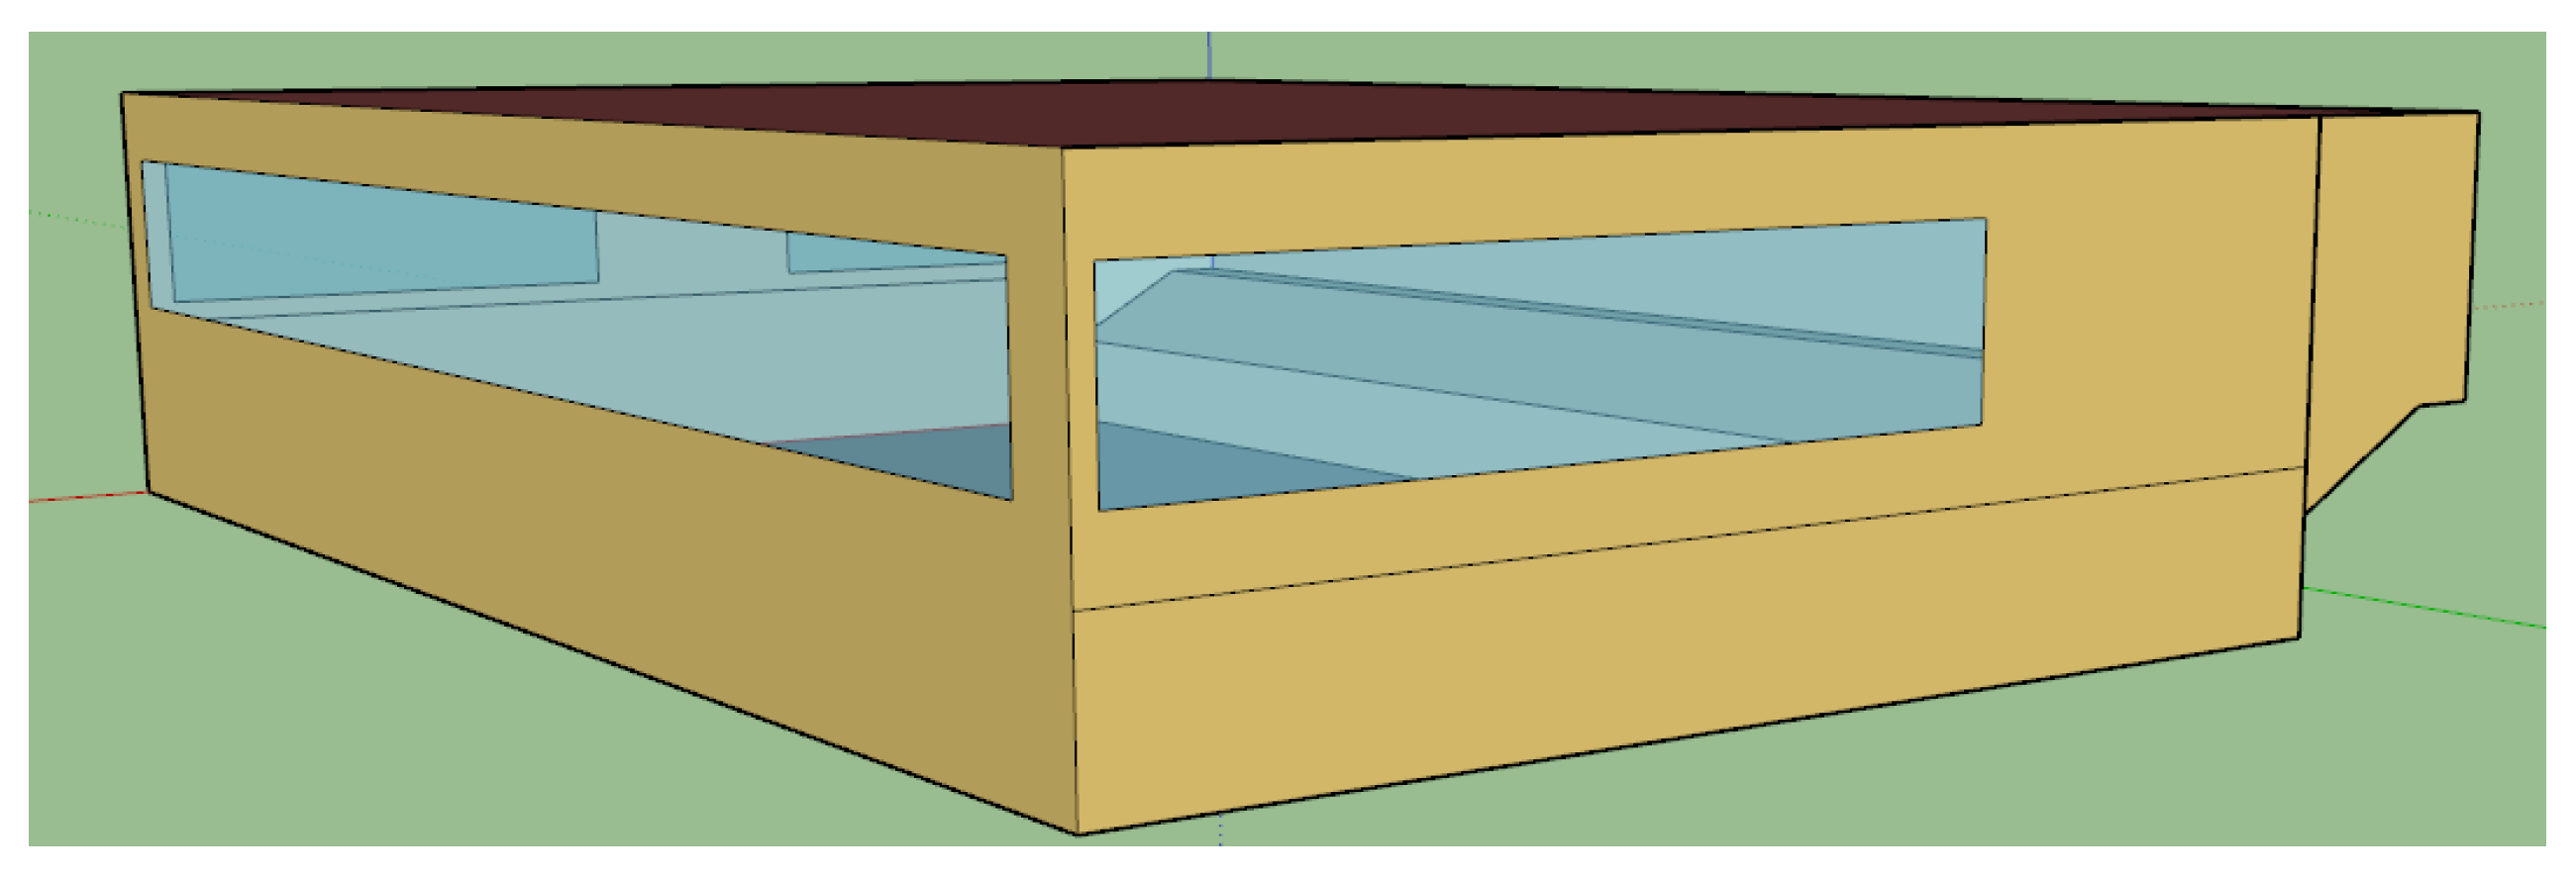
2.3. Thermal Simulation

To determine the cooling demand in the sports hall, a thermal simulation of the building was carried out using EnergyPlus 9.4 (US Department of Energy, Washington, DC, USA) [29]. The model included one thermal zone (Figure 3). The conditions in the unmodeled part of the building around the stands were assumed to be similar to the calculated zone. The following assumptions were made for the calculations:
  • Simulation for the summer period 1.06 to 30.09 (2928 h) with a 15-min time step;
  • Outdoor climate: typical climate data (TMY) for Katowice (typical meteorological years and statistical climatic data for the area of Poland for energy calculations of buildings [30]). The minimum temperature in the simulated period was 1.9 °C, the maximum temperature was 30.8 °C, and the average temperature was 16.2 °C;
  • Indoor temperature: the lower limit was adopted according to the design assumptions—24 °C. In the model, the ideal loads air system was used, which supplies cooling or heating air to a zone in sufficient quantity to meet the zone load;
  • Heat gains from lighting (400 W × 150 lamps = 60 kW): 15% convection (k), 85% radiation (r) (fluorescent lights built in the ceiling);
  • Heat gains from people on the playing field [31]: sensible heat 145 W/person (k/r 50/50%), latent heat 280 W/person;
  • Heat gains from people in stands [31] sensible heat 75 W/person (k/r 50/50%), latent heat 55 W/person;
  • Non-transparent building partitions according to the current state;
  • Transparent building partitions (windows) according to manufacturers’ data for similar windows from the construction period of the facility. The optical properties of the glass were determined using a dedicated Window 7.8 program [32] (Table A1);
  • Air infiltration: due to a mechanical ventilation system, external air infiltration was omitted. The windows in the building are relatively new (only ten years old) and tight and, with a small difference in temperature between the outside and the inside in summer, the infiltrating airflow is very small. Therefore, the error associated with this assumption is negligible;
  • Internal shades (according to actual state): the solar radiation transmittance coefficient was adopted on the basis of catalogue data of similar roller shades available on the market. Two options were adopted: windows without shades or all windows covered.
The calculations were carried out for three variants of use:
  • A: empty hall;
  • B: sports training on the playing field (20 people doing very hard work);
  • C: hall with full occupancy of the audience (20 people doing very hard work and 400 people sitting).

3. Results

The ventilation and cooling systems were made according to the design of the building, but unfortunately the occupants complain of thermal discomfort in the summer. Retrofitting with a cooling system raises doubts and the question as to whether the air flow specified in the earlier project is sufficient to cover the cooling demand of the sports hall at the assumed supply air temperature has not been checked. Furthermore, the indoor temperature of 24 °C to 26 °C, assumed in the designed stage, is recommended for light work in the summer (for example, office work or spectating as part of an audience in the gym). The recommended temperature for very hard work, that is, high activity performed by players on the field, is 18–21 °C [33].

3.1. Ventilation Airflow Rate

The results of the measured volume flux and the temperature of the supplied air are presented in Table 2. The average temperature of the air supplied was 17.9 °C. The standard deviation of the air temperature measured in all diffusers was 0.5 °C.
The total measured ventilation air flow was 9350 m3/h ± 50 m3/h, and was lower by 8–33%, averaging 18%, than the design. From a hygienic point of view, with a maximum of 400 occupants, this flow is approximately 20% too low. When the hall is fully occupied, the air quality may be slightly unsatisfactory, but this is probably not often the case. Taking into account the hygiene conditions, it is not necessary to increase the ventilation airflow rate.
The average temperature of the air supplied was 17.9 °C. The standard deviation of the air temperature measured in all diffusers was 0.5 °C.

3.2. Evaluation of the Throw Length of Supply Jets

Visualization for the long-range nozzle was carried out twice, once for the nozzle directed downwards (setting found in the sport hall) and once upwards (setting recommended for a cold jet supply). The temperature of the supply air and the air at several points in the surrounding jet was measured. The supply air temperature measured in both diffusers was 16.6 °C. The air temperature in the hall was, on average, 21.7 °C, and its values differed very slightly within the uncertainty of its measurement. Thus, the temperature difference between the air supplied and the air in the room was −5 °C. Figure 4 and Figure 5 show exemplary photos from tests of the jet throw length.
Figure 4 shows that, at the current setting of the long-range nozzles, the jets reach the level of the floor, covering the entire occupied zone. With a properly operating air conditioning system this setting may be unfavourable, as the jets reaching the occupied zone may cause a sensation of draught. However, in current conditions, when the temperature in the hall is too high, this setting may improve the thermal comfort of the athletes. When the nozzles are orientated up, the jets are attached to the ceiling and cover the entire width of the room.
In the case of the jet supplied from a swirl diffuser, and as shown in Figure 5, the cold air slowly descends downward and reaches the occupied zone. The conditions during the measurement were more conducive to such a development of the jet than the conditions when there are spectators in the audience. During a mass event, thermal plumes are formed above the spectators, which cause a vertical upward air movement. Thermal plumes work opposite to the supply jets, limiting their range. In this case, the throw length of the air jets may be smaller.

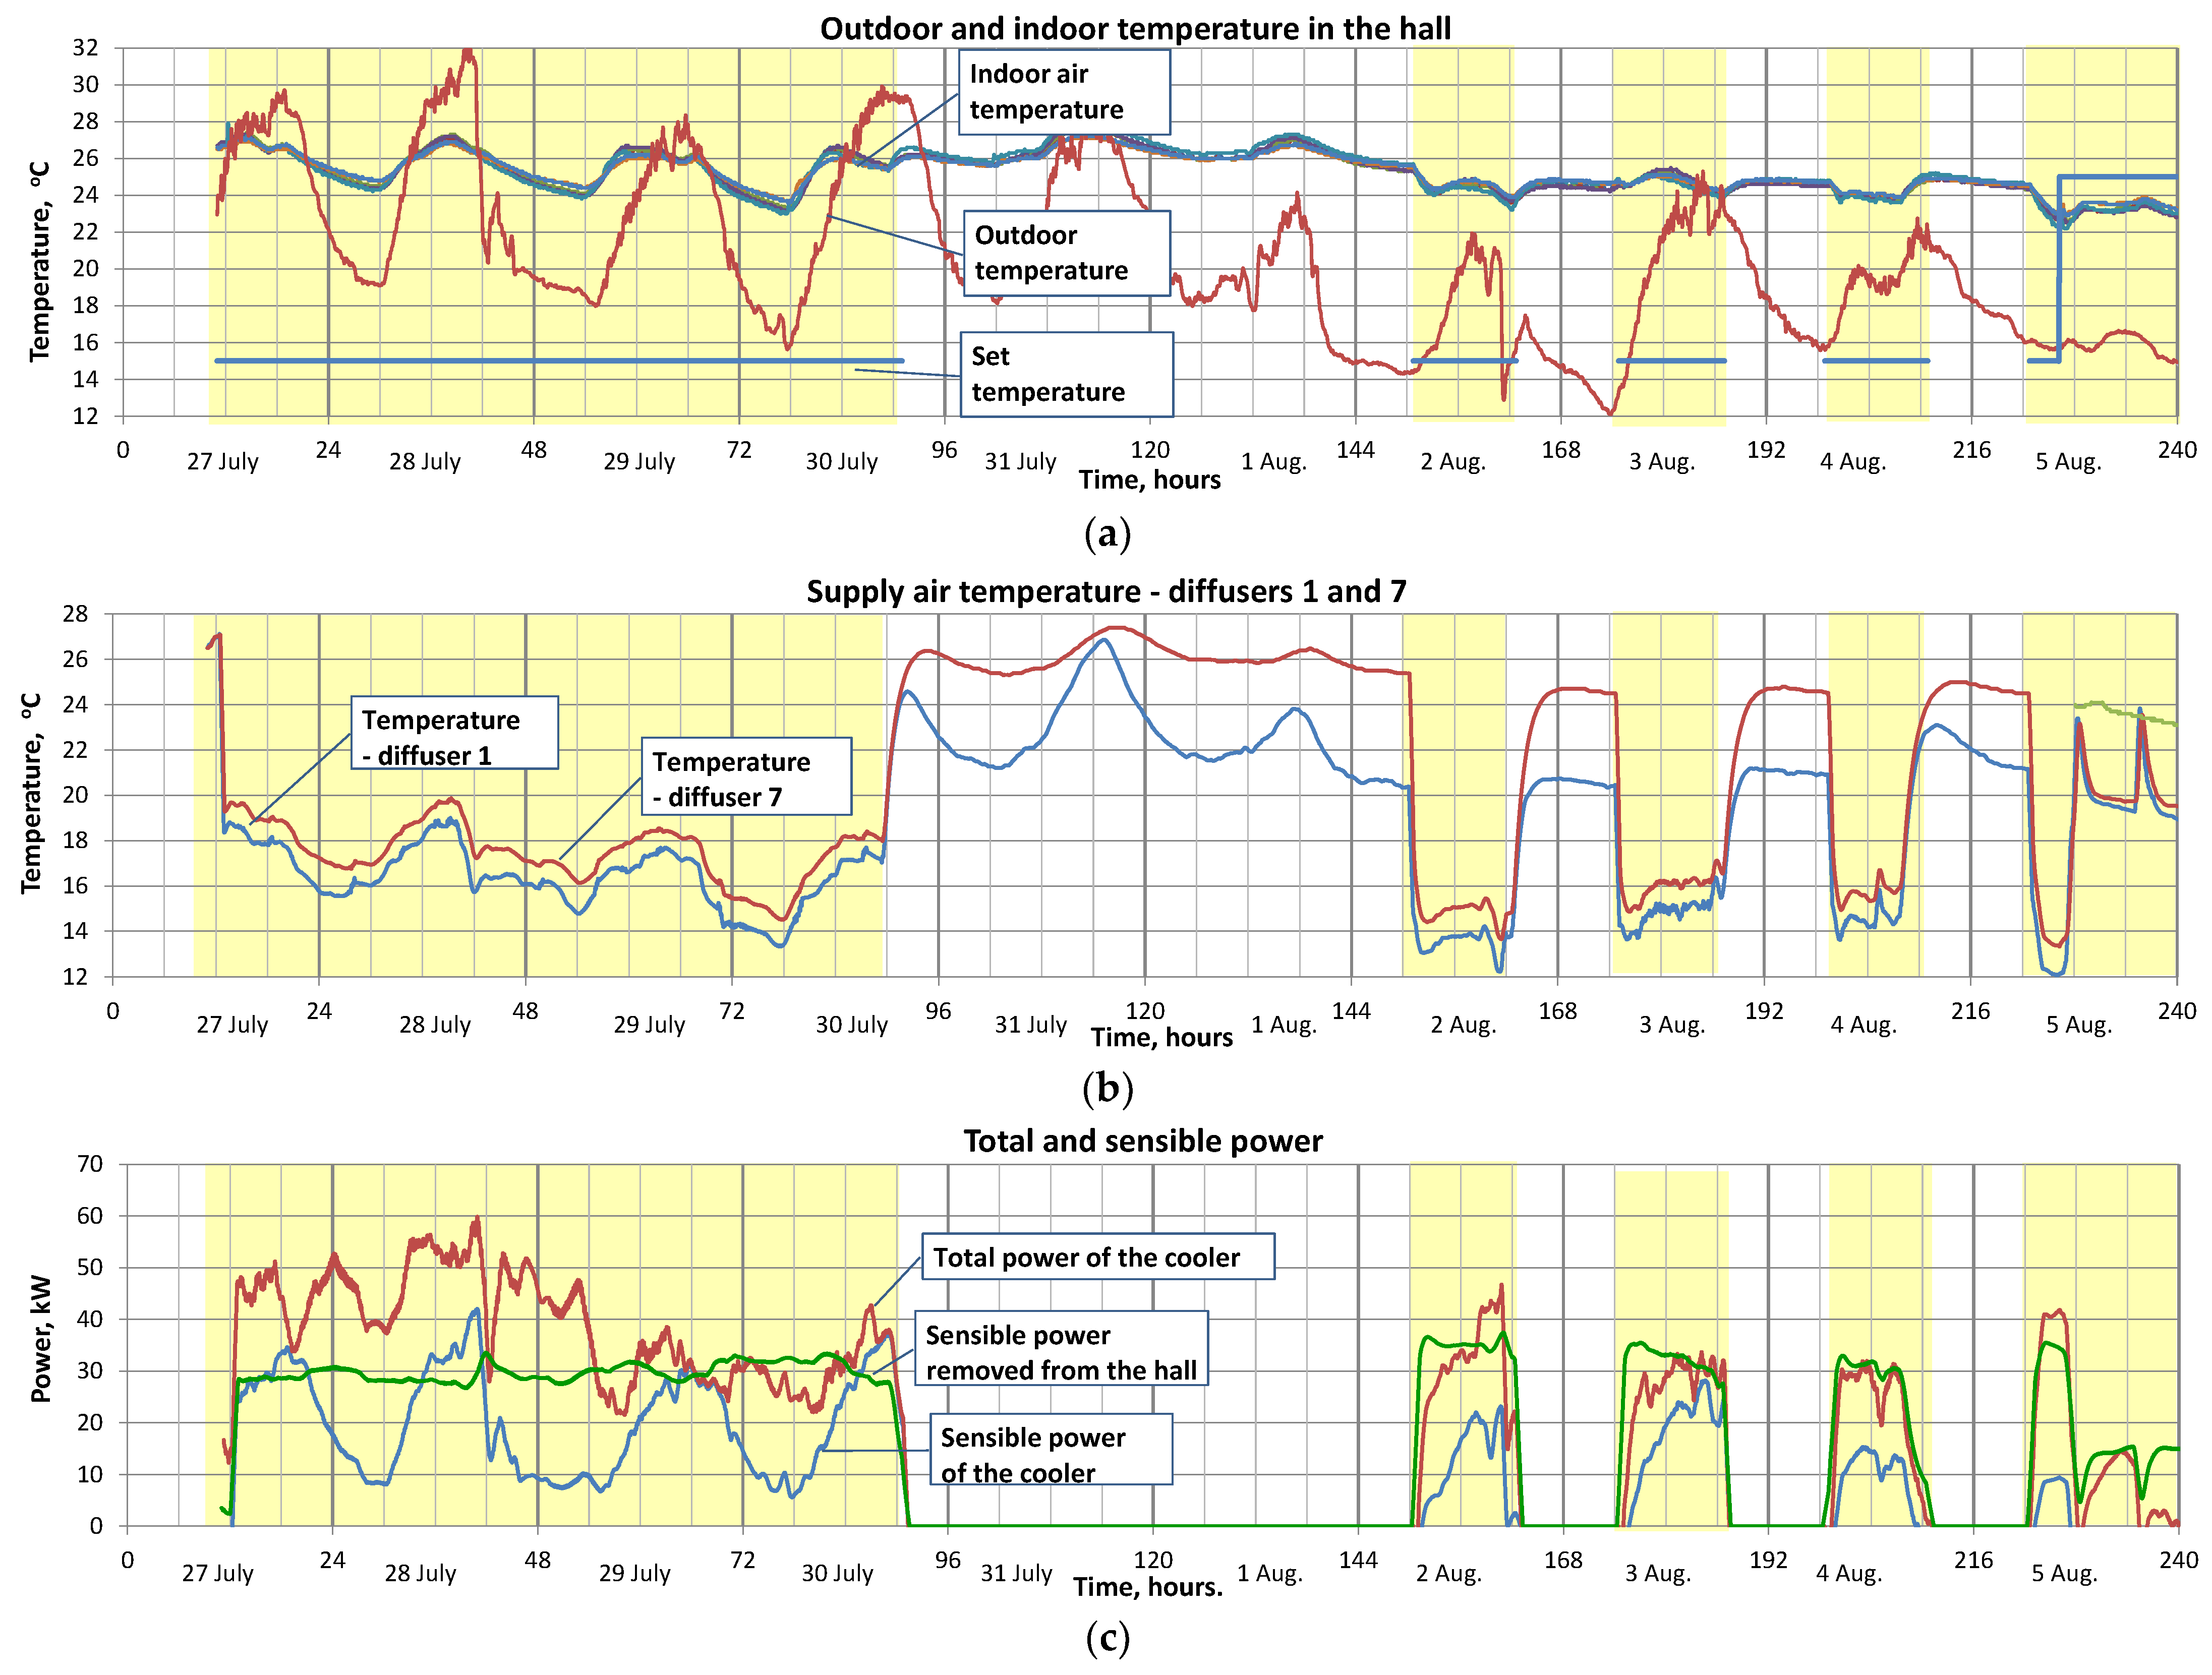
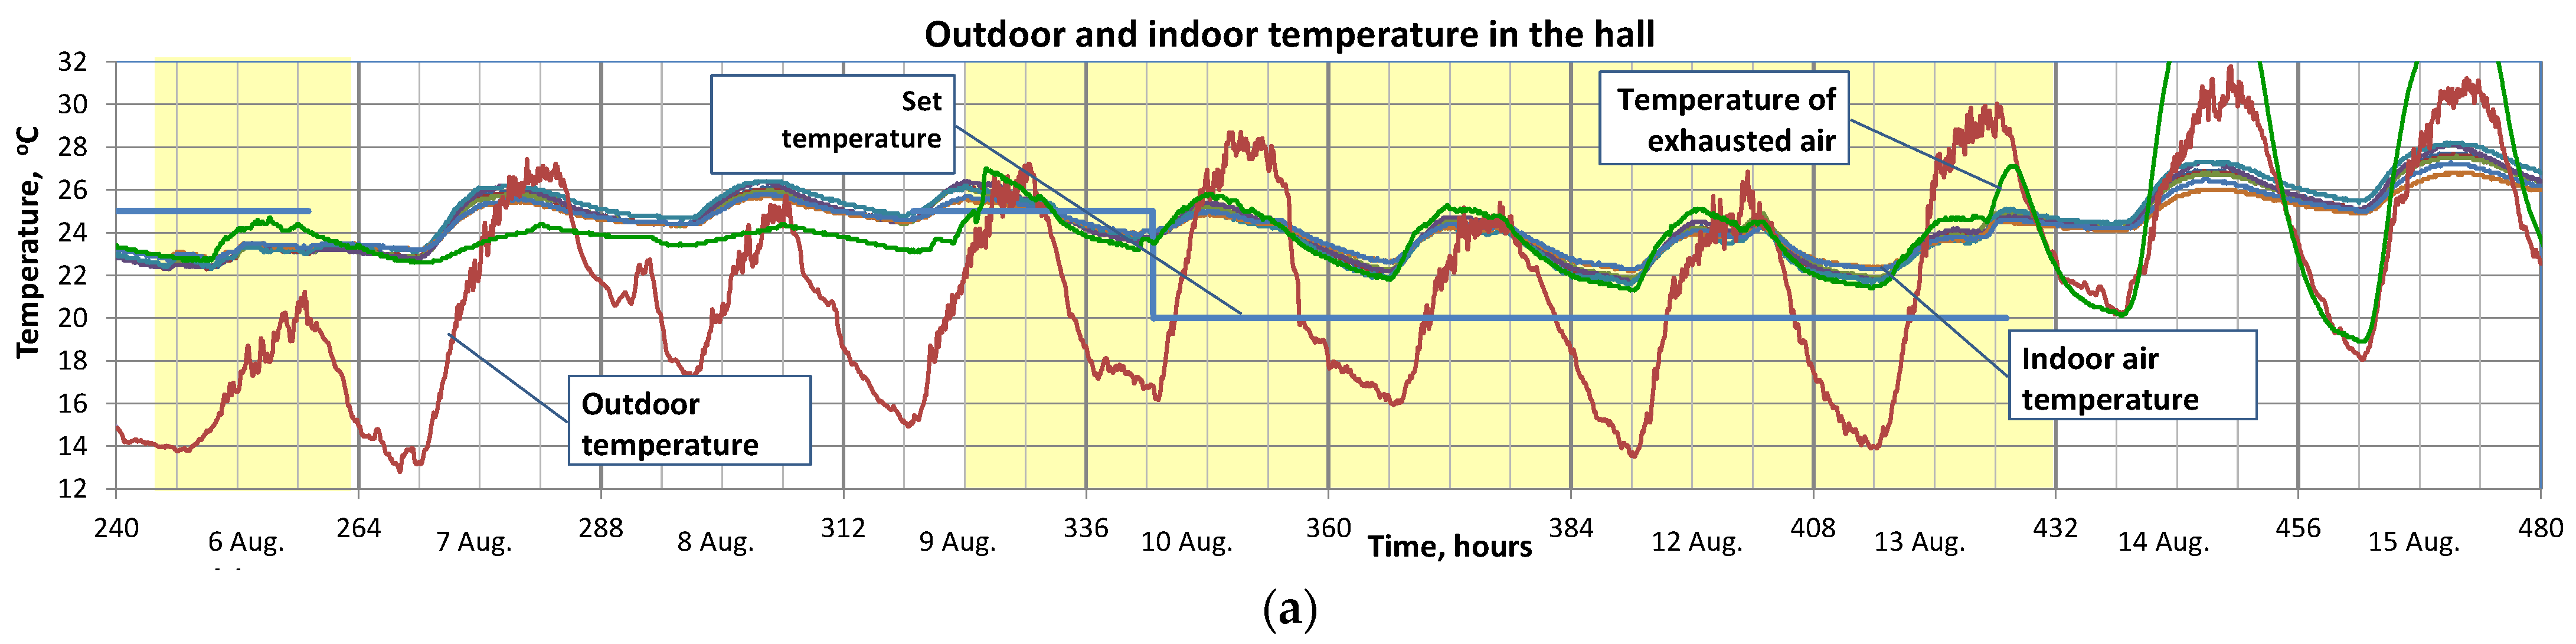
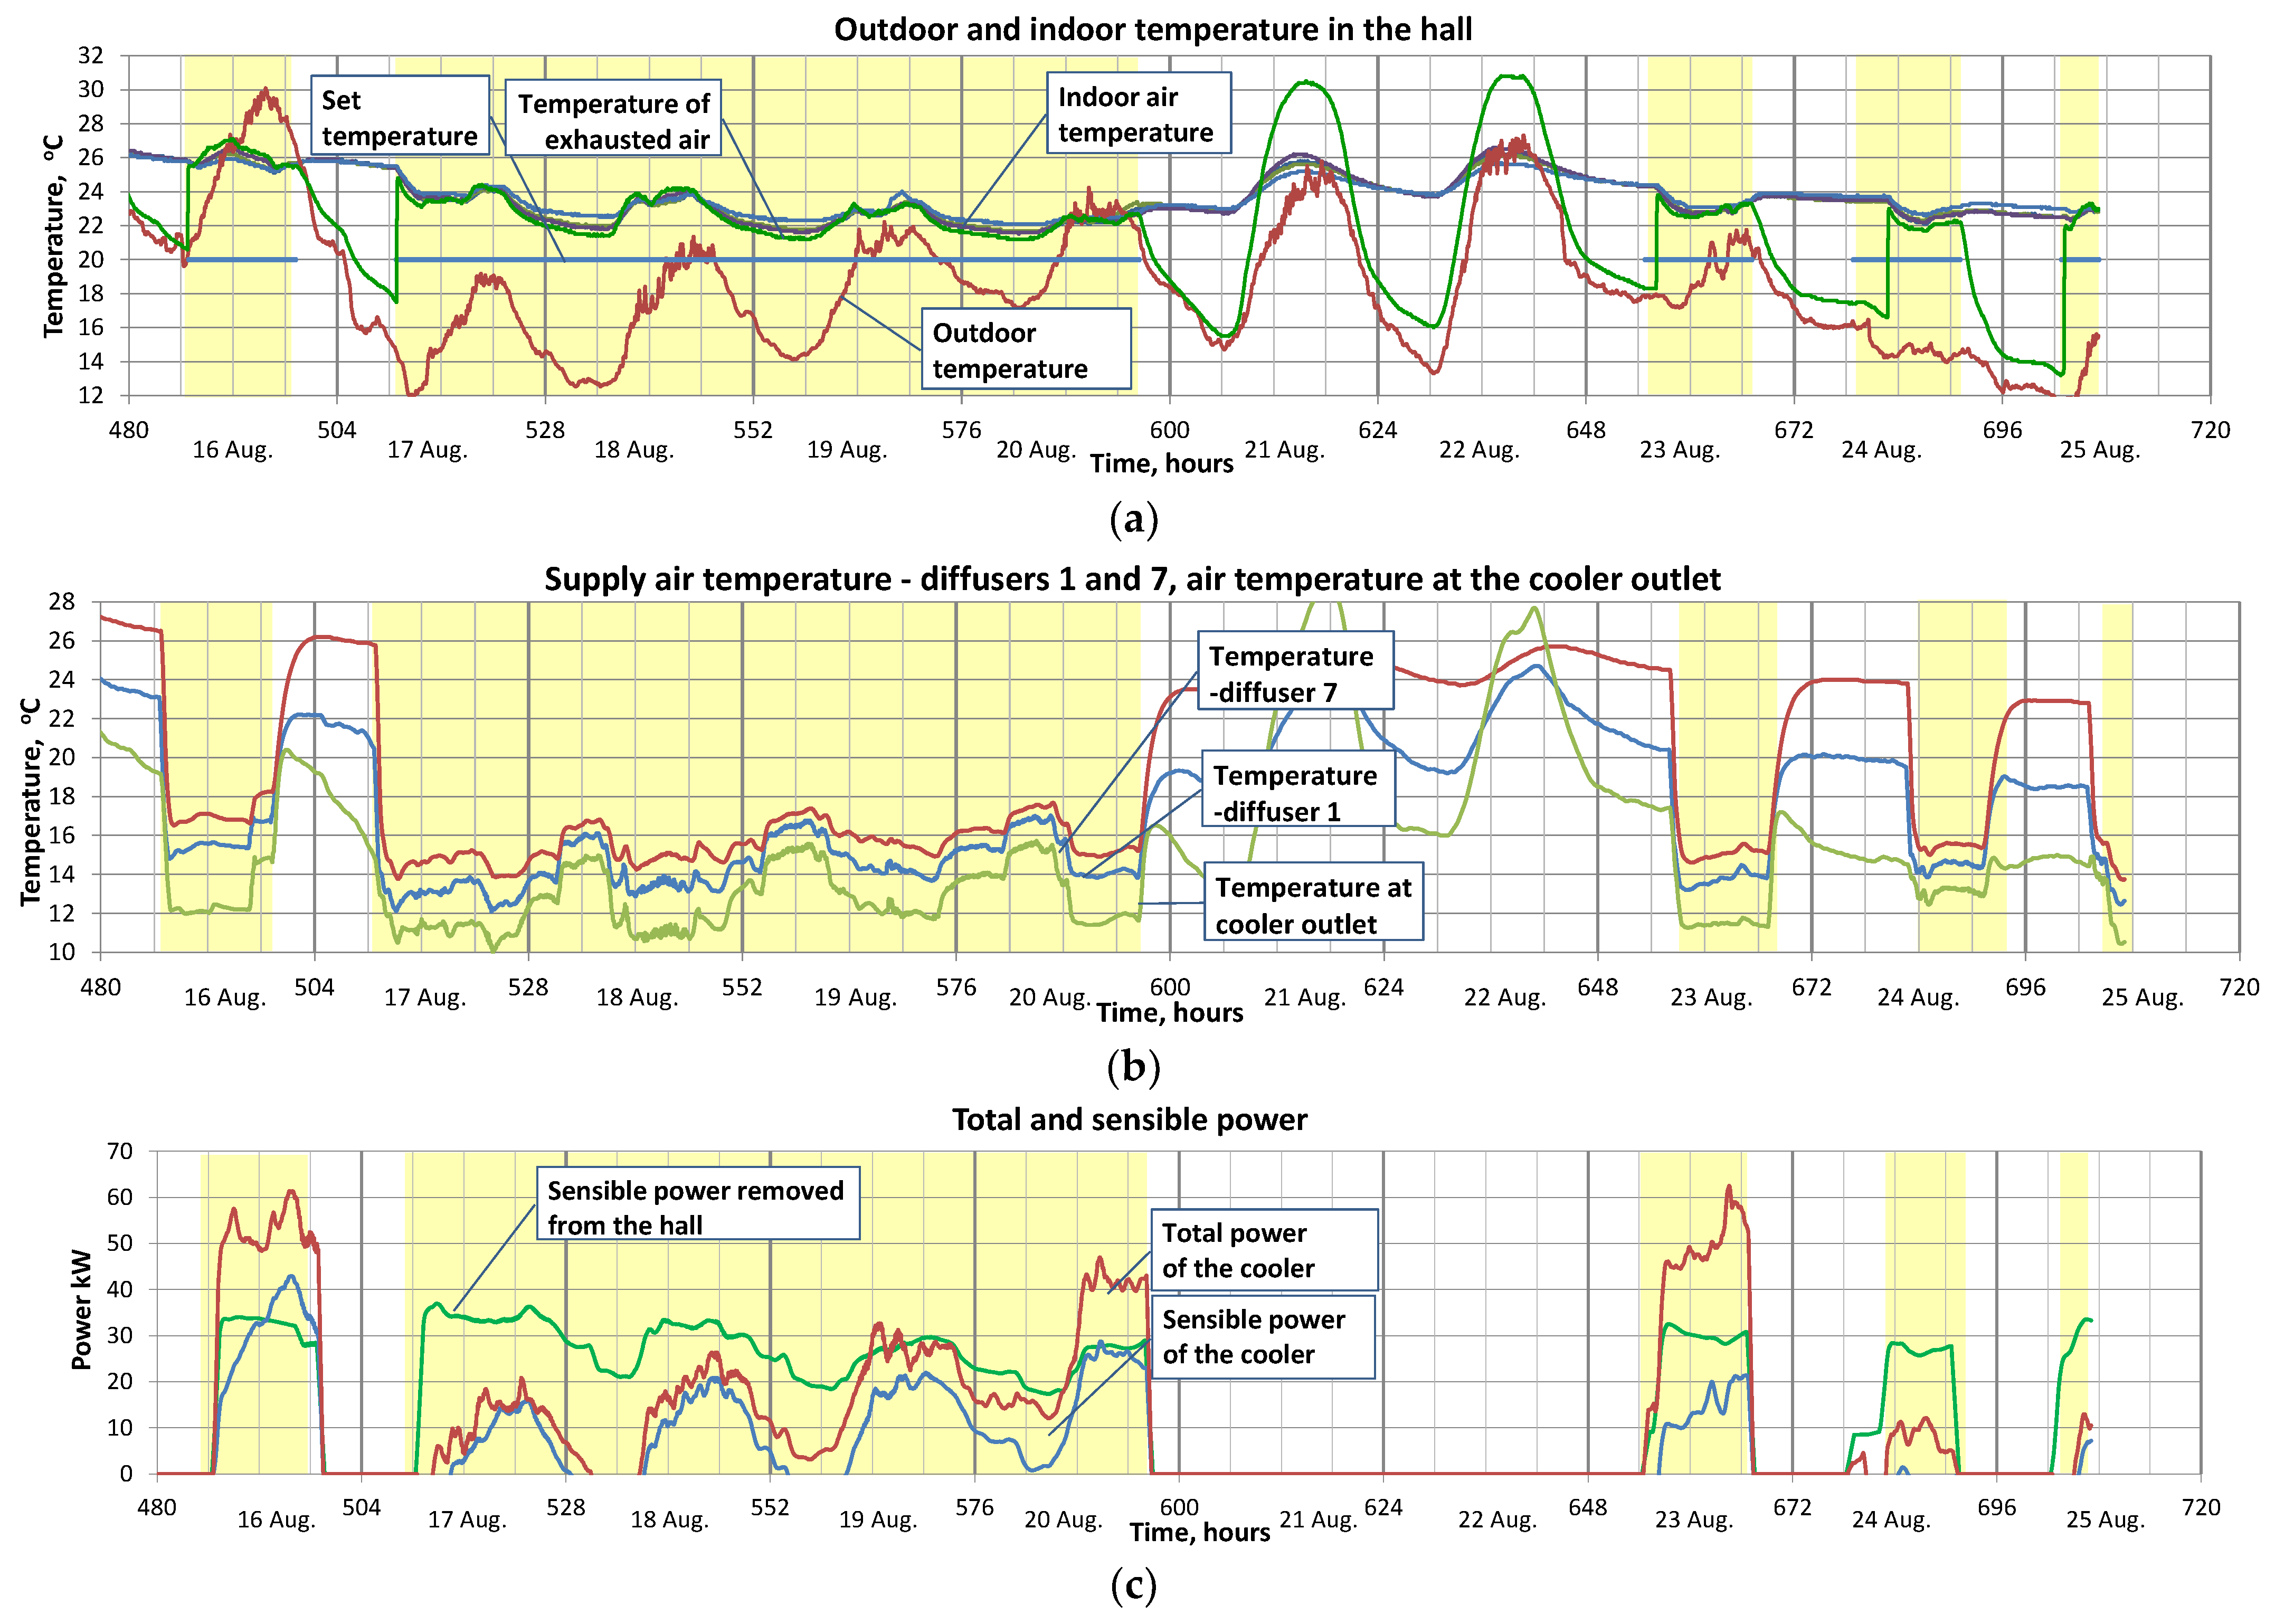
3.3. Temperature Measurement Results in the Hall

The time series of outdoor air temperature and indoor air temperature in the hall measured at seven points in the occupied zone, and the air temperature in the hall as set on the controller are shown in Figure 6a, Figure 7a and Figure 8a. Additionally, Figure 7a and Figure 8a show the exhaust air temperatures measured in the air handling unit. The air temperature at all measurement points was continuously recorded, with the AHU turned on and off. In Figure 6, Figure 7 and Figure 8, the periods in which the AHU was switched on are marked with a yellow background.
The measurement results show that there are homogeneous thermal conditions in the occupied zone of the hall, that the temperature values recorded at various points in the hall are similar, and that the differences do not exceed 1 °C (Figure 6a, Figure 7a and Figure 8a). Furthermore, the temperature of the air exhausted from the hall is slightly (less than 1°C) higher than the average temperature measured in the occupied zone.
In the registered time series, three several-day periods of continuous operation of the control panel can be distinguished; these are hourly intervals: 11–91, 322–427 and 512–592. In the first period, the set temperature inside the hall was 15 °C (to determine the maximum cooling capacity), in the second period, in the range 322–335, the set temperature was 25 °C, and in the following hours of the second period and in the third period, it was 20 °C.
In the first period of continuous operation of the AHU (11–91 h) in the afternoon, the outdoor air temperature was high, at 28–32 °C. Despite the temperature setting in the hall being at 15 °C, the air-conditioning system did not provide the intended air temperature of 25 °C, and the temperature in the hall reached up to 27 °C. In the second period (322–427 h), the maximum outdoor air temperature was lower, at 24–30 °C. During most of the AHU operation time, when the outside air temperature was lower than 28 °C, the air temperature in the hall did not exceed 25 °C, but it was much higher than the set value of 20 °C. It was observed that, despite negligible internal gains and the continuous operation of the cooling system in the first and second periods, the average air temperature in the hall was about 2 °C higher than the average outside air temperature, which demonstrates the poor protection of the hall against heat gains from solar radiation.
In the third period (512–592 h), the maximum outdoor air temperature increased in the following days from 19 °C to 24 °C. The average daily temperature in the hall decreased slightly from 24 °C to 23 °C. Throughout the period, the air temperature in the room was higher than the outside air temperature and the set value of 20 °C.
Based on the temperature variations in the other, shorter, periods of the AHU operation (the AHU is turned on at 7 am and switched off around 7 pm), it can be observed that switching on the installation prevents the temperature from rising during the day, despite the increase in outdoor temperature.

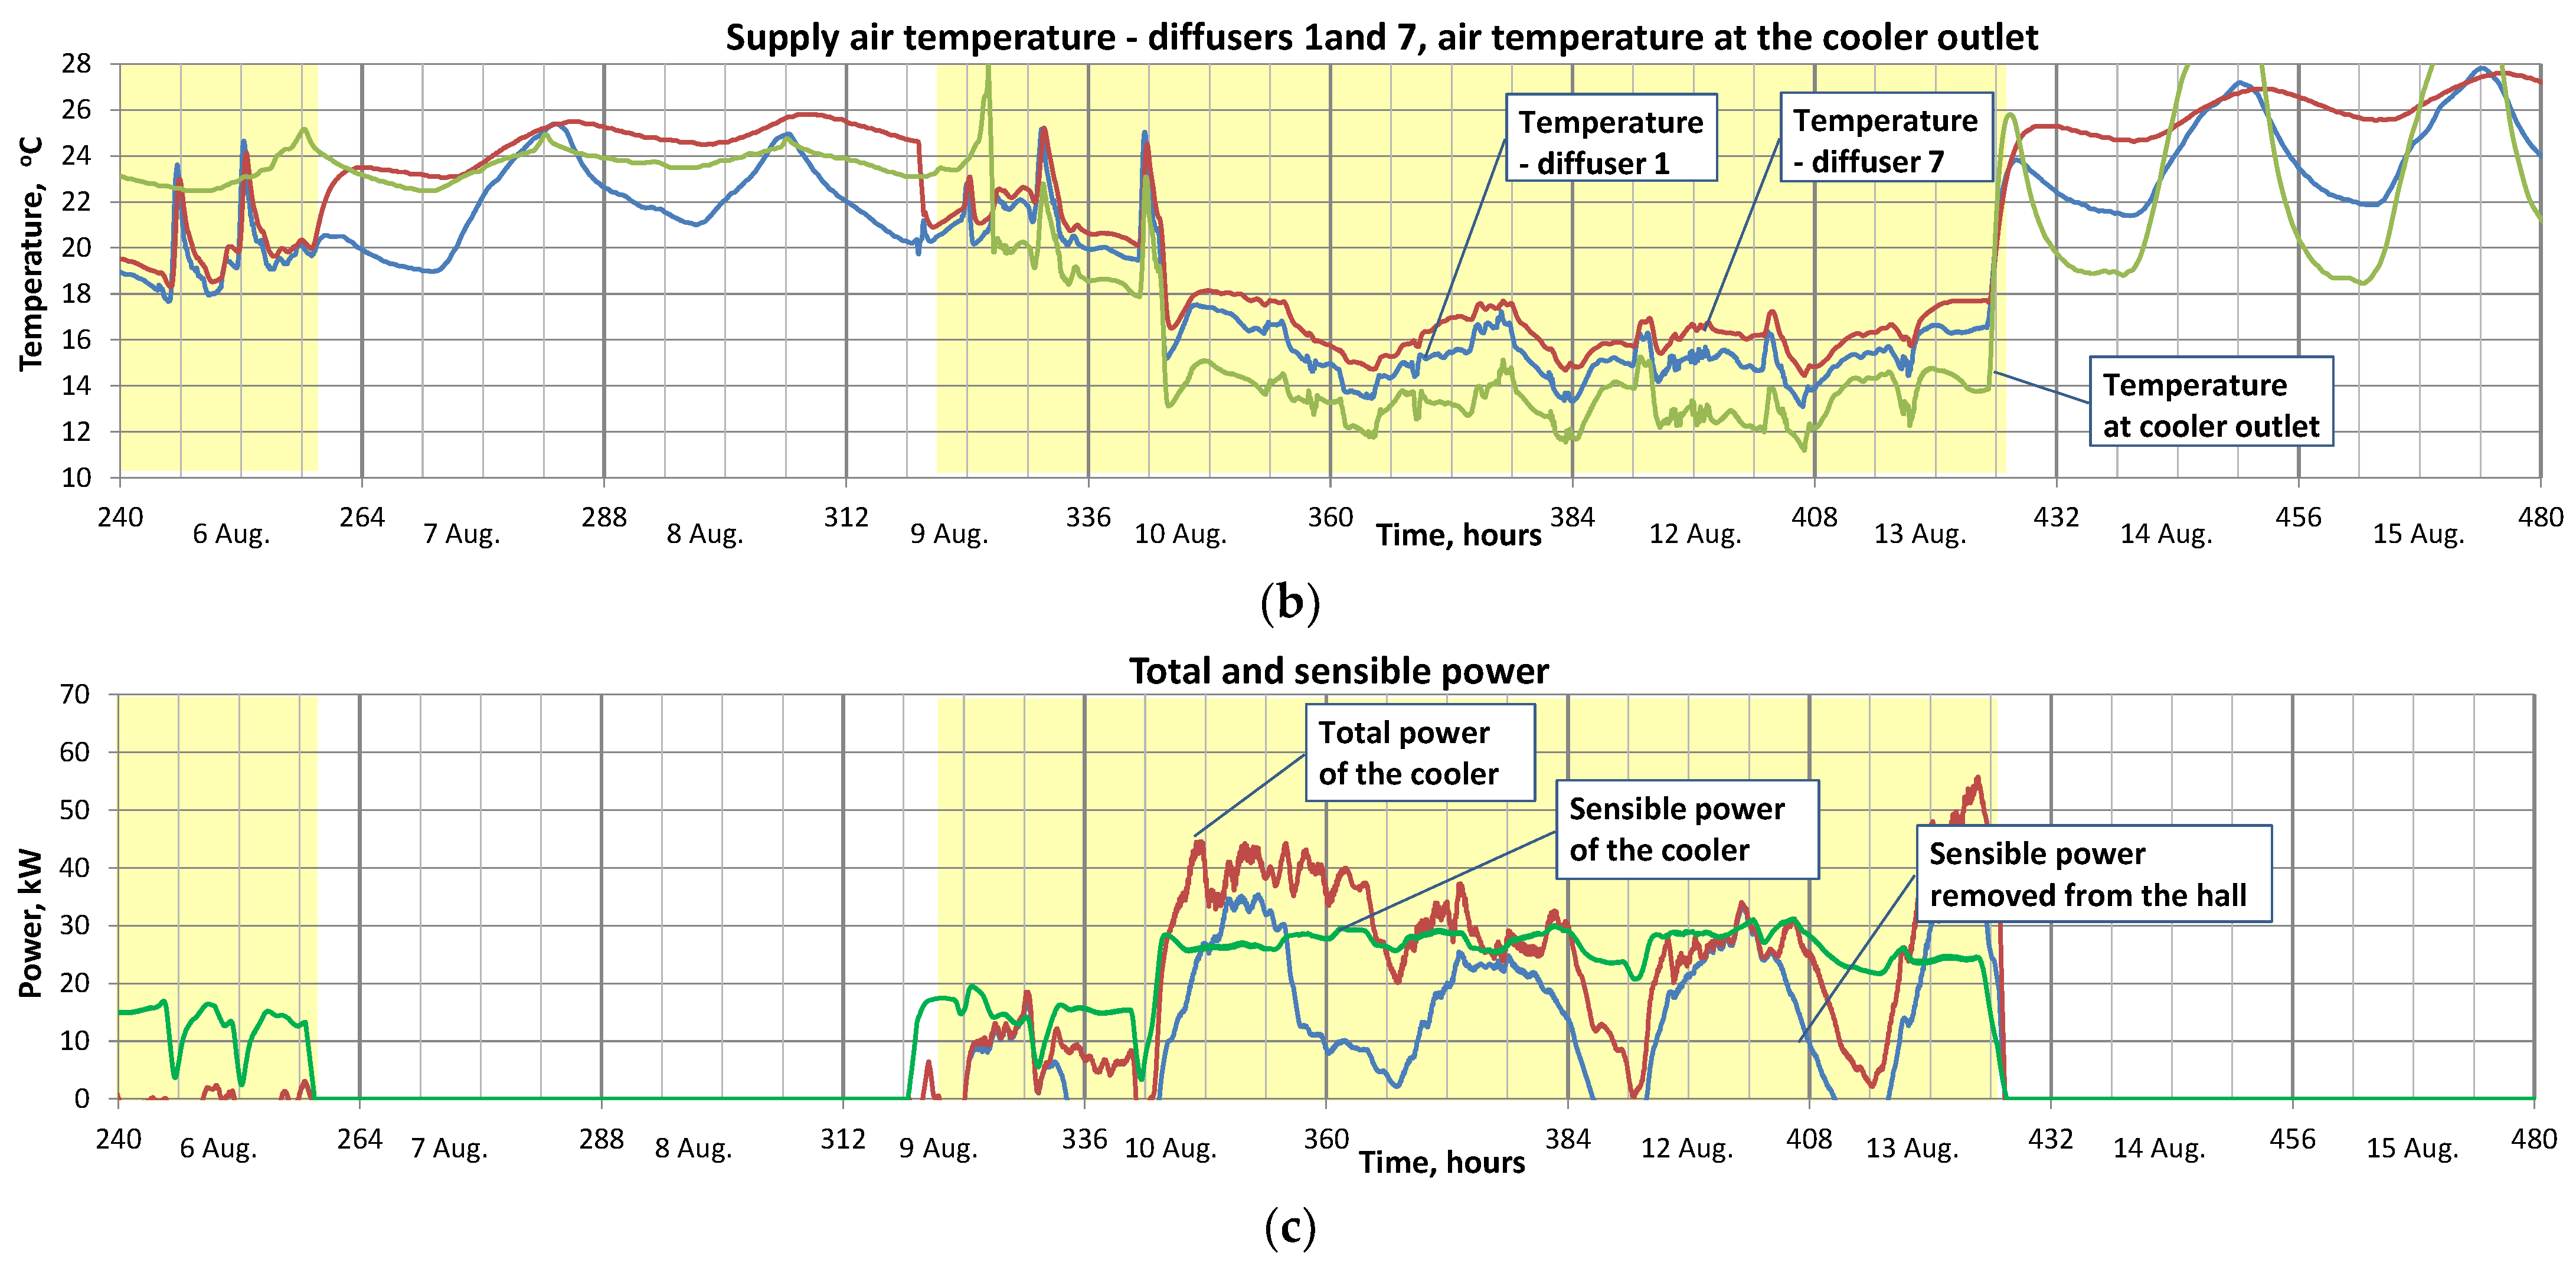
3.4. Determination of the Total and Sensible Power of the Cooling System and the Sensible Power Removed from the Hall

3.4.1. Calculation Procedure

The sensible and total powers of the cooling system were determined on the measured temperature and relative humidity at the inlet and outlet of the cooling coil.
The sensible power of the cooling coil was determined from the equation:
Q s | c o = V · ρ · c p · t o t c ,
where:
V airflow rate, m3/h;
ρ air density, kg/m3;
c p specific heat of dry air, c p = 1.005 kJ/(kg∙K);
t o outdoor air temperature, °C;
t c temperature at the cooling coil outlet, °C.
Analysing the measurement results (Figure 7b and Figure 8b), it was found that, during the AHU operation, the temperature of the air supplied to the hall was on average 2.3 °C higher than the temperature of the air measured directly at the cooling coil outlet. The reason for the increase in air temperature is because the air became heated in the supply fan and in the ducts that supply the air to the diffusers. For the calculation of the cooling coil capacity, it was assumed that the air temperature behind the cooler was 2.3 °C lower than the average temperature measured in diffusers 1 and 7.
The total power of the cooling coil was calculated from the equation:
Q t | c o = V · ρ · h o h c ,
where:
h o enthalpy of outdoor air, kJ/kg;
h c enthalpy of air at the cooling coil outlet, kJ/kg.
The enthalpy of outdoor air and enthalpy at the cooling coil outlet were calculated using the equation:
h o = c p · t o + x o · r o + c w p · t o ,
h c = c p · t c c + x c · r o + c w p · t c ,
where:
r o heat of vaporization, r o = 2501 kJ/kg;
c w p specific heat of water vapor, c w p = 1.84 kJ/kg.
The specific humidity x was determined from the relationship:
x = 0.622 φ · p s p b φ · p s ,
where:
φ relative air humidity;
p b barometric pressure, Pa;
p s saturation pressure of water vapour calculated from the Clausius–Clapeyron equation:
p s = 611.213 · exp 17.5043 · t 241.2 + t .
The sensible power (sensible heat flux) removed from the hall was calculated from the equation:
Q s | s u p e x = V n · ρ · c p · t e x t s u p ,
where:
t e x temperature of the air exhausted from the hall, °C;
t s u p supply air temperature (average of the values measured in diffusers 1 and 7), °C.
The air supply temperature measured at diffuser 7, which is located further from the AHU than diffuser 1, is systematically higher, by 0.5–1.0 °C, than the temperature measured at diffuser 1 (Figure 6b, Figure 7b and Figure 8b). A slightly higher air temperature at diffuser 7 may indicate insufficient thermal insulation of the supply air ducts.
Comparing the time series of the temperature of the air removed from the hall (measured at the inlet to the air handling unit in a shorter period, from 6 August to 25 August) and the average temperature measured inside the hall, it can be noticed that the temperature of the air removed from the hall is slightly, less than 1 °C, higher from the average temperature measured inside the hall. In the calculations for the entire measurement period from 27 July to 25 August, it was assumed that the temperature of the exhaust air was equal to the average temperature in the hall plus 1 °C.

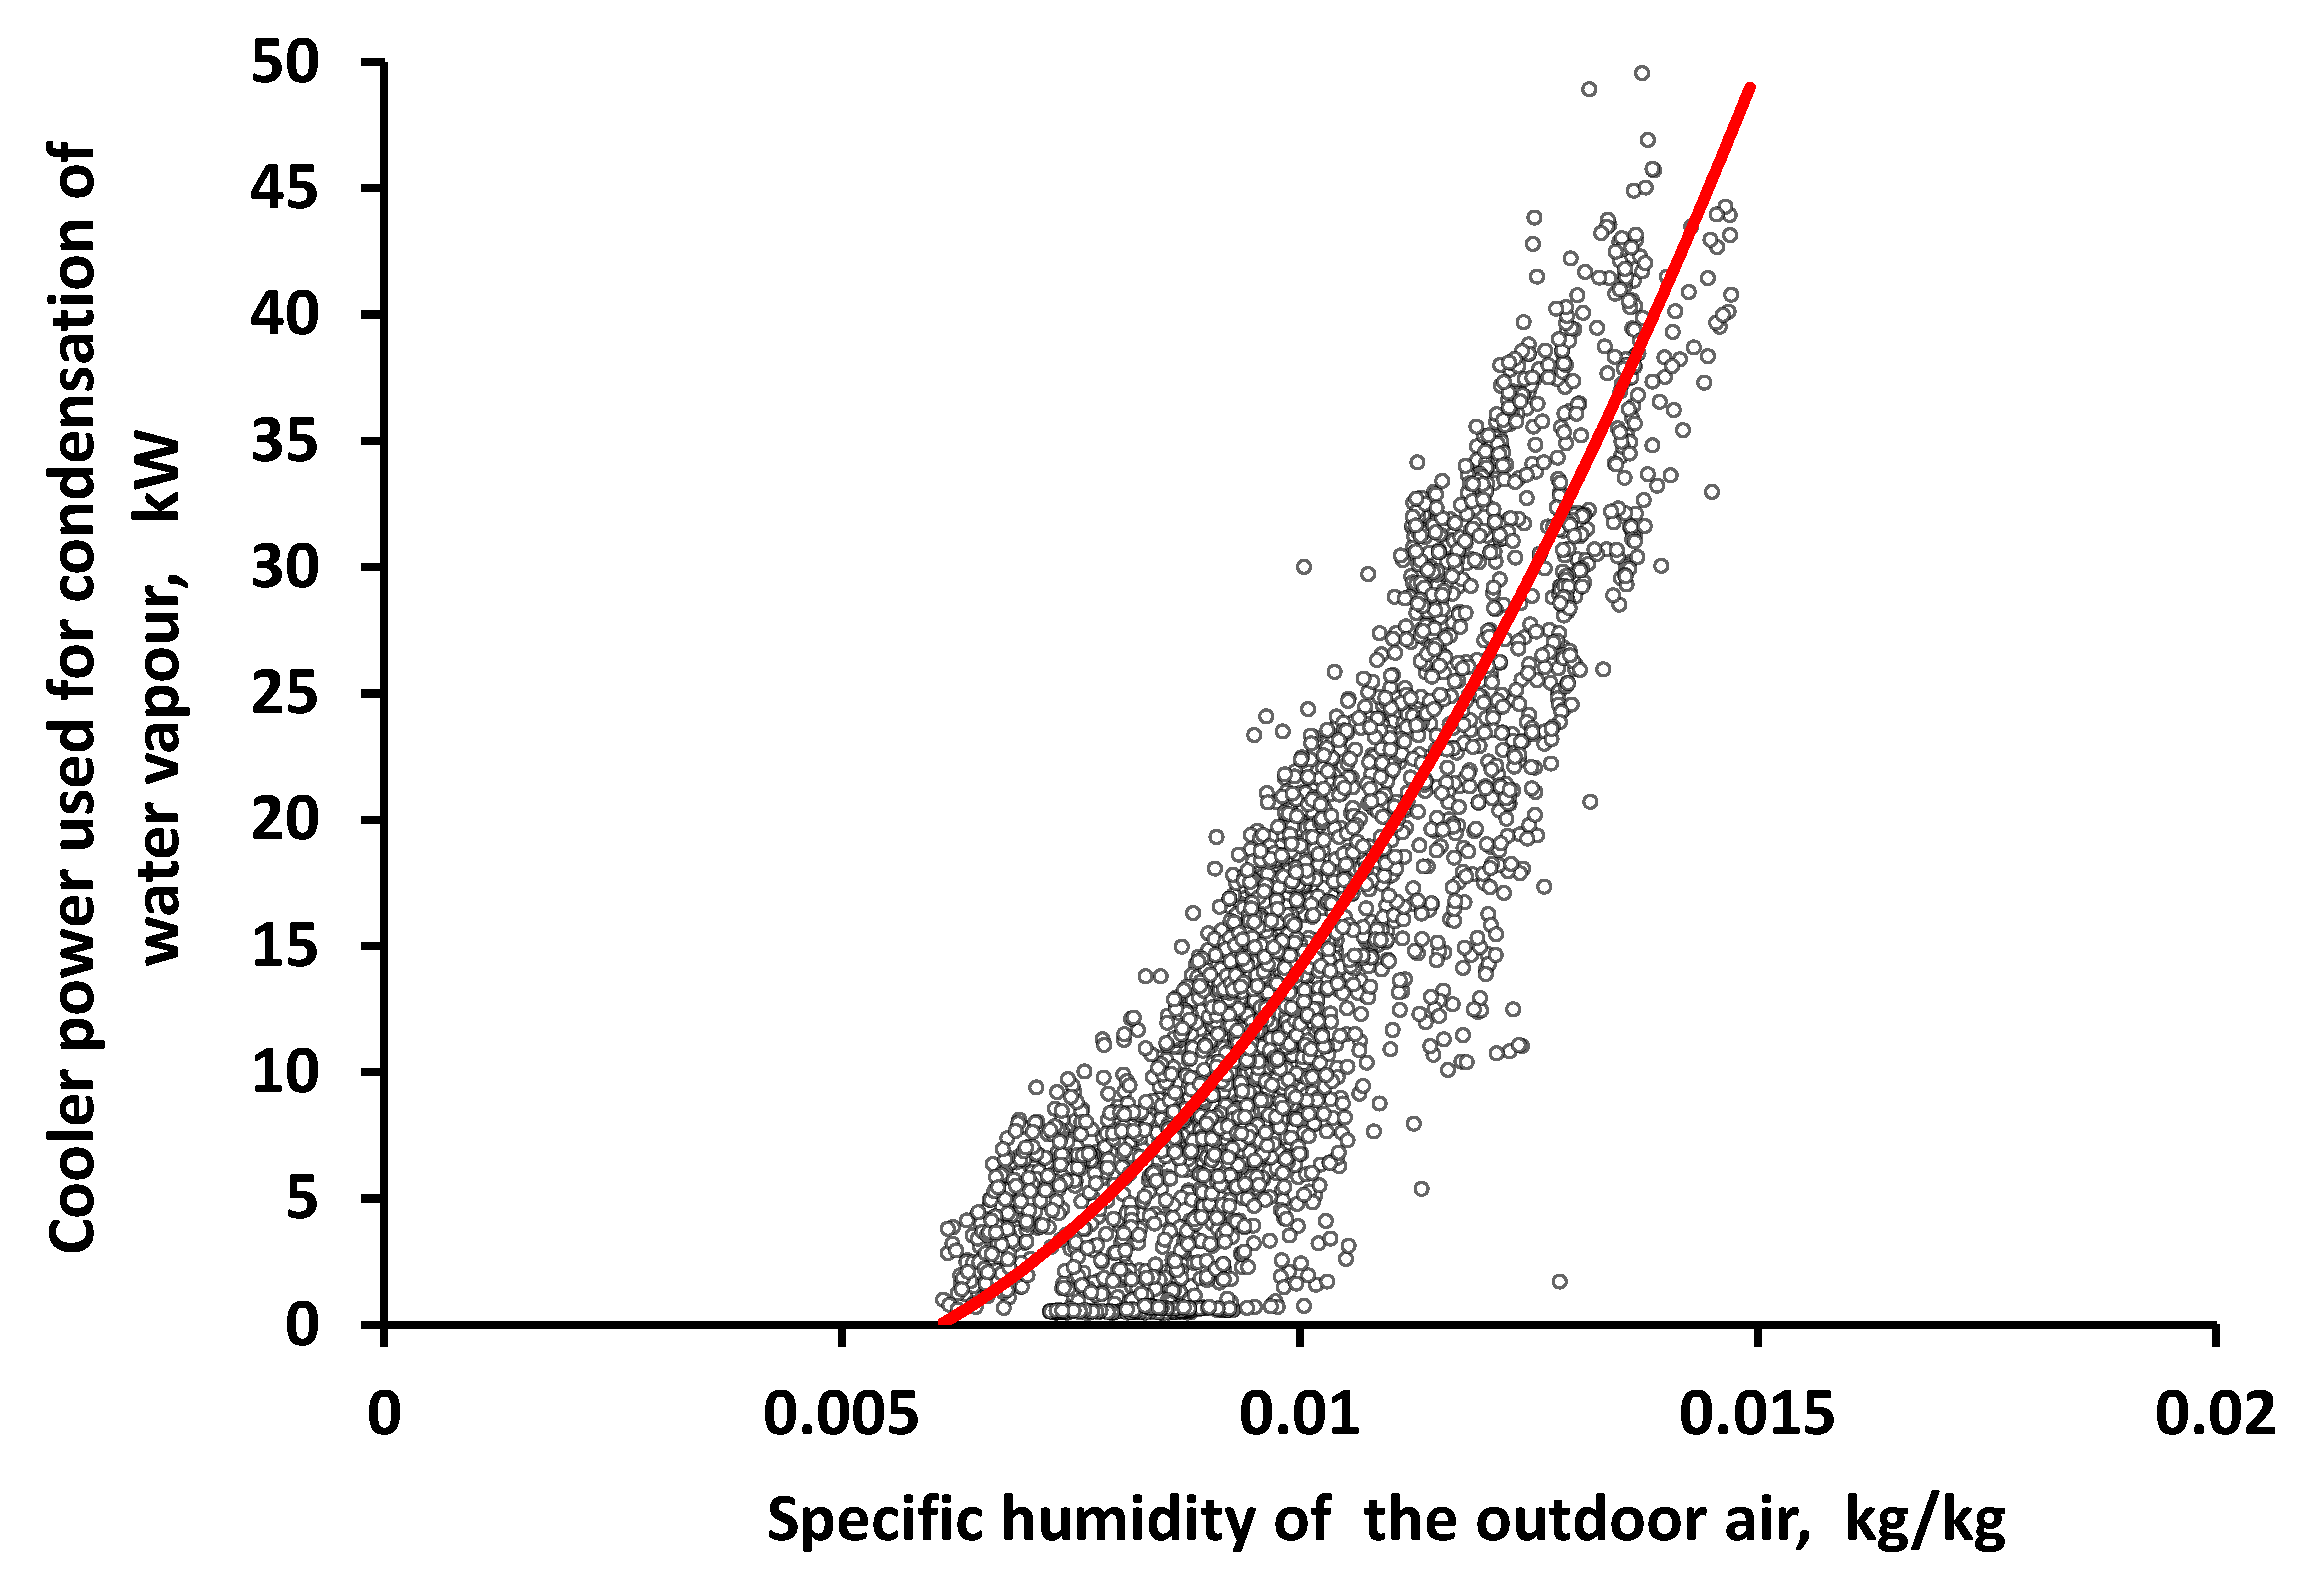
3.4.2. Sensible and Total Power of the Cooling Coil

The maximum total power of the cooling coil, determined based on the measurement data recorded in the period from 27 July to 25 August 2021, was approximately 60 kW (Figure 8c). This value was approximately 20% lower than the assumed value of total power 74.5 kW when selecting the cooling coil. The reason for this difference is that the ventilation airflow rate is lower by approximately 18% than the design value. Due to the fact that the mean surface temperature of the cooling coil is approximately constant and equal to approximately 9 °C, the total power of the cooler decreases with decreasing temperature of the outdoor air. At an outdoor air temperature of approximately 16 °C, the total power of the cooling coil was approximately 25 kW (Figure 8c).
The sensible power is much lower than the total power of the cooler. The reason for this is that the water vapour condenses on the surface of the cooling coil and uses part of the total power for this phase change. The difference between total and sensible power depends on the moisture content in the outdoor air. The latent power (i.e., the difference between the total and sensible power of the cooler) as a function of the specific humidity in the outdoor air is shown in Figure 9. The data presented in Figure 9 were determined based on the temperature and humidity of the outdoor and supplied air recorded with a 5-min time interval during the AHU operation, in the period from 27 July to 25 August. The maximum sensible power of the cooling system, approximately 42 kW, occurred multiple times. The total and sensible power of the cooling coil varies widely with the temperature and moisture content of the outdoor air.
The sensible heat flux removed from the hall depends on the ventilation airflow and the temperature difference between the exhausted and supplied air. The air temperature during the measurement period varied from 13 °C to 19 °C with an average value of approximately 16 °C, and the exhausted air temperature was in the range from 23 to 28 °C with an average value of approximately 25.5 °C. The variability of the sensible heat flux removed from the room is shown in Figure 6c, Figure 7c and Figure 8c.
When the outdoor air temperature is high, the indoor air temperature exceeded the designed value of 25 °C, and most of the time the air temperature in the room was higher than the set value of 15 °C or 20 °C. Meanwhile, the sensible power removed from the hall has not changed significantly, from approximately 28 kW to approximately 32 kW. Therefore, it can be assumed that the maximum heat flux removed by the ventilation air from the hall is approximately 30 kW. The exceptions are two time periods: 240–258 and 318–340, in which the outside air temperature was lower than the set temperature of 25 °C. At that time, the average sensible heat flux removed from the hall was about 18 kW (Figure 7c).

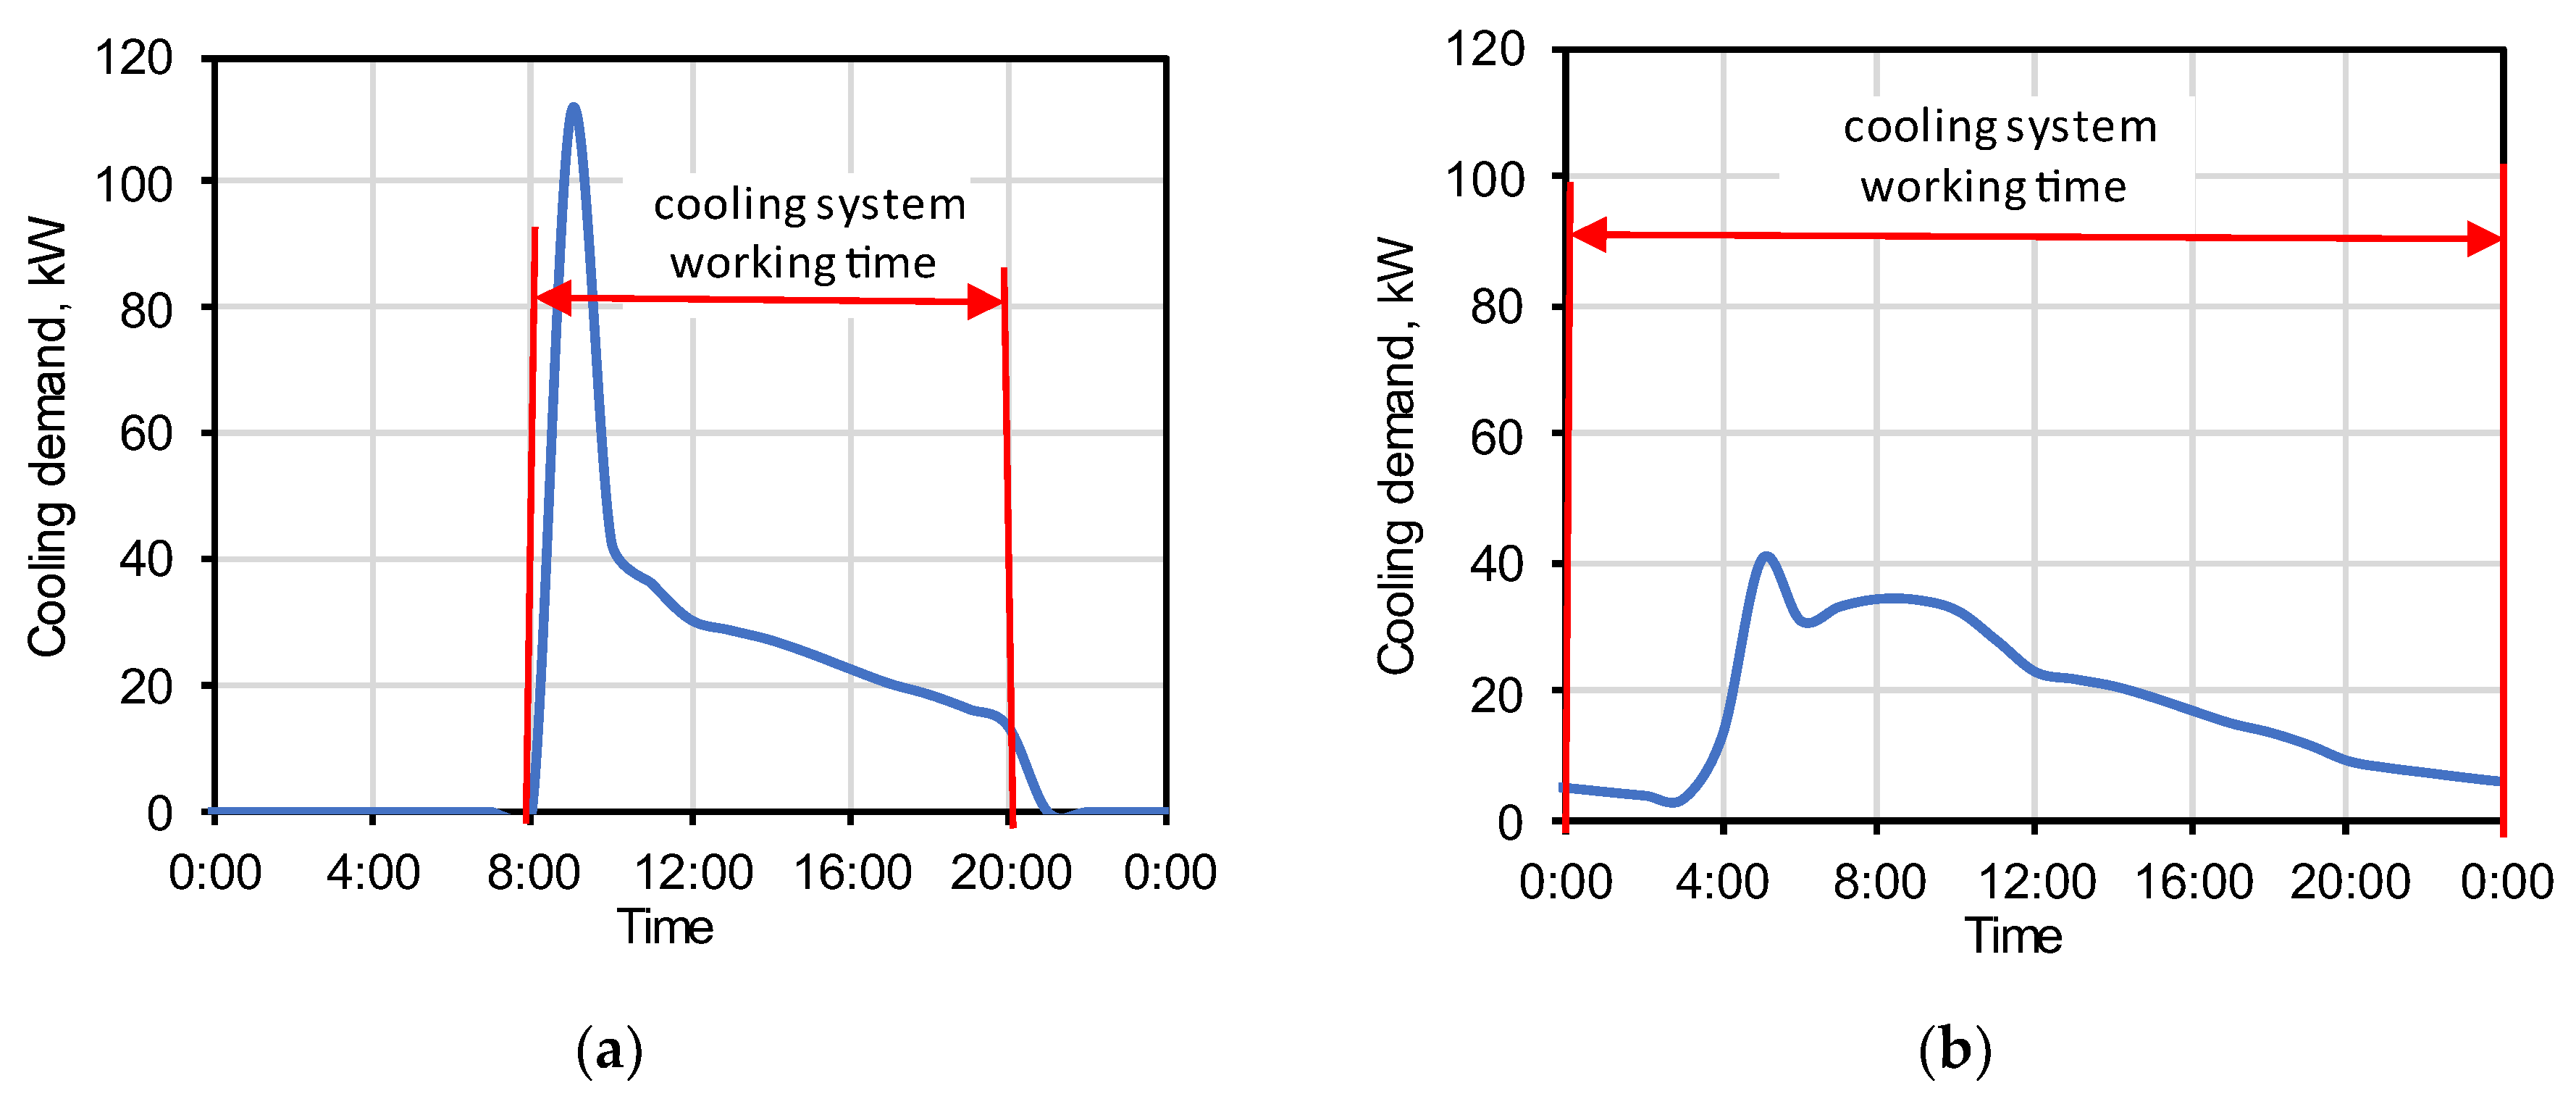
3.5. Thermal Simulation Results

In order to determine the causes of the situation diagnosed during in situ measurements, thermal calculations of the sports hall were carried out in various states of its use. Table 3 presents the simulation results for the eight cases of internal and external heating load. The number of hours in which the cooling demand exceeds 27 kW is also given (see Section 2.1).
Even in an empty room with shades on all windows and without using artificial lighting, the maximum cooling demand exceeded the available cooling power from the supplied air. Cooling power was insufficient in this case only for 1% of the summer season. Even without window shades, the excess was not greater than 5% of the time. These cases are similar to those analysed during the measurements. This confirms that the built thermal model is accurate. Simulations using TMY climate confirmed conclusions regarding the thermal conditions in the hall in the considered period. Case A2 can be treated as a comparative case with situations in which there are people and lighting in the room (it is the case with the lowest external and internal heat gains in the hall) and can be used to assess the impact of the use of shades on windows. In the hall, there are internal shades in a light colour. Visual evaluation showed that the shades are highly transparent and moved away from the window frame (on the sides and bottom of the shades, there are gaps that allow air to circulate between the window area and the room). In this case, a large part of the heat gains result from solar radiation entering the window space into the room. Figure 10 shows the variability of the cooling demand for cases without and with shades in July.
It should be noted that, due to the accumulation of heat in the building partitions, in the hot periods of the season, the cooling demand did not drop to zero even at night. Therefore, a very unfavourable case represents times when the cooling system is turned off at night (unfortunately, this is a typical situation in the hall). In the morning hours, a very large cooling power is therefore required to ensure 24 °C in the hall. Figure 11 shows the cooling demand on a selected day for such a case in comparison with the case wherein there is a 24-h operation of the system (empty-hall cases). After starting the system, the cooling demand was about three times higher than the average value in the following hours of the day and the maximum value when the system operated continuously around the clock. In practice, this means overheating of the room in the initial hours of its use, because the maximum cooling capacity of the system is limited. The time of overheating will depend on the hall load at the time of system start-up.
The next case considered was training in the hall without spectators (20 people doing very hard work). In cases where 50% of the lighting was used and without lighting and at the same time without shades on the windows, the maximum cooling demand exceeded two times the maximum cooling power of 27 kW. When using 50% the cooling power shortage occurred for 42% of the summer season; with lights off, it was for 10% of the season. However, it should be verified as to whether the level of natural lighting in the hall (without artificial lighting) is sufficient for performing sports activities.
In the case of a full audience, the cooling demand significantly exceeded the available cooling capacity (up to 4.5 times). With full occupancy and 100% lighting, the hall can be overheated for more than 60% of the summer season (June–September). Figure 12 shows the variability of cooling demand in one day at full load in the hall.
Due to the fact that the temperature in the sports hall in the summer should not exceed 21 °C, the question of how much the cooling demand increases in such a case was additionally evaluated. The results for the three selected cases are presented below:
  • Empty hall (A2 case): 46.8 kW;
  • Training (B1 case): 62.5 kW;
  • Full audience (C1 case): 128.0 kW.
When meeting the indoor thermal conditions recommended by the standards (Ti = 21 °C), the cooling demand increased by an additional 5% to 10%, depending on the case of hall load. In summary, the calculated maximum cooling demand significantly exceeded the value specified in the design stage of the building; the value was underestimated by 77%. The efficiency of the designed system has been severely underestimated, as a result of which there are inadequate thermal conditions in the hall. When the hall is fully loaded, the gains from the sun (with windows covered with internal roller shades) account for almost 40% of the cooling demand, which is why the installation of much more effective external shields should be considered.

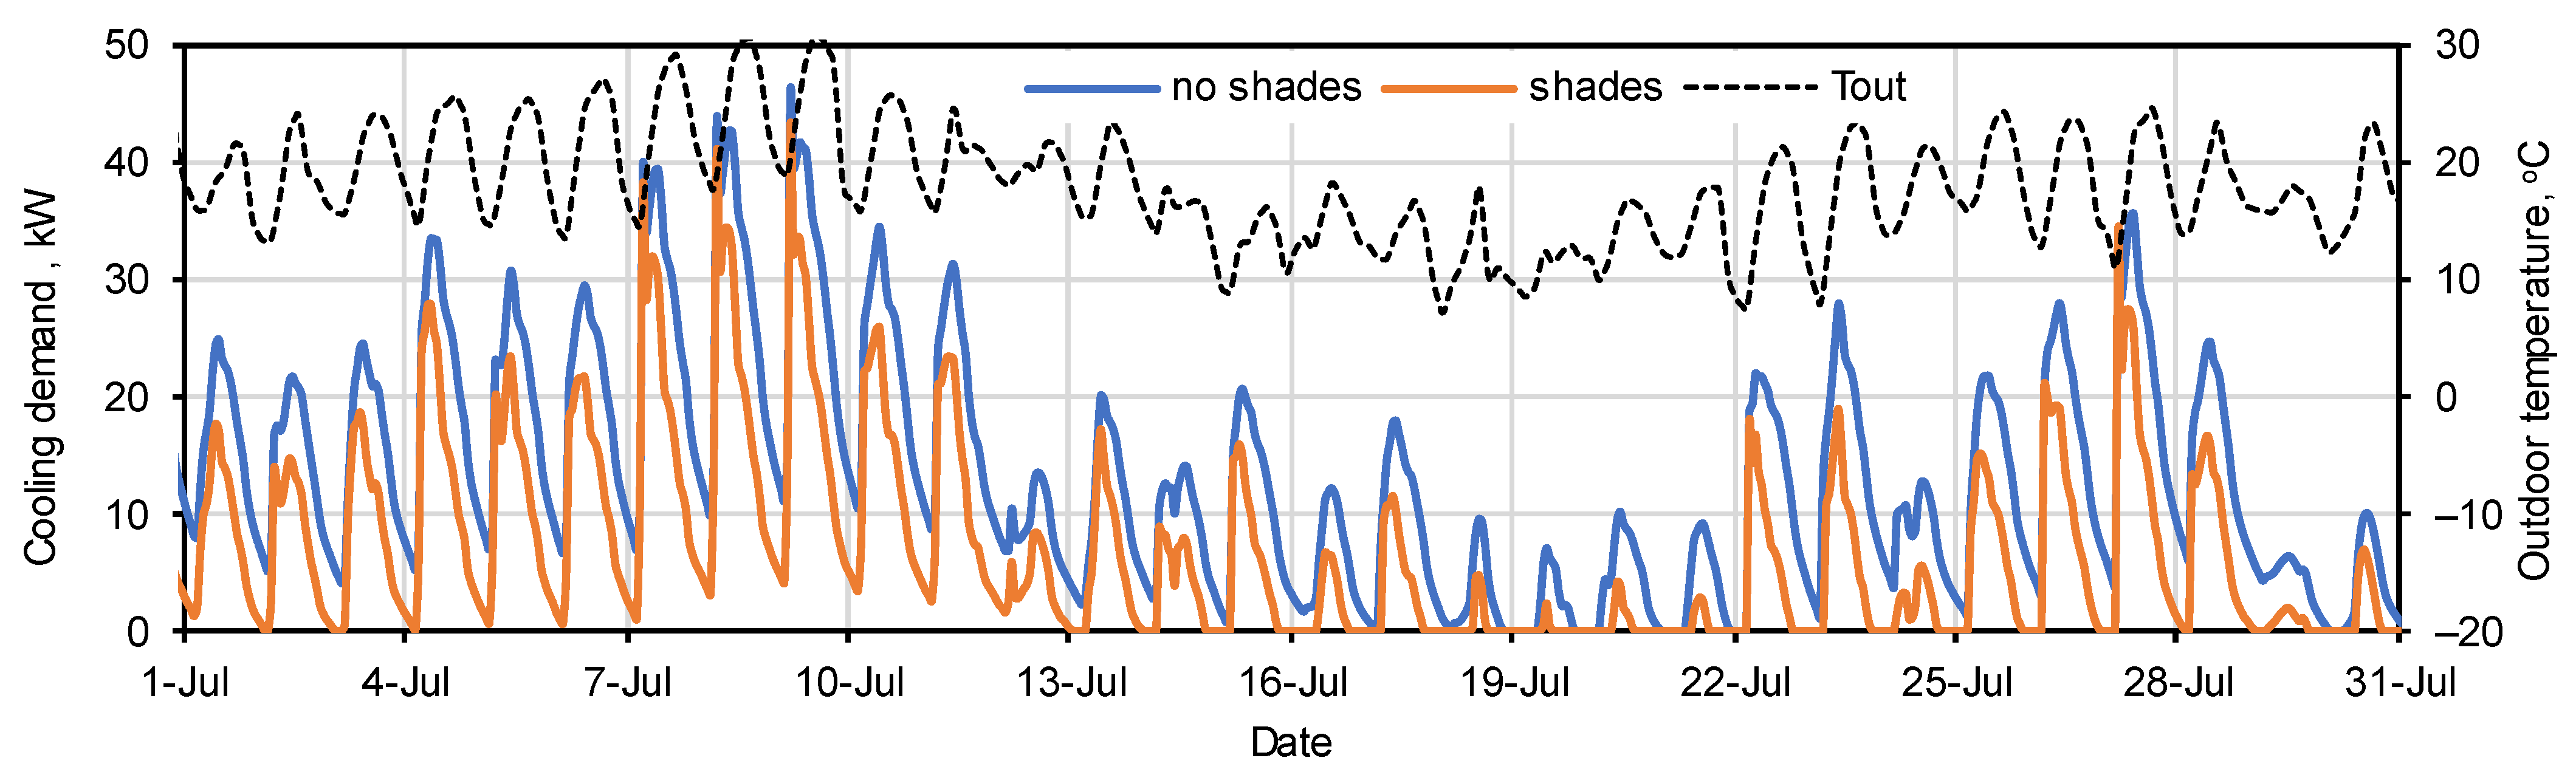
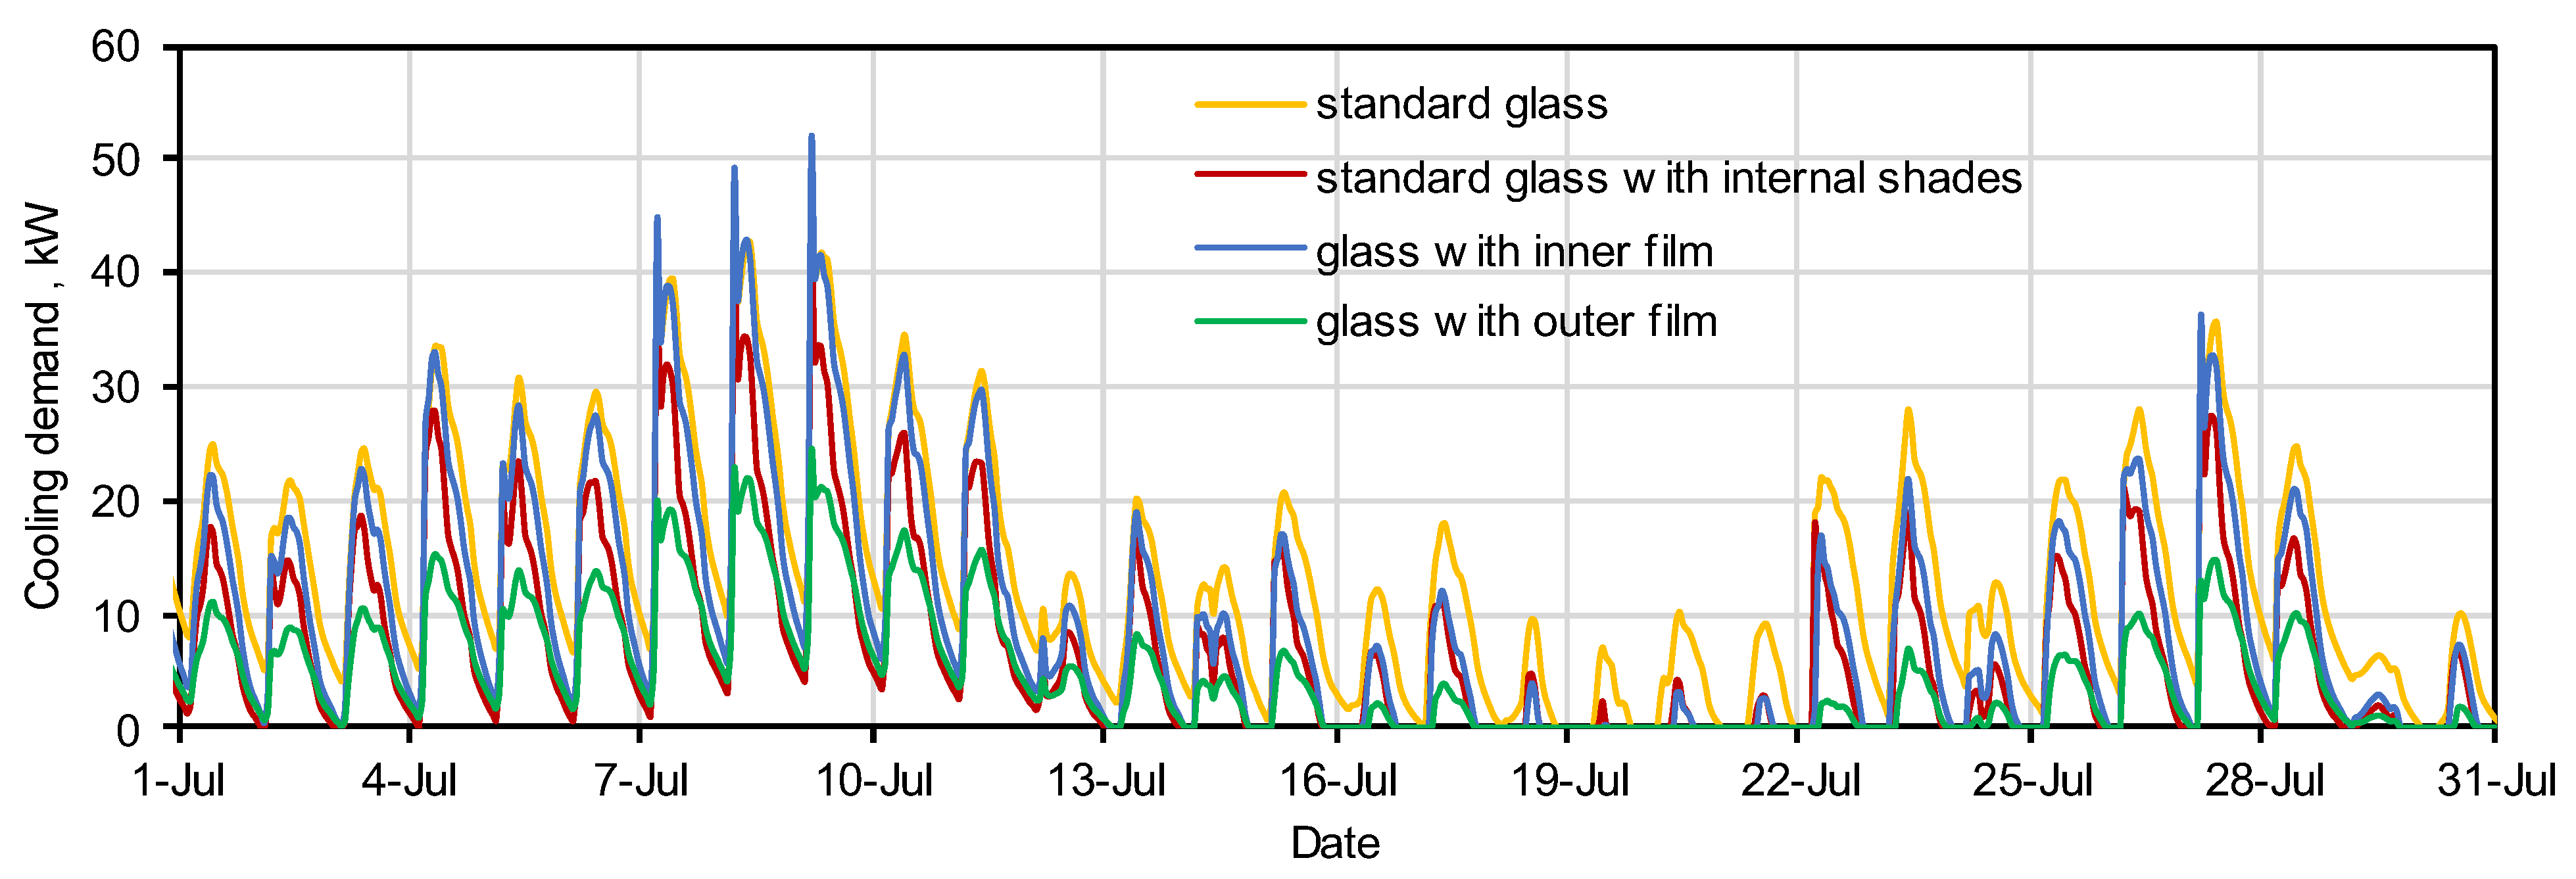
3.6. Evaluation of the Reduction of the Cooling Demand by the Use of Sun Control Window Films

Simulations of cooling demand in the summer season and heat demand in the winter season were performed to check the impact of the use of sun control window film. An empty hall was analysed without taking into account internal gains, represented by case A1 in Table 3. The assumed temperature set point was 20 °C for heating and 24 °C for cooling.
The main objective of solar control films is to reduce the amount of heat entering the building through the windows. Sunscreen films typically have a thin adhesive layer for optimal transparency and a metallic microlayer that evenly covers the film, reflecting infrared solar radiation and resulting in a significant reduction in solar heat gains. The calculations were based on 3M™ Sun Control window films from the Neutral series [34], which do not change the colour of the glass: RE35NEARL inner film and RE35NEARLXL outer film. Table A1 presents a comparison of the optical properties of the standard glazing unit assumed for the analysis and the same glazing unit with internal or external film. Figure 13 and Figure 14 show the variability of the cooling demand in July and the heating demand in January. The results for case A2 are also presented to reflect the difference between placing shades versus sunscreens on the inside or outside of the windows.
The inner film did not meet expectations. Cooling demand in summer was comparable to the “no film” case; the required maximum cooling power may be even higher (Table 4). Additionally, instantaneous heating demand in winter increased significantly in this case. The current solution with blinds on the inside of the window gave better results for both cooling and heating demands. The tested outer film reduced the maximum gains from the sun by almost half, additionally, it slightly affected the instantaneous heating demand in winter.
The methodology for calculating the design heat load in accordance with the EN 12831-1:2017 standard [35] applicable in Poland does not take into account internal and external heat gains. Assuming that the calculations of design heat load in the tested hall were made correctly, it can be assumed that, regardless of the sun-control film used, the heating system should provide the required energy. However, this may affect the annual heat consumption of the building.

4. Conclusions

Based on the inspection and diagnosis performed on the air conditioning system in the sports hall, the following problems were identified:
  • The performed measurements confirmed that, during periods when the outdoor air temperature exceeded 28 °C, the air temperature in the hall exceeded the design temperature of 24 °C to 26 °C even with no or negligible internal heat gains. The currently installed cooler used has insufficient cooling capacity. The sensible heat gains assumed at the design stage amounted to 69 kW, while the identified sensible heat flux removed from the hall was approximately 2.6 times lower. This means that the ventilation airflow of 11,500 m3/h at the temperature of 18 °C cannot ensure the air temperature in the hall at the level of the design assumptions;
  • The thermal conditions in all occupied zones in the hall were uniform. The temperature values recorded at various points in the hall were similar and the differences did not exceed 1 °C. This means that the system used does not ensure the required temperature in different zones of the hall. In this type of facility, in summer the temperature in the field zone should be 6–7 °C lower than in the spectator zone;
  • The total and sensible power of the cooler varied greatly depending on the parameters (temperature and humidity) of the outdoor air. These changes, however, did not have a significant impact on the operation of the cooling system, i.e., the sensible heat flux removed from the hall by the ventilation air. The maximum values of the total and sensible power of the cooler (approximately 60 kW, and 42 kW respectively) were lower by approximately 4.2 kW, which is 20% of the values adopted for the selection of the cooler (74.5 kW and 55.0 kW). The reason for this difference is that the ventilation airflow rate is lower by approximately 18% than the design value;
  • It is not possible to remove heat gains from the room with the current airflow of ventilation (which was confirmed based on measurement data and calculations). Air flow would have to be more than four times greater. It is not possible to supply this amount of air with the existing ventilation system. The expansion of the air system would be ineffective, and an additional (cooperating) cooling system is required;
  • The cooling demand was underestimated at the design stage. The value calculated on the basis of computer simulation significantly exceeds (by 75%) the value estimated at the design stage. Simplified design methods can lead to significant calculation errors and thus problems later in the building operation. A very large part of the heat gains in the hall (approximately 40%) are solar gains due to the large windows. Unfortunately, the internal roller blinds used do not significantly reduce solar gains;
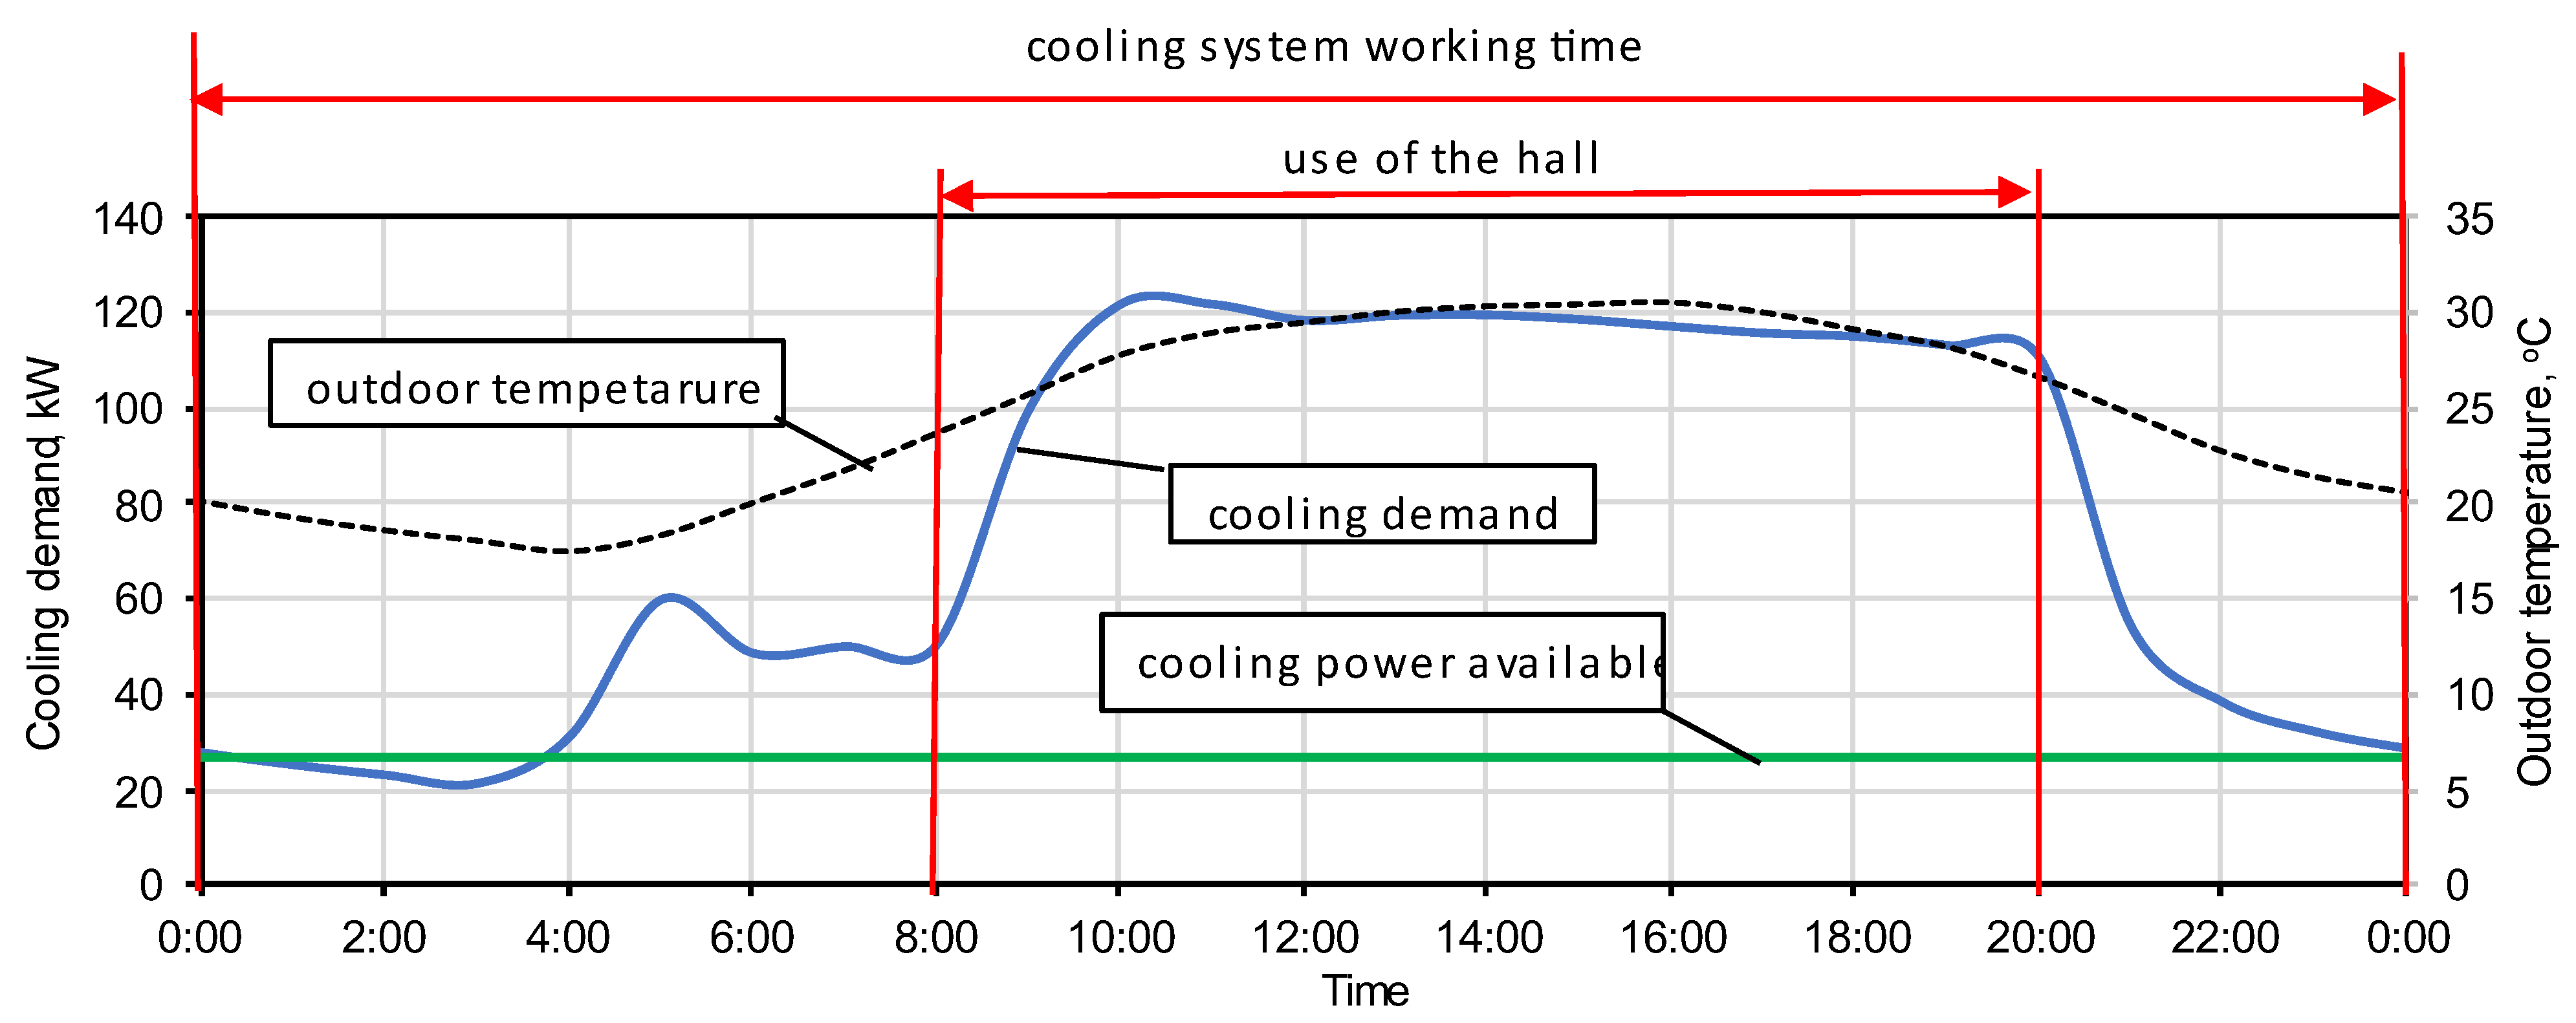
  • The cooling system is turned off at night, adding to the problem of cooling during the day.
In order to solve the problems with cooling the main hall, the following actions are proposed:
  • In the hottest periods of the summer season, it is recommended to operate the cooling system continuously or at least 24 h before using the room;
  • Additionally, the introduction of night cooling on these nights, when there is a significant drop in the outdoor air temperature, is recommended. High-efficiency exhaust fans should ensure intensive air exchange, with outside air inflow through opening hatches or windows. For this purpose, additional exhaust fans (e.g., roof fans) must be installed. Fans should be installed at a certain distance from the opened windows, to ensure intensive mixing and air exchange throughout the hall. The operation of the night cooling system should be automatically controlled. The opening of windows at night should be coupled with the operation of the fans;
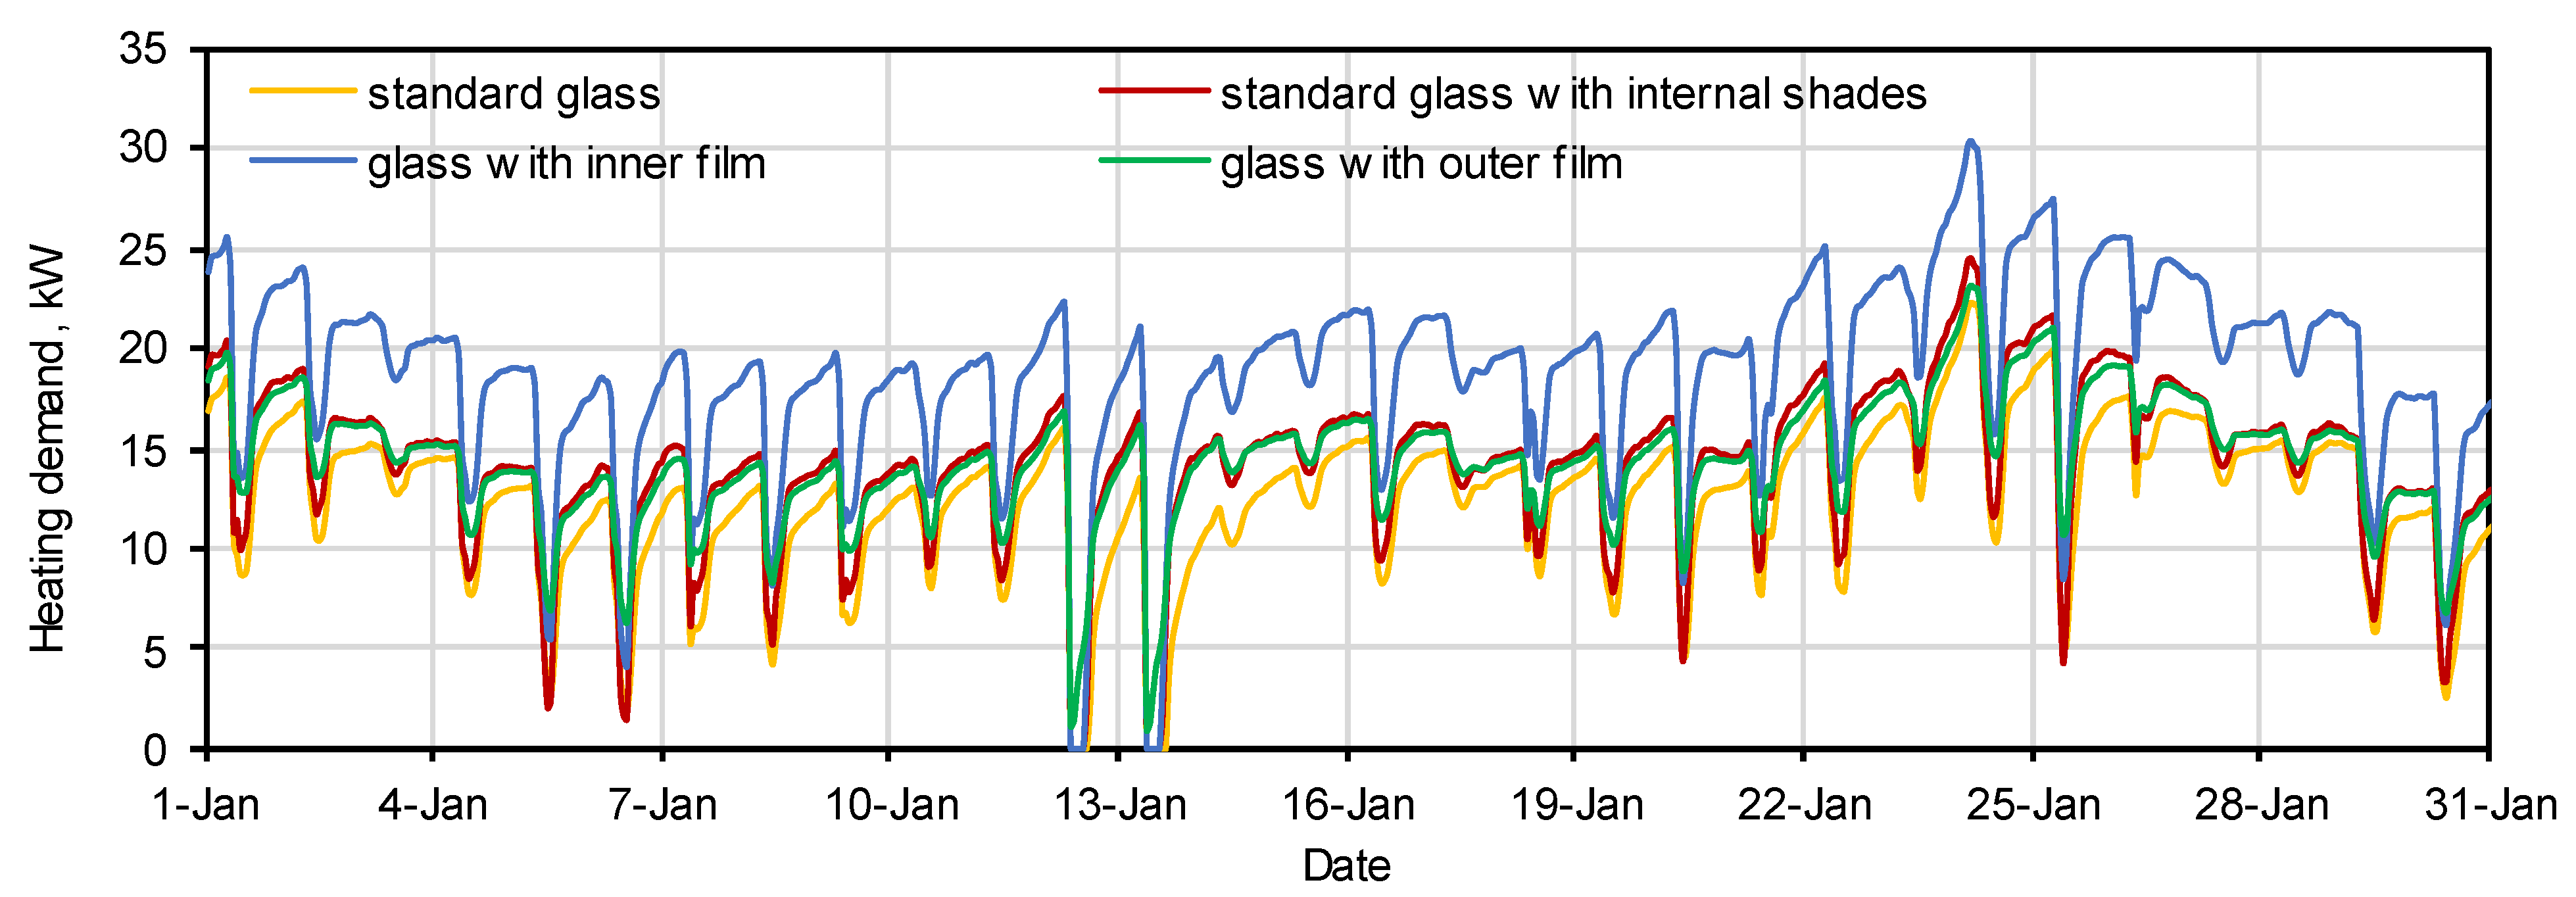
  • The introduction of external sun shields controlled by a solar radiation sensor. Consideration should also be given to the use of more effective sunscreens on the windows, for example, the window films tested in this study that were glued to the outside of the glass;
  • The replacement of light sources with energy-saving sources, e.g., LED ones, to reduce internal heat gains;
  • The use of an additional system based on cooling the internal air in recirculation mode should be considered. This is because, in buildings with high internal heat gains, all-air cooling systems are ineffective, as they require very large volumes of ventilation air. Air distribution in the room is likely to be problematic in this case due to the risk of drafts. The existing ventilation system in the hall ensures the required amount of fresh air defined by hygiene requirements. For this purpose, it is possible to use, for example, fan coil units supplied with coolant from an additional cooling unit, or multi-split units with direct evaporation of the refrigerant. The selection of devices should be based on simulation calculations of the hall’s heat loads. The additional air conditioning system should cooperate with the existing air system, e.g., during periods of high external air temperature and/or with high internal heat gains.

Author Contributions

Conceptualization, M.H., J.F.-G. and J.K.; methodology, M.H., J.F.-G., J.K. and P.K.; software, J.F.-G.; formal analysis, M.H. and J.F.-G.; data curation, P.K. and M.H.; writing—original draft preparation, M.H. and J.F.-G.; writing—review and editing, J.K. and P.K.; supervision, J.F.-G. All authors have read and agreed to the published version of the manuscript.

Funding

This research received no external funding.

Data Availability Statement

Not applicable.

Acknowledgments

The work supported by the Polish Ministry of Education and Science within the research subsidy.

Conflicts of Interest

The authors declare no conflict of interest.

Appendix A

Table A1. Optical properties of glazing units.
ParameterDescriptionStandard Glass Assumed in CalculationsGlass with Inner Film RE35NEARLGlass with Outer Film RE35NEARLXL
SHGCSolar heat gain coefficient0.6230.5520.362
TvisVisible light transmission of the glazing system0.8030.3330.370
RfvisFront surface reflectance of the glazing system0.1240.2470.145
RbvisBack surface reflectivity of the glazing system0.1280.1900.195
TsolSolar transmission of the glazing system0.5390.2680.254
RfsolFront surface solar reflectance of the glazing system0.2800.2160.181
RbsolBack surface solar reflectance of the glazing system0.2670.2030.305
Abs1Solar absorptance for layer 10.0930.0810.522
Abs2Solar absorptance for layer 20.0890.4360.043

References

  1. Ngarambe, J.; Yun, G.Y.; Santamouris, M. The use of artificial intelligence (AI) methods in the prediction of thermal comfort in buildings: Energy implications of AI-based thermal comfort controls. Energy Build. 2020, 211, 109807. [Google Scholar] [CrossRef]
  2. Moran, P.; Goggins, J.; Hajdukiewicz, M. Super-insulate or use renewable technology? Life cycle cost, energy and global warming potential analysis of nearly zero energy buildings (NZEB) in a temperate oceanic climate. Energy Build. 2017, 139, 590–607. [Google Scholar] [CrossRef]
  3. Popiolek, Z. Comprehensive Onsite Thermal Diagnostics of Buildings in Practice, Vol. 5 of the Guidebook of Thermal Diagnostics of Buildings, Gliwice, Politechnika Śląska. Wydział Inżynierii Sr. Energetyki 2013, 447. (In Polish). [Google Scholar]
  4. Hurnik, M.; Specjal, A.; Popiolek, Z.; Kierat, W. Assessment of Single-Family House Thermal Renovation Based on Comprehensive on-Site Diagnostics. Energy Build. 2018, 158, 162–171. [Google Scholar] [CrossRef]
  5. Specjal, A.; Lipczyńska, A.; Hurnik, M.; Król, M.; Palmowska, A.; Popiolek, Z. Case Study of Thermal Diagnostics of Single-Family House in Temperate Climate. Energies 2019, 12, 4549. [Google Scholar] [CrossRef]
  6. Blaszczok, M.; Król, M.; Hurnik, M. On-Site Diagnostics of the Mechanical Ventilation in Office Buildings. Archit. Civ. Eng. Environ. 2017, 10, 145–156. [Google Scholar] [CrossRef]
  7. Hurnik, M.; Blaszczok, M.; Król, M. On-Site Thermal Diagnostics of Cooling Sources for Air Conditioning Systems in Office Buildings. Archit. Civ. Eng. Environ. 2017, 10, 157–163. [Google Scholar] [CrossRef]
  8. Heiselberg, P.K. Ventilation of Large Spaces in Buildings: Analysis and Prediction Techniques; Department of Mechanical Engineering, Aalborg University: Aalborg, Denmark, 1998. [Google Scholar]
  9. Tolis, E.I.; Panaras, G.; Douklias, E.; Ouranos, N.; Bartzis, J.G. Air Quality Measurements in a Medium Scale Athletic Hall: Diurnal and I/O Ratio Analysis. FEB-Fresenius Environ. Bull. 2019, 28, 658. [Google Scholar]
  10. Accili, A.; Ortiz, J.; Salom, J. Energy Strategies to NZEB Sports Hall; Palma de Mallorca: Barcelona, Spain, 2016. [Google Scholar]
  11. Salonen, H.; Salthammer, T.; Morawska, L. Human Exposure to Air Contaminants in Sports Environments. Indoor Air 2020, 30, 1109–1129. [Google Scholar] [CrossRef]
  12. Szczepanik-Ścislo, N. Indoor Air Quality and Control Methods for Mechanical Ventilation Systems inside Large Passive Objects. Tech. Trans. 2020, 117, e2020001. [Google Scholar] [CrossRef]
  13. Ilieș, D.C.; Buhaș, R.; Ilieș, A.; Gaceu, O.; Oneț, A.; Buhaș, S.; Rahotă, D.; Dragoș, P.; Baiaș, Ș.; Marcu, F. Indoor Air Quality Issues. Case Study: The Multipurpose Sports Hall of the University of Oradea. Environ. Eng. Manag. J. 2018, 17, 2999–3005. [Google Scholar]
  14. Seduikyte, L.; Stasiulienė, L.; Prasauskas, T.; Martuzevičius, D.; Černeckienė, J.; Ždankus, T.; Dobravalskis, M.; Fokaides, P. Field Measurements and Numerical Simulation for the Definition of the Thermal Stratification and Ventilation Performance in a Mechanically Ventilated Sports Hall. Energies 2019, 12, 2243. [Google Scholar] [CrossRef]
  15. Szulc, J.; Cichowicz, R.; Gutarowski, M.; Okrasa, M.; Gutarowska, B. Assessment of Dust, Chemical, Microbiological Pollutions and Microclimatic Parameters of Indoor Air in Sports Facilities. Int. J. Environ. Res. Public Health 2023, 20, 1551. [Google Scholar] [CrossRef] [PubMed]
  16. Ma, Y.; Lin, S.; Liu, L.; Pan, Z.; Chen, H.; Peng, Q. Investigation on Indoor Air Quality in the Badminton Hall of Wuhan Sports University in winter Based on Subjective Questionnaire Survey and Field Test. Proceedings 2020, 49, 148. [Google Scholar]
  17. Huang, X.; Chen, G.; Zhao, C.; Peng, Y.; Guo, W. Post Occupancy Evaluation of Indoor Environmental Quality of Sports Buildings at Hot and Humid Climate from the Perspective of Exercisers. Build. Environ. 2022, 226, 109760. [Google Scholar] [CrossRef]
  18. Lenart-Boroń, A.; Drab, D.; Chrobak, J. Microbiological Aerosol, Particulate Matter Concentrations and Antibiotic Resistant Staphylococcus spp. in the Premises of Poland’s Oldest Agricultural School. Atmosphere 2021, 12, 93. [Google Scholar] [CrossRef]
  19. Bralewska, K.; Rogula-Kozłowska, W.; Bralewski, A. Size-Segregated Particulate Matter in a Selected Sports Facility in Poland. Sustainability 2019, 11, 6911. [Google Scholar] [CrossRef]
  20. Fantozzi, F.; Lamberti, G. Determination of Thermal Comfort in Indoor Sport Facilities Located in Moderate Environments: An Overview. Atmosphere 2019, 10, 769. [Google Scholar] [CrossRef]
  21. Dudzińska, A.; Kisilewicz, T. Efficiency of Night Ventilation in Limiting the Overheating of Passive Sports Hall. In MATEC Web of Conferences; EDP Sciences: Les Ulis, France, 2020; Volume 322, p. 01031. [Google Scholar]
  22. Kisilewicz, T.; Dudzińska, A. Summer Overheating of a Passive Sports Hall Building. Arch. Civ. Mech. Eng. 2015, 15, 1193–1201. [Google Scholar] [CrossRef]
  23. SeppȨnen, O. Ventilation Strategies for Good Indoor Air Quality and Energy Efficiency. Int. J. Vent. 2008, 6, 297–306. [Google Scholar]
  24. Dudzińska, A. Efficiency of Solar Shading Devices to Improve Thermal Comfort in a Sports Hall. Energies 2021, 14, 3535. [Google Scholar] [CrossRef]
  25. Gürlich, D.; Reber, A.; Biesinger, A.; Eicker, U. Daylight Performance of a Translucent Textile Membrane Roof with Thermal Insulation. Buildings 2018, 8, 118. [Google Scholar] [CrossRef]
  26. Spunei, E.; Frumușanu, N.-M.; Măran, G.; Martin, M. Technical–Economic Analysis of the Solutions for the Modernization of Lighting Systems. Sustainability 2022, 14, 5252. [Google Scholar] [CrossRef]
  27. Koper, P. Performance Assessment of Air Conditioning Installation in Multifunctional Sports Hall Using CFD Simulations. Archit. Civ. Eng. Environ. 2016, 9, 123–134. [Google Scholar] [CrossRef]
  28. Rajagopalan, P.; Elkadi, H. Thermal and Ventilation Performance of a Multifunctional Sports Hall within an Aquatic Centre. In Proceedings of the Building Simulation, Sydney, Australia, 14–16 November 2011. [Google Scholar]
  29. Mitchell, R.; Kohler, C.; Curcija, D.; Zhu, L.; Vidanovic, S.; Czarnecki, S.; US Department of Energy. Engineering Reference, EnergyPlusTM Version 9.4.0 Documentation; US Department of Energy: Washington, DC, USA, 2020; Available online: https://energyplus.net/Sites/All/Modules/Custom/Nrel_custom/Pdfs/Pdfs_v9.4.0/EngineeringReference.Pdf (accessed on 15 January 2023).
  30. Typical Meteorological and Statistical Climatic Data for Energy Calculations of Buildings. Available online: https://dane.gov.pl/en/dataset/797,typowe-lata-meteorologiczne-i-statystyczne-dane-klimatyczne-dla-obszaru-polski-do-obliczen-energetycznych-budynkow (accessed on 19 February 2023).
  31. ANSI/ASHRAE Standard 55; Thermal Environmental Conditions for Human Occupancy. American Society of Heating, Refrigerating and Air-Conditioning Engineers (ASHRAE): Atlanta, GA, USA, 2017.
  32. Mitchell, R.; Kohler, C.; Curcija, D.; Zhu, L.; Vidanovic, S.; Czarnecki, S.; Arasteh, D. WINDOW 7 User Manual. Lawrence Berkeley National Laboratory, March 2019. Available online: https://Windows.Lbl.Gov/Tools/Window/Documentation (accessed on 14 December 2022).
  33. ISO 7730:2005; Ergonomics of the Thermal Environment—Analytical Determination and Interpretation of Thermal Comfort using Calculation of the PMV and PPD Indices and Local Thermal Comfort Criteria. International Organization for Standardization: Geneva, Switzerland, 2005.
  34. 3MTM Sun Control Window Film Neutral Series. Available online: https://www.3m.com/3M/en_US/p/d/b00016672/ (accessed on 19 February 2023).
  35. EN 12831-1:2017; Energy Performance of Buildings—Method for Calculation of the Design Heat Load—Part 1: Space Heating Load, Module M3-3. European Committee for Standardization: Brussels, Belgium, 2017.
Figure 1. Hall: view on the stands (a); view on the windows (b); masonry and roof construction packages (c).
Buildings 13 01185 g001
Figure 2. Sketch of the hall with diffusers (marked red, long-range jet nozzles 1–7, swirl diffusers 8–14) and the location of the temperature and humidity measurement points (marked blue in circles).
Buildings 13 01185 g002
Figure 3. View of the geometry of the sports hall.
Buildings 13 01185 g003
Figure 4. Visualization of the air stream from the nozzle directed downward (a) and upwards (b) in the 80th second.
Buildings 13 01185 g004
Figure 5. Visualisation of the air stream from the swirl diffuser in the 30th second.
Buildings 13 01185 g005
Figure 6. Time series of air temperature and the total and sensible power of the cooling system (27 July to 5 August): outdoor and indoor temperature in the hall (a); supply air temperature-diffusers 1 and 7 (b); total and sensible power (c).
Buildings 13 01185 g006
Figure 7. Time series of air temperature and the total and sensible power of the cooling system (6 August to 15 August): outdoor and indoor temperature in the hall (a); supply air temperature-diffusers 1 and 7, air temperature at the cooler outlet (b); total and sensible power (c).
Buildings 13 01185 g007aBuildings 13 01185 g007b
Figure 8. Time series of air temperature and the total and sensible power of the cooling system (16 August to 25 August): outdoor and indoor temperature in the hall (a); supply air temperature-diffusers 1 and 7, air temperature at the cooler outlet (b); total and sensible power (c).
Buildings 13 01185 g008
Figure 9. Cooler power used for condensation of water vapour as a function of the specific humidity of the outdoor air.
Buildings 13 01185 g009
Figure 10. Cooling demand for cases A1 and A2.
Buildings 13 01185 g010
Figure 11. (a) Cooling demand on a selected day for the case when the cooling system is turned off at night—case A3—and (b) for the case when the system operates around the clock—case A2.
Buildings 13 01185 g011
Figure 12. Cooling demand on the selected day (full load of the hall).
Buildings 13 01185 g012
Figure 13. Cooling demand in July (empty hall).
Buildings 13 01185 g013
Figure 14. Heating demand in January (empty hall).
Buildings 13 01185 g014
Table 1. List of measuring instruments.
InstrumentTypeMeasurement Range and
Uncertainty in Measurement
Purpose of Measurement
BalometerACCUBALANCE II40–4000 m3/h
±3% of measured value
Measurement of volume flux of air supplied from diffusers
ThermometerTesto 110−50–150 °C
±0.2 °C (−25–75 °C)
Measurement of the temperature of air supplied from diffusers
Data logger APARAR235Temperature: −30–80 °C, ±0.2 °C
Relative humidity: 0–100%, ±3% (20–80%), ±3–5% (in the remaining range)
Measurement of air temperature and relative humidity: supply from the diffusers; in the occupied zone (7 meas. points); in the air-conditioning unit (2 meas. points)
Smoke generatorAntari 3000Visualization of supplied jets
Table 2. Supply airflow rate and air temperature.
DiffuserDesign Airflow Rate m3/hMeasured Airflow m3/hMeasured Air Temperature, °C
189076017.8
289068018.0
389082018.0
489061016.7
589064017.9
689073017.9
789060017.7
875070017.1
975067017.8
1075065017.8
1175062018.5
1275061017.9
1375062018.6
1475064018.5
Total design airflow rate: 11,500 m3/h; total measured airflow rate: 9350 m3/h; average temperature: 17.9 °C.
Table 3. Cooling demand calculation results.
CaseOccupantsShadesLightingCooling System Working TimeMax Cooling Demand Qj, kWNumber of Hours with Cooling Demand > 27 kW (Percentage of Time)
A1nononoall day45.8126 (4.3%)
A2noyesnoall day42.935 (1.2%)
A3no yesno8 am to 8 pm111.774 (2.5%)
B1training (8 am to 8 pm)yes50%all day58.31221 (41.7%)
B2training (8 am to 8 pm)nonoall day48.4300 (10.2%)
C1full audience (8 am to 8 pm)yes100%all day122.31868 (63.8%)
C2full audience (8 am to 8 pm)yes50%all day100.61663 (56.8%)
C3full audience (8 am to 8 pm)nonoall day90.51584 (54.1%)
Table 4. Cooling and heating demand results for cases with film on windows.
ParameterStandard Glass Assumed in CalculationsStandard Glass with Internal ShadesGlass with Inner Film RE35NEARLGlass with Outer Film RE35NEARLXL
Maximum heating demand, kW22.824.530.423.2
Maximum cooling demand, kW45.842.951.424.1
Disclaimer/Publisher’s Note: The statements, opinions and data contained in all publications are solely those of the individual author(s) and contributor(s) and not of MDPI and/or the editor(s). MDPI and/or the editor(s) disclaim responsibility for any injury to people or property resulting from any ideas, methods, instructions or products referred to in the content.

