1. Introduction
1.1. Background of Research
In order to reduce greenhouse gas emissions and mitigate global warming, the 2015 Paris Agreement [
1] has set the goal of achieving net zero emissions by the second half of this century. In the United States and Europe, building energy consumption accounts for almost 40% of primary energy [
2]. Building energy conservation is one of the most effective ways to save energy and reduce CO
2 emissions. The building energy regulations published in 2016 by the United States Department of Energy require an increase of some 30% in energy efficiency compared to those published ten years previously [
3,
4]. Sweden has set a building energy saving target of 20% by 2020 and 50% by 2050 compared with 1995 standards [
5]. Belgian regions are considering increasing building energy performance levels to “low energy” or “near zero energy” in line with the Energy Performance of Building Directive (EPBD) [
6]. As one of the world’s largest carbon dioxide emitters, China proposes to reach carbon peak before 2030 and strives to achieve carbon neutrality before 2060. Reducing building energy use will therefore play a major role in reducing China’s CO
2 emissions. The Implementation Path issued by the Ministry of Housing and Urban-Rural Development of the People’s Republic of China [
7] proposes that all new residential buildings should achieve ultra-low energy performance by 2045.
1.1.1. Ultra-Low Energy Buildings
With reference to the Technical Standard for Near Zero Energy Buildings (issued by the Ministry of Housing and Urban-Rural Development of the People’s Republic of China) [
8], the term ultra-low energy buildings in this study refers to buildings that adopt energy efficient measures, such as high levels of thermal insulation and high envelope airtightness, to reduce building energy demand and achieve an energy efficiency level that is 50% higher than the current energy efficiency standards [
9,
10]. The current Design Standard for Energy Efficiency of Residential Buildings in Hot Summer and Cold Winter Zones JGJ134 [
10] stipulates that the thermal envelope and HVAC design of buildings should adopt energy conservation measures to control energy consumption for heating and air conditioning within specified limits. Therefore, reducing the energy demand of ultra-low energy buildings in this study only includes heating and air conditioning energy consumption. The 2010 European Union’s EPBD [
11] defines a near-zero energy building as a building with very high energy performance, requiring almost zero or very low energy that can be extensively covered by renewable energy produced on or near the site. Zeiler et al. [
12] state that the two main design strategies for near-zero energy buildings are to minimize energy demand through energy efficient measures and to use renewable energy sources. In this study, the ultra-low energy building is a near-zero energy building, without renewable energy utilization.
Furton et al. [
13] proposed that climate change has a significant impact on heating and cooling energy consumption, as well as o indoor thermal comfort. Although practice has proven that ultra-low energy buildings can greatly reduce energy consumption, it is still difficult to promote ultra-low energy buildings in the Hot Summer and Cold Winter Climate Zone of China. Established ultra-low energy buildings standards, such as the Passivhaus, are based on operational conditions of “full space and continuous-time” for heating and cooling [
14], which do not correspond to typical energy-use behavior in China. The energy efficiency potential for a technical solution will vary greatly along with energy-use behavior [
15]. Therefore, it is necessary to develop behavior models that match the characteristics of energy-use behavior for a particular region to predict systems optimization in practice. Mlecnik et al. [
16] monitored the summer and winter thermal comfort of several near-zero energy buildings in Germany, Austria and Switzerland, and found that between 9% and 49% of the residents were dissatisfied, pointing out that a building envelope with high performance thermal insulation and high airtightness tends to make it difficult to remove heat from indoor spaces. The heat gains from lighting, appliances and occupants are trapped inside, resulting in uncomfortably high temperatures indoors [
17]. In addition, the high-performance thermal insulation materials, door and window components and service systems used in ultra-low energy buildings are often “new products” and “new technologies” at this stage, lacking the economic adaptability to social conditions, and have relatively high costs. The problem of high investment costs resulting from the single pursuit of low energy solutions is a well documented decarbonization challenge [
12,
18,
19]. Szalay et al. [
20] proposed that the additional material requirements of increased insulation has also resulted in a slight increase in global costs of buildings. For example, the incremental cost of a demonstration project of an ultra-low energy building in Qinhuangdao, China, was some 600 yuan/m
2 higher [
21], and such a high incremental cost makes the ultra-low energy building less economically effective, which compromises its wider uptake [
22].
1.1.2. Characteristics of Energy Use Behavior in the Hot Summer and Cold Winter Climate Zone of China
Human energy use behavior is an important factor affecting building energy consumption [
23]. The climate in China varies greatly among its regions, resulting in different characteristics of energy use behavior and building energy consumption in different climate zones. The Thermal Design Code for Civil Buildings (GB 50176-93, 1993) [
24] defines five climate zones based on the temperatures of the coldest and hottest months, including Severe Cold Zone (t
min·m ≤ −10 °C), Cold Zone (10 °C < t
min·m ≤ 0 °C), Hot Summer and Cold Winter Zone (0 °C < t
min·m ≤ 10 °C, 25 °C < t
max·m ≤ 30 °C), Hot Summer and Warm Winter Zone (10 °C < t
min·m,25 °C < t
max·m ≤ 29 °C), and mild Zone (0 °C < t
min·m ≤ 13 °C,18 °C < t
max·m ≤ 25 °C). The relative humidity in the Hot Summer and Cold Winter Zone is 70–80% or even higher throughout the year. It has long summers and winters (summer: early May to late September; winter: mid-December to mid-February). The average external temperature in the coldest month is 0–10 degrees Celsius, and the average external temperature in the hottest month is 25–30 degrees Celsius. According to Chinese design regulations (GB 50176-93, 1993) [
24] and traditional customs, there is no requirement for district heating in the Hot Summer and Cold Winter (HSCW) climate zone, and residents mostly adopt a “part-time, part-space” pattern of intermittent heating in separate rooms. The decision to turn on the air conditioning is usually determined by a combination of factors, such as whether people are in the room or whether they can tolerate the existing temperature, and only 1/3 to 1/2 of the rooms are cooled during the cooling period, with an average cooling time of only 8 to 12 h. This “part-time, part-space” energy use pattern not only meets the thermal comfort requirements of residents, but also conforms to the sustainable development concept of harmonious coexistence between human beings and nature [
25], and the average energy saving is 49.7% when compared to the “continuous-time, full-space” operation pattern commonly assumed in previous studies [
23].
To sum up, it is of great significance to approach energy efficient technologies for ultra-low energy buildings from three directions: energy saving, improving the indoor thermal environment, and enhancing economic efficiency, based on the characteristics of energy-use behaviors in the region.
1.2. Literature Review
1.2.1. Occupant Energy-Use ‘Action Behavior’ Model
‘Action behavior’ refers to the regulation and control of various types of equipment indoors, which determines the change of equipment status and has a large impact on building energy consumption [
2]. It is the main factor that distinguishes “part time, part space” from “continuous time, full space” energy use behavior. Four types of models are often used to describe the action behavior of occupants: fixed-rest models, statistical regression models such as ANN and polynomials based on large amounts of measured data, threshold models, and conditional probability models.
Crawley and Yan used the fixed occupant schedule model [
26,
27] to describe the hourly operation status of room equipment and the occurrence of occupant actions. This is also the most common occupant behavior model used in building energy simulation software, such as the “full space, continuous time” mode. Liu et al. [
28] obtained a large amount of data through field measurements in 34 buildings and used neural networks, gradient-enhanced decision tree fitting to establish behavioral models in order to improve the accuracy of energy consumption simulations. Indraganti et al. [
29,
30] investigated the behavior of air conditioner use in India and Japan in large samples and used linear relations, polynomial, and logistic nonlinear relationships to establish statistical correlations between air conditioner usage rates (i.e., the proportion turned on) and indoor and outdoor temperatures. Jian [
31] proposed the concept of “tolerance temperature” to describe the behavior of residents when they “turn on the air conditioner when they feel hot”, and only turn on air conditioning when it exceeds this temperature, which is similar to Newsham’s model of “closed curtains when feeling sunny” [
32]. These are simple threshold models describing the feedback behavior within the environment. The threshold model reflects the interaction between human behavior and the environment, which is similar to the fixed occupant schedule method. Wang [
33] proposed the “feedback-based” and “time-based” conditional probability models to describe the occupants’ control in relation to turning on and off the air conditioning equipment. The “feedback-based” model is environment-related, meaning that actions are influenced and stimulated by environmental factors, so it is a threshold model; the “time-based” model describes time-related actions, meaning that actions occur at certain special moments.
The conditional probability model is stochastic and can accommodate both environment-independent and environment-feedback features, the feature parameters are simple and clear, and the underlying data are relatively easy to obtain. The four models are summarized in
Table 1.
1.2.2. Multi-Objective Optimization (MOO) Approach towards Low Energy Buildings
In the field of building performance simulation, various optimization methods are used to solve multi-objective problems. There are two common approaches to the problem of optimizing buildings with the goals of reducing energy consumption or improving the indoor thermal environment, (1) the classical weighted sum approach [
34] and (2) the Pareto-dominance approach [
35]. The classical weighted sum approach converts MOO into a single scalar objective problem by attaching a corresponding weighting (e.g., weighting and algorithms) to individual objectives based on mathematical principles [
36]; this method does not provide information about the mutual interference between different sub-targets. The Pareto-dominance approach employs stochastic rules to find the set of non-dominated solutions in the entire space of feasible decision variables, i.e., Pareto solutions [
35], optimizing all objectives simultaneously and providing a set of non-obvious optimal solutions, facilitating decision makers in choosing the optimal solution according to different preferences [
36]. Therefore, the Pareto dominance method is increasingly used in the field of multi-objective optimization.
MOPSO and NSGA are the most commonly used evolutionary algorithms for solving multi-objective problems for buildings [
37]. Aiming at the regulatory compliance, asset value and customer satisfaction of real estate property maintenance, Taillandier et al. [
38] took advantage of the optimality of the MOPSO algorithm and Pareto solutions to optimize the operations of building component maintenance and obtain decision schemes that satisfy the decision maker’s preferences. Delgarm et al. [
39] used MOPSO to optimize parameters such as orientation and window size, with the objective functions of annual cooling energy, heating energy, lighting energy, and economy, to obtain the optimal set of design solutions. Hamdy et al. [
40] took a single-family near-zero energy house in Finland as a study, where the NSGA-II multi-objective genetic algorithm was used in three stages to identify the optimal combination of design variables such as building envelope (insulation thickness of exterior walls, roofs, floors, window types, building sealing) and heat recovery devices that affect the thermal performance of the house. Magnier et al. [
41,
42] took Canadian, Portuguese and French residential buildings as research objects, used the ANN model to describe the relationship between building envelope and HVAC system as those between variables and energy consumption and indoor thermal comfort, then coupled this with NSGA-II multi-objective arithmetic to obtain energy efficient technology solutions towards the goals of energy-saving, indoor thermal environment improvement and economic efficiency. The basic ideas and the advantages and disadvantages of MOPSO and NSGA algorithms are shown in
Table 2.
As mentioned above, the non-dominated ranking genetic algorithm NSGA-II with elite strategy runs fast with a solution set of good convergence and distribution, and it has been successfully used in multi-objective optimal design towards energy saving, improving indoor thermal comfort, increasing economic efficiency or reducing carbon emission in the building field. However, in previous studies [
40,
41,
42] on multi-objective optimization of building performance, the fixed work–rest model is often used to describe energy use behavior, ignoring the impact of the characteristics of energy use behavior, such as randomness, and influenced by environmental factors regarding energy consumption and economy, which are typical in regions such as the Hot Summer and Cold Winter Climate Zone of China.
1.3. Aim of This Study
This study aims to explore the technical optimization scheme of ultra-low energy housing that meets the multiple objectives of energy saving, thermal comfort and economy, by using a probabilistic model of residents’ energy use behavior in the Hot Summer and Cold Winter Zone of China, in order to provide more reliable research and technical bases for the promotion of ultra-low energy housing in the region. In terms of behavior model, this study overcomes the limitations found in previous studies, by taking into account the stochastic nature of residents’ energy-use behavior and the influence of the interaction between environment and behavior on energy consumption and economy, such as using a conditional probability model based on regional survey results to construct a typical model of residents’ energy use behavior. In terms of a multi-objective optimization method, NSGA-II, a Pareto-dominance multi-objective algorithm is used to carry out the study. Materials and methods applied in the study are discussed in the following section.
2. Materials and Methods
This study consists of four parts:
- (1)
Determining the relevant indicators to measure the optimization objectives of energy efficiency, indoor thermal environment, and the economic goals of the building.
- (2)
Development of the building model and the residents’ behavior model.
- (3)
Identification of key technical variables to meet the energy efficiency benchmark for ultra-low energy buildings.
- (4)
Multi-objective optimization to obtain the Pareto optimal solution set and the appropriate combinations of energy efficient technologies for ultra-low energy housing.
The research framework is shown in
Figure 1.
Changsha, the target city selected for this study, is an important central city in the hot-summer and cold-winter region, and its climate is characterized by typical hot summers and cold winters. The summer is hot and long, with an average daily temperature above 30 °C for 85 days and hot days above 35 °C for an average of about 30 days per year; the average winter temperature below 0 °C is very short, and the average temperature in January, the coldest month, is 4.4–5.1 °C. Most housing in this area does not have centralized heating or cooling facilities, and the residents mainly adopt a “part time, part space” energy use pattern, which can represent the typical energy use behavior of residents in the Hot Summer and Cold Winter Climate Zone.
2.1. Defining the Objective-Functions
The optimization objectives of this study, including energy efficiency, thermal comfort and economy, are defined using indicators such as annual energy consumption, indoor thermal discomfort hours and global cost increment, respectively.
The operational energy consumption of a building includes those from heating, cooling, lighting, domestic hot water, and appliances. The energy use for lighting, domestic hot water, and appliances does not vary significantly with the optimization variables in this study. The heating and cooling energy use typically accounts for more than 50% of the total building energy consumption [
44], and this proportion is increasing [
45]. Therefore, the analysis of annual energy consumption in this study only takes into account heating and cooling energy consumption.
where
is the optimized solution,
is the annual energy consumption per unit area (kWh/m
2), E
cooling is the cooling energy consumption per unit area (kWh/m
2), and E
heating is the heating energy consumption per unit area (kWh/m
2).
Indoor air temperature is one of the most important factors affecting the indoor thermal environment. The number of thermal discomfort hours in this study refers to the number of hours when hourly indoor temperature exceeds the specified thermal comfort temperature range under normal occupant behavior conditions throughout the year. For the determination of annual thermal discomfort hours, the occupants’ indoor thermal comfort quantitative demand under natural ventilation mode according to the Evaluation Standard for Indoor Thermal Environment in Civil Buildings (GB/T 50785-2012) [
46] is used as the evaluation basis, and 18 °C ≤ T ≤ 28 °C is defined as the thermal comfort range.
where
is the optimized solution,
is the annual indoor thermal uncomfortable hours (h), and T is the number of data points located within the boundary of the thermal comfort zone on a yearly basis (h).
The economic objective is defined by the global cost increment [
47], which is the difference between the global cost C
g(j) integrating any energy-efficient technical variable j and the global cost C
g(ref) of the reference base case just meeting the requirements of the current design standard for energy efficient domestic buildings, to offset the impact of cost values on the results of the economic evaluation, and the relevant calculation formula is as follows.
In the above,
is the optimized solution,
is the global cost increment (yuan/m
2), C
1 is the initial investment cost (yuan), C
e,i is the annual energy cost (yuan) of year i, the initial energy price is 0.588 yuan/kWh [
48], R
d(i) is the discount rate of year I, A
floor is the floor area (m
2), R
R is the real interest rate, R
e is the increase rate of energy price, which is taken as 1.2% [
47], R
i is the market interest rate, which is taken as 4.25% [
47], and the calculation period is taken as 30 years, since results accuracy will be reduced for economic calculation beyond 30 years [
49]. The energy consumption of the building is assumed to be constant during the calculation period, and the equipment would be replaced once during the calculation period [
50]. Since it is difficult and to quantify with certainty the performance decay of the equipment system (air conditioning system), the performance of the equipment system in this study is assumed to be constant during the calculation period.
2.2. Defining and Verifying the Occupant Behavioral and Building Model
2.2.1. Questionnaire Survey
The results of the questionnaire survey are one of the main bases for determining the architectural archetype and the energy use behavior model. The research group conducted field and online questionnaire surveys from July 2021 to July 2022 to obtain basic information and data from residents living in the new residential areas in Changsha city. The questionnaire consisted of three parts, including basic household information, heating and cooling equipment, energy use behavior habits, and etc., with a total of 40 questions. The main content of the questionnaire is shown in
Table 3.
2.2.2. Defining and Verifying the Building Model
The most frequently occurring characteristics of orientation, building form, number of households per floor, number of bedrooms and living rooms, and house area were selected as the parameters of the building archetype for this study. Based on the literature review, questionnaires and market survey, drawings of nearly 100 new residential buildings were collected to define the archetype. It was found that the most popular characteristics are north–south orientation, high-rise slab-type, two staircases and four households per floor, three bedrooms and two living rooms, and 90–100 m
2 per single-family. Parameters such as the window-to-wall ratio should meet the requirements of DBJ 43-2017 Design standard for energy efficiency of residential buildings in Hunan province [
9]. An archetype was finally obtained and its simplified plan for a standard floor is shown in
Figure 2. For speed of simulation, only the standard floor, ground floor (first floor) and top floor are modelled in this study (
Figure 3). The window-to-wall ratios are 0.35 and 0.32 for the south and north facades, respectively, with no windows on the east and west walls.
A reference base case was defined using the building archetype, its building thermal properties fulfilling the thermal performance indexes specified in DBJ 43-2017 Design standard for energy efficiency of residential buildings in Hunan province [
9]. The main constructions and materials of the envelope are shown in
Table 4. The split air conditioner has an e energy efficiency of level 3 (cop3.2/EER2.9) and the capacity is 1.87 kW. The CSWD weather data for Changsha was used, and the heating period calculation using a 5-day smoothing method was from 29 December 29 to 4 February, while the cooling period calculation was from 2 June to 31 August [
51]. The air change rate was assumed to be 1.0 h
−1. Based on the above design conditions, a typical housing model was created in DesT (
Figure 3), which is a software platform for building environment and HVAC simulation, developed by Tsinghua University based on its own intellectual property rights. It has been used to study the influence of occupant behavior on the effect of energy efficient technologies in many studies [
15,
23].
The DesT model was calibrated by comparing it with monitoring data. A room in the middle floor of a residential building with the same building plan and envelope as the archetype building was selected for temperature and humidity measurements, namely the room marked with the symbol ○ in
Figure 2. The room was in normal operation from 1 August to 7 August 2022, without active temperature control, and the indoor air temperature and humidity were obtained using an AZ882 9 temperature and humidity self-recorder. The weather data from 1 August to 7 August 2022 was obtained from the National Weather Science Data Center and input to Dest software to simulate the daily profile of indoor air temperature as influenced by outdoor temperature. The results are shown in
Figure 4. As can be seen, the variation of the predicted indoor air temperature is consistent with that of the measurement, the absolute error of indoor air temperature is 0.39 °C and the relative error is 2.60%, which indicates the accuracy of the modeling procedure.
2.2.3. Defining the Critical Parameters of the Occupant Behavior Model
In this study, we will choose one of the “feedback-based” and “time-based” conditional probabilistic models (
Table 5) to describe the residents’ energy use behavior. The human control behavior for window and air conditioner is an important factor affecting energy use [
33]. The control behaviors for window and air conditioner with the largest proportion in the survey were selected as the typical modes.
When determining probabilistic model parameters for energy use behavior over a wide range, the “time-based” model often estimates
p values according to the literature or experience, with values of 0.9 for frequent events and 0.1 to 0.2 for infrequent events [
33]. The “feedback type” refers to the “two-point” method of Zhang [
23] to determine the occupant energy use behavior curve of air conditioners. For example, if the probability of turning on the equipment is assumed to be 0.9 at a certain environmental threshold, and 0.1 at a certain environmental value when people feel comfortable, then these values can be substituted into the model to obtain the relevant parameters.
2.2.4. Validating the Typicality of the Behavior Model
The above behavior model is input to the Dest model to obtain the annual cooling and heating energy consumption. By collecting monthly electricity consumption data from the residents surveyed by questionnaires, combined with literature research, the actual building energy consumption, heating and cooling energy consumption and energy efficiency data were obtained to verify and validate the model.
2.3. Selection of Energy Efficient Technologies
2.3.1. Listing Energy Efficient Technologies
Previous studies [
16,
17] have shown that reducing the heat transfer coefficient of the east and west walls has a bigger impact on improving the indoor thermal environment and saving energy in this area compared with the south and north walls, so it is necessary to optimize the building envelope by orientation. Since the north-facing windows receive the least solar radiation, shading is not considered, while the south-facing windows would benefit from horizontal shading to reduce their cooling load. This study refers to the relevant energy conservation standards in force [
52] in order to determine the value ranges of the variables and the variable settings and related parameters which are summarized in
Table 6. The initial investment costs of external wall insulation, roof insulation, window types, horizontal shading and equipment systems are obtained from the manufacturers. The initial investment costs of external wall and roof insulation and windows include raw material prices and construction costs. The literature review combined with questionnaire surveys show that split air conditioners are mainly used in the area, while heat recovery is rarely used, so heat recovery devices are not considered.
2.3.2. Screening Key Technologies
In this study, sensitivity analysis was used to screen the energy efficient technologies in order to reduce the volume of the optimization model. It would be time consuming and labor intensive to perform traversal calculations for 10 energy efficient technologies at multiple energy efficient levels as shown in
Table 6, so this study used Latin hypercube sampling (LHS) to generate representative case samples, where the number of samples should be more than 1.5 times the number of variables, thus creating 130 combinations of energy efficient technologies. Research [
47] has proved that equipment type is one of the key parameters affecting energy consumption and cost increment, so equipment type, such as the air conditioner, is taken as one of the key technologies in this study, without passing the screening step. The 130 combinations together with the occupants’ energy use behavior model were input to Dest to obtain the predicted energy consumption and indoor thermal discomfort hours. Then, a regression-based global sensitivity [
53] analysis was conducted to analyze the importance and significance of building energy consumption and indoor thermal discomfort hours, and the global cost increment influenced by the technical parameters of building energy efficiency based on standardized regression coefficients (SRC) and significance
p. Finally, the energy efficient technologies with significant impact on energy consumption, indoor thermal discomfort hours, and cost increment indexes were selected as key parameters.
The standardized regression coefficient (SRC) is the regression coefficient obtained after standardizing the independent variable and dependent variable simultaneously. The data are standardized to eliminate the effects of differences in magnitude and order of magnitude, making them comparable. The standardized regression coefficients are used to compare the influence of different independent variables on the dependent variable, and the larger the absolute value of the independent variable SRC, the greater the influence on the dependent variable. The
p-value obtained from the significance level test indicates the likelihood of the occurrence of an event, and the significance of the influence of the independent variable on the dependent variable is judged by the F-value. If
p < 0.05 indicates that the independent variable has a significant influence on the dependent variable, the opposite is true for
p ≥ 0.05 [
54].
2.3.3. Determination of the Technical Variable Thresholds of Ultra-Low Energy Buildings
Traversal calculations were carried out for the combinations of technologies selected as above, together with air conditioners with different energy efficiency levels, then solutions achieving just 50% energy saving rate are identified. The solution with the smallest cost increment is taken as the technical threshold for ultra-low energy building to ensure that the energy efficiency benchmark can be met, and to further determine the technical optimization ranges of ultra-low energy buildings.
2.4. Multi-Objective Optimization
2.4.1. Objective-Functions
In order to achieve the best comprehensive performance for energy saving, indoor thermal environment, and economic benefits, a function consisting of minimizing the total annual energy consumption per unit area, the number of hours of indoor thermal discomfort, and the annual cost increment index is established as follows:
where
is the annual building energy consumption per unit area (kW·h/m
2),
is the annual indoor thermal discomfort hours (h),
is global cost increment (yuan/m
2), and
is the optimization variable, i.e., the key building energy efficient technologies.
2.4.2. Defining the Objective Function Model
A database of 150 cases was obtained from the technology combination solutions to meet the benchmark for ultra-low energy buildings. Based on the database, a quantitative relationship model between key energy efficient technologies and energy consumption, indoor thermal environment and global cost increment is developed. The average relative error and R
2 value are then used to evaluate the model. Mohamed et al. [
40] showed that the neural network model can reflect well the relationship between energy efficient technology and energy consumption and indoor thermal environment. In this study, a neural network model was used to establish the quantitative relationship model, in which 80% of the samples were trained and 20% [
53] were tested. The neural network model was composed of three layers, one input layer containing neurons associated with the screened key technologies, one hidden layer composed of n layers and one output layer containing one neuron, which is energy consumption, or indoor thermal environment, or global cost increment, respectively. The hidden neurons are determined using a trial-and-error method, based on an evaluation of the average relative error of the neural network. The sigmoid function is used as the activation function and the Levenberg-Marquardt algorithm is used to adjust the weight values between layers.
If the average relative error of the neural network model is too large or the R2 is too small, regression with other models, such as polynomial, is then considered, depending on whichever is less than the error limit.
2.4.3. Multi-Objective Evolutionary Algorithm Optimization
In this study, to reach the objectives of reducing building energy consumption, ensuring indoor thermal comfort and reducing cost increment, NSGA-II is used to optimize the objective functions, consisting of key technical variables, energy consumption, indoor thermal discomfort hours and cost increment, to obtain the Pareto optimal solution set.
NSGA-II initializes a random population consisting of a certain number of individuals and generates offspring through recombination and variation to form a Pareto front solution set. In this study, each individual represents a design solution, and individual genes represent design parameters. In the Pareto optimal solution set, the combination solutions that meet the energy saving benchmark of ultra-low energy buildings (50% more energy efficient than the current energy saving standard) are screened, and the Pareto solution set is analyzed in depth towards four different targets: the optimal energy saving effect, the optimal indoor thermal environment, the optimal economy, and the optimal trade-off.
The algorithm for the trade-off solution refers to the individual utilization Weighting Factor Method (WSM) proposed by Yu et al. [
36], which converts the multi-criteria optimization problem into a scalar problem by summing the normalized objective functions and multiplying them by their weighting factor W
i to obtain the trade-off solution of the Pareto front, as calculated in Equation (8):
where f1(x), f2(x), f3(x) are objective function values;
, In this study, the weights of the normalized objective functions are evenly assigned without preference, therefore W
i is 1/3.
3. Results and Discussion
3.1. The Residents’ Energy Use Behavior Model
3.1.1. Development of the Energy Use Behavior Model
A total of 945 questionnaires were distributed, of which 905 were valid. To demonstrate whether the 905 questionnaires met the requirements of the margin of error study at the 95% confidence level of the sample size, the sample size was calculated using Equation (9) as follows [
55]:
where S is the sample size, Z is the Z-score (i.e., the standard score, which measures how many standard deviations the results show from the mean of the normal distribution curve), and the confidence level is 95%. Z takes the value of 1.96 [
55];
p is the percentage of people who choose to participate in the survey (0.5 is used for the required sample size, meaning that usually people have equal probability of choosing or refusing to participate in the survey, i.e., 50%); ME represents the error range; and N is the overall size, which is the resident population of 1,047,900 in Changsha. When S = 905, ME = 3.21%, and S = 1003, the result is ME = 3.09, indicating that we have a margin of error of approximately 3% at the 95% confidence level for this sample size survey and the sample size is statistically accurate.
Selected results of the questionnaire surveys are shown in
Figure 5,
Figure 6,
Figure 7 and
Figure 8. For window opening and closing behaviors, the research results (
Figure 5 and
Figure 6) show that the patterns are basically the same in summer and winter. The window opening behavior is mainly influenced by indoor environmental factors, so it is described by the “feedback type conditional probability model”, where u is 700 ppm. Window closing behavior is mainly triggered by outdoor environment (noise, wind, rain, dust) and time factors, such as closing a window when the outdoor environment is bad, or when leaving home. Due to the lack of data on outdoor noise and dust concentrations, the window closing model only considers the working condition of closing when leaving home, and the value of
p is 0.9 in the probability model in
Table 5.
According to
Figure 7, split air conditioners dominate the cooling mode in Changsha area in summer, accounting for 84% of the total cooling mode; 40.52% of residents use heaters and electric blankets for partial heating in winter, and 38.92% use spilt air conditioners for heating because partial heating behavior has a greater randomness and complexity, cooling and heating behavior are studied along with the air conditioning control in this research. The survey results for the control behavior of air conditioners are shown in
Figure 8. In summer, 34.16% of residents turn air conditioners on when they feel hot and off when they feel cold, which is significantly higher than the other switching options. In winter, 28.64% of residents turn air conditioners on when they feel cold and off when they feel hot, which is also higher than the other switching options. Therefore, “on when feeling hot and off when feeling cold” is the typical pattern of controlling air conditioning in summer; “on when feeling cold and off when feeling hot” is the typical pattern of heating behavior in winter, both of which are described by the “feedback-type conditional probability” model.
Zhang [
56] showed that the common temperature at which residents turned on the air conditioner in hot summer areas was 30.1 °C. Xiao et al. [
57] showed that the acceptable indoor thermal comfort temperature for residents in winter is 9.61 °C through measurements and subjective questionnaire evaluation of 30 residential houses in the Changsha area in winter, while DBJ 43-2017 Energy-saving Design Standards for Residential Buildings in Hunan Province [
9] stipulates that the design temperatures in summer and winter are 26 °C and 18 °C, respectively. Therefore, this study assumes that the design temperatures of air conditioning in summer and winter are 30.1 °C and 9.61 °C (according to studies [
56,
57], if it reaches the setpoints, most people would turn on the air conditioners), with a 90% probability of air conditioning being turned on, while the comfortable temperatures in summer and winter are 28 °C and 18 °C, respectively, (according to GBT50785-2012, the set points can meet the thermal comfort requirements of 90% of the population), with a 10% probability of being turned on. Using the two-point method, the probabilistic behavioral model of air conditioning (as shown in
Table 5) shows that, in summer, U = 26.8 °C on (30.2 off), l = 3.2 on (6.2 off), k = 3.85 on (3.8 off); in winter, U = 12.1 °C on (21 off), l = 3.2, k = 3.85. U represents threshold indoor air temperatures at which to turn on or off air conditioners, l is a scale parameter describing environmental stimuli, and k is the slope parameter, which refers to the exponential sensitivity of the action to the change in temperature. The probability curves are shown in
Figure 9 and
Figure 10.
3.1.2. Model Verification and Validation
Figure 11 shows a comparison of the simulation results of adopting the probabilistic behavior model with the actual surveyed data. As can be seen from
Figure 11, the predicted energy consumption is within the range of the surveyed data and close to the actual measured mean data, which confirms the representativeness and accuracy of the probabilistic behavior model.
3.2. Identification of Key Technical Variables in Achieving Ultra-Low Energy Housing
3.2.1. Sensitivity Analysis
According to
Figure 12 and
Figure 13, the most influential variable for building energy consumption is the south window type, while that for heat discomfort hours is the ventilation rate, as well as cost increment. This is because the windows are the weak points of heat insulation for the envelope, the solar radiation to the south windows are greater than those to the north, and the insulation performance of the south windows can effectively prevent heat transfers between indoor and outdoor, reducing the heat loss and increasing cooling energy. However, the initial investment costs for high performance windows are high, which should be considered in the decision-making for south window selection.
The influence of air mass flow coefficient on energy consumption is consistent with that on indoor thermal environment, and ventilation rate is one of the most sensitive variables for both objectives, indicating that the airtightness of a building envelope is extremely important for improving the indoor thermal environment and reducing energy consumption. The air mass flow coefficient should meet the minimum requirement of the indoor air change rate to ensure air quality and minimize the possibility of moisture and mold problems.
The influence of the insulation thicknesses of the west wall, east wall and north wall on energy consumption and indoor thermal discomfort time is negative, indicating that a thick layer of insulation is beneficial to energy saving and improving the indoor thermal environment. Among these, west wall insulation is most sensitive to energy consumption, while east wall insulation is most sensitive to indoor thermal discomfort. Both east and west walls have a great impact on cost increment. Therefore, more attention should be paid to east and west wall insulation when carrying out energy efficiency design of the building envelope.
The length of the south-facing horizontal sunshade has a positive effect on energy consumption and indoor thermal discomfort time, indicating that the lengthening of the south-facing horizontal sunshade is an effective strategy to improve the building energy performance and indoor thermal comfort. What needs to be emphasized here is that the south horizontal shading is also an important factor influencing indoor natural lighting, which is not considered in this study. Therefore, even if it is beneficial to reduce energy consumption and indoor thermal discomfort time, it should be carefully designed according to the indoor lighting requirement in practice.
According to
Figure 12, the significant impact factors on building energy efficiency are south window K-value, west wall EPS thickness, north wall EPS thickness, east wall EPS thickness, air mass flow coefficient, and south-facing horizontal shading. For the thermal discomfort time, the key impact factors include air mass flow coefficient, south window K-value, east wall EPS thickness, west wall EPS thickness, north wall EPS thickness, and south-facing horizontal shading, as shown in
Figure 13. According to
Figure 14, the significant impact factors on global cost increment are south window K-value, north window K-value, east wall EPS thickness, and west wall EPS thickness. The heat transfer coefficient of the north-facing windows has a significant impact on the cost increment, since the initial investment cost of reducing the heat transfer coefficient of exterior windows is more than those of the other technologies, but it has little effect on saving energy and improving indoor thermal environment, so it is not considered as a key factor. The thickness of roof insulation has little impact on the overall energy consumption and indoor thermal environment of a building, but is conducive to improving the thermal comfort and energy consumption of the top floor, so it is still considered as a key factor. Therefore, the finalized key energy efficient technologies are the heat transfer coefficient of south windows, insulation thickness of the west wall, insulation thickness of the east wall, insulation thickness of the north wall, ventilation rate, south-facing horizontal shading, thickness of roof insulation, and type of heating and cooling equipment.
3.2.2. Baseline Values of the Technical Variables for Ultra-Low Energy Buildings
According to Dest, the energy consumption of the reference base case is estimated to be 10.50 kwh/m
2 and the annual thermal discomfort time is estimated to be 3868 h. Traversal calculations were carried out for key technologies selected from the sensitivity analysis as above. Compared with the reference case, the technology combination schemes achieving around 50% energy saving rate (the ultra-low energy housing benchmark) were identified and summarized in
Table 7.
Scheme 4 in
Table 7 has the smallest global cost increment, with an energy consumption of 5.23 kwh/m
2 and an energy saving rate of 50.2%. This is taken as the threshold of the technical parameters of ultra-low energy housing; namely, its technical parameters are used as the optimized benchmark values, including the minimum insulation thicknesses of north wall, west wall, east wall and roof at 0.07 m, 0.09 m, 0.09 m and 0.06 m, respectively. Therefore, for ultra-low energy housing in the area, the variable ranges of insulation thicknesses of north wall, west wall and east wall should be 0.07–0.21 m, 0.09–0.21 m and 0.09–0.21 m, respectively, and the variation range of roof insulation thickness should be 0.06–0.27 m; the length of horizontal external sunshade and the ventilation rate are constant, with no horizontal external sunshade and a ventilation rate of 1 air change rate. The energy saving rate of 50% may also be achieved when the equipment type is of level 1, so the optimized equipment type range can include both level 1 and level 2.
Therefore, eight influential variables and their ranges in total were finally determined, as identified in
Table 8.
3.3. Multi-Objective Optimization
3.3.1. Training and Validation of the Objective Functions
The objective function was trained with the BP model, which is a type of neural network model. The relationship between global cost increment and key technical variables is with a goodness-of-fit not greater than 0.53 when described by a neural network model, regardless of how the hidden layer neuron number is changed, and a goodness-of-fit of 0.97 when using polynomial regression (
Figure 15), of which the average relative error is 1.89%. Therefore, the global cost increment is regressed using the polynomial model, as follows:
When the objective function is energy consumption and indoor thermal environment with two neural network models, the input layer contains eight neurons (key technical variables screened in
Section 3.2.1), the number of hidden layer neurons is three, and the output contains one neuron (energy consumption or indoor thermal discomfort time), the objective function models have the relatively best agreement with the calculated results of Dest simulation, and the results are shown in
Figure 16 and
Figure 17. It can be seen that the average relative errors of energy consumption and indoor thermal discomfort time are 0.46% and 1.54%, respectively, and the R
2 values of the BP models of the key technologies with energy consumption and indoor thermal discomfort time are larger than 0.98. As shown above, the fit of the objective function models with the calculated results from Dest simulations is good.
3.3.2. Optimization Results and Discussion
The objective function model composed of key energy efficient technologies is optimized and calculated by NSGA-II with a population size of 20, a crossover rate of 0.9 and a variation rate of 1, the constraints of the model based on variation ranges as shown in
Table 8. After 500 generations [
53] of operations, the Pareto front results are obtained, as shown in
Figure 18, and summarized as technique schemes, as shown in
Table 9. From
Table 9, the technical combinations towards the optimal energy-saving effect, the optimal thermal comfort, the optimal economic benefit and the optimal trade-off, as well as the benchmark scheme for ultra-low energy buildings in the region, are shown as follows:
The optimal technical combination scheme for the energy efficiency objective is case 1 in
Table 9. Compared with the reference case (case 0), its energy saving rate is 60.20% and the thermal discomfort time is reduced by 5.98%, while the global cost increment is high for 536.52 yuan/m
2.
The optimal technical combination scheme for the indoor thermal comfort objective is case 2 in
Table 9. Compared with the reference case, its energy saving rate is 52.96% and the thermal discomfort time is reduced by 11.09%, while the global cost increment is still high for 478.30 yuan/m
2.
The optimal technical combination scheme towards the economic objective is case 3 in
Table 9. Compared with the reference case, its energy saving rate is 50.20% and the thermal discomfort time is reduced by 3.88%. Its global incremental cost is only 115.9 yuan/m
2, indicating the best economic feasibility among all the schemes. In addition, its technical parameters are the same as those of the ultra-low energy benchmark housing, which have been identified at an early stage.
The optimal technical combination scheme for the trade-offs objective is case 4 in
Table 9. It is 55.15% more energy efficient and has 6.34% less thermal discomfort time compared with the reference case. It is 4.95% more energy efficient and with 2.46% less thermal discomfort time compared with the economically optimal scheme. It has 26.16% and 17.20% less global incremental cost compared with the optimal energy-saving and the optimal indoor thermal environment schemes, which greatly improves the economic viability.
Table 9 shows that both the optimal energy-saving scheme and the optimal indoor thermal environment scheme require that the thermal insulation performance of the east and west walls should be the best, which is consistent with the sensitivity analysis results. Besides, according to calculation, the energy consumption of the benchmark scheme of the ultra-low energy housing adopting a “full space and continuous energy use behavior” is 8.6 kWh/m
2 (with reference to GBT 51350 [
8]), with an incremental cost of 105.13 yuan/m
2. As shown in
Table 10, its energy consumption is 64.43% higher than that of the benchmark scheme adopting the probabilistic behavior model, while the saved energy consumption compared with the reference case is 1.78 times, and therefore its incremental cost is 50.76 yuan/m
2 lower. This is probably an important reason why the promotion of ultra-low energy housing in the Hot Summer and Cold Winter Zone is more difficult than those in the Cold and Severe Cold Zones, where “all space and continuous time” energy use behavior is more popular.
4. Conclusions
Improving the indoor thermal environment and economic efficiency is key to further promoting the uptake of ultra-low energy buildings. This is a multi-objective optimization problem, regarding how to effectively use technical measures such as roof insulation, sun shading, etc., to achieve optimal energy saving, indoor thermal comfort, and economic objectives simultaneously. The energy-use behavior model employed in thermal simulations does not usually reflect the randomness and complexity of residents’ energy-use behavior in the Hot Summer Cold Winter Climate Zone of China, for which the basic data is difficult to collect, and as a result the gaps between predicted and actual energy consumption are large.
This paper presented a method that employs a probability model of the residents’ actual energy use behavior in the Hot Summer and Cold Winter Climate Zone of China, to carry out multi-objective optimization for ultra-low energy housing in the region. Firstly, the objective indicators measuring the energy efficiency, indoor thermal comfort and economic performance were determined; a building energy model and a probabilistic model to represent the residents’ energy use behavior were obtained and input to DesT to provide more accurate calculation on energy consumption; then, key technical variables were identified through sensitivity analysis and the threshold values to achieve ultra-low energy housing were obtained; NSGA-II was used to carry out optimization towards the objectives of energy reduction, improved indoor thermal comfort and increased economic effectiveness with key technical variables, and the Pareto optimal solution set was obtained; finally, the corresponding combination schemes towards multiple objectives, but with different preferences, were determined by assigning weight values to the objective indicators. Both the building energy model and the probabilistic behavior model have gone through the verification process and have been proved to be reliable. In the development of the objective function model to describe the relationship between the objective indicators and key technical variables, the regression of global cost increment, unlike those of energy consumption and indoor thermal discomfort time, employs a polynomial model instead of a neural network model to achieve a larger goodness-of-fit.
Research on the probabilistic behavior model indicates that window opening behavior is mainly influenced by indoor environmental factors, while window closing behavior is triggered by outdoor environment and time factors. Residents in the region also tend to turn air conditioners on or off according to their feelings of thermal comfort. The sensitivity analysis concludes that the key energy efficient technologies towards ultra-low energy housing should include heat transfer coefficient of south windows, insulation thickness of west wall, insulation thickness of east wall, insulation thickness of north wall, ventilation rate, south-facing horizontal shading, thickness of roof insulation, and type of heating and cooling equipment. The identification of the optimal technical combination schemes towards energy efficiency, indoor thermal comfort, economic and trade-off objectives can assist with design decision-making for ultra-low energy housing with different preferences in the region. A comparison of the benchmark scheme for ultra-low energy housing employing a “full space and continuous time energy use behavior” with that employing the probabilistic behavior model shows a lower incremental cost, on top of that of the associated reference base case compared with the former, which confirms the reason why the promotion of ultra-low energy housing in the Hot Summer and Cold winter Zone is more difficult than those in the Cold and Severe Cold Zones, where “all space and continuous time energy use behavior” is adopted. Findings from this study will provide a good research basis for further developing ultra-low energy housing performance benchmarks and design standards tailored for the energy use patterns and indoor environment creation modes in the Hot Summer and Cold Winter Climate Zone of China.
It is worth noting that the archetype building proposed in this study is for a new residential building, and similar methods can be used to obtain archetypes for other building types to reduce the computational workload. Although the probability model of the residents’ energy use behavior developed in this study is supportive in increasing the accuracy of energy consumption simulation, it is more applicable to the simulation of a large scale group of residential buildings, as it was originally developed based on regional survey results. However, a similar method can be used to obtain a specific probability model of energy use behavior for a specified single building. Besides, the thermal comfort model employed in the research is a simple one based on temperature only, so will be optimized in future studies. Future research will refine the numerical models of different occupants’ energy use behaviors to analyze the impact of energy use behavior scenarios on energy consumption and indoor thermal environment; meanwhile, research will expand to include other optimization variables and objective functions, such as carbon emissions, as well as considering the variations of relevant technical parameters in the time dimension, such as the decay of building thermal parameters and energy efficiency of air conditioners.
Author Contributions
Conceptualization, J.X. and X.L.; methodology, J.X. and X.L.; software, J.X.; validation, J.X.; formal analysis, J.X.; investigation, J.X.; resources, J.X. and H.L.; data curation, J.X.; writing—original draft preparation, J.X.; writing—review and editing, J.X., X.L., P.J. and E.P.; visualization, J.X.; supervision, X.L.; project administration, X.L. and H.L. All authors have read and agreed to the published version of the manuscript.
Funding
This study was sponsored by the Natural Science Foundation of Hunan (NO. 2022JJ30140) and the Postgraduate Scientific Research Innovation Project of Hunan Province (NO. QL20210109).
Data Availability Statement
The data presented in this study are available on request from the corresponding author. The data are not publicly available due to privacy.
Conflicts of Interest
The authors declare no conflict of interest.
References
- The Paris Agreement. Available online: https://unfccc.int/process-and-meetings/the-paris-agreement (accessed on 12 December 2015).
- Saving Energy and Money with Building Energy Codes in the United States; US Department of Energy: Washington, DC, USA, 2014.
- Development of Ultra-low Energy Building Standards in European Countries. Available online: http://chinagb.chinasus.org/bencandy.php?fid=60&id=121347 (accessed on 19 July 2019).
- Yang, X.Y.; Zhang, S.C.; Xu, W. Impact of zero energy buildings on medium-to-long term building energy consumption in China. Energy Policy 2019, 129, 574–586. [Google Scholar] [CrossRef]
- National Program for Energy Efficiency and Energy-Smart Construction. Available online: http://www.government.se/information-material/2006/05/nationalprogramme-for-energy-eciencyand-energy-smart-construction/ (accessed on 20 April 2009).
- Mlecnik, E. Defining nearly zero-energy housing in Belgium and the Netherlands. Energy Effic. 2012, 5, 411–431. [Google Scholar] [CrossRef]
- Ministry, C.C. Carbon Peaking and Carbon Neutral Targets and Implementation Paths in the Building Sector; China Industry Press: Beijing, China, 2021; pp. 3–20. [Google Scholar]
- GBT 51350:2019; Technical Standard for Near Zero Energy Buildings. Ministry of Housing and Urban-Rural Development of the People’s Republic of China (MOHURD): Beijing, China, 2019.
- DBJ 43:2017; Design Standard for Energy Efficiency of Residential Buildings in Hunan Province. Changsha Urban and Rural Construction Committee: Beijing, China, 2017.
- JGJ134-2016; Design Standard for Energy Efficiency of Residential Buildings in Hot Summer and Cold Winter Zones. Ministry of Housing and Urban-Rural Development of the People’s Republic of China (MOHURD): Beijing, China, 2016.
- Ferrara, M.; Monetti, V.; Fabrizio, E. Cost-Optimal Analysis for Nearly Zero Energy Buildings Design and Optimization: A Critical Review. Energies 2018, 11, 32. [Google Scholar] [CrossRef]
- Zeiler, W.; Gvozdenovic, K.; De Bont, K.; Maassen, W. Toward cost-effective nearly zero energy buildings: The dutch situation. Sci. Technol. Built Environ. 2016, 22, 911–927. [Google Scholar] [CrossRef]
- Furton, B.; Szagri, D.; Nagy, B. The Effect of European Climate Change on Indoor Thermal Comfort and Overheating in a Public Building Designed with a Passive Approach. Atmosphere 2022, 13, 27. [Google Scholar] [CrossRef]
- Schnieders, J.; Feist, W.; Rongen, L. Passive Houses for different climate zones. Energy Build. 2015, 105, 71–87. [Google Scholar] [CrossRef]
- Chen, G.D.Y.; Guo, S.J. An Research on Prototype Building Models in Beijing Based on Actual Energy Consumption Characteristics. Build. Sci. 2020, 36, 14–22. [Google Scholar] [CrossRef]
- Mlecnik, E.S.T.; Jansen, S.J.T.; De Vries, G.; Visscher, H.J.; Van Hal, A. End-user experiences in nearly zero-energy houses. Energy Build. 2012, 49, 471–478. [Google Scholar] [CrossRef]
- Li, Z.; Hao, Y.; Zhao, Q.; Qi, D.; Zhang, D. Thermal Design Optimization and Analysis on Load of Ultra-Low Energy Buildings in Hot Summer and Cold Winter Regions. Build. Sci. 2017, 33, 182–187. [Google Scholar] [CrossRef]
- Becchio, C.; Bottero, M.C.; Corgnati, S.P.; Ghiglione, C. nZEB Design: Challenging between Energy and Economic Targets. In Proceedings of the 6th International Building Physics Conference (IBPC), Torino, Italy, 14–17 June 2015; Elsevier Science Bv: Amsterdam, The Netherlands, 2015. [Google Scholar]
- Kalaycioglu, E.; Yilmaz, A.Z. A new approach for the application of nearly zero energy concept at district level to reach EPBD recast requirements through a case study in Turkey. Energy Build. 2017, 152, 680–700. [Google Scholar] [CrossRef]
- Szalay, Z.; Szagri, D.; Bihari, A.; Nagy, B.; Kiss, B.; Horvath, M.; Medgyasszay, P. Development of a life cycle net zero carbon compact house concept. Energy Rep. 2022, 8, 12987–13013. [Google Scholar] [CrossRef]
- Liu, Y. Research and Practice of The “On the Water Side” Passive House Demonstration Project in Qinhuangdao. Constr. Technol. 2012, 17, 78–79+81. [Google Scholar] [CrossRef]
- Teni, M.; Culo, K.; Krstic, H. Renovation of Public Buildings towards nZEB: A Case Study of a Nursing Home. Buildings 2019, 9, 14. [Google Scholar] [CrossRef]
- Zhang, Z. A simulation study on the behavioral energy savings of residential buildings in Hot and Humid Climate: A case study on the use of air-conditioning. Build. Sci. 2018, 34, 19–24+77. [Google Scholar] [CrossRef]
- GB 50176:93; Thermal Design Code for Civil Building. Ministry of Housing and Urban-Rural Development of the People’s Republic of China (MOHURD): Beijing, China, 1993.
- Fu, X. Reaserch on passive energy-saving techniques for ultra low-energy residential buildings in hot summer and cold winter zone. Ph.D. Thesis, Zhejiang University, Hangzhou, China, 2019. [Google Scholar]
- Crawley, D.B.; Lawrie, L.K.; Winkelmann, F.C.; Buhl, W.F.; Huang, Y.J.; Pedersen, C.O.; Strand, R.K.; Liesen, R.J.; Fisher, D.E.; Witte, M.J.; et al. EnergyPlus: Creating a new-generation building energy simulation program. Energy Build. 2001, 33, 319–331. [Google Scholar] [CrossRef]
- Yan, D.; Xia, J.J.; Tang, W.Y.; Song, F.T.; Zhang, X.L.; Jiang, Y. DeST-an integrated building simulation toolkit part I: Fundamentals. Build. Simul. 2008, 1, 95–110. [Google Scholar] [CrossRef]
- Liu, H.T.; Sun, H.J.; Mo, H.; Liu, J.J. Analysis and modeling of air conditioner usage behavior in residential buildings using monitoring data during hot and humid season. Energy Build. 2021, 250, 13. [Google Scholar] [CrossRef]
- Indraganti, M. Behavioural adaptation and the use of environmental controls in summer for thermal comfort in apartments in India. Energy Build. 2010, 42, 1019–1025. [Google Scholar] [CrossRef]
- Indraganti, M. Thermal comfort in apartments in India: Adaptive use of environmental controls and hindrances. Renew. Energy 2011, 36, 1182–1189. [Google Scholar] [CrossRef]
- Jian, Y.; Jiang, Y. Investigation and analysis of the operating condition of residential room air conditioners. Heat. Vent. Air Cond. 2005, 2, 11–14. [Google Scholar]
- Newsham, G. Manual control of window blinds: Implications for comfort and energy consumption. Indoor Built Environ. 1993, 3, 135–144. [Google Scholar]
- Wang, C. Simulation Research on Occupant Energy-related Behaviors in Building. Ph.D. Thesis, Tsinghua University, Beijing, China, 2014. [Google Scholar]
- Wang, J.J.; Zhai, Z.Q.; Jing, Y.Y.; Zhang, C.F. Particle swarm optimization for redundant building cooling heating and power system. Appl. Energy 2010, 87, 3668–3679. [Google Scholar] [CrossRef]
- Qu, Y.; Ma, Z.; Clausen, A.; Jorgensen, B.N. A Comprehensive Review on Evolutionary Algorithm Solving Multi-Objective Problems. In Proceedings of the 22nd IEEE International Conference on Industrial Technology (ICIT), Valencia, Spain, 10–12 March 2021. [Google Scholar]
- Yu, Z.; Lu, F.; Zou, Y.; Xu, W.; Sun, D.; Liu, C. A simulation-based multi-objective optimization approach for design of nearly zero energy buildings. Build. Sci. 2019, 35, 8–15. [Google Scholar] [CrossRef]
- Coello, C.A.C.; Lechuga, M.S. MOPSO: A proposal for multiple objective particle swarm optimization. In Proceedings of the IEEE World Congress on Computational Intelligence (WCCI2002), Honolulu, HI, USA, 12–17 May 2002. [Google Scholar]
- Taillandier, F.; Fernandez, C.; Ndiaye, A. Real Estate Property Maintenance Optimization Based on Multiobjective Multidimensional Knapsack Problem. Comput.-Aided Civil Infrastruct. Eng. 2017, 32, 227–251. [Google Scholar] [CrossRef]
- Delgarm, N.; Sajadi, B.; Kowsary, F.; Delgarm, S. Multi-objective optimization of the building energy performance: A simulation-based approach by means of particle swarm optimization (PSO). Appl. Energy 2016, 170, 293–303. [Google Scholar] [CrossRef]
- Hamdy, M.; Hasan, A.; Siren, K. A multi-stage optimization method for cost-optimal and nearly-zero-energy building solutions in line with the EPBD-recast 2010. Energy Build. 2013, 56, 189–203. [Google Scholar] [CrossRef]
- Magnier, L.; Haghighat, F. Multiobjective optimization of building design using TRNSYS simulations, genetic algorithm, and Artificial Neural Network. Build. Environ. 2010, 45, 739–746. [Google Scholar] [CrossRef]
- Gossard, D.; Lartigue, B.; Thellier, F. Multi-objective optimization of a building envelope for thermal performance using genetic algorithms and artificial neural network. Energy Build. 2013, 67, 253–260. [Google Scholar] [CrossRef]
- Orosz, T.; Rassolkin, A.; Kallaste, A.; Arsenio, P.; Panek, D.; Kaska, J.; Karban, P. Robust Design Optimization and Emerging Technologies for Electrical Machines: Challenges and Open Problems. Appl. Sci. 2020, 10, 33. [Google Scholar] [CrossRef]
- Xu, Y.Z.; Zhang, G.L.; Yan, C.C.; Wang, G.; Jiang, Y.L.; Zhao, K. A two-stage multi-objective optimization method for envelope and energy generation systems of primary and secondary school teaching buildings in China. Build. Environ. 2021, 204, 14. [Google Scholar] [CrossRef]
- HVAC Accounts for 50% of Total Building Energy Consumption. Available online: https://www.china5e.com/news/news-256324-0.html (accessed on 28 November 2012).
- GB/T 50785:2012; Evaluation Standard for Indoor Thermal Environment in Civil Buildings. Chongqing Urban and Rural Construction Committee: Chongqing, China, 2012.
- Wu, D.; Liu, L.; Li, X.; Liu, C. Research on Passive Low Energy Building Technology Based on Multi-objective Optimization. J. South China Univ. Technol. 2018, 46, 98–104. [Google Scholar]
- Changsha Electricity Tariff Step Charge Standard. Available online: https://www.angyang.net.cn/post/118192.html (accessed on 21 October 2022).
- Six Questions about The Life Expectancy of Chinese Buildings “30 years”. Available online: http://news.sohu.com/20100416/n271561721.shtml (accessed on 16 April 2010).
- How Long Is The Service Life of Air Conditioners in General. Available online: https://baijiahao.baidu.com/s?id=1698625909096124154&wfr=spider&for=pc (accessed on 3 May 2021).
- Li, K. Study on the Thermal Performance Index of the Enclosure Structure of Existing Residential Buildings in Changsha Area. Master’s Thesis, Hunan University, Changsha, China, 2020. [Google Scholar]
- GB/T 51366: 2019; Standard for Building Carbon Emission Calculation. Ministry of Housing and Urban-Rural Development of the People’s Republic of China (MOHURD): Beijing, China, 2019.
- Gou, S.Q.; Nik, V.M.; Scartezzini, J.L.; Zhao, Q.; Li, Z.R. Passive design optimization of newly-built residential buildings in Shanghai for improving indoor thermal comfort while reducing building energy demand. Energy Build. 2018, 169, 484–506. [Google Scholar] [CrossRef]
- Wu, D.; Zhang, X.; Fu, M. Research on target value of auxiliary energy consumption in passive ultra-low energy consumption building design in cold zone. Ind. Constr. 2021, 51, 81–86. [Google Scholar] [CrossRef]
- Zhang, Y.; Bai, X.M.; Mills, F.P. Characterizing energy-related occupant behavior in residential buildings: Evidence from a survey in Beijing, China. Energy Build. 2020, 214, 18. [Google Scholar] [CrossRef]
- Zhang, Y.; Chen, H.; Meng, Q. Thermal comfort in buildings with split air-conditioners in hot-humid area of China. Build. Environ. 2013, 64, 213–224. [Google Scholar] [CrossRef]
- Xiao, J.; Zou, J.; Xu, F.; Zhang, G. Evaluation Index For Indoor Thermal Environment of Residential Buildings Based on Thermal Comfort in Hot Summer Cold Winter Zone. J. Cent. South Univ. Sci. Technol. 2012, 43, 3693–3697. [Google Scholar]
Figure 1.
The research framework.
Figure 1.
The research framework.
Figure 2.
Standard floor plan of a typical residential building.
Figure 2.
Standard floor plan of a typical residential building.
Figure 3.
DesT model of the building.
Figure 3.
DesT model of the building.
Figure 4.
Comparison of the predicted and measured indoor air temperature.
Figure 4.
Comparison of the predicted and measured indoor air temperature.
Figure 5.
Open window behavior: (a) Summer; (b) Winter.
Figure 5.
Open window behavior: (a) Summer; (b) Winter.
Figure 6.
Closing window behavior: (a) Summer; (b) Winter.
Figure 6.
Closing window behavior: (a) Summer; (b) Winter.
Figure 7.
Heating and cooling equipment in use research results: (a) Cooling equipment; (b) Heating equipment.
Figure 7.
Heating and cooling equipment in use research results: (a) Cooling equipment; (b) Heating equipment.
Figure 8.
Air conditioning behavior research results: (a) Changsha area summer; (b) Changsha area winter.
Figure 8.
Air conditioning behavior research results: (a) Changsha area summer; (b) Changsha area winter.
Figure 9.
Cooling probability model diagram: (a) “On when feeling hot”; (b) “Off when feeling cold”.
Figure 9.
Cooling probability model diagram: (a) “On when feeling hot”; (b) “Off when feeling cold”.
Figure 10.
Heating probability model diagram: (a) “On when feeling cold”; (b) “Off when feeling hot”.
Figure 10.
Heating probability model diagram: (a) “On when feeling cold”; (b) “Off when feeling hot”.
Figure 11.
Verification of the probabilistic behavior model.
Figure 11.
Verification of the probabilistic behavior model.
Figure 12.
Sensitivity analysis of the technical parameters to energy consumption (* Significant factors).
Figure 12.
Sensitivity analysis of the technical parameters to energy consumption (* Significant factors).
Figure 13.
Sensitivity analysis of the technical parameters on thermal discomfort time (* Significant factors).
Figure 13.
Sensitivity analysis of the technical parameters on thermal discomfort time (* Significant factors).
Figure 14.
Sensitivity analysis of the technical parameters to global cost increment (* Significant factors).
Figure 14.
Sensitivity analysis of the technical parameters to global cost increment (* Significant factors).
Figure 15.
Verification of the objective function of energy saving technology variables and global cost increments (R2 = 0.97).
Figure 15.
Verification of the objective function of energy saving technology variables and global cost increments (R2 = 0.97).
Figure 16.
Verification of the objective function of energy efficient technology variables and the predicted energy consumption of DesT (R2 = 0.987).
Figure 16.
Verification of the objective function of energy efficient technology variables and the predicted energy consumption of DesT (R2 = 0.987).
Figure 17.
Validation of the objective function of energy efficient technology variables and DesT predicted indoor thermal discomfort hours (R2 = 0.992).
Figure 17.
Validation of the objective function of energy efficient technology variables and DesT predicted indoor thermal discomfort hours (R2 = 0.992).
Figure 18.
NSGA-II calculation results.
Figure 18.
NSGA-II calculation results.
Table 1.
A comparison of the most popular occupant energy-use behavior models.
Table 1.
A comparison of the most popular occupant energy-use behavior models.
| Model Type | Basic Ideology | Advantages and Disadvantages |
|---|
| Fixed-rest models | Describe the hourly operation status of indoor equipment and the occurrence of occupant actions | It is easy to obtain and define, but it does not reflect the randomness of occupant actions and indoor equipment operation, and the interaction between human behavior and the environment. |
| Statistical regression models | Establish statistical correlations between occupant energy use behavior (such as the proportion of turned on air conditioner) and the related factors (such as indoor and outdoor temperatures) | The mathematical rules between occupant energy use behavior and the related factors are relatively accurate. However, statistical regression models such as neural networks and polynomials require a large amount of fine data over a long period of time, the summarized behavioral models are mostly applicable to research subjects, and the universality of regional applications is insufficient. |
| Threshold models | Describe the feedback behavior of the environment | They reflect the interaction between human behavior and the environment, which is similar to the fixed occupant schedule method, but it does not reflect the randomness of human actions. |
| Conditional probability models | Describe the occupants’ control in relation to turning on and off the air conditioning or other equipment | The models are stochastic and can accommodate both environment-independent and environment-feedback features, the feature parameters are simple and clear, and the underlying data are relatively easy to obtain. |
Table 2.
A comparison of common algorithms for building performance optimization [
43].
Table 2.
A comparison of common algorithms for building performance optimization [
43].
| Algorithms | Basic Ideology | Advantages and Disadvantages |
|---|
| MOPSO | To solve multi-objective problems using PSO, the optimization process is deco-mposed into multiple sub-problems with a single objective, and the optimization conditions are changed step by step to find a better solution. | The structure is simple and convergence is fast. However, the optimization problem with discrete variables is not well handled and easily falls into local optimum. |
| NSGA-II | It uses the elitist strategy with the crowding distance operator to preserve diversity and the efficient non-dominated sorting operator to select the Pareto-dominant solutions. | The elite strategy is retained to improve the overall evolution of the population, the convergence speed is fast, the convergence and distribution of the solution set are better, but the calculation of the crowding distance is more complicated. |
Table 3.
A summary of the main content of the questionnaire.
Table 3.
A summary of the main content of the questionnaire.
| Question Type | The Questions | The Options |
|---|
| Basic family information | Age; gender; household income | Younger than 20 years, 20–40 years old, 40–60 years old, older than 60 years; male, female; less than 50,000 yuan, 50–100,000 yuan, 100–200,000 yuan, 200,000 yuan or more |
| House type | Villas/row houses; multi-story buildings; high-rise towers; high-rise slab buildings |
| Room type | One bedroom and one living room, two bedrooms and one/two living room(s), three bedrooms and one/two living room(s); four bedrooms and one/two living room(s) |
| Heating and cooling equipment situation | What cooling systems or equipment are used in summer | No cooling equipment; indoor central air conditioning; wall-mounted or cabinet air conditioning; electric fans |
| What heating systems or equipment are used in winter | No heating equipment; centralized district heating; floor heating; household central air conditioning; wall-mounted or cabinet air conditioning; fan heaters, electric radiators; electric blankets |
| Occupant energy use behavior | When to turn on the air conditioning in summer/winter | Never on; Always on; when entering the living room; when feeling hot/cold; when having guests; other |
| When to turn off the air conditioning in summer/winter | Never off; when leaving the living room; when going to bed at night; when feeling cold/hot; other |
| When to open window in summer/winter | Never open; Always open in summer/winter; when entering the living room; when waking up; when feeling hot/cold; when the room is smelly or stuffy; other |
| When to close window in summer/winter | Never closed; Closed after leaving room; when feeling hot/cold; when it is noisy outside, or when the environment outside is bad (wind and rain, sand and dust); other |
Table 4.
Thermal properties of the envelope of the reference base case.
Table 4.
Thermal properties of the envelope of the reference base case.
| Envelope | Construction Details | Performance Parameters |
|---|
| External walls | 20 mm Cement mortar + 10 mmEPS + 200 mm Shale porous brick + 20 mm mixed mortar exterior finish plastering | 1.1 W/(m2·K) |
| Roof | 10 mm cement mortar + 60 mmEPS + 100 mm reinforced concrete structural slab | 0.6 W/(m2·K) |
| External windows | 6 mm Low-e glass + 12 mm air + 6 mm clear glass | K = 3.2 W/(m2·K)
SHGC = 0.43 |
| Internal walls | 10 mm cement mortar +200 mm shale porous brick | 2.0 W/(m2·K) |
| External shading | -- | -- |
| Heating/cooling equipment | Split air conditioners | cop3.1/EER2.8 |
Table 5.
Probability models of action behavior.
Table 5.
Probability models of action behavior.
| Model Type | Type of Action Behavior | Probability Function | Feature Parameters |
|---|
| Time-based | On when entering room, Off when leaving room, On when going to bed, Off when going to bed, etc. | | p is the probability of an event occurring at a given time |
| Feedback type | On when feeling hot/cold, Off when feeling cold/hot, On when feeling stuffy, etc. | | U represents threshold parameters that characterize human discomfort such as indoor air temperatures to turn on air conditioning or open window, and indoor CO2 concentration, l is a scale parameter describing environmental stimuli; k is the slope parameter which refers to the exponential sensitivity of the action to the change of the parameter; Δt is the time step used in the simulation. |
Table 6.
Variable settings.
Table 6.
Variable settings.
| Description of the Variables | Variable Names | Probability Density Functions | Variation Ranges | Initial Investment Costs |
|---|
| South wall EPS thickness | X1 | Continuous uniform | 0.01–0.21 m | 600 yuan/m3 |
| North wall EPS thickness | X2 | Continuous uniform | 0.01–0.21 m | 600 yuan/m3 |
| West wall EPS thickness | X3 | Continuous uniform | 0.01–0.21 m | 600 yuan/m3 |
| East wall EPS thickness | X4 | Continuous uniform | 0.01–0.21 m | 600 yuan/m3 |
| Roof EPS thickness | X5 | Continuous uniform | 0.06–0.27 m | 650 yuan/m3 |
| Interior wall EPS thickness | X6 | Continuous uniform | 0–0.06 m | 600 yuan/m3 |
| South window K-value | X7 | Discrete | (0.8, 1.1, 1, 4, 1.7, 2.0, 2.3, 2.6, 2.9, 3.2) W/(m2·K) | (2500, 2300, 1200, 920, 900, 890, 800, 600, 500) yuan/m2 |
| North window K-value | X8 | Discrete | (0.8, 1.1, 1, 4, 1.7, 2.0, 2.3, 2.6, 2.9, 3.2) W/(m2·K) | (2500, 2300, 1200, 920, 900, 890, 800, 600, 500) yuan/m2 |
| Length of south-facing horizontal external shading | X9 | Continuous uniform | 0–0.6 m | 300 yuan/m2 |
| Air mass flow coefficient | X10 | Discrete | (0.5, 0.75, 1) h−1 | (0, 5, 10) yuan/m2 |
| HVAC: Split air conditioner+ natural ventilation | X11 | Discrete | (cop3.1/EER2.8(level 3),
cop4.3/EER3.3(level 2),
cop5.4/EER3.6(level 1)) | (100, 120, 140) yuan/m2 |
Table 7.
A summary of the selected technology combination schemes.
Table 7.
A summary of the selected technology combination schemes.
| No. | Insulation Thickness (m) | South Window K Value W/(m2·K) | Horizontal Overhang Shading (Length: m) | ACR (h−1) | Air Conditioner Type | Energy Use (kwh/m2) | Energy Saving Rate | Global Cost Increment (yuan/m2) |
|---|
| North Wall | West Wall | East Wall | Roof |
|---|
| 1 | 0.11 | 0.07 | 0.07 | 0.08 | 1.1 | 0 | 0.75 | Level 1 | 5.20 | 50.46% | 475.02 |
| 2 | 0.03 | 0.19 | 0.11 | 0.06 | 2 | 0.2 | 1 | Level 1 | 5.23 | 50.20% | 226.57 |
| 3 | 0.21 | 0.03 | 0.05 | 0.09 | 2.3 | 0.2 | 0.75 | Level 1 | 5.22 | 50.26% | 221.61 |
| 4 | 0.07 | 0.09 | 0.09 | 0.06 | 2.6 | 0 | 1 | Level 1 | 5.23 | 50.20% | 155.89 |
| 5 | 0.03 | 0.17 | 0.15 | 0.06 | 2.6 | 0 | 0.5 | Level 1 | 5.21 | 50.33% | 166.58 |
| 6 | 0.19 | 0.11 | 0.05 | 0.07 | 2.6 | 0 | 0.5 | Level 1 | 5.20 | 50.41% | 207.25 |
| 7 | 0.15 | 0.13 | 0.03 | 0.12 | 2 | 0 | 0.5 | Level 1 | 5.16 | 50.86% | 218.02 |
| 8 | 0.09 | 0.11 | 0.19 | 0.15 | 2.6 | 0 | 0.5 | Level 1 | 5.16 | 50.84% | 175.25 |
| 9 | 0.13 | 0.05 | 0.15 | 0.06 | 1.7 | 0 | 0.5 | Level 1 | 5.23 | 50.19% | 225.58 |
| 10 | 0.21 | 0.07 | 0.09 | 0.14 | 1.7 | 0.6 | 0.75 | Level 1 | 5.16 | 50.84% | 249.41 |
| 11 | 0.01 | 0.19 | 0.13 | 0.15 | 1.7 | 0.5 | 0.5 | Level 2 | 5.21 | 50.43% | 218.04 |
Table 8.
Influential variables and ranges.
Table 8.
Influential variables and ranges.
| Description of the Variables | Variable Names | Probability Density Functions | Variation Ranges |
|---|
| North wall EPS thickness | X2 | Continuous uniform | 0.07–0.21 m |
| West wall EPS thickness | X3 | Continuous uniform | 0.09–0.21 m |
| East wall EPS thickness | X4 | Continuous uniform | 0.09–0.21 m |
| Roof EPS thickness | X5 | Continuous uniform | 0.06–0.27 m |
| South window K-value | X7 | Discrete | (0.8, 1.1, 1, 4, 1.7, 2.0, 2.3, 2.6, 2.9, 3.2) W/(m2·K) |
| Length of south-facing horizontal external shading | X9 | Continuous uniform | 0–0.6 m |
| Air mass flow coefficient | X10 | Discrete | (0.5, 0.75, 1) h−1 |
| HVAC: Split air conditioner+ natural ventilation | X11 | Discrete | (cop4.3/EER3.3 (level 2), cop5.4/EER3.6 (level 1)) |
Table 9.
Technique schemes from multi-objective optimization.
Table 9.
Technique schemes from multi-objective optimization.
| No. | Insulation Thickness (m) | South Window Heat K Value W/(m2·K) | Horizontal Overhang Shading (Length: m) | ACR (h−1) | Air Conditioner Type | Energy Saving Rate | Thermal Discomfort Time Reduction Rate | Global Cost Increment (yuan/m2) |
|---|
| North Wall | West Wall | East Wall | Roof |
|---|
| 0 | 0.01 | 0.01 | 0.01 | 0.06 | 3.2 | 0.00 | 1.00 | Level 3 | 0 | 0 | 0 |
| 1 | 0.07 | 0.21 | 0.21 | 0.27 | 0.80 | 0.00 | 1.00 | Level 1 | 60.20% | 5.98% | 536.52 |
| 2 | 0.14 | 0.09 | 0.21 | 0.21 | 0.80 | 0.51 | 0.50 | Level 1 | 52.96% | 11.09% | 478.30 |
| 3 | 0.07 | 0.09 | 0.09 | 0.06 | 2.60 | 0.00 | 1.00 | Level 1 | 50.20% | 3.88% | 155.89 |
| 4 | 0.08 | 0.15 | 0.09 | 0.06 | 1.10 | 0.10 | 1.00 | Level 1 | 55.15% | 6.34% | 396.03 |
| 5 | 0.17 | 0.21 | 0.21 | 0.06 | 0.80 | 0.18 | 0.75 | Level 1 | 53.06% | 9.37% | 526.99 |
| 6 | 0.20 | 0.09 | 0.19 | 0.06 | 1.10 | 0.53 | 0.50 | Level 1 | 52.77% | 10.30% | 443.34 |
| 7 | 0.07 | 0.12 | 0.19 | 0.23 | 0.80 | 0.05 | 1.00 | Level 1 | 53.82% | 8.03% | 493.85 |
| 8 | 0.18 | 0.14 | 0.10 | 0.06 | 2.00 | 0.45 | 1.00 | Level 1 | 51.06% | 5.60% | 260.09 |
| 9 | 0.20 | 0.09 | 0.15 | 0.06 | 1.40 | 0.48 | 0.50 | Level 1 | 51.63% | 9.27% | 348.56 |
| 10 | 0.20 | 0.09 | 0.15 | 0.21 | 1.70 | 0.48 | 0.50 | Level 1 | 50.87% | 9.18% | 330.49 |
| 11 | 0.13 | 0.14 | 0.13 | 0.20 | 1.10 | 0.08 | 1.00 | Level 1 | 53.06% | 7.04% | 427.19 |
| 12 | 0.18 | 0.21 | 0.09 | 0.06 | 2.30 | 0.43 | 1.00 | Level 1 | 52.01% | 3.52% | 224.88 |
| 13 | 0.13 | 0.19 | 0.09 | 1.80 | 2.00 | 0.49 | 0.50 | Level 1 | 51.91% | 7.65% | 287.09 |
| 14 | 0.11 | 0.09 | 0.17 | 0.06 | 0.80 | 0.52 | 0.50 | Level 1 | 52.39% | 9.75% | 431.94 |
| 15 | 0.07 | 0.13 | 0.19 | 0.06 | 0.80 | 0.06 | 1.00 | Level 1 | 53.72% | 7.89% | 487.25 |
| 16 | 0.21 | 0.10 | 0.21 | 1.90 | 0.90 | 0.51 | 0.50 | Level 1 | 52.87% | 10.84% | 464.53 |
| 17 | 0.21 | 0.12 | 0.09 | 0.06 | 1.70 | 0.34 | 0.50 | Level 1 | 51.72% | 7.99% | 300.65 |
| 18 | 0.07 | 0.16 | 0.09 | 0.06 | 1.40 | 0.09 | 1.00 | Level 2 | 53.25% | 5.72% | 354.39 |
| 19 | 0.70 | 0.21 | 0.90 | 0.20 | 1.40 | 0.59 | 0.75 | Level2 | 56.01% | 11.09% | 546.48 |
| 20 | 0.07 | 0.20 | 0.09 | 0.06 | 1.40 | 0.51 | 1.00 | Level2 | 55.63% | 6.67% | 436.48 |
Table 10.
The energy consumption and global cost increment comparisons of two energy-use behavior models.
Table 10.
The energy consumption and global cost increment comparisons of two energy-use behavior models.
| Behavioral Model Type | Technique Scheme Type | Energy Consumption (kWh/(m2·a)) | Global Cost Increment (yuan/m2) |
|---|
| Full space and continuous energy use behavior [8] | Reference scheme (case 0 of Table 9) | 18.01 | 0 |
| Benchmark scheme (case 3 of Table 9) | 8.60 | 105.13 |
| The probabilistic behavioral model (Section 3.1) | Reference scheme (case 0 of Table 9) | 10.50 | 0 |
| Benchmark scheme (case 3 of Table 9) | 5.23 | 155.89 |
| Disclaimer/Publisher’s Note: The statements, opinions and data contained in all publications are solely those of the individual author(s) and contributor(s) and not of MDPI and/or the editor(s). MDPI and/or the editor(s) disclaim responsibility for any injury to people or property resulting from any ideas, methods, instructions or products referred to in the content. |
© 2023 by the authors. Licensee MDPI, Basel, Switzerland. This article is an open access article distributed under the terms and conditions of the Creative Commons Attribution (CC BY) license (https://creativecommons.org/licenses/by/4.0/).


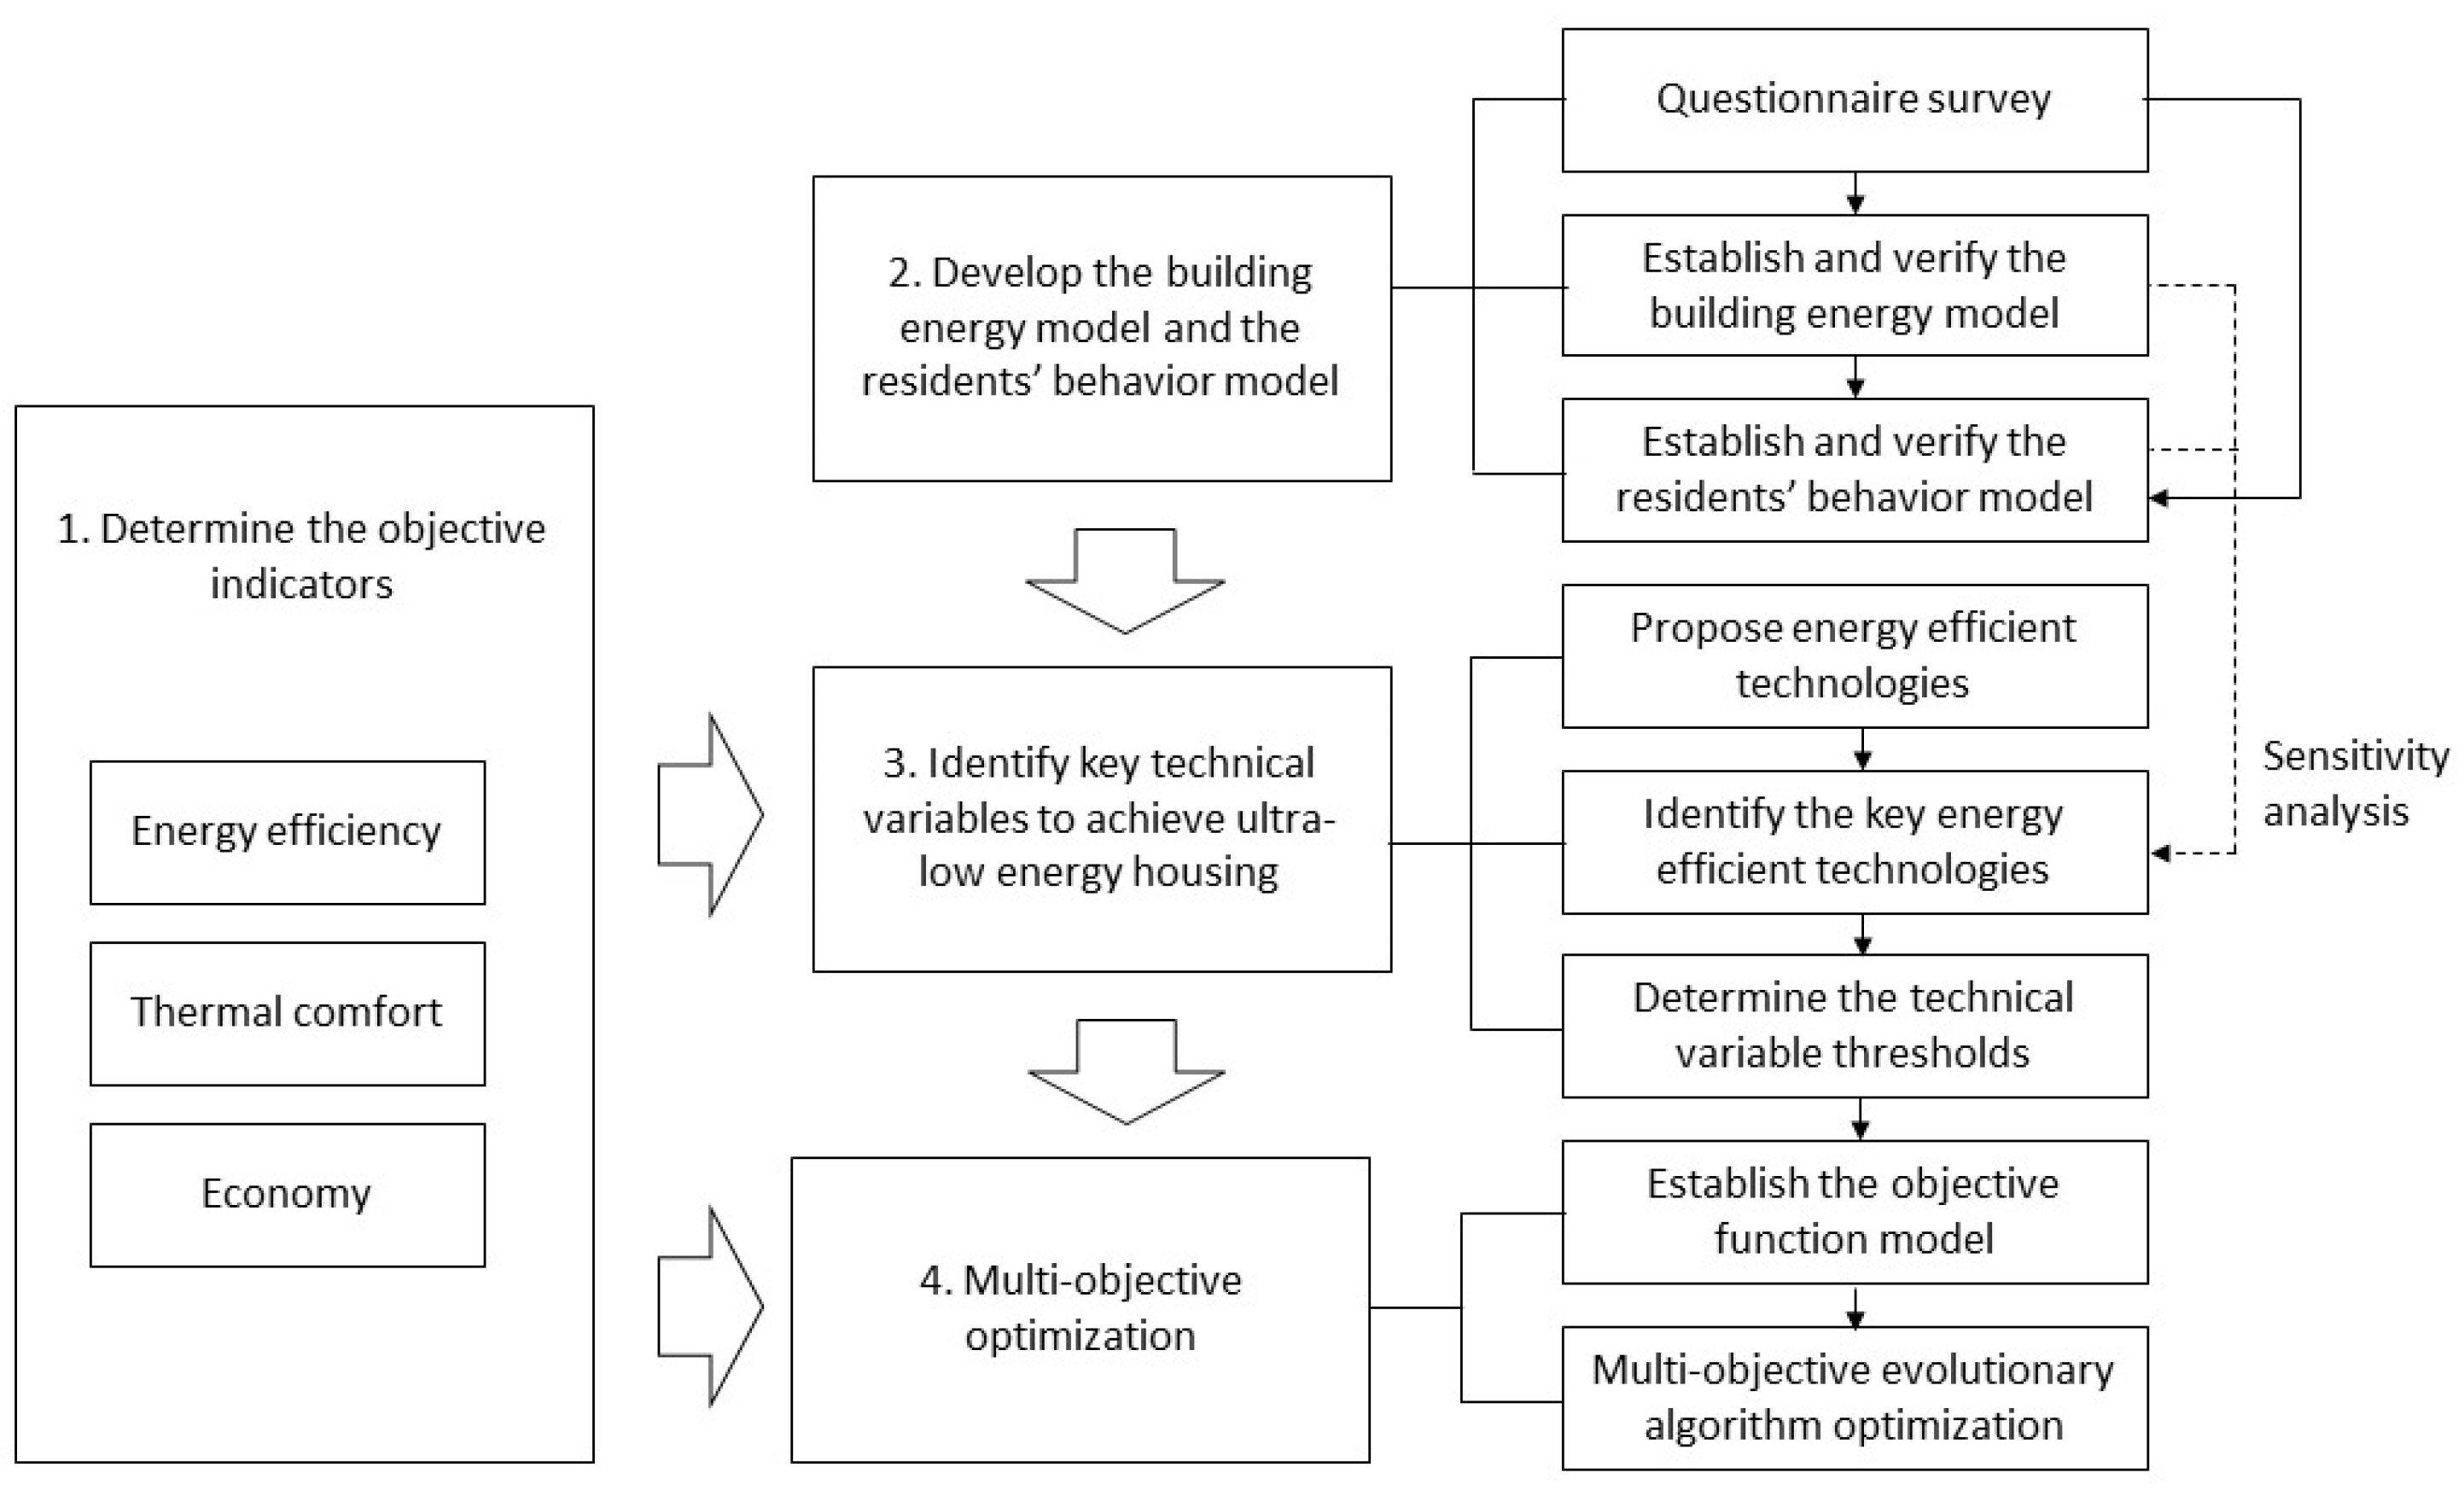
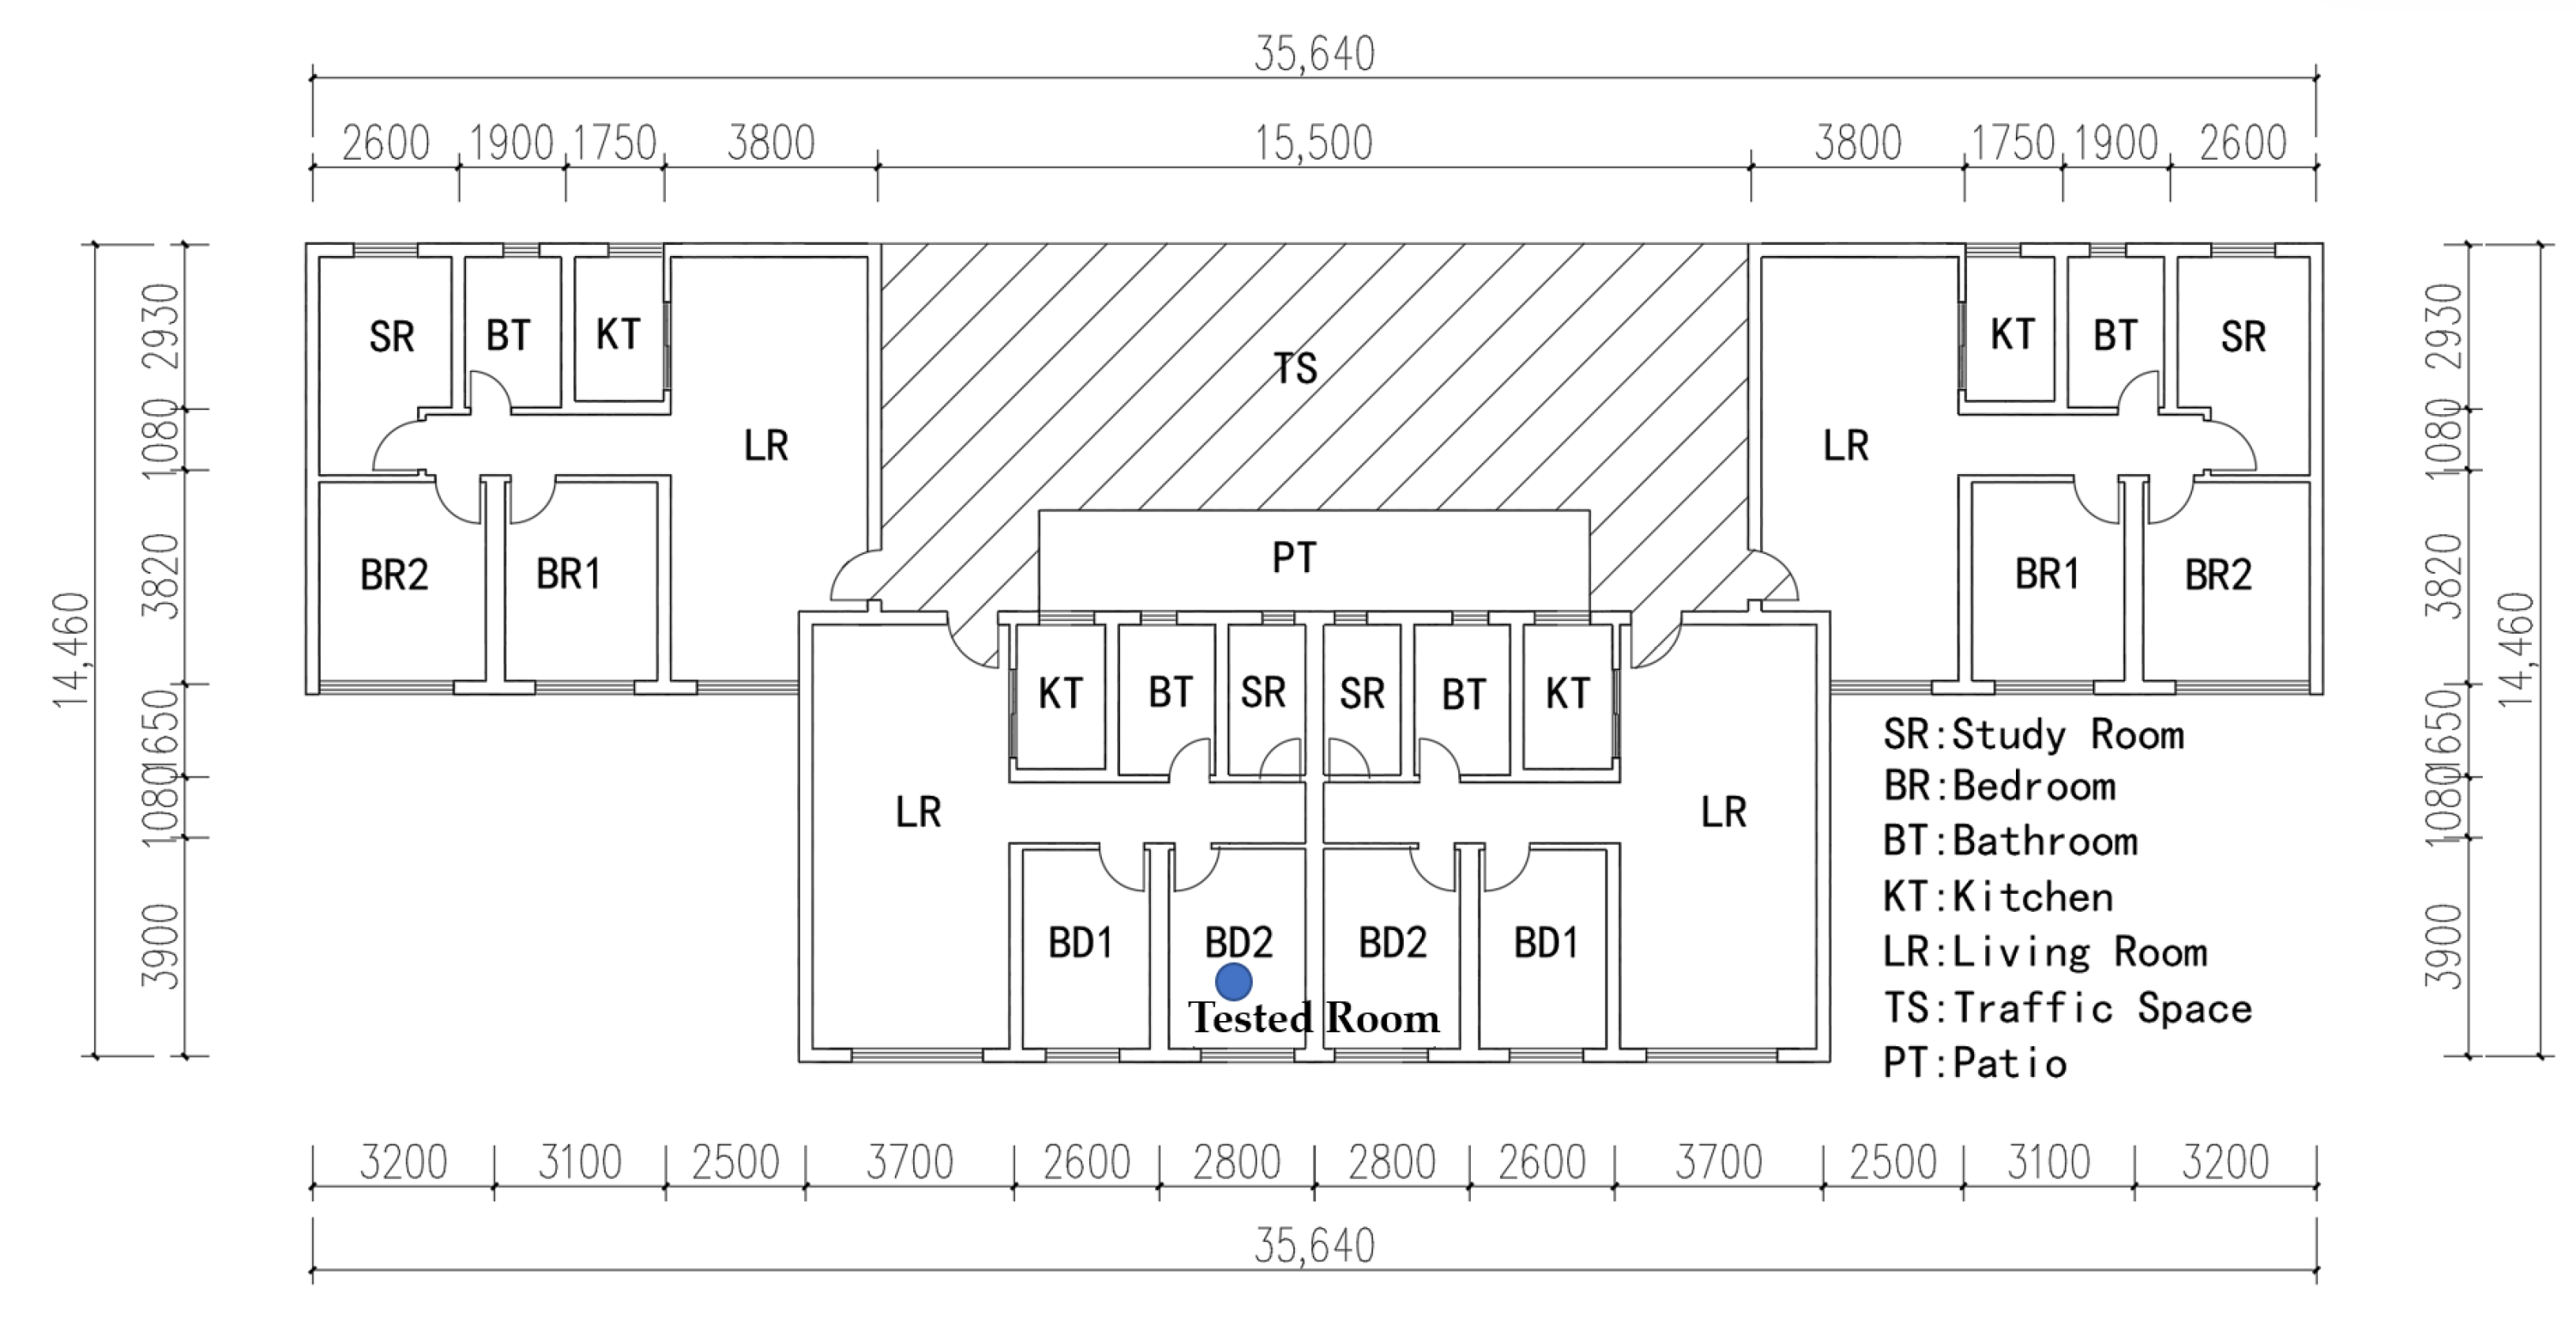
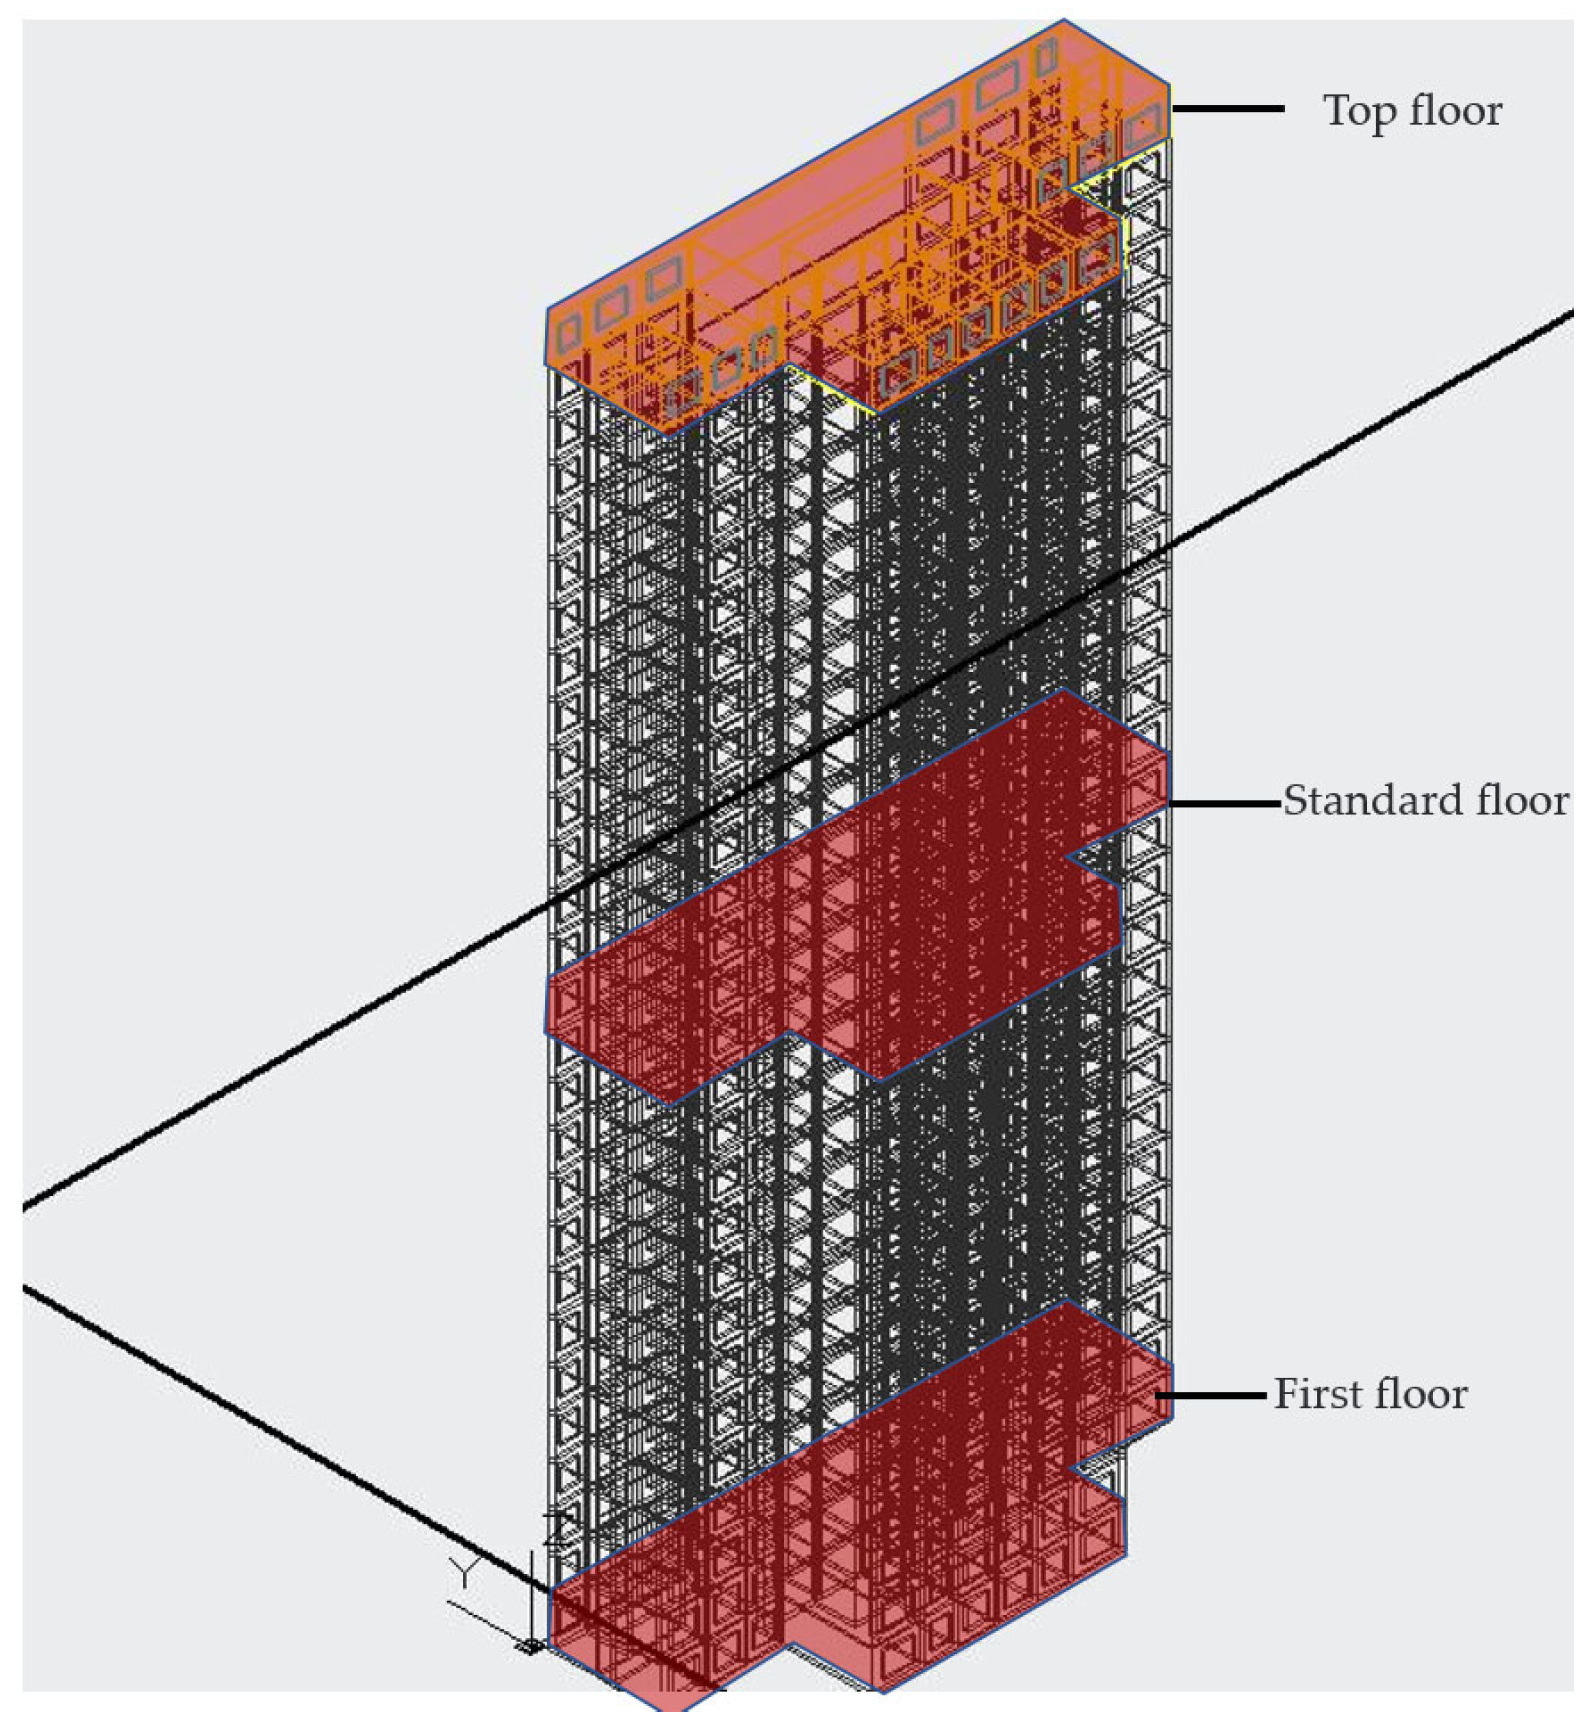
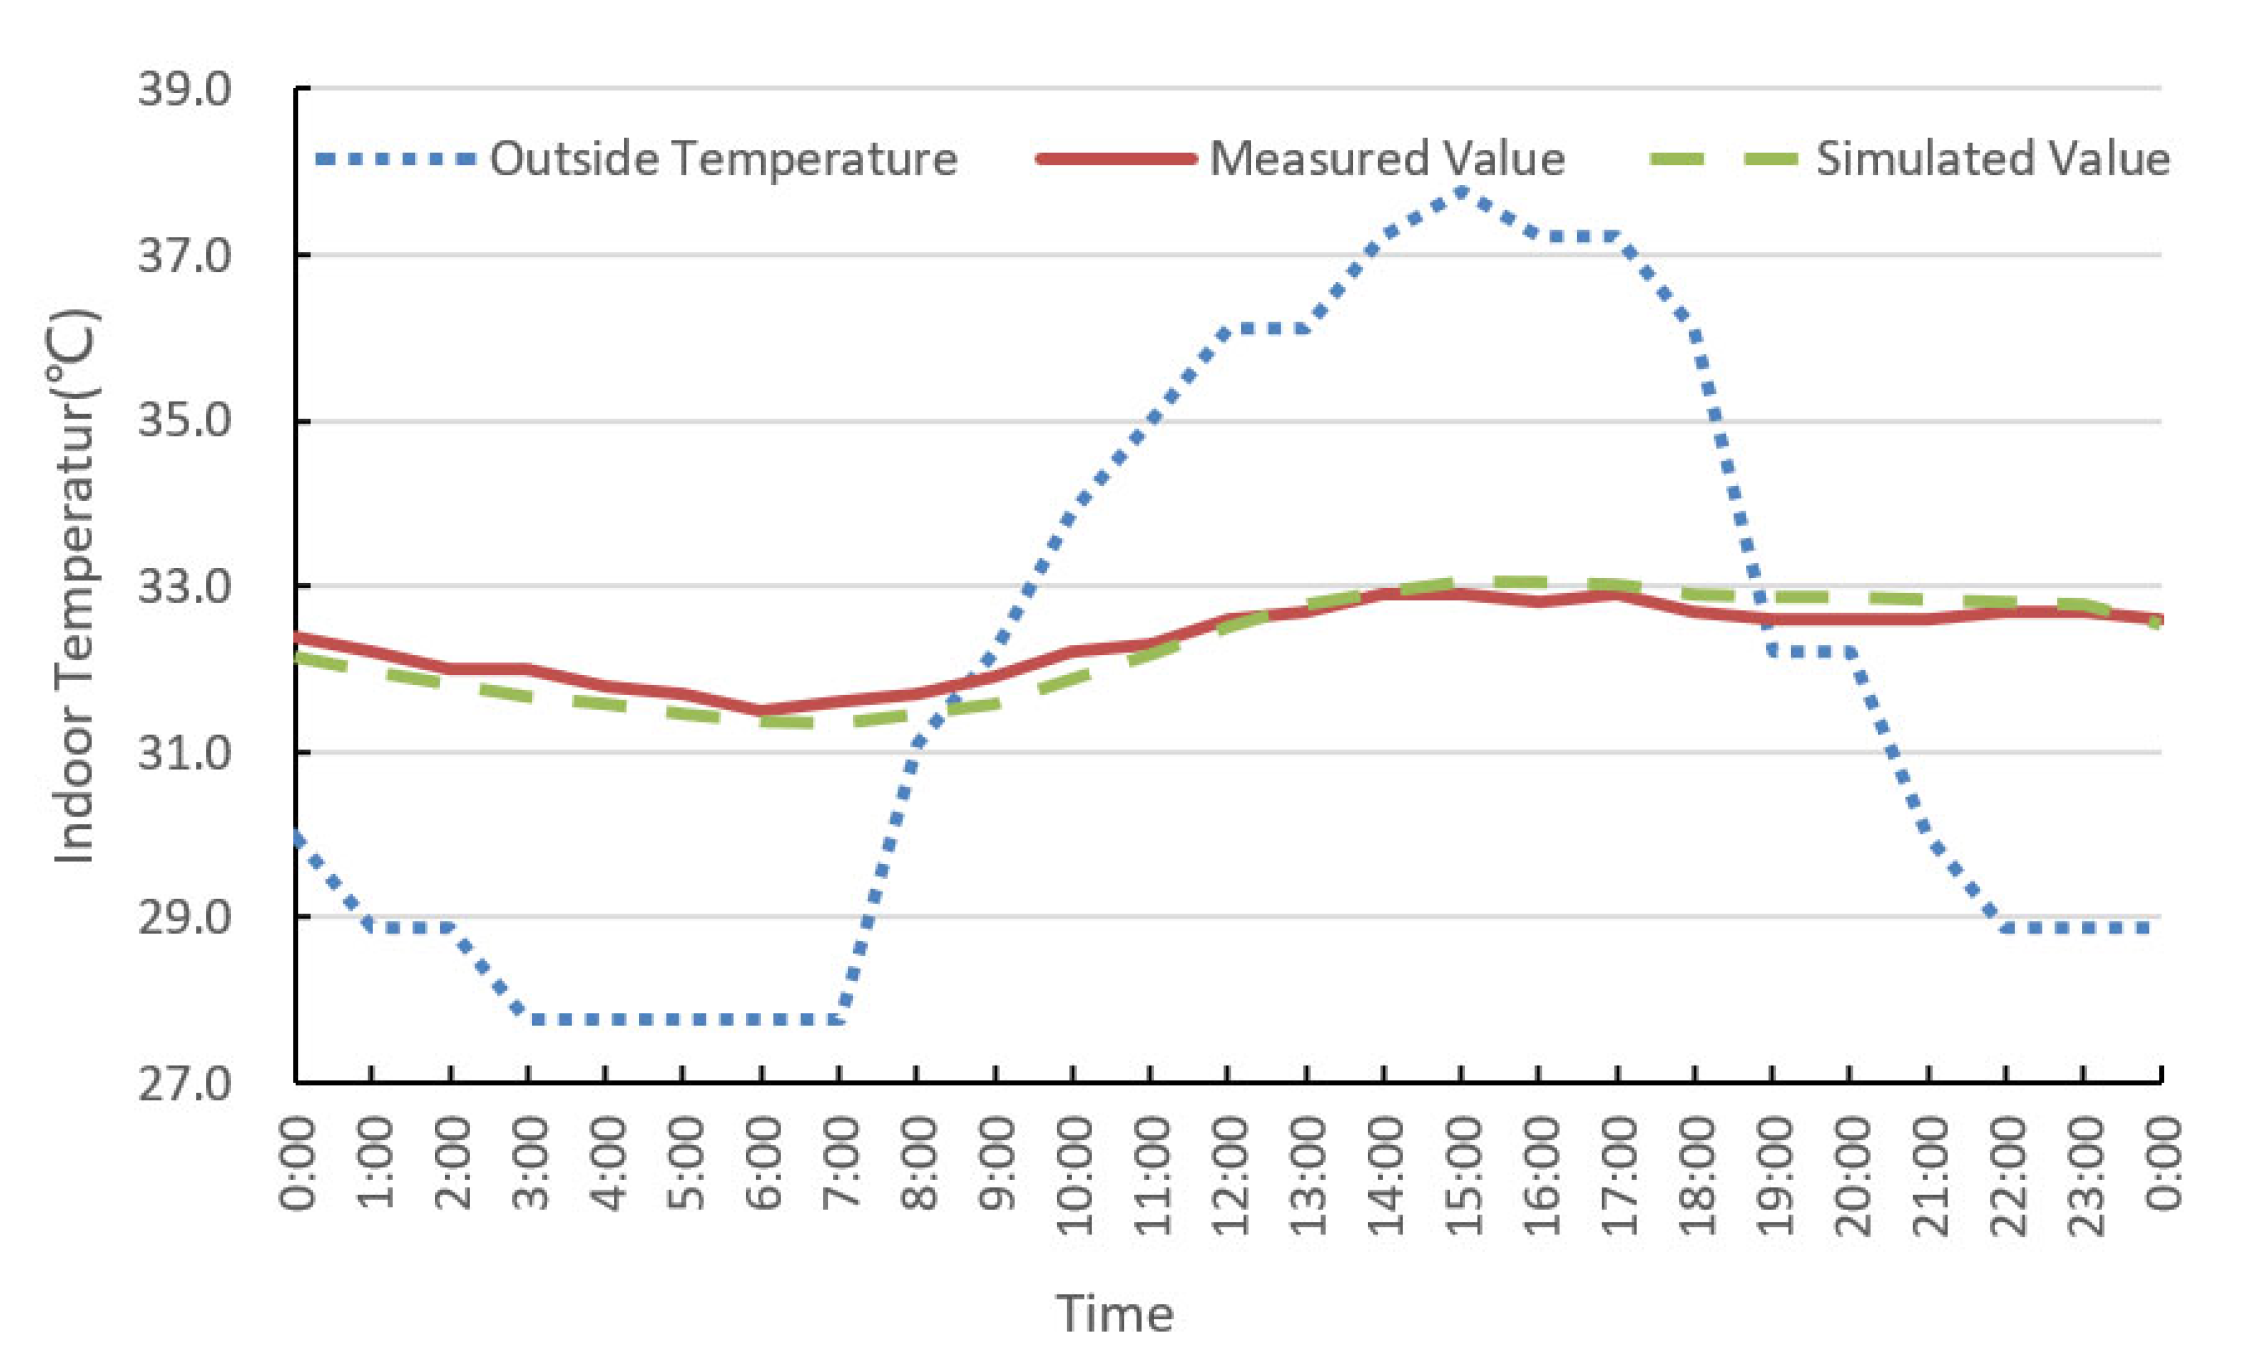
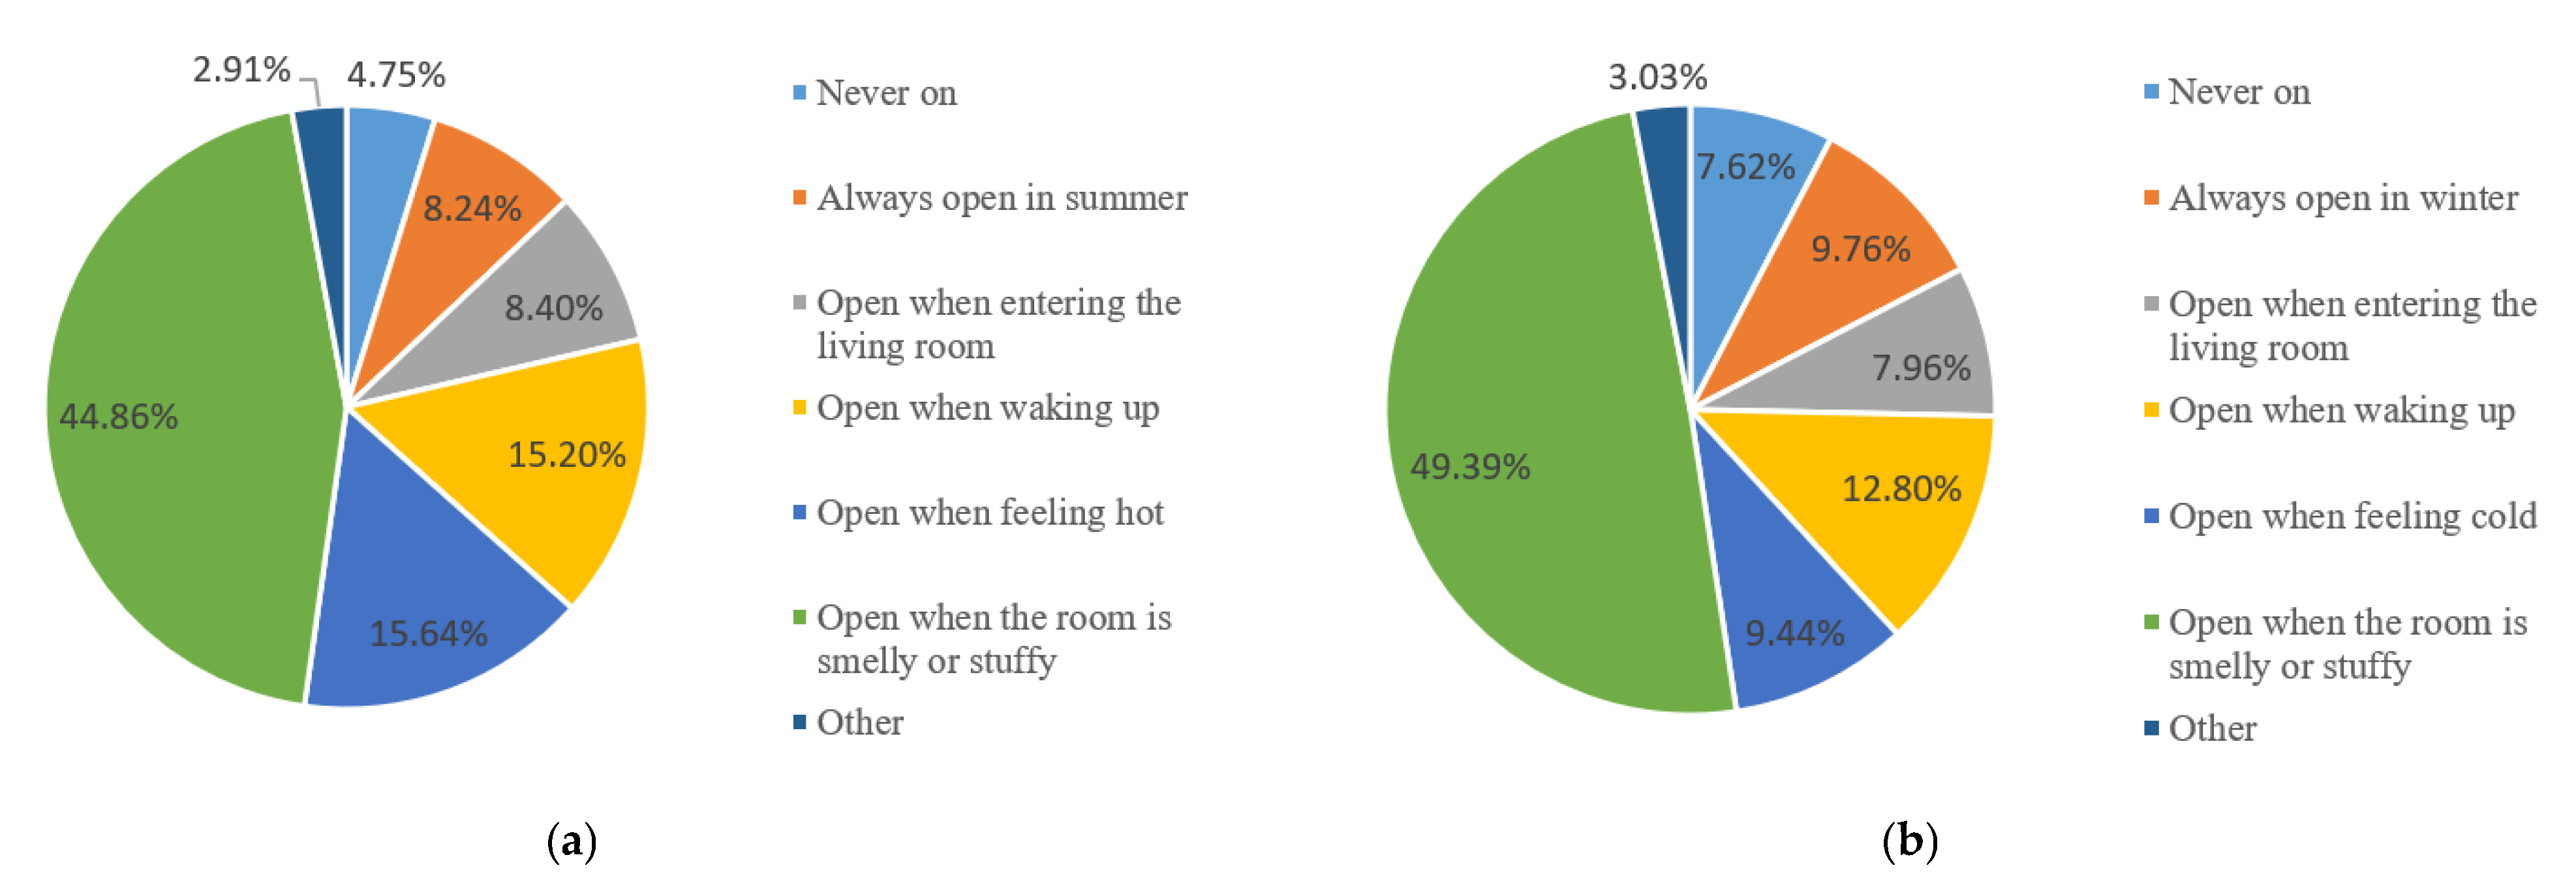
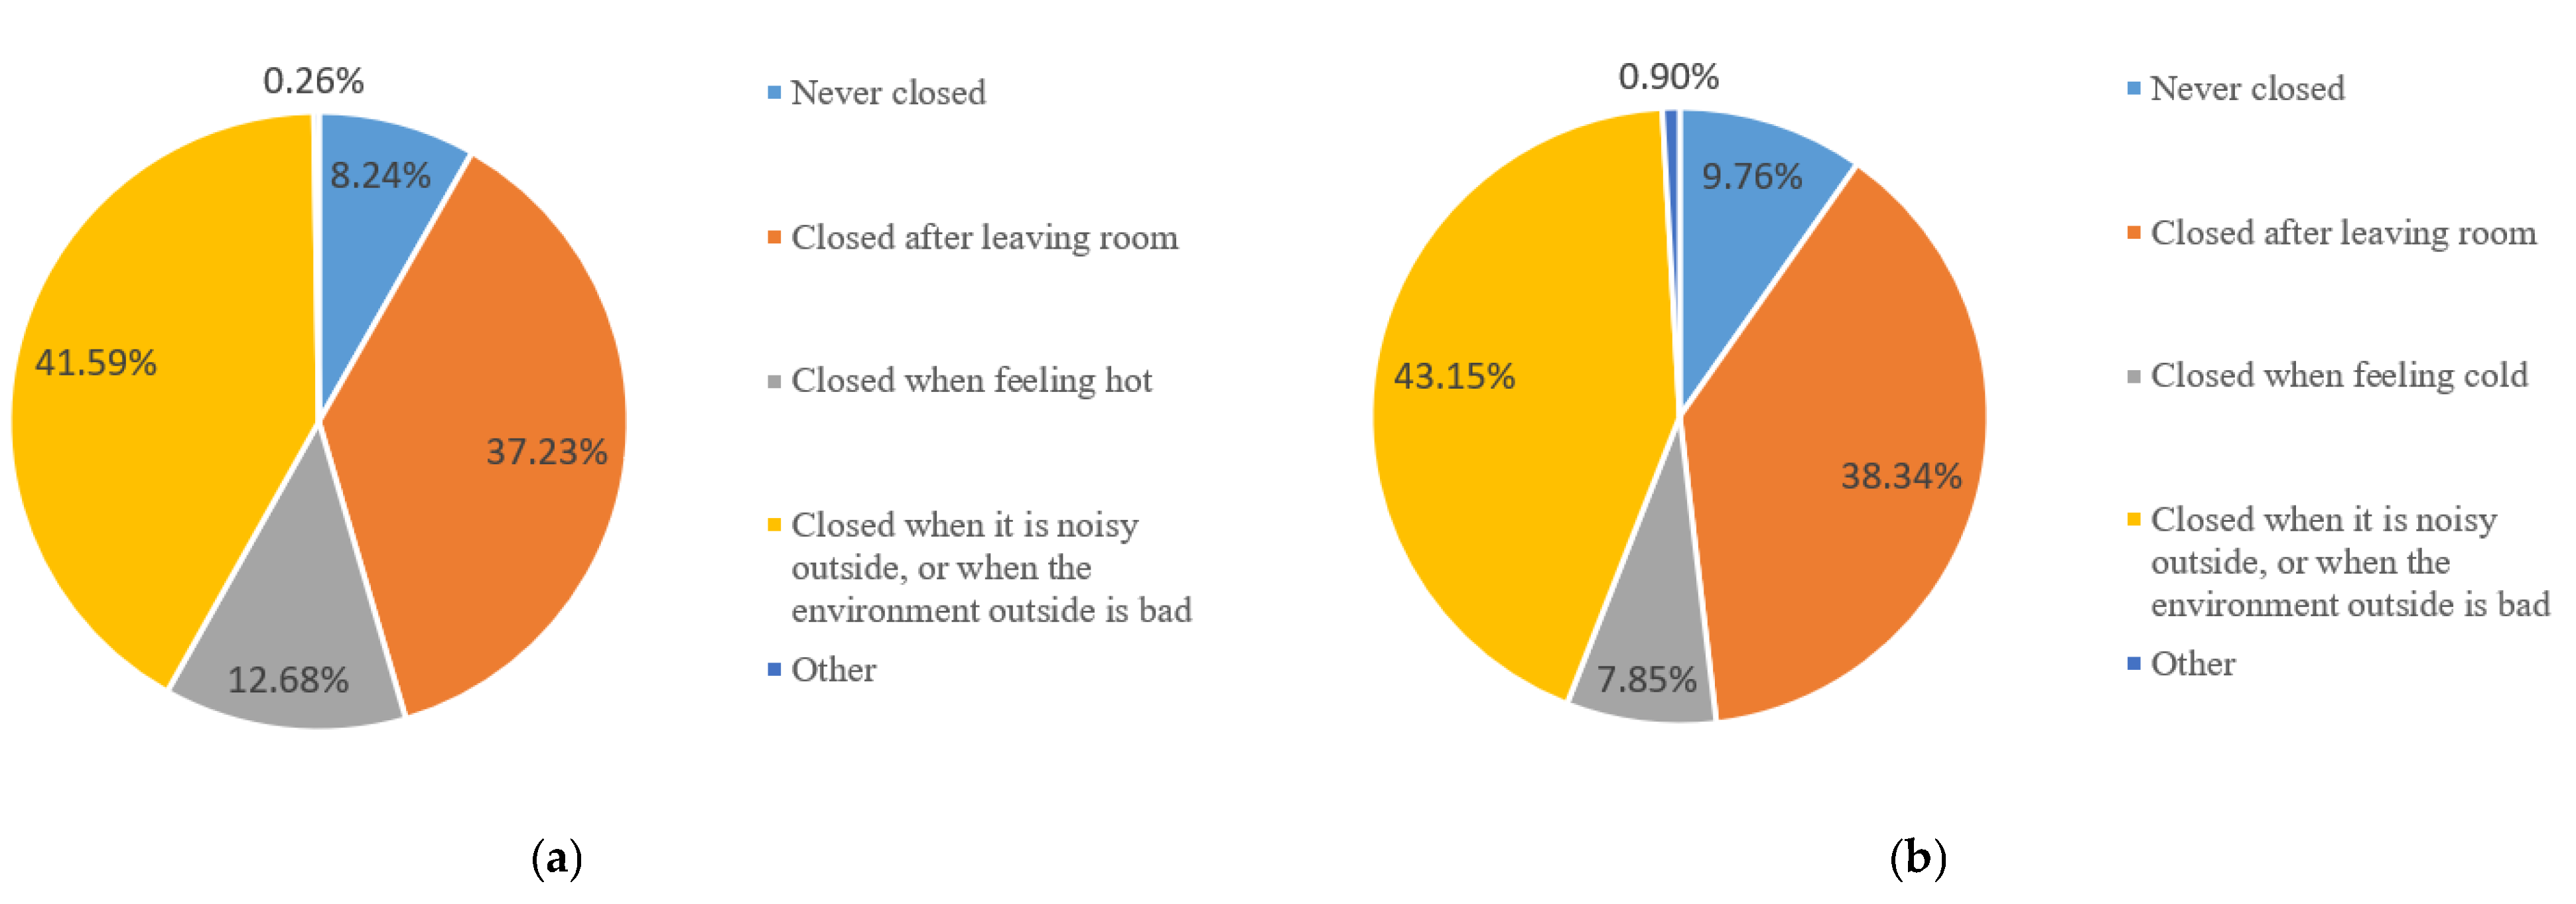
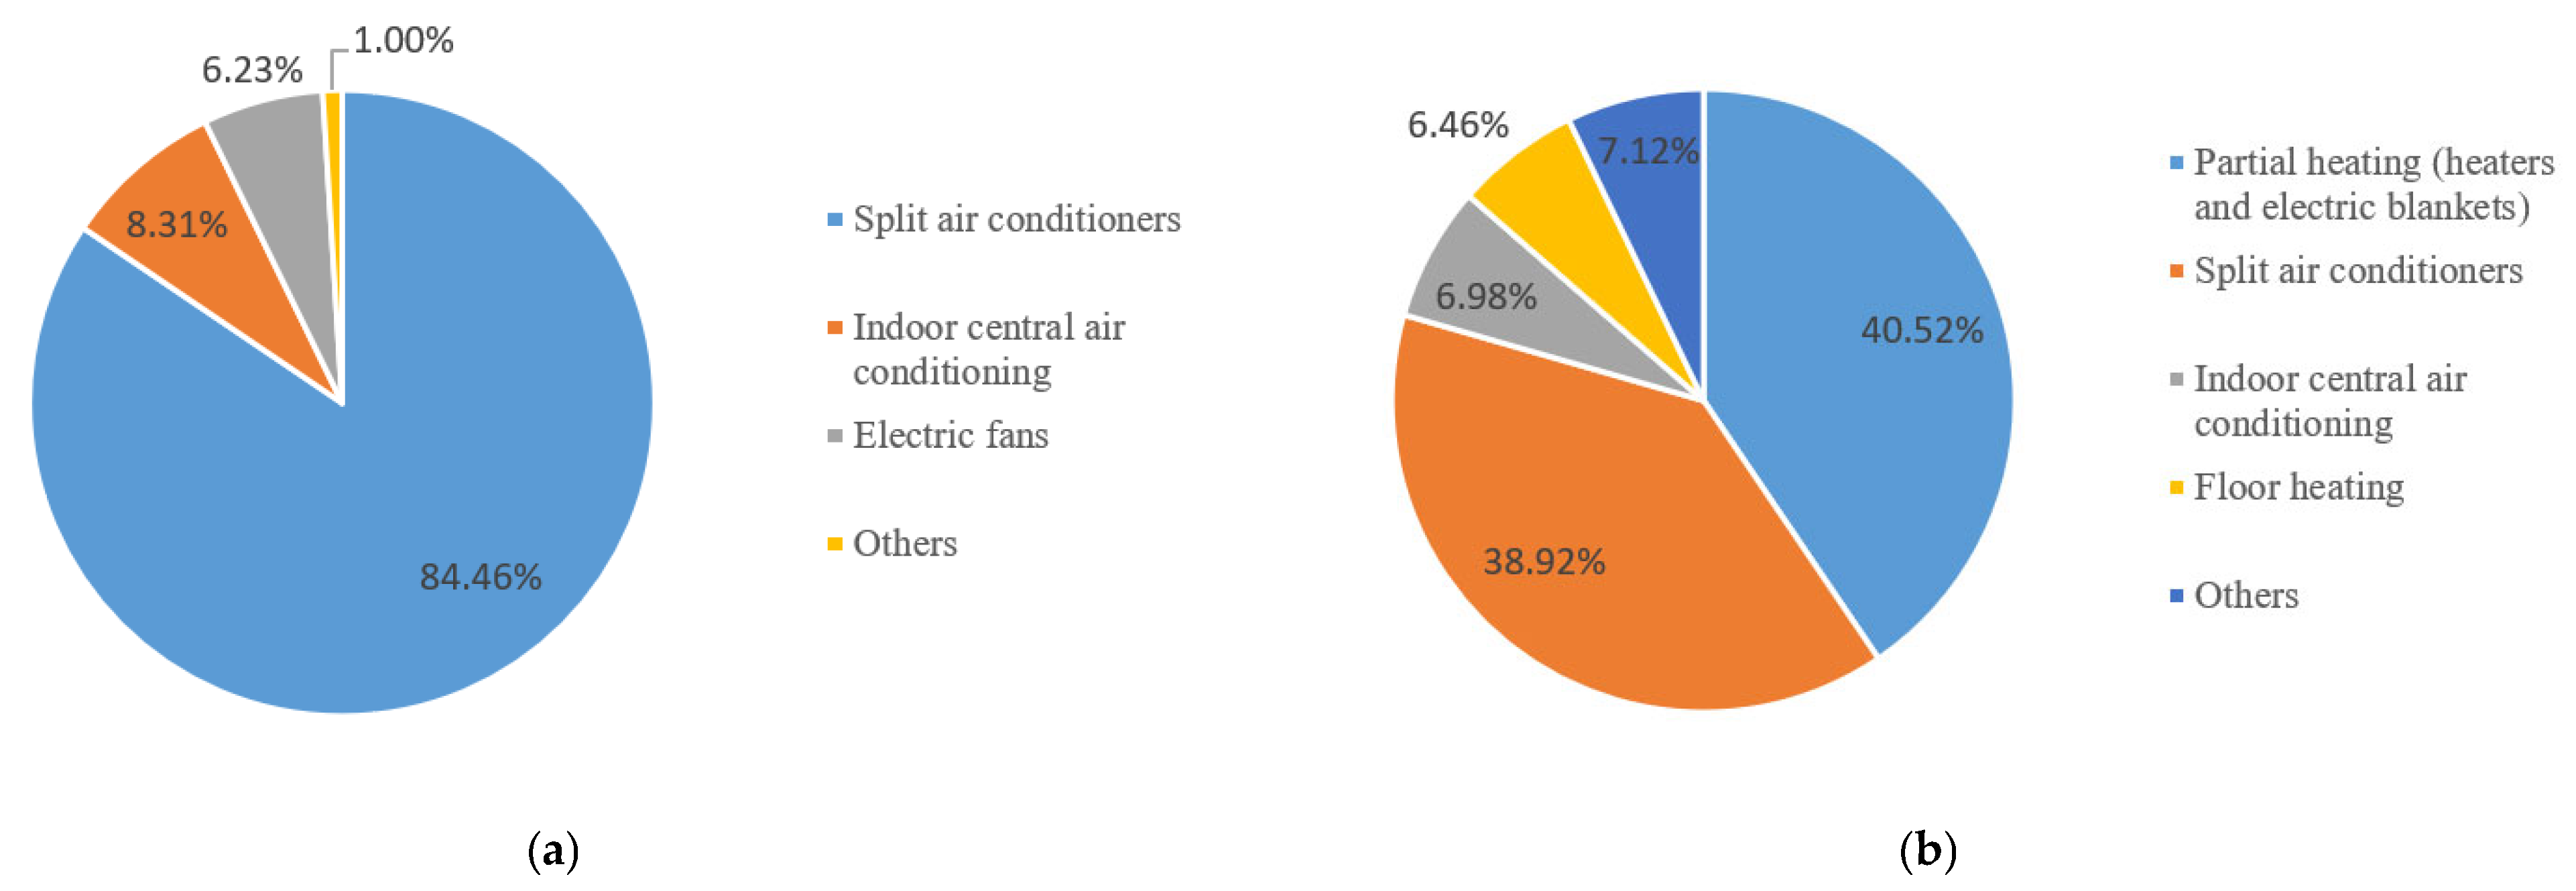
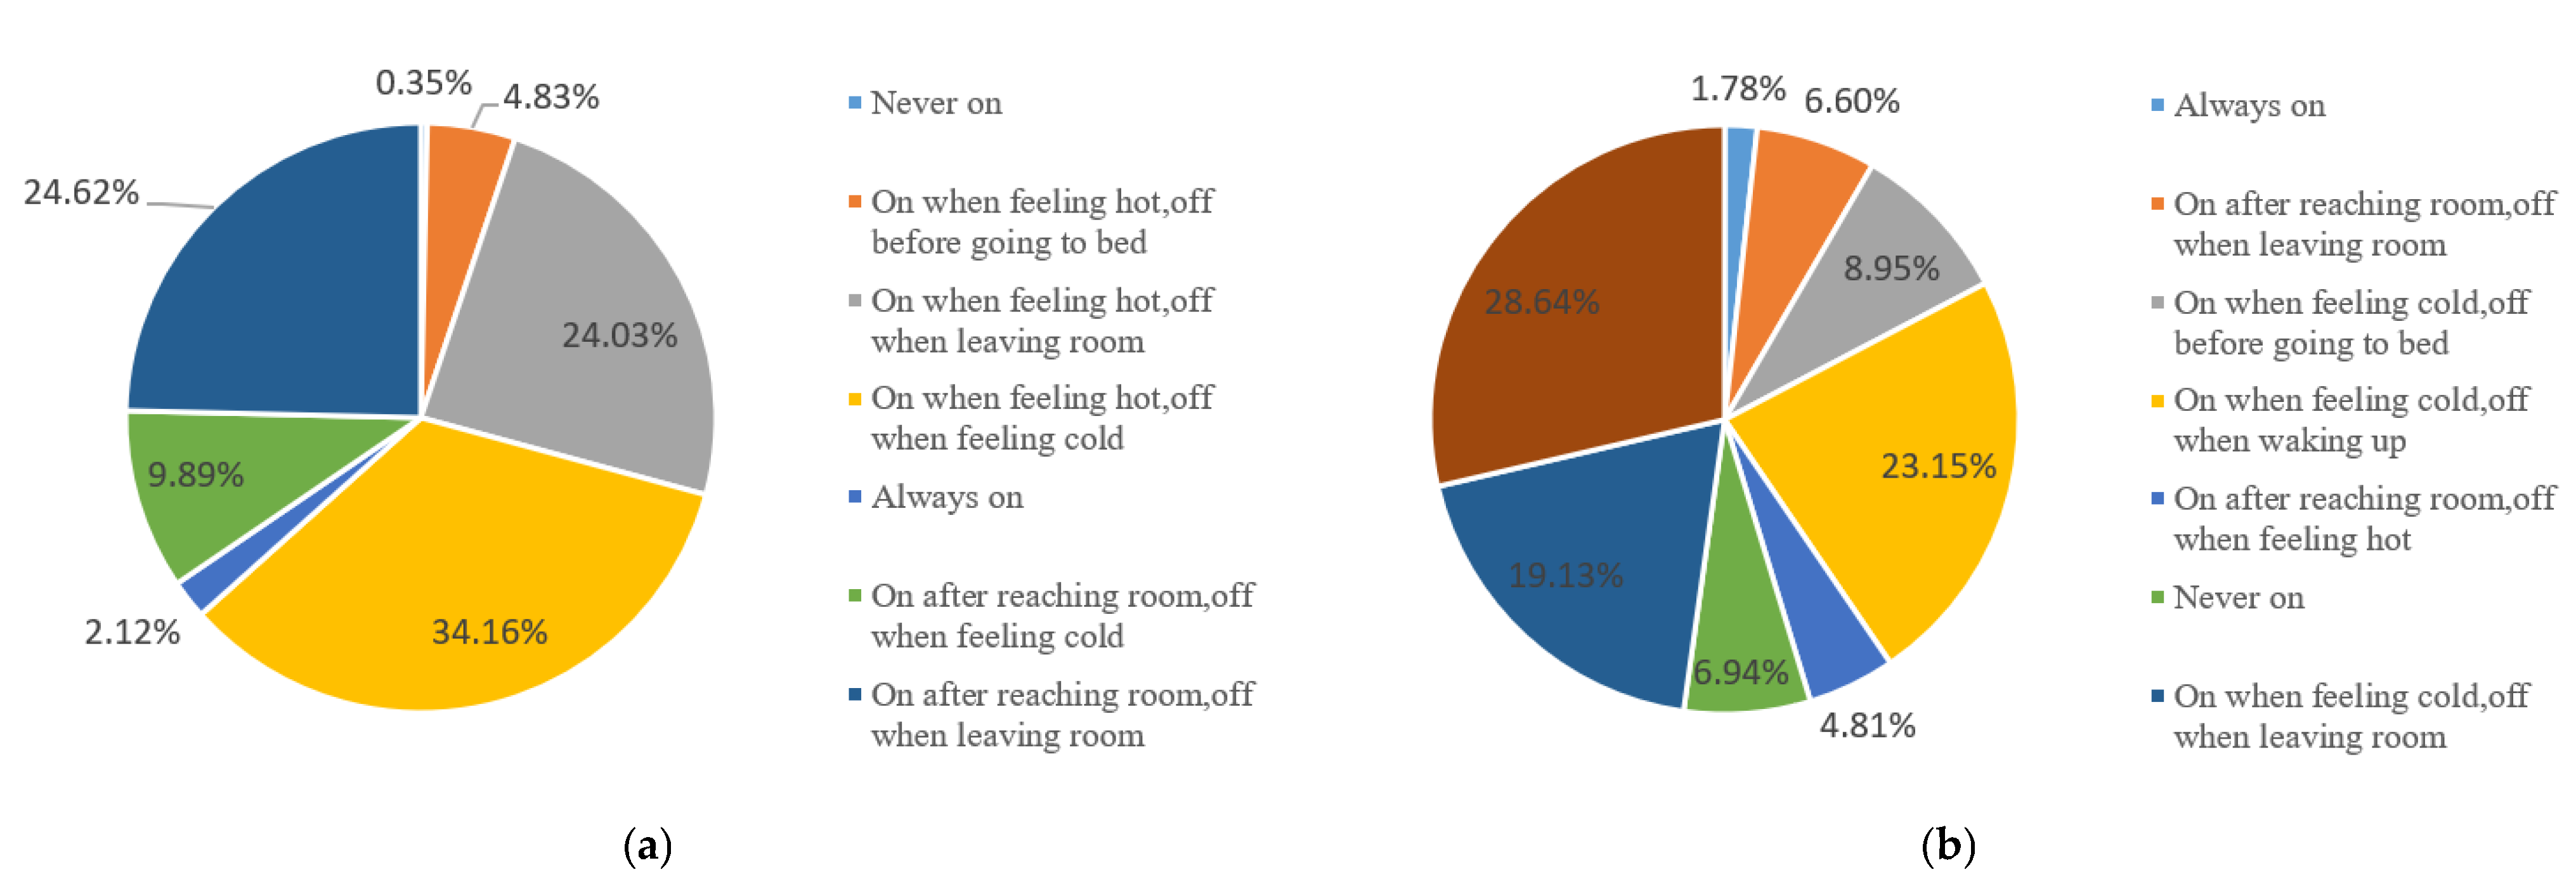
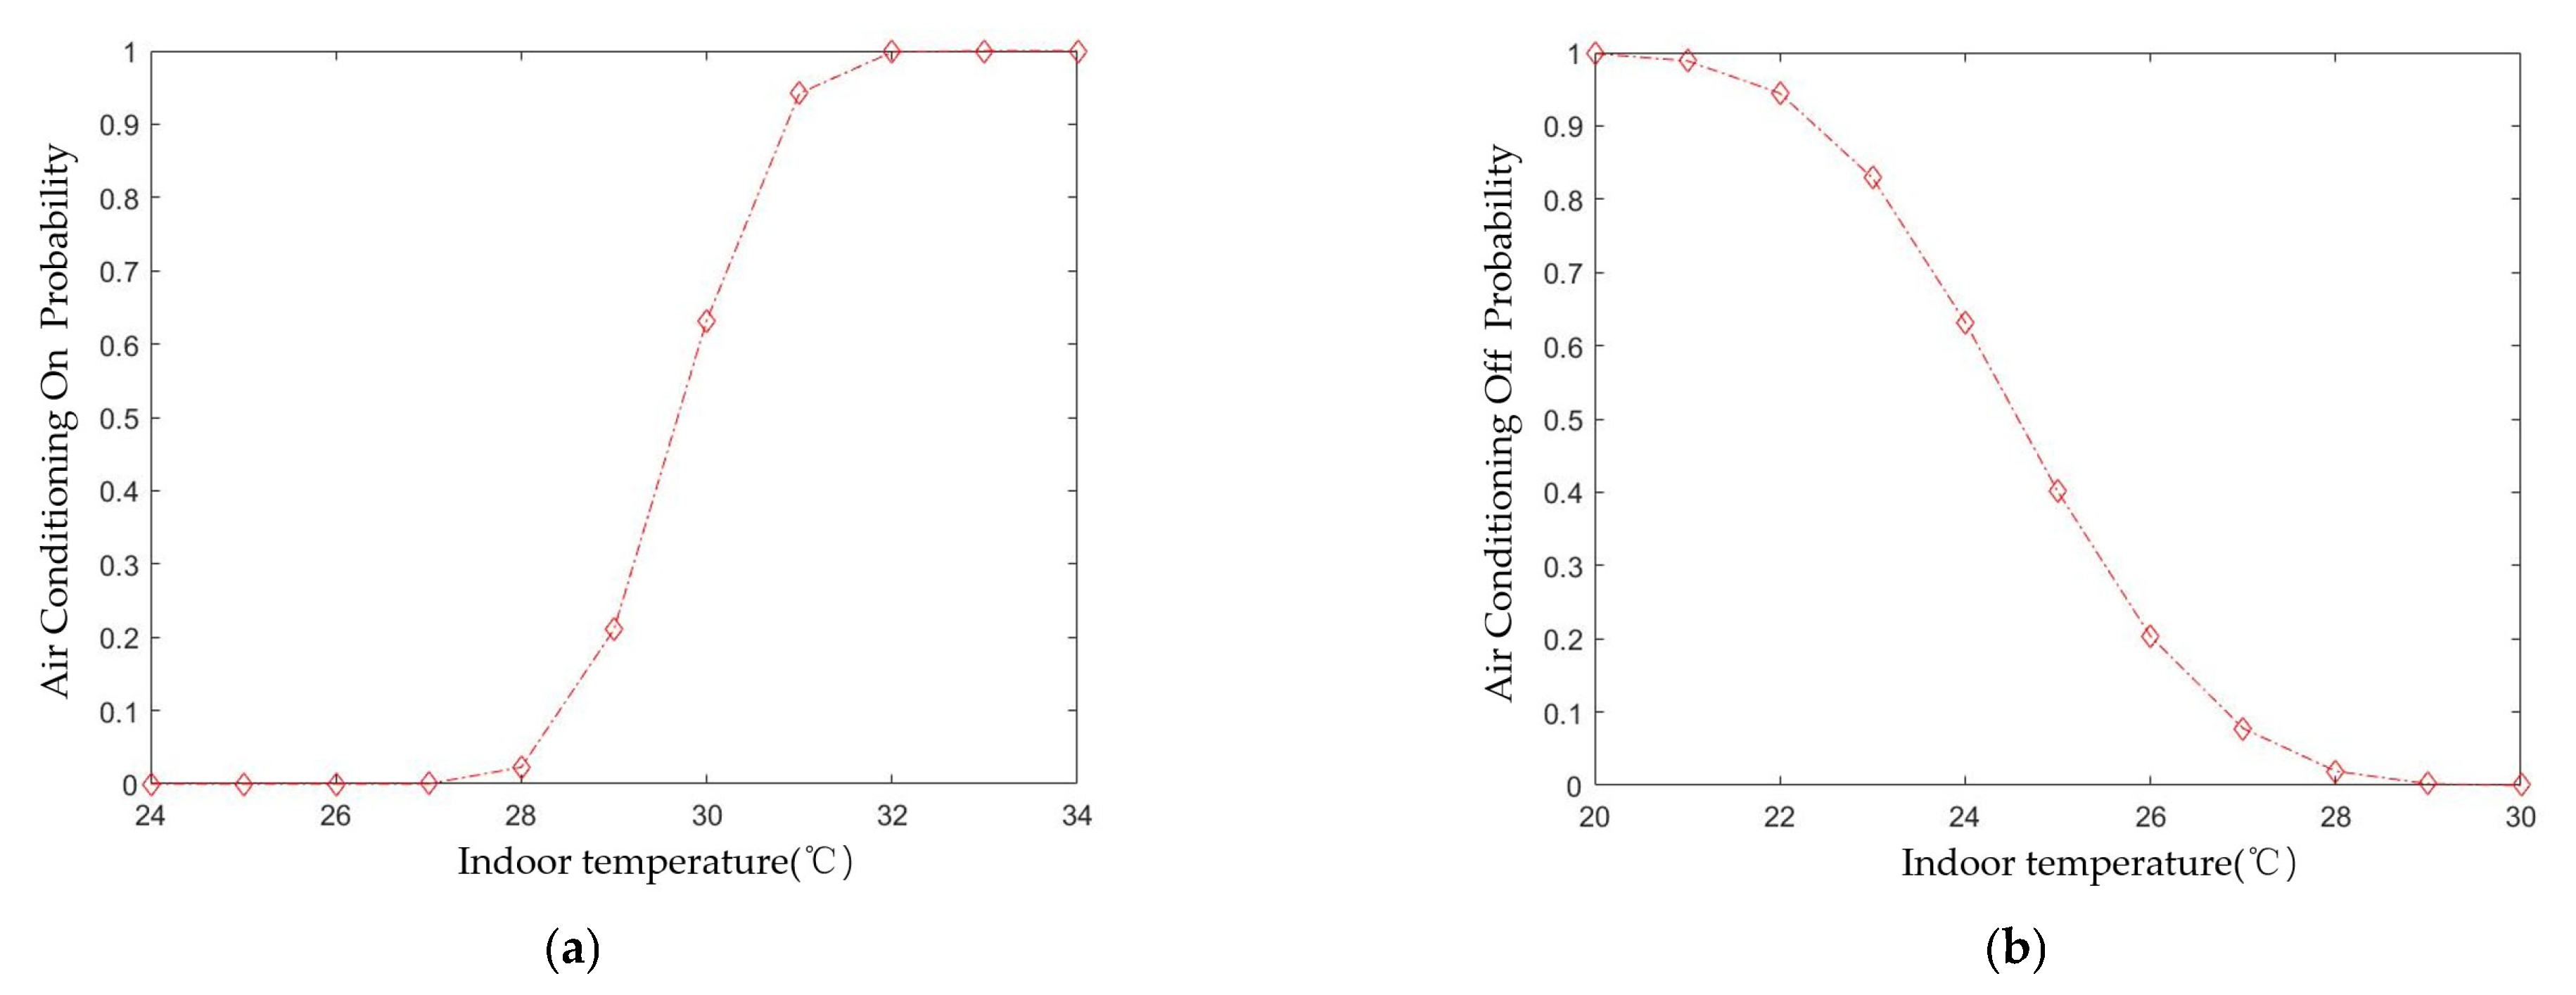
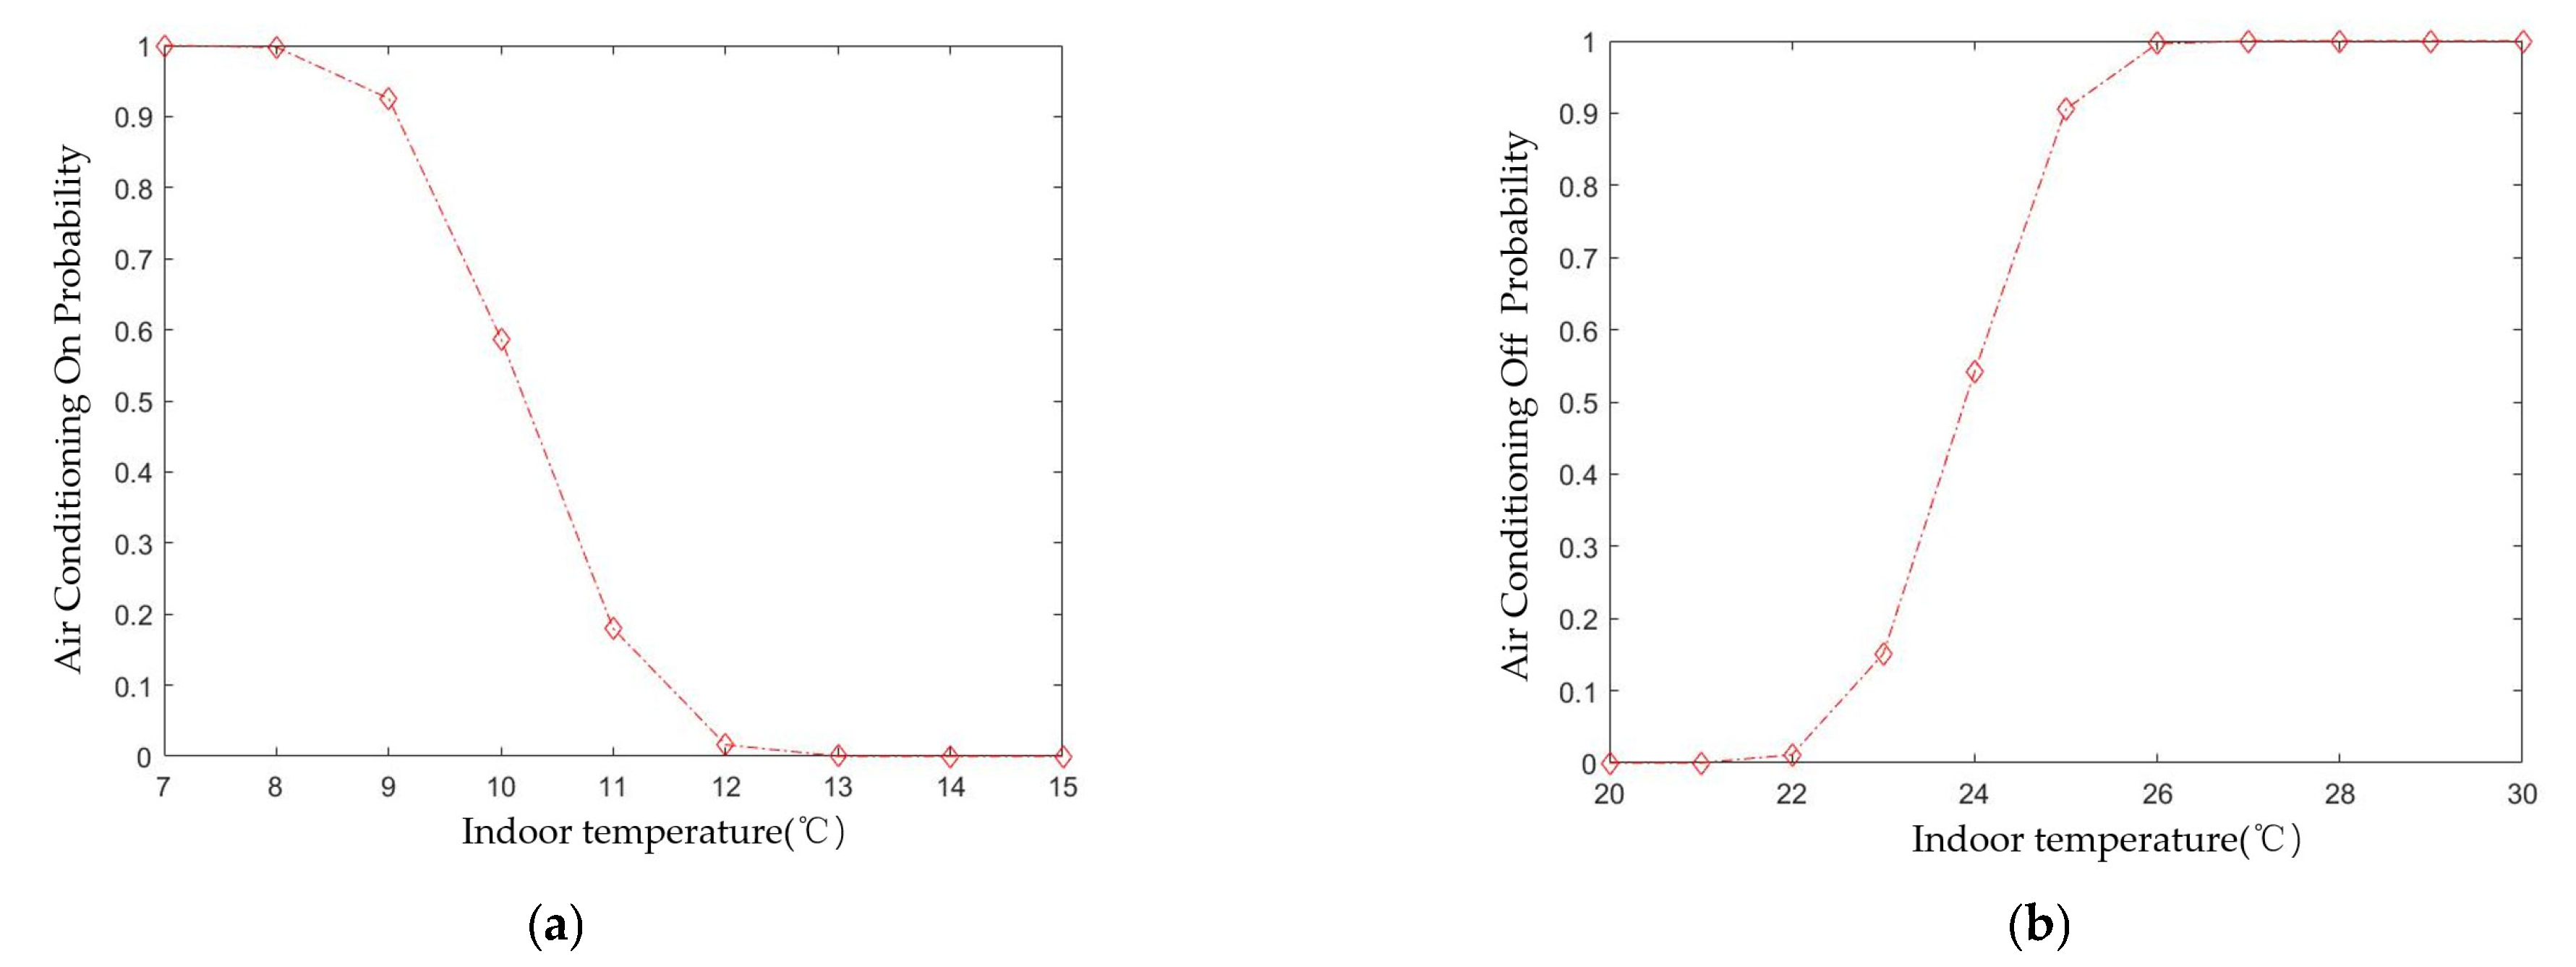
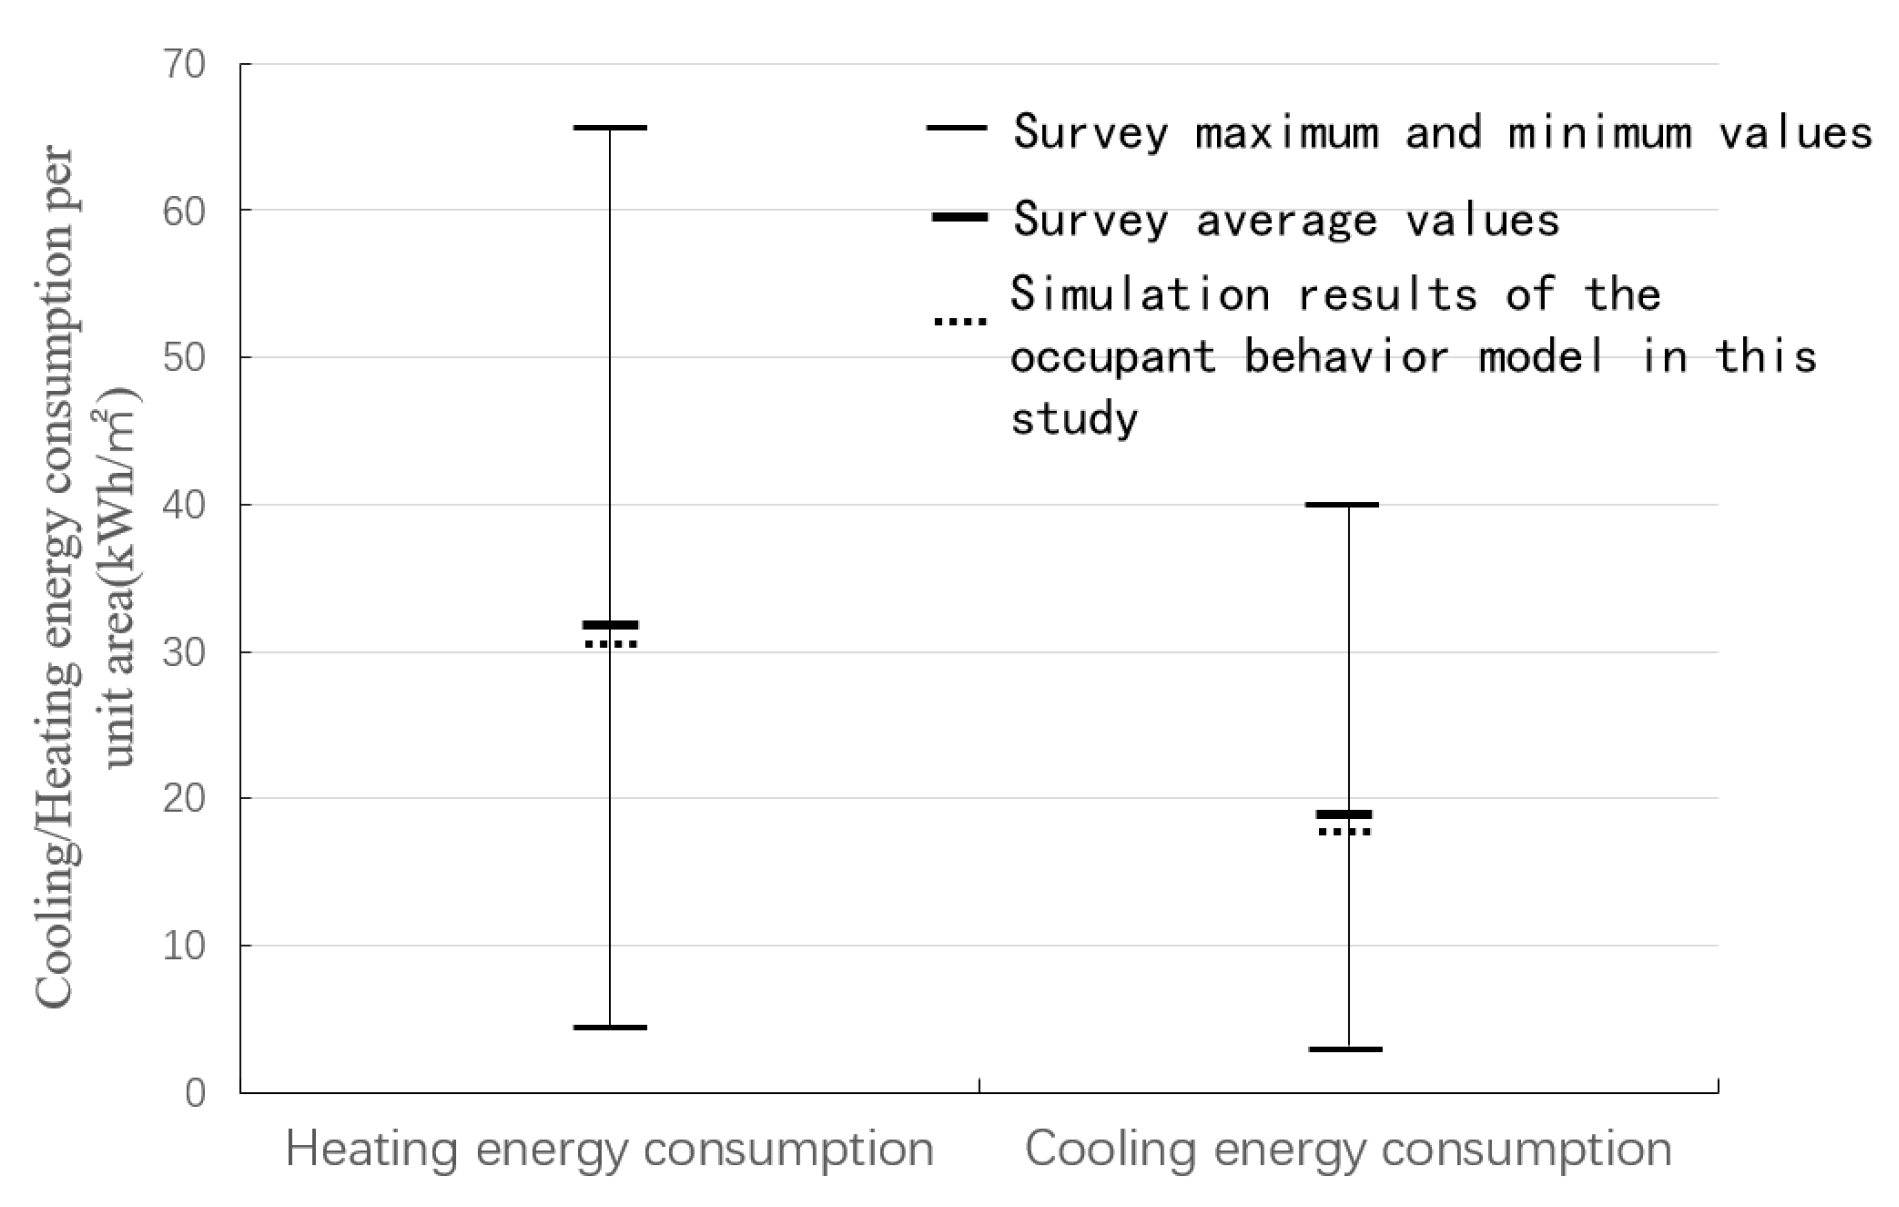
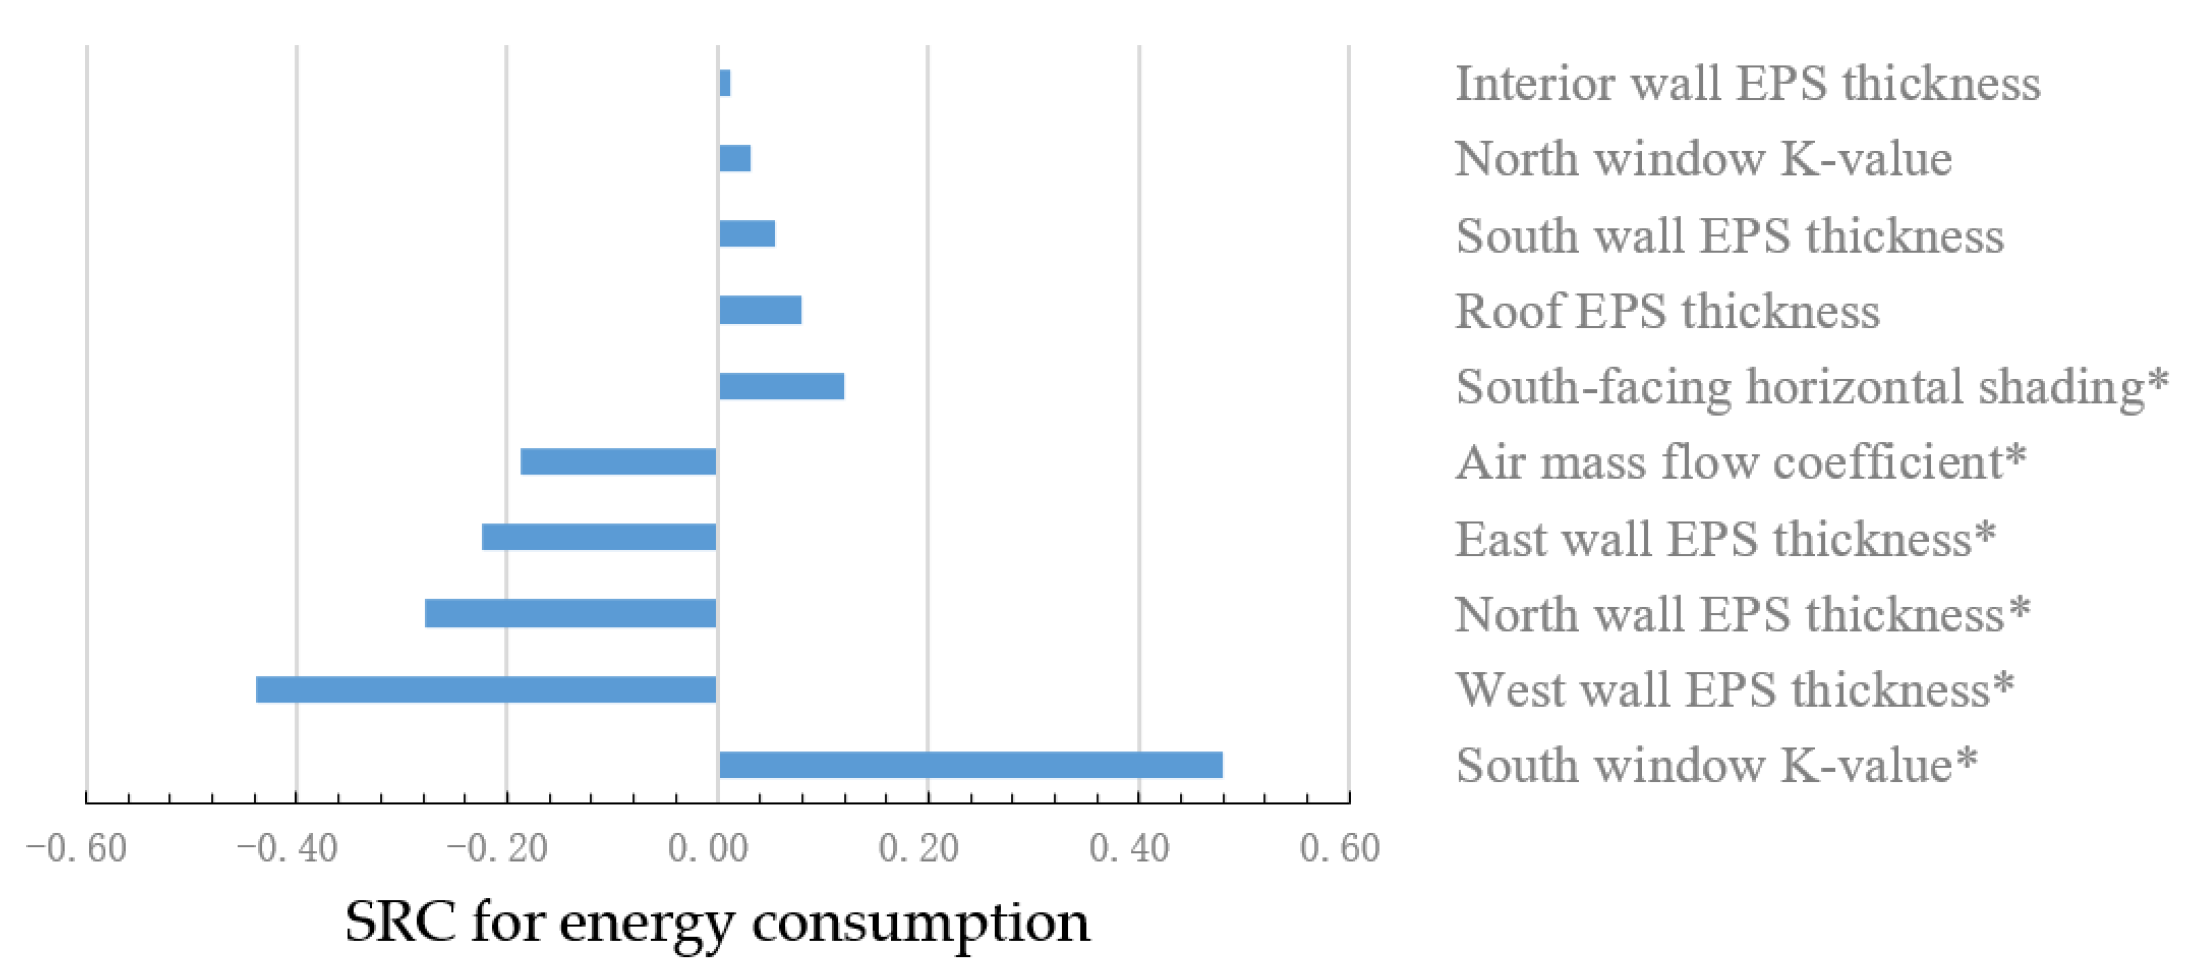
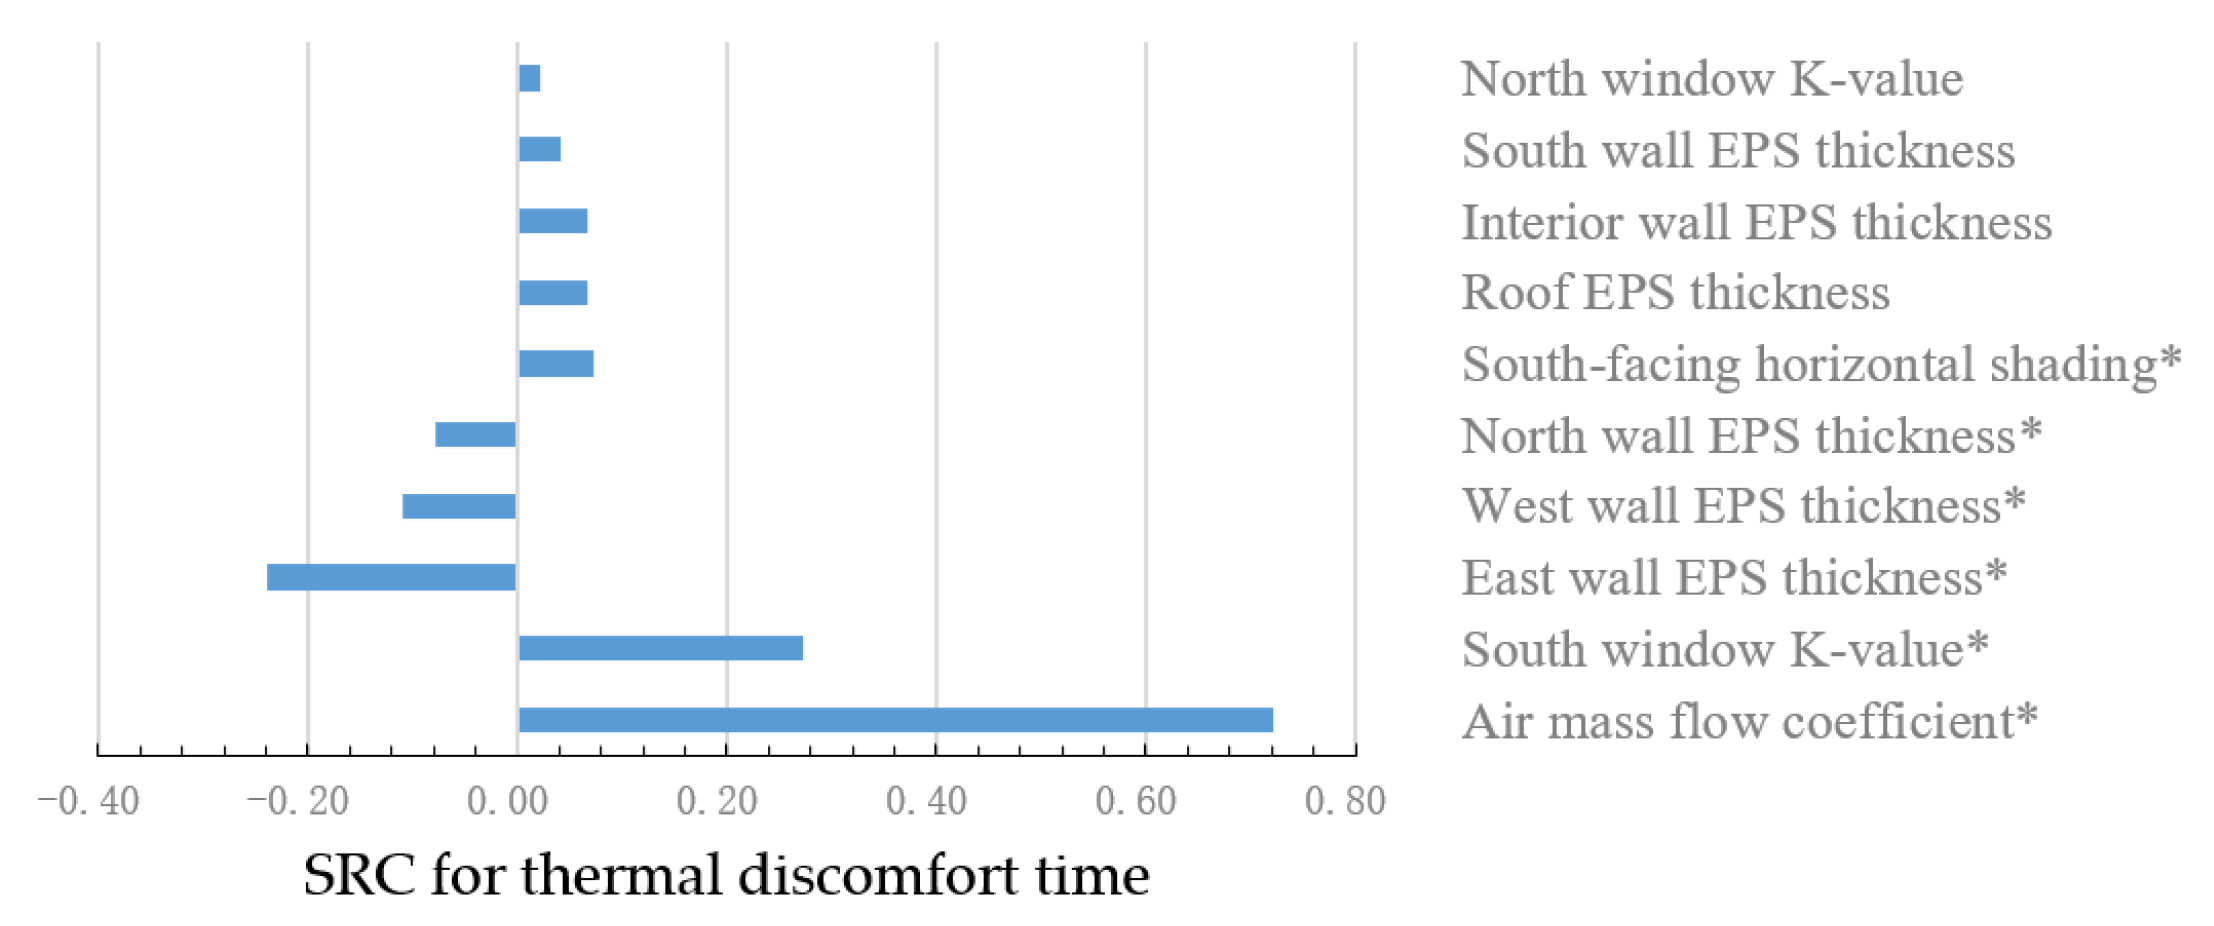
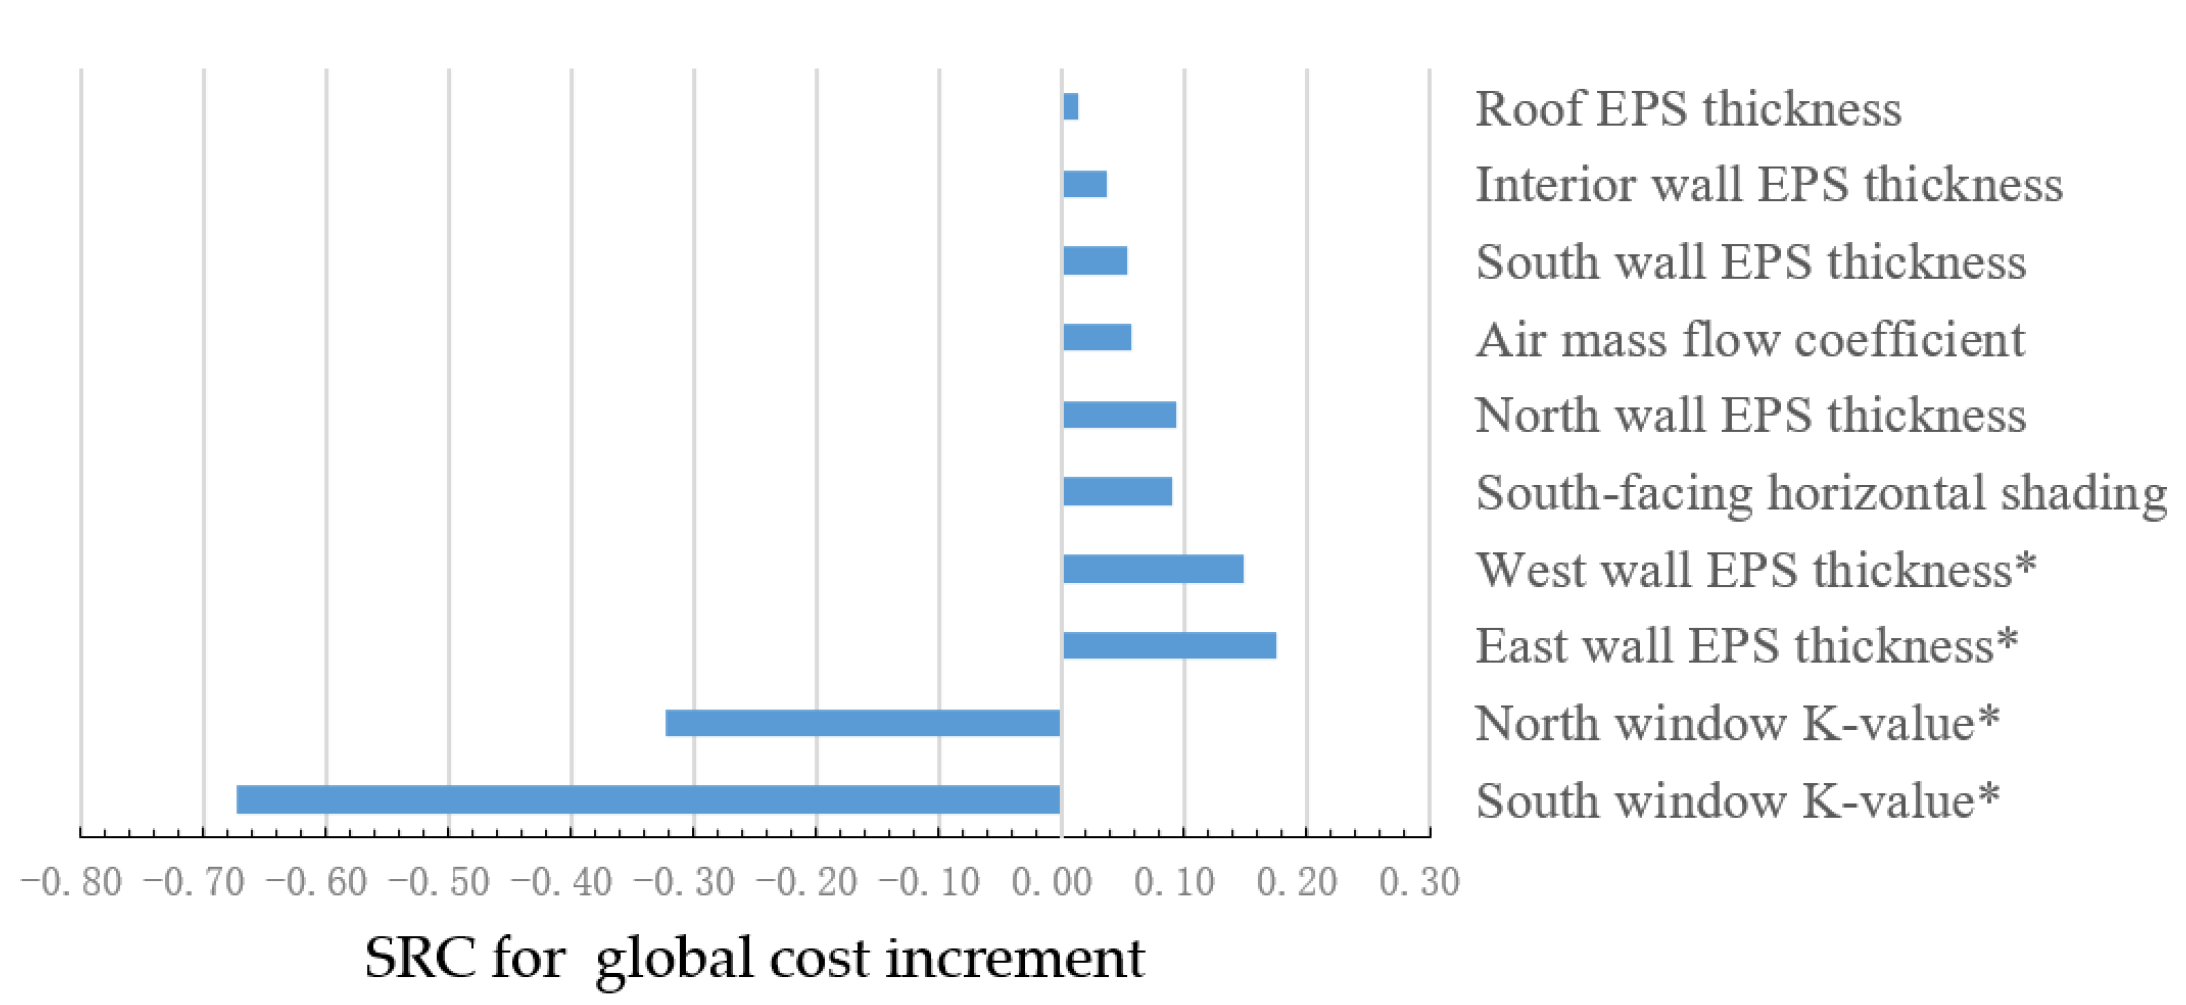
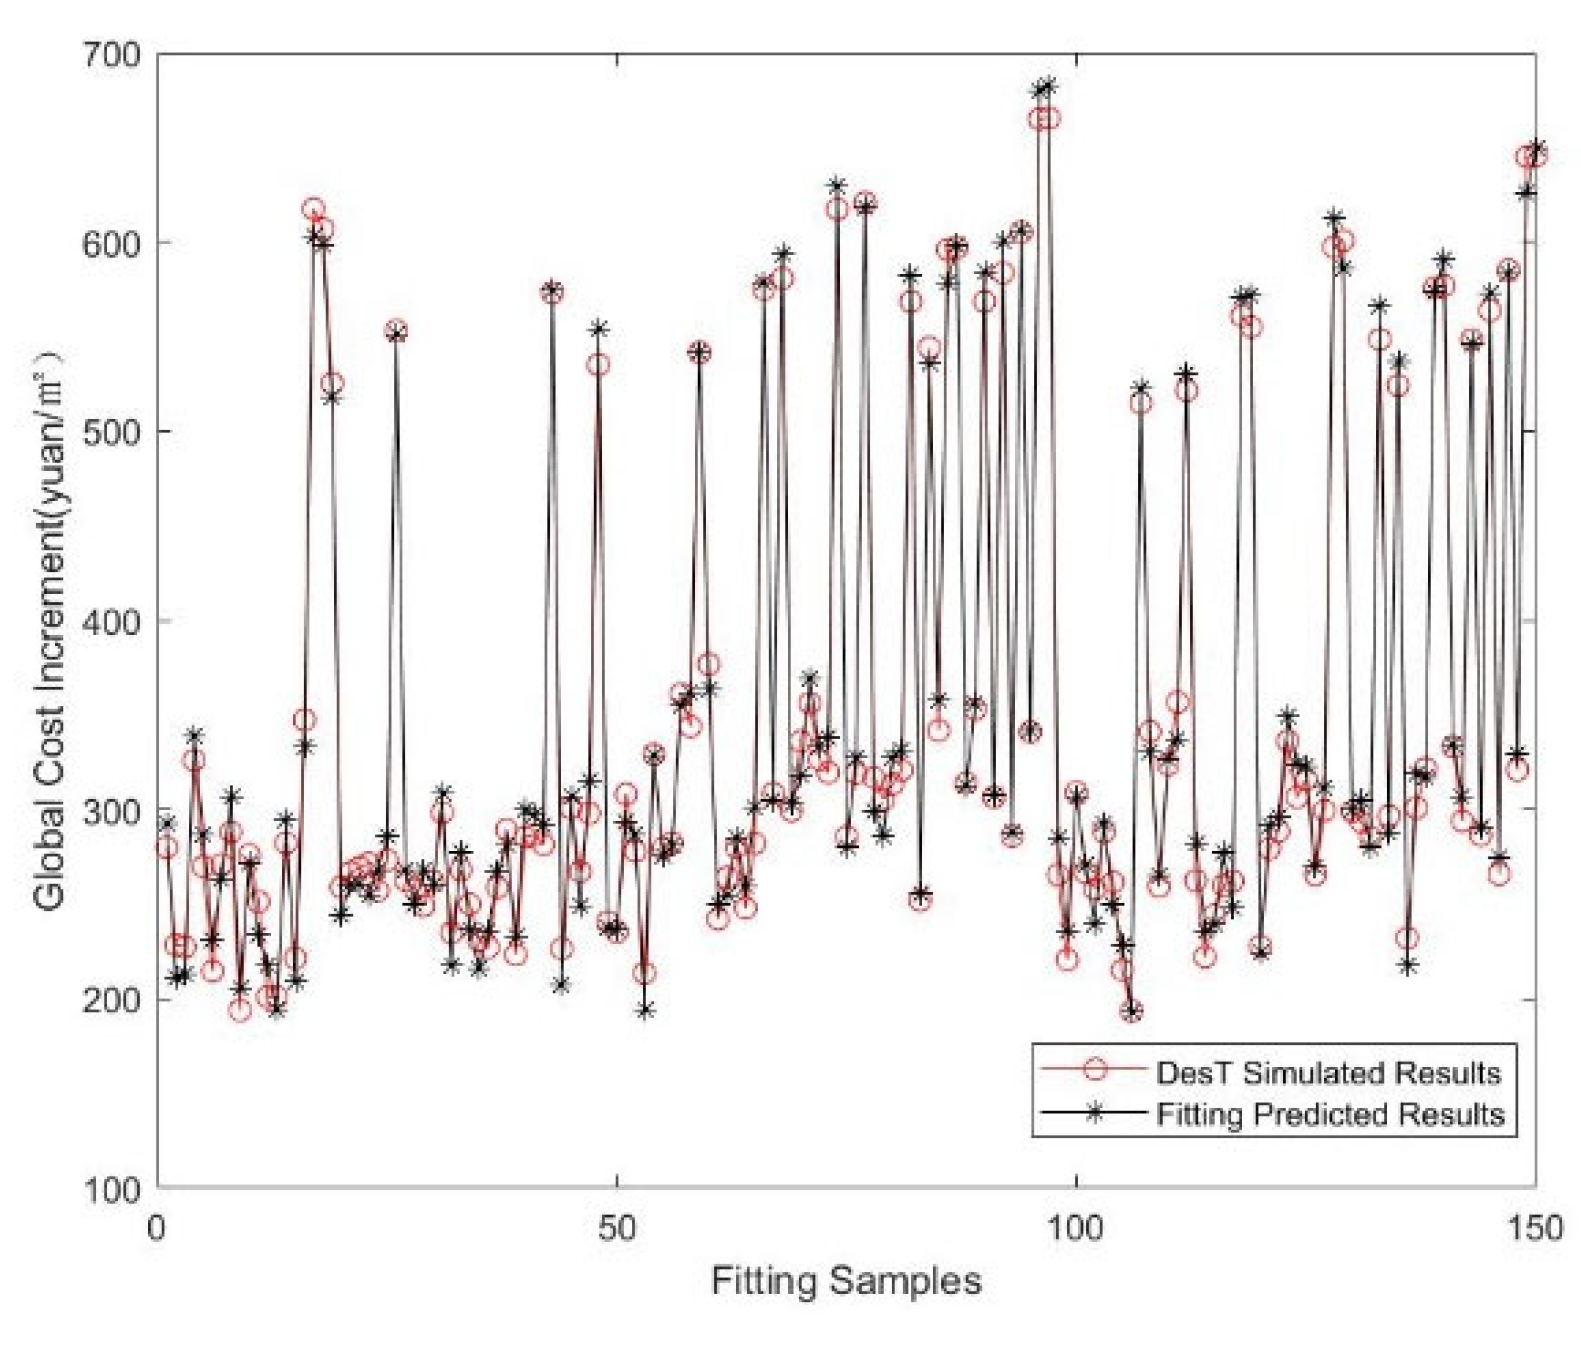
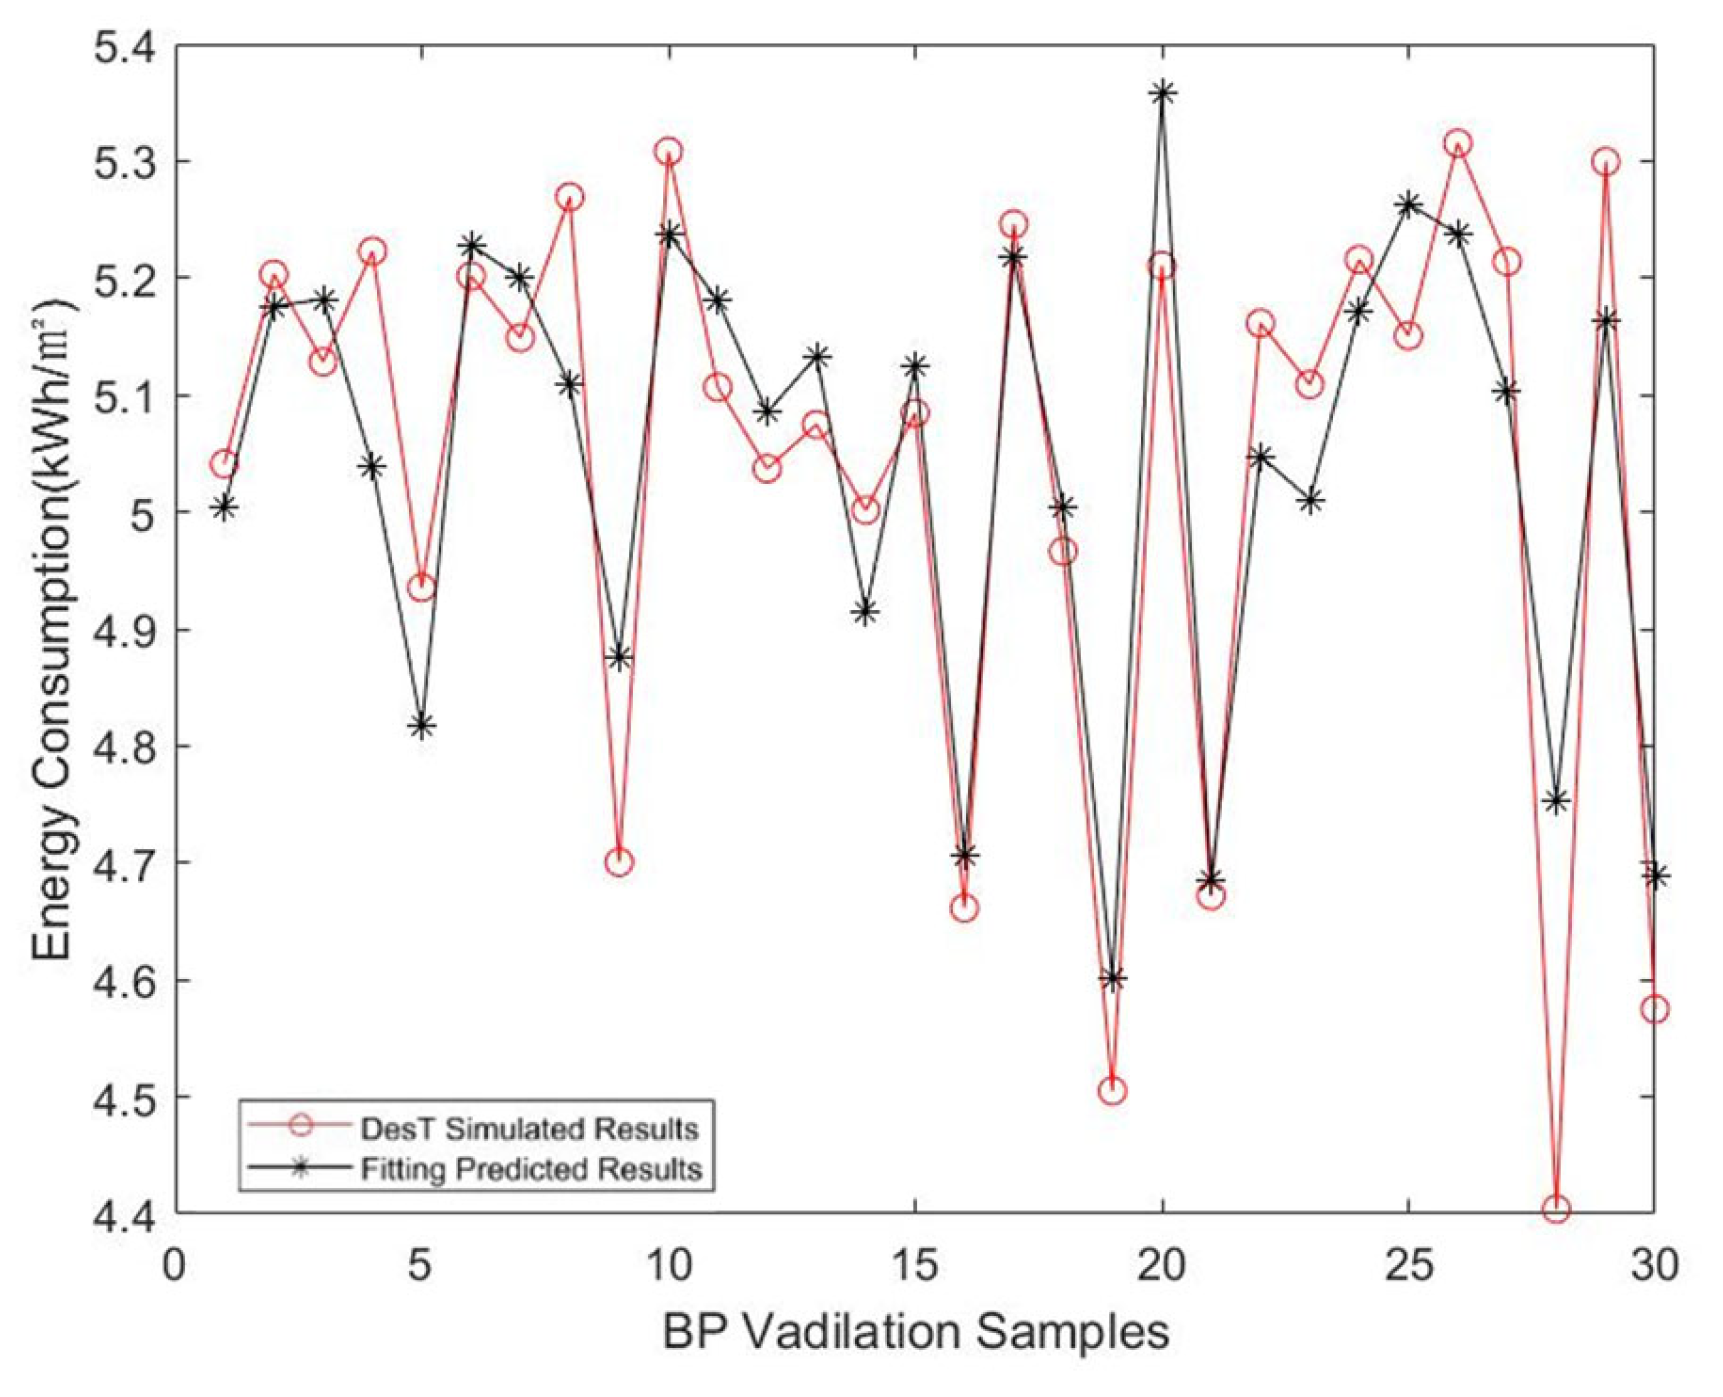
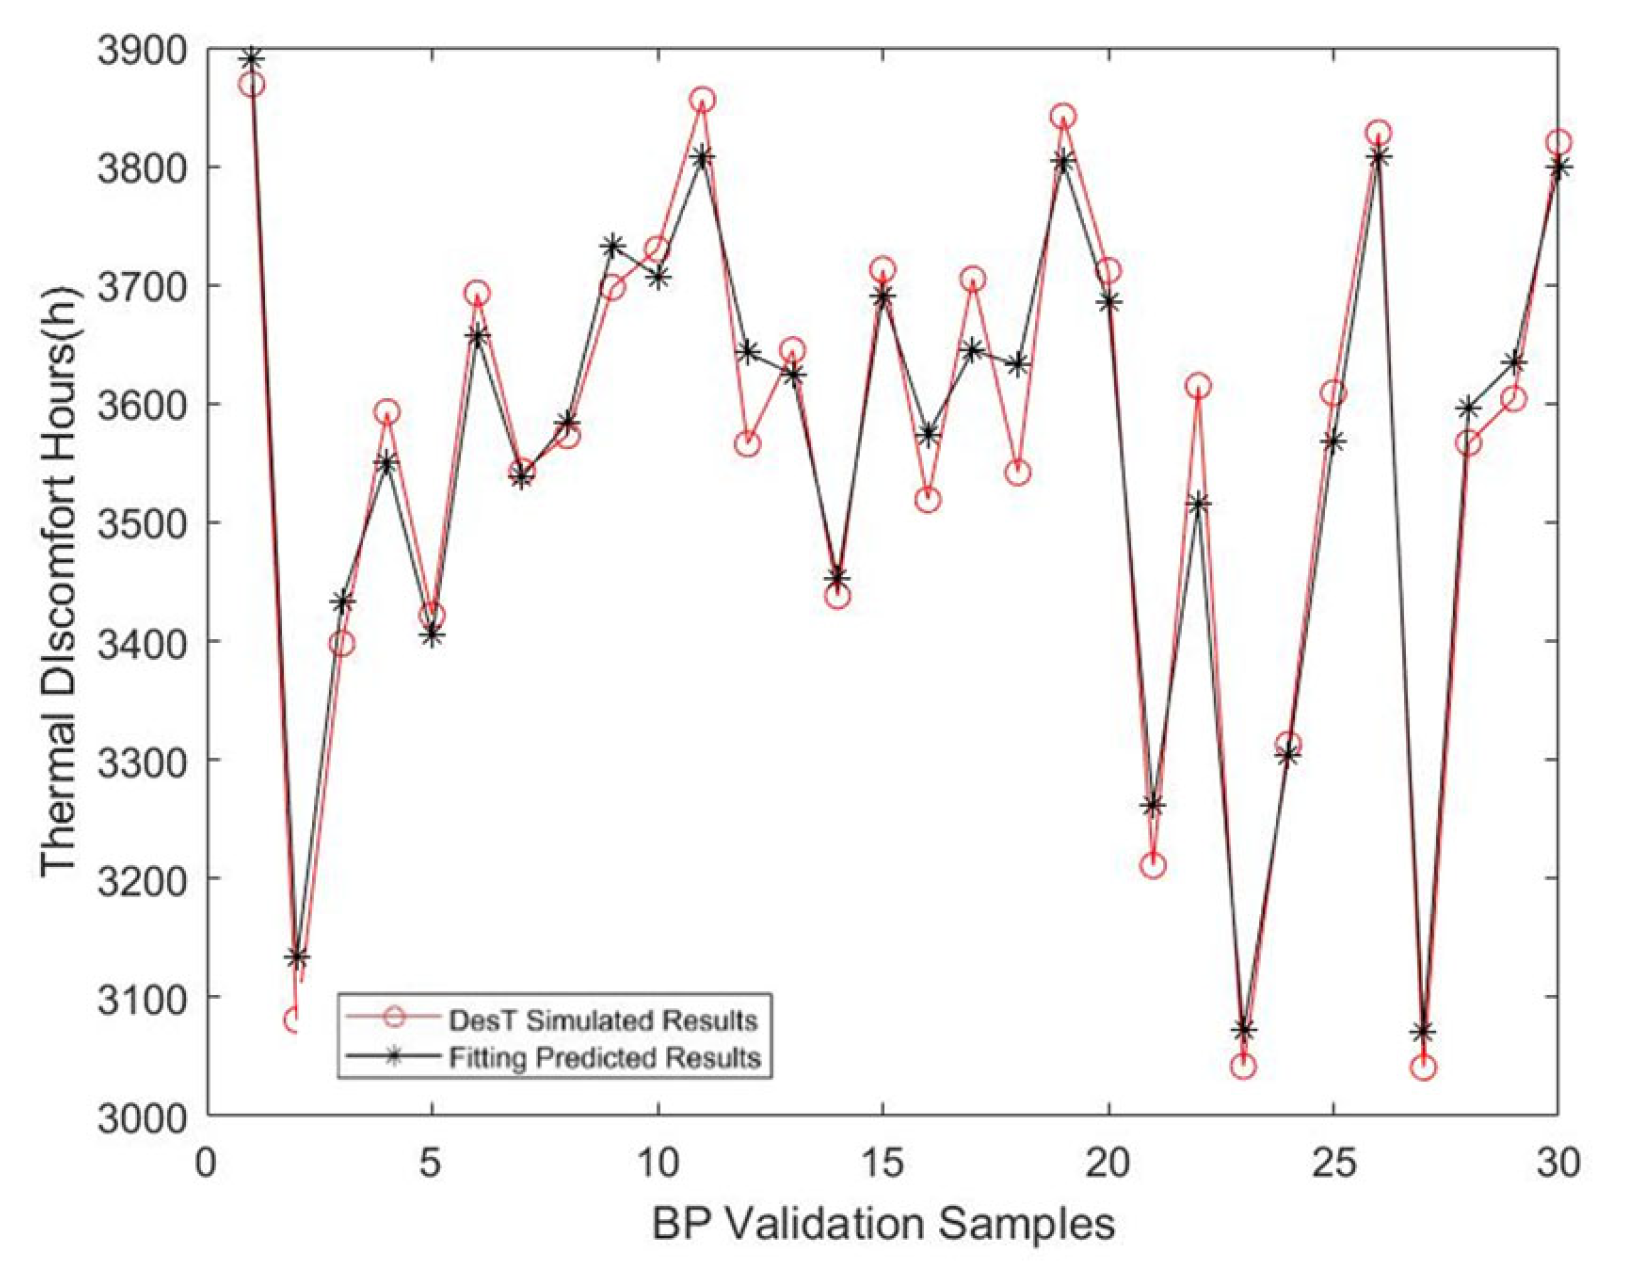
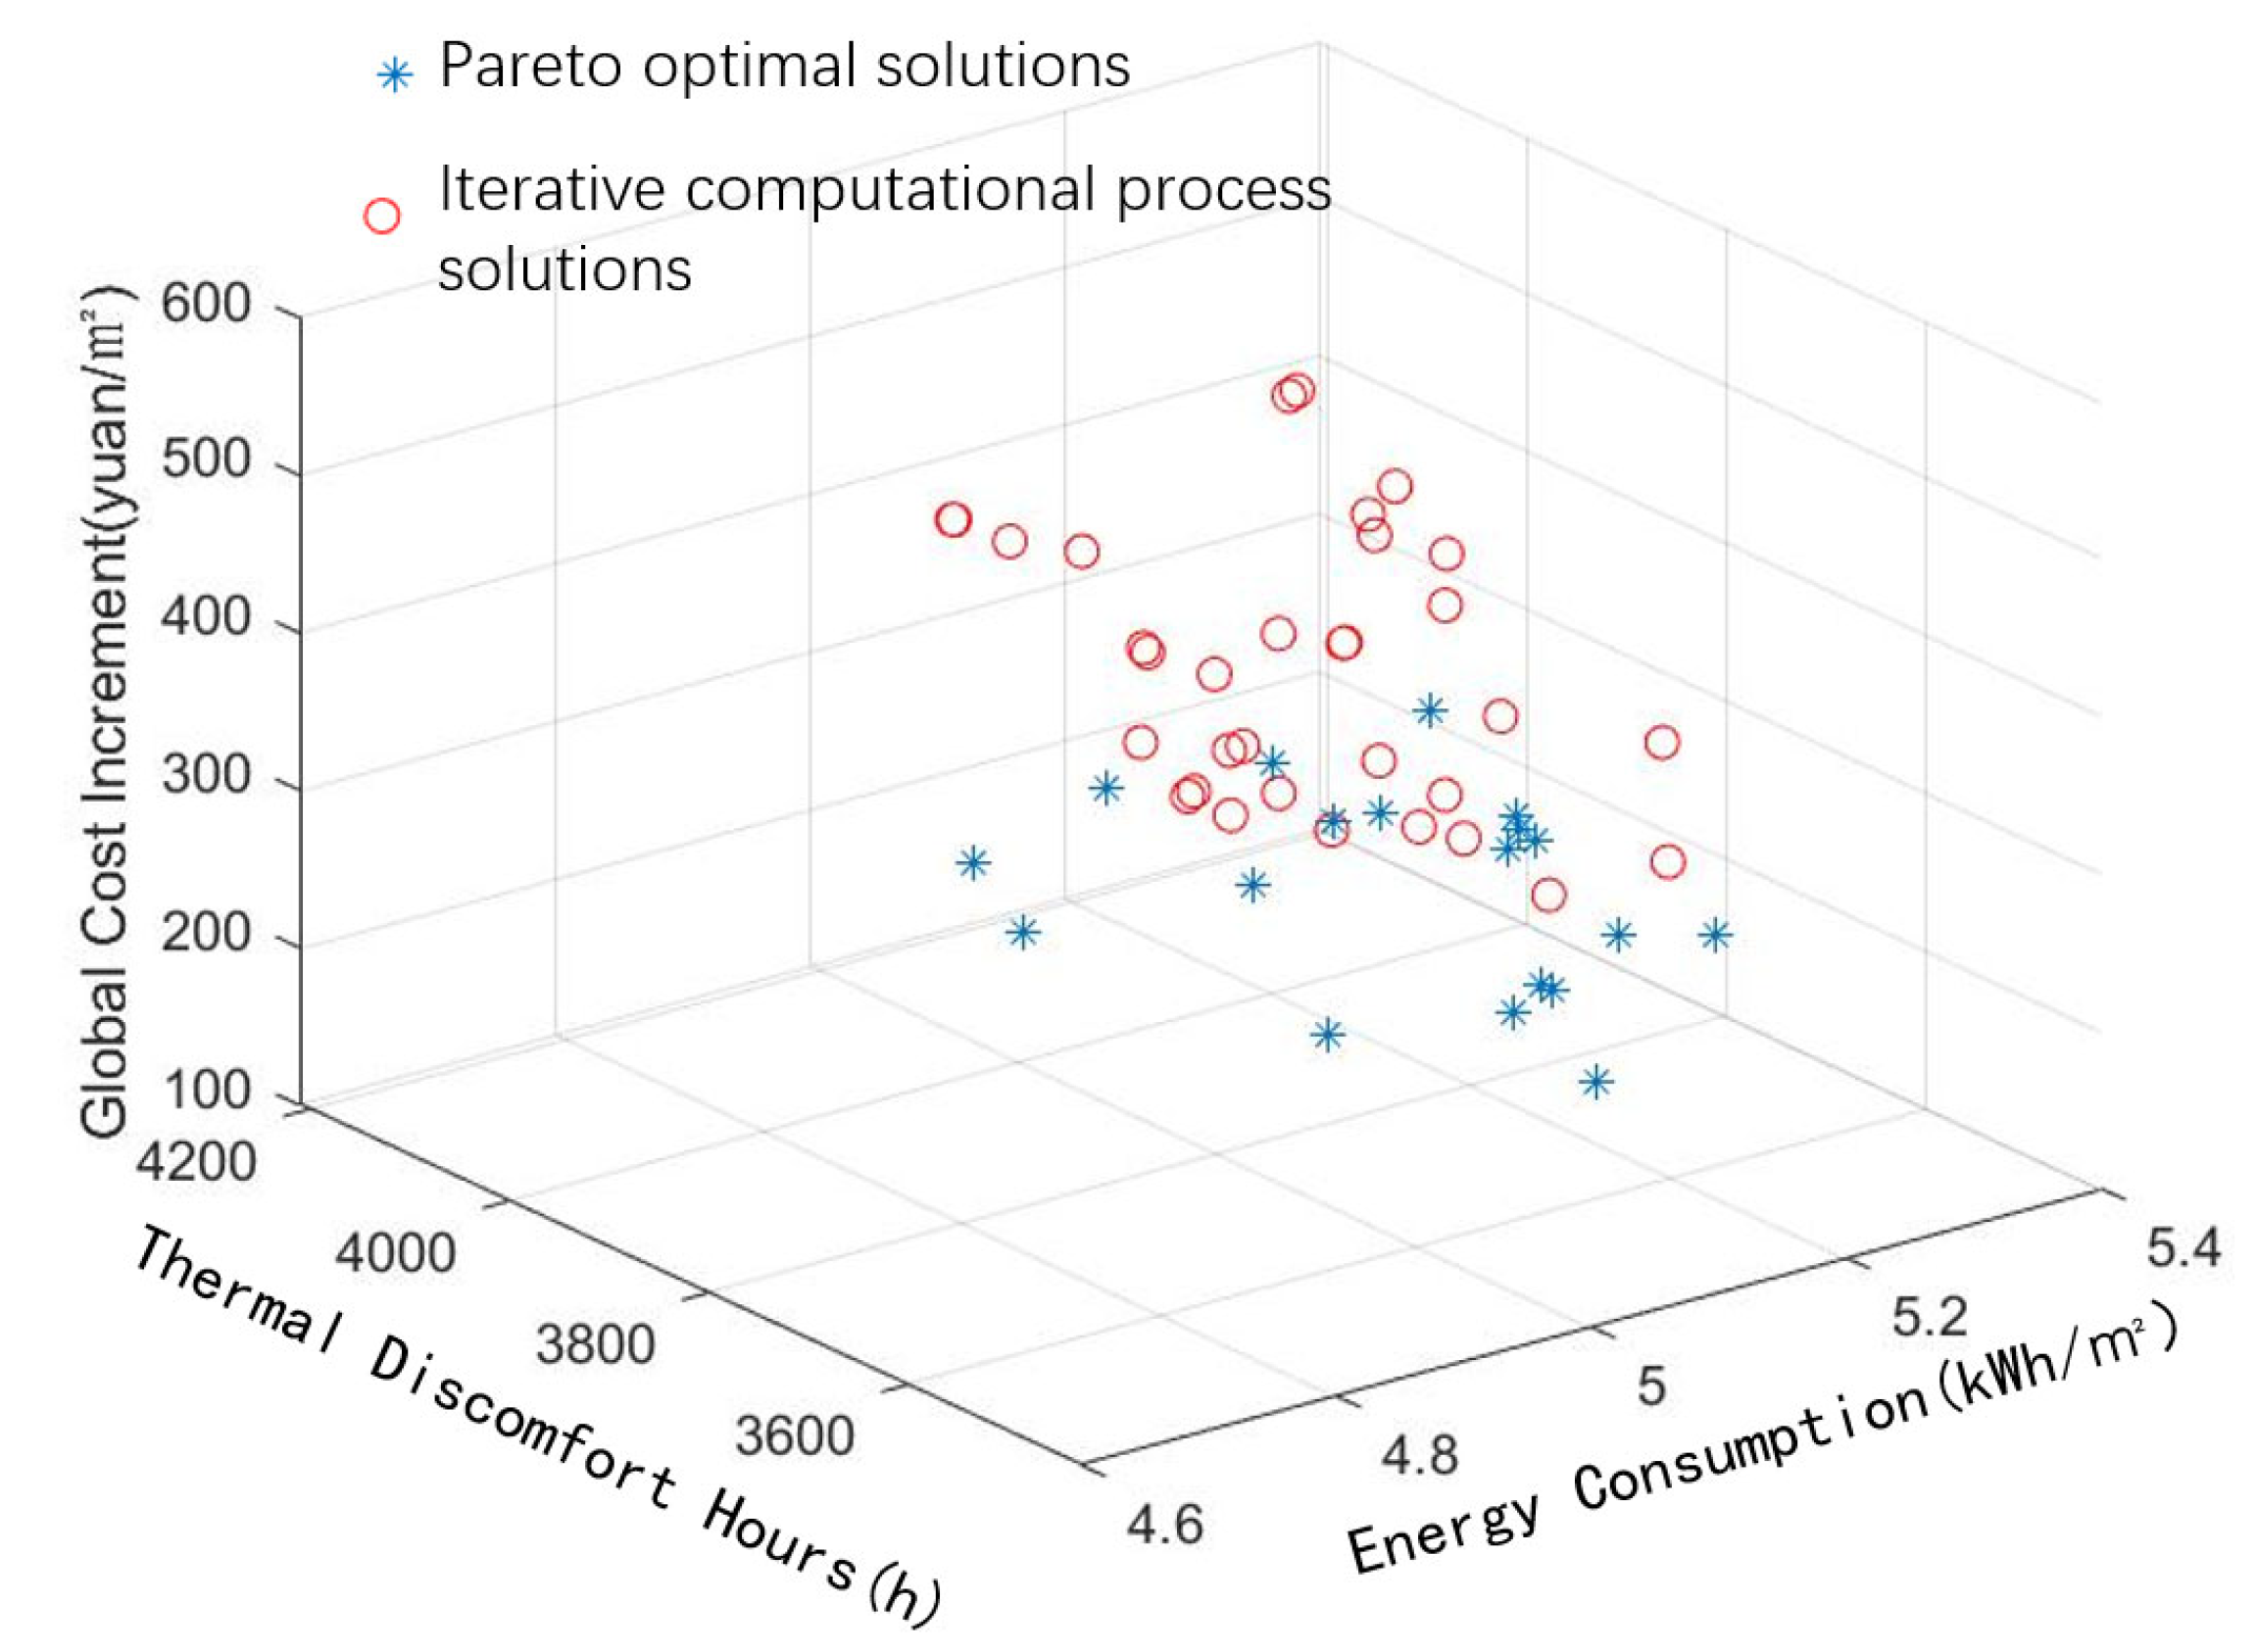