

Assessment of Thermal Comfort and Indoor Air Quality in Library Group Study Rooms


Abstract
:1. Introduction
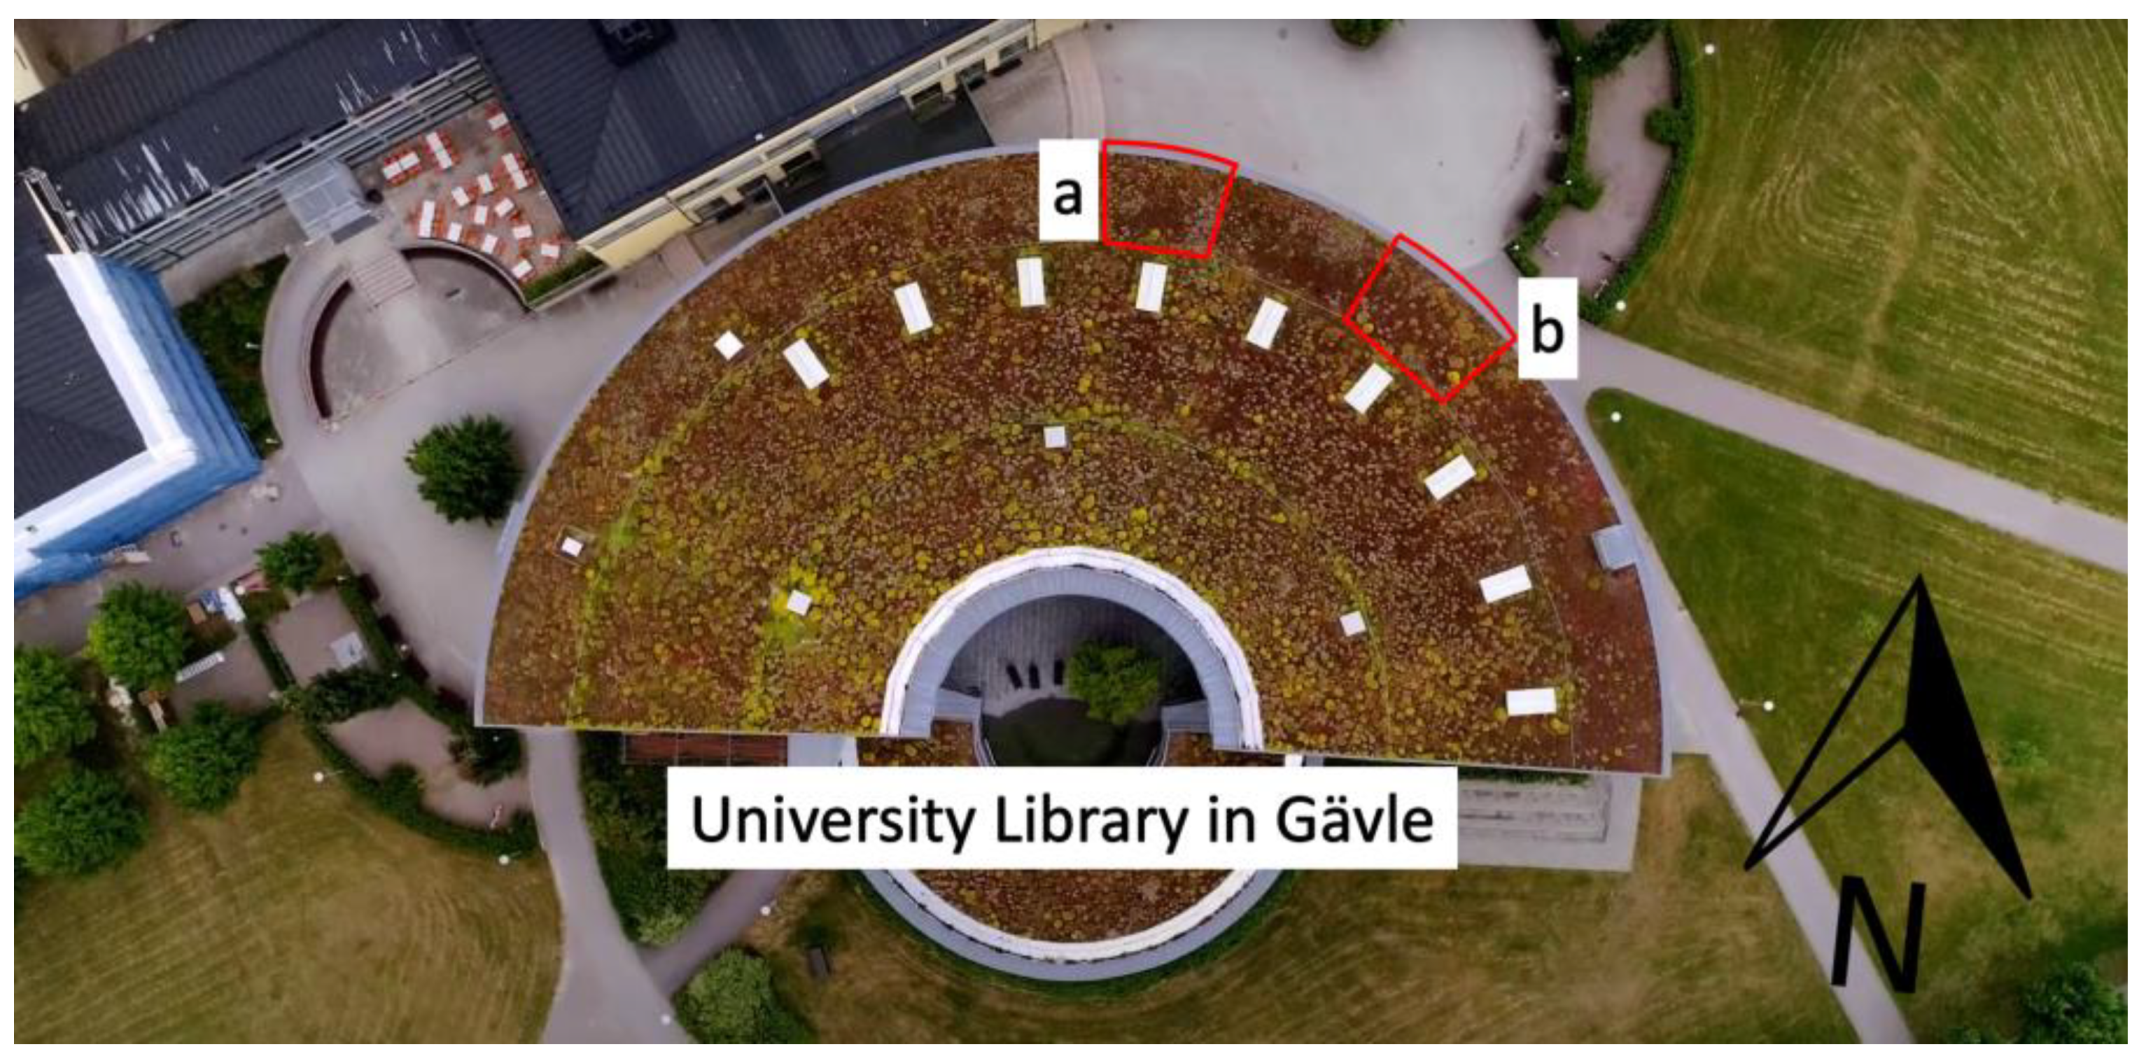
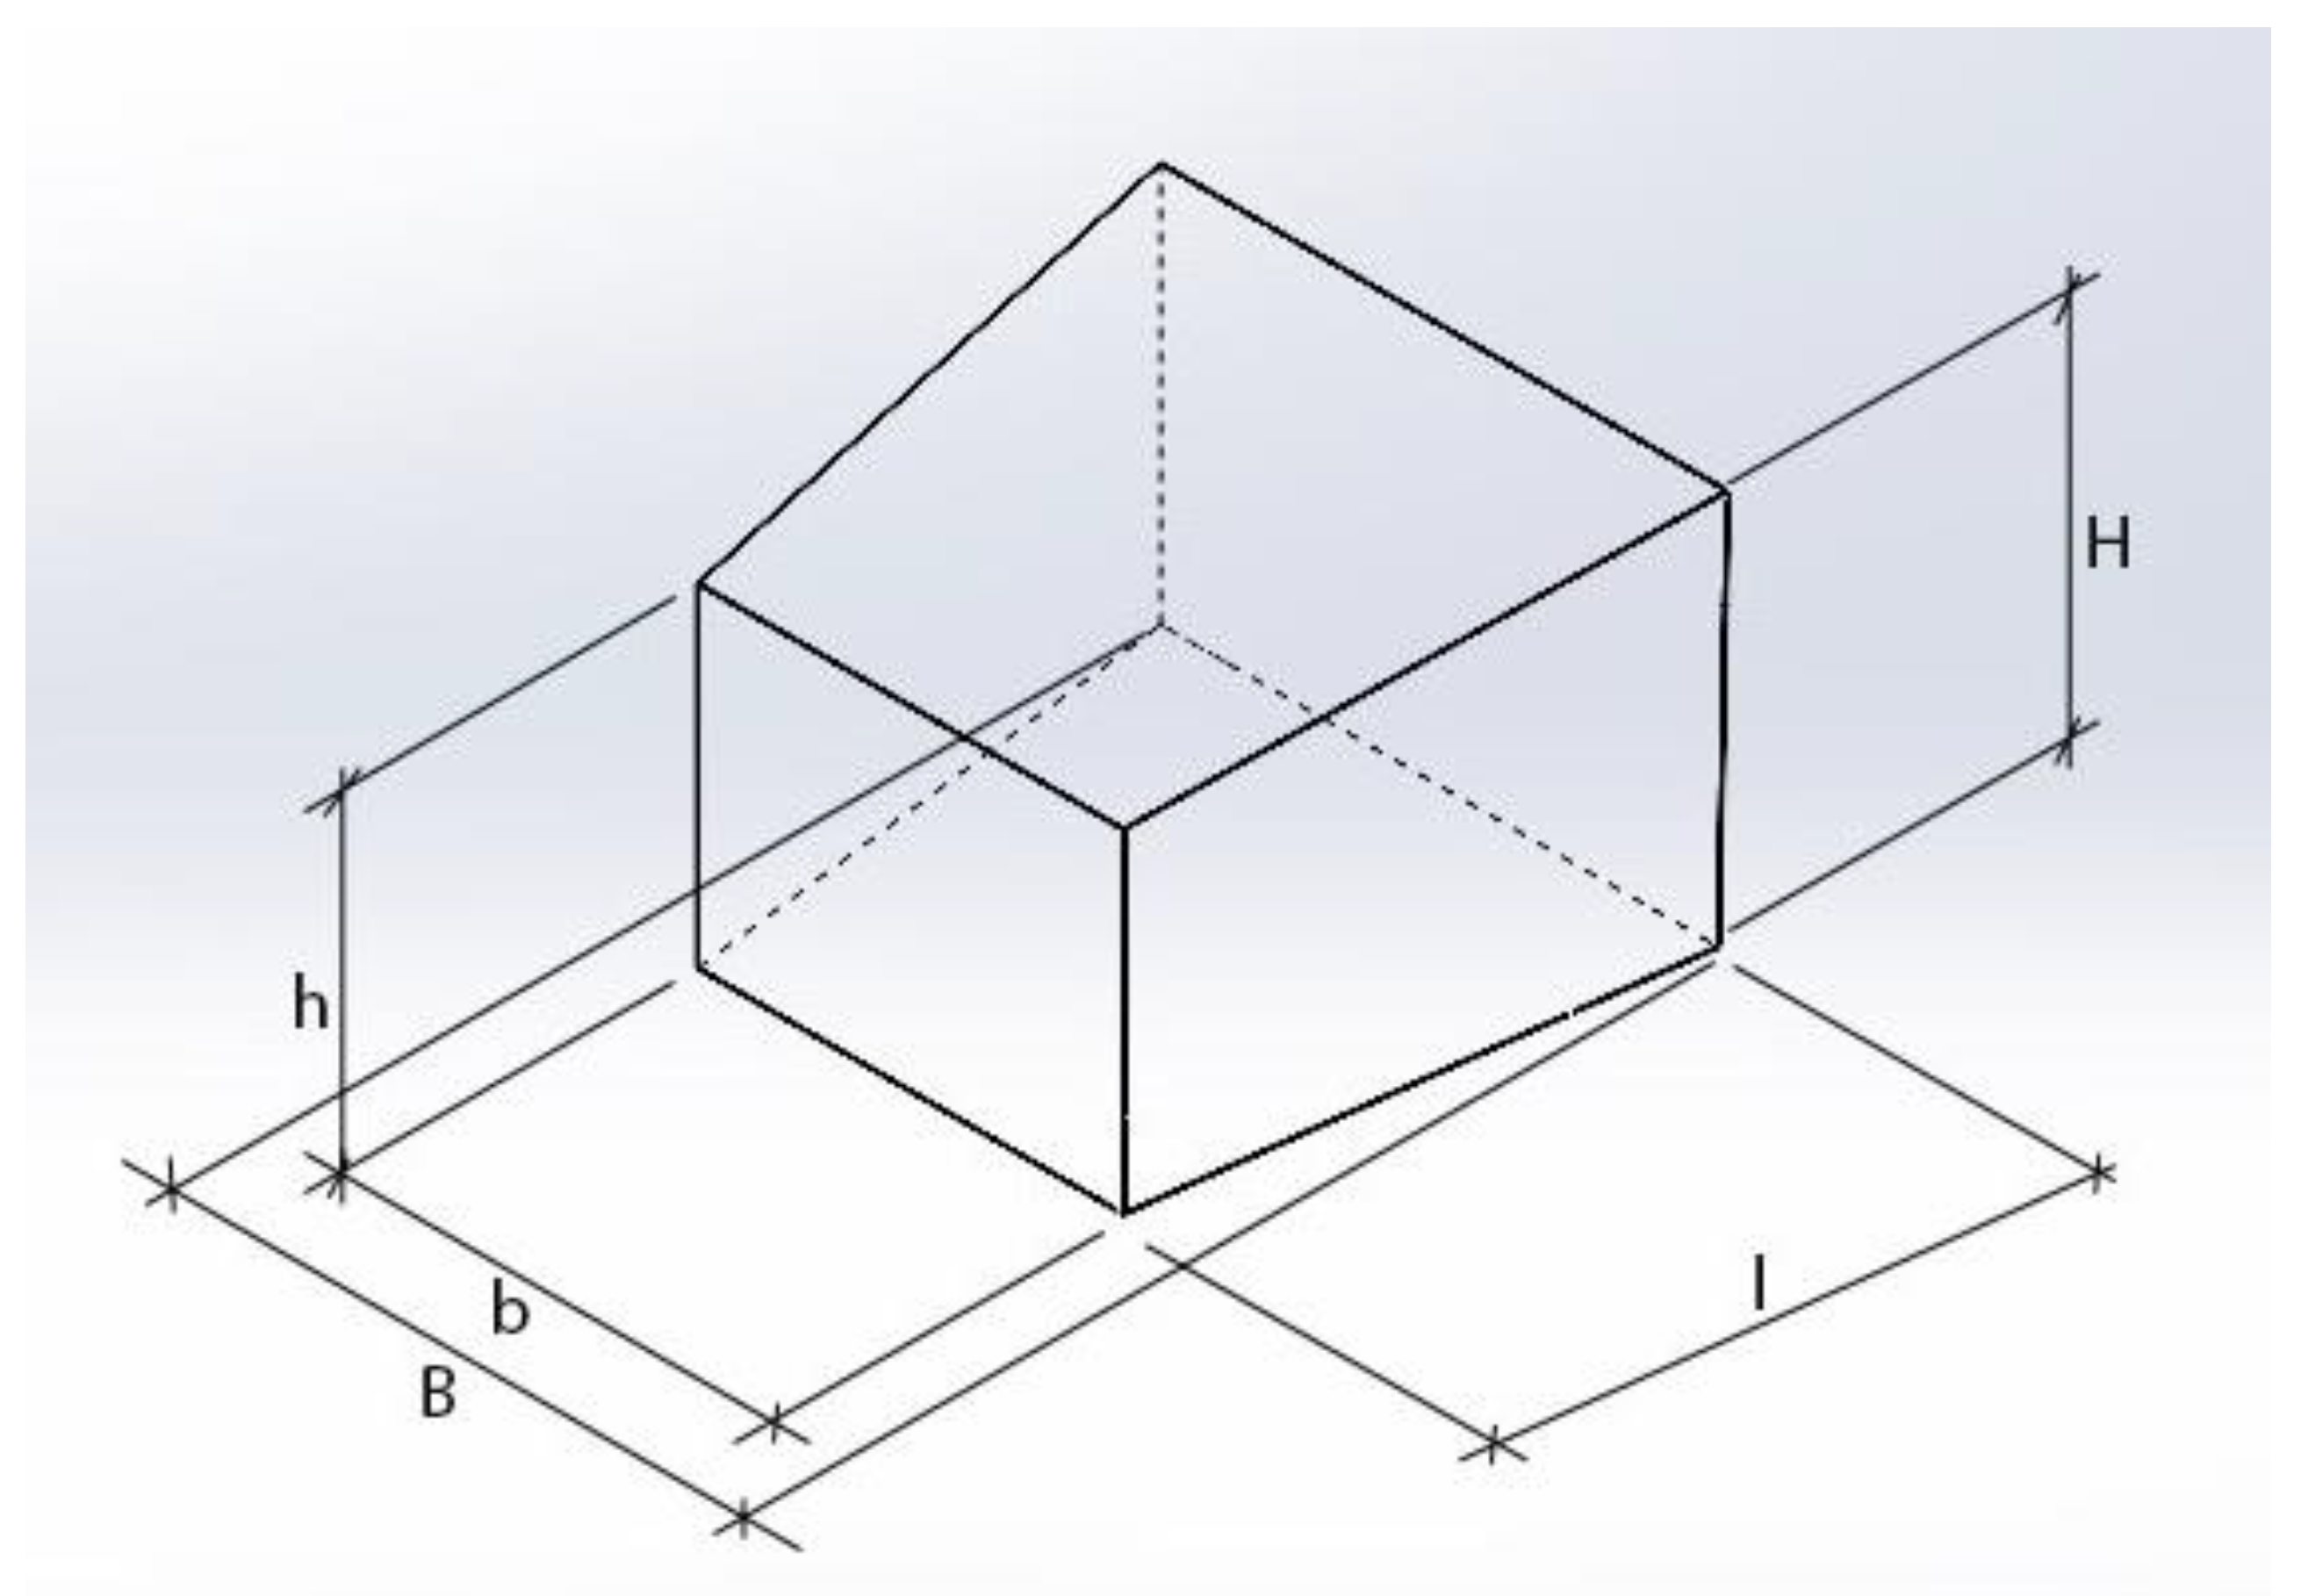
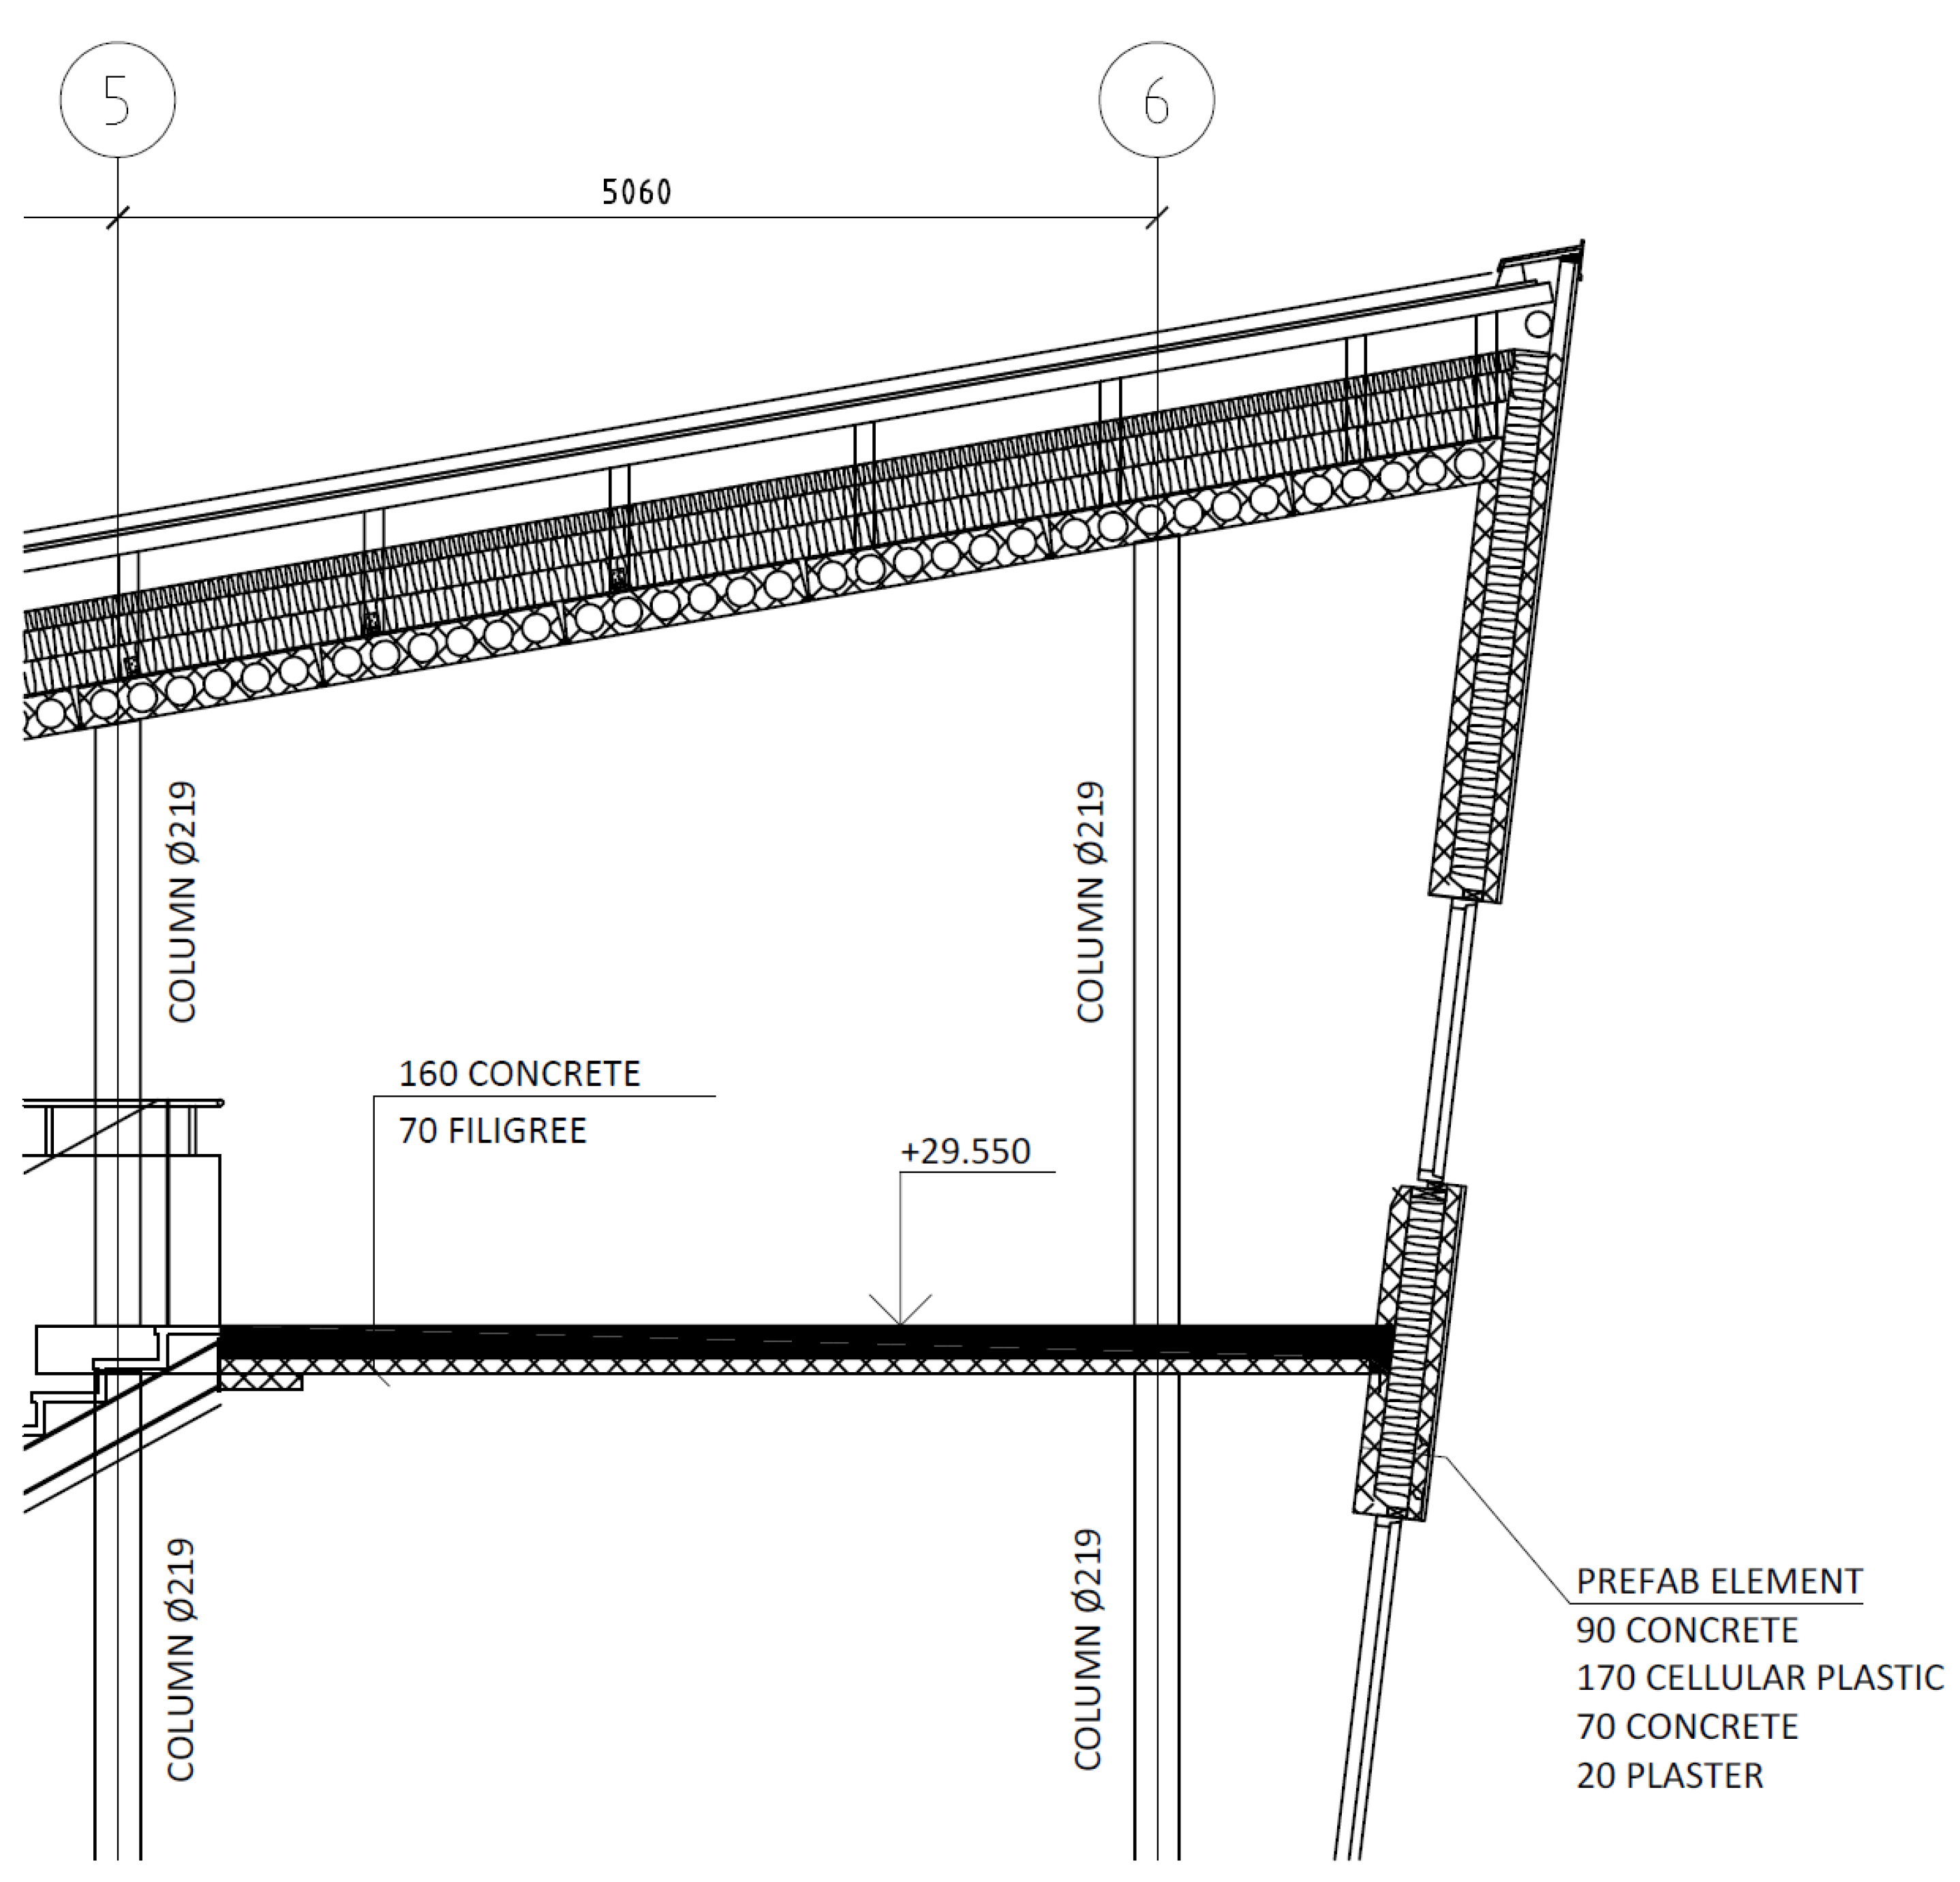
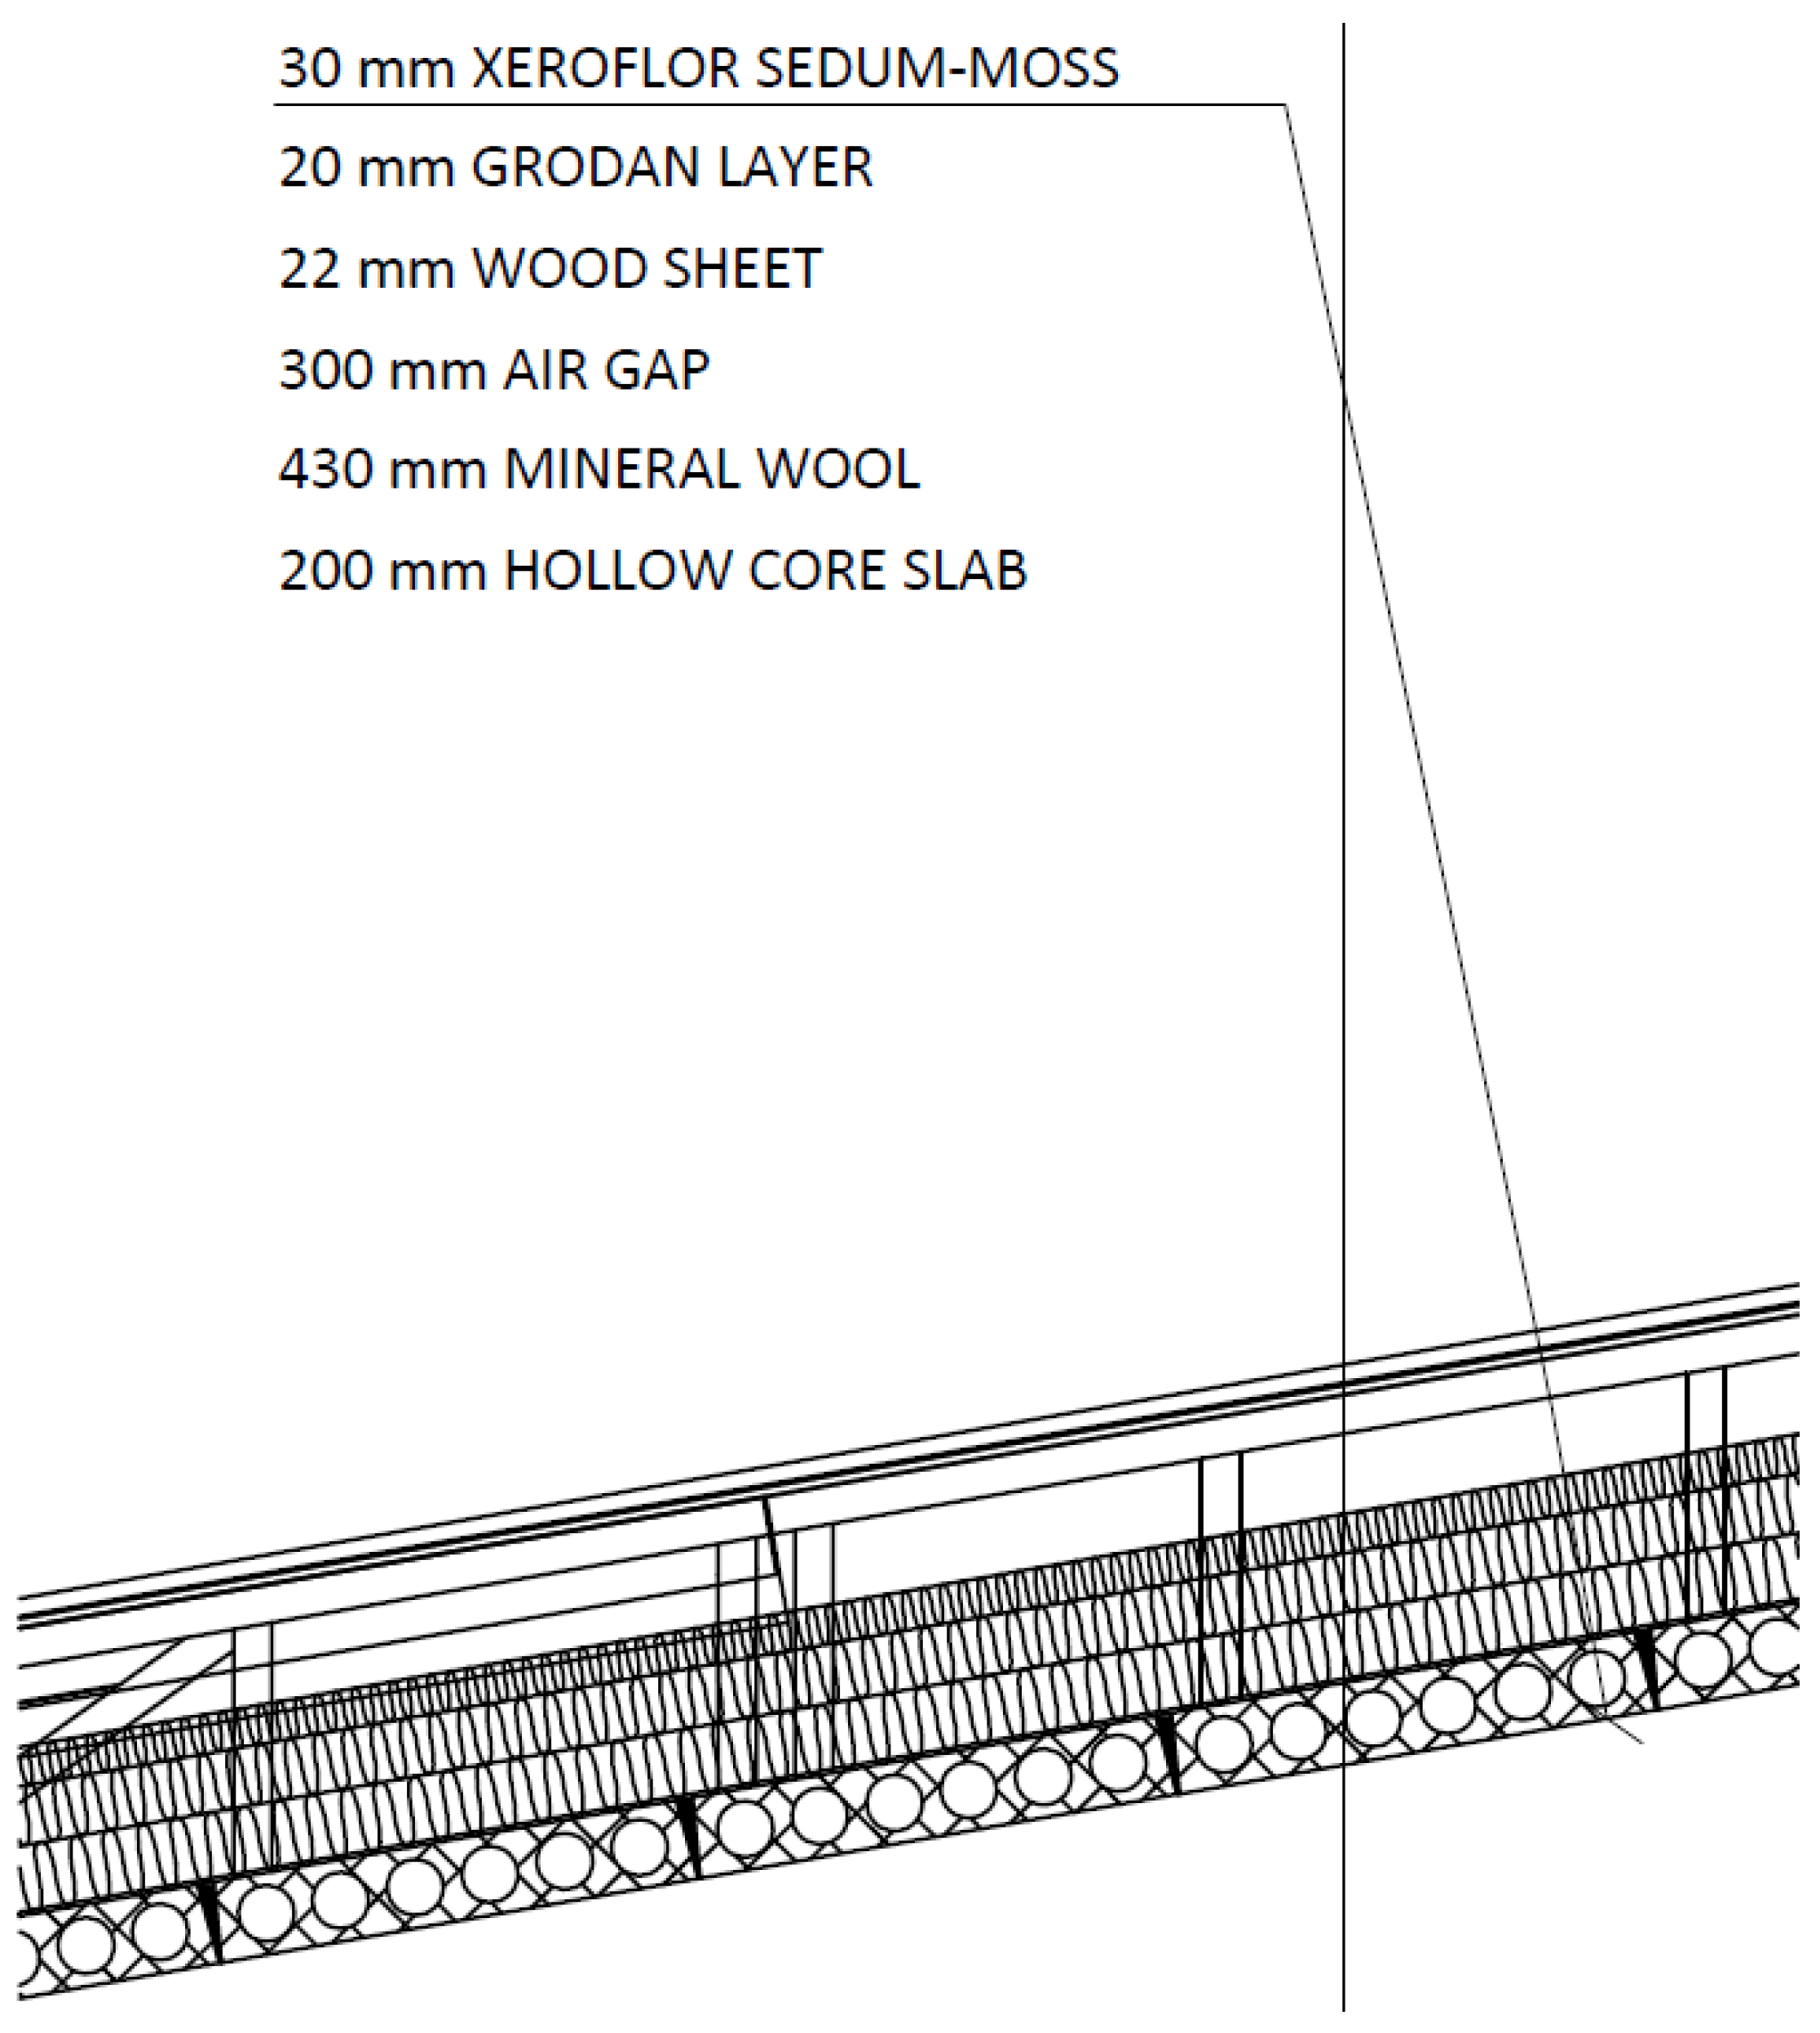
2. Object for Study
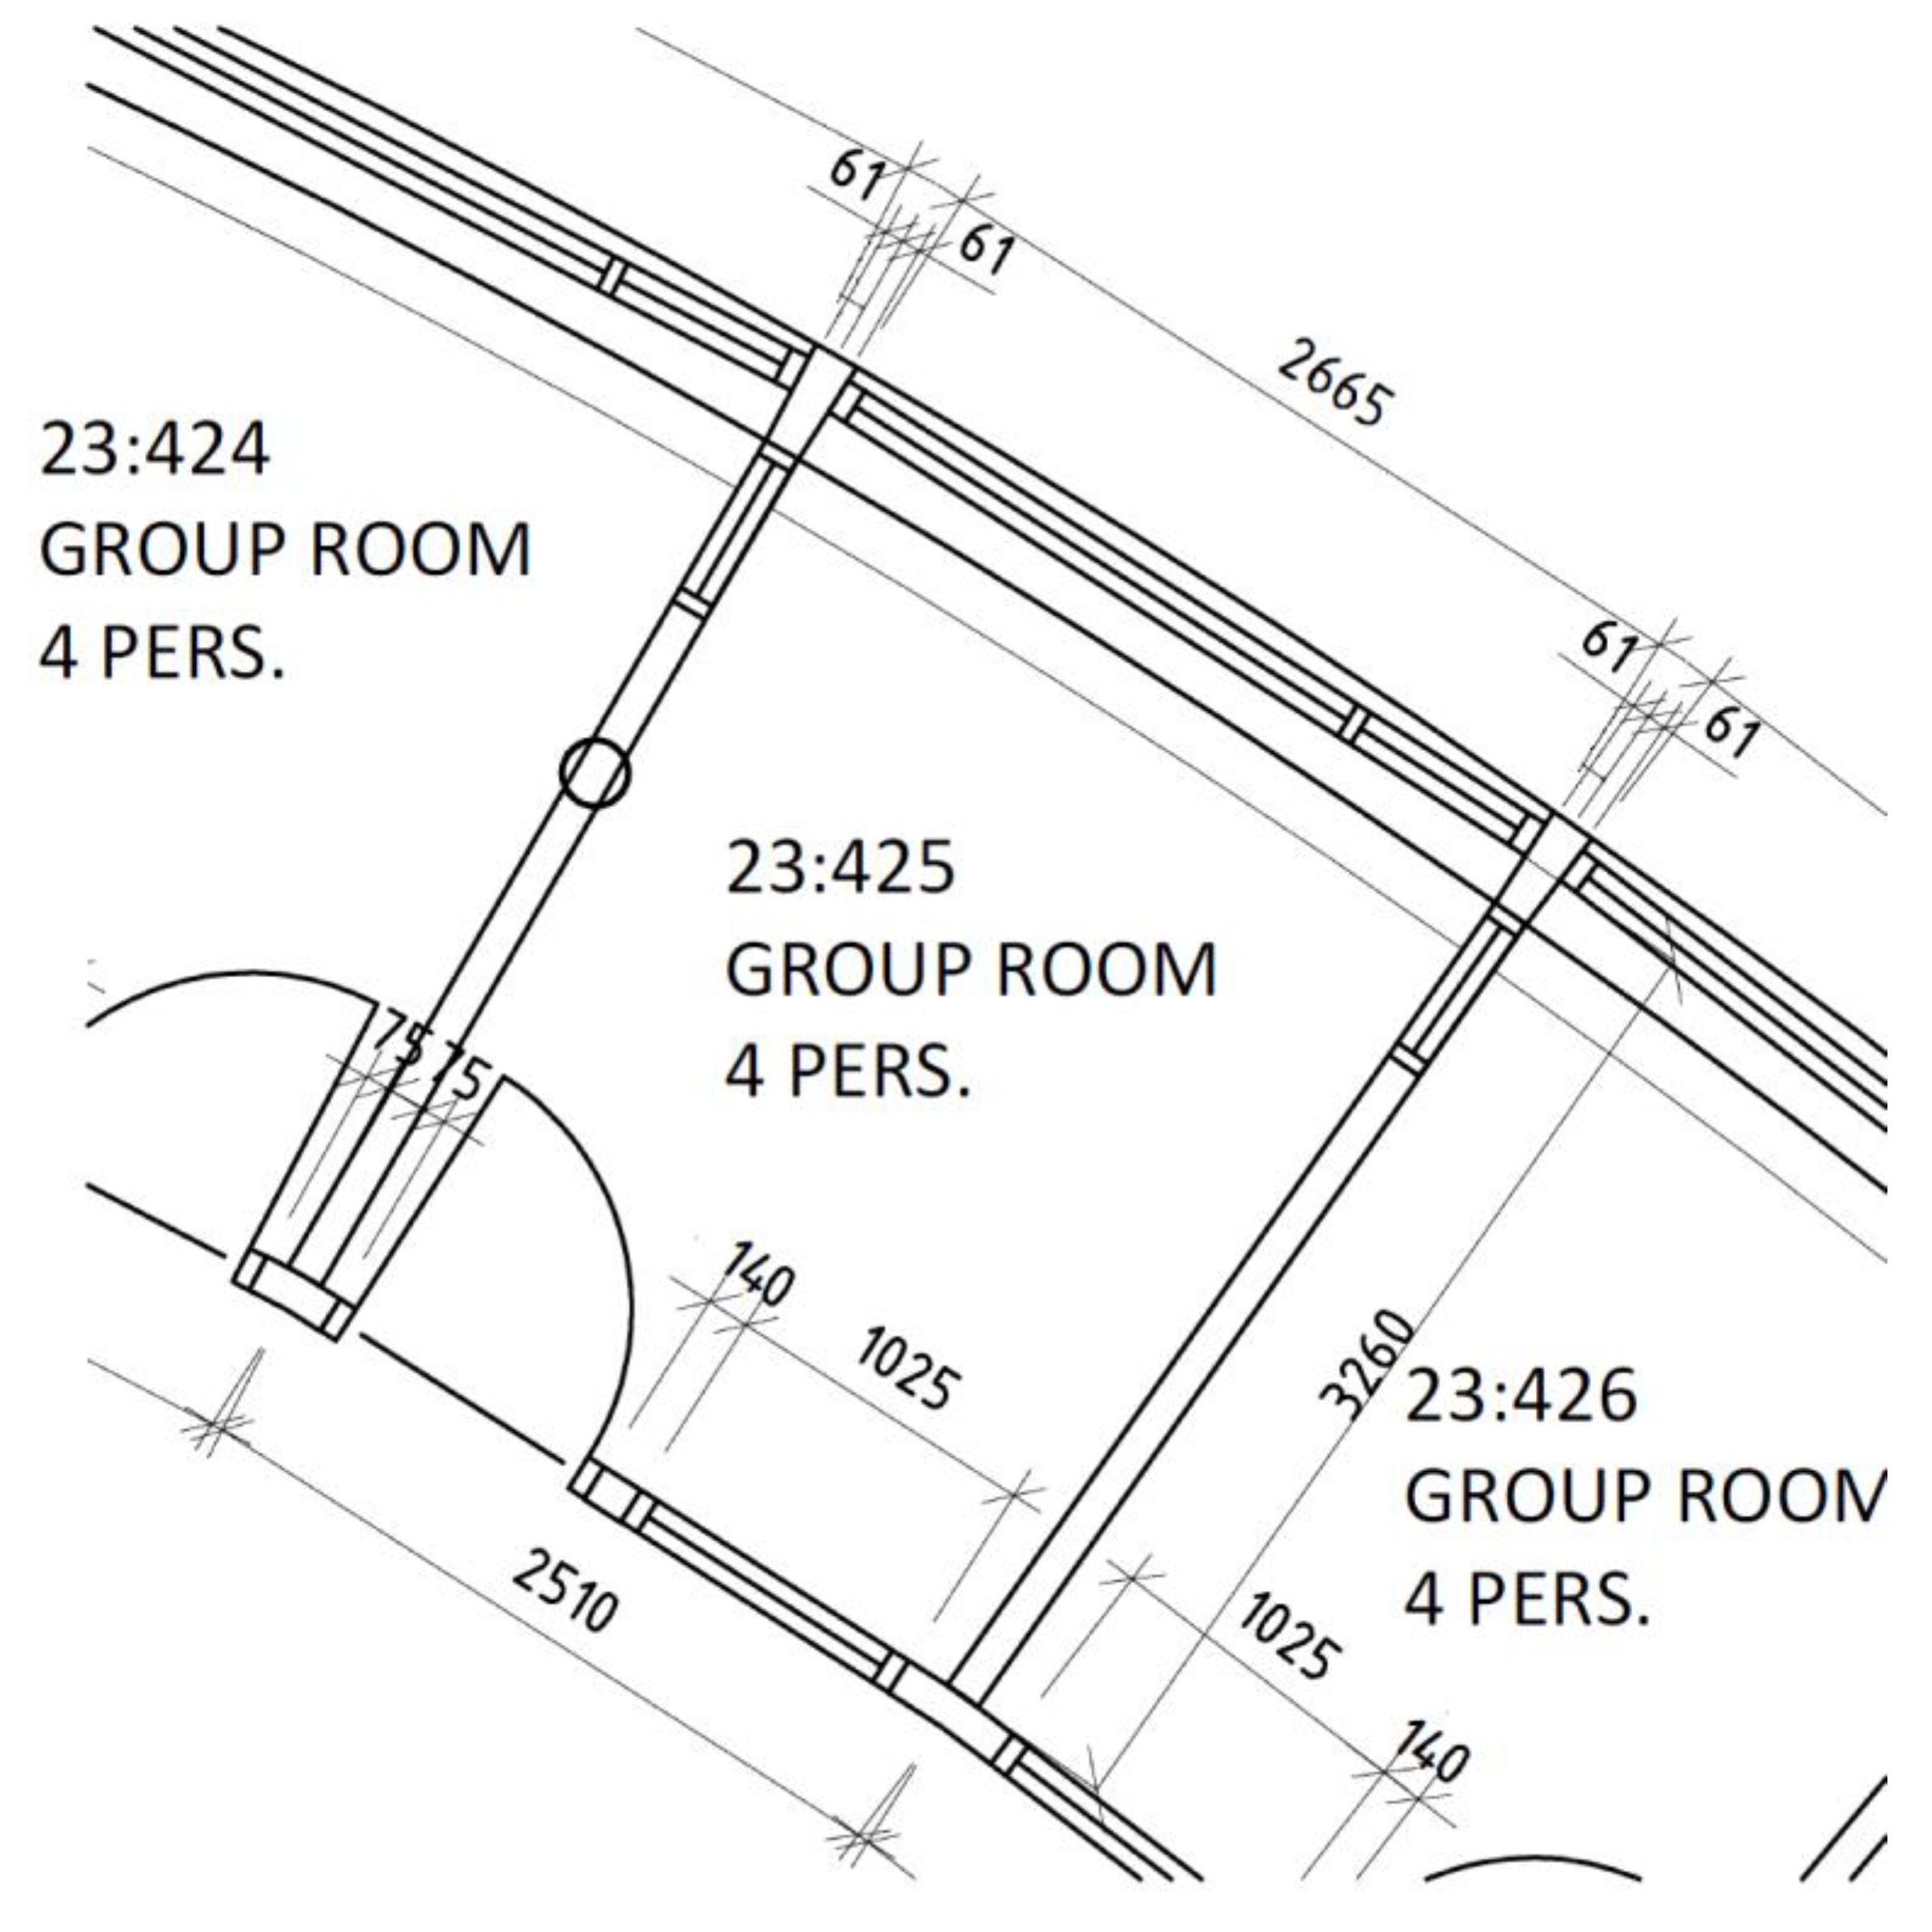
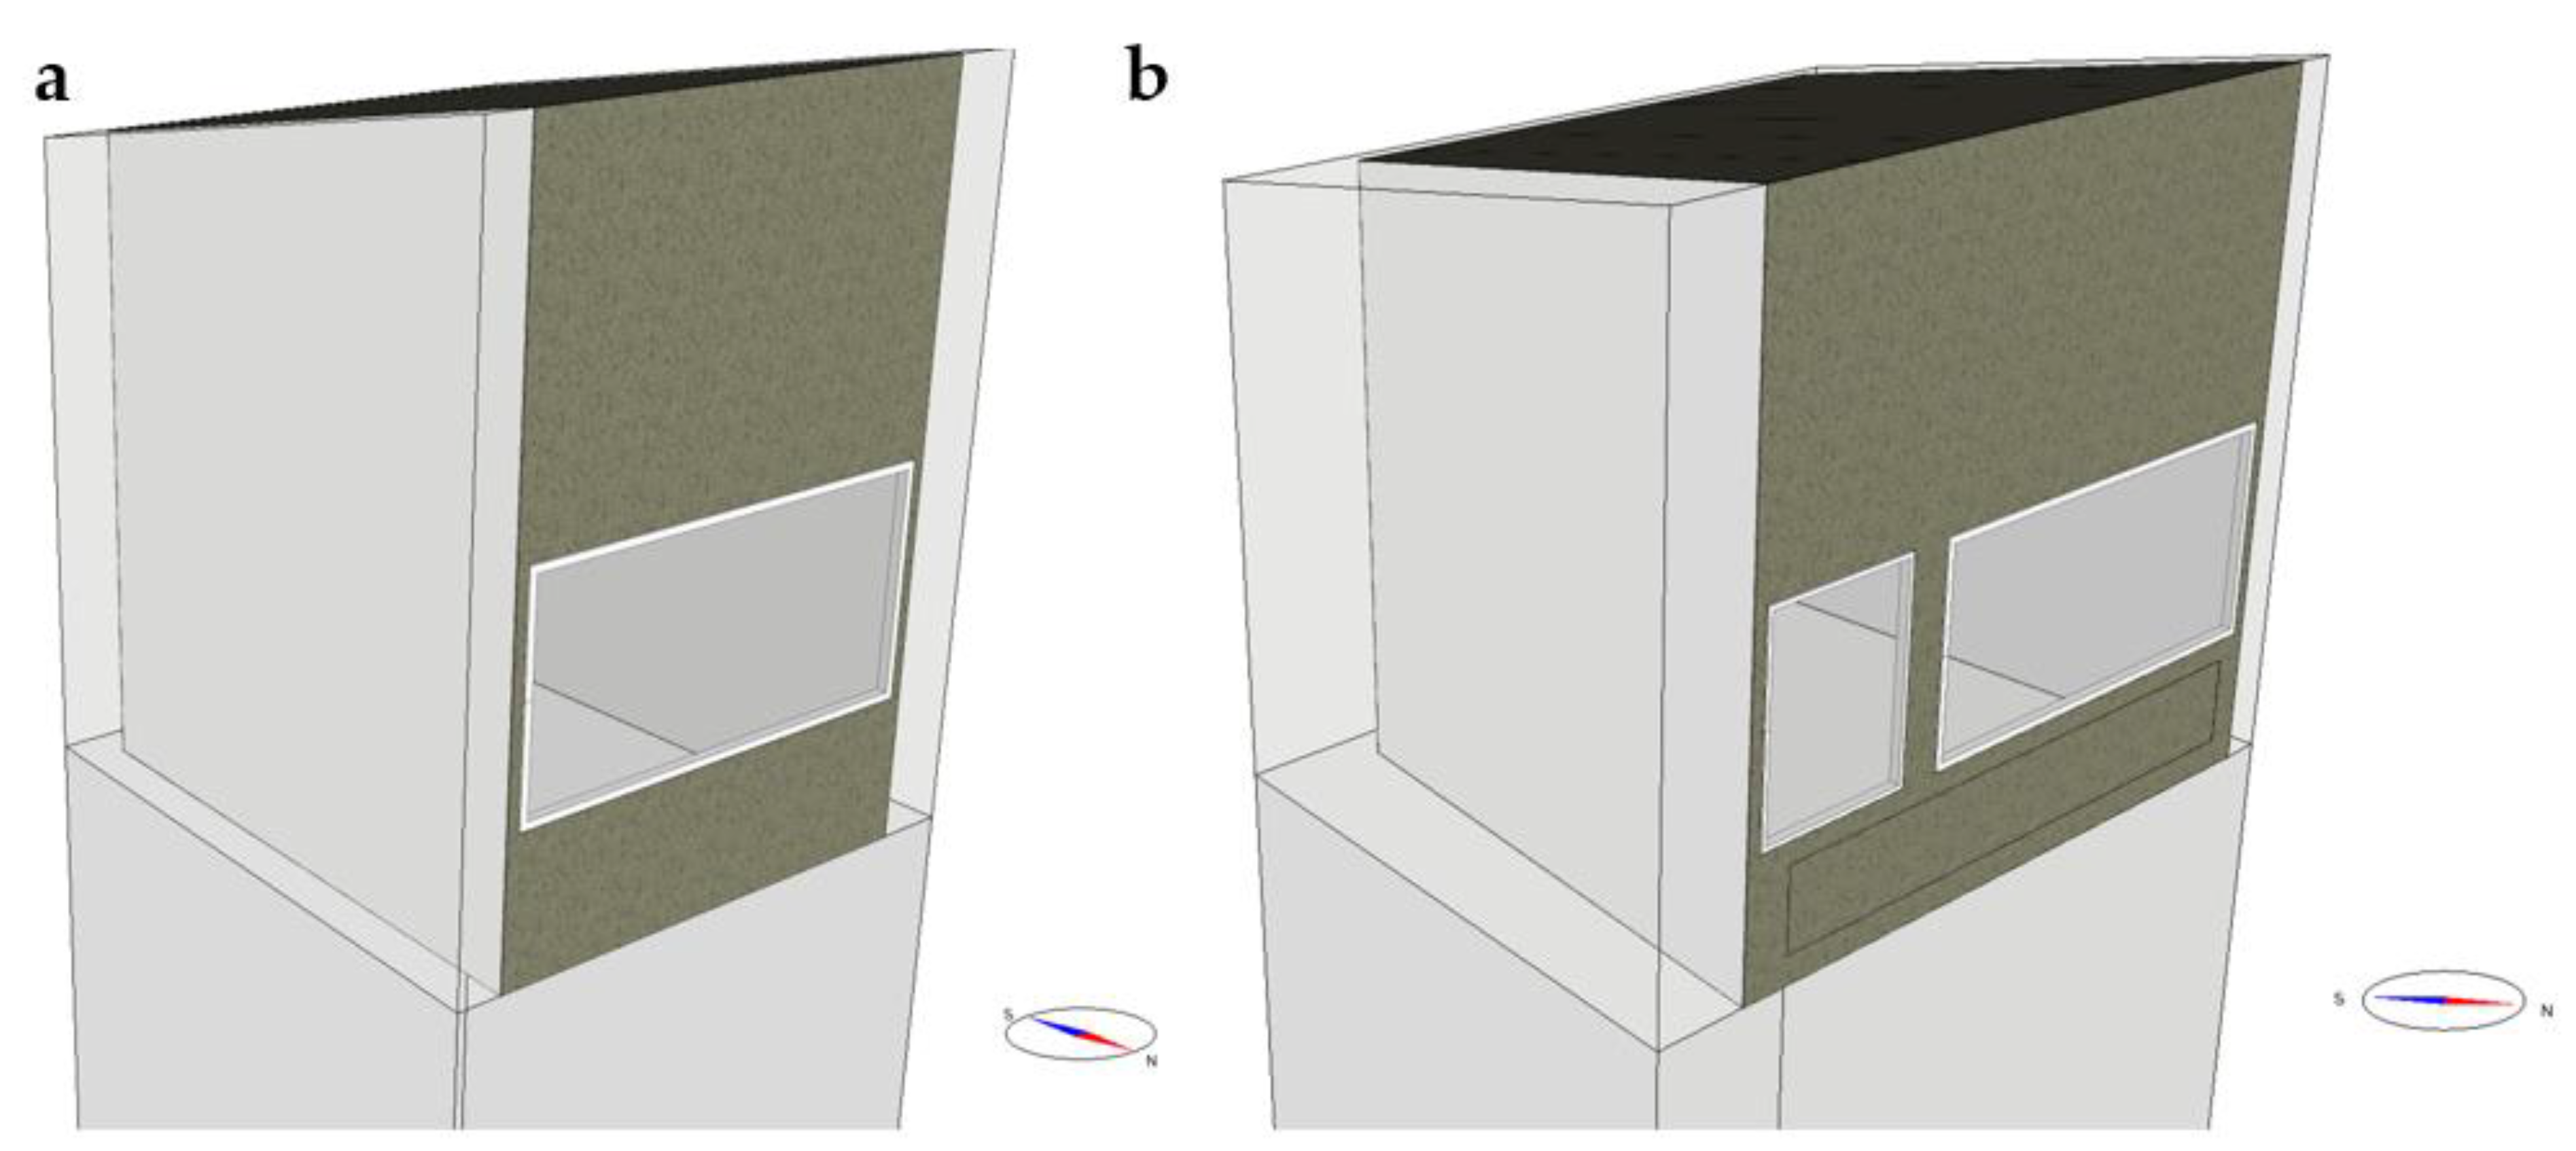
2.1. Room 23:425
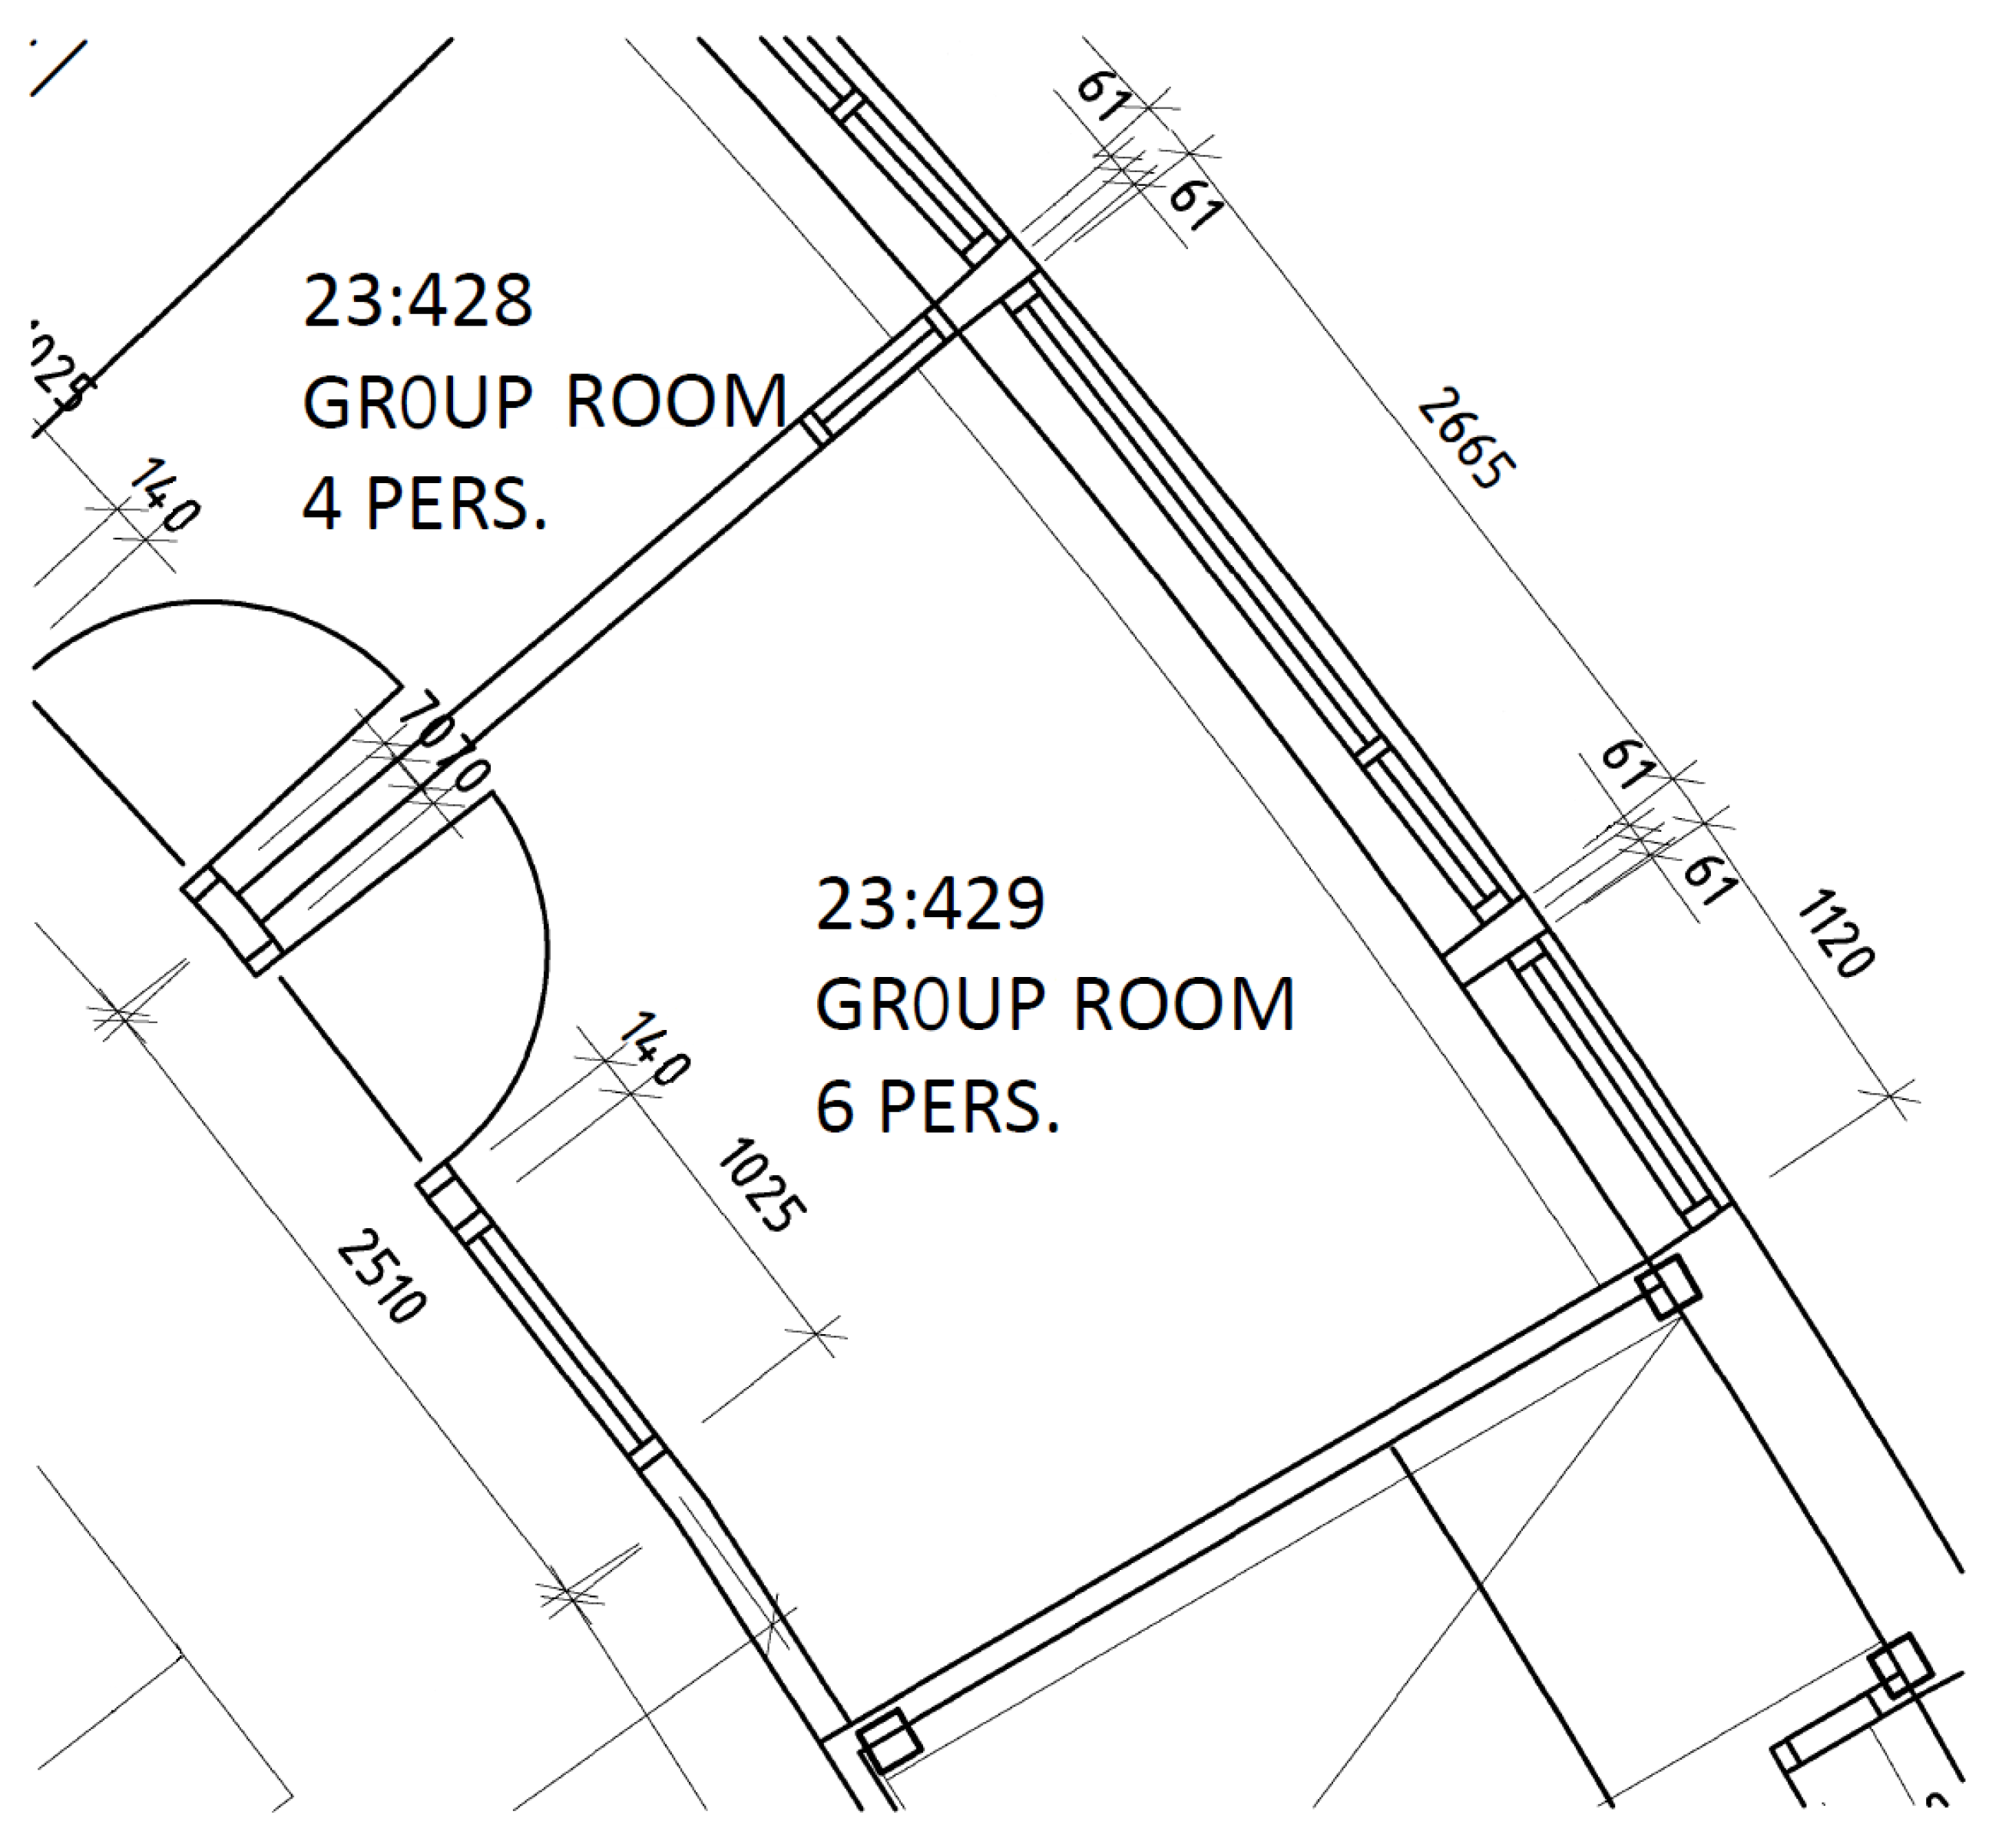
2.2. Room 23:429
3. Methods
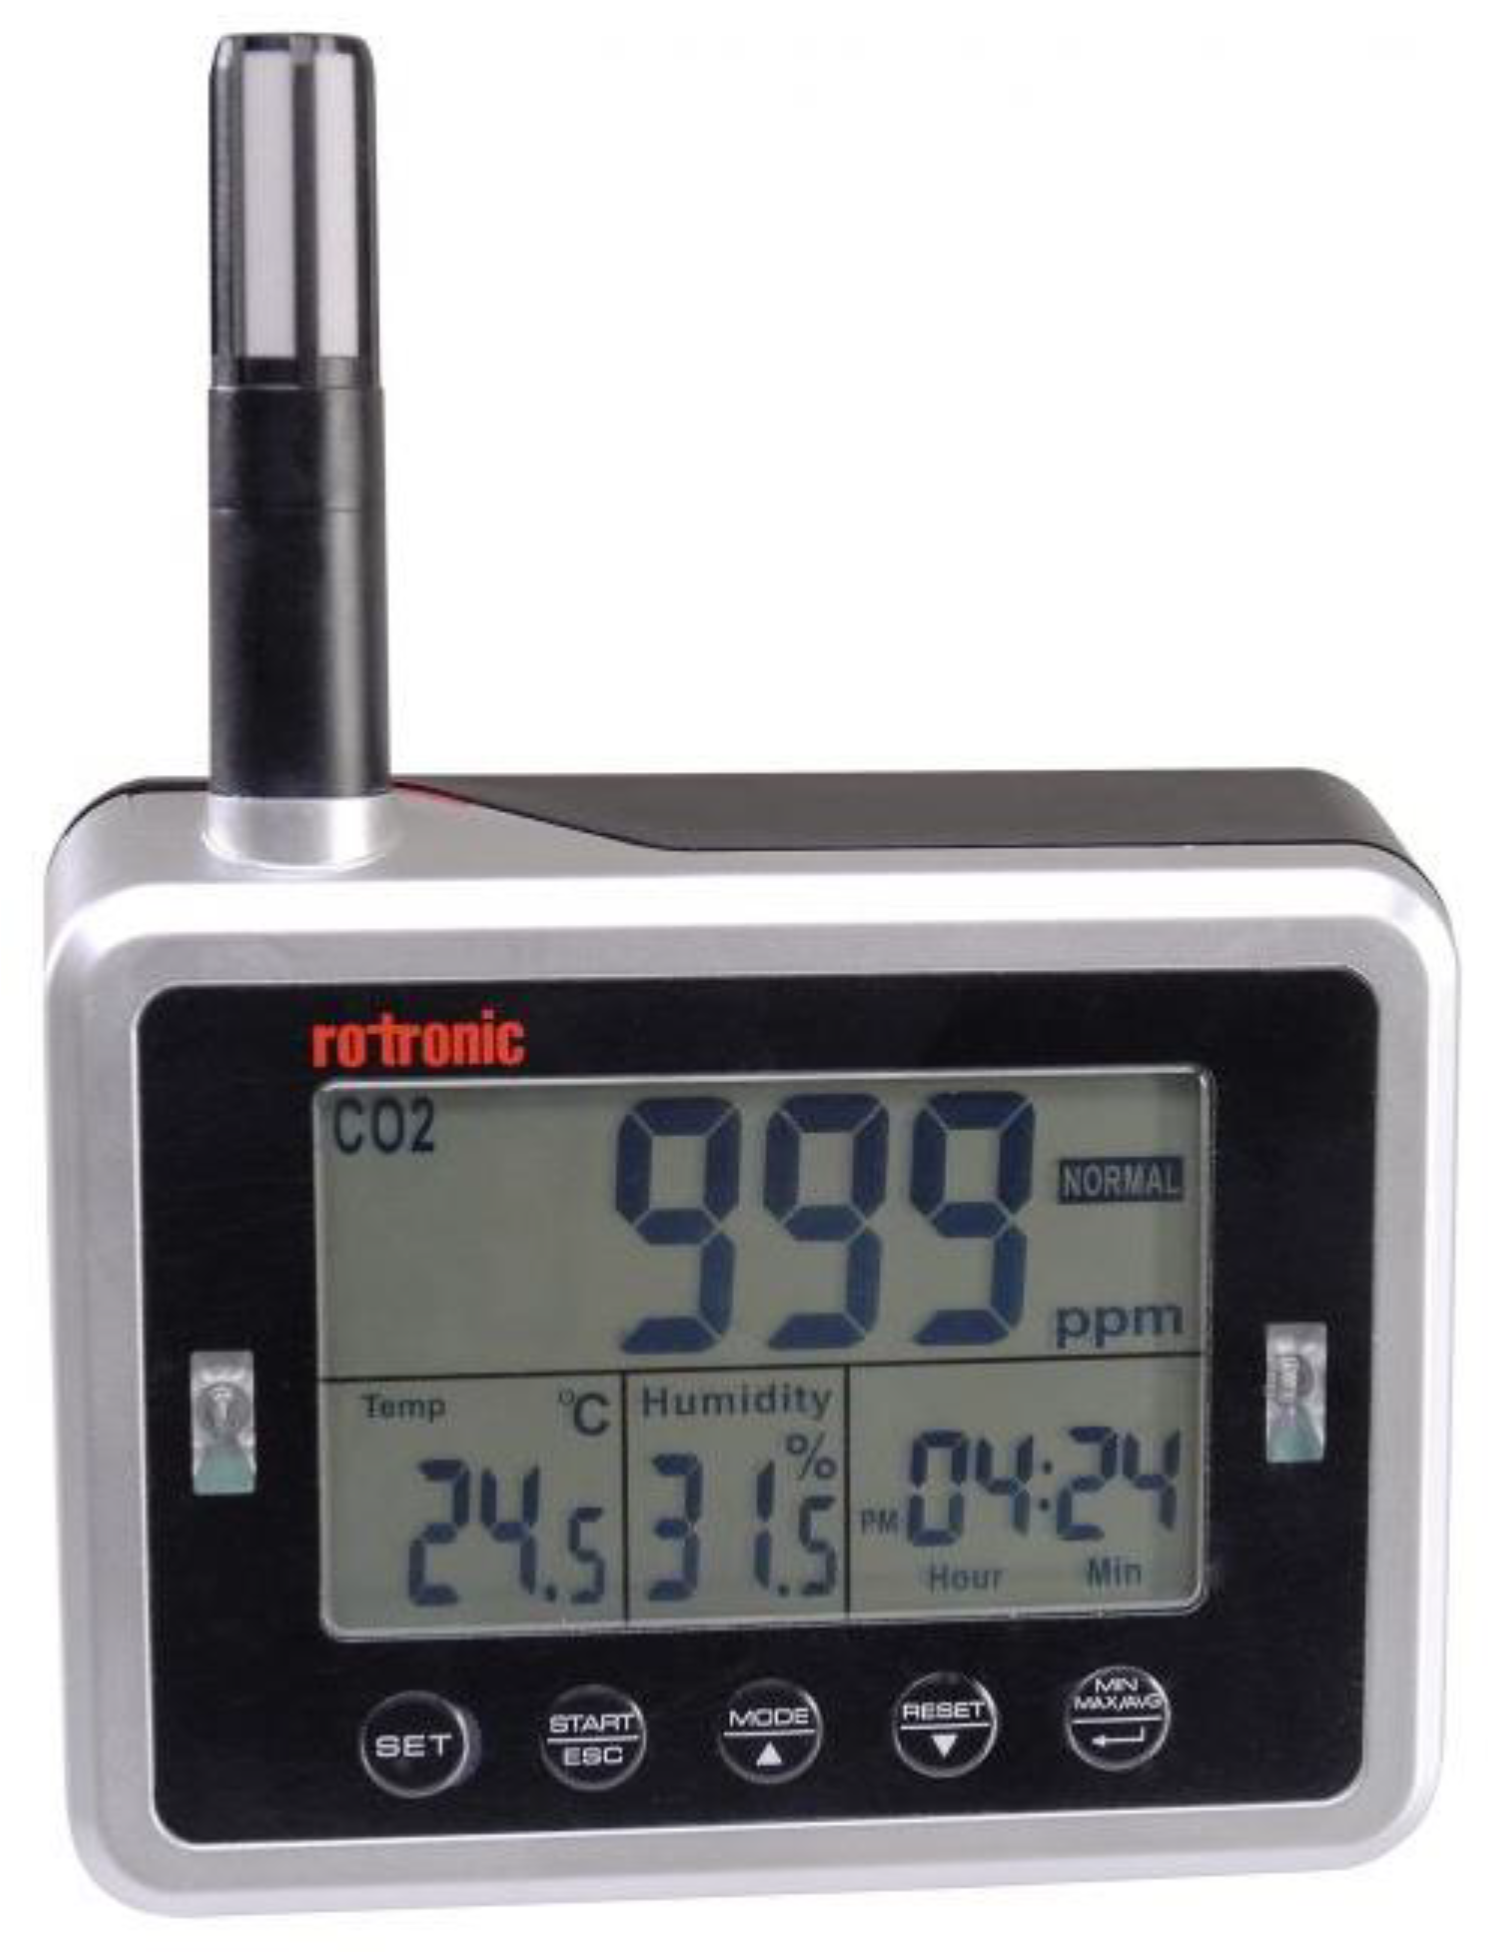
3.1. Data Collection
3.2. Building Simulation Software
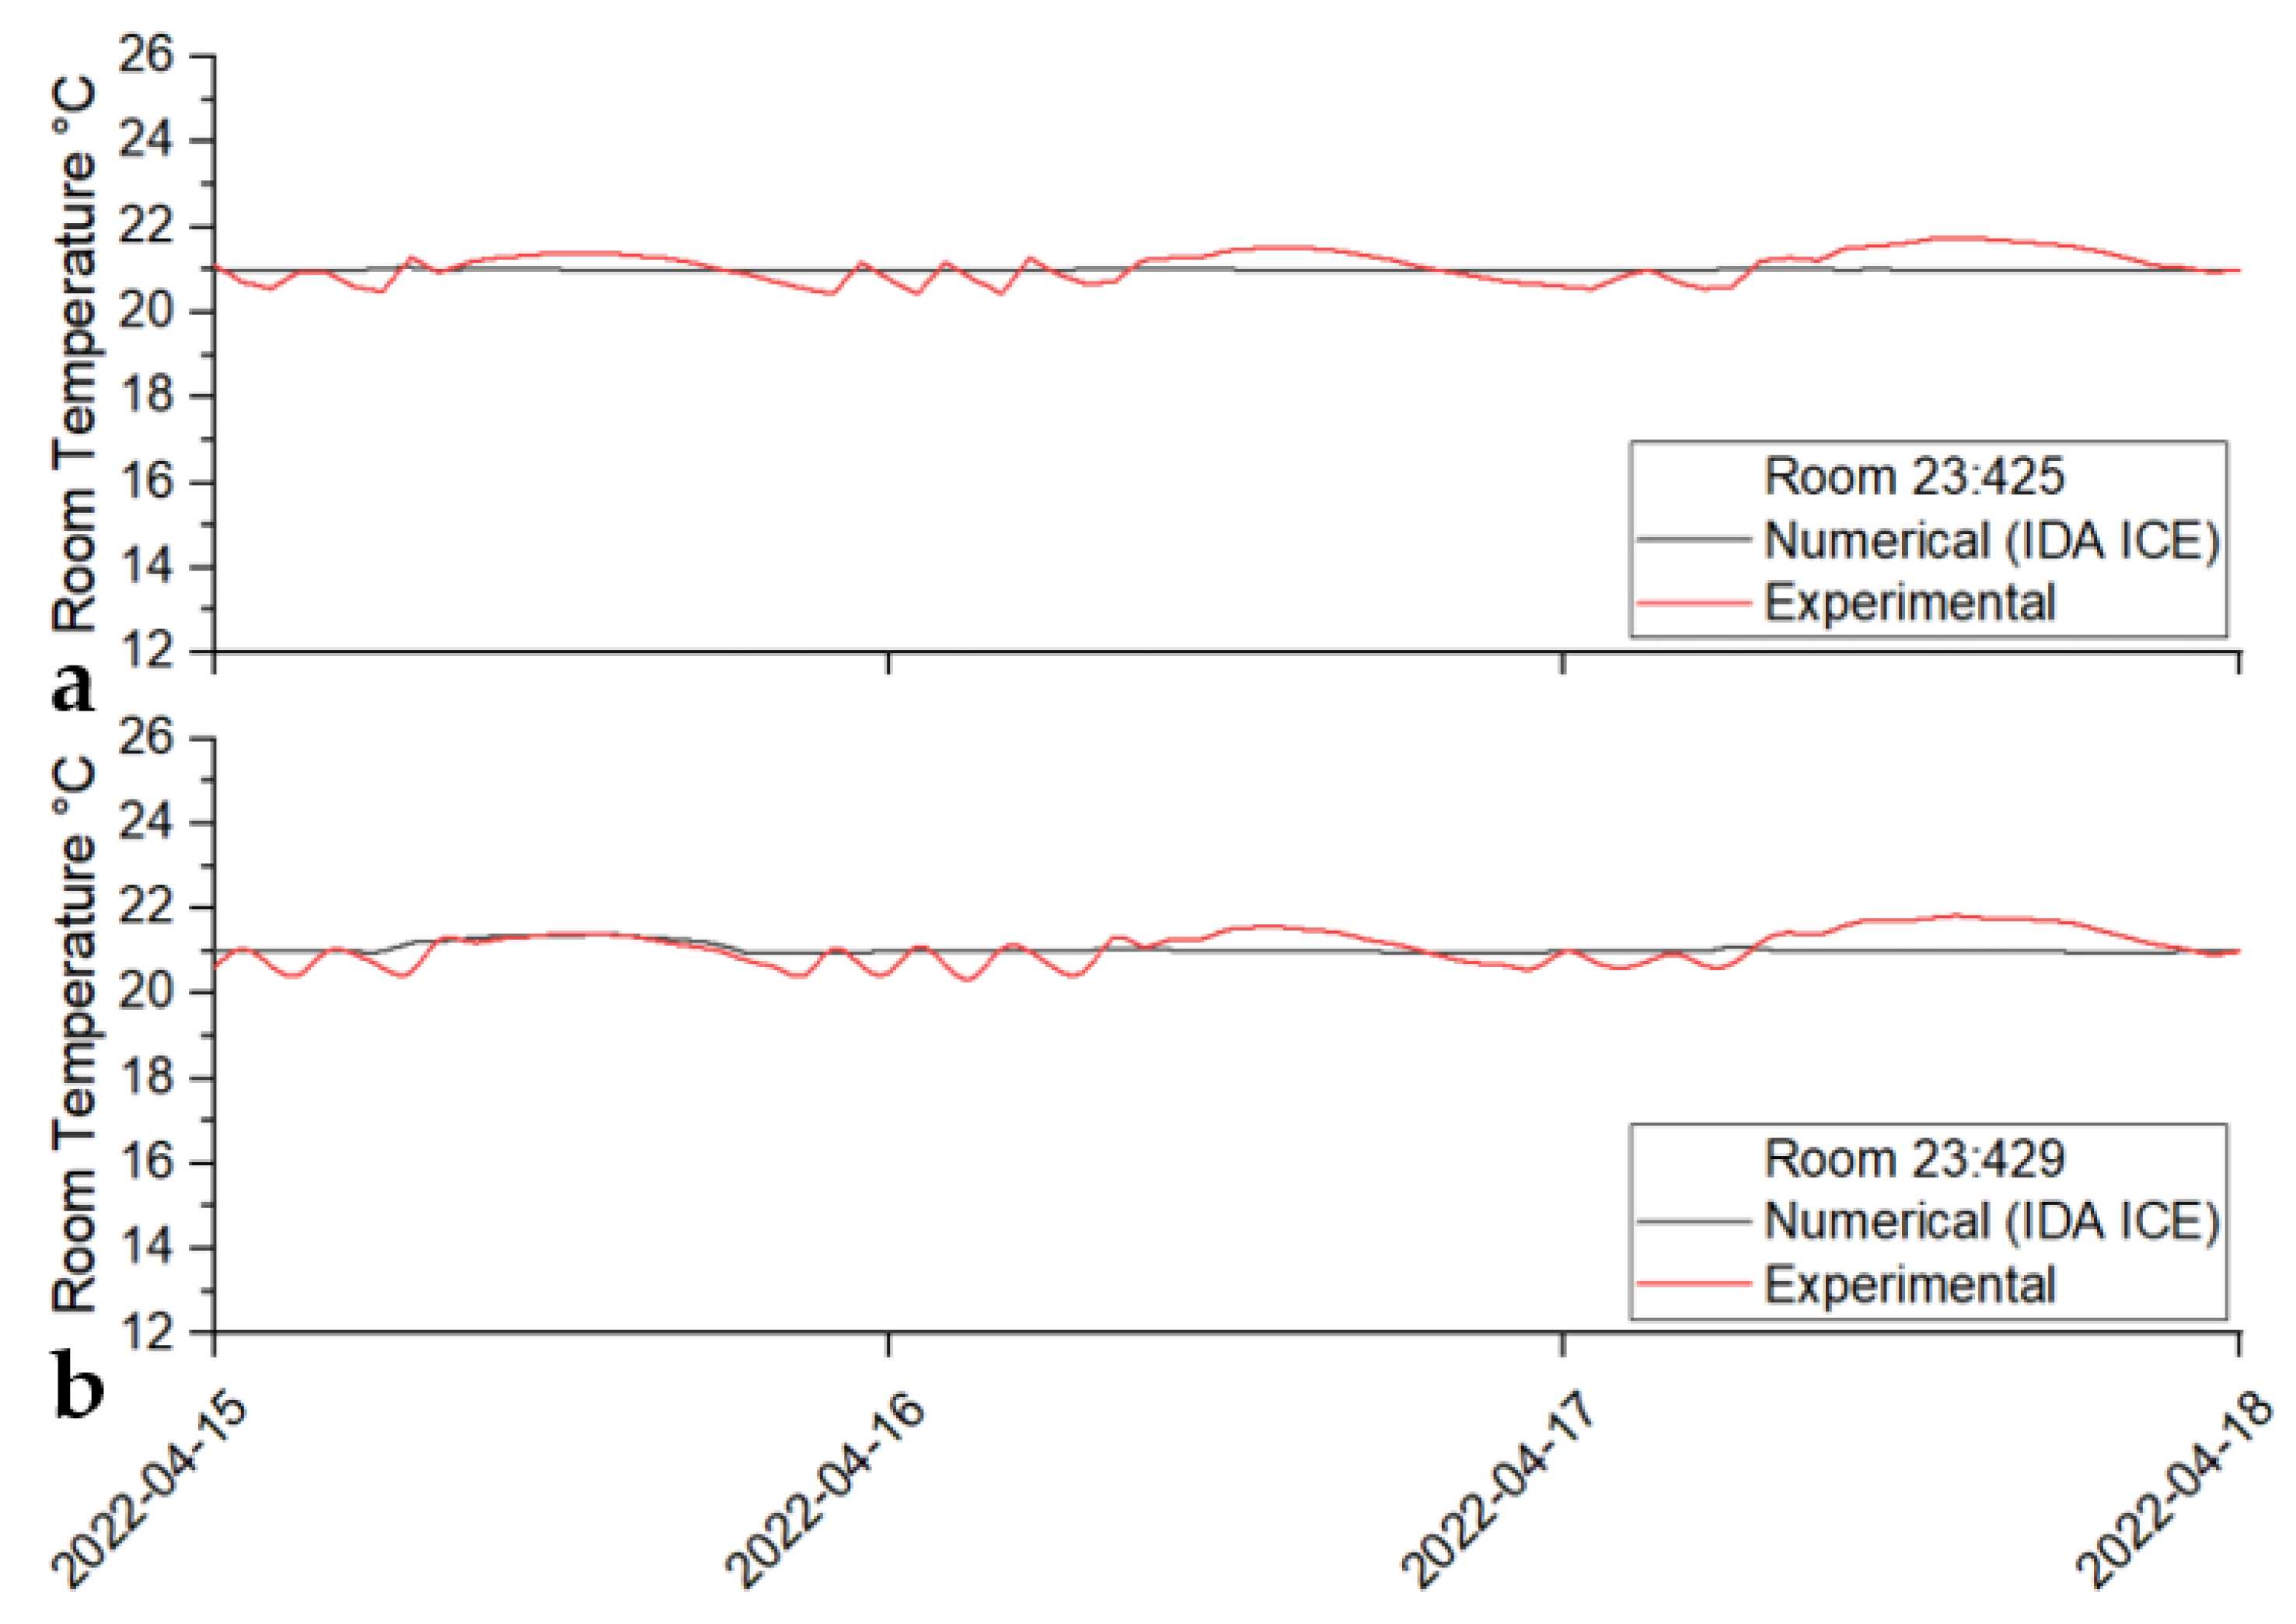
3.3. Numerical Model Validation
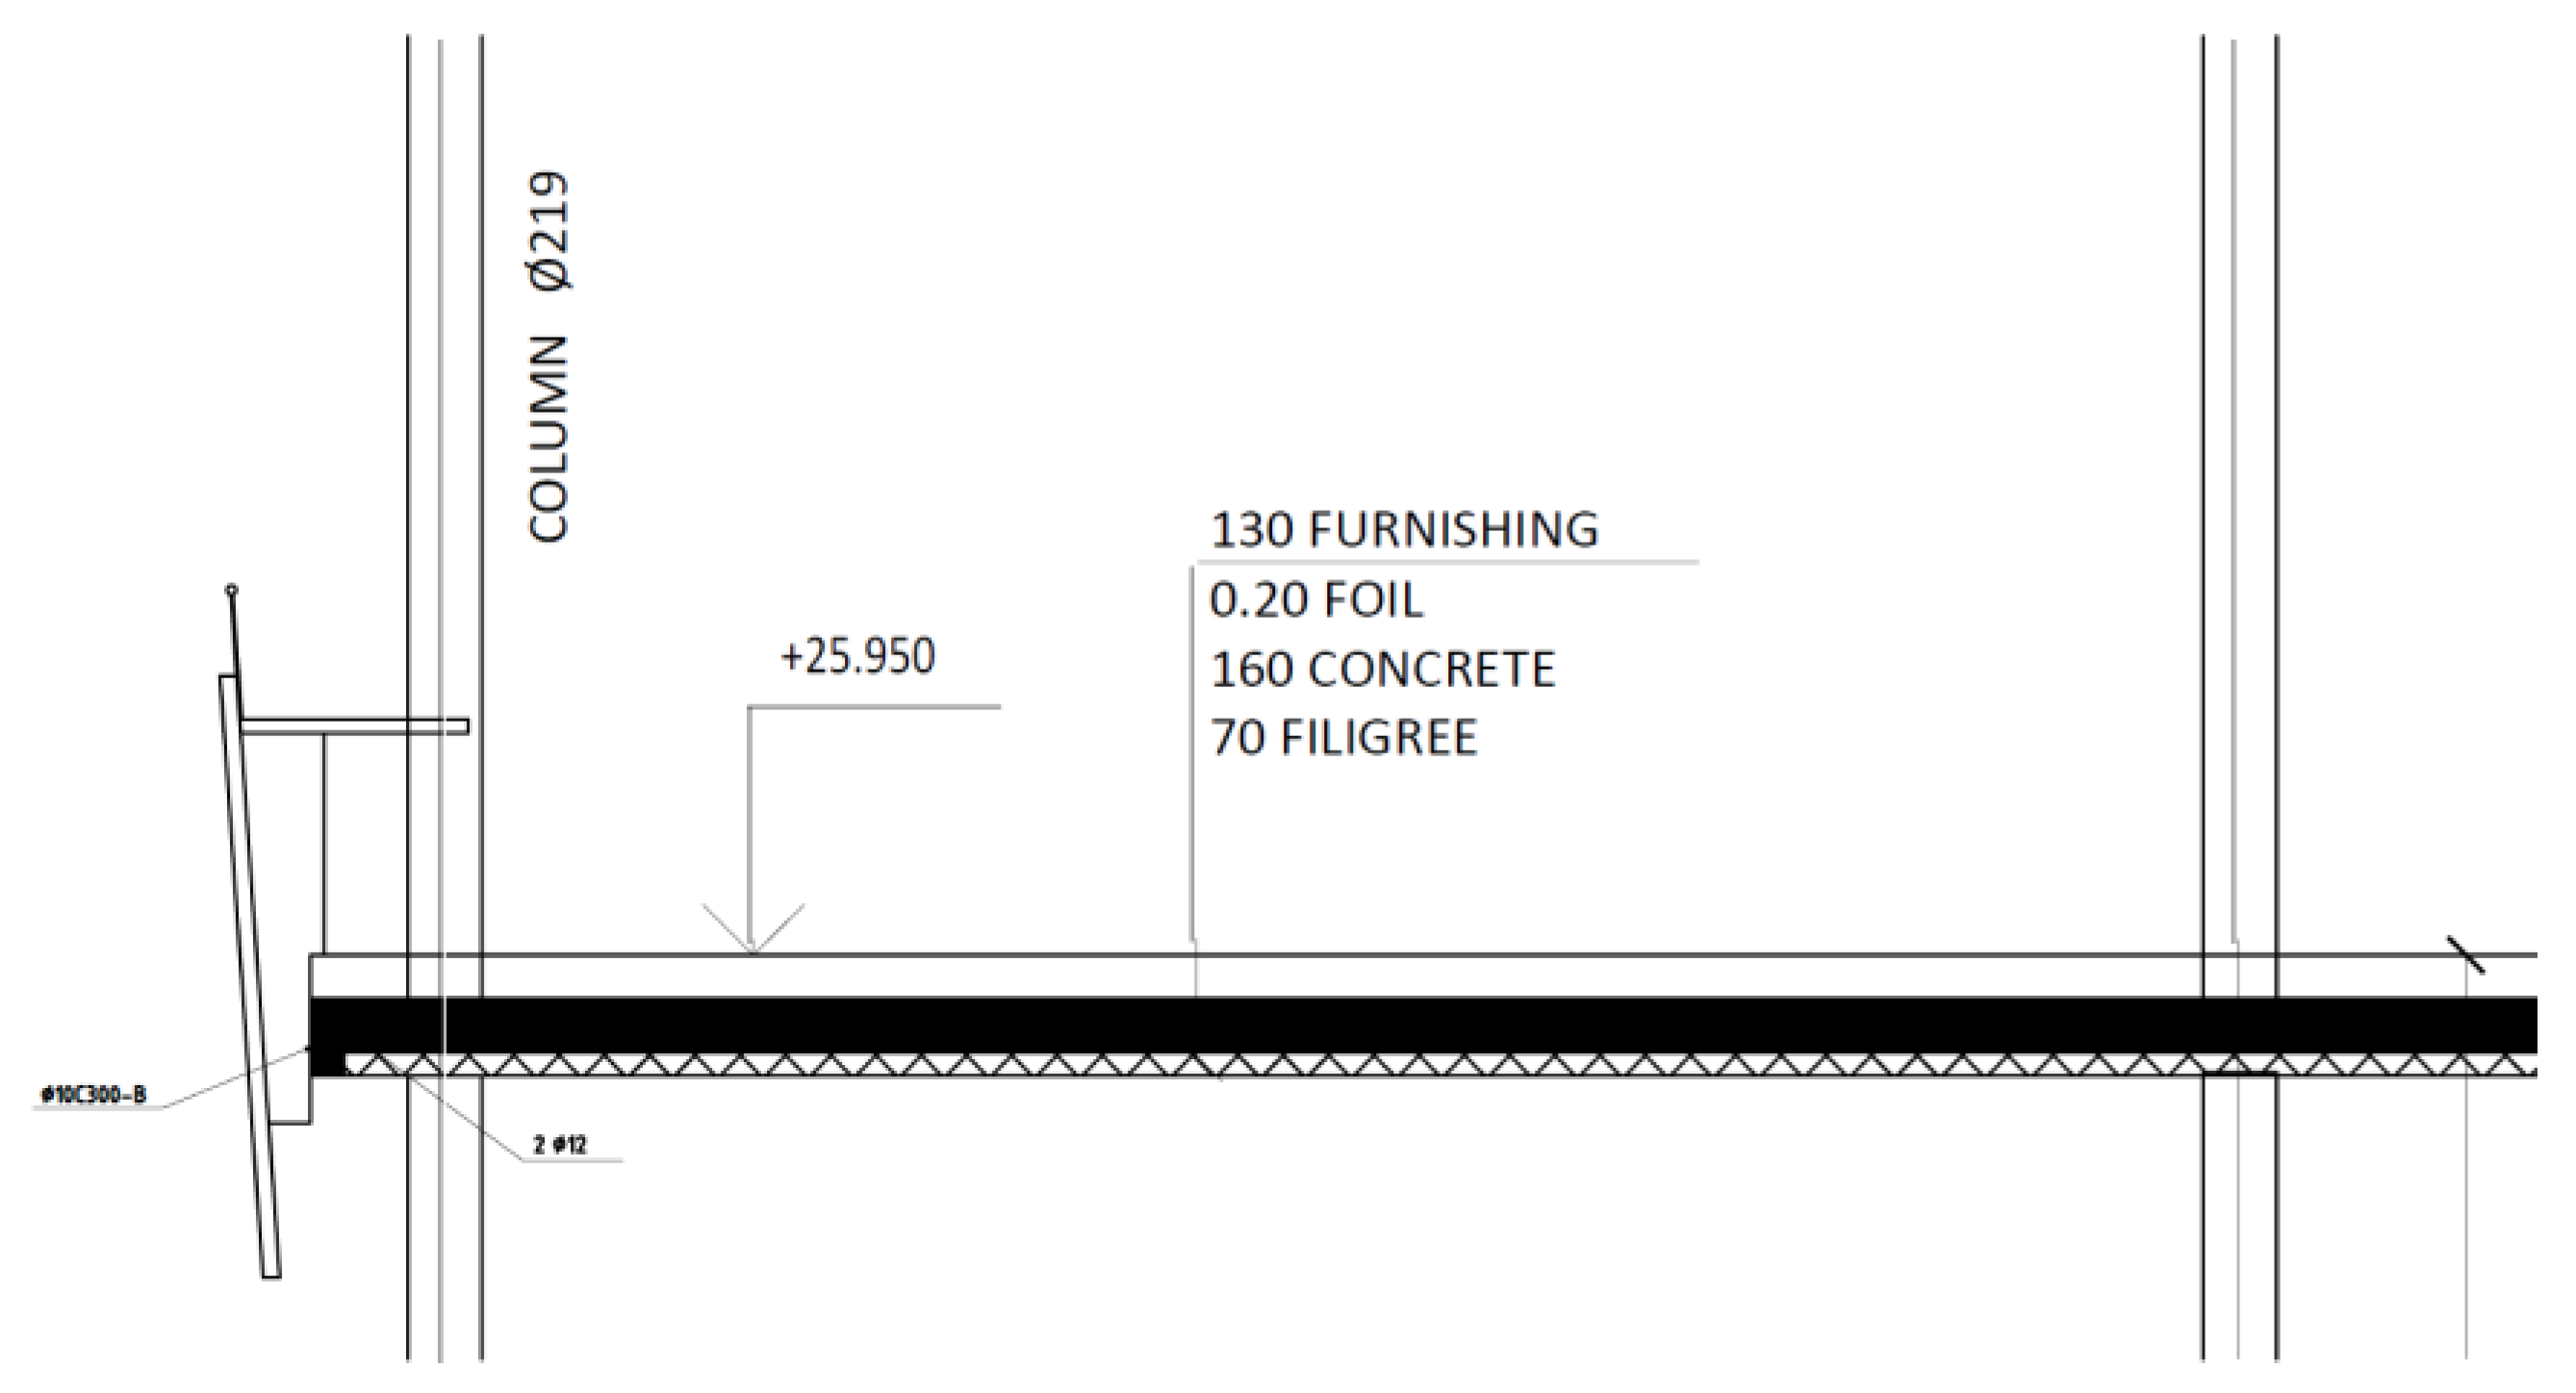
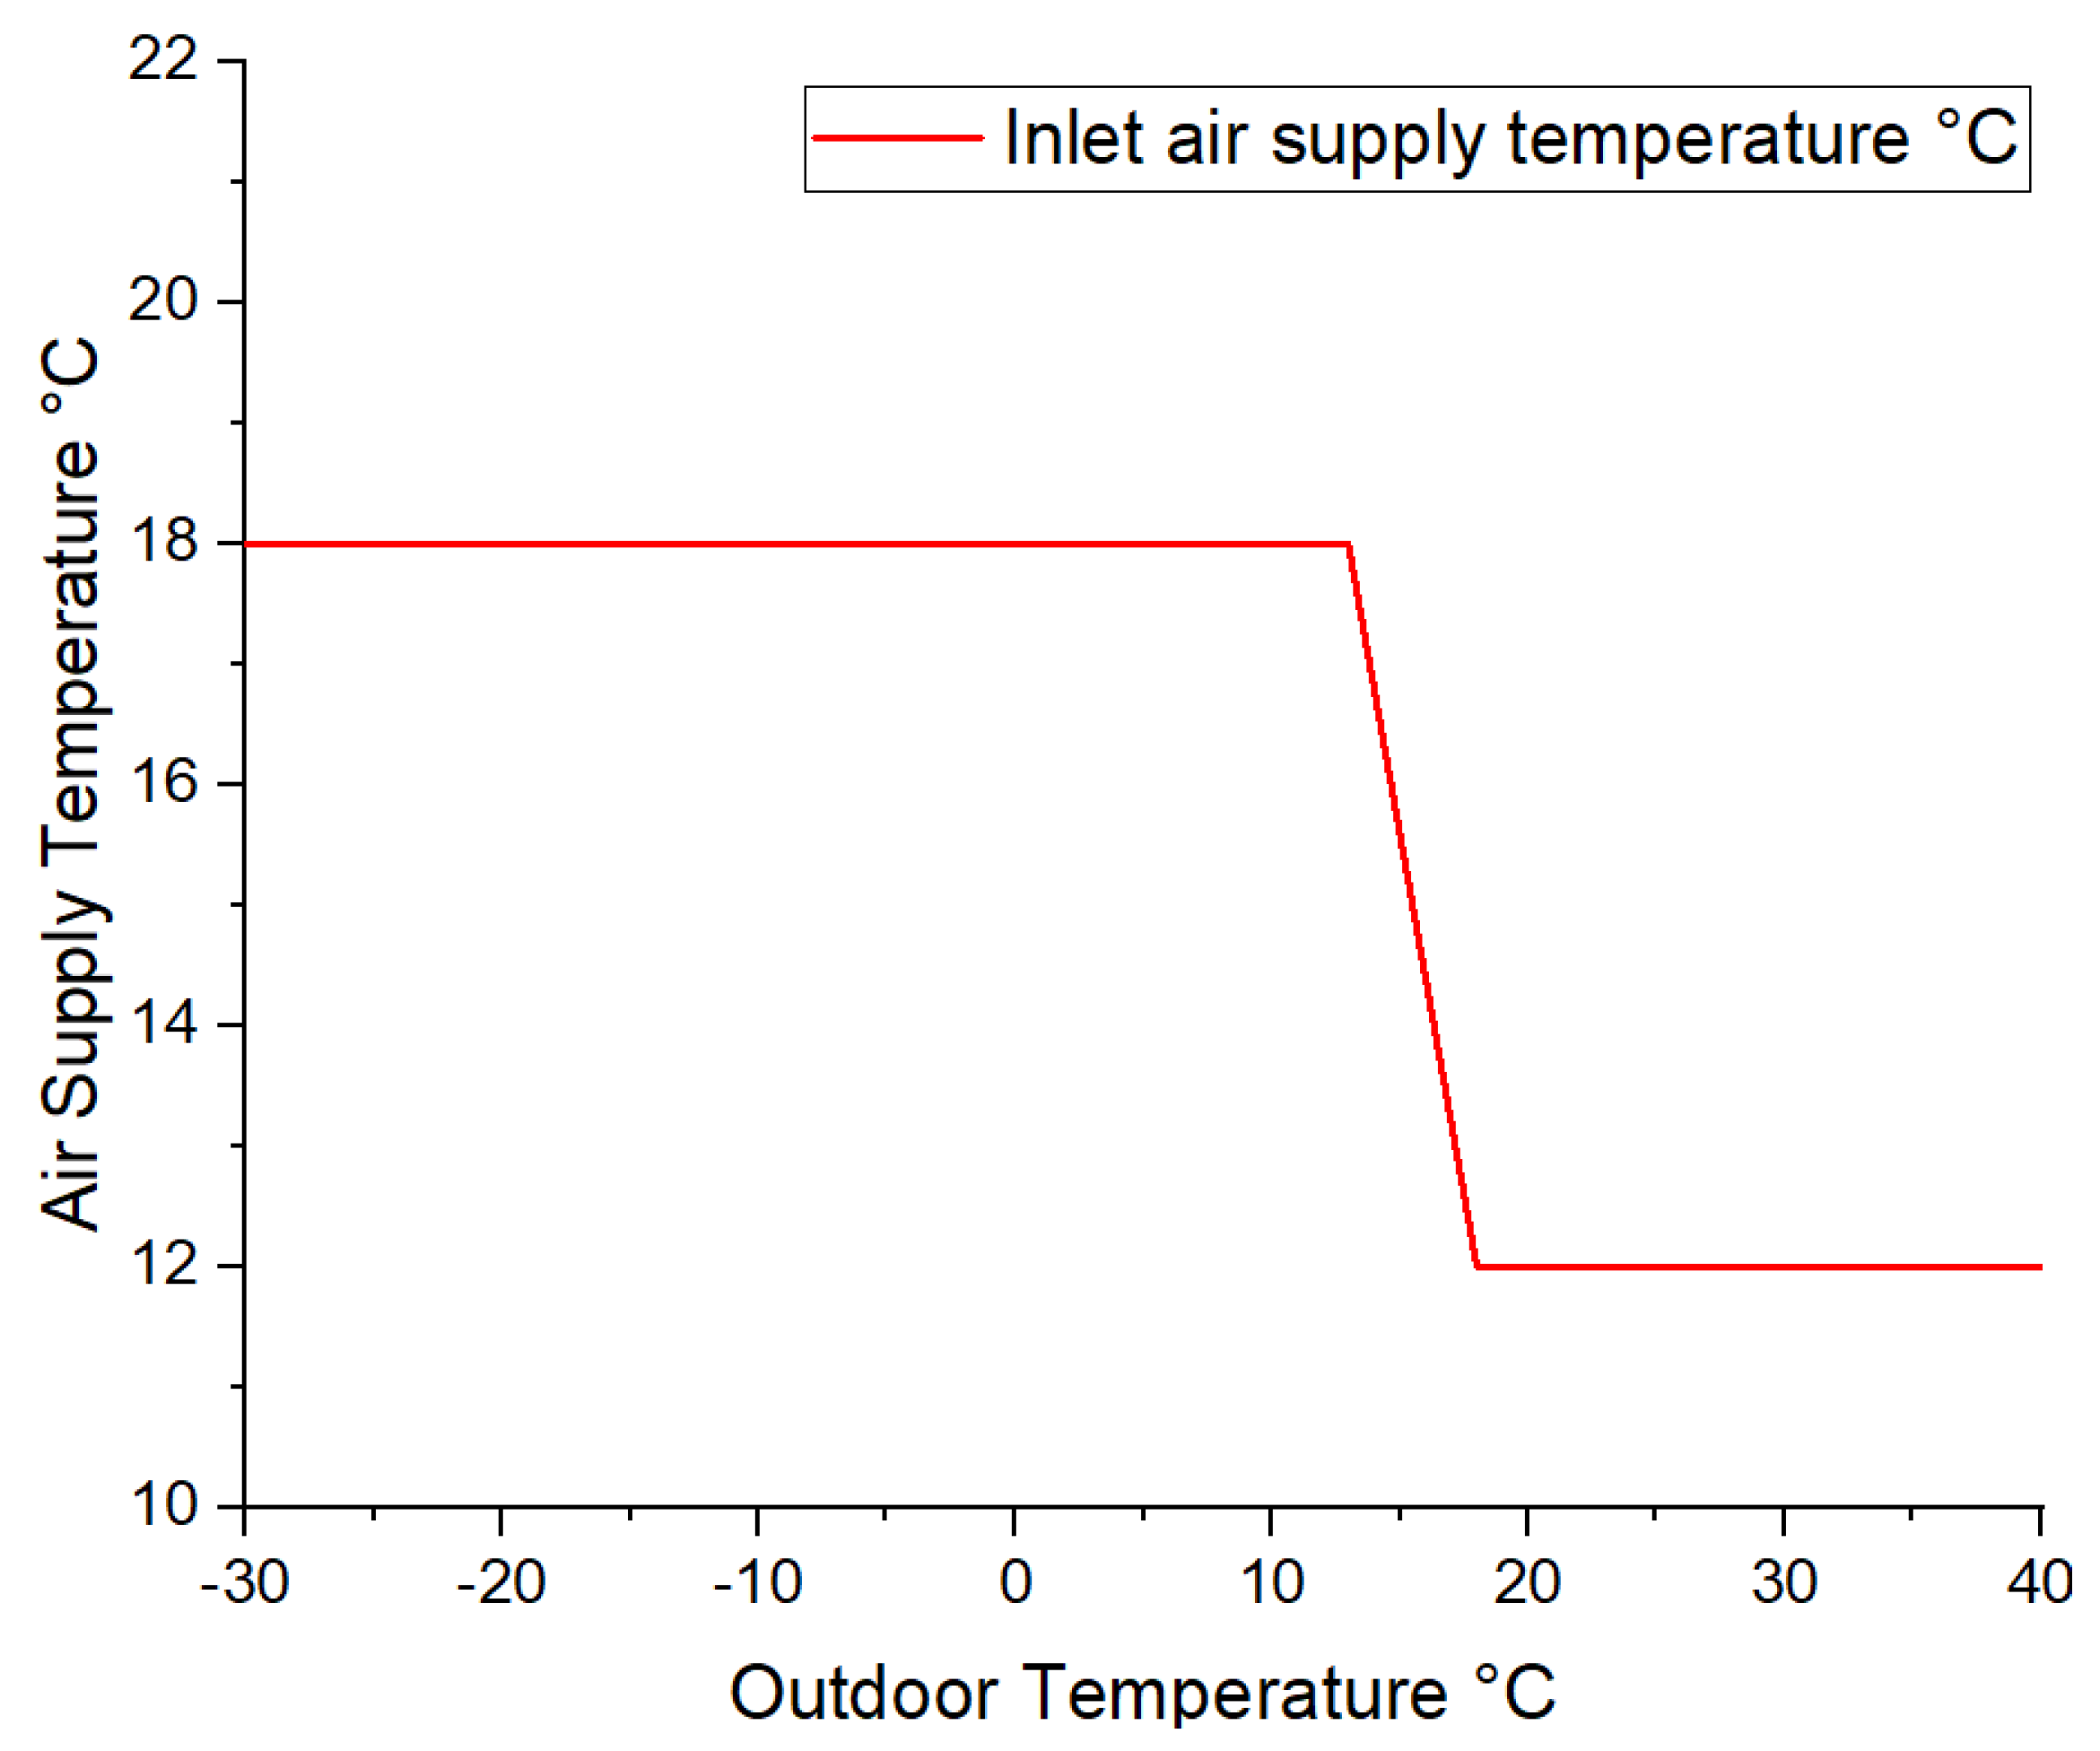
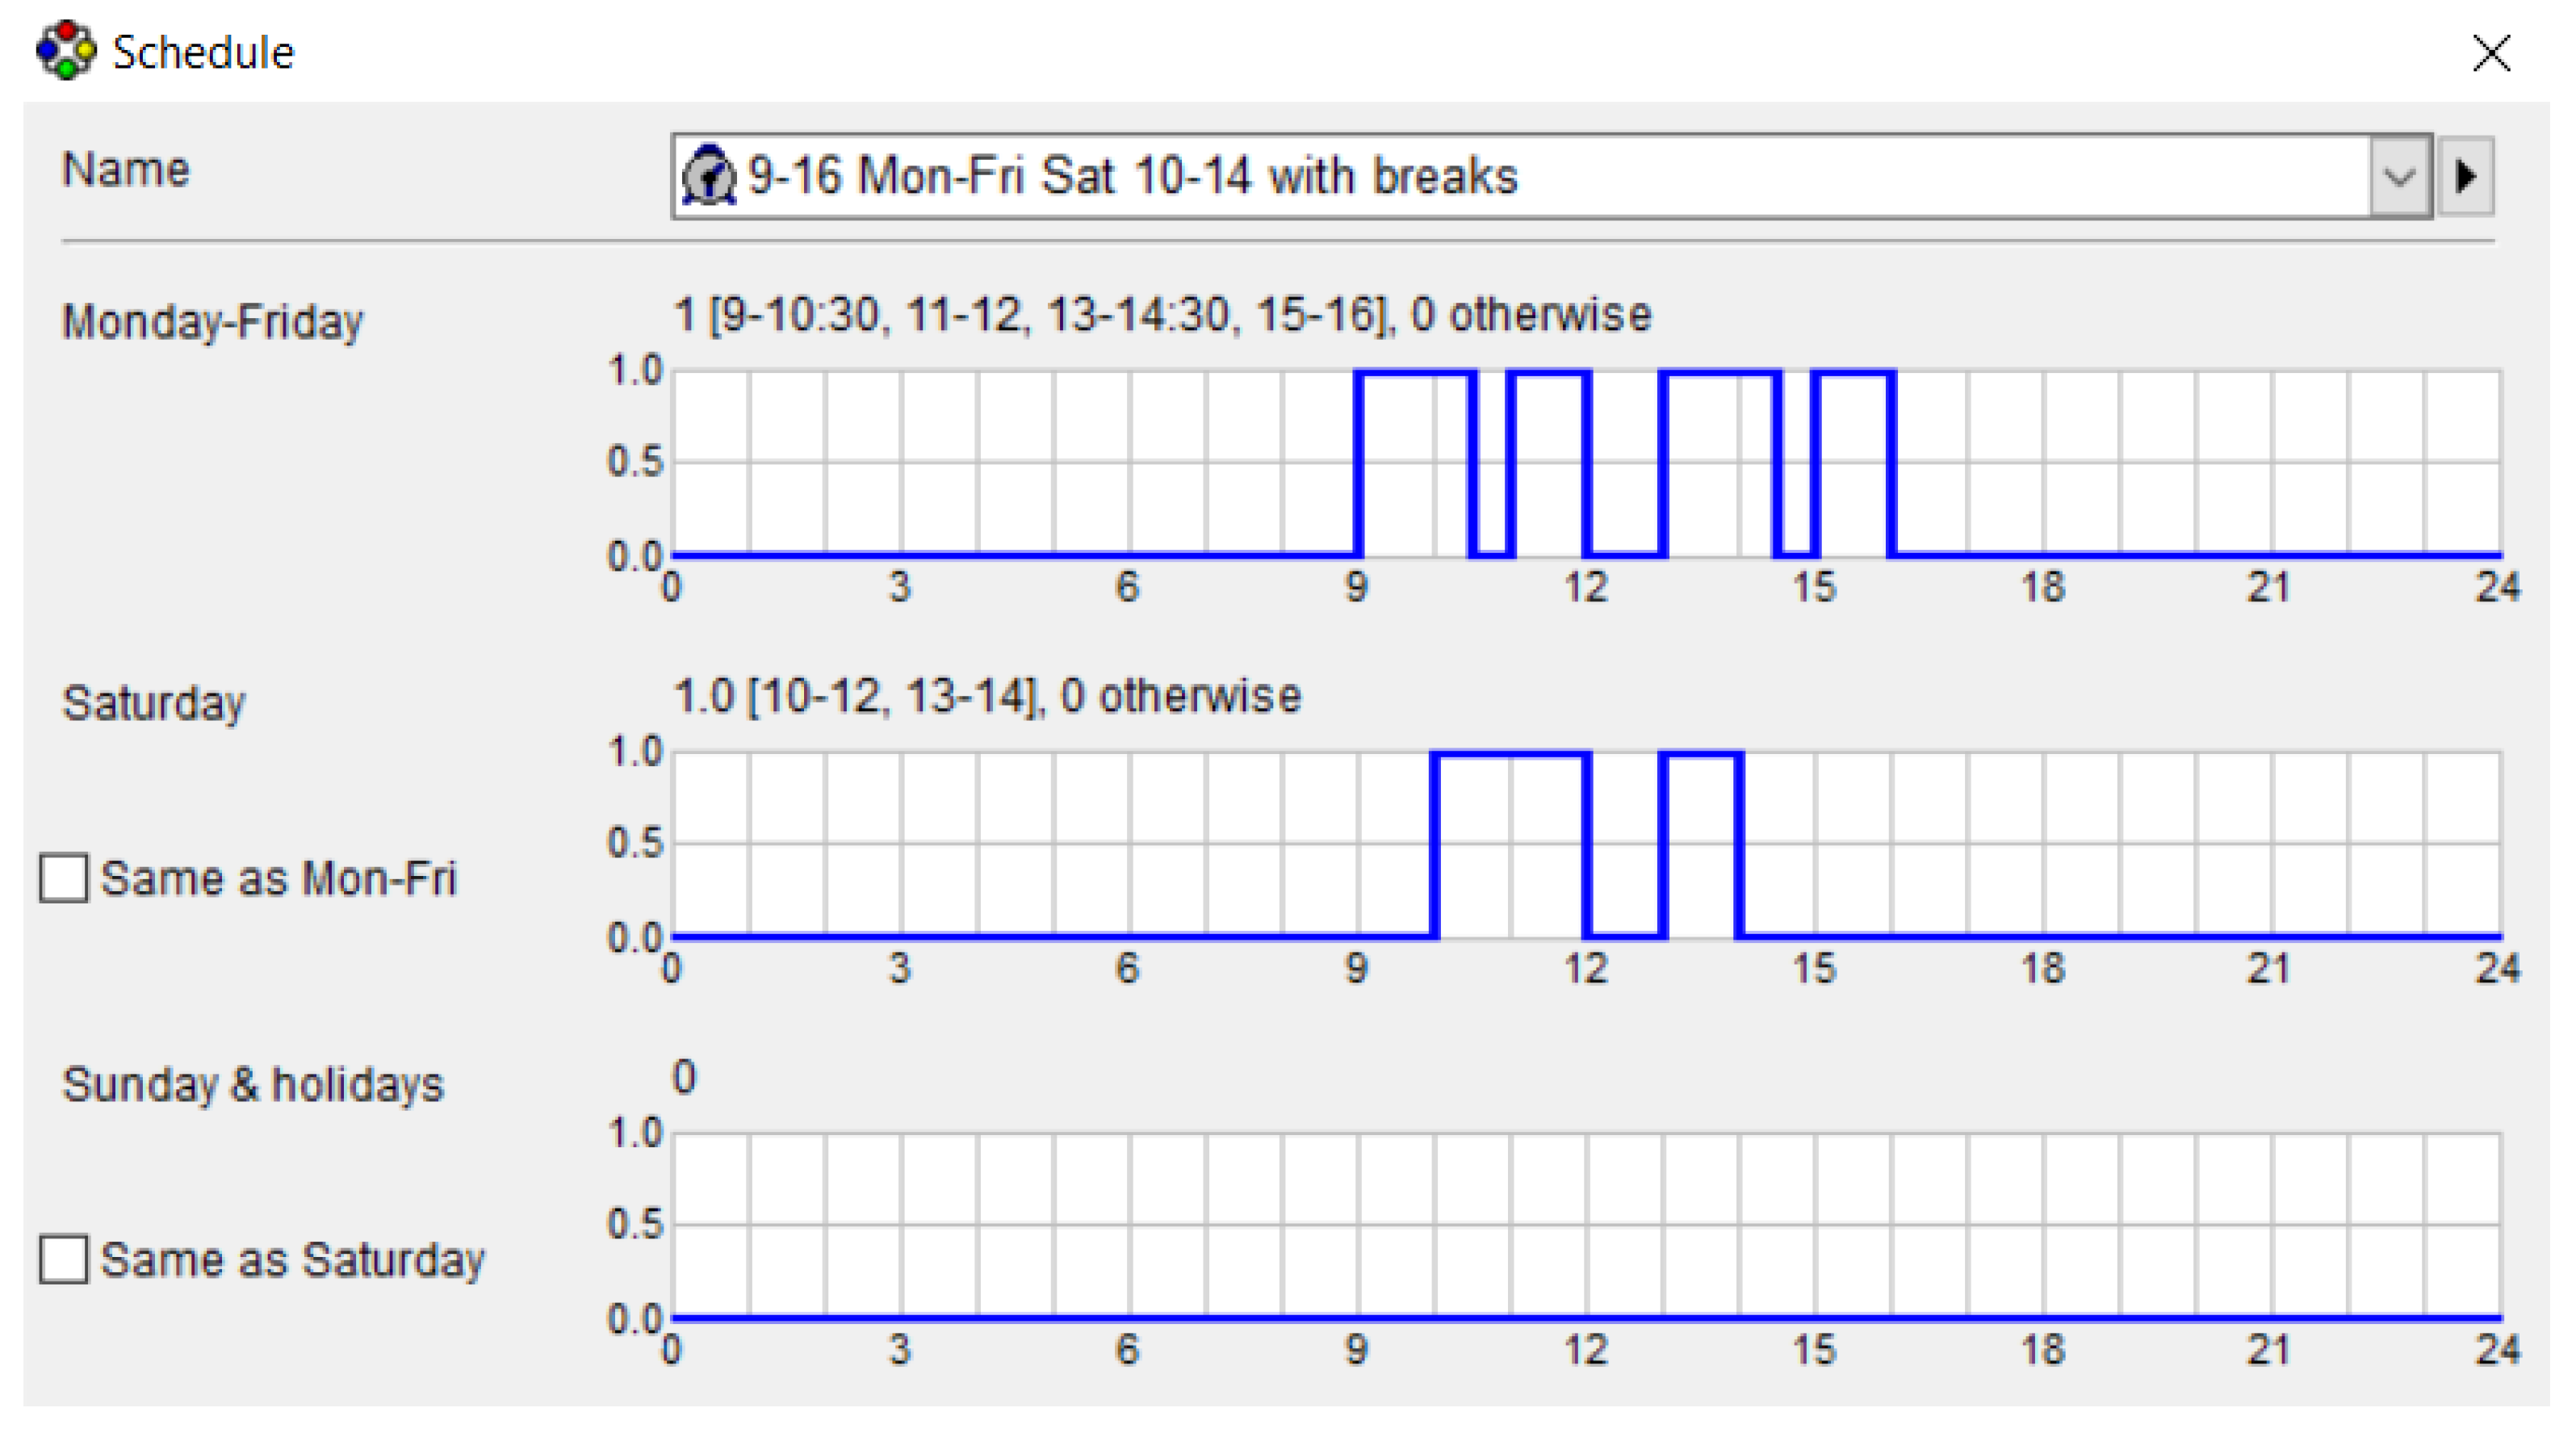
3.4. Simulation Model and Boundary Conditions
4. Results and Discussion
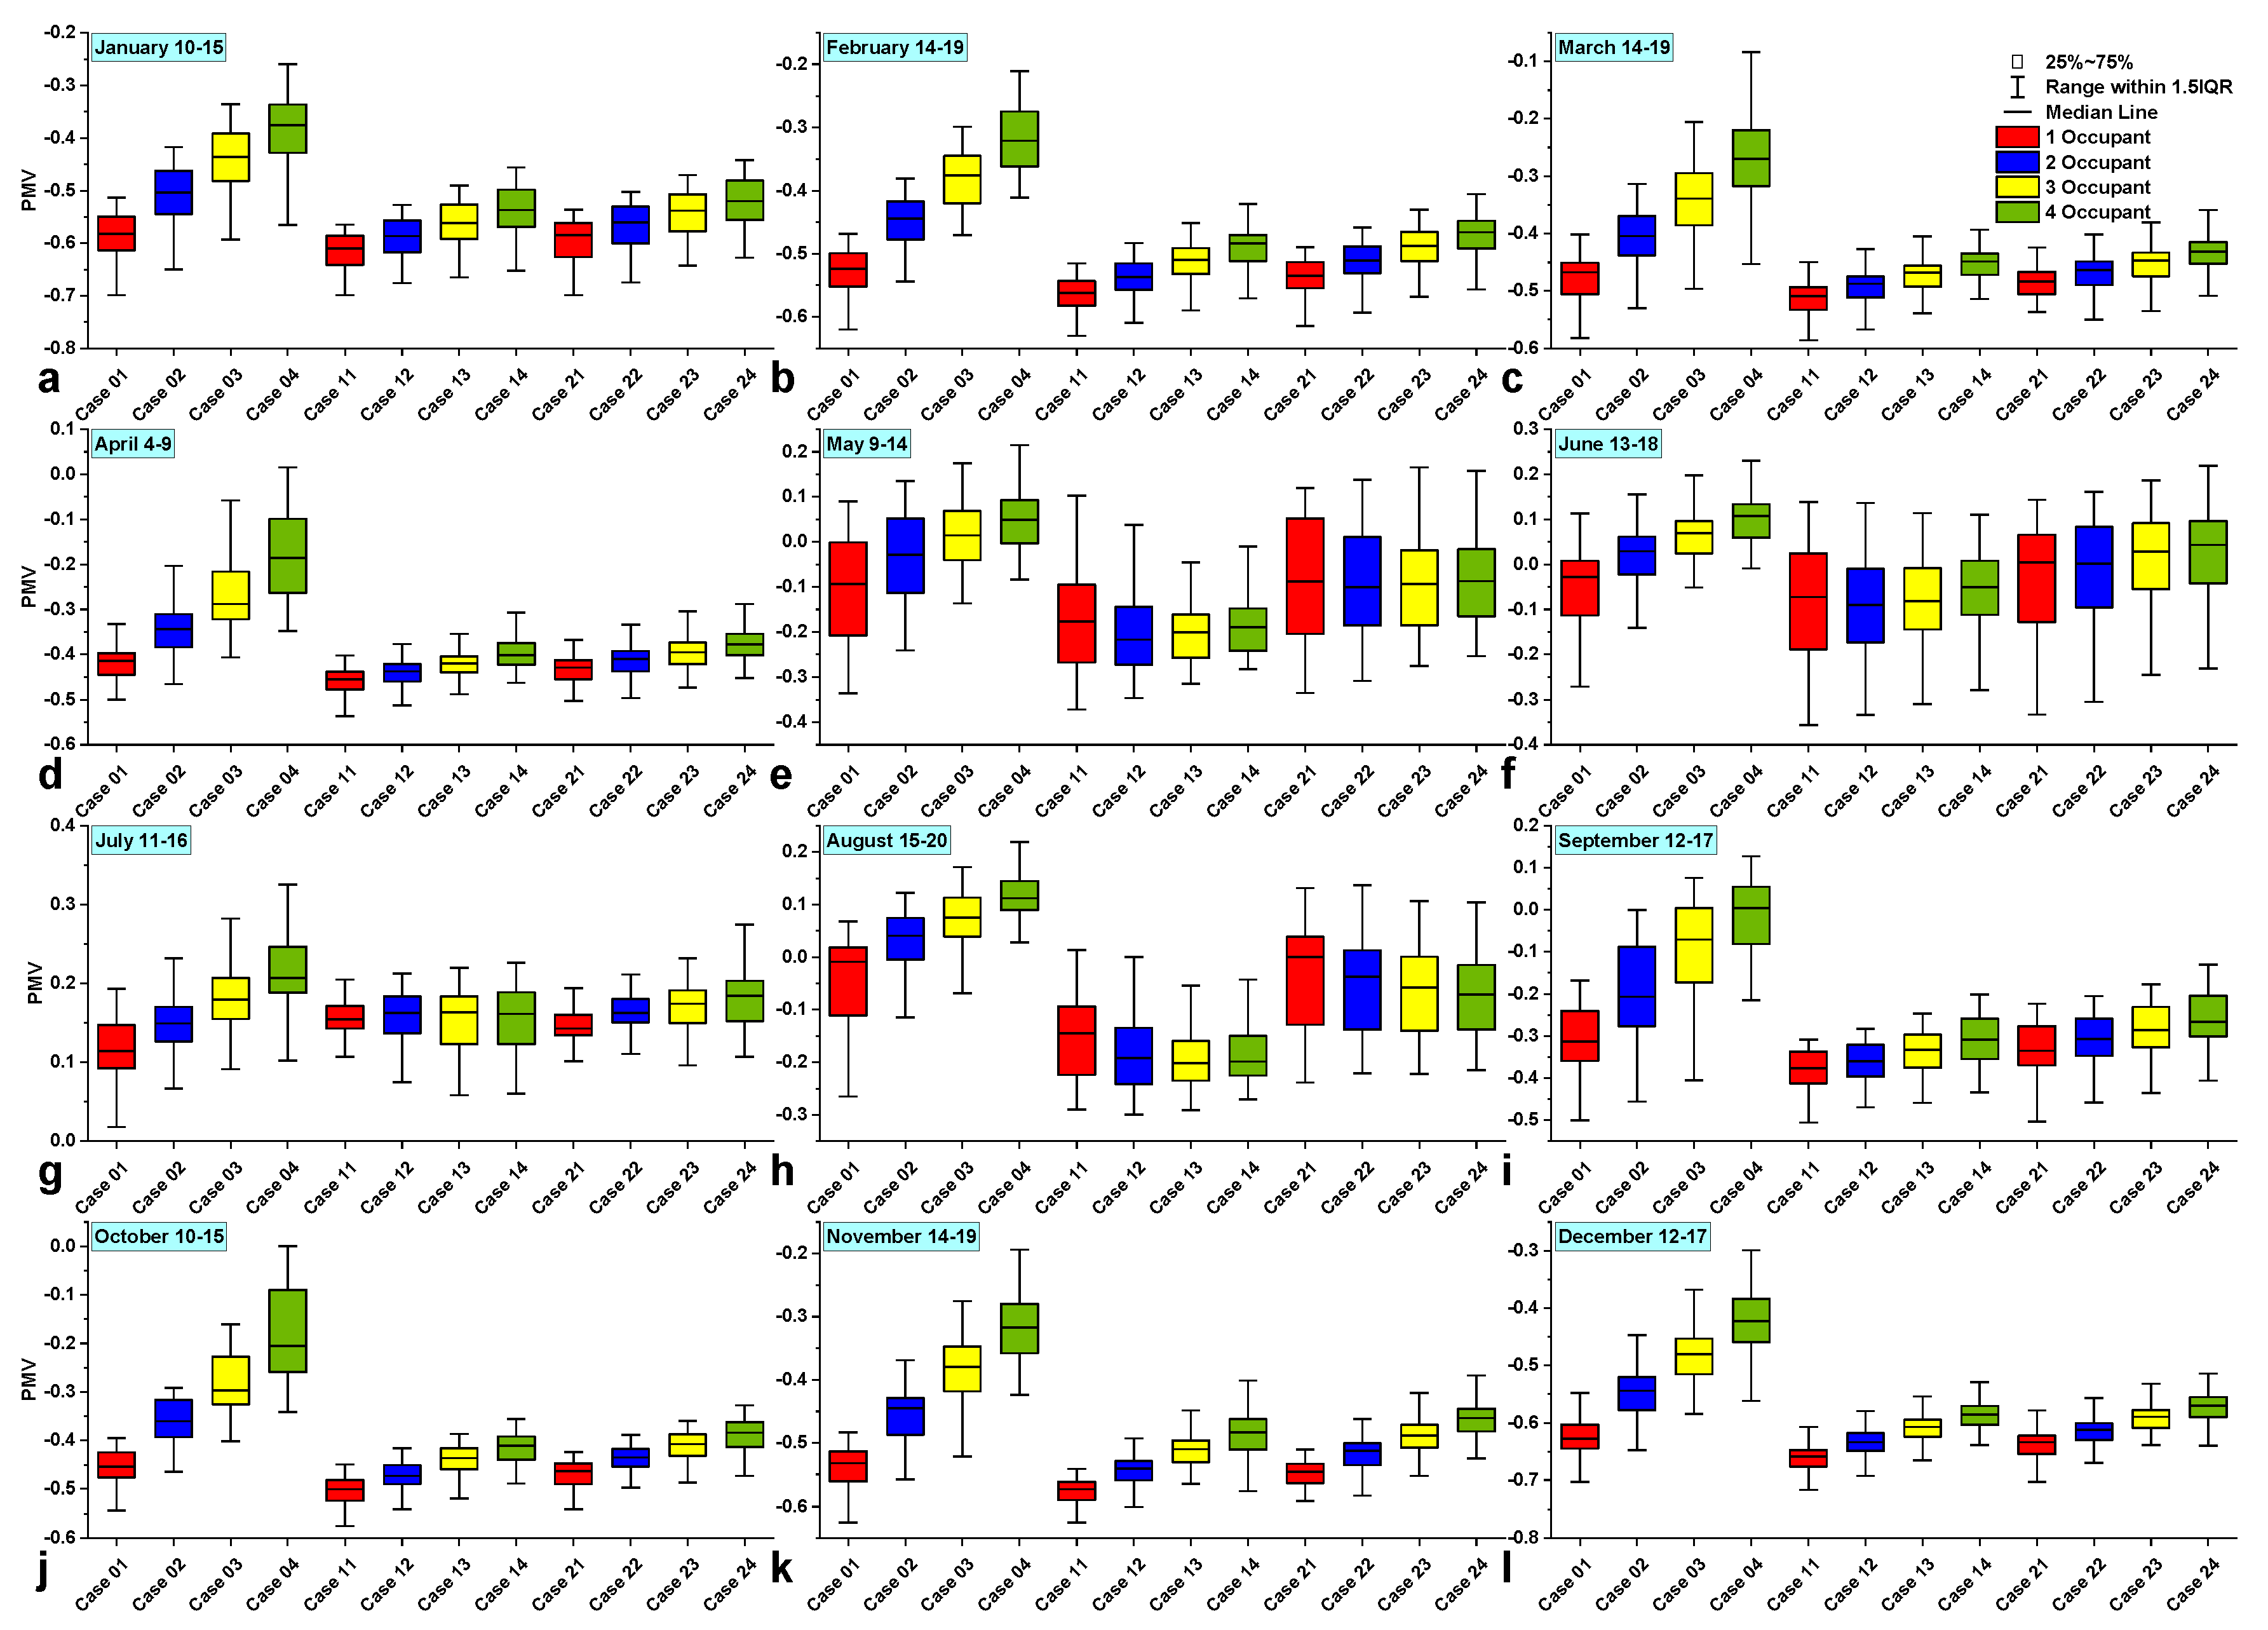
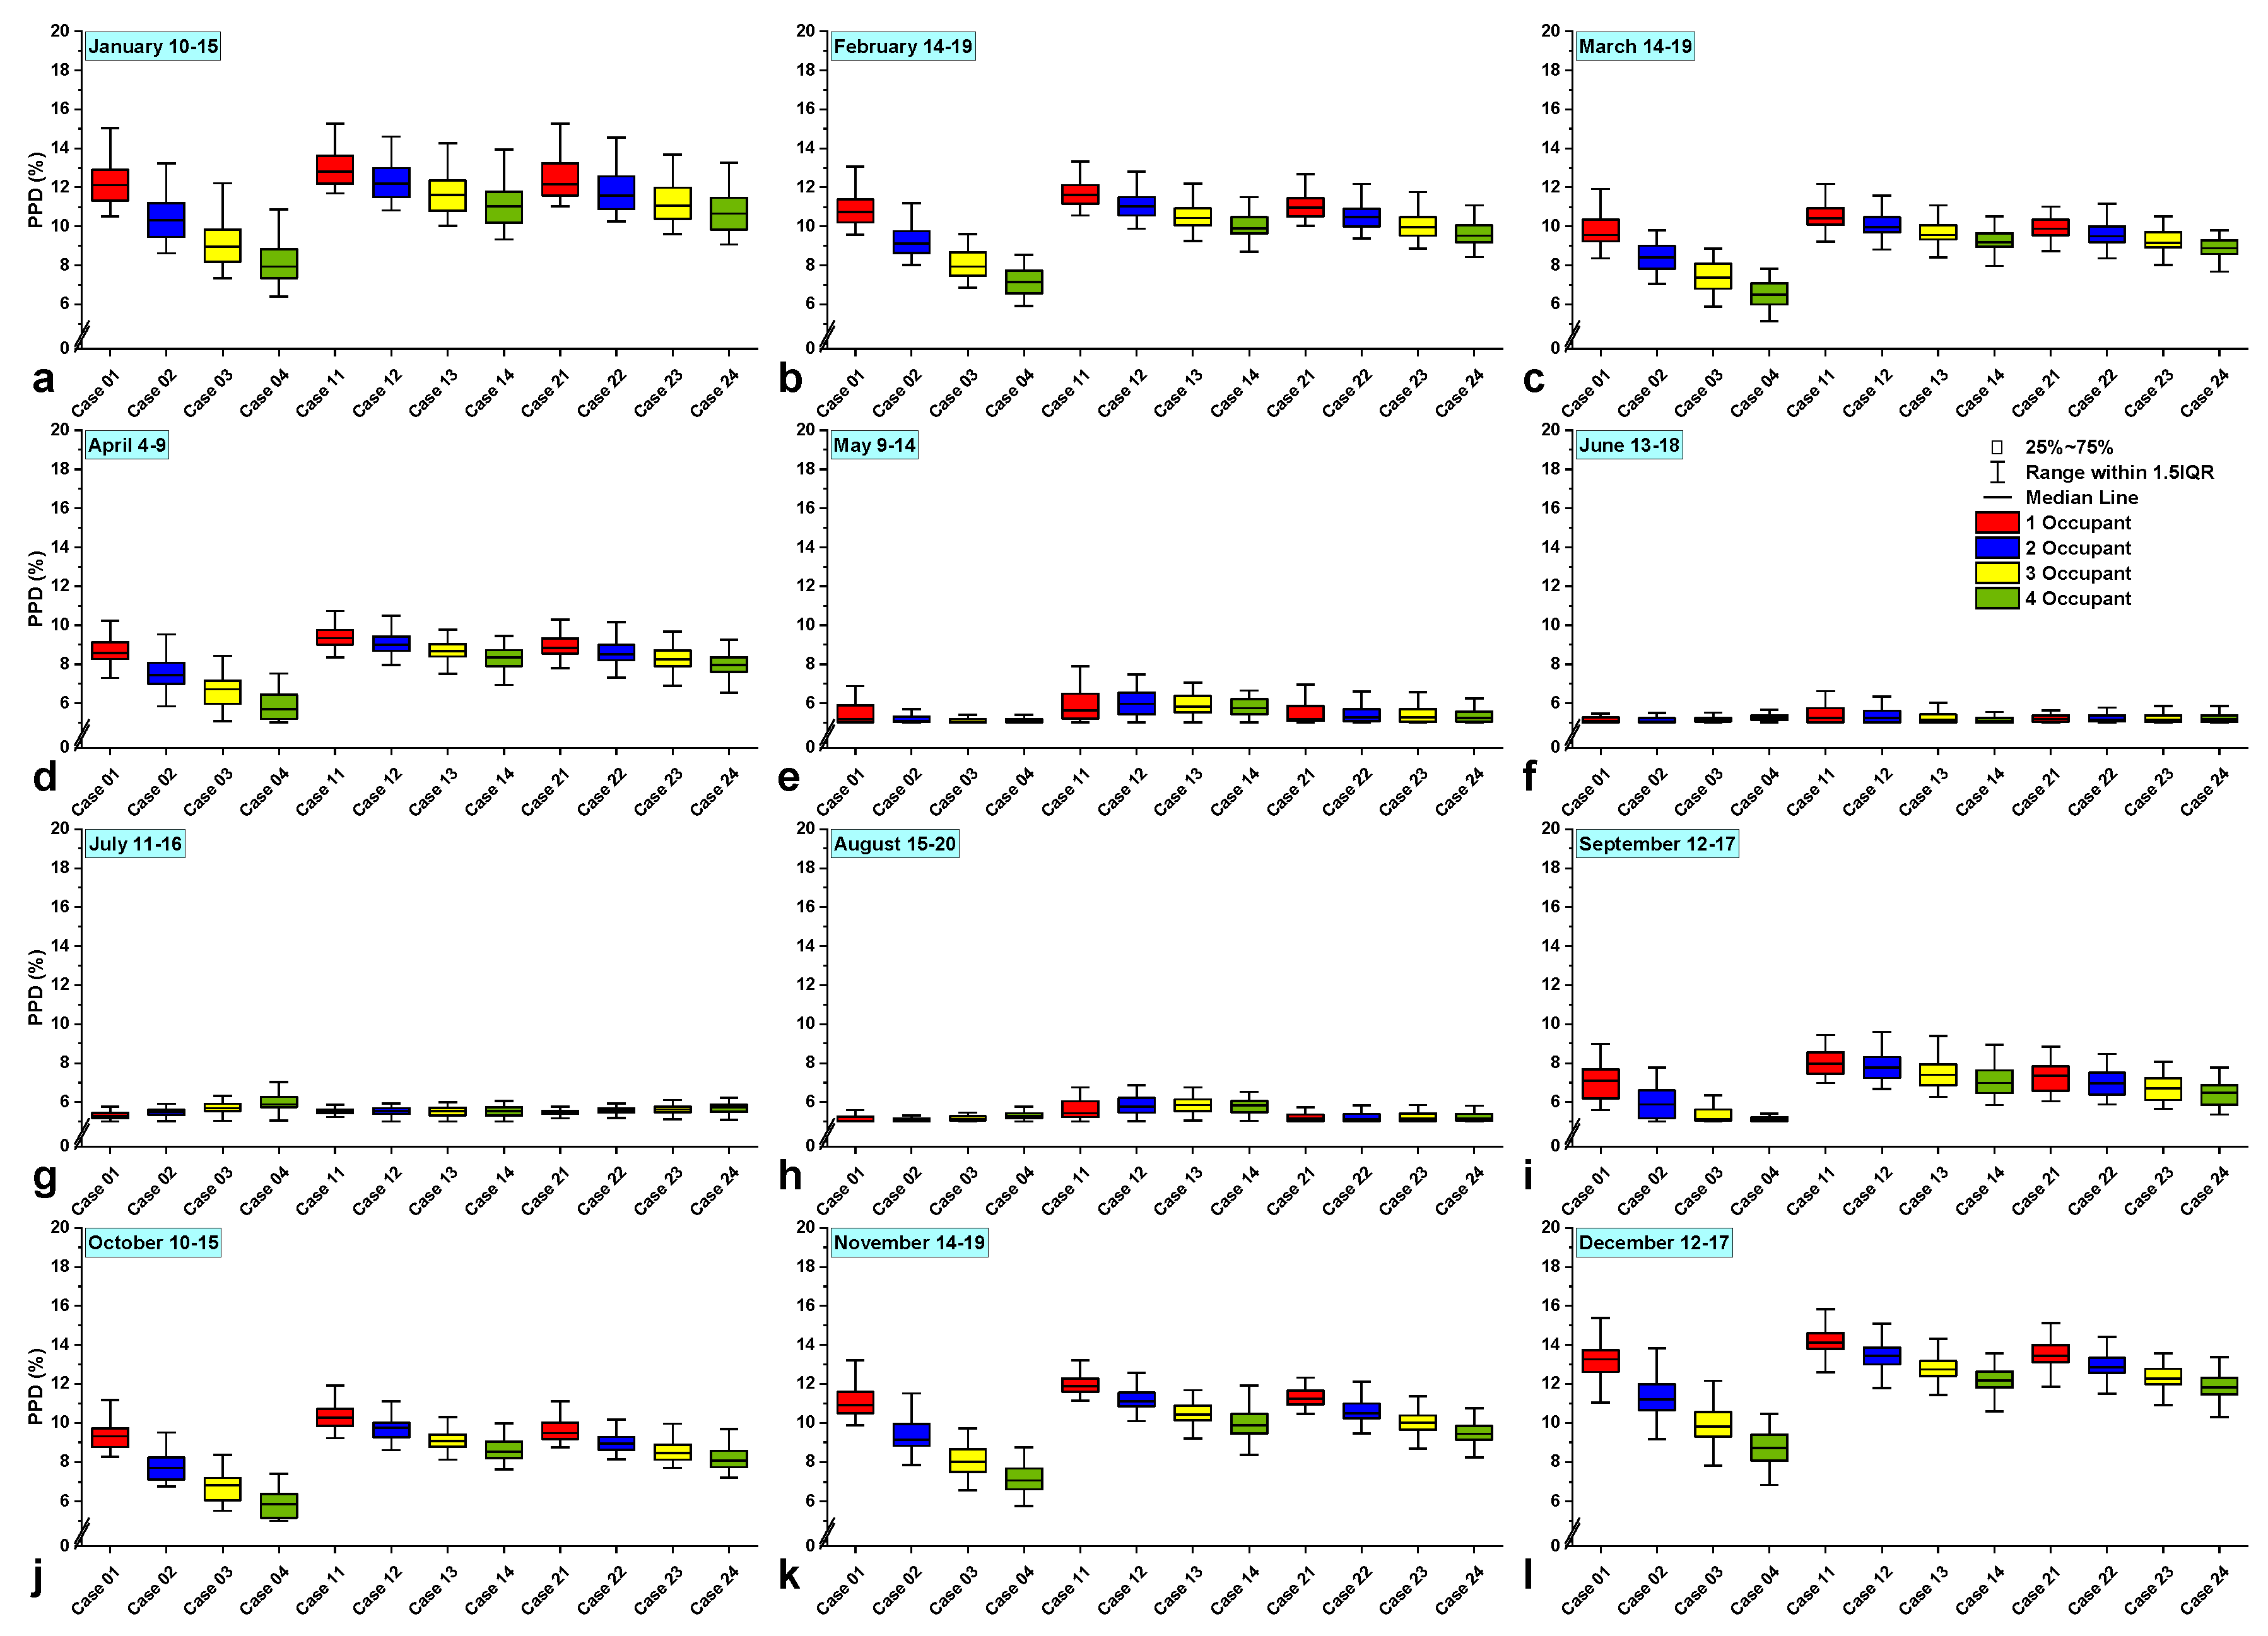
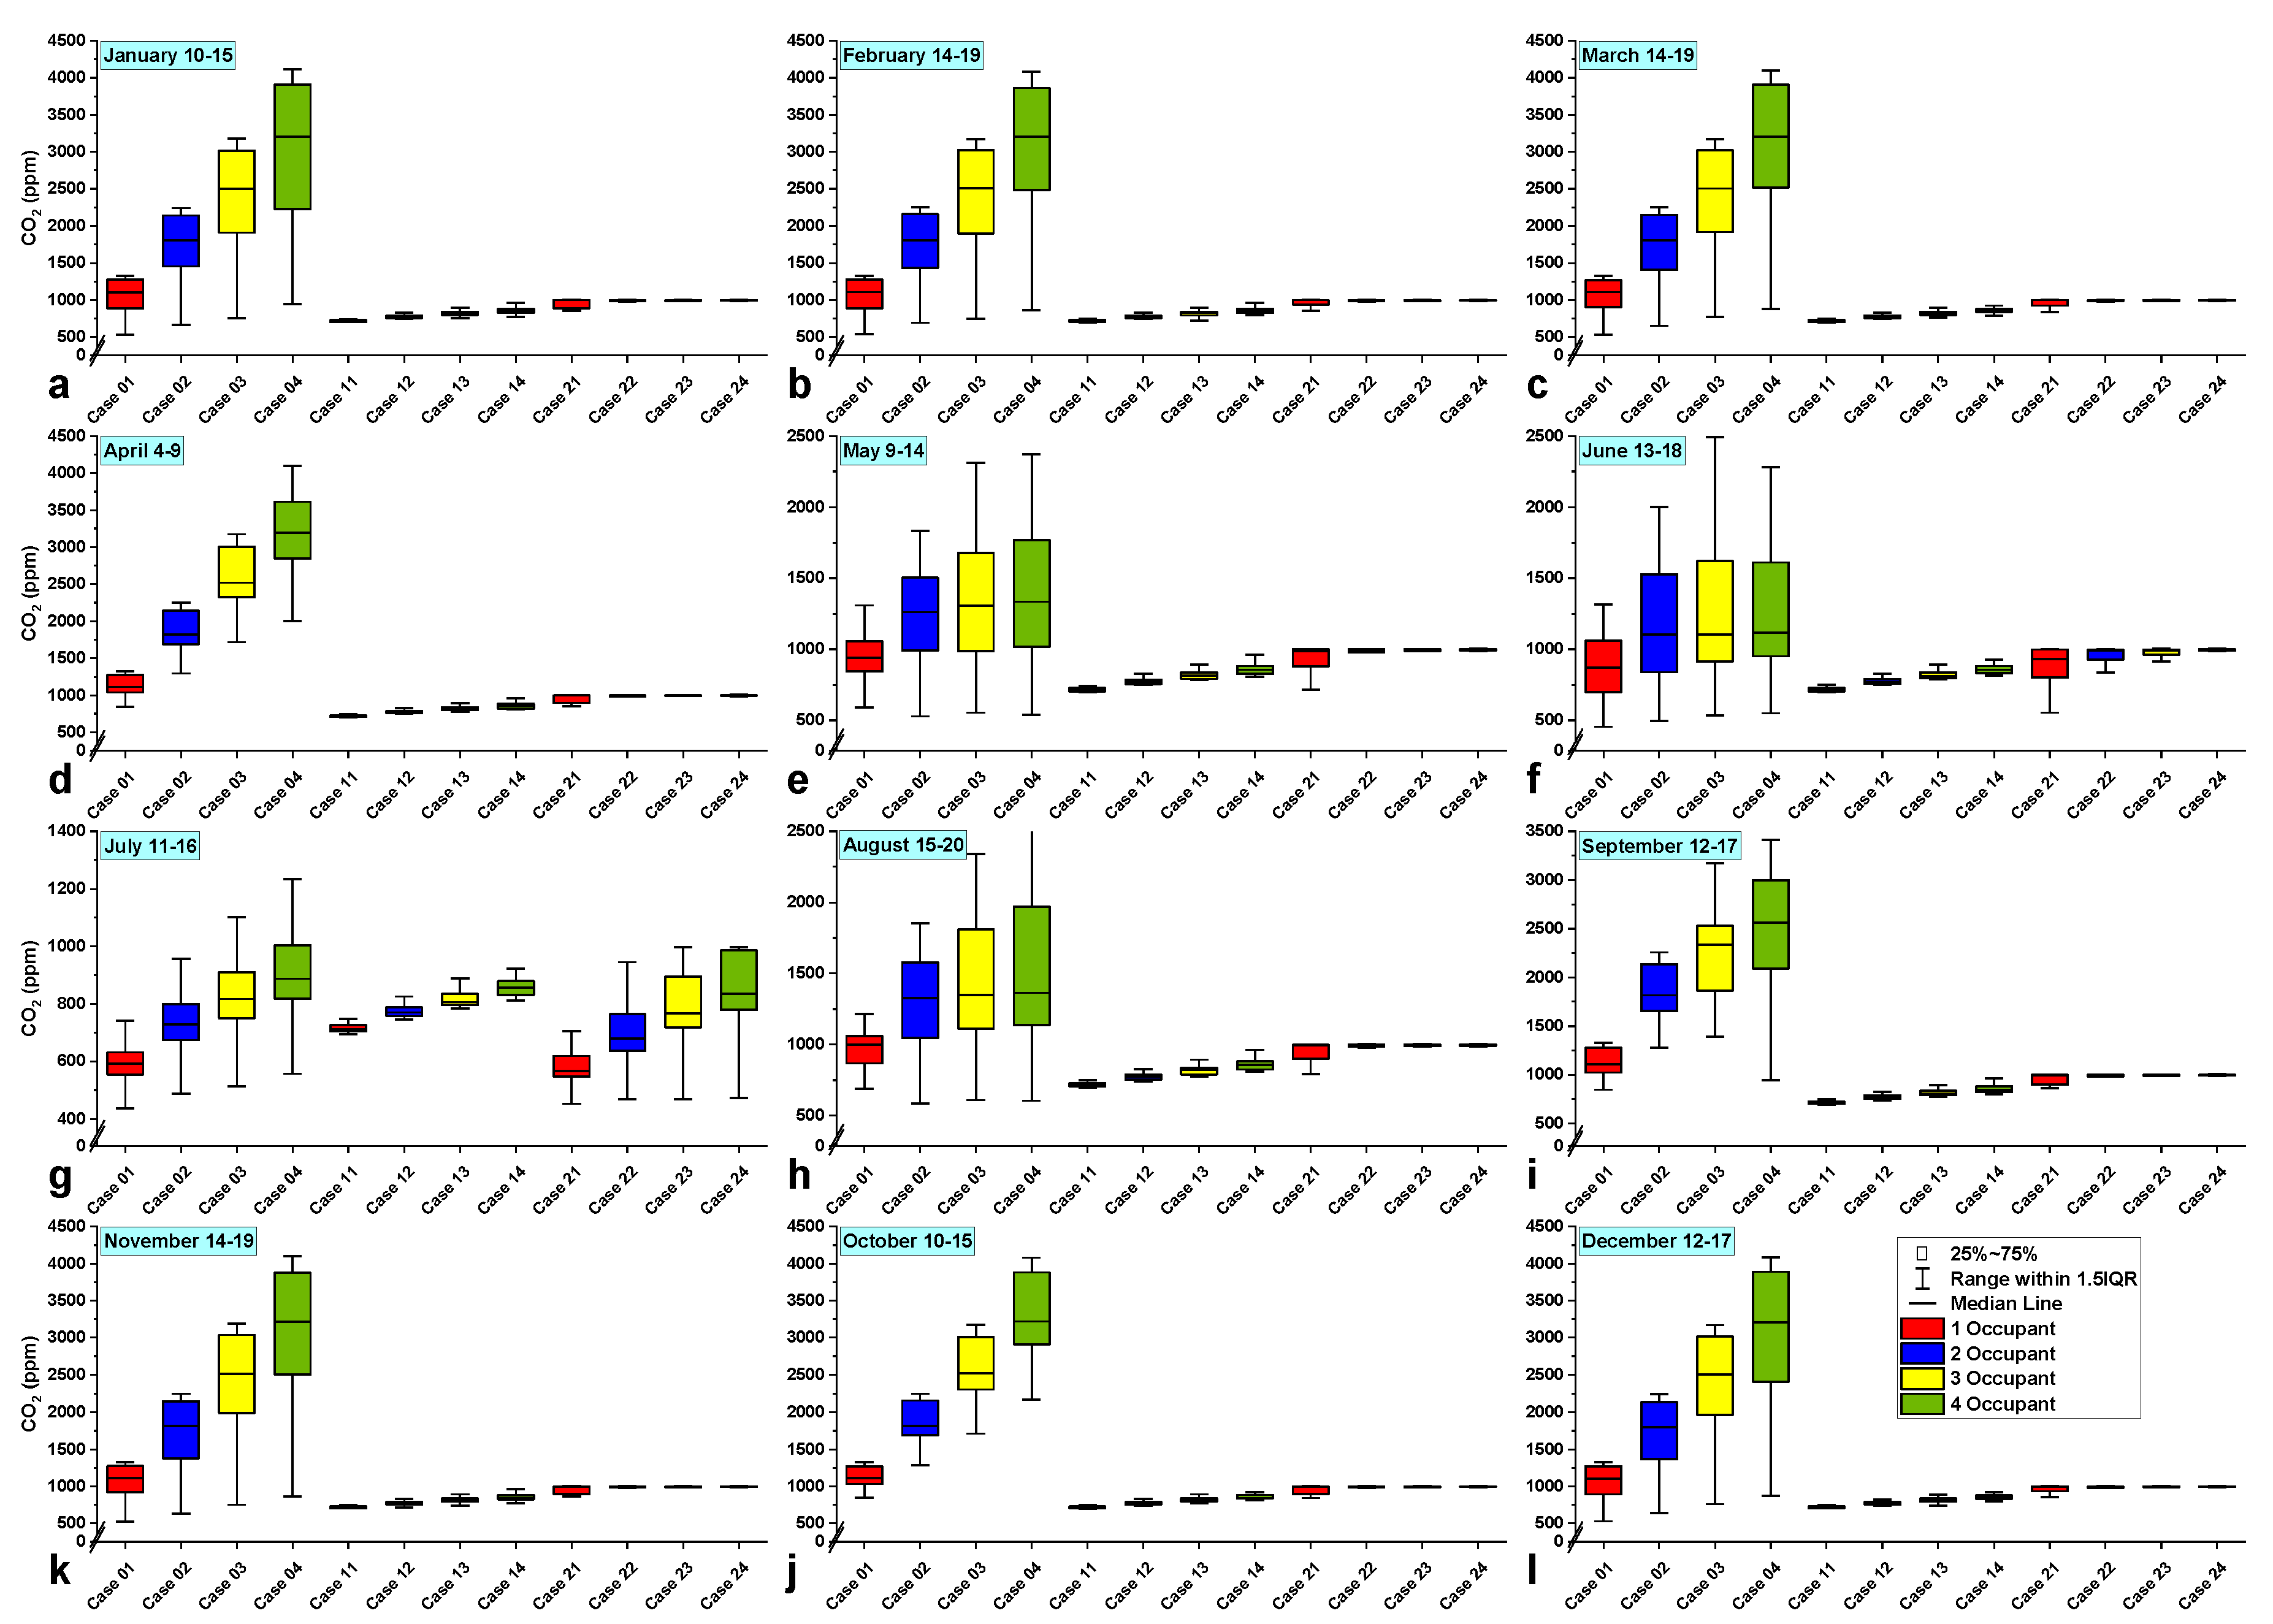
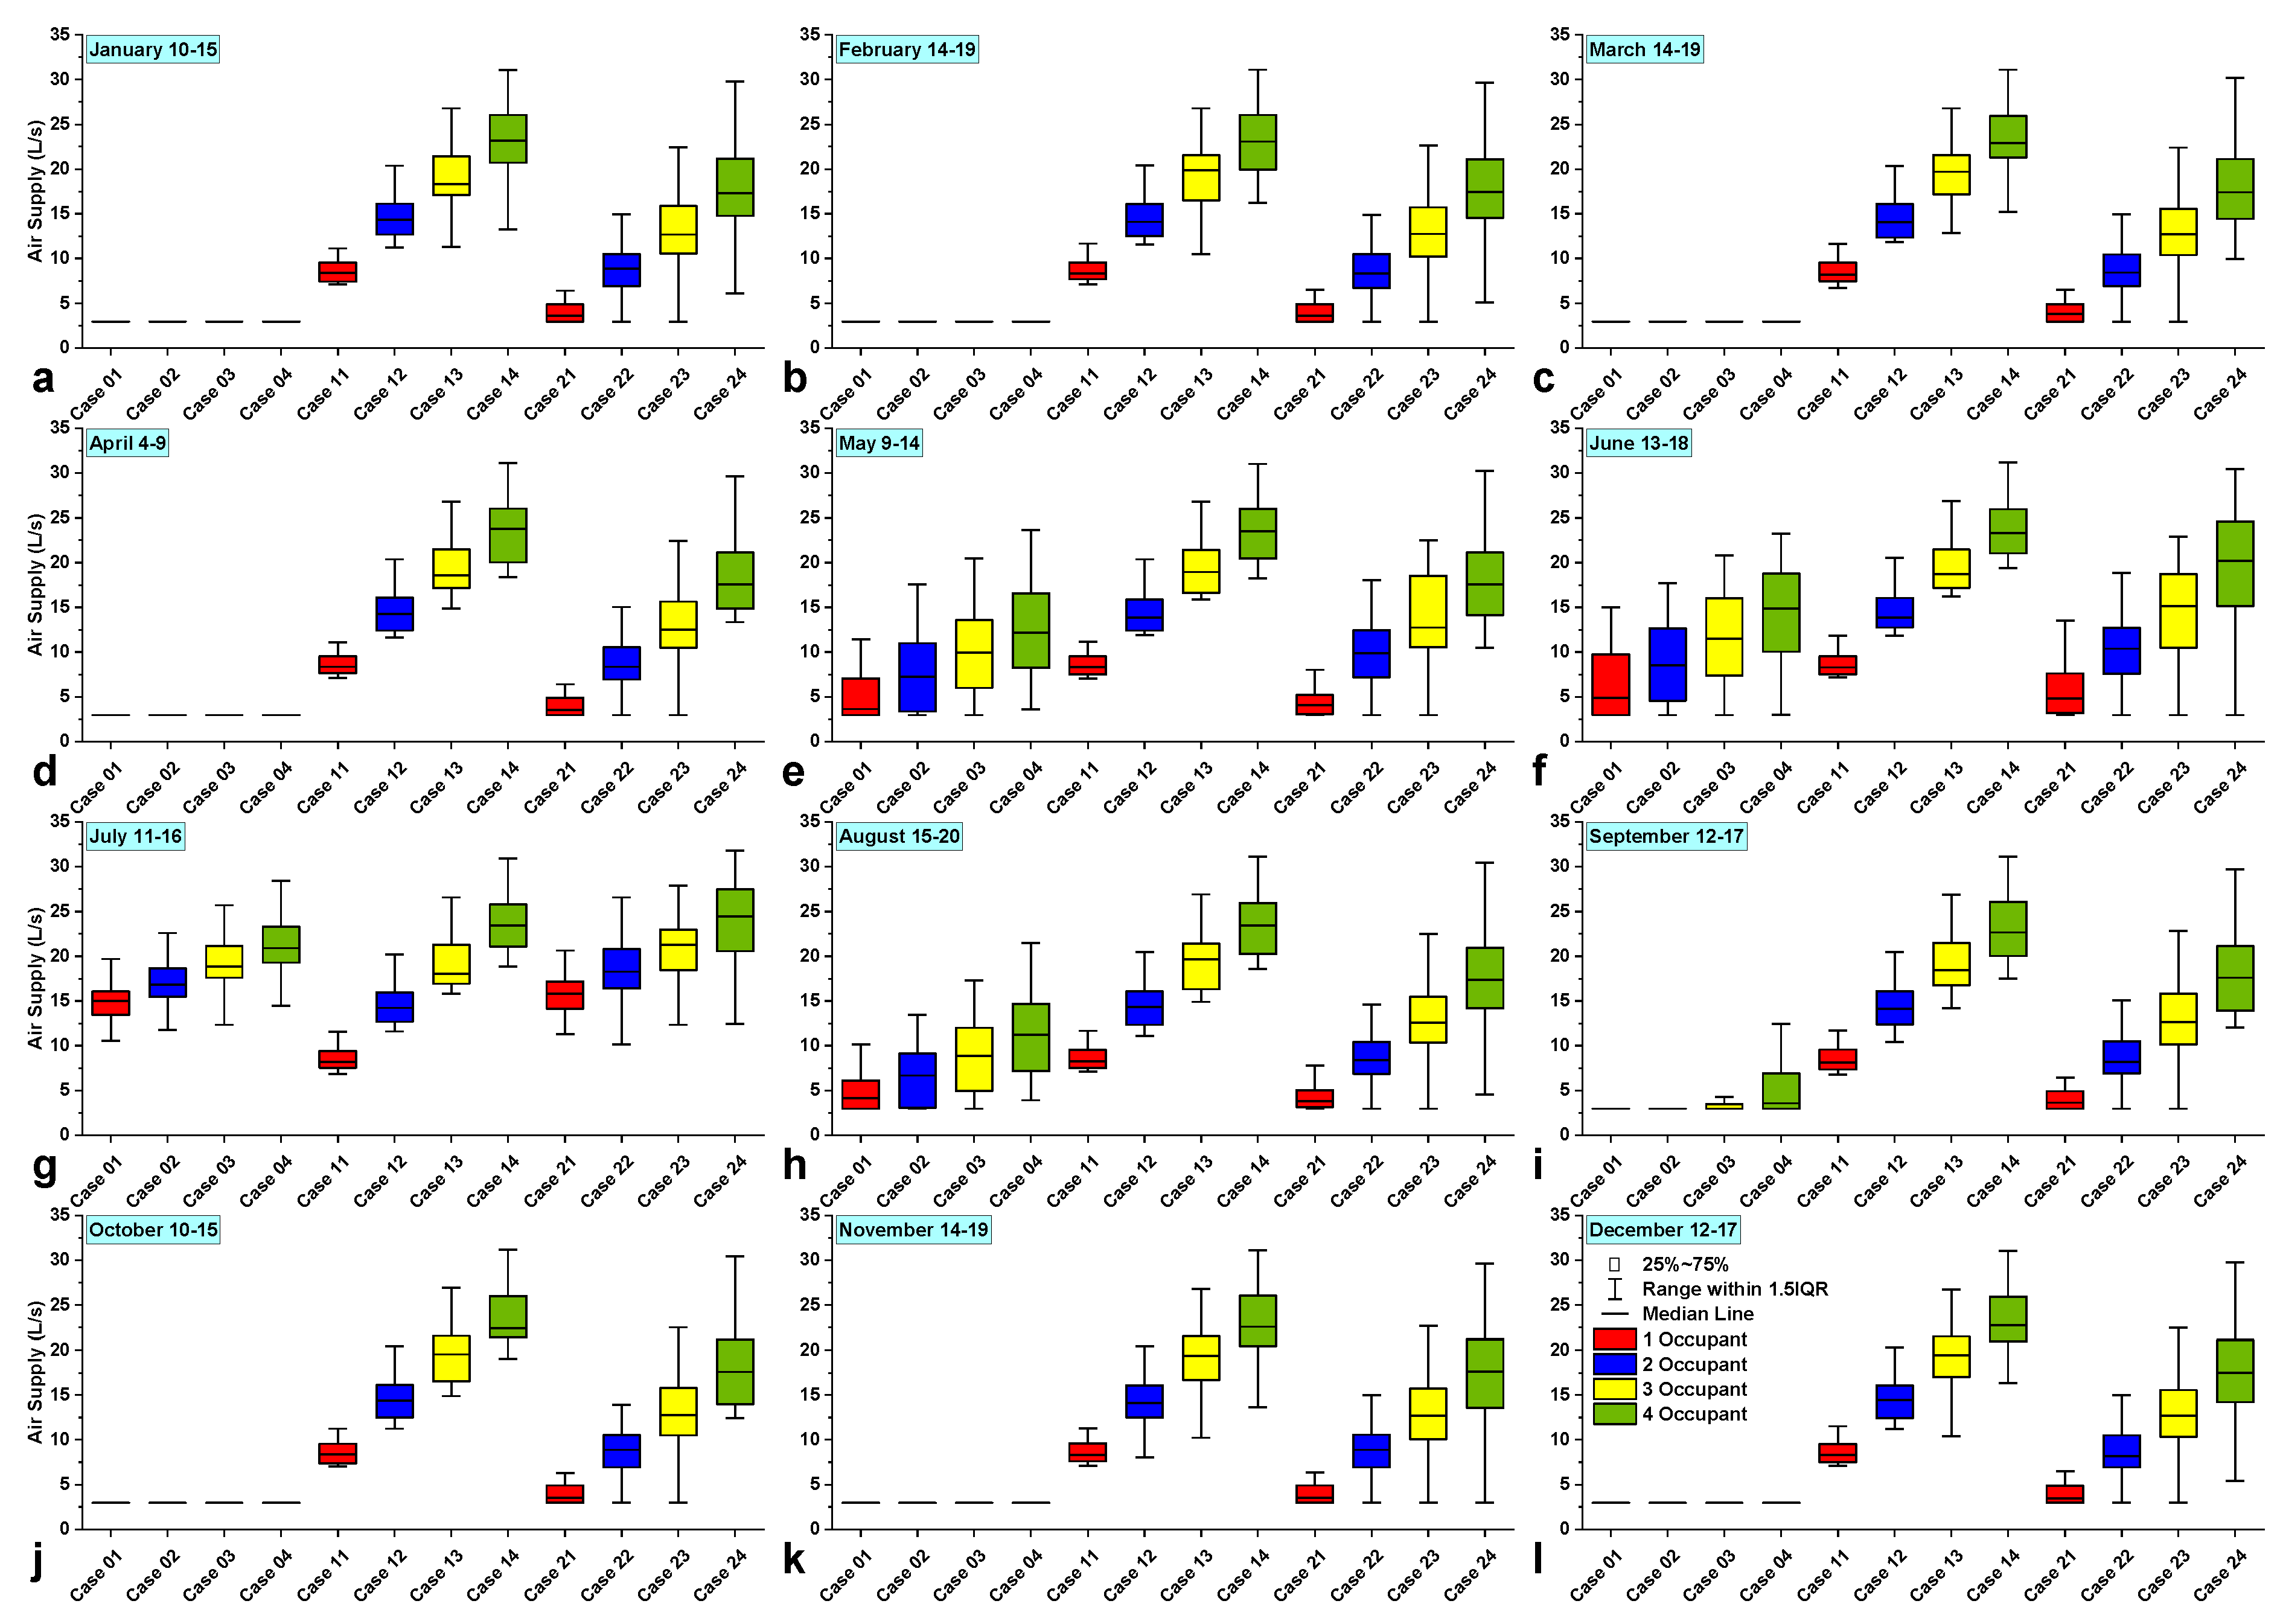
4.1. Results for Room 23:425
4.2. Results for Room 23:429
5. Conclusions
Author Contributions
Funding
Data Availability Statement
Conflicts of Interest
Nomenclature
| CV(RSME) | coefficient of variation of the root-mean-square error |
| IAQ | indoor air quality |
| NMBE | normalized mean bias error (%) |
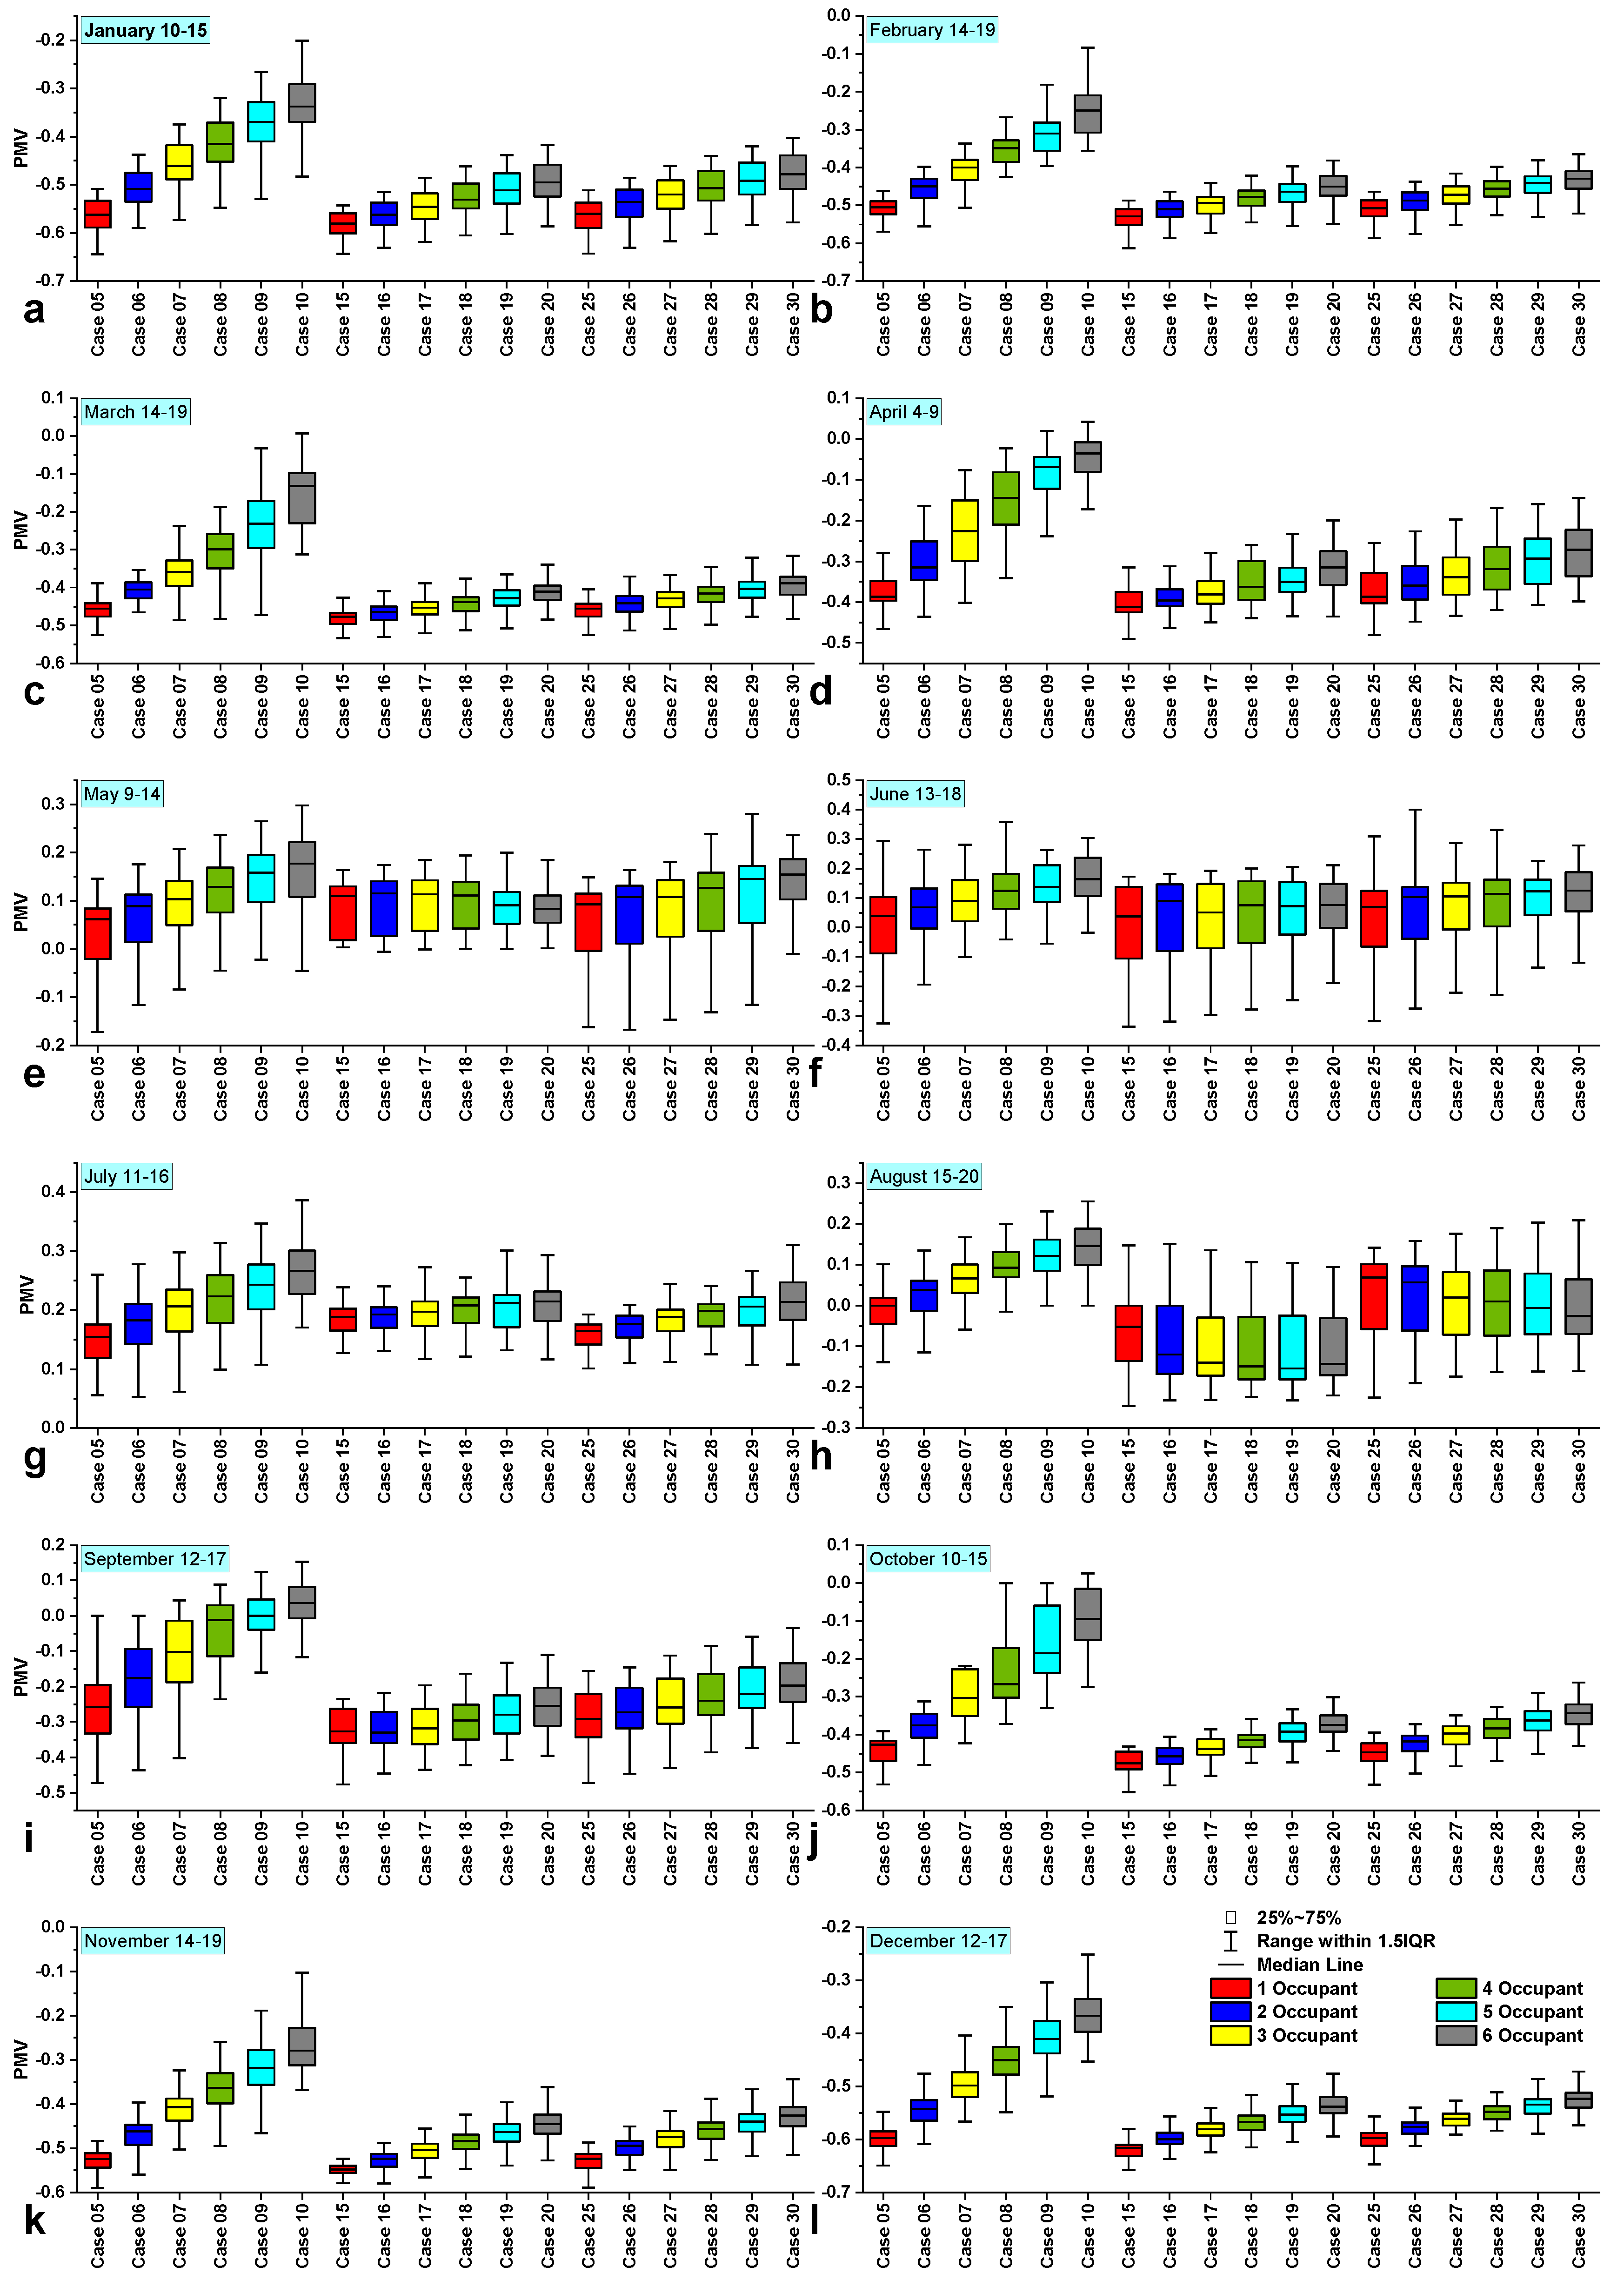
| PMV | predicted mean vote |
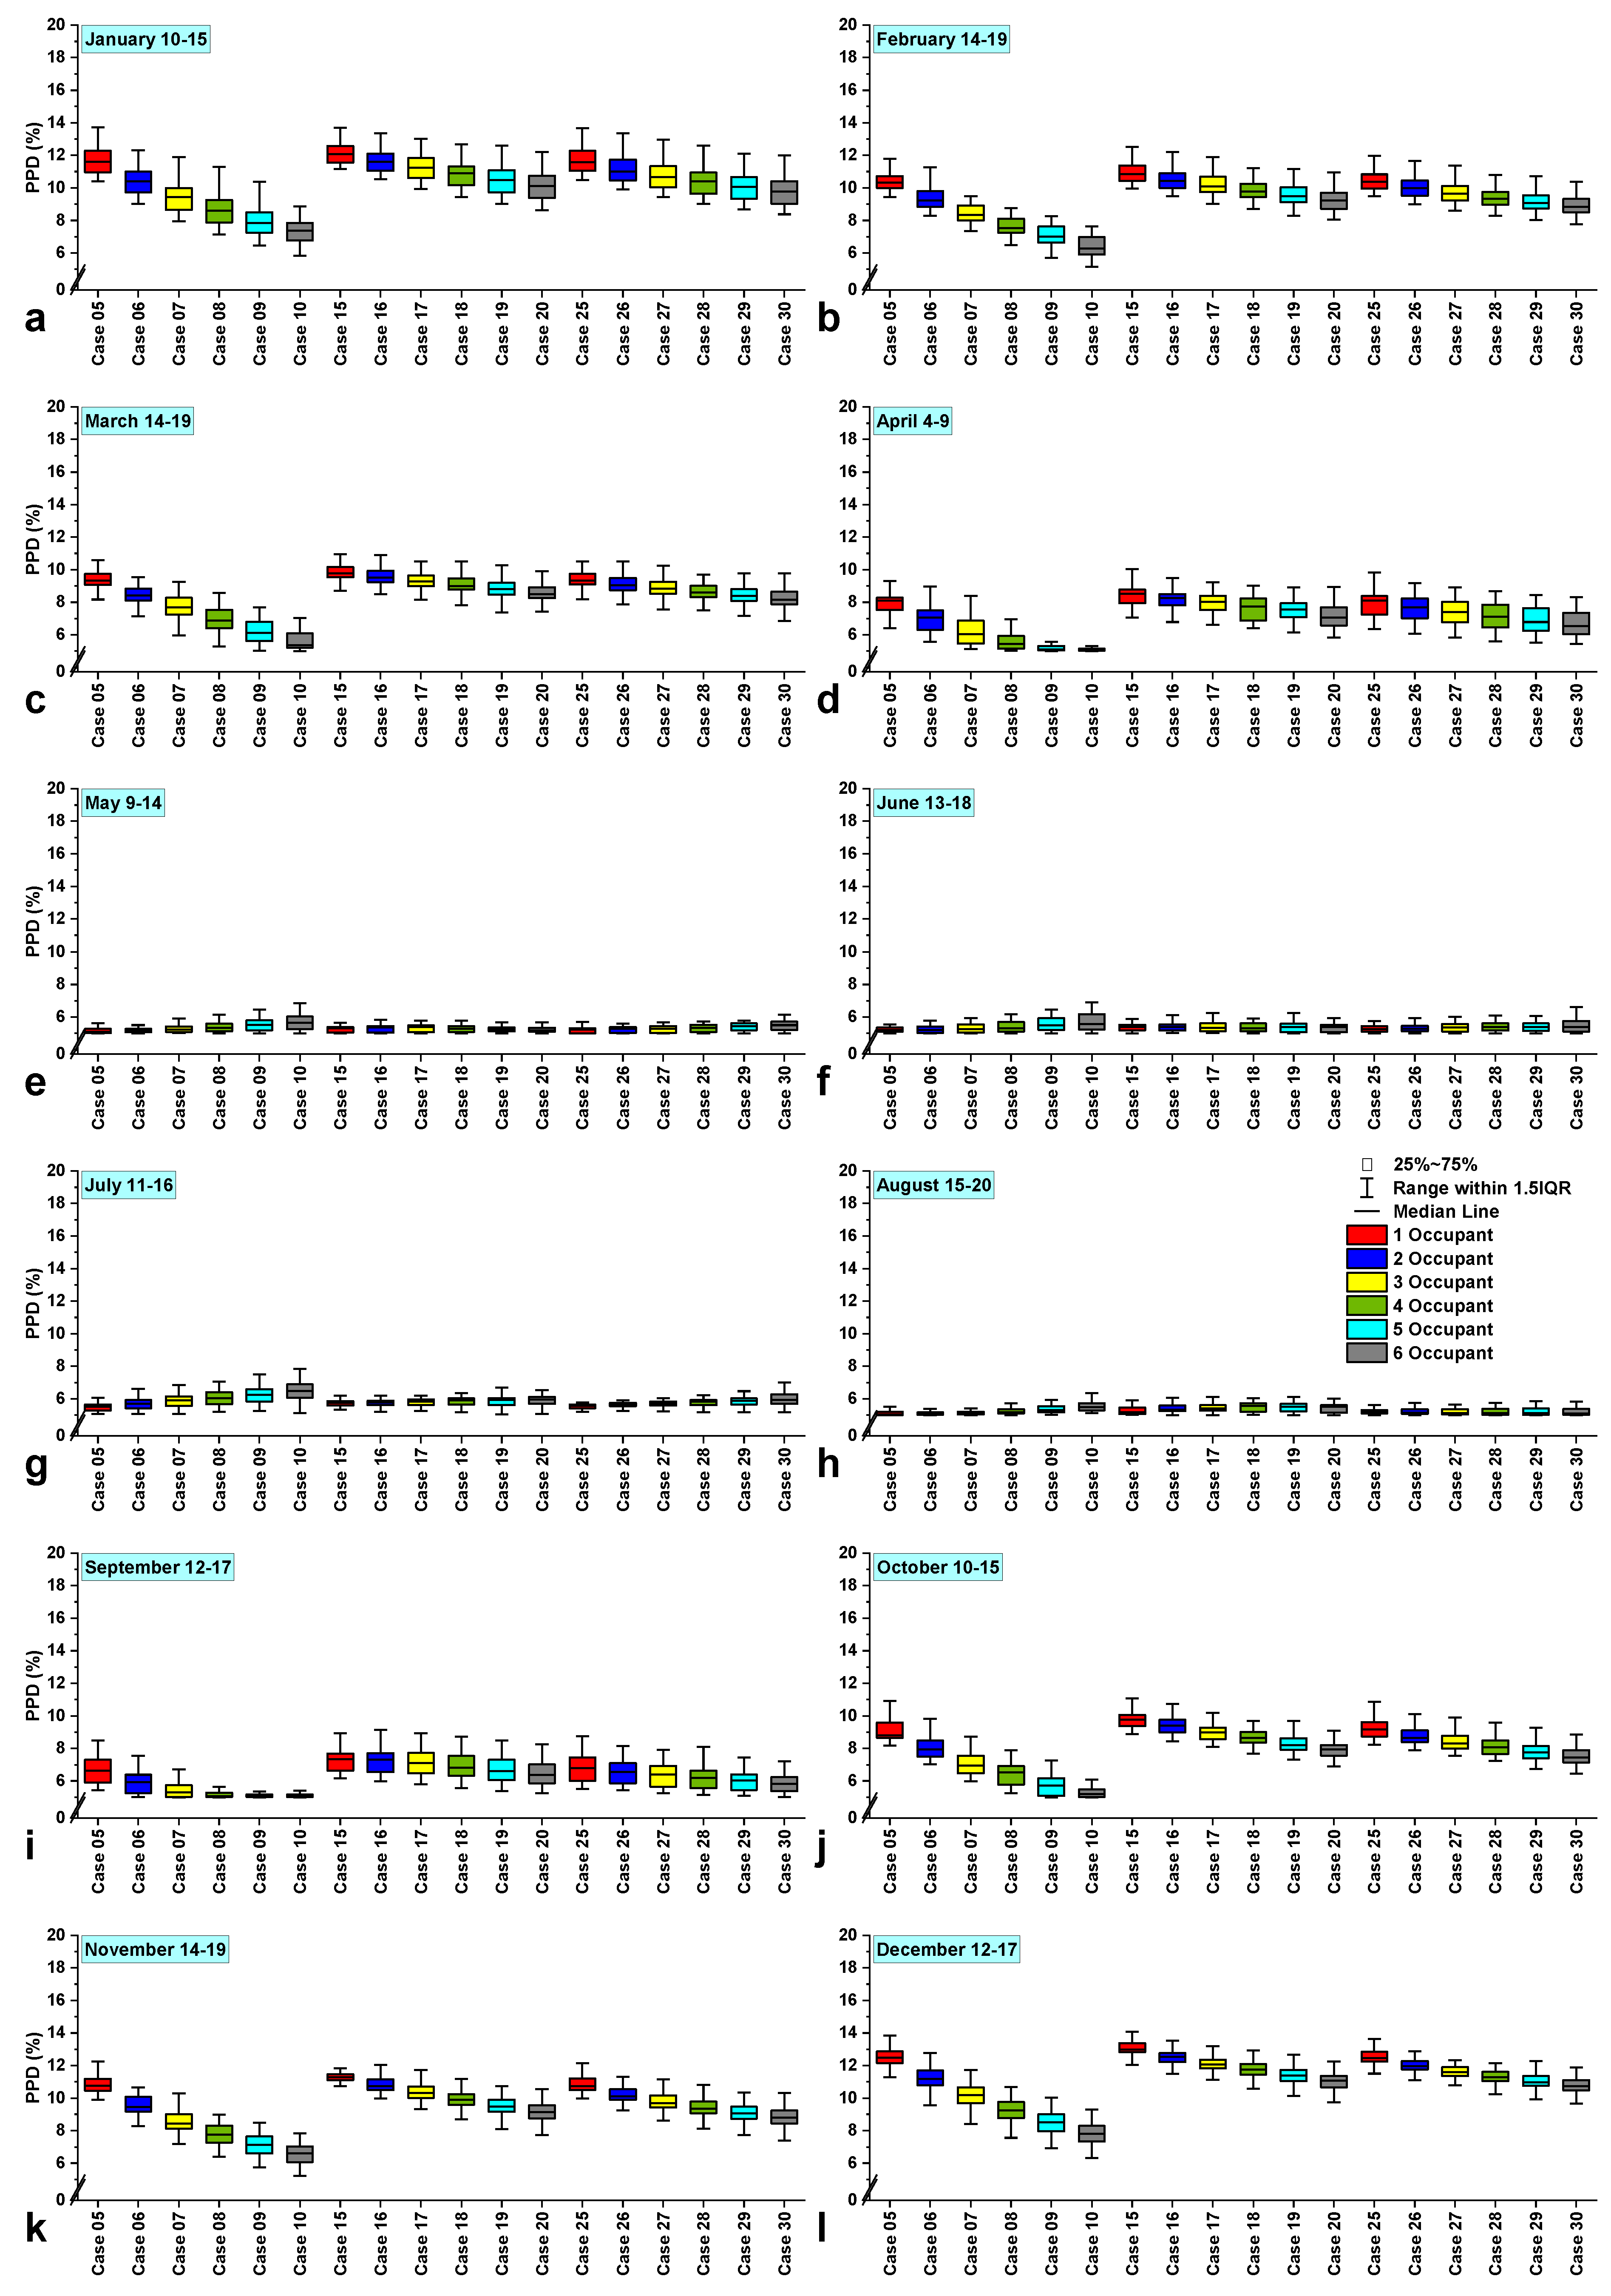
| PPD | predicted percentage dissatisfied (%) |
| VAV | variable air volume |
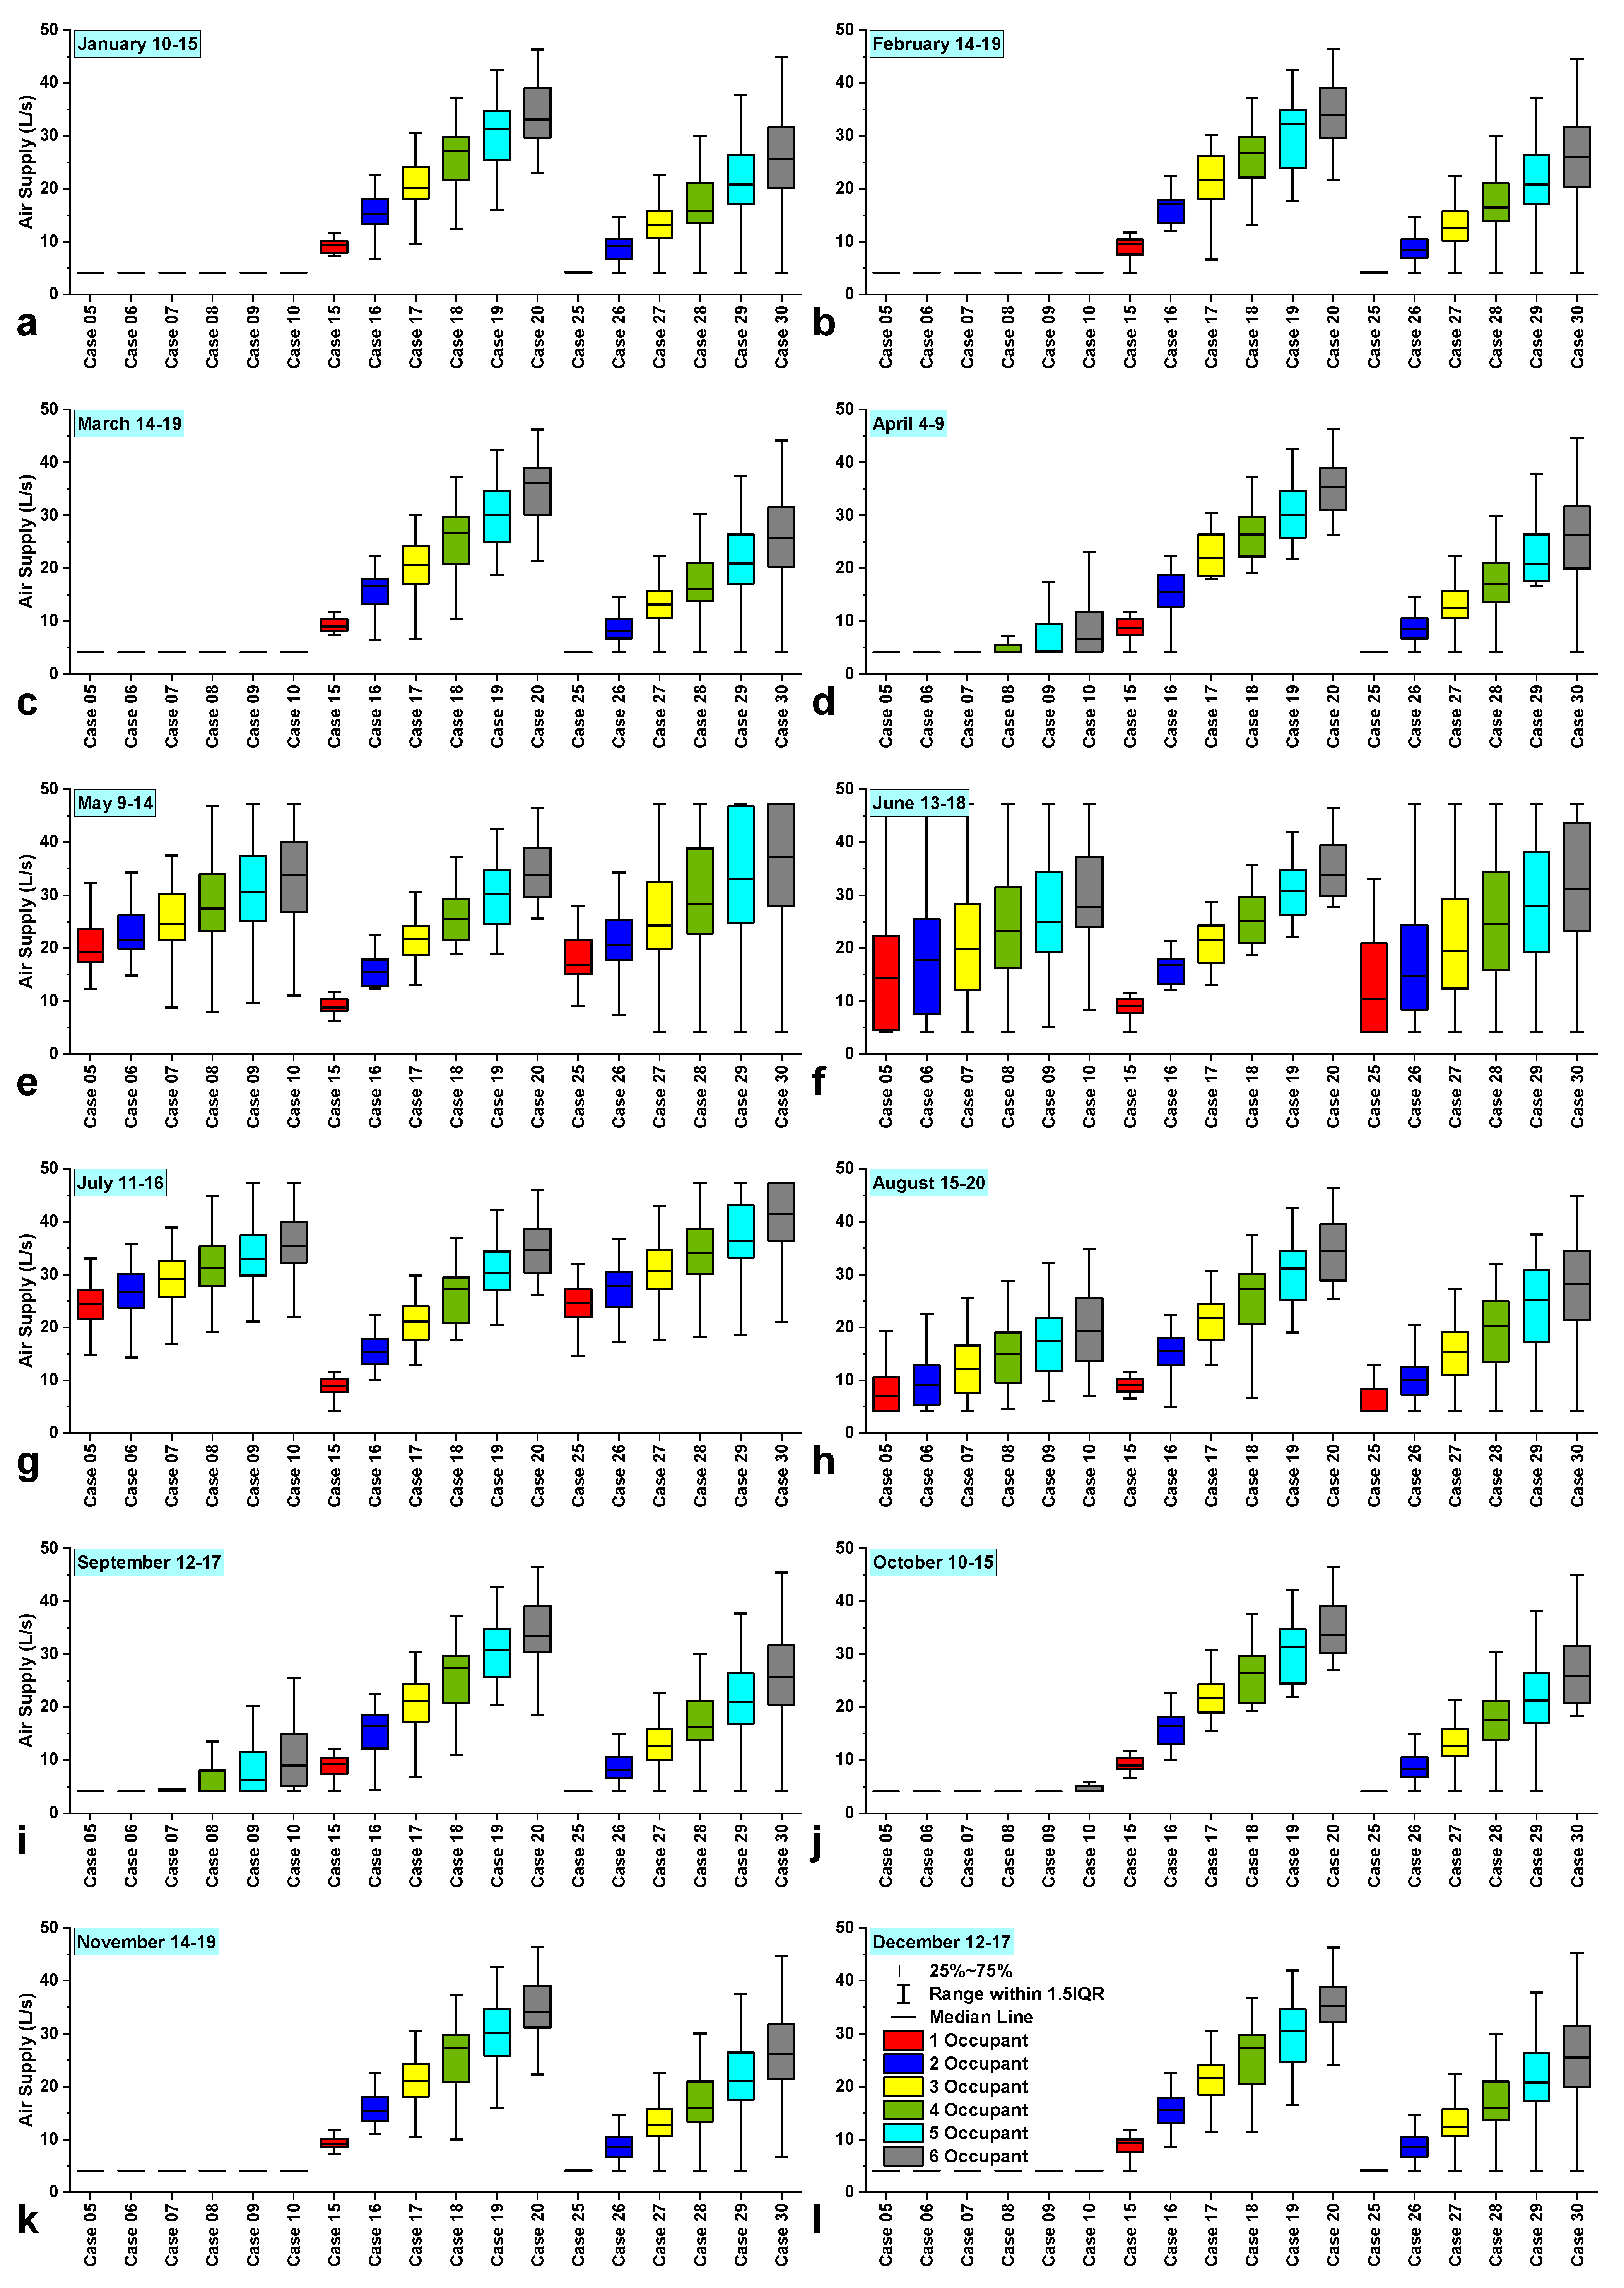
| VFR | ventilation flow rate [L∙s−1] |
References
- Bueno, A.M.; de Paula Xavier, A.A.; Broday, E.E. Evaluating the Connection between Thermal Comfort and Productivity in Buildings: A Systematic Literature Review. Buildings 2021, 11, 244. [Google Scholar] [CrossRef]
- ASHRAE. Standard 62.1-2013; Ventilation for Acceptable Indoor Air Quality. American Society of Heating, Refrigerating and Air-Conditioning Engineers, Inc.: Atlanta, GA, USA, 2013.
- Kierat, W.; Ai, Z.; Melikov, A.; Markov, D.; Bivolarova, M. Towards Enabling Accurate Measurements of CO2 Exposure Indoors. Build. Environ. 2022, 213, 108883. [Google Scholar] [CrossRef]
- Shrestha, M.; Rijal, H.B.; Kayo, G.; Shukuya, M. An Investigation on CO2 Concentration Based on Field Survey and Simulation in Naturally Ventilated Nepalese School Buildings during Summer. Build. Environ. 2022, 207, 108405. [Google Scholar] [CrossRef]
- Yang, S.; Mahecha, S.D.; Moreno, S.A.; Licina, D. Integration of Indoor Air Quality Prediction into Healthy Building Design. Sustainability 2022, 14, 7890. [Google Scholar] [CrossRef]
- Stabile, L.; Buonanno, G.; Frattolillo, A.; Dell’Isola, M. The Effect of the Ventilation Retrofit in a School on CO2, Airborne Particles, and Energy Consumptions. Build. Environ. 2019, 156, 1–11. [Google Scholar] [CrossRef]
- Saini, J.; Dutta, M.; Marques, G. Indoor Air Quality Monitoring Systems Based on Internet of Things: A Systematic Review. Int. J. Environ. Res. Public Health 2020, 17, 4942. [Google Scholar] [CrossRef]
- Ameen, A.; Mattsson, M.; Boström, H.; Lindelöw, H. Assessment of Thermal Comfort and Air Quality in Office Rooms of a Historic Building: A Case Study in Springtime in Continental Climate. Buildings 2023, 13, 156. [Google Scholar] [CrossRef]
- Asif, A.; Zeeshan, M. Indoor Temperature, Relative Humidity and CO2 Monitoring and Air Exchange Rates Simulation Utilizing System Dynamics Tools for Naturally Ventilated Classrooms. Build. Environ. 2020, 180, 106980. [Google Scholar] [CrossRef]
- The Swedish Work Environment Authority. The Swedish Work Environment Authority’s Statute Book—AFS 2020:1; The Swedish Work Environment Authority: Solna, Sweden, 2020.
- Crosby, S.; Rysanek, A. Predicting Thermal Satisfaction as a Function of Indoor CO2 Levels: Bayesian Modelling of New Field Data. Build. Environ. 2022, 209, 108569. [Google Scholar] [CrossRef]
- ISO. ISO 7730:2005; Ergonomics of the Thermal Environment: Analytical Determination and Interpretation of Thermal Comfort Using Calculation of the PMV and PPD Indices and Local Thermal Comfort Criteria. ISO: Geneva, Switzerland, 2005.
- American Society of Heating and Refrigerating and Air-Conditioning Engineers. ANSI/ASHRAE Standard 55-2020; Thermal Environmental Conditions for Human Occupancy. ASHRAE Peachtree Corners: Peachtree Corners, GA, USA, 2021.
- Ole Fanger, P. Thermal Comfort: Analysis and Applications in Environmental Engineering; Danish Technical Press: Copenhagen, Denmark, 1970; p. 244. [Google Scholar]
- Djongyang, N.; Tchinda, R.; Njomo, D. Thermal Comfort: A Review Paper. Renew. Sustain. Energy Rev. 2010, 14, 2626–2640. [Google Scholar] [CrossRef]
- Sarbu, I.; Pacurar, C. Experimental and Numerical Research to Assess Indoor Environment Quality and Schoolwork Performance in University Classrooms. Build. Environ. 2015, 93, 141–154. [Google Scholar] [CrossRef]
- Balbis-Morejón, M.; Rey-Hernández, J.M.; Amaris-Castilla, C.; Velasco-Gómez, E.; San José-Alonso, J.F.; Rey-Martínez, F.J. Experimental Study and Analysis of Thermal Comfort in a University Campus Building in Tropical Climate. Sustainability 2020, 12, 8886. [Google Scholar] [CrossRef]
- Predescu, L.; Dunea, D. Performance Evaluation of Particulate Matter and Indoor Microclimate Monitors in University Classrooms under COVID-19 Restrictions. Int. J. Environ. Res. Public Health 2021, 18, 7363. [Google Scholar] [CrossRef] [PubMed]
- Alonso, A.; Llanos, J.; Escandón, R.; Sendra, J.J. Effects of the COVID-19 Pandemic on Indoor Air Quality and Thermal Comfort of Primary Schools in Winter in a Mediterranean Climate. Sustainability 2021, 13, 2699. [Google Scholar] [CrossRef]
- Rismanchi, B.; Zambrano, J.M.; Saxby, B.; Tuck, R.; Stenning, M. Control Strategies in Multi-Zone Air Conditioning Systems. Energies 2019, 12, 347. [Google Scholar] [CrossRef]
- Taheri, S.; Razban, A. Learning-Based CO2 Concentration Prediction: Application to Indoor Air Quality Control Using Demand-Controlled Ventilation. Build. Environ. 2021, 205, 108164. [Google Scholar] [CrossRef]
- Bicer, A.; Kar, F. Thermal and Mechanical Properties of Gypsum Plaster Mixed with Expanded Polystyrene and Tragacanth. Therm. Sci. Eng. Prog. 2017, 1, 59–65. [Google Scholar] [CrossRef]
- CL11—Indoor Air Quality Data Logger (CO2, Humidity, Temperature). Available online: https://www.rotronic.com/en/cl11 (accessed on 10 April 2022).
- Zhao, Q.; Lian, Z.; Lai, D. Thermal Comfort Models and Their Developments: A Review. Energy Built Environ. 2021, 2, 21–33. [Google Scholar] [CrossRef]
- Sahlin, P.; Eriksson, L.; Grozman, P.; Johnsson, H.; Shapovalov, A.; Vuolle, M. Whole-Building Simulation with Symbolic DAE Equations and General Purpose Solvers. Build. Environ. 2004, 39, 949–958. [Google Scholar] [CrossRef]
- Equa Simulation AB; Equa Simulation Finland Oy. Validation of IDA Indoor Climate and Energy 4.0 with Respect to CEN Standards EN 15255-2007 and EN 15265-2007; Equa Simulation AB: Solna, Sweden; Equa Simulation Finland Oy: Espoo, Finland, 2010. [Google Scholar]
- ANSI/ASHRAE Guideline 14-2002; Measurement of Energy and Demand Savings. American Society of Heating, Ventilating, and Air Conditioning Engineers: Atlanta, GA, USA, 2002.
- Woloszyn, M.; Rode, C. Tools for Performance Simulation of Heat, Air and Moisture Conditions of Whole Buildings. Build. Simul. 2008, 1, 5–24. [Google Scholar] [CrossRef]
- Ameen, A.; Bahrami, A.; El Tayara, K. Energy Performance Evaluation of Historical Building. Buildings 2022, 12, 1667. [Google Scholar] [CrossRef]
- Moghaddam, S.A.; Mattsson, M.; Ameen, A.; Akander, J.; Gameiro Da Silva, M.; Simões, N. Low-Emissivity Window Films as an Energy Retrofit Option for a Historical Stone Building in Cold Climate. Energies 2021, 14, 7584. [Google Scholar] [CrossRef]
- Kabanshi, A.; Ameen, A.; Hayati, A.; Yang, B. Cooling Energy Simulation and Analysis of an Intermittent Ventilation Strategy under Different Climates. Energy 2018, 156, 84–94. [Google Scholar] [CrossRef]


| Calibration Criteria (%) | Index | ASHRAE Guideline 14-2002 |
|---|---|---|
| Hourly criteria | NMBE CV (RMSE) | ±10% 30% |
| Uncertainty Indices | Air Temperature in Room 23:425 | Air Temperature in Room 23:425 |
|---|---|---|
| NMBE (%) CV (RMSE) (%) | 0.4% 1.8% | 0.5% 1.9% |
| Structural Component | U-Value (W/(m2·K)) |
|---|---|
| External wall | 0.221 |
| Side walls | 0.174 |
| Internal floor | 0.793 |
| Internal wall | 5.90 |
| Roof | 0.071 |
| Heated floor area for room 23:425 | 8.43 m2 |
| Room 23:425 volume | 31.61 m3 |
| Window-to-Wall Ratio for room 23:425 | 30.3% |
| Heated floor area for room 23:429 | 11.85 m2 |
| Room 23:429 volume | 44.51 m3 |
| Window-to-Wall Ratio for room 23:429 | 28.6% |
| Type | U-Value (W/(m2·K)) | g-Value | Transmitted Visible Light |
|---|---|---|---|
| Double-Pane Window | 2.30 | 0.76 | 0.81 |
| Parameter | Value | Unit | |
|---|---|---|---|
| Minimum | Maximum | ||
| Control Setpoint | |||
| Temperature | 22 | 25 | °C |
| Relative Humidity | 20 | 80 | % |
| CO2 Concentration | 600 | 1000 | ppm |
| Control Setpoint Room 23:425 | |||
| Mech. Supply Air Flow | 0.35 * | 3.77 * | L/(s·m2) |
| Mech. Return Air Flow | 0.35 * | 3.77 * | L/(s·m2) |
| Control Setpoint Room 23:429 | |||
| Mech. Supply Air Flow | 0.35 * | 3.99 * | L/(s·m2) |
| Mech. Return Air Flow | 0.35 * | 3.99 * | L/(s·m2) |
| Case | Room | Occupant | Ventilation Control |
|---|---|---|---|
| 1 | 23:425 | 1 | Temperature |
| 2 | 23:425 | 2 | Temperature |
| 3 | 23:425 | 3 | Temperature |
| 4 | 23:425 | 4 | Temperature |
| 5 | 23:429 | 1 | Temperature |
| 6 | 23:429 | 2 | Temperature |
| 7 | 23:429 | 3 | Temperature |
| 8 | 23:429 | 4 | Temperature |
| 9 | 23:429 | 5 | Temperature |
| 10 | 23:429 | 6 | Temperature |
| 11 | 23:425 | 1 | CO2 |
| 12 | 23:425 | 2 | CO2 |
| 13 | 23:425 | 3 | CO2 |
| 14 | 23:425 | 4 | CO2 |
| 15 | 23:429 | 1 | CO2 |
| 16 | 23:429 | 2 | CO2 |
| 17 | 23:429 | 3 | CO2 |
| 18 | 23:429 | 4 | CO2 |
| 19 | 23:429 | 5 | CO2 |
| 20 | 23:429 | 6 | CO2 |
| 21 | 23:425 | 1 | Temperature + CO2 |
| 22 | 23:425 | 2 | Temperature + CO2 |
| 23 | 23:425 | 3 | Temperature + CO2 |
| 24 | 23:425 | 4 | Temperature + CO2 |
| 25 | 23:429 | 1 | Temperature + CO2 |
| 26 | 23:429 | 2 | Temperature + CO2 |
| 27 | 23:429 | 3 | Temperature + CO2 |
| 28 | 23:429 | 4 | Temperature + CO2 |
| 29 | 23:429 | 5 | Temperature + CO2 |
| 30 | 23:429 | 6 | Temperature + CO2 |
| Date | Day & Time |
|---|---|
| 10–15 January | Monday–Friday 9–16, Saturday 10–14 |
| 14–19 February | Monday–Friday 9–16, Saturday 10–14 |
| 14–19 March | Monday–Friday 9–16, Saturday 10–14 |
| 4–9 April | Monday–Friday 9–16, Saturday 10–14 |
| 9–14 May | Monday–Friday 9–16, Saturday 10–14 |
| 13–18 June | Monday–Friday 9–16, Saturday 10–14 |
| 11–16 July | Monday–Friday 9–16, Saturday 10–14 |
| 15–20 August | Monday–Friday 9–16, Saturday 10–14 |
| 12–17 September | Monday–Friday 9–16, Saturday 10–14 |
| 10–15 October | Monday–Friday 9–16, Saturday 10–14 |
| 14–19 November | Monday–Friday 9–16, Saturday 10–14 |
| 12–17 December | Monday–Friday 9–16, Saturday 10–14 |
Disclaimer/Publisher’s Note: The statements, opinions and data contained in all publications are solely those of the individual author(s) and contributor(s) and not of MDPI and/or the editor(s). MDPI and/or the editor(s) disclaim responsibility for any injury to people or property resulting from any ideas, methods, instructions or products referred to in the content. |
© 2023 by the authors. Licensee MDPI, Basel, Switzerland. This article is an open access article distributed under the terms and conditions of the Creative Commons Attribution (CC BY) license (https://creativecommons.org/licenses/by/4.0/).
Share and Cite
Ameen, A.; Bahrami, A.; Elosua Ansa, I. Assessment of Thermal Comfort and Indoor Air Quality in Library Group Study Rooms. Buildings 2023, 13, 1145. https://doi.org/10.3390/buildings13051145
Ameen A, Bahrami A, Elosua Ansa I. Assessment of Thermal Comfort and Indoor Air Quality in Library Group Study Rooms. Buildings. 2023; 13(5):1145. https://doi.org/10.3390/buildings13051145
Chicago/Turabian StyleAmeen, Arman, Alireza Bahrami, and Ibai Elosua Ansa. 2023. "Assessment of Thermal Comfort and Indoor Air Quality in Library Group Study Rooms" Buildings 13, no. 5: 1145. https://doi.org/10.3390/buildings13051145