Article

A Monte Carlo-Based Approach to Assess the Reinforcement Depassivation Probability of RC Structures: Simulation and Analysis

by
Emerson Felipe Félix
1,*,
Isabela da Silva Falcão
1,
Larissa Gabriela dos Santos
1,
Rogério Carrazedo
2 and
Edna Possan
3
1
Department of Civil Engineering, Faculty of Engineering and Sciences, São Paulo State University, Guaratinguetá 12516-410, Brazil
2
Department of Structural Engineering, São Carlos School of Engineering, University of São Paulo, São Carlos 13566-590, Brazil
3
Latin American Institute of Technology, Infrastructure and Territory, Federal University of Latin American Integration, Foz do Iguaçu 85866-000, Brazil
*
Author to whom correspondence should be addressed.
Buildings 2023, 13(4), 993; https://doi.org/10.3390/buildings13040993
Submission received: 10 March 2023 / Revised: 30 March 2023 / Accepted: 7 April 2023 / Published: 9 April 2023
(This article belongs to the Special Issue Strength and Performance of Building Materials)

Abstract

:
In this work, an approach is presented to assess the reinforcement depassivation probability of reinforced concrete structures under corrosion induced by carbonation or chloride diffusion. The model consists of coupling mathematical formulations of CO2 and Cl diffusion with Monte Carlo simulation (MCS). Random events were generated using MCS to create several design life and environmental scenarios. A case study was performed by simulating five Brazilian environmental conditions and distinct mixes of concrete. The effect of input parameters on the reinforcement concrete depassivation probability was evaluated. The results point out that the depassivation probability due to carbonation is more significant in urban centers, and the compressive strength of concrete has the main influence on the depassivation probability. Results also showed that the depassivation probability due to chloride ingress is influenced by, in order of importance, the chloride content on the surface (61.4%), concrete cover (20.3%), compressive strength (7.1%), relative humidity (6.1%), and temperature (5.1%). In addition, an increase in the compressive strength of concrete, from 30 to 50 MPa, can reduce depassivation probability by up to 70%, resulting in a concrete structure that attends the durability limit state. Thus, by incorporating probabilistic approaches, this model can be a valuable tool in the civil construction industry for studying the improvement of durability, reliability, and safety of reinforced concrete structures.

1. Introduction

Managing the durability of civil infrastructure involves high costs. With limited public resources, it requires establishing priorities for maintenance, rehabilitation, and replacement. Thus, a holistic design approach based on lifespan is required [1].
One of the main causes of lifespan reduction in reinforced concrete structures is reinforcement corrosion [2]. According to the World Corrosion Organization, the costs involved with reinforced concrete (RC) corrosion are higher than 3% of the Gross Domestic Product (GDP) in several countries. Corrosion in reinforced concrete structures stands out among other deteriorating mechanisms, with occurrence rates up to 48% in South Africa, 25% in the United Kingdom, 36% in India, and 31% in the United States [3]. For instance, in Brazil, corrosion has an occurrence rate that varies from 14 to 64%, depending on the region [4,5,6].
The corrosion of RC rebars is an electrochemical process due to differences in the concentrations of dissolved ions, in which a region becomes cathodic and another anodic, resulting in material losses, steel rust, and consequently, reduction of its mechanical capacity [7]. The formation of rust generates internal stresses in the steel–concrete interface, leading to cracks towards the concrete surface [3,7,8,9,10,11,12].
According to Helene [13] and Tuutti [14], corrosion is generally associated with concrete carbonation (diffusion of CO2) or diffusion of chlorides present in the atmosphere. Regardless of the corrosive process, it can be divided into two stages, initiation and propagation. The transition is characterized by the depassivation of steel, in which the depth of diffusion of the aggressive agent (yd) is equal to the concrete cover (Cnom). The stages of corrosion are exemplified in Figure 1, where: Figure 1a represents the period in which the carbonation depth is smaller than the concrete cover thickness; Figure 1b shows when the steel is depassivated, i.e., the carbonation front reaches the reinforcement layer; finally, Figure 1c shows the propagation period, with the formation of rust and cracks, causing loss of mechanical. Chloride corrosion can be described analogously except by the corrosion agent and how it would progress.
The propagation period is generally characterized by the corrosion rate and the quality of the concrete that withstands internal stresses due to the formation of rust, also known as ferric oxide [14,15].
Due to the magnitude of the tensile stresses generated by corrosion rust, macro fissures develop, further enhancing entry of aggressive agents, increasing concrete degradation, and, consequently, reducing its lifespan [11,15,16].
Concerning the corrosion modeling, most researchers are focused on the corrosion initiation stage, associated with the design life, developing models to estimate the diffusion depth or the time for rebar depassivation considering diffusion of either dioxide carbon [6,17,18,19,20,21,22,23] or chlorides [24,25,26,27,28,29,30,31,32,33].
A natural drawback to assess the corrosion front is the influence of the material properties and the exposure environment in the diffusion process. There are several uncertainties in these parameters, as well as in the parameters of any mathematical model that simulate the deteriorating mechanism, subduing a deterministic analysis of the problem [5,20].
Ramezanianpour et al. [34] noticed that purely deterministic approaches are not able to properly assess the lifespan of corroded concrete structures, and that considering the randomness of the different parameters involved is required to analyze the problem.
With the advances in computing and the advent of the theory of reliability applied to the analysis of structures, modeling of structural phenomena considering uncertainties has become attractive because it allows the treatment of these uncertainties in a more consistent theoretical way through statistical associations [35]. Probabilistic analysis via reliability theory offers an alternative and efficient methodology to assess the performance and safety of structures [36,37].
Currently, there are different methods to assess performance and reliability of concrete structures [26,27,37,38,39,40]. The Monte Carlo simulation is a powerful method for this kind of analysis since it considers both uncertainties and random parameters [41,42]. It is a non-deterministic statistical numerical method for simulating random variables.
The Monte Carlo simulation uses a sampling technique for random variables to build a set of values that may be used to describe the failure and safety domain, classified as a robust statistical procedure of analysis by sampling [41,43]. Thus, coupling the diffusion laws with reliability algorithms results in a more consistent, comprehensive, and reliable approach than deterministic processes, as shown in the recent works that deal with the lifespan of reinforced concrete structures under corrosion [26,35,39,41,44,45].
The use of Monte Carlo simulation has become increasingly popular in predicting the corrosion probability of reinforced concrete structures. Shim [46] used Monte Carlo simulation to predict the expected onset of corrosion and the required concrete cover for RC structures to ensure 100 years of service life. Representative values and variability of parameters used in the analysis are provided. The results show that the probability distribution is most sensitive to the chloride content in the surface.
Liberati et al. [35] used a probabilistic approach to analyze the durability of a beam designed according to the Brazilian structural design codes NBR 6118 [47]. Corrosion initiation was determined by Fick’s diffusion law, whereas Faraday’s corrosion laws are adopted to model the loss of metal. The probability of structural failure was determined using Monte Carlo simulation. The results indicated that the design procedures presented in [47] lead to probabilities of structural failure with the safety values recommended by [48], which range from 10−3 to 10−4.
The effect of different mixture parameters (percentage of metakaolin, binder content, and water-to-binder ratio) on the corrosion probability was studied by Al-Alaily et al. [41], using a new model for computing the chloride-induced corrosion period based on combining Monte Carlo simulation and statistical analysis methods. The results pointed out that the probability of corrosion decreased as the percentage of metakaolin increased. Additionally, using a lower water-to-binder ratio or higher binder content in metakaolin mixtures improved the effectiveness of metakaolin to reduce the probability of corrosion.
Aslani and Dehestani [39] conducted a reliability analysis on the performance of concrete structures under corrosion. Monte Carlo simulation was used to predict corrosion initiation and residual lifetime associated with crack propagation until failure. They concluded that the stochastic gamma process is appropriate to evaluate the probability of failure associated with the limit state of load-bearing capacity. They also concluded that Monte Carlo simulation is appropriate to evaluate the probability of failure associated with the limit state of serviceability.
Lizarazo-Marriaga et al. [44] proposed a probabilistic method based on Monte Carlo’s to estimate the corrosion initiation in fly ash concrete. The chloride diffusion coefficient, concrete porosity, and external chloride concentrations were used as stochastic parameters. Results demonstrated that a probabilistic approach to evaluate corrosion initiation is feasible.
Pellizzer and Leonel [49] proposed a diffusion-probabilistic framework for accurate modeling chloride’s diffusion on concrete. Their model handles the corrosion time initiation considering the inherent problem randomness. The randomness was quantified by Monte Carlo simulation. The results pointed out the importance of appropriately designing the depth of concrete cover to improve its durability.
Different scenarios considering the corrosion initiation and the influence of the chloride diffusion coefficient for different loadings were proposed and analyzed by [26]. The authors carried out stochastic analyses to determine the probability of failure of steel bars, and to evaluate the influences of internal and external factors. Results show that stochastic approaches plus advanced solutions allow, in a more complete way, the sustainability decision-making process during the design phase, maintenance, inspections, and repair.
Ghanooni-Bagha et al. [50] analyzed, using Monte Carlo simulation, the effect of the water–cement ratio on the corrosion initiation probability associated with the carbonation phenomenon. Results pointed out that for a fixed water–cement ratio, the use of greater cement content in mix designs improves the material’s durability. They also indicated that the corrosion initiation probability can contribute to the adjustment of mix designs necessary to achieve greater lifespan in RC structures.
Recently, Monteiro and Gonçalves [51] proposed a probabilistic methodology to verify the limit state of depassivation, based on Monte Carlo simulation, which can be applied to RC structures subjected to corrosion induced by chlorides diffusion. The results indicated that the chloride threshold content has major influence on the depassivation probability and needs to be carefully taken into account in assessment of concrete. In addition, it was observed that the use of the lognormal distribution is recommended for describing the concrete cover depth to avoid unrealistic negative values of depassivation probabilities.
As noted above, use of Monte Carlo simulation to assess the corrosion initiation has been previously studied. Although there has been some progress in the modeling of reinforced concrete corrosion and its initiation, the probabilistic method shows a high level of complexity and requires use of parameters that are difficult to obtain, such as the chloride threshold, making it unfeasible to use as a support tool in the design of RC structures.
Developing a model for service life poses a significant challenge due to factors such as material characteristics, climatic conditions, and construction methods that can affect service life prediction. Thus, in this work, a probabilistic approach is presented to map the diffusion of Cl and CO2 into concrete with Monte Carlo simulation, generating a simple yet efficient model to estimate the reinforcement depassivation probability of RC structures. This research provides a simplified method, in which designers and engineers can easily incorporate durability concepts into their designs, leading to structures that are able to withstand corrosion and maintain their structural integrity over time.
To show its applicability, a case study is presented with five Brazilian environment conditions and concretes made with distinct mixes. The effect of input parameters on the reinforcement depassivation probability of a RC structure was analyzed and interpreted using numerical simulations.

2. Modeling

The proposed approach to estimate the probability of reinforcement depassivation due to CO2 or ion chloride diffusion is shown in Figure 2. The first step consists in collecting data and defining the characteristics of the structure, such as boundary conditions, reinforcement rate and its covering, the exposure conditions of the surrounding environment, and the characteristics of the constituent materials.
In the second stage, it is defined the aggressive agent to which the concrete is exposed. Ingress of CO2 is indicated for urban environments far from the coast, and ingress of Cl for structures located in coastal regions and close to the sea. The combined effect of the two aggressive agents is not addressed in this work and can be seen in Felix et al. [22] and Zhu et al. [52].
In the third step of the process, the database of samples for probabilistic analyses is created. Samples are created using the importance sampling technique [53]. These samples are created for the main parameters involved in the corrosion phenomenon: concrete compressive strength, reinforcement cover, temperature, relative air humidity, condition of exposure to rain, and levels of CO2 or Cl present in the atmosphere.
Finally, the fourth and last step is to stablish the depassivation probability, which is the probability of corrosion initiation, where analytical formulations are used to represent the diffusion of aggressive agents. Simulations were conducted using the Monte Carlo simulation. The formulations used to map the diffusion of CO2 and chlorides, and the coupling of these models with Monte Carlo simulation, are defined next.

2.1. Models for Mapping the CO2 or Cl Diffusion in Concrete

When concrete structures are located in coastal regions, corrosion of the reinforcement is predominantly a function of Cl concentration. On the other hand, in structures located in urban regions and far from the coast, corrosion occurs mainly due to CO2 diffusion [54]. Nevertheless, Taffese and Sistonen [55] reported that a structure located in an urban region may not trigger corrosion by carbonation. The authors reported that it is necessary to assess which aggressive agents (CO2 or Cl) are in greater proportion in the environment around the structure and thus considered responsible for the corrosion initiation.
Knowing this, several models have been developed over time. Until the mid-1980s, CO2 or Cl diffusion models were obtained utilizing regression techniques, considering different factors, such as water/cement ratio (w/c), type of cement, and compressive strength of concrete [56].
Afterwards, some researchers inserted some aspects related to the exposure environment and the material’s resistance to the diffusion of aggressive agents [19,31,33,57,58]. It was possible to determine the diffusion front with greater accuracy, as in the models developed by Andrade et al. [59] for Cl, and by Possan et al. [20] for carbonation.
To determine the carbonation depth of concrete, it is used in this work the formulation proposed by Possan et al. [20] and presented in Equation (1). This model was chosen because it presents easy-to-collect input parameters and has been validated using 298 data of natural carbonation available in the several references, representing 87% of tested data. In the validation analysis, the authors verified that the model determination coefficient is 0.986, and the root-mean-square error is 0.3 mm. Some parameters are obtained according to the concrete properties and the environment conditions. Other parameters regarding Possan’s Model are indicated in Table 1 and Table 2.
y = k c · 20 f c k f c · t 20 1 2 · exp k a d · a d 3 2 40 + f c + k c o 2 · C O 2 60 + f c k R H ( R H 0.68 ) 2 100 + f c · k c e
where y is the average carbonation depth of the concrete (in mm), fc is the compressive strength of the concrete (in MPa), kc is related to the type of cement used (Table 1), kfc is related to the axial compression strength of the concrete, depending on the type of cement used (Table 1), t is the age of the concrete (in years), ad is the admixture content (in % to the cement mass), kad is related to additions depending on the type of cement used (Table 1), RH is the average relative humidity (in %*0.01), KRH is related to relative humidity, depending on the type of cement used (Table 1), CO2 is the CO2 content in atmosphere (in %), kco2 is related to the CO2 content of the environment, depending on the type of cement used (Table 1), kce is related to exposure to rain, depending on the exposure conditions of the structure (Table 2).
To determine the chloride penetration depth, it is used the analytical formulation developed by Andrade et al. [59], presented in Equation (2). The model was chosen because it uses easily collectable input parameters, and it was validated using a 22-year-old structure located in the Brazilian coastal region. The results showed that the proposed model provided chloride penetration values that were similar to those determined by inspections of the structure, with a mean-square error of 2.2 mm. The formulation was obtained considering that the chloride diffusion is proportional to temperature, relative humidity, and external chloride concentration, and it is inversely proportional to the concrete compressive strength, the type of cement, and the type and mineral additions content. In the model construction, Andrade et al. [59] considered the chloride threshold equal to 0.4% of the cement weight.
y = 7.35 U R 0.7 · T 0.1 · C l 0.7 k 1 · f c k · k 2 1 + A d 0.2 · t
where y is the depth of critical chloride concentration (in mm), fck is the concrete compressive strength (in MPa), T is the room temperature (°C), k1 is a variable related to the type of cement (Table 3), t is the age of the concrete (years), Ad is the content of addition (in % to the cement mass), k2 is the variable related to the additions (Table 4), UR is the average relative humidity (%), Cl refers to the surface concentration of chlorides (%).
Some parameters are dependent on the cement type and the admixture type used in the concrete mix design, as shown in Table 3 and Table 4.
With both models, Equations (1) and (2), it is possible to estimate the depth of carbonation or the depth of chlorides diffusion in concrete produced with the different types of Portland cement. The standard Portland cement, CEM I, is commonly used for general purposes and is suitable for most concrete applications. Portland composite cement type, such as CEM II/A-L, CEM II/A-S, and CEM II/B-S, contain a mixture of clinker, limestone, and a pozzolanic material, and they have moderate to high sulfate resistance. Type CEM II/AV contains a mixture of clinker and pozzolanic material and has low heat of hydration. Type CEM III/A is a blast furnace slag cement, which contains a high percentage of ground granulated blast furnace slag, while pozzolanic cement, CEM IV/A, contains a high percentage of pozzolanic material and it is highly resistant to sulfate. Finally, CEM IV/B is also a pozzolanic cement with a high percentage of pozzolanic material.

2.2. Monte-Carlo Simulation

The Monte Carlo simulation is a numerical procedure to carry out random experiments on reliability problems [35,41,42]. In this method, samples of random variables are used to describe the failure probability [43], according to Equation (3).
P f = G 0 f x x 1 , x 2 , , x n d x 1 , d x 2 , , d x n
where Pf is the failure probability, fx(X) is the joint probability density function (joint PDF) of the variables X.
Samples are constructed based on the statistical distribution attributed to the random variable of the problem. As the method is based on the simulation of the limit state function, the larger the sample generated, the more accurate the description of the probability of failure or associated reliability [60].
Evaluation of the integral defined in Equation (3) is almost impossible, requiring alternative methods and procedures which are based on the concept of the reliability index β [60]. The reliability index is defined as the distance between the midpoint and the point of failure allocated on the limit state function, G(X) = 0, and it is related to the probability of failure through the cumulative standard normal distribution function ϕ, according to Equation (4).
P f = ϕ ( β )
The probability of failure is calculated using an estimator based on the evaluation of the limit state function, according to Equation (5). Estimator I(xi) is calculated using Equation (6), assuming values of 1 or 0, failure or not, respectively.
P f = G 0 f x x i d x i = G 0 I x i f x x i d x i = E I x i
I x i = 1 , G ( X ) 0 0 , G ( X ) > 0
The average value I(xi) will be an estimative for the probability of failure, so, according to Equation (7), the failure probability can be estimated for the entire sample database.
P f = E I x i = 1 N i = 1 N I x i
where N is the number of simulations, i.e., the number of evaluations of the limit state equation. In this work, samples were defined by the Importance Sample technique. To Jacquemart et al. [53], the Importance Sample is an interesting theoretical approach for estimating rare event probabilities on a continuous Markov process.
Once the method to estimate the probability of failure is defined, the final step is to specify the limit state equation. Two equations are used in this work, G1 and G2, referring to the probability of corrosion initiation due to concrete carbonation and due to chloride diffusion, respectively. Equations (8) and (9) show these two limit states.
G 1 X = X 3 k c · 20 X 1 k f c · t 20 1 2 · e k c o 2 · X 4 60 + X 1 k R U . ( 0.01 · X 2 0.68 ) 2 100 + X 1 k c e
G 2 X = X 3 7.35 X 2 0.7 · X 6 0.1 · X 5 0.7 k 1 · X 1 · k 2 1 + A d 0.2 t
where vector X is the vector of random variables, with X1 being the concrete compressive strength (MPa), X2 the relative humidity (%), X3 the concrete cover (mm), X4 the content of CO2 (%), X5 the concentration of chlorides (%), and X6 the temperature (°C).
According to Equations (8) and (9), failure occurs when Gi(X) ≤ 0, and it does not fail when Gi(X) > 0. Thus, the failure occurs when the diffusion depth of the aggressive agents is equal to or greater than the concrete cover. The remaining cases represent safe conditions—without corrosion.

3. Case Study

This work presents a probabilistic approach that maps the diffusion of Cl and CO2 into concrete with Monte Carlo simulation, generating a simple yet efficient model to estimate the reinforcement depassivation probability of RC structures. To demonstrate and test the approach’s applicability, a case study was carried out, where the reinforcement depassivation probability of concrete beams, with a generic geometry (Figure 3), was assessed. The structures were simulated considering the concrete produced with different types of Portland cement (Table 1) and located in five different Brazilian cities: Manaus (AM); Fortaleza (CE); Brasília (DF); São Paulo (SP); Florianópolis (SC). These cities were chosen because they represent different climatic aspects of each country’s regions (North, Northeast, Midwest, Southeast, and South) The purpose is to analyze the influence of exposure parameters on the reinforcement depassivation probability of RC structures, and to provide recommendations for concrete cover thickness by a reliable safe region based on concrete compressive strength and relative humidity. To simplify the simulation, beams were modeled considering the same exposure conditions on the four sides.
For the proposed probabilistic approach, it is necessary to describe the random variables of the problem and their distribution. Data were collected on relative humidity and temperature referring to the past 10 years, CO2 content in the atmosphere, chloride content on the surface, concrete compressive strength, and concrete cover thickness.
The climatic data related to temperature and humidity were collected for the five cities in the last decade. They were extracted from the meteorological database of the Brazilian National Institute of Meteorology [61]. Figure 4 and Figure 5 show the frequency distributions of the monthly average humidity and the monthly average temperature, respectively. Table 5 presents the results obtained for the mean, standard deviation, and the distribution function that best fitted the sample. For the analysis, the Normal, Lognormal, Logistics, Gamma, Weibull, and Normal with Johnson transformation distribution functions were tested to set the best fitting distribution function.
As seen in Figure 4 and Table 5, the temperature distribution frequency of Florianópolis presents a profile not represented by any of the basic distribution functions analyzed; thus, it was necessary to perform a Johnson transformation on the variable, as shown in the Equation (10). After the transformation, the variable could then be represented using the Normal distribution. The same process was done for the distributions related to the relative humidity in the cities of Brasília (Equation (11)), Fortaleza (Equation (12)), and Manaus (Equation (13)).
T t r a n s = 0.206242 + 0.649269 · L N T 14.2510 26.8126 T
U R t r a n s = 0.760113 + 0.865030 · L N U R 23.0873 84.0951 U R
U R t r a n s = 0.409589 + 1.01403 · L N U R 67.5460 91.4887 U R
U R t r a n s = 0.543247 + 0.876466 · L N U R 59.7484 88.8229 U R
where Ttrans refers to the transformed temperature variable, T is the average temperature (°C), UR is the average relative humidity (%), and URtrans is the humidity after Johnson’s transformation.
Due to a lack of data regarding the CO2 concentration and chloride content for the cities analyzed, the data of the country were used, presented by the CO2 Levels bureau [62] and Liberati et al. [35], respectively. The data represent the distribution of the Brazilian urban environment. The mean, deviation, and distribution functions used for these data are displayed in Table 6.
Altogether, 423 experimental data collected by Helene and Terzian [63] for compressive strength were used to characterize the variability of concretes produced in Brazil (see Table 6).
For the concrete cover, it was adopted the minimum value recommended for an environment with aggressiveness class II for concrete structures subject to CO2 (30 mm), and aggressiveness class III for structures subject to chlorides ingress (40 mm), according to the Brazilian design code for concrete NBR 6118 [47]. The definition of the distribution function and standard deviation, presented in Table 6, was done considering the data presented by Liberati et al. [35] and Enright and Frangopol [36].

4. Results

Results from the simulations, conducted with the case study, are described and discussed below. Durability state limit (DSL) analysis, regarding the reinforcement depassivation and the initiation of reinforcement degradation, was conducted considering a deterministic application of Equations (1) and (2), and the probabilistic approach.

4.1. Deterministic Analysis

Figure 6 shows the diffusion depths of CO2 and Cl into the concrete. The process of concrete carbonation was considered for all cities, while chloride diffusion was considered only for the cities located in coastal regions, Florianópolis and Fortaleza.
For the carbonation analysis, the exposure environments that generate the maximum and minimum carbonation depths in Equation (1) were the indoor-sheltered from rain (KCE = 1.3) and the outdoor-exposed to rain (KCE = 0.65), respectively. Simulations were conducted for beams with cross-sections of 22 × 40 cm (Figure 3), and concrete produced with Portland cement CEM III/A type, and with no content additions. To perform the simulations, the CO2 concentration and concrete compressive strength were defined with the mean values indicated in 
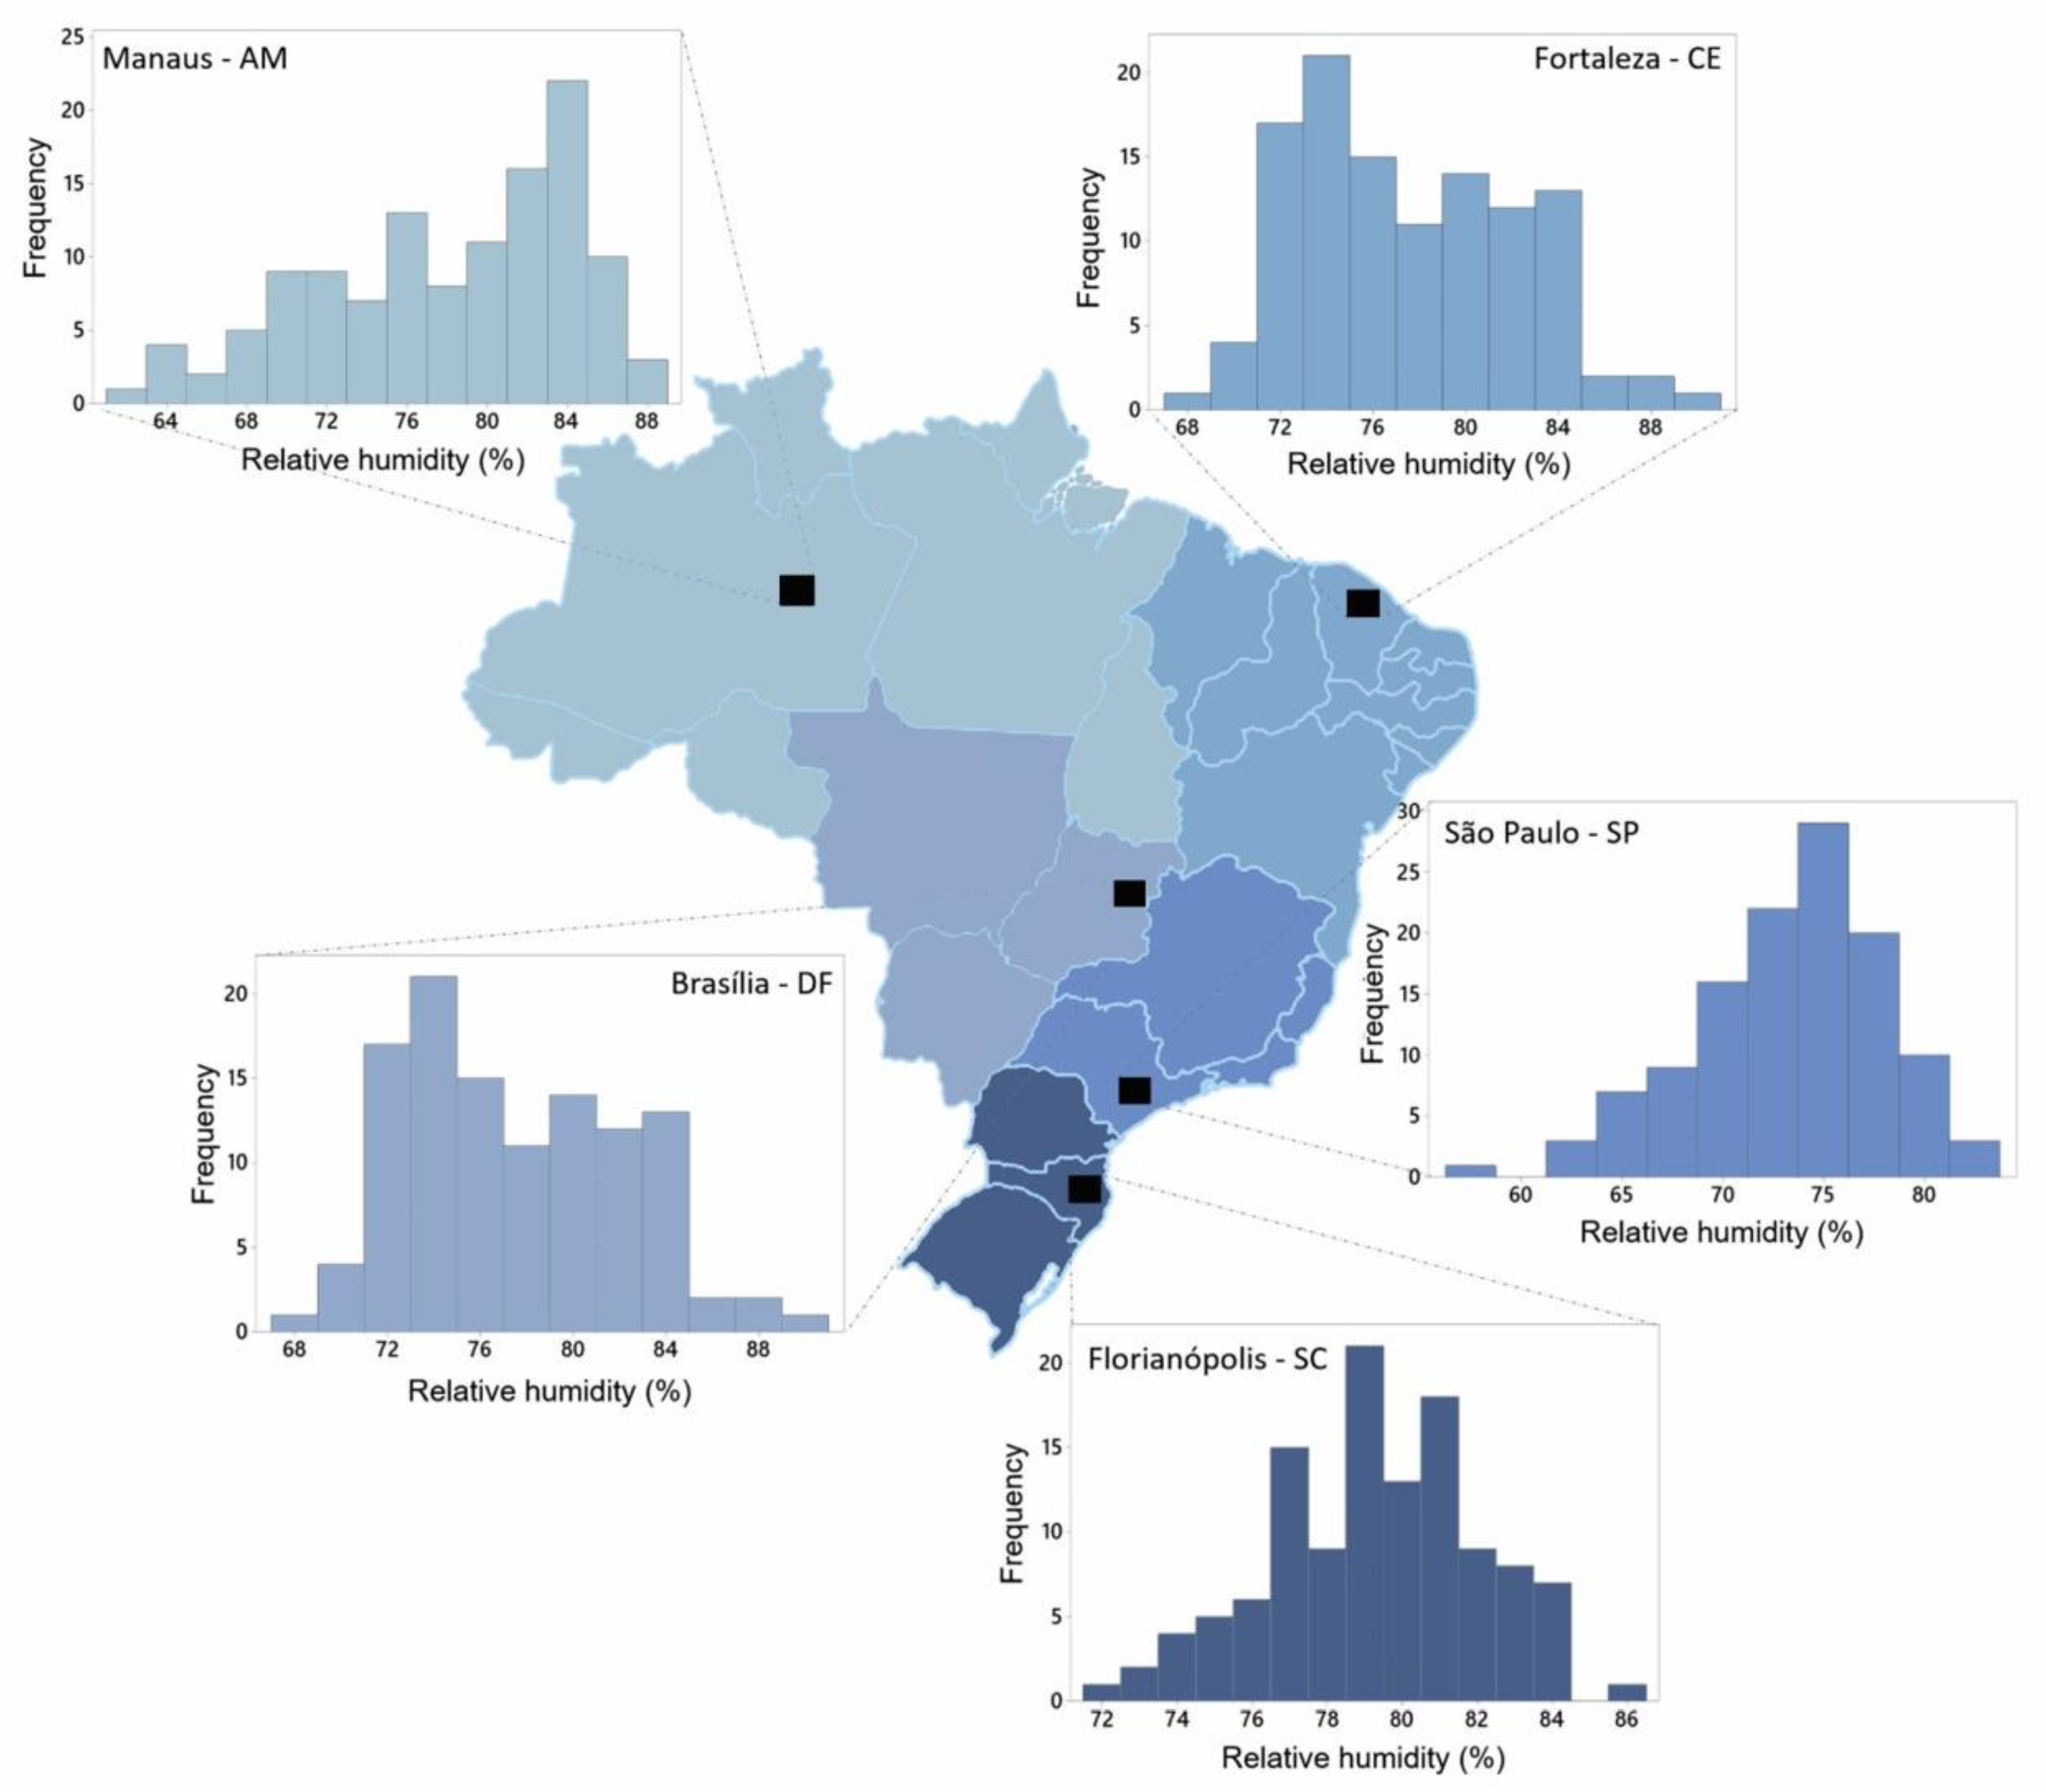
Table 6. The relative humidity was defined with mean values indicated in Table 5, and the other input parameters were: Kc = 30.5; Kfc = 1.7; Kad = 0.32; KCO2 = 15.5; and KRH = 1300.0.
To perform the simulations of structures located in Florianópolis and Fortaleza, the beams are modeled with a cross-section of 22 × 40 cm (Figure 3), and concrete is produced with Portland cement CEM III/A type, with no content additions. The Cl concentration and concrete compressive strength were defined with the mean values presented in Table 6. The relative humidity and temperature were defined with mean values indicated in Table 5, and the other input parameters were K1 = 1.21 and K2 = 1.0.
Based on Figure 6, there is no occurrence of reinforcement depassivation by carbonation for concrete structures located outdoors, exposed to rain environments. For structures located indoors, sheltered from rain environments, depassivation occurs in all cases. This analysis considers that the diffusion depth of CO2 or chlorides, before the age of 50, is greater than the cover indicated in the Brazilian design standard for RC structures (NBR 6118 [47]) located in the simulated environments. When comparing all the cities, the CO2 diffusion is higher in the cities of São Paulo and Brasilia, and this can be explained by the average values of relative humidity in these cities (Table 5), which are between 60 and 70%, the range of humidity that enhances the diffusion of CO2 in concrete [64].
Considering structures located in coastal cities, depassivation occurs due to the diffusion of chlorides. In Florianópolis and Fortaleza, as shown in Figure 6, the depth of chloride diffusion at the end of 50 years is greater than the concrete cover thickness (40 mm). When comparing the CO2 and chlorides diffusion depth of these cities, at the end of the analysis, they are two to four times higher than the carbonation depth, showing that the chlorides ingress is more meaningful and aggressive, as reported by Taffese and Sistonen [55]. However, for Zhu et al. [40], in cases where there is a combined action of chlorides and CO2, the initiation of corrosion must be analyzed considering the two mechanisms simultaneously. There must also be considered a synergistic effect between the aggressive agents, which could reduce the structure’s service life by up to 40% [52].
Figure 6 also indicates that, for the durability requirements of the Brazilian standard (NBR 15575 [65]), the specified concrete cover and compressive strength only abide by depending on the exposure conditions. Thus, the aggressiveness of the environment must be carefully defined in the design stage, so the structural element achieves its design life.

4.2. Probabilistic Analysis

The first step of the probabilistic analysis is to establish the number of samples and simulations that would provide reliable results. According to Liberati et al. [35], the probability of failure of civil structures is between 10−3 and 10−6, so it is required about 103 to 105 limit state simulations. As an option to reduce computational efforts, it was decided to carry out a convergence study.
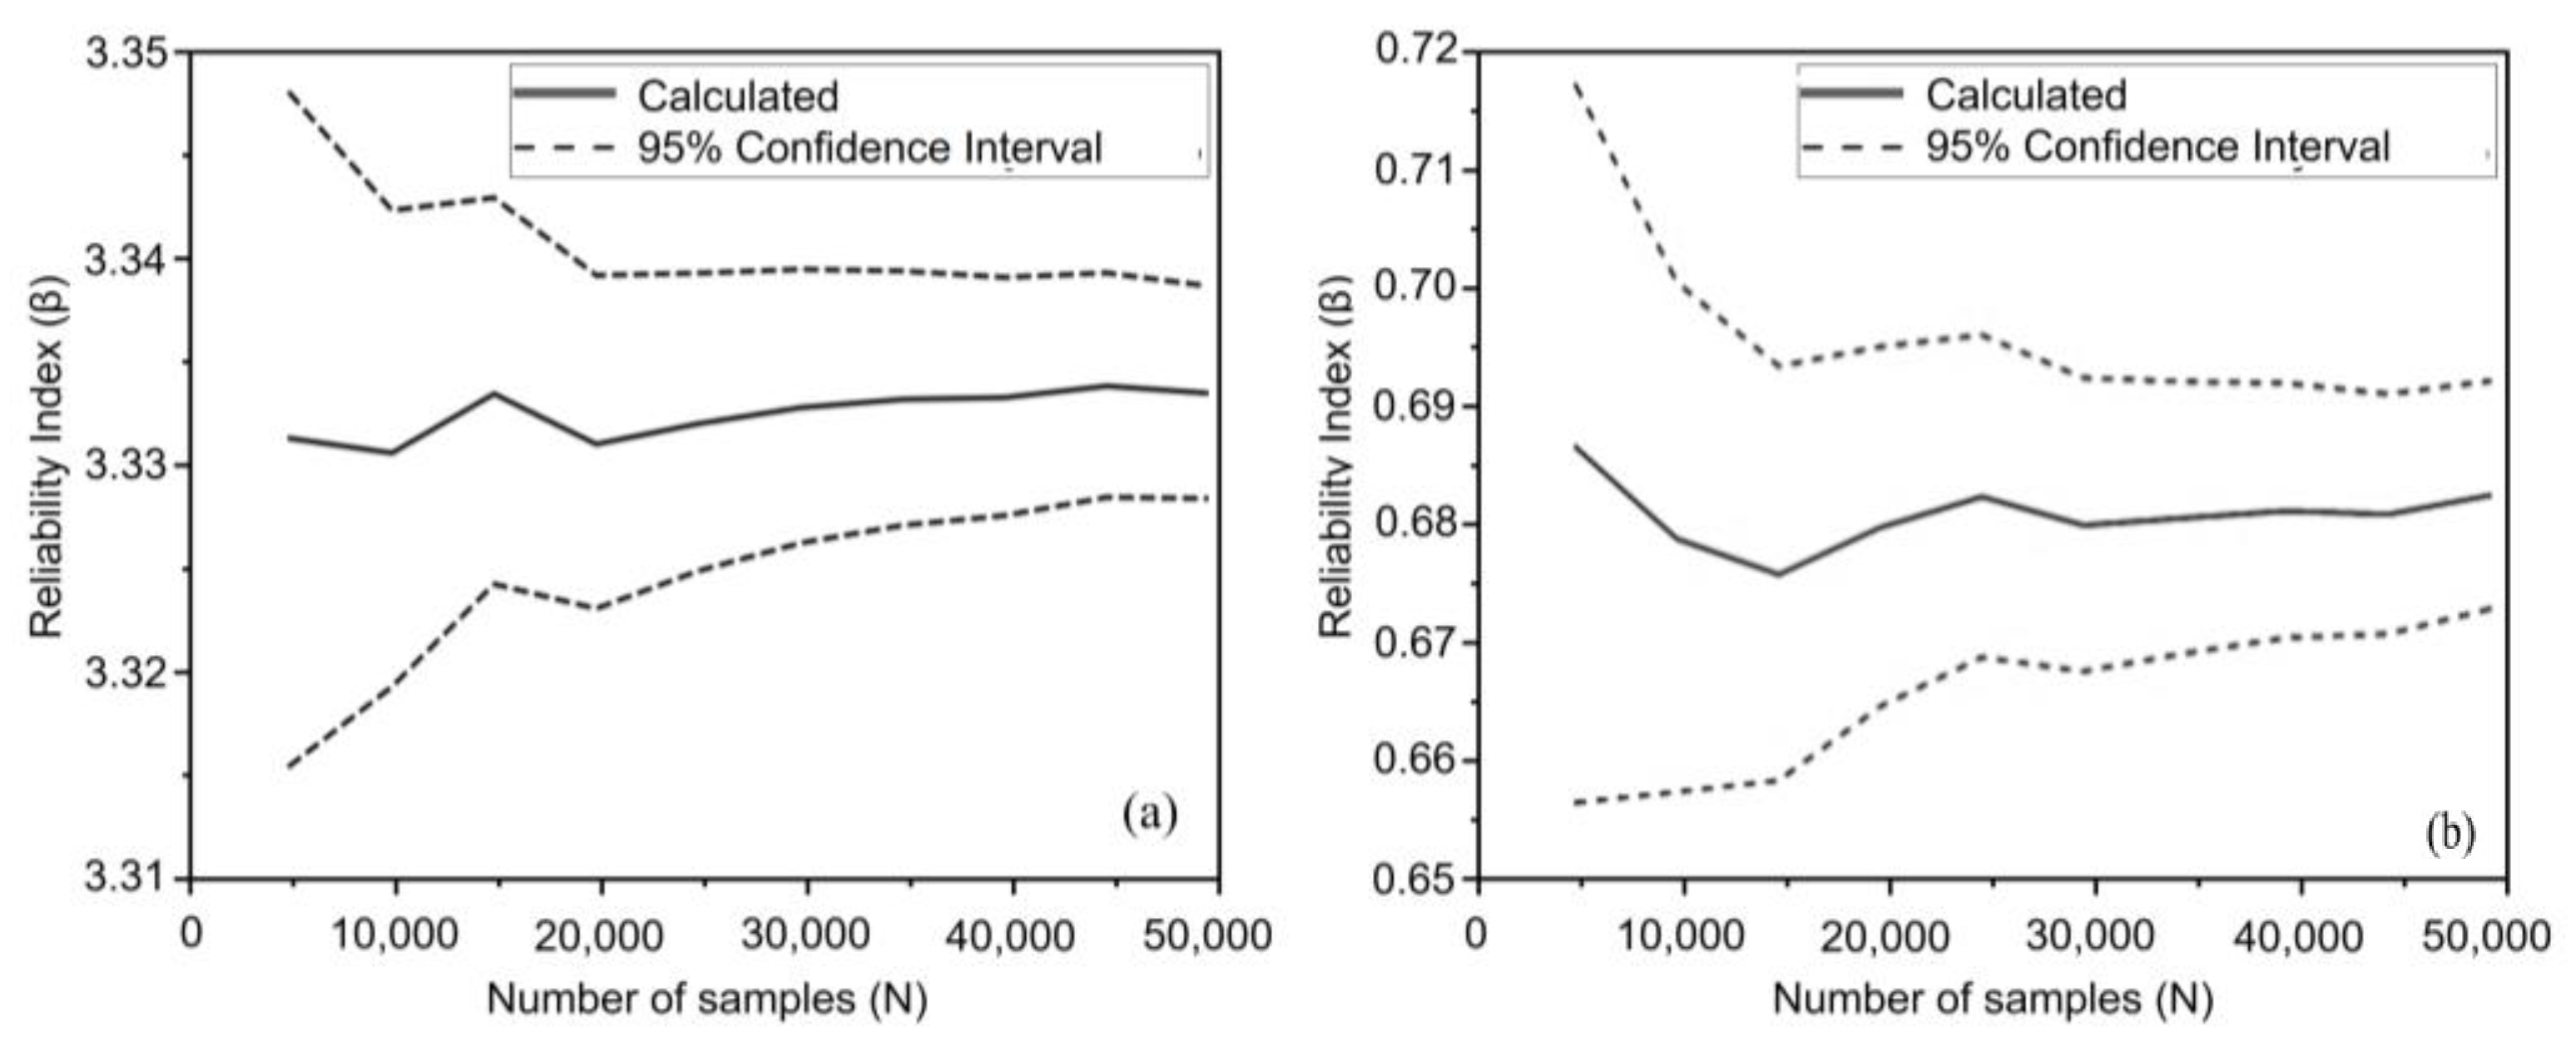
In Figure 7, two convergence analyses are presented, referring to the variability of the reliability index with the number of samples used in the simulations. The analyses were conducted considering the process of carbonation in the city of São Paulo (Figure 7a) and chloride diffusion in the city of Florianópolis (Figure 7b). The samples were generated with the Importance Sampling technique [53].
Figure 7a,b shows that the number of samples between 30,000 and 50,000 is sufficient to converge the reliability index and the probability of failure of the structure. Once the number of samples is defined, it is possible to estimate the probability of depassivation considering the simulated scenarios.
The results presented in Figure 8 show that the reinforcement depassivation probability due to CO2 diffusion is approximately zero for the first ten years, for all the simulated conditions of rain exposure. When analyzing the process of carbonation in an external environment and exposed to rain, the depassivation probability after 50 years is less than 10%, which attends to the durability limit state, and it is an acceptable probability for the reinforcement depassivation of concrete structures [66]. The durability limit state marks the onset of durability failure as the reinforcement depassivation in a RC structure [67]. According to ISO 13823:2008 [68], the durability limit state is reached when the reliability index exceeds the value of 1.6, which is equivalent to a failure probability of 0.2.
For indoor concrete structures, considering the carbonation process and an element sheltered from the rain, the reinforcement depassivation probability reached 20% at the age of 16–23 years, depending on the city. São Paulo was the city with the earliest probability of depassivation reaching 20%, at the age of 16 years. It is a city where the relative humidity has great variation, thus structures may always be under drying/wetting cycles. Possan et al. [67] observed that the diffusion of CO2 is highly affected by internal humidity, and the carbonation chemical reaction would be better represented by internal moisture instead of air relative humidity. Thus, to reach a more reliable analysis, it would be interesting to use a diffusion model that considers the internal humidity of concrete. However, using this parameter as input to the model would make it impractical, since it is not simple to collect the material’s internal humidity.
In chloride-induced depassivation analyses, it was found that the aggressiveness of the environment generates depassivation probability curves with steeper slopes in the first few years, with diffusion slowing down over time. Al-Alaily et al. [41] observed through probabilistic analyses, using Monte Carlo simulation, that the level of aggressiveness is primarily defined by the concrete’s compressive strength, i.e., its quality, and that in concrete without additions, the probability curve has high growth rates in the first few years. The authors [41] showed that if metakaolin is added to concrete, the depassivation probability decreases and the corrosion initiation is postponed.
When comparing the results obtained in the deterministic and probabilistic analyses, it is observed that the depassivation limit state, in corrosion induced by carbonation and in the indoor environment sheltered from rain, is reached at age 20 to 30 years in all environments evaluated probabilistically, while in the deterministic analysis, depassivation occurs between 35–45 years. In coastal cities, the durability limit state is reached at 30 years in the deterministic analysis and at 10 years in the probabilistic analysis. These results point out that purely deterministic approaches are not able to properly evaluate the depassivation of concrete structures because it is necessary to consider the randomness of the variables.
To evaluate the influence of the input parameters, a sensitivity analysis of the random variables considered in the probabilistic approach is shown in Figure 9. While Figure 9a is related to the input parameters in the analysis with CO2 diffusion in concrete structures in Manaus, Brasília, and São Paulo, Figure 9b is related to the input parameters in the simulation of Cl diffusion in Fortaleza and Florianópolis.
Figure 9 shows that the compressive strength, in the depassivation probability due to the carbonation, had the same importance level of the chloride content on the surface, when the depassivation due to Cl diffusion is analyzed. Thus, concrete structures located in urban environments are more sensitive to the quality of concrete when subject to carbonation. When the chloride content is predominant concerning the content of CO2 in the atmosphere, the chloride content on the surface indicates the level of environmental aggressiveness, and concrete quality parameters, such as concrete cover, and compressive strength, must be asserted to ensure the durability limit state.
Figure 10a,b shows the depassivation probability curves for beams produced with different types of Portland cement. Figure 10a shows the results of simulations conducted with an indoor environment sheltered from rain, in São Paulo city. Figure 10b shows the results of simulations conducted with structures located in Florianópolis for depassivation due to chloride diffusion.
Figure 10a shows that beams produced with types of cement CEM III/A or CEM IV/A and CEM IV/B have higher probability of depassivation by carbonation and less durability, the inverse of depassivation due to chloride diffusion (Figure 10b). Jiang et al. [69] and Possan et al. [20] reported the existence of a negative influence of using additions in the carbonation process due to the reduction of the alkaline reserve of the concrete when produced with cement types CEM III/A or CEM IV/A and CEM IV/B, which have high slag contents (from 35 to 70%) and pozzolana (from 15 to 50%) in their compositions, respectively. However, Andrade [33] reported that cement types CEM III/A and CEM IV/A and CEM IV/B are more resistant to chloride’s ingress. Rasheduzzafar et al. [70] and Helene [13] reported that chloride ions combine with tricalcium aluminate (C3A) to produce Friedel’s Salt, which reduces the number of chlorides in the pore solution, thus hindering its diffusion in the cementitious matrix.
Besides, although CEM II/A-S and CEMII/B-S E and CEM II/A-V cement types have additions in their composition (slag and pozzolan, respectively), the carbonation depths were lower than those obtained in beams produced with CEM III/A or CEM IV/A and CEM IV/B because they present significantly lower addition content, thus with a low reserve of alkaline ions but enough to improve the overall quality of concrete. The same analysis applies to the greater depths of chloride diffusion observed in the types CEM II/B-S and CEM II/A-V, and lesser depths in CEM III/A, CEM IV/A, and CEM IV/B.
The cement types that lead to greater durability against carbonation process were CEM I and CEM II/A-L and against chloride’s ingress were the types CEM III/A and CEM IV/A and CEM IV/B. Figure 11 shows the probability of reinforcement depassivation related to the beam’s simulations produced with CEM III/A and CEM I cement, with different concrete compressive strengths (30, 40, and 50 MPa), in two environmental scenarios, in the cities of São Paulo and Florianópolis.
The depassivation probability due to the ingress of CO2 in structures located in São Paulo (Figure 11a) with 30 MPa, and a concrete cover of 30 mm, is about 98% for CEM III/A. It clearly does not guarantee the durability in this scenario. Even with CEM I, the probability of depassivation is about 44%. To extend the durability limit state of a structure with a concrete cover of 30 mm, it would be recommended to produce concrete with CEM I and at least 40 MPa, reducing the probability of depassivation to less than 20%.
The depassivation probability due to chloride diffusion in concrete structures located in Florianópolis (Figure 11b) with 30 MPa and a concrete cover of 40 mm is about 86% for cement CEM I and 75% for CEM III/A. Just enhancing the quality of concrete by improving its compressive strength to 50 MPa would reduce the probability of depassivation to less than 25%.
Figure 12 illustrates the effect of the concrete cover thickness on the reinforcement depassivation, using contour maps referring to the variation in probability of depassivation for structures with different ages (10, 30, and 50 years), considering beams produced with cement CEM III/A and compressive strength of 30 MPa.
As before, the first Figure 12a refers to a concrete beam subjected to carbon dioxide ingress in São Paulo in an indoor environment sheltered from the rain. The second Figure 12b refers to a beam subject to chloride diffusion in Florianópolis. The environmental parameters employed in the simulation were defined in Table 5 and Table 6. The probability of depassivation is higher for chloride’s ingress, even with a cover greater than 40 mm.
The results shown in Figure 11 and Figure 12 confirm those indicated in Figure 9, in which the concrete cover has lower influence than the compressive strength on corrosion induced by carbonation, whilst in corrosion induced by chlorides, the compressive strength has a higher level of influence compared to the concrete cover. Coverings smaller than 40 mm generate higher depassivation probabilities in environments governed by the action of CO2, while coverings greater than 40 mm have higher depassivation probabilities when the structures are in coastal environments. For instance, when considering a concrete cover of 30 mm, the probability of depassivation due to the carbonation process is 97%, while there is a probability of 92% when analyzing the depassivation by Cl diffusion. When evaluating a cover of 35 mm, the probability of depassivation due to the carbonation process is 58%, and the probability of depassivation due to the action of chlorides is 66%. To ensure protection, the concrete cover must be increased. According to Palm et al. [71], an association of concrete cover and good practices for construction must be designed in every project to increase service life and durability.

5. Conclusions

In this work, an approach based on the Monte Carlo simulation was performed to determine the reinforcement depassivation probability of RC structures. To show the approach’s applicability, a case study is presented with five Brazilian environment conditions and with concretes made with distinct mixes. The effect of input parameters on the reinforcement depassivation probability of RC structures was analyzed and interpreted using numerical simulations.
To provide a reliable analysis with the proposed approach, results pointed out that about 50,000 samples are enough to establish convergence to the reliability index and the depassivation probability.
Results show that the depassivation due to carbonation process is influenced by, in order of importance, CO2 concentration content, relative humidity, concrete cover, and concrete compressive strength. For depassivation due to chlorides, the parameters of influence are, in order of importance, temperature, relative air humidity, concrete compressive strength, concrete cover, and concentration of chlorides on the surface.
In environments where chloride action is predominant, their content in the structure surface is an indicator of aggressiveness. In these cases, an adequate concrete cover and good practices of execution may reduce about 25% of the probability of depassivation.
In light of recent concerns over the durability and safety of concrete structures, the results point out that building codes can be updated to commit a reliable and safe concrete cover based on specific parameters. These parameters should include factors, such as compressive strength and relative humidity, which are critical indicators of a concrete structure’s strength and resistance to environmental damage. It is also recommended that certain types of Portland cement should be used for producing concrete in different environments. For environments with high chloride content, it is recommended to use Portland cement types CEM III/A, CEM IV/A, or CEM IV/B, as they are highly effective in preventing chloride-induced corrosion. On the other hand, for environments where the CO2 rate in the atmosphere is predominant, Portland cement types CEM I, CEM II/A-L, CEM II/A-S, or CEM II/B-S are recommended, as they are highly resistant to carbonation-induced corrosion. By incorporating these guidelines into building codes, more reliable and durable concrete structures could be designed.
When comparing the results obtained from the deterministic and probabilistic analyses, the durability limit state evaluated with the probabilistic approach is reached in about half of time indicated in the deterministic analysis. Thus, purely deterministic approaches were not able to properly evaluate the depassivation of concrete structures, because it is necessary to consider the randomness of the different parameters. Overall, incorporating models that consider the right parameters can be a valuable tool in the engineering industry, helping to improve the reliability and safety of concrete structures.
For future work, it is suggested to explore coupling Monte Carlo simulation with Machine Learning techniques, such as regression trees and artificial neural networks, to generate CO2 and chloride diffusion models that map their combined effect, and to consider the internal humidity of the material instead of the air’s relative humidity. In addition, to further improve future studies, obtaining natural degradation data is recommended to calibrate the diffusion models and the probabilistic approach.

Author Contributions

Conceptualization, E.F.F., R.C. and E.P.; Data curation, E.F.F., I.d.S.F. and L.G.d.S.; Formal analysis, E.F.F. and R.C.; Funding acquisition, E.F.F., R.C. and E.P.; Methodology, E.F.F.; Project administration, R.C.; Software, E.F.F.; Supervision, E.P.; Writing—original draft, E.F.F., I.d.S.F. and L.G.d.S.; Writing—review and editing, R.C. and E.P. All authors have read and agreed to the published version of the manuscript.

Funding

This research was funded by the Brazilian National Council for Scientific and Technological Development (CNPq 141078/2018 and CNPq 310564/2018-2), the Coordenação de Aperfeiçoamento de Pessoal de Nível Superior–Brasil (CAPES)–Finance Code 001 and by the EDITAL 01/2023-PROPe/PROPEG of São Paulo State University (UNESP).

Data Availability Statement

Publicly available datasets were analyzed in this study. This data can be found here: https://bdmep.inmet.gov.br/ (accessed on 9 March 2023).

Conflicts of Interest

The authors declare no conflict of interest.

References

  1. Ellingwood, B.R.; Frangopol, D.M. Introduction to the State of the Art Collection: Risk-Based Lifecycle Performance of Structural Systems. J. Struct. Eng. 2016, 142, F2016001. [Google Scholar] [CrossRef]
  2. Al Fuhaid, A.F.; Niaz, A. Carbonation and Corrosion Problems in Reinforced Concrete Structures. Buildings 2022, 12, 586. [Google Scholar] [CrossRef]
  3. Felix, E.F. Modelagem Da Deformação Do Concreto Armado Devido à Formação Dos Produtos de Corrosão. Ph.D. Thesis, University of São Paulo, São Carlos, Brazil, 2018. [Google Scholar]
  4. Carmona, A.F.; Marega, A. Retrospectiva Da Patologia No Brasil: Estudo Estatístico. In Proceedings of the Jornadas em Español y Portugués sobre Estructuras y Materiales, Madrid, Spain, 23–27 May 1988; pp. 325–348. [Google Scholar]
  5. Dal Molin, D. Fissuras Em Estruturas de Concreto Armado: Análise Das Manifestações Típicas e Levantamento de Casos Ocorridos No Estado Do Rio Grande Do Sul. Ph.D. Thesis, Universidade federal do Rio Grande do Sul, Porto Alegre, Brazil, 1988. [Google Scholar]
  6. Andrade, C. Manual Para Diagnóstico de Obras Deterioradas Por Corrosão de Armaduras; Carmona, A., Helene, P., Eds.; PINI: São Paulo, Brazil, 1992. [Google Scholar]
  7. Geiker, M.R.; Polder, R.B. Experimental Support for New Electro Active Repair Method for Reinforced Concrete. Mater. Corros. 2016, 67, 600–606. [Google Scholar] [CrossRef]
  8. Kari, O.P.; Puttonen, J.; Skantz, E. Reactive Transport Modelling of Long-Term Carbonation. Cem. Concr. Compos. 2014, 52, 42–53. [Google Scholar] [CrossRef]
  9. Nguyen, T.T.H.; Bary, B.; de Larrard, T. Coupled Carbonation-Rust Formation-Damage Modeling and Simulation of Steel Corrosion in 3D Mesoscale Reinforced Concrete. Cem. Concr. Res. 2015, 74, 95–107. [Google Scholar] [CrossRef]
  10. Karka, B.R.; Bruno, B.; Ngarmaïm, N.; Rimbarngaye, A. The Effects of Degradation Phenomena of the Steel-Concrete Interface in Reinforced Concrete Structures. J. Mater. Sci. Chem. Eng. 2023, 11, 1–21. [Google Scholar] [CrossRef]
  11. Zeng, B.; Wang, Y.; Gong, F.; Maekawa, K. Corrosion-Induced Cracking Pattern Analysis of RC Beam under Sustained Load Considering the Poromechanical Characteristics of Corrosion Products. Buildings 2022, 12, 2256. [Google Scholar] [CrossRef]
  12. Robuschi, S.; Tengattini, A.; Dijkstra, J.; Fernandez, I.; Lundgren, K. A Closer Look at Corrosion of Steel Reinforcement Bars in Concrete Using 3D Neutron and X-Ray Computed Tomography. Cem. Concr. Res. 2021, 144, 106439. [Google Scholar] [CrossRef]
  13. Helene, P. Corrosão Em Armaduras Para Concreto Armado; PINI: São Paulo, Brazil, 1986. [Google Scholar]
  14. Tuutti, K. Corrosion of Steel in Concrete; Cement-och betonginst: Stockholm, Sweden, 1982. [Google Scholar]
  15. Köliö, A.; Pakkala, T.A.; Hohti, H.; Laukkarinen, A.; Lahdensivu, J.; Mattila, J.; Pentti, M. The Corrosion Rate in Reinforced Concrete Facades Exposed to Outdoor Environment. Mater. Struct. 2017, 50, 23. [Google Scholar] [CrossRef]
  16. Broomfield, J. Corrosion of Steel in Concrete: Understanding, Investigation and Repair, 2nd ed.; CRC Press: London, UK, 2006. [Google Scholar]
  17. Hamada, M. Neutralization (Carbonation) of Concrete and Corrosion of Reinforcing Steel. In Proceedings of the 5th International Congress on the Chemistry of Cement, Tokyo, Japan, 7–11 October 1968. [Google Scholar]
  18. Felix, E.F.; Carrazedo, R.; Possan, E. Carbonation Model for Fly Ash Concrete Based on Artificial Neural Network: Development and Parametric Analysis. Constr. Build. Mater. 2021, 266, 121050. [Google Scholar] [CrossRef]
  19. Papadakis, V.G.; Vayenas, C.G.; Fardis, M.N. Fundamental Modeling and Experimental Investigation of Concrete Carbonation. ACI Mater. J. 1991, 88, 363–373. [Google Scholar] [CrossRef]
  20. Possan, E.; Andrade, J.J.O.; Dal Molin, D.C.C.; Ribeiro, J.L.D. Model to Estimate Concrete Carbonation Depth and Service Life Prediction. In Hygrothermal Behaviour and Building Pathologies; Springer: Berlin/Heidelberg, Germany, 2021; pp. 67–97. [Google Scholar]
  21. Felix, E.F.; Possan, E. Modeling the Carbonation Front of Concrete Structures in the Marine Environment through ANN. IEEE Lat. Am. Trans. 2018, 16, 1772–1779. [Google Scholar] [CrossRef]
  22. Felix, E.F.; Possan, E.; Carrazedo, R. Artificial Intelligence Applied in the Concrete Durability Study. In Hygrothermal Behaviour and Building Pathologies; Springer: Berlin/Heidelberg, Germany, 2021. [Google Scholar]
  23. Liu, Q.; Cai, Y.; Peng, H.; Meng, Z.; Mundra, S.; Castel, A. A Numerical Study on Chloride Transport in Alkali-Activated Fly Ash/Slag Concretes. Cem. Concr. Res. 2023, 166, 107094. [Google Scholar] [CrossRef]
  24. Andrade, C.; Díez, J.M.; Alonso, C. Mathematical Modeling of a Concrete Surface “Skin Effect” on Diffusion in Chloride Contaminated Media. Adv. Cem. Based Mater. 1997, 6, 39–44. [Google Scholar] [CrossRef]
  25. Arora, P.; Popov, B.N.; Haran, B.; Ramasubramanian, M.; Popova, S.; White, R.E. Corrosion Initiation Time of Steel Reinforcement in a Chloride Environment—A One Dimensional Solution. Corros. Sci. 1997, 39, 739–759. [Google Scholar] [CrossRef]
  26. Zacchei, E.; Nogueira, C.G. Numerical Solutions for Chloride Diffusion Fluctuation in RC Elements from Corrosion Probability Assessments. Buildings 2022, 12, 1211. [Google Scholar] [CrossRef]
  27. Lehner, P.; Koubová, L.; Rosmanit, M. Study of Effect of Reference Time of Chloride Diffusion Coefficient in Numerical Modelling of Durability of Concrete. Buildings 2022, 12, 1443. [Google Scholar] [CrossRef]
  28. Liang, X.; Qi, W.; Fang, Z.; Zhang, S.; Fan, Y.; Shah, S.P. Study on the Relationship between Chloride Ion Penetration and Resistivity of NAC-Cement Concrete. Buildings 2022, 12, 2044. [Google Scholar] [CrossRef]
  29. Wu, L.; Wang, Y.; Wang, Y.; Ju, X.; Li, Q. Modelling of Two-Dimensional Chloride Diffusion Concentrations Considering the Heterogeneity of Concrete Materials. Constr. Build. Mater. 2020, 243, 118213. [Google Scholar] [CrossRef]
  30. Silvestro, L.; Andrade, J.J.O.; Dal Molin, D.C.C. Evaluation of Service-Life Prediction Model for Reinforced Concrete Structures in Chloride-Laden Environments. J. Build. Pathol. Rehabil. 2019, 4, 20. [Google Scholar] [CrossRef]
  31. Spiesz, P.; Brouwers, H.J.H. The Apparent and Effective Chloride Migration Coefficients Obtained in Migration Tests. Cem Concr Res 2013, 48, 116–127. [Google Scholar] [CrossRef]
  32. Xu, J.; Jiang, L.; Wang, W.; Jiang, Y. Influence of CaCl2 and NaCl from Different Sources on Chloride Threshold Value for the Corrosion of Steel Reinforcement in Concrete. Constr. Build. Mater. 2011, 25, 663–669. [Google Scholar] [CrossRef]
  33. Andrade, J.J.D.O. Contribuição à Previsão Da Vida Útil Das Estruturas de Concreto Armado Atacadas Pela Corrosão de Armaduras: Iniciação Por Cloretos. Ph.D. Thesis, Universidade Federal do Rio Grande do Sul, Porto Alegre, Brazil, 2001. [Google Scholar]
  34. Ramezanianpour, A.A.; Tarighat, A.; Miyamoto, A. Concrete Carbonation Modelling and Monte Carlo Simulation Method for Uncertainty Analysis of Stochastic Front Depth. Mem. Fac. Eng. Yamaguchi Univ. 2000, 50, 149–152. [Google Scholar]
  35. Liberati, E.A.P.; Leonel, E.D.; Nogueira, C.G. Influence of the Reinforcement Corrosion on the Bending Moment Capacity of Reinforced Concrete Beams: A Structural Reliability Approach. Rev. Ibracon Estrut. Mater. 2014, 7, 379–413. [Google Scholar] [CrossRef] [Green Version]
  36. Enright, M.P.; Frangopol, D.M. Probabilistic Analysis of Resistance Degradation of Reinforced Concrete Bridge Beams under Corrosion. Eng. Struct. 1998, 20, 960–971. [Google Scholar] [CrossRef]
  37. Kirkpatrick, T.J.; Weyers, R.E.; Anderson-Cook, C.M.; Sprinkel, M.M. Probabilistic Model for the Chloride-Induced Corrosion Service Life of Bridge Decks. Cem. Concr. Res. 2002, 32, 1943–1960. [Google Scholar] [CrossRef]
  38. Li, Q.; Li, K.; Zhou, X.; Zhang, Q.; Fan, Z. Model-Based Durability Design of Concrete Structures in Hong Kong–Zhuhai–Macau Sea Link Project. Struct. Saf. 2015, 53, 1–12. [Google Scholar] [CrossRef]
  39. Aslani, F.; Dehestani, M. Probabilistic Impacts of Corrosion on Structural Failure and Performance Limits of Reinforced Concrete Beams. Constr. Build. Mater. 2020, 265, 120316. [Google Scholar] [CrossRef]
  40. Saassouh, B.; Lounis, Z. Probabilistic Modeling of Chloride-Induced Corrosion in Concrete Structures Using First- and Second-Order Reliability Methods. Cem. Concr. Compos. 2012, 34, 1082–1093. [Google Scholar] [CrossRef]
  41. Al-alaily, H.S.; Hassan, A.A.A.; Hussein, A.A. Probabilistic and Statistical Modeling of Chloride-Induced Corrosion for Concrete Containing Metakaolin. J. Mater. Civ. Eng. 2017, 29. [Google Scholar] [CrossRef]
  42. Ann, K.Y.; Pack, S.-W.; Hwang, J.-P.; Song, H.-W.; Kim, S.-H. Service Life Prediction of a Concrete Bridge Structure Subjected to Carbonation. Constr. Build. Mater. 2010, 24, 1494–1501. [Google Scholar] [CrossRef]
  43. Marek, P.; Guštar, M.; Tikalsky, P.J. Monte Carlo Simulation—Tool for Better Understanding of LRFD. J. Struct. Eng. 1993, 119, 1586–1599. [Google Scholar] [CrossRef]
  44. Lizarazo-Marriaga, J.; Higuera, C.; Guzmán, I.; Fonseca, L. Probabilistic Modeling to Predict Fly-Ash Concrete Corrosion Initiation. J. Build. Eng. 2020, 30, 101296. [Google Scholar] [CrossRef]
  45. Yu, B.; Liu, J.; Chen, Z. Probabilistic Evaluation Method for Corrosion Risk of Steel Reinforcement Based on Concrete Resistivity. Constr. Build. Mater. 2017, 138, 101–113. [Google Scholar] [CrossRef]
  46. Shim, H. Design & Analysis of Corrosion Free Service Life of Concrete Structures Using Monte Carlo Method. KSCE J. Civ. Eng. 2005, 9, 377–384. [Google Scholar] [CrossRef]
  47. NBR 6118; Projeto de Estruturas de Concreto-Procedimento. Associação Brasileira de normas Técnicas: Rio de Janeiro, Brazil, 2014.
  48. Eurocode 2; Design of Concrete Structures Part 1-1: General Rules for Buildings. European Committee for Standardization: Brussels, Belgium, 2004.
  49. Pellizzer, G.P.; Leonel, E.D. Probabilistic Corrosion Time Initiation Modelling in Reinforced Concrete Structures Using the BEM. Rev. Ibracon Estrut. Mater. 2020, 13, e13409. [Google Scholar] [CrossRef]
  50. Ghanooni-Bagha, M.; YekeFallah, M.R.; Shayanfar, M.A. Durability of RC Structures against Carbonation-Induced Corrosion under the Impact of Climate Change. KSCE J. Civ. Eng. 2020, 24, 131–142. [Google Scholar] [CrossRef]
  51. Monteiro, A.V.; Gonçalves, A. Probabilistic Assessment of the Depassivation Limit State of Reinforced Concrete Structures Based on Inspection Results. J. Build. Eng. 2022, 49, 104063. [Google Scholar] [CrossRef]
  52. Zhu, X.; Zi, G.; Lee, W.; Kim, S.; Kong, J. Probabilistic Analysis of Reinforcement Corrosion Due to the Combined Action of Carbonation and Chloride Ingress in Concrete. Constr. Build. Mater. 2016, 124, 667–680. [Google Scholar] [CrossRef]
  53. Jacquemart, D.; Morio, J.; Le Gland, F.; Balesdent, M. Special Developments for Time-Variant Systems. In Estimation of Rare Event Probabilities in Complex Aerospace and Other Systems; Elsevier: Amsterdam, The Netherlands, 2016; pp. 137–153. [Google Scholar]
  54. Mehta, P.K.; Monteiro, P.J.M. Effect of Aggregate, Cement, and Mineral Admixtures on the Microstructure of the Transition Zone. MRS Proc. 1987, 114, 65. [Google Scholar] [CrossRef]
  55. Taffese, W.Z.; Sistonen, E.; Puttonen, J. CaPrM: Carbonation Prediction Model for Reinforced Concrete Using Machine Learning Methods. Constr. Build. Mater. 2015, 100, 70–82. [Google Scholar] [CrossRef]
  56. Kobayashi, K.; Uno, Y. Mechanism of Carbonation of Concrete. Concr. Libr. JSCE 1990, 16, 139–151. [Google Scholar]
  57. Ishida, T.; Maekawa, K. Modeling of ph Profile in Pore Water Based on Mass Transport and Chemical Equilibrium Theory. Doboku Gakkai Ronbunshu 2000, 2000, 203–215. [Google Scholar] [CrossRef] [PubMed] [Green Version]
  58. Maekawa, K.; Ishida, T.; Kishi, T. Multi-Scale Modeling of Concrete Performance. J. Adv. Concr. Technol. 2003, 1, 91–126. [Google Scholar] [CrossRef] [Green Version]
  59. Andrade, J.J.O.; Possan, E.; Dal Molin, D.C.C. Considerations about the Service Life Prediction of Reinforced Concrete Structures Inserted in Chloride Environments. J. Build. Pathol. Rehabil. 2017, 2, 6. [Google Scholar] [CrossRef] [Green Version]
  60. Beck, A.T. Confiabilidade e Segurança Das Estruturas; Elsevier: Rio de Janeiro, Brasil, 2019. [Google Scholar]
  61. Instituto Nacional de Meteorologia (BDMEP/INMET) Banco de Dados Meteorológicos Para Ensino e Pesquisa. Temperaturas Máximas e Mínimas e Humidade Relativa Do Ar Anos 2012/2022. Available online: http://www.inmet.gov.br/projetos/rede/pesquisa/ (accessed on 9 March 2023).
  62. 2 Degrees Institute CO2 Mudial Concentration.Data of Global CO2 levels (december, 2022). Available online: https://www.2degreesinstitute.org/ (accessed on 9 March 2023).
  63. Helene, P.R.; Terzian, P. Manual de Dosagem e Controle Do Concreto; PINI: São Paulo, Brazil, 1993. [Google Scholar]
  64. Felix, E.F.; Carrazedo, R.; Possan, E. Análise Paramétrica Da Carbonatação Em Estruturas de Concreto Armado via Redes Neurais Artificiais. Rev. Alconpat 2017, 7, 302. [Google Scholar] [CrossRef] [Green Version]
  65. NBR 15575-1; Edifícios Habitacionais-Desempenho: Parte 1: Requisitos Gerais. Associação Brasileira de Normas Técnicas (ABNT): Rio de Janeiro, Brazil, 2013.
  66. Fluge, F. Marine Chlorides. A Probabilistic Approach to Derive Provisions for EN206-1. In Proceedings of the 3rd DuraNet Workshop, Tromso, Norway, 10 July 2001. [Google Scholar]
  67. Possan, E.; Thomaz, W.A.; Aleandri, G.A.; Felix, E.F.; dos Santos, A.C.P. CO2 Uptake Potential Due to Concrete Carbonation: A Case Study. Case Stud. Constr. Mater. 2017, 6, 147–161. [Google Scholar] [CrossRef]
  68. ISO:13823; General Principles on the Design of Structures for Durability. International Organization for Standardization: Geneve, Switzerland, 2008.
  69. Jiang, L.; Lin, B.; Cai, Y. A Model for Predicting Carbonation of High-Volume Fly Ash Concrete. Cem. Concr. Res. 2000, 30, 699–702. [Google Scholar] [CrossRef]
  70. Rasheduzzafar, S.S.; Al-Saadam, F.H.; Dakhil, A.S.; Al-Gahtani, C.L. Corrosion of Reinforcement in Concrete; Elsevier Applied Science: London, UK, 1990; pp. 213–226. [Google Scholar]
  71. Palm, V.; Maran, A.P.; Barreto, M.F.F.M.; Molin, D.C.D.; Masuero, J.R. Influência Da Distribuição de Espaçadores No Cobrimento e Na Vida Útil de Lajes Maciças. Ambiente Construído 2020, 20, 671–686. [Google Scholar] [CrossRef]
Figure 1. Reinforcement corrosion in RC structures due to CO2 diffusion.
Buildings 13 00993 g001
Figure 2. Flow chart of the probabilistic approach.
Buildings 13 00993 g002
Figure 3. Dimensions of beams cross section (in mm) and surface exposure conditions.
Buildings 13 00993 g003
Figure 4. Frequency of distribution of the monthly average humidity for selected cities.
Buildings 13 00993 g004
Figure 5. Frequency of distribution of the monthly average temperatures for selected cities.
Buildings 13 00993 g005
Figure 6. CO2 and chloride diffusion depth for the simulated scenarios.
Buildings 13 00993 g006
Figure 7. Reliability index vs. number of samples on the depassivation by (a) CO2 and (b) Cl diffusion.
Buildings 13 00993 g007
Figure 8. Depassivation probability due to CO2 and Cl diffusion.
Buildings 13 00993 g008
Figure 9. Sensitivity analysis considering depassivation due to (a) CO2 and (b) Cl diffusion.
Buildings 13 00993 g009
Figure 10. Depassivation probability in function cement type and for (a) CO2 or (b) Cl diffusion.
Buildings 13 00993 g010
Figure 11. Depassivation probability in function of concrete cover in 50-year-old structure for (a) São Paulo and (b) Florianópolis.
Buildings 13 00993 g011
Figure 12. Depassivation probability in function of concrete cover and structure age for a concrete beam located in (a) São Paulo—considering carbonation process and (b) Florianópolis—considering chloride diffusion.
Buildings 13 00993 g012
Table 1. Model coefficients as a function of concrete characteristics [20].
Cement TypeConcrete CharacteristicsEnvironmental Conditions
CementfcMineral AdmixtureCO2RH
KcKfcKadKCO2KRH
CEM I 119.801.700.2418.001300
CEM II/A-L 221.681.500.2418.001100
CEM II/A-S 3
CEM II/B-S 322.481.500.3215.501300
CEM II/A-V 423.661.500.3215.501300
CEM III/A 530.501.700.3215.501300
1 Ordinary Portland Cement—Equivalent to Brazilian Cement CP I and CP V/ASTM C 150. 2 Portland cement with limestone filler—Equivalent to Brazilian Cement CP II F/ASTM C 150. 3 Portland cement with slag—Equivalent to Brazilian Cement CP II E/ASTM C 595/IP. 4 Portland cement with pozzolan—Equivalent to Brazilian Cement CP II Z/ASTM C 595/IS. 5 Portland cement with slag—Equivalent to Brazilian Cement CP III/ASTM C 595. 6 Portland cement with pozzolan—Equivalent to Brazilian Cement CP IV/ASTM C 595.
Table 2. Model coefficients as a function of exposure conditions [20].
Exposure ConditionsCoefficient Kce
Indoor, sheltered from rain1.30
Outdoor, sheltered from rain1.00
Outdoor, exposed to rain0.65
Table 3. Model coefficients as a function of the cement type [59].
Cement TypeCoefficient K1
CEM I0.95
CEM II/A-L1.00
CEM II/A-SCEM II/B-S0.98
CEM II/A-V1.05
CEM III/A1.21
CEM IV/ACEM IV/B1.17
CEM I0.95
CEM II/A-L1.00
Table 4. Model coefficients as a function of the concrete admixture [59].
Admixture TypeCoefficient K2
Active Silica or without admixture1.00
Metakaolin0.97
Rice husk ash0.76
Table 5. Statistical parameters of average monthly temperature and humidity.
VariableCityMeanDeviationDistribution Function
T (°C)Brasília21.711.44Normal
Florianópolis21.083.33Normal with Johnson transformation
Fortaleza27.230.52Normal
Manaus27.991.14Log-normal
São Paulo20.382.41Normal
RH (%)Brasília63.5413.24Normal with Johnson transformation
Florianópolis79.292.81Normal
Fortaleza77.464.71Normal with Johnson transformation
Manaus77.966.42Normal with Johnson transformation
São Paulo73.394.80Logistic
Table 6. Statistical parameters of CO2 and Cl, compressive strength, and concrete cover [35,36,47,62,63].
VariableMeanDeviationDistribution
CO2 concentration (%)0.0410.0043Normal
Cl concentration (%)1.150.575Log-normal
Concrete compressive strength (MPa)27.403.14Normal
Concrete cover (mm)30 or 403.6 or 4.8Normal
Disclaimer/Publisher’s Note: The statements, opinions and data contained in all publications are solely those of the individual author(s) and contributor(s) and not of MDPI and/or the editor(s). MDPI and/or the editor(s) disclaim responsibility for any injury to people or property resulting from any ideas, methods, instructions or products referred to in the content.

