
Numerical Method for Creep Analysis of Strengthened Fatigue-Damaged Concrete Beams

Abstract
:1. Introduction
2. Numerical Method
2.1. Constitutive Fatigue Model
- The effective stress theory
- The equivalent strain theory.
2.2. Constitutive Creep Model with Fatigue Damage
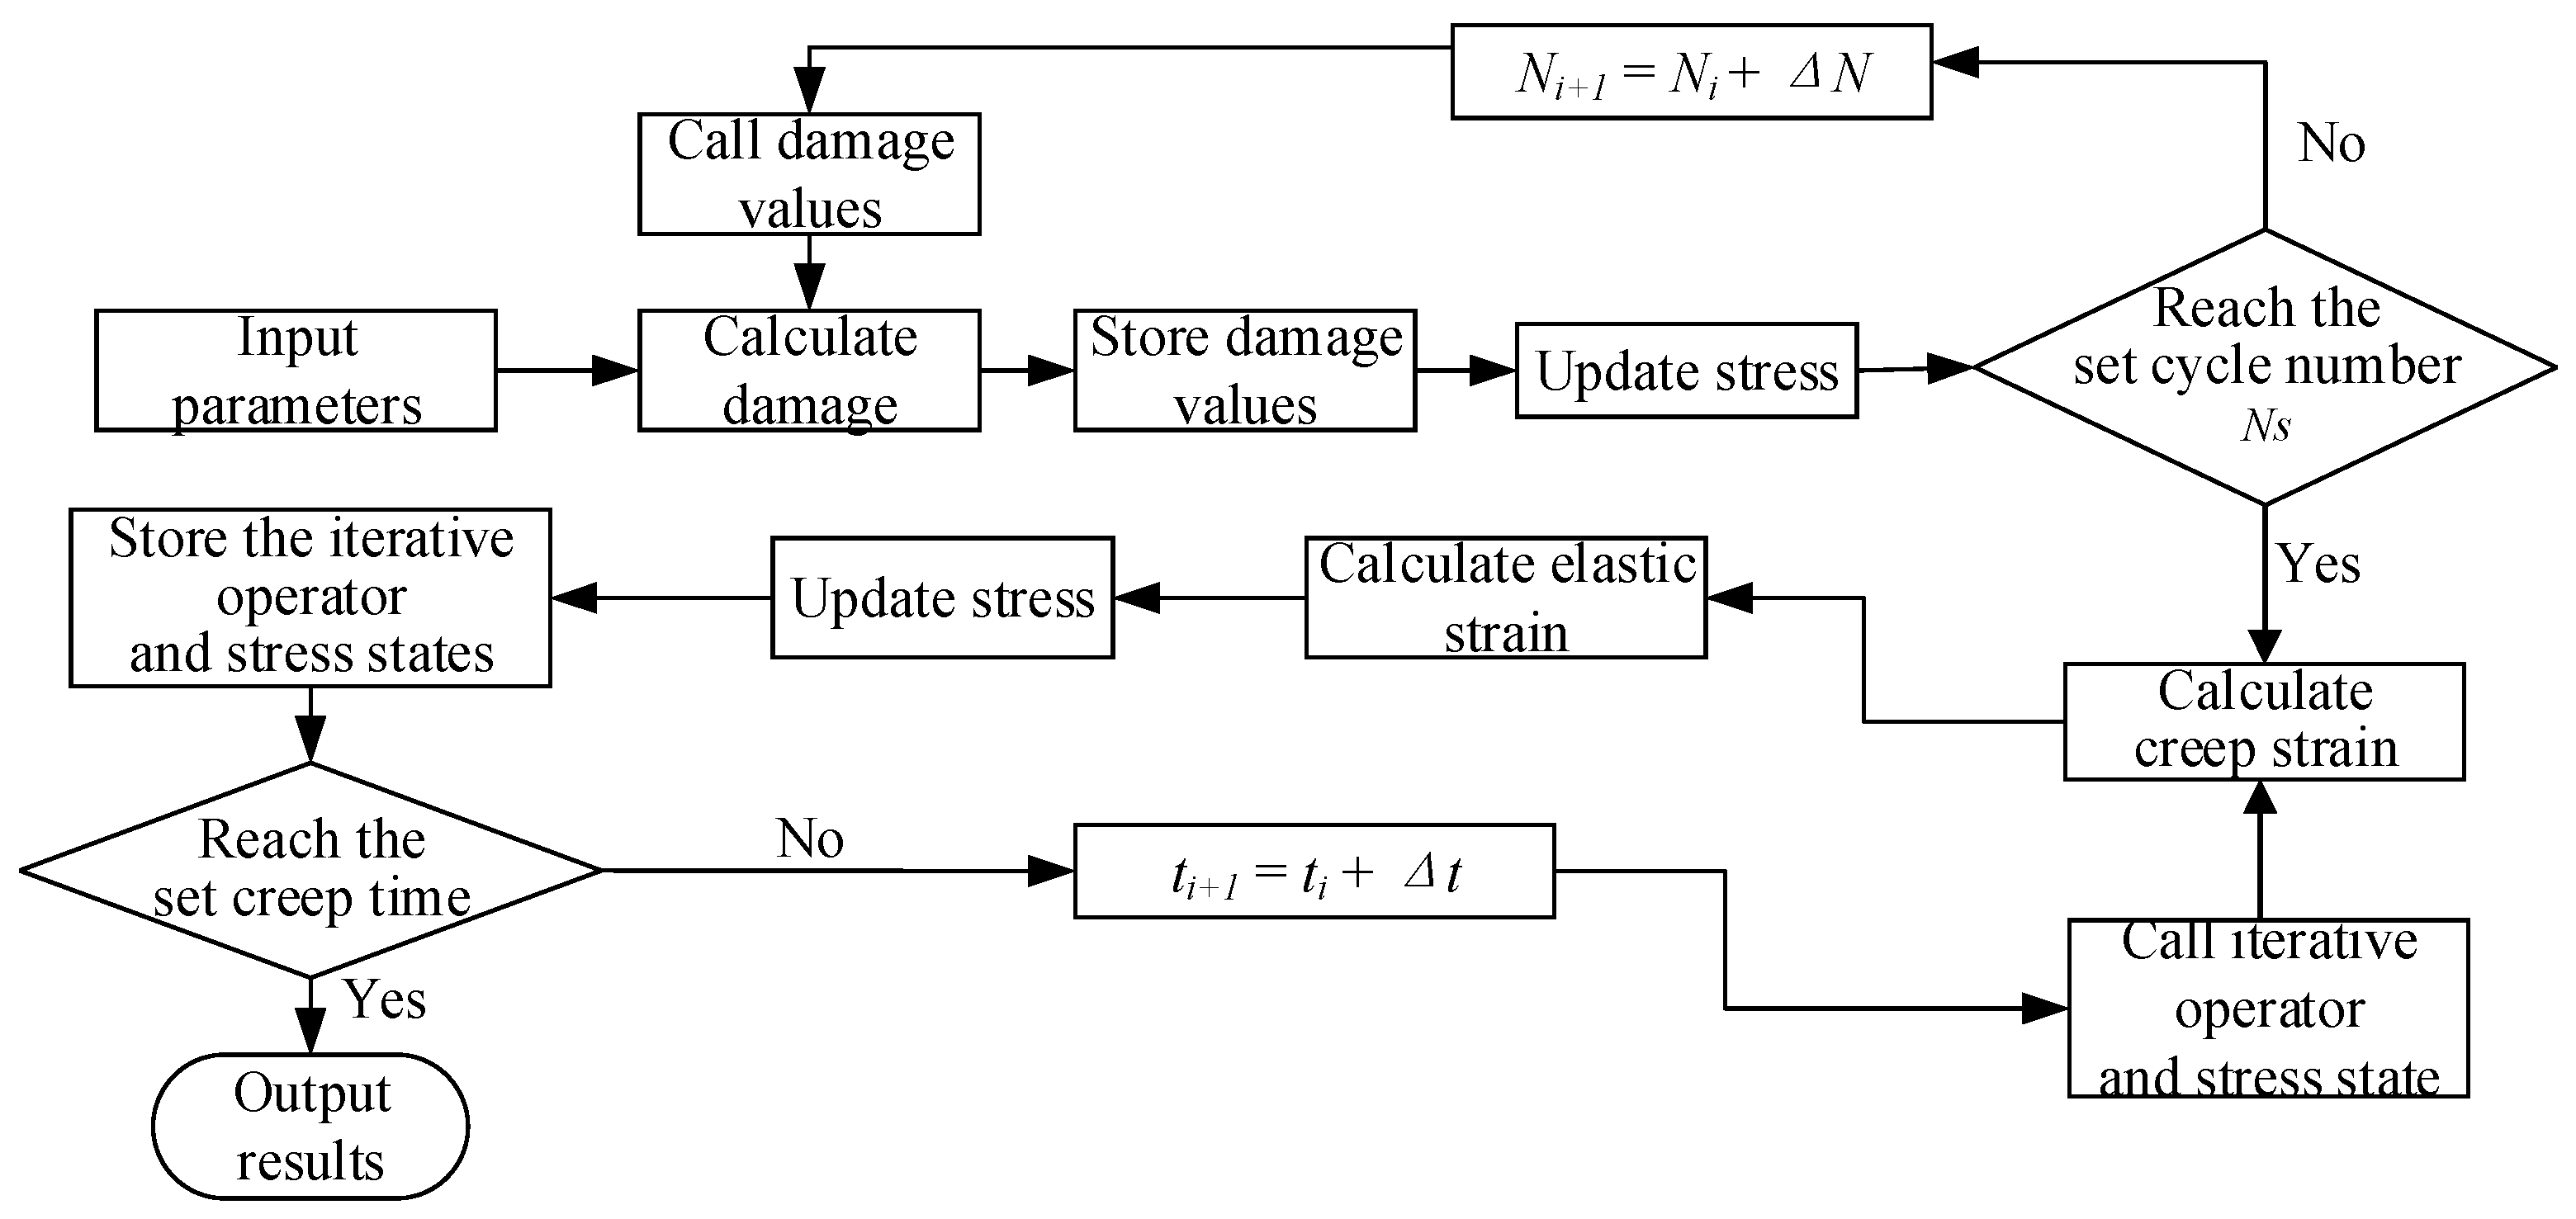
2.3. Numerical Modeling of Creep Deformation with Fatigue Damage
- Calculating the stress increment using the strain increment () and updating the stress in ANSYS;
- Calculating the Jacobi matrix according to Equations (17) and (20).
- Initialize the material parameters and set the initial value of damage to each element at zero;
- Check whether the time value corresponding to the current cycle number () reaches the preset cycle number (), and if not, call the fatigue part of the subroutine;
- Call the equation solver: first, read the accumulated value of the damage variable stored in the previous cycle , then solve the constitutive relationship depending on Equation (3), and finally, calculate the stress coupled damage under this cyclic loading;
- As a precondition for ensuring the calculation accuracy and saving computing time, this study adopts a jumping algorithm [28]. Take 1% of the fatigue life as the value of cycle increment and solve Equation (4) to calculate the damage increment ;
- Store the damage variable , substitute the cumulative value of damage into Equation (3) to solve the constitutive relationship, and update the damaging stress;
- End the iteration if the required number of cycles is reached.
3. Modeling
3.1. Simulation Program
3.2. Geometric Models
3.3. Model Development
4. Experimental Procedures
4.1. Materials
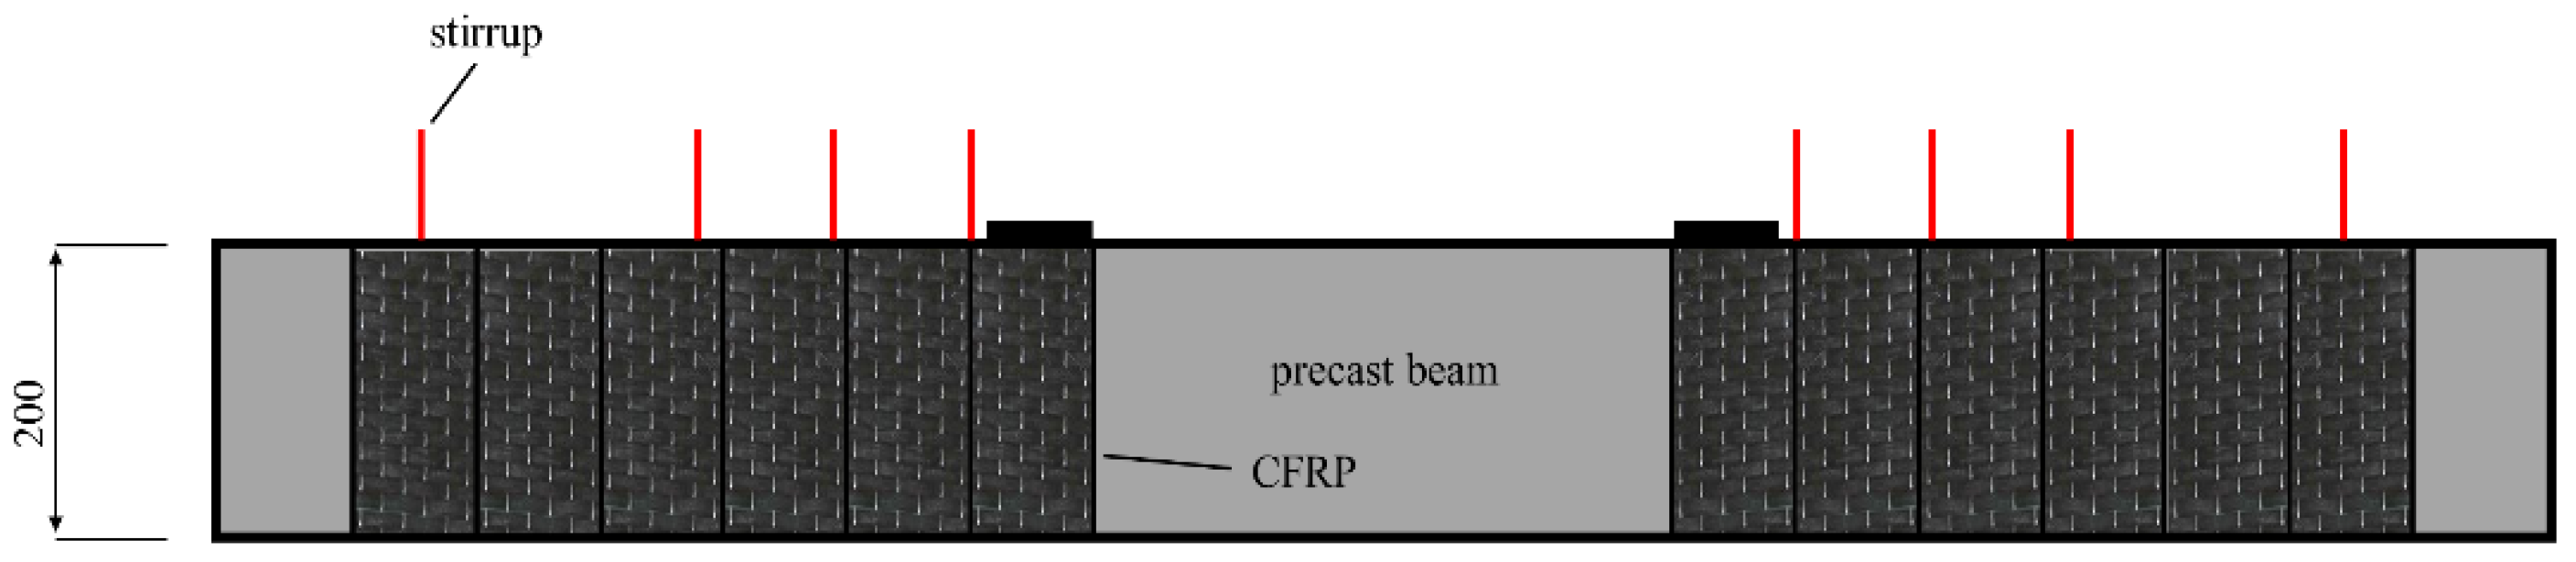
4.2. Section Design
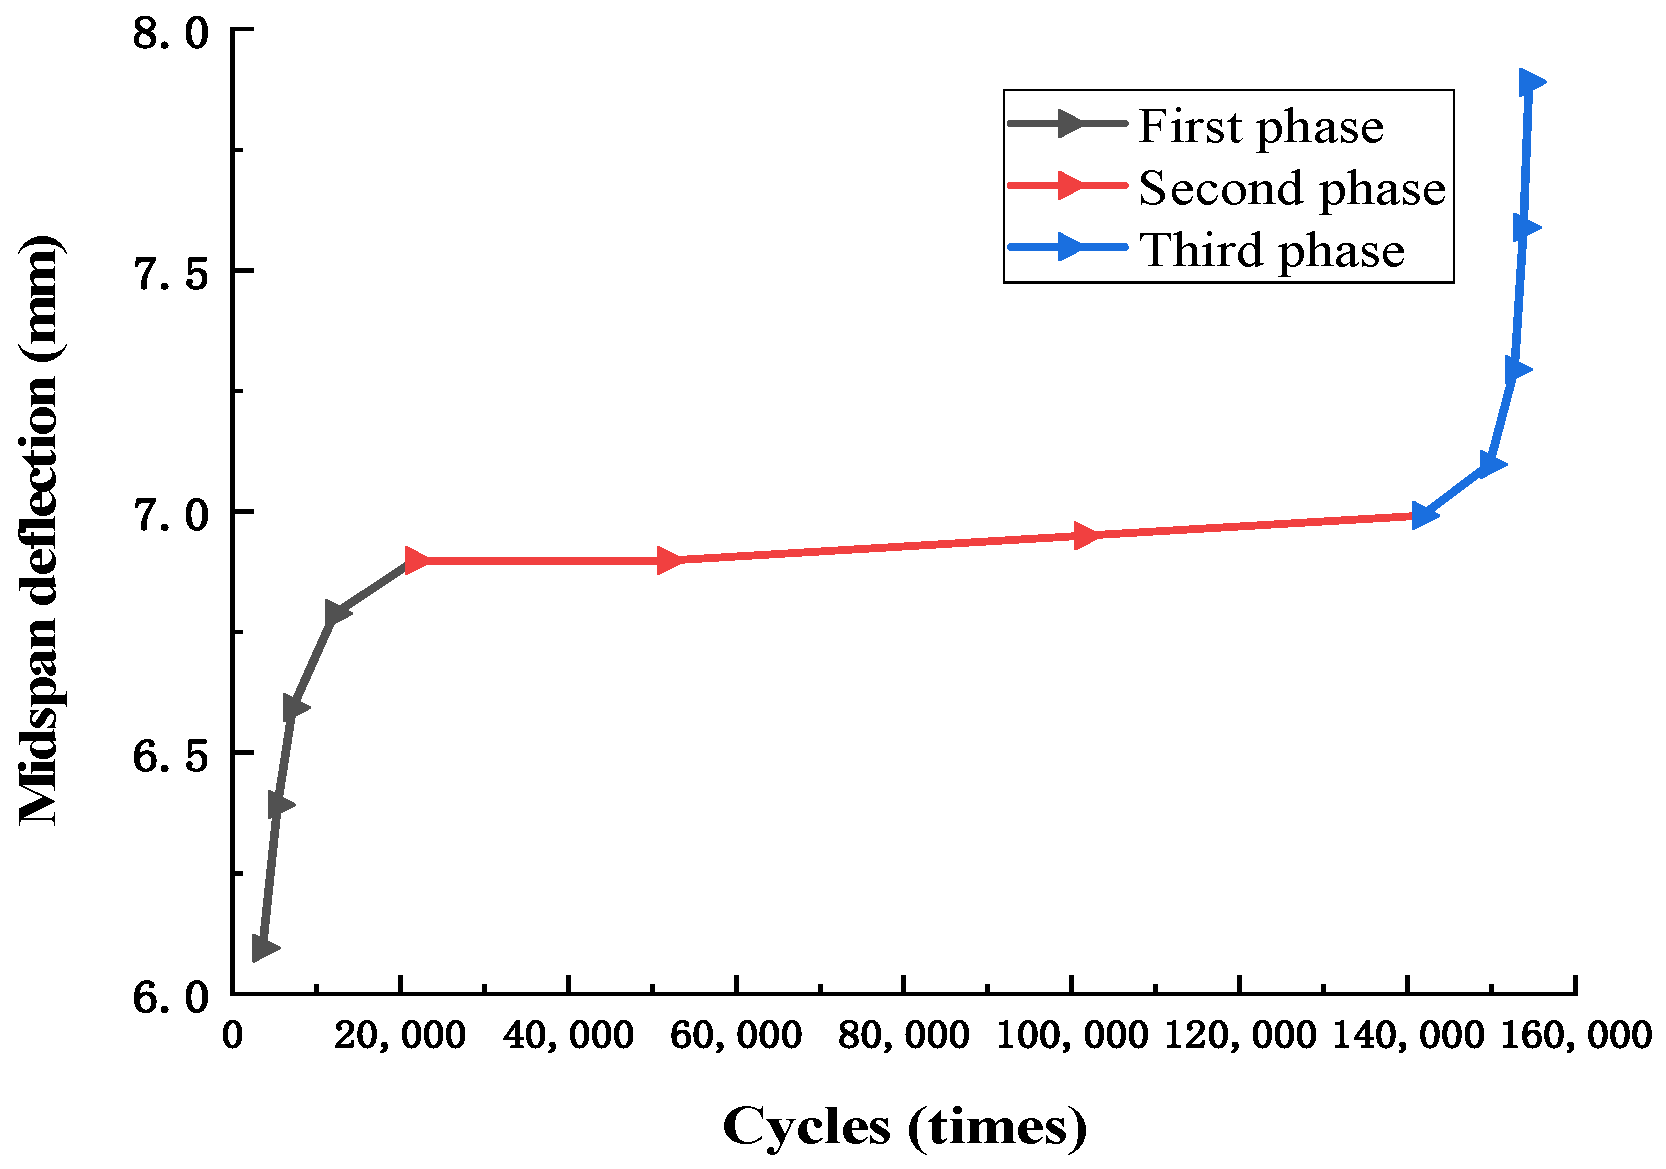
4.3. Introducing Fatigue Damage
4.4. Creep Experiments
4.4.1. Creep Test on Concrete Specimens
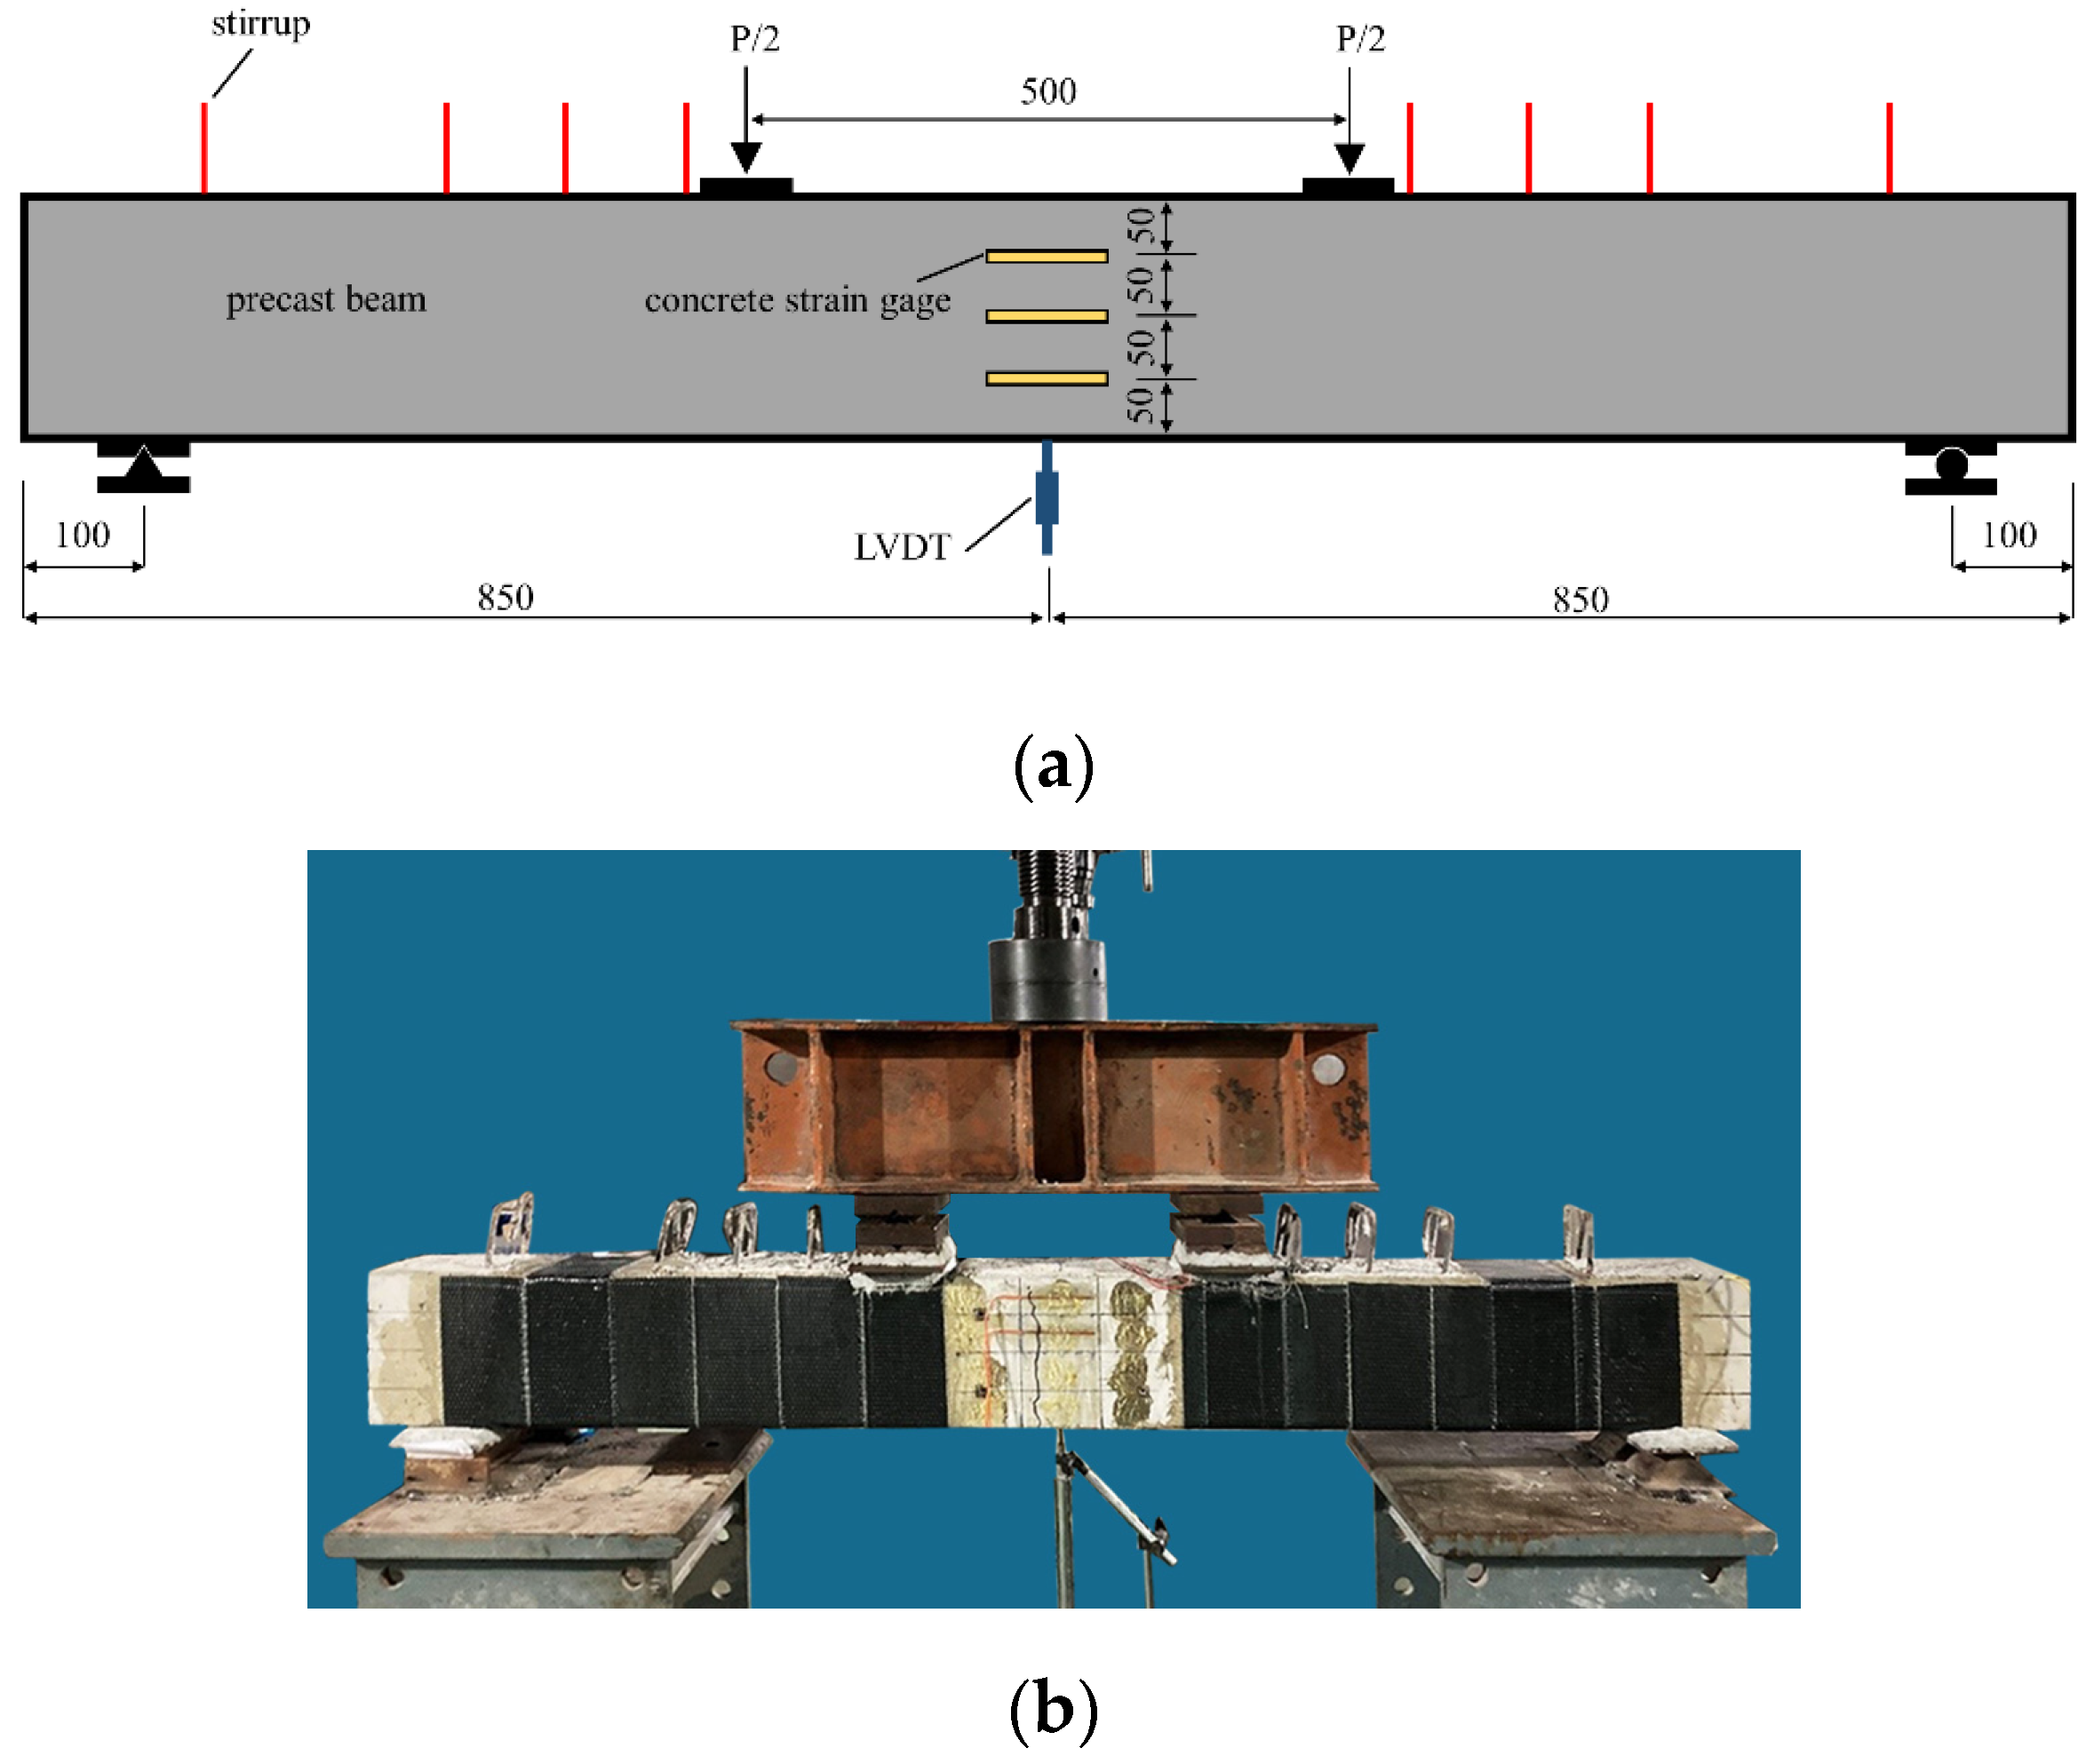
4.4.2. Creep Test on Strengthened Concrete Beams
5. Results
5.1. Material Parameters
5.2. Comparing Experimental Results with Numerical Data
5.2.1. Midspan Deflection
5.2.2. Stress on Cross Section
5.3. Fatigue damage
6. Discussion
6.1. Factors Influencing Damage Effect on Creep of Strengthened Beams
6.1.1. Stress Magnitude
6.1.2. Loading Age
6.2. Creep Effect of Strengthened Damaged Beams
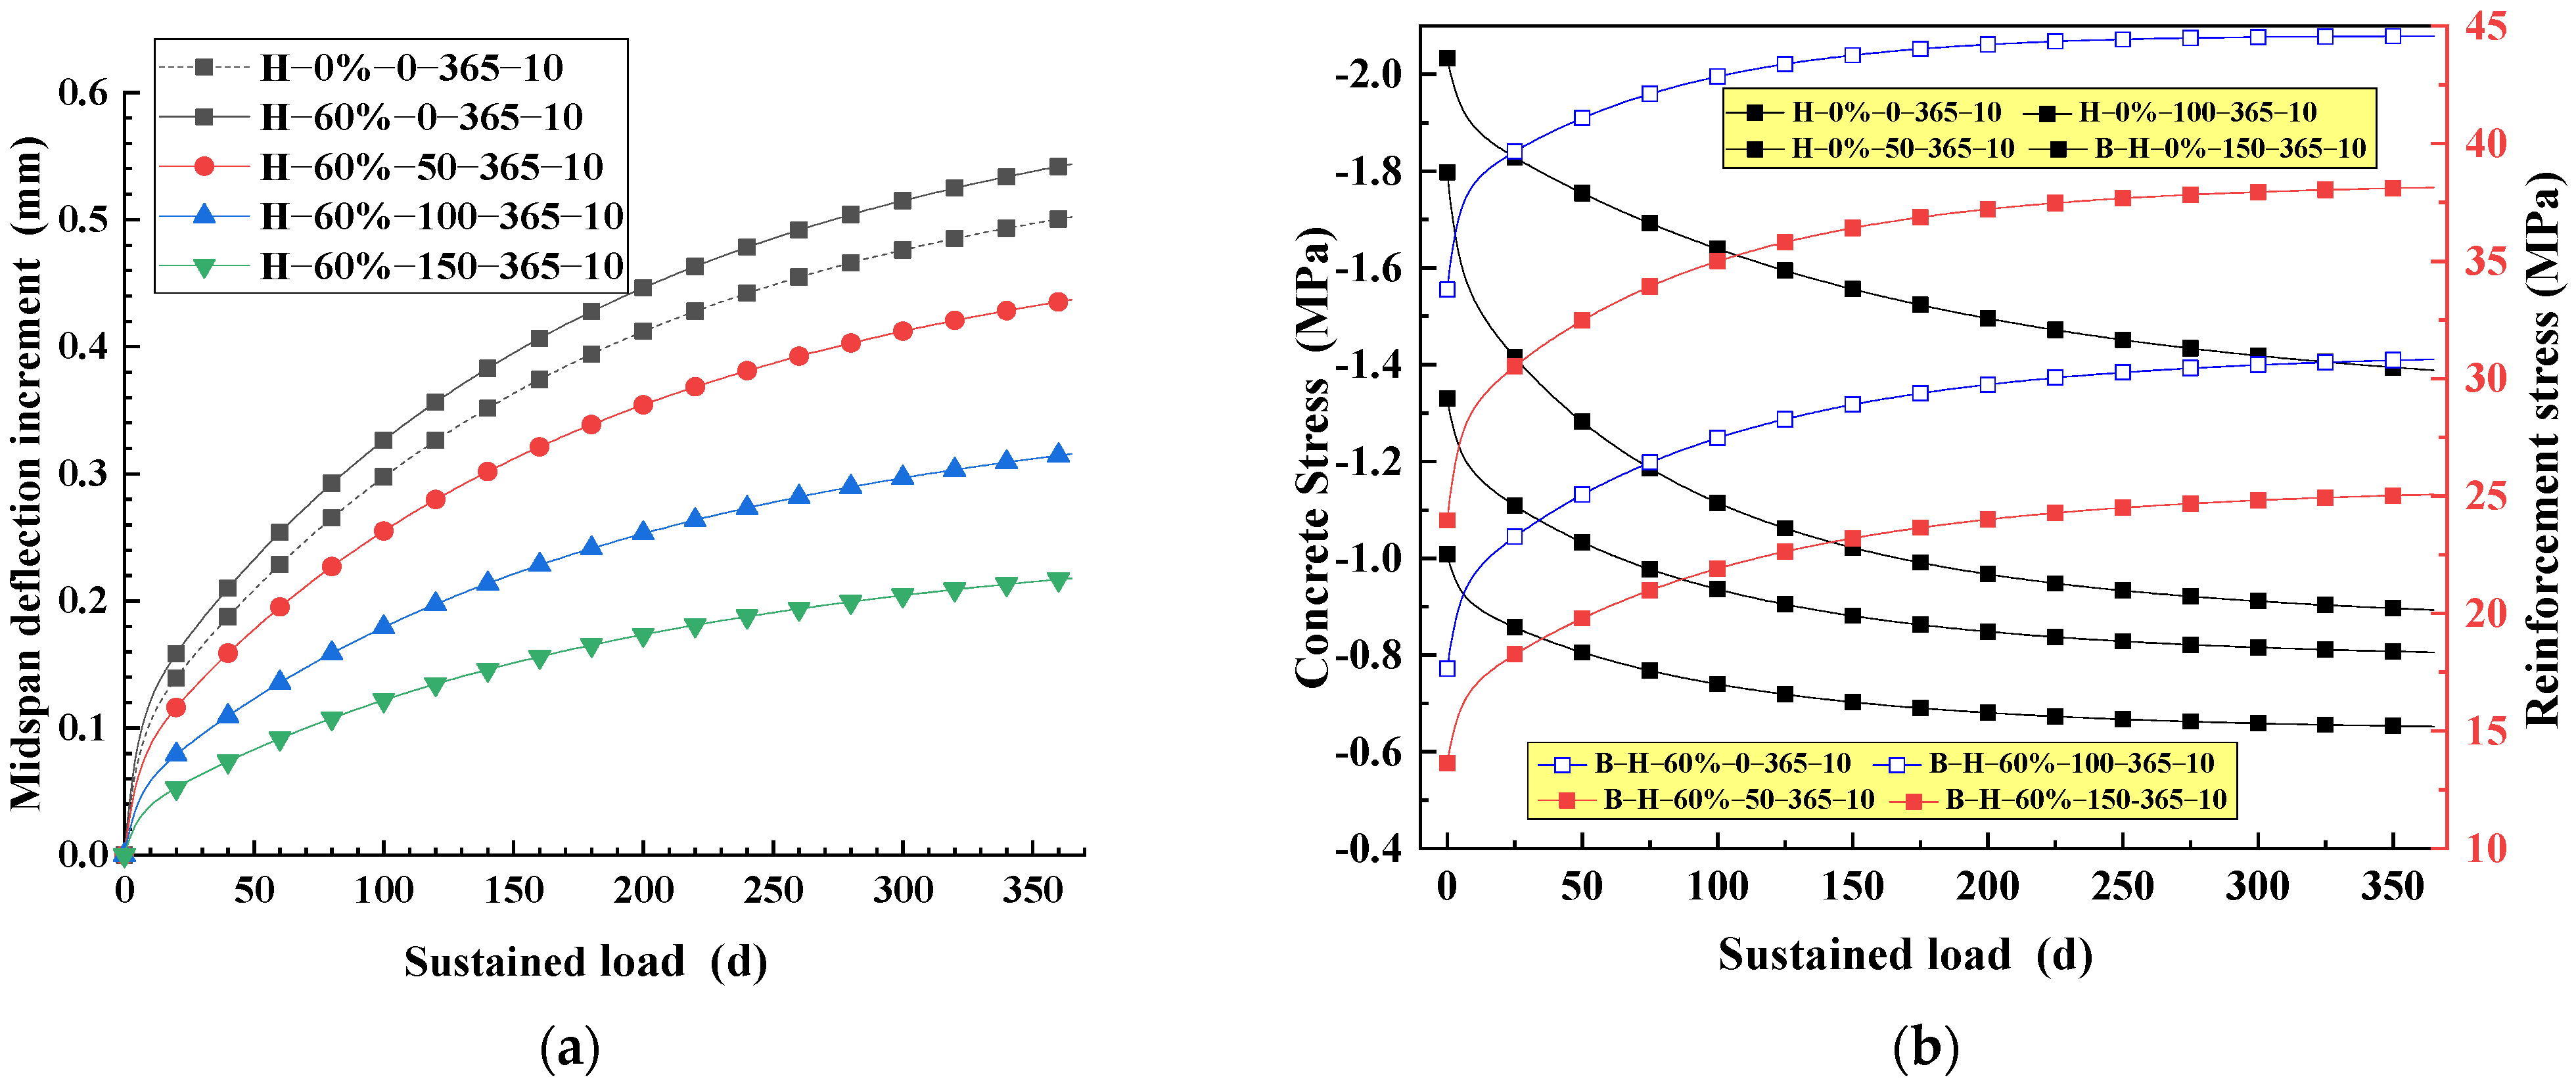
6.2.1. Under Positive Bending Moment
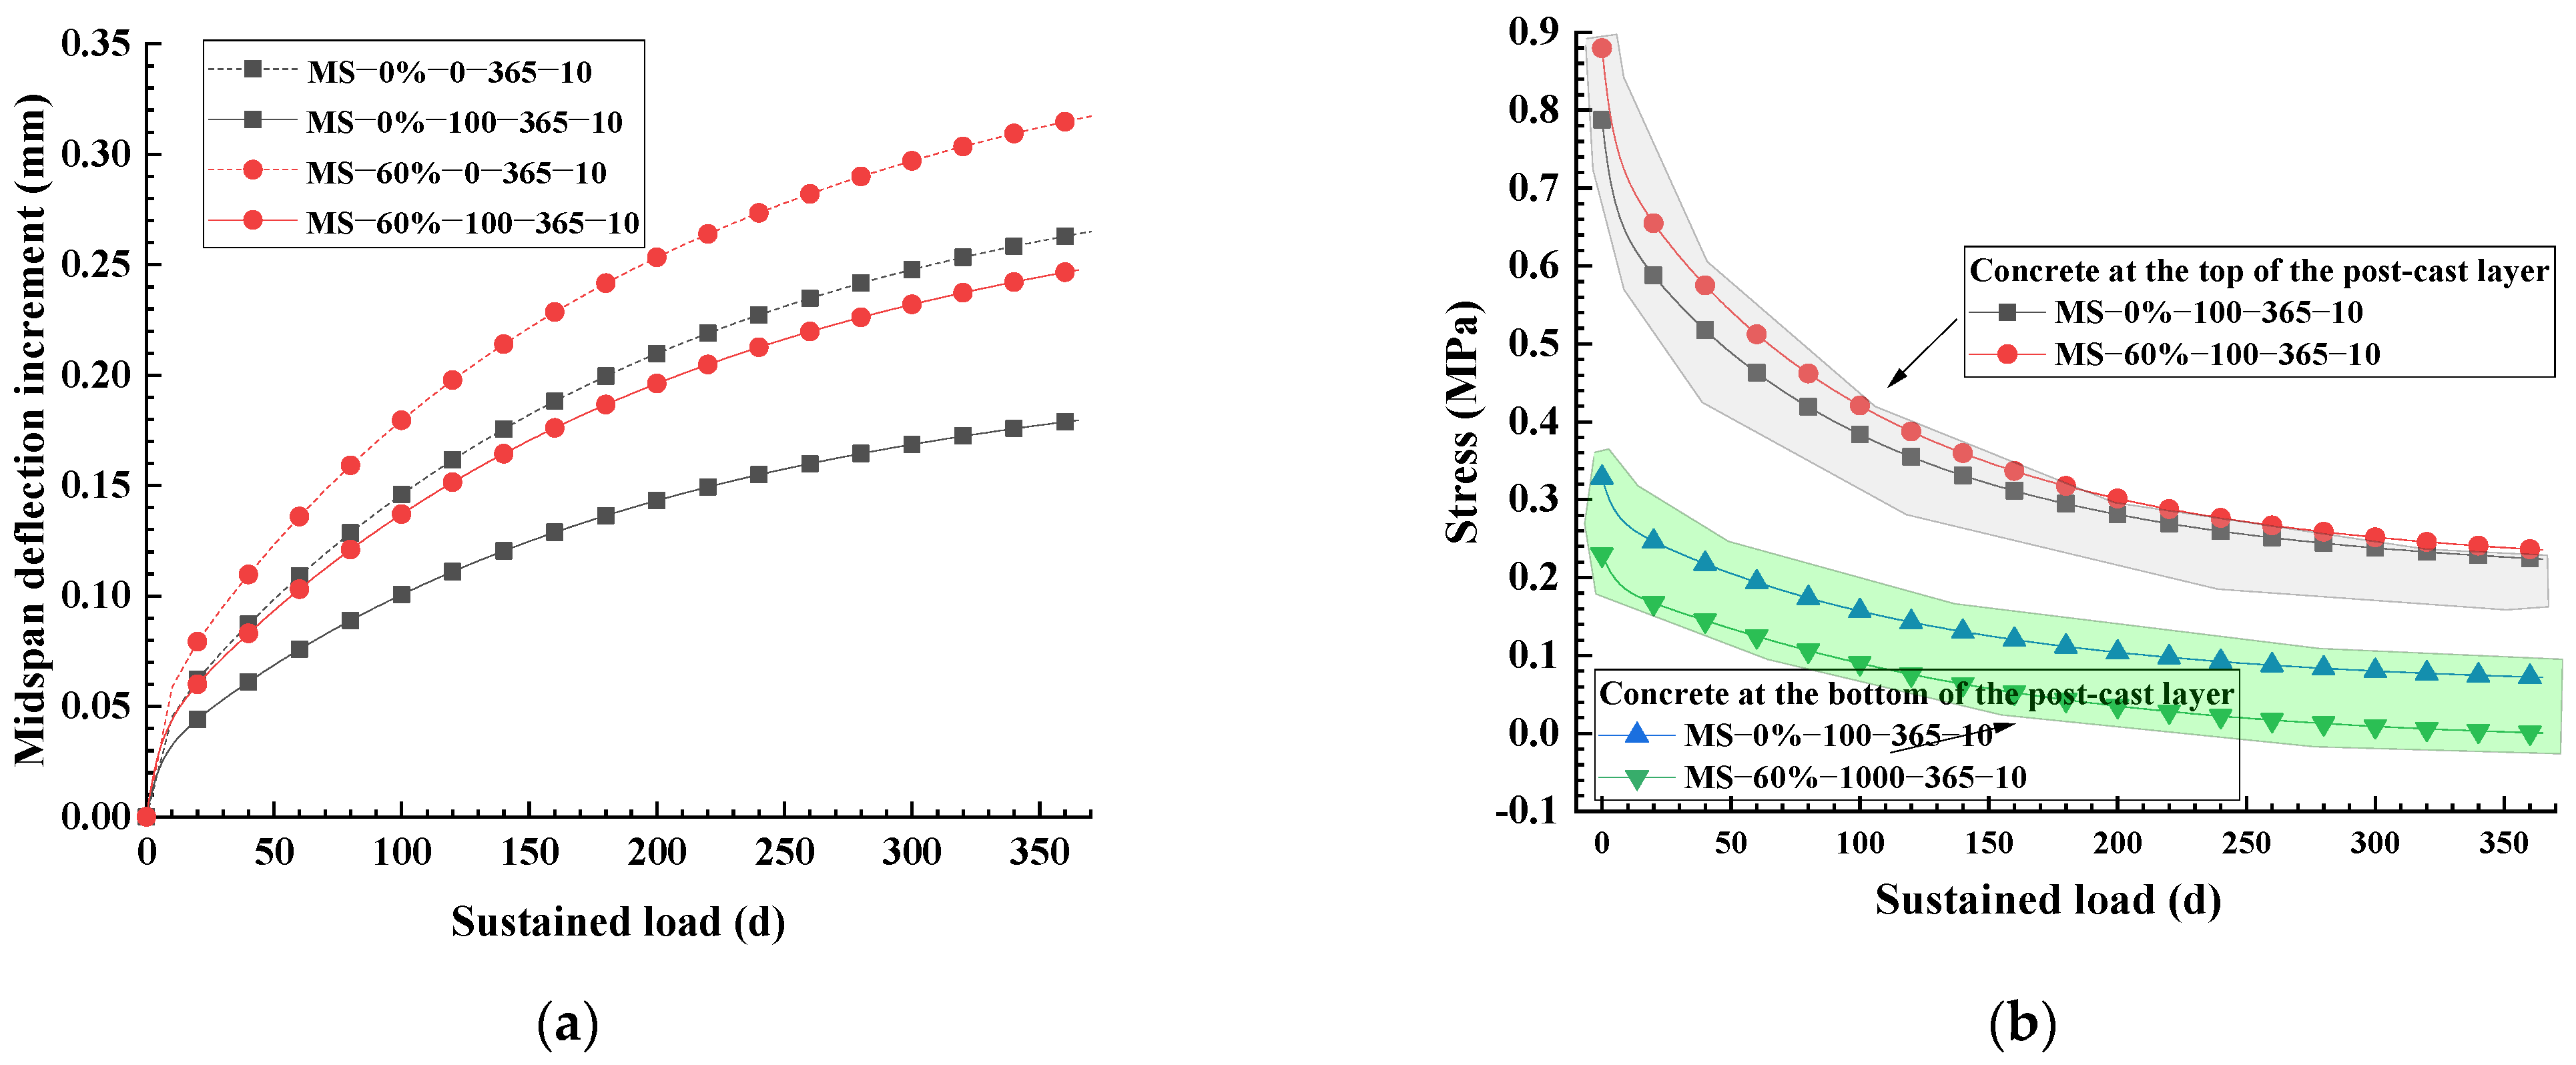
6.2.2. Under Negative Bending Moment
7. Conclusions
- On the basis of the principle of damage mechanics and strain equivalence, we established a creep structure of damaged concrete and proposed a numerical method for the creep effect of fatigue-damaged concrete components, which is suitable only for fatigue damage components but not for damage components, such as steel corrosion, concrete erosion, etc. The experimental results also validated the proposed model for the creep of damaged concrete components. The model could be used to forecast the creep deformation of undamaged components or damaged components after being strengthened, facilitating structural maintenance and decision-making about reinforcement.
- The mechanism for the influence of damage on the creep development of concrete beams was analyzed in conjunction with numerical calculations. The damage changed the stiffness of the cross section of the components and varied the stress state of the concrete in the cross section during loading, affecting the creep development of the concrete. Further, the creep of the components developed slowly as the age of the concrete increased.
- The undamaged beams were continuously loaded with 5 and 15 kN for 365 days, experiencing midspan deflections of 0.270 and 0.734 mm, respectively. When the load was elevated from 5 to 15 kN, the deflection enlarged by roughly 0.46 mm. The deflection of beam A-60%-100-365-10 and A-60%-100-3650-10 was 0.252 mm and 0.264 mm at the age of 365 and 3650 days, respectively. It increased by approximately 0.01 mm in 3285 days. Further, the stress magnitude had a more profound effect on the creep than the loading.
- The incremental creep deflection of the beams with a strengthened section height of 50, 100, and 150 mm loaded for 365 days decreased by 0.107, 0.228, and 0.326 mm, respectively, compared with the unstrengthened damaged beam. The method of reinforcing damaged beams with laminating post-cast part offered promising results in terms of controlling their creep deflection; in particular, increasing the section height had a profound effect. Moreover, this method excellently controlled the deflection of the damaged components under a negative bending moment.
8. Prospect
- This work investigated the impact of the creep of cracked concrete under low stress. For the nonlinear creep of damaged components at high stress levels, the initial damage to concrete may differ during the creep process. Thus, the nonlinear creep effect should be further investigated.
- This study focused on a single sort of damage, i.e., fatigue damage, and its influence on the creep effect of the component. However, in practice, multiple factors affect components’ creep. Therefore, further research on creep is required under the combined impact of factors, such as material flaws, load, and the environment.
Author Contributions
Funding
Data Availability Statement
Conflicts of Interest
References
- Chen, P.; Zhang, G.; Cao, S.; Lv, X.; Shen, B. Creep and post-creep mechanical properties of reinforced concrete columns. J. Build. Eng. 2023, 63, 105521. [Google Scholar] [CrossRef]
- Abdelrahman, A. Strengthening of Concrete Structures: Unified Design Approach, Numerical Examples and Case Studies, 1st ed.; Springer Nature: Singapore, 2023; pp. 115–141. [Google Scholar]
- Momayez, A.; Ehsani, M.; Rajaie, H.; Ramezanianpour, A. Cylindrical specimen for measuring shrinkage in repaired concrete members. Constr. Build. Mater. 2005, 19, 107–116. [Google Scholar] [CrossRef]
- Decter, M. Durable concrete repair—Importance of compatibility and low shrinkage. Constr. Build. Mater. 1997, 11, 267–273. [Google Scholar] [CrossRef]
- Chen, X. An Experimental Research on the Differential Shrinkage and Creep of Simply Supported Rectangular Prestressed Concrete Composite Beams. J. Wuhan Univ. Technol. 1981, 4, 55–84. [Google Scholar]
- Vassie, P.; TRRL. Reinforcement corrosion and the durability of concrete bridges. Proc. Inst. Civ. Eng. 1984, 76, 713–723. [Google Scholar] [CrossRef]
- Wang, W.-W.; Weng, C.; Yang, W. Experimental Study on Creep and Shrinkage of Old and New Concrete Composite Beams. J. Southeast Univ. (Nat. Sci. Ed.) 2008, 38, 505–510. [Google Scholar]
- Yang, W.; Xu, H. Practical Nonlinear Analysis Method of New-Old Concrete Composite Beams with Shrinkage and Creep. Mech. Eng. 2017, 39, 379–383. [Google Scholar] [CrossRef]
- Guo, Y.-L.; Geng, Y.; Qu, L.-Y. Time-dependent behaviour of circular steel tube confined reinforced concrete (STCRC) stub columns subjected to low axial load. Eng. Struct. 2021, 243, 112663. [Google Scholar] [CrossRef]
- Gilbert, R.I. Time-Dependent Analysis of Composite Steel-Concrete Sections. J. Struct. Eng. 1989, 115, 2687–2705. [Google Scholar] [CrossRef]
- Ayoub, A.; Filippou, F.C. Mixed Formulation of Nonlinear Steel-Concrete Composite Beam Element. J. Struct. Eng. 2000, 126, 371–381. [Google Scholar] [CrossRef]
- Nguyen, Q.-H.; Hjiaj, M. Nonlinear Time-Dependent Behavior of Composite Steel-Concrete Beams. J. Struct. Eng. 2016, 142, 04015175. [Google Scholar] [CrossRef]
- Fang, Y.; Mao, J.; Zhang, Y.; Jin, W.; Tang, D.; Zhang, J. Calculation of Deflection and Stress of Assembled Concrete Composite Beams under Shrinkage and Creep and Its Application in Member Design Optimization. KSCE J. Civ. Eng. 2021, 25, 3458–3476. [Google Scholar] [CrossRef]
- Henriques, D.; Gonçalves, R.; Sousa, C.; Camotim, D. GBT-based time-dependent analysis of steel-concrete composite beams including shear lag and concrete cracking effects. Thin-Walled Struct. 2020, 150, 106706. [Google Scholar] [CrossRef]
- Ferrier, E.; Hamelin, P. Durability of Reinforced Concrete Beams Repaired by Composites under Creep and Fatigue Loading. In Recent Developments in Durability Analysis of Composite Systems, 1st ed.; CRC Press: London, UK, 2000; pp. 279–289. Available online: https://www.taylorfrancis.com/chapters/edit/10.1201/9781003211181-37/durability-reinforced-concrete-beams-repaired-composites-creep-fatigue-loading-ferrier-hamelin (accessed on 1 April 2023).
- Farah, M.; Grondin, F.; Alam, S.; Loukili, A. Experimental approach to investigate creep-damage bilateral effects in concrete at early age. Cem. Concr. Compos. 2019, 96, 128–137. [Google Scholar] [CrossRef]
- Cao, G.-H.; Han, C.-C.; Peng, P.; Zhang, W.; Tang, H. Creep Test and Analysis of Concrete Columns under Corrosion and Load Coupling. ACI Struct. J. 2019, 116, 121–130. [Google Scholar] [CrossRef]
- Zhou, H.Y.; Chen, Y.B.; Ci, J.C.; Yang, C.K. Research Status of Fatigue Damage Mechanism of Reinforced Concrete Beam. Sci. Net 2017, 858, 44–49. Available online: https://www.scientific.net/amm.858.44 (accessed on 1 April 2023). [CrossRef]
- Kachanov, L.M.; Krajcinovic, D. Introduction to Continuum Damage Mechanics. J. Appl. Mech.-Trans. Asme-J. Appl. Mech. 1987, 54, 481. [Google Scholar] [CrossRef] [Green Version]
- Zhang, T.; McHugh, P.; Leen, S. Finite element implementation of multiaxial continuum damage mechanics for plain and fretting fatigue. Int. J. Fatigue 2012, 44, 260–272. [Google Scholar] [CrossRef]
- Van Do, V.N.; Lee, C.-H.; Chang, K.-H. High cycle fatigue analysis in presence of residual stresses by using a continuum damage mechanics model. Int. J. Fatigue 2015, 70, 51–62. [Google Scholar] [CrossRef]
- Bazant, Z.P. Discussion of L. F. Nielsen’s paper “On the applicability of modified dischinger equations”. Cem. Concr. Res. 1978, 8, 117–119. [Google Scholar] [CrossRef]
- Du, J.; Mao, C.; Si, T. Bridge Structure Analysis, 1st ed.; Tongji University Publishing: Shanghai, China, 1994; pp. 32–38. [Google Scholar]
- Xiao, R. Bridge Structure Analysis and Program System, 1st ed.; People’s Communications University Press: Beijing, China, 2002; pp. 10–17. [Google Scholar]
- Lemaitre, J. How to use damage mechanics. Nucl. Eng. Des. 1984, 80, 233–245. [Google Scholar] [CrossRef]
- Mai, S.; Le-Corre, F.; Foret, G.; Nedjar, B. A continuum damage modeling of quasi-static fatigue strength of plain concrete. Int. J. Fatigue 2012, 37, 79–85. [Google Scholar] [CrossRef] [Green Version]
- Zhu, B. An Implicit Method for the Stress Analysis of Concrete Structures Considering the Effect of Creep. J. Hydraul. Eng. 1983, 5, 40–46. Available online: http://en.cnki.com.cn/Article_en/CJFDTOTAL-SLXB198305004.htm (accessed on 1 April 2023).
- Zhan, Z.; Meng, Q.; Hu, W.; Sun, Y.; Shen, F.; Zhang, Y. Continuum damage mechanics based approach to study the effects of the scarf angle, surface friction and clamping force over the fatigue life of scarf bolted joints. Int. J. Fatigue 2017, 102, 59–78. [Google Scholar] [CrossRef]
- Boumakis, I.; Ninčević, K.; Marcon, M.; Vorel, J.; Wan-Wendner, R. Bond stress distribution in adhesive anchor systems: Interplay of concrete and mortar creep. Eng. Struct. 2021, 250, 113293. [Google Scholar] [CrossRef]
- Zhu, B. Temperature Stress and Temperature Control of Hydraulic Concrete Structures, 1st ed.; Water Resources and Electric Power Press: Beijing, China, 1976; pp. 137–184. [Google Scholar]
- GB50010-2010; Code for Design of Concrete Structures. China Architecture and Building Press: Beijing, China, 2010.
- Fan, Z.; Sun, Y. Detecting and evaluation of fatigue damage in concrete with industrial computed tomography technology. Constr. Build. Mater. 2019, 223, 794–805. [Google Scholar] [CrossRef]
- Pan, H.; Qiu,, H.X. Numerical Simulation of Fatigue Performance of Reinforced Concrete Flexural Components. J. Southeast Univ. (Nat. Sci. Ed.) 2006, 6, 997–1001. Available online: http://en.cnki.com.cn/Article_en/CJFDTOTAL–DNDX200606024.htm (accessed on 4 March 2023).
- Isleem, H.F.; Augustino, D.S.; Mohammed, A.S.; Najemalden, A.M.; Jagadesh, P.; Qaidi, S.; Sabri, M.M.S. Finite element, analytical, artificial neural network models for carbon fibre reinforced polymer confined concrete filled steel columns with elliptical cross sections. Front. Mater. 2023, 9, 1115394. [Google Scholar] [CrossRef]
- Hawileh, R.; Nawaz, W.; Abdalla, J.; Saqan, E. Effect of flexural CFRP sheets on shear resistance of reinforced concrete beams. Compos. Struct. 2015, 122, 468–476. [Google Scholar] [CrossRef]
- Kim, Y.J.; Harries, K.A. Fatigue behavior of damaged steel beams repaired with CFRP strips. Eng. Struct. 2011, 33, 1491–1502. [Google Scholar] [CrossRef]
- GB 503672013; Code for Design of Reinforcement of Concrete Structures. China Industry Press: Beijing, China, 2013.
- Isleem, H.F.; Jagadesh, P.; Qaidi, S.; Althoey, F.; Rahmawati, C.; Najm, H.M.; Sabri, M.M.S. Finite element and theoretical investigations on PVC–CFRP confined concrete columns under axial compression. Front. Mater. 2022, 9, 1055397. [Google Scholar] [CrossRef]
- Li, L.; Guo, Y.; Liu, F.; Bungey, J. An experimental and numerical study of the effect of thickness and length of CFRP on performance of repaired reinforced concrete beams. Constr. Build. Mater. 2006, 20, 901–909. [Google Scholar] [CrossRef]
- Ying, J.; Guo, J. Fracture Behaviour of Real Coarse Aggregate Distributed Concrete under Uniaxial Compressive Load Based on Cohesive Zone Model. Materials 2021, 14, 4314. [Google Scholar] [CrossRef] [PubMed]
- Tang, D.; Jin, W.; Mao, J.; Zhao, Y. Influence of Shrinkage and Creep on Deflections of Assembled Concrete Composite Beams. J. Civ. Environ. Eng. 2019, 41, 127–134, (In English and Chinese). [Google Scholar]
- Ma, Z.; Shen, J.; Wang, C.; Wu, H. Characterization of sustainable mortar containing high-quality recycled manufactured sand crushed from recycled coarse aggregate. Cem. Concr. Compos. 2022, 132, 104629. [Google Scholar] [CrossRef]
- Cagnon, H.; Vidal, T.; Sellier, A.; Bourbon, X.; Camps, G. Drying creep in cyclic humidity conditions. Cem. Concr. Res. 2015, 76, 91–97. [Google Scholar] [CrossRef]
- Huixiang, M.; Zhigang, L.; Zhang, Y.; Haoran, X. Research on the Bearing Capacity of the Cross Section of Reinforced Concrete Beams Strengthened with Increasing Section Method Considering the Effect of the Second Loading. Adv. Res. 2015, 5, 1–9. [Google Scholar] [CrossRef]
- Hui, R.; Huang, G.; Yi, R. Shrinkage Creep, 1st ed.; China Railway Press: Beijing, China, 1988; pp. 236–312. [Google Scholar]
- Liu, Z.; Zheng, X. An Analysis of the Section-Enlarging Reinforcing Method for Concrete. Traffic Eng. Technol. Natl. Def. 2006, 4, 68–70. Available online: http://en.cnki.com.cn/Article_en/CJFDTOTAL-GFJT200604021.htm (accessed on 1 April 2023).


| Numerical Simulation Component Number | Fatigue Cycle (%Nmax) | Height of Post-Cast Layer (mm) | Loading Age (d) | Load (kN) |
|---|---|---|---|---|
| F | 0%, 2%, 10%, 60% | 0, 100 | 80 | 10 |
| ST | 0% | 0 | 365 | 5, 10, 15 |
| A | 0%, 60% | 100 | 365, 1000, 3650 | 10 |
| H | 0%, 60% | 0, 50, 100, 150 | 365 | 10 |
| MS | 0%, 60% | 0, 100 | 365 | 10 |
| Ingredient | Water | Cement | Fine Aggregate | Coarse Aggregate |
|---|---|---|---|---|
| Value (kg/m3) | 210 | 382 | 651 | 1157 |
| Type | Yield Strength (MPa) | Ultimate Strength (MPa) | Young’s Modulus (GPa) |
|---|---|---|---|
| HPB300 | 300 | 446 | 206 |
| HRB400 | 465 | 612 | 195 |
| Stress State | |||||||
|---|---|---|---|---|---|---|---|
| Tension | 0.0 | 0.0 | 0.667 | 0.85 | 26.0 | 11.0 | |
| Compression | 6.0 | 0.7 | 1.3 | 0.9 | 22.0 | 10.0 |
| Parameter | ||||||||
|---|---|---|---|---|---|---|---|---|
| Value | 1.94/E | 17.848/E | 0.45 | 0.003 | 0.67/E | 1.139/E | 0.45 | 0.1 |
Disclaimer/Publisher’s Note: The statements, opinions and data contained in all publications are solely those of the individual author(s) and contributor(s) and not of MDPI and/or the editor(s). MDPI and/or the editor(s) disclaim responsibility for any injury to people or property resulting from any ideas, methods, instructions or products referred to in the content. |
© 2023 by the authors. Licensee MDPI, Basel, Switzerland. This article is an open access article distributed under the terms and conditions of the Creative Commons Attribution (CC BY) license (https://creativecommons.org/licenses/by/4.0/).
Share and Cite
Ding, Y.; Fang, Y.; Jin, W.; Zhang, J.; Li, B.; Mao, J. Numerical Method for Creep Analysis of Strengthened Fatigue-Damaged Concrete Beams. Buildings 2023, 13, 968. https://doi.org/10.3390/buildings13040968
Ding Y, Fang Y, Jin W, Zhang J, Li B, Mao J. Numerical Method for Creep Analysis of Strengthened Fatigue-Damaged Concrete Beams. Buildings. 2023; 13(4):968. https://doi.org/10.3390/buildings13040968
Chicago/Turabian StyleDing, Yunfei, Yan Fang, Weiliang Jin, Jun Zhang, Bixiong Li, and Jianghong Mao. 2023. "Numerical Method for Creep Analysis of Strengthened Fatigue-Damaged Concrete Beams" Buildings 13, no. 4: 968. https://doi.org/10.3390/buildings13040968