
Barriers to Energy Efficiency: Low-Income Households in Australia


Abstract
:1. Introduction
2. Energy Efficiency Barriers
2.1. Financial Barriers
2.2. Information Barriers
2.3. Decision-Making Barriers
2.4. Split Incentives Barrier
3. Research Methodology
3.1. Questionnaire Design
3.2. Participants and Procedures
3.3. Data Analysis
4. Analysis Results
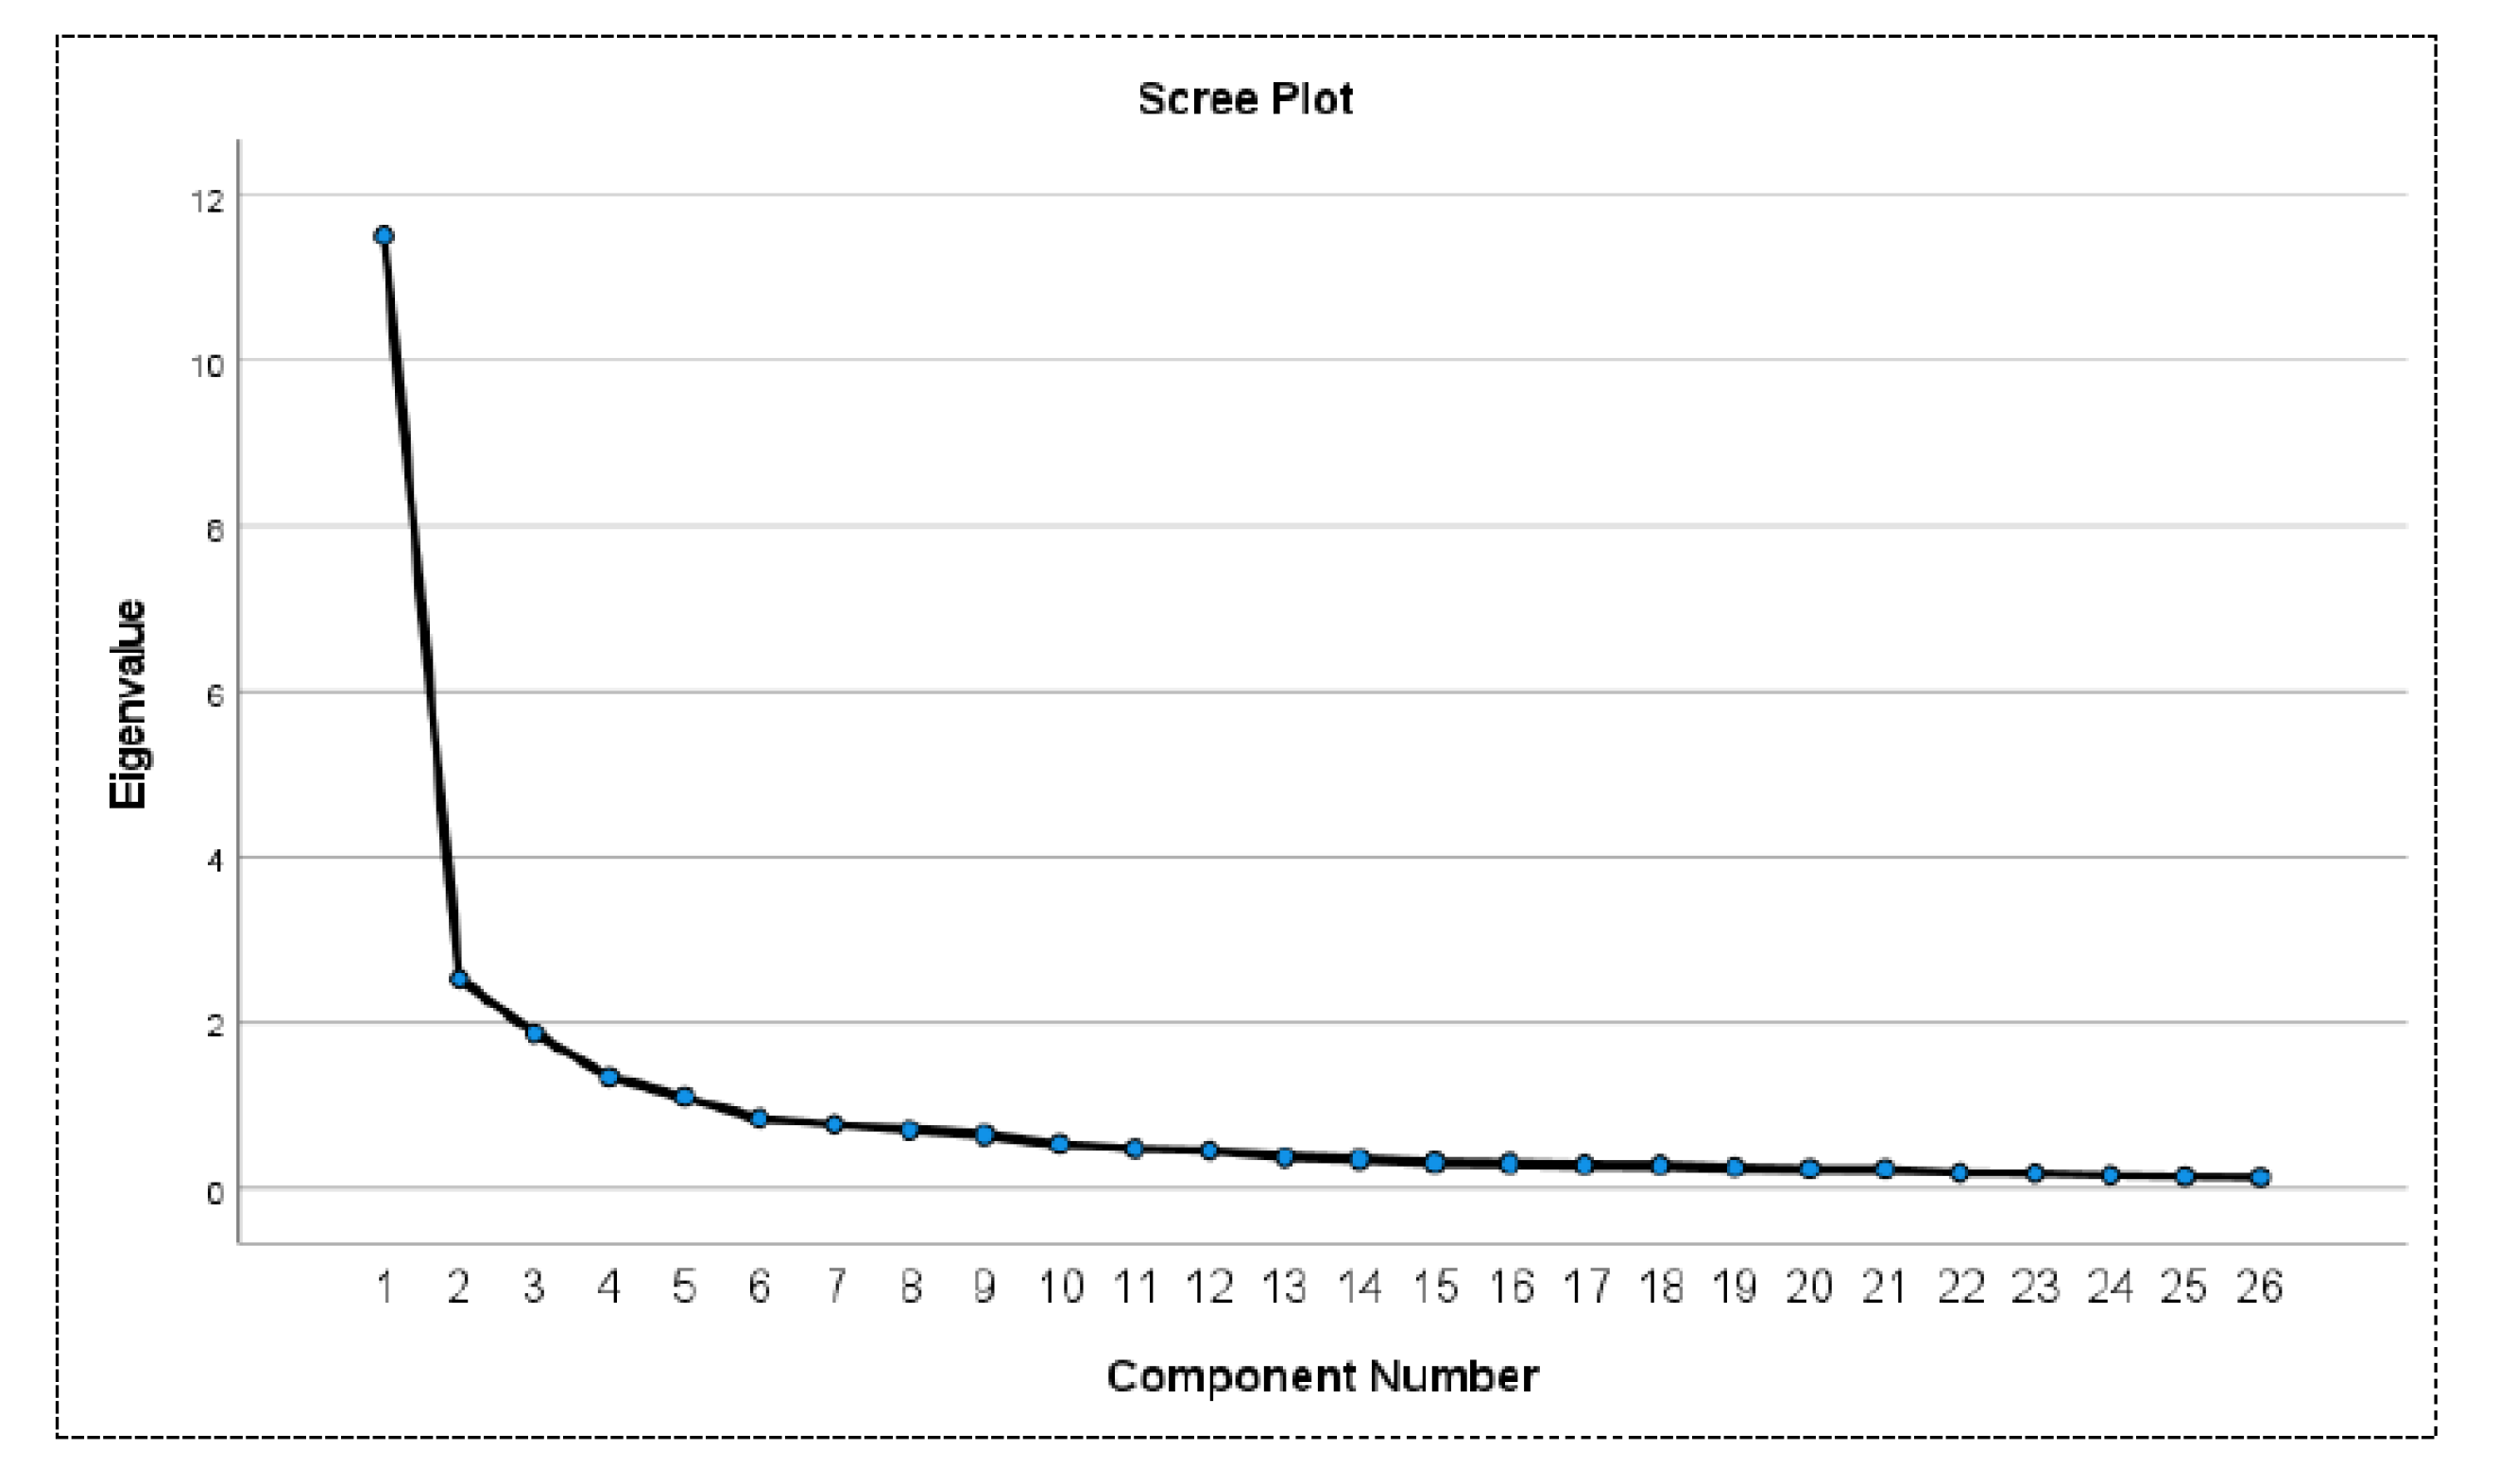
4.1. EFA Results
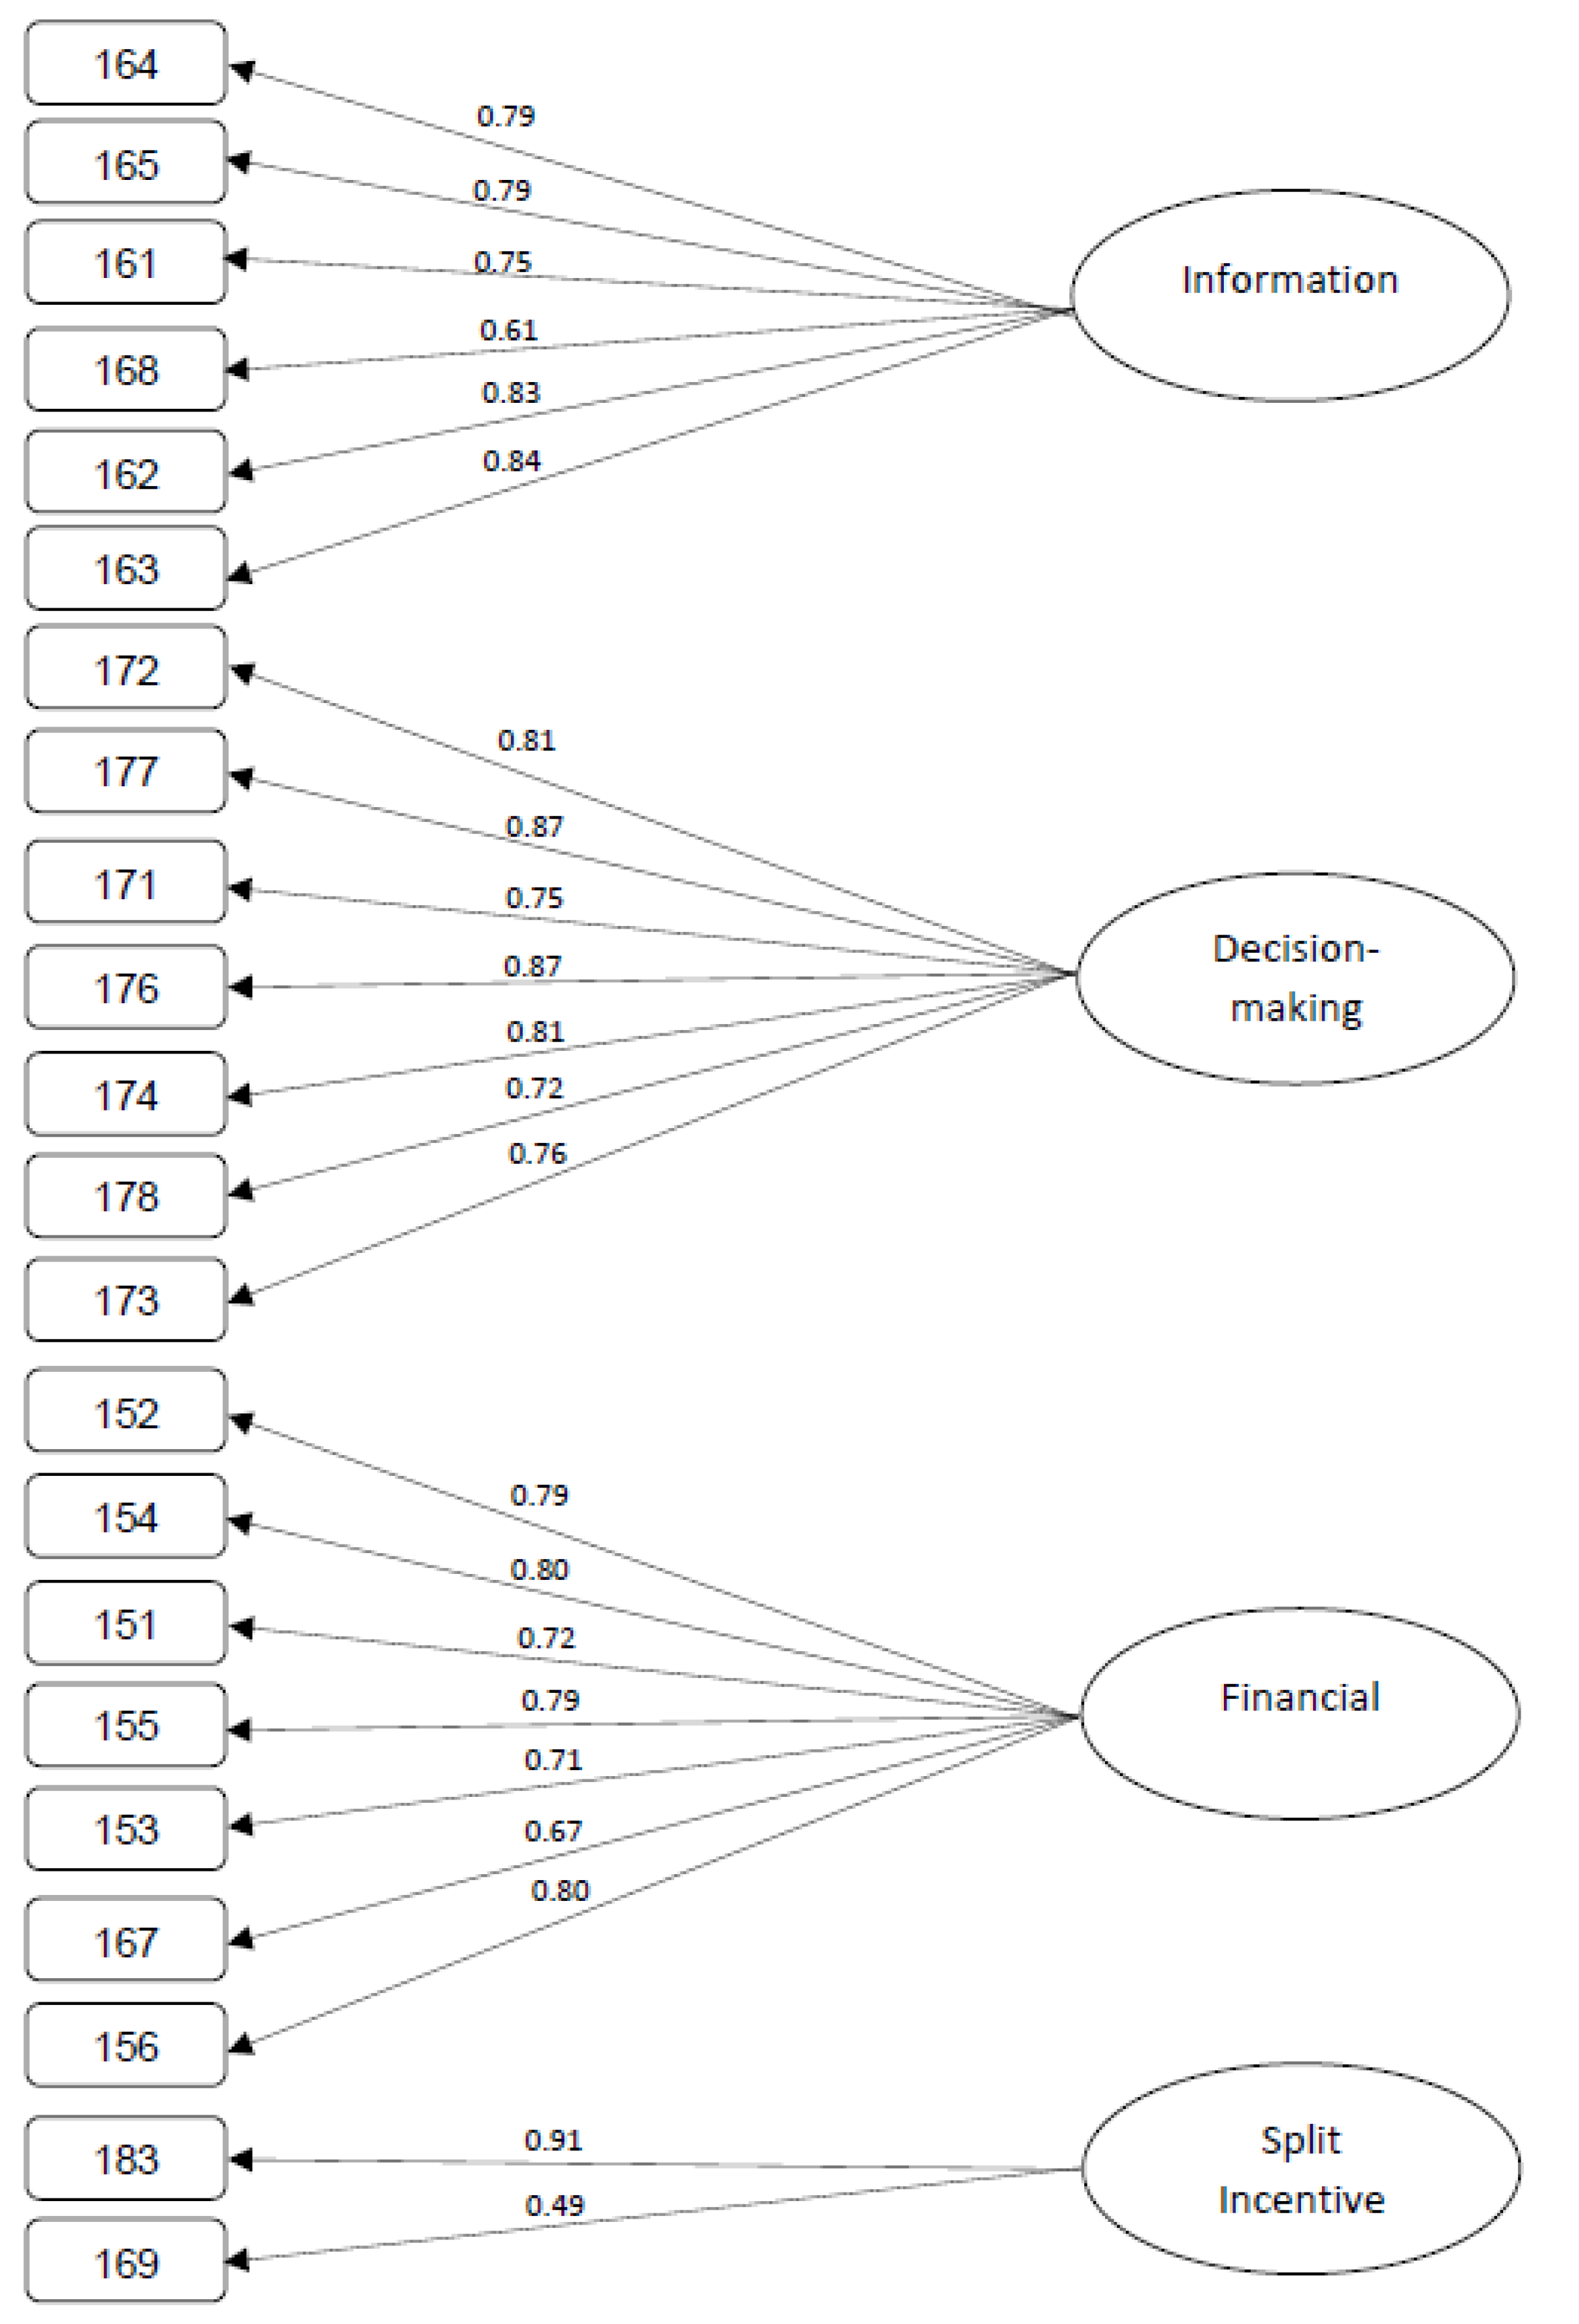
4.2. Empirically Tested CFA Model
5. Discussion
5.1. Financial
5.2. Decision-Making
5.3. Split Incentives
5.4. Information
6. Conclusions, Limitations, and Recommendations
Author Contributions
Funding
Data Availability Statement
Acknowledgments
Conflicts of Interest
Appendix A

| How much do the following points influence your decision to adopt energy efficiency? (Such as energy-saving renovations, purchasing energy-efficient appliances, and adoption of renewable energy.) Please choose the appropriate box. | |||||
|---|---|---|---|---|---|
| Very High Impact | High Impact | Moderate Impact | Low Impact | Very Low Impact | |
| High upfront cost | |||||
| Immediate loss for delayed gains | |||||
| Lack of incentives, subsidies from government | |||||
| Lack of saving | |||||
| Hidden cost | |||||
| Financial risks | |||||
| Lack of awareness or skepticism of existing resources | |||||
| Misperceptions about energy costs | |||||
| Doubts about cost-saving outcomes | |||||
| Unavailability of relevant information on efficiency measures | |||||
| Lack of trust in available information | |||||
| Lack of information about energy efficiency programs | |||||
| Lack of support for low-income or vulnerable households | |||||
| Lack of marketing campaigns | |||||
| Uncertainty about the period of residence at a particular dwelling | |||||
| Disruption that comes along with conducting renovations in the home to adopt energy efficiency | |||||
| Measure implementation comes with too much stress | |||||
| Doubts about the contractor’s reliability | |||||
| Technical risk | |||||
| Doubts about the costs of transaction | |||||
| The stress that comes along with making irreversible and complicated decisions | |||||
| Periods of transition in the household life cycle | |||||
| Households’ social communication behavior as a particular type of personal influence | |||||
| Physical distance from resources | |||||
| Difficulty to access professional services | |||||
| Landlord’s unwillingness to adopt efficiency measures | |||||
References
- Liu, E.; Judd, B.; Santamouris, M. Challenges in transitioning to low carbon living for lower income households in Australia. Adv. Build. Energy Res. 2019, 13, 49–64. [Google Scholar] [CrossRef] [Green Version]
- Ding, G. Strategies for Sustainable Housing Development-The Challenges from Renewable Energy. International Journal for Housing Science and Its Applications: Housing Planning. 2013. Available online: http://www.housingscience.org/html/publications/pdf/37-4-5.pdf (accessed on 5 December 2021).
- Fenner, A.E.; Kibert, C.J.; Woo, J.; Morque, S.; Razkenari, M.; Hakim, H.; Lu, X. The carbon footprint of buildings: A review of methodologies and applications. Renew. Sustain. Energy Rev. 2018, 94, 1142–1152. [Google Scholar]
- MacDonald, S.; Winner, B.; Smith, L.; Juillerat, J.; Belknap, S. Bridging the rural efficiency gap: Expanding access to energy efficiency upgrades in remote and high energy cost communities. Energy Effic. 2020, 13, 503–521. [Google Scholar] [CrossRef] [Green Version]
- Hall, N.; Romanach, L.; Cook, S.; Meikle, S. Increasing energy-saving actions in low income households to achieve sustainability. Sustainability 2013, 5, 4561–4577. [Google Scholar] [CrossRef] [Green Version]
- Pape, A. Energy Efficiency & People on Low Incomes; Australian Council of Social Service: Surry Hills, Australia, 2013. [Google Scholar]
- Raissi, S.; Reames, T.G. “If we had a little more flexibility.” perceptions of programmatic challenges and opportunities implementing government-funded low-income energy efficiency programs. Energy Policy 2020, 147, 111880. [Google Scholar]
- Abrahamse, W.; Steg, L.; Vlek, C.; Rothengatter, T. A review of intervention studies aimed at household energy conservation. J. Environ. Psychol. 2005, 25, 273–291. [Google Scholar]
- Pierce, J.; Schiano, D.; Paulos, E. Home, habits, and energy: Examining domestic interactions and energy consumption. In Proceedings of the SIGCHI Conference on Human Factors in Computing Systems, Association for Computing Machinery, Atanta, Georgia, 10–15 April 2010; pp. 1985–1994. [Google Scholar]
- Sorrell, S.; O’Malley, E.; Schleich, J.; Scott, S. The Economics of Energy Efficiency: Barriers to Cost-Effective Investment; Edward Elgar: Cheltenham, Australia, 2004. [Google Scholar]
- O’Malley, E.; Scott, S.; Sorrell, S. Barriers to Energy Efficiency: Evidence from Selected Sectors; Economic and Social Research Institute (ESRI): Dublin, Ireland, 2003. [Google Scholar]
- Sorrell, S.; Schleich, J.; Scott, S.; O’Malley, E.; Trace, F.; Boede, U.; Ostertag, K.; Radgen, P. Reducing Barriers to Energy Efficiency in Public and Private Organizations; Science and Policy Technology Research (SPRU), University of Sussex: Sussex, UK, 2000. [Google Scholar]
- Wilson, C.; Crane, L.; Chryssochoidis, G. Why do homeowners renovate energy efficiently? Contrasting perspectives and implications for policy. Energy Res. Soc. Sci. 2015, 7, 12–22. [Google Scholar] [CrossRef] [Green Version]
- Murphy, L. The influence of energy audits on the energy efficiency investments of private owner-occupied households in the Netherlands. Energy Policy 2014, 65, 398–407. [Google Scholar] [CrossRef]
- Gynther, L.; Mikkonen, I.; Smits, A. Evaluation of European energy behavioural change programmes. Energy Effic. 2012, 5, 67–82. [Google Scholar]
- Ameli, N.; Brandt, N. Determinants of households’ investment in energy efficiency and renewables: Evidence from the OECD survey on household environmental behaviour and attitudes. Environ. Res. Lett. 2015, 10, 044015. [Google Scholar] [CrossRef]
- Bukarica, V.; Tomšić, Ž. Energy efficiency policy evaluation by moving from techno-economic towards whole society perspective on energy efficiency market. Renew. Sustain. Energy Rev. 2017, 70, 968–975. [Google Scholar] [CrossRef]
- Australian Bureau of Statistics (ABS). The Survey of Income and Housing Australian Government. 2021. Available online: https://www.abs.gov.au/statistics/detailed-methodology-information/concepts-sources-methods/survey-income-and-housing-user-guide-australia/latest-release (accessed on 5 December 2021).
- Australian Taxation Office. Rental Expenses You Can Claim Now. 2022. Available online: https://www.ato.gov.au/Individuals/Investments-and-assets/Residential-rental-properties/Rental-expenses-to-claim/Rental-expenses-you-can-claim-now/ (accessed on 5 December 2021).
- DeVellis, R. Scale Development: Theory and Applications: Theory and Application; Sage: Thousand Okas, CA, USA, 2003. [Google Scholar]
- Nunnally, J.; Bernstein, L. Psychometric Theory; McGraw-Hill Higher, INC: New York, NY, USA, 1994. [Google Scholar]
- Green, S.; Lissitz, R.; Mulaik, S. Limitations of coefficient alpha as an index of test unidimensionlity. Educ. Psychol. Meas. 1977, 37, 827–838. [Google Scholar]
- Spector, P.E. Summated Rating Scale Construction: An Introduction Sage University Papers Series. Quantitative Applications in the Social Sciences; No. 07-082; Sage Publications, Inc.: Thousand Okas, CA, USA, 1992. [Google Scholar]
- Vaske, J.J. Survey Research and Analysis: Applications in Parks, Recreation and Human Dimensions; Venture: State College, PA, USA, 2008. [Google Scholar]
- Hair, J.F.; Black, W.C.; Babin, B.J.; Anderson, R.E. Multivariate Data Analysis, 7th ed.; Pearson Education Limited: London, UK, 2009. [Google Scholar]
- Australian Bureau of Statistics (2019–2020). Household Income and Wealth, Australia. Available online: https://www.abs.gov.au/statistics/economy/finance/household-income-and-wealth-australia/2019-20 (accessed on 7 March 2023).
- Yong, A.G.; Pearce, S. A Beginner’s Guide to Factor Analysis: Focusing on Exploratory Factor Analysis. Tutor. Quant. Methods Psychol. 2013, 9, 79–94. [Google Scholar] [CrossRef] [Green Version]
- Guadagnoli, E.; Velicer, W.F. Relation to sample size to the stability of component patterns. Psychol. Bull. 1988, 103, 265–275. [Google Scholar] [CrossRef]
- Costello, A.B.; Osborne, J.W. Best practices in exploratory factor analysis: Four recommendations for getting the most from your analysis. Practical Assessment. Res. Eval. 2005, 10, 7. [Google Scholar]
- Field, A. Discovering Statistics Using SPSS: Introducing Statistical Method, 3rd ed.; Sage Publications: Thousand Oaks, CA, USA, 2009. [Google Scholar]
- Tabachnick, B.G.; Fidell, L.S. Using Multivariate Statistics, 5th ed.; Allyn & Bacon: Boston, MA, USA, 2007. [Google Scholar]
- Pallant, J. SPSS Survival Manual: A Step by Step Guide to Data Analysis for Windows, 3rd ed.; Open Univ.: Maidenhead, UK, 2007. [Google Scholar]
- Cattell, R.B. The Scientific Use of Factor Analysis in Behavior and Life Sciences; Plenum: New York, NY, USA, 1978. [Google Scholar]
- Hon, C.K.H.; Chan, A.P.C.; Yam, M.C.H. Determining safety climate factors in the repair, maintenance, minor alteration, and addition sector of Hong Kong. J. Constr. Eng. Manag. ASCE 2013, 139, 519–528. [Google Scholar]
- Kline, R.B. Principles and Practice of Structural Equation Modeling, 4th ed.; The Guilford Press: New York, NY, USA, 2016. [Google Scholar]
- Ullman, J.B. Structural equation modeling: Reviewing the basics and moving forward. J. Personal. Assess. 2006, 87, 35–50. [Google Scholar]
- Browne, M.W.; Cudeck, R. Alternative ways of assessing modelfit. In Testing Structural Models; Bollen, K.A., Long, J.S., Eds.; Sage: Newbury Park, CA, USA, 1993; pp. 35–57. [Google Scholar]
- Hu, L.T.; Bentler, P.M. Evaluating model fit. In Structural Equation Modeling: Concepts, Issues and Application; Hoyle, R.H., Ed.; Sage: Thousand Oaks, CA, USA, 1995; pp. 77–99. [Google Scholar]
- Diamantopoulos, A.; Siguaw, J.A.; Siguaw, J.A. Introducing LISREL: A Guide for the Uninitiated; Sage: Thousand Oaks, CA, USA, 22 September 2000. [Google Scholar]
- Hon, C.K.H.; Chan, A.P.C.; Yam, M.C.H. Relationships between safety climate and safety performance of building repair, maintenance, minor alteration, and addition (RMAA) works. Saf. Sci. 2014, 65, 10–19. [Google Scholar]
- Sarstedt, M.; Ringle, C.M.; Hair, J.F. Partial least squares structural equation modeling. In Handbook of Market Research; Springer International Publishing: Cham, Switzerland, 2017; Volume 26, pp. 1–40. [Google Scholar]
- Fornell, C.; Larcker, D.F. Evaluating structural equation models with unobservable variables and measurement error. J. Mark. Res. 1981, 18, 39–50. [Google Scholar] [CrossRef]
- Bagozzi, R.P.; Yi, Y. On the evaluation of structural equation models. Acad. Mark. Sci. 1988, 16, 074–094. [Google Scholar]
- Cattaneo, C. Internal and external barriers to energy efficiency: Which role for policy interventions? Energy Effic. 2019, 12, 1293–1311. [Google Scholar]
- Sorrell, S.; Mallett, A.; Nye, S. Barriers to Industrial Energy Efficiency: A Literature Review; United Nations Industrial Development Organization (UNIDO): Vienna, Austria, 2011. [Google Scholar]
- Lusambili, A.M.; Tod, A.M.; Homer, C.; Abbott, J.; Cooke, J.; McDaid, K.A. Keeping Warm: Social Connectedness and Technology-A Case Study of Rotherham, England ‘Technology and Health in the Elderly’. Int. J. Health Wellness Soc. 2011, 1, 27–42. [Google Scholar]
- Ugarte, S.; van der Ree, B.; Voogt, M.; Eichhammer, W.; Ordoñez, J.; Reuter, M.; Schlomann, B.; Lloret, P.; Villafafila-Robles, R. Energy Efficiency for Low-Income Households. 2016. Available online: https://www.europarl.europa.eu/RegData/etudes/STUD/2016/595339/IPOL_STU(2016)595339_EN.pdf (accessed on 5 December 2021).
- Davison, R.M.; Martinsons, M.G. Context is king! Considering particularism in research design and reporting. J. Inf. Technol. 2016, 31, 241–249. [Google Scholar]


| Variable | Description | n | % |
|---|---|---|---|
| Age | 18–24 | 6 | 1.9 |
| 25–34 | 12 | 5.7 | |
| 35–44 | 21 | 10 | |
| 45–54 | 18 | 8.6 | |
| 55–64 | 46 | 21.9 | |
| 65–74 | 68 | 32.4 | |
| 75–84 | 39 | 18.6 | |
| 85 or older | 2 | 1 | |
| Gender | Male | 102 | 48.1 |
| Female | 109 | 51.4 | |
| Non-binary | 1 | 0.5 | |
| Annual personal income | Less than AUD 10,000 | 21 | 9.9 |
| AUD 10,000–AUD 19,999 | 36 | 17.0 | |
| AUD 20,000–AUD 29,999 | 79 | 37.3 | |
| AUD 30,000–AUD 39,999 | 36 | 17.0 | |
| AUD 40,000–AUD 49,999 | 24 | 11.3 | |
| AUD 50,000–AUD 59,999 | 13 | 6.1 | |
| AUD 60,000–AUD 69,999 | 3 | 1.4 | |
| Annual household income | Less than AUD 10,000 | 7 | 3.3 |
| AUD 10,000–AUD 19,999 | 11 | 5.2 | |
| AUD 20,000–AUD 29,999 | 51 | 24.1 | |
| AUD 30,000–AUD 39,999 | 37 | 17.5 | |
| AUD 40,000–AUD 49,999 | 45 | 21.2 | |
| AUD 50,000–AUD 59,999 | 31 | 14.6 | |
| AUD 60,000–AUD 69,999 | 10 | 4.7 | |
| AUD 70,000–AUD 79,999 | 4 | 1.9 | |
| AUD 80,000–AUD 89,999 | 3 | 1.4 | |
| AUD 90,000–AUD 99,999 | 5 | 2.4 | |
| AUD 100,000–AUD 149,999 | 7 | 3.3 | |
| More than AUD 150,000 | 1 | 0.5 |
| Component | Actual Eigenvalue from PCA | Criterion Value from Parallel Analysis | Decision |
|---|---|---|---|
| 1 | 11.498 | 1.725673 | Accept |
| 2 | 2.518 | 1.592229 | Accept |
| 3 | 1.866 | 1.510609 | Accept |
| 4 | 1.437 | 1.435158 | Accept |
| 5 | 1.093 | 1.373765 | Reject |
| Item | Factor Loading | M | SD | |||
|---|---|---|---|---|---|---|
| F1 | F2 | F3 | F4 | |||
| Factor 1, Decision-making (eigenvalue = 11.498; percentage of variance = 44.529; cumulative percentage = 44.529) | ||||||
| 172. Measure implementation comes with too much stress | 0.820 | 2.88 | 1.16 | |||
| 177. Periods of transition in the household lifecycle | 0.783 | 2.96 | 1.12 | |||
| 171. Disruption that comes along with conducting renovations in the home to adopt energy efficiency | 0.763 | 2.89 | 1.21 | |||
| 176. The stress that comes along with making irreversible and complicated decisions | 0.749 | 3.17 | 1.21 | |||
| 174. Technical risk | 0.733 | 2.96 | 1.09 | |||
| 173. Doubts about the contractor’s reliability | 0.682 | 3.17 | 1.14 | |||
| 178. Households’ social communication behavior as a particular type of personal influence | 0.674 | 2.57 | 1.08 | |||
| Factor 2, Financial (eigenvalue = 2.518; percentage of variance = 9.402; cumulative percentage = 53.931) | ||||||
| 156. Financial risks | 0.786 | 3.67 | 1.11 | |||
| 152. Immediate loss for delayed gains | 0.771 | 3.4 | 1.02 | |||
| 154. Lack of saving | 0.761 | 3.67 | 1.11 | |||
| 151. High upfront costs | 0.752 | 4.01 | 0.96 | |||
| 155. Hidden costs | 0.746 | 3.75 | 1.07 | |||
| 153. Lack of incentives, subsidies from government | 0.649 | 3.4 | 1.02 | |||
| 167. Lack of support for low-income or vulnerable households | 0.600 | 3.73 | 1.2 | |||
| Factor 3, Information (eigenvalue = 1.866; percentage of variance = 7.205; cumulative percentage = 61.136) | ||||||
| 164. Unavailability of relevant information on efficiency measures | 0.769 | 3.16 | 1.05 | |||
| 165. Lack of trust in available information | 0.745 | 3.18 | 1.14 | |||
| 161. Lack of awareness or skepticism of existing resources | 0.731 | 3.02 | 1.12 | |||
| 168. Lack of marketing campaigns | 0.681 | 2.87 | 1.07 | |||
| 162. Misperceptions about energy costs | 0.681 | 3.02 | 1.05 | |||
| 163. Doubts about cost-saving outcomes | 0.607 | 3.27 | 1.06 | |||
| Factor 4, Split incentives (eigenvalue = 1.437; percentage of variance = 5.141; cumulative percentage = 66.276) | ||||||
| 183. Landlord’s unwillingness to adopt efficiency measures | 0.853 | 2.56 | 1.55 | |||
| 169. Uncertainty about the period of residence at a particular dwelling | 0.711 | 2.9 | 1.31 | |||
| Goodness-Of-Fit Measure | Value | Acceptable Threshold | Results Supporting Model Fit |
|---|---|---|---|
| χ2/df | 1.288 | <2 | √ |
| RMSEA | 0.053 | <0.06 | √ |
| CFI | 0.957 | >0.90 | √ |
| IFI | 0.959 | >0.90 | √ |
| TLI | 0.948 | >0.90 | √ |
| Discriminant Validity | Estimate | Correlation Squared | AVE 1; AVE 2 (AVEs Should Be > r2) | Discriminant Validity |
|---|---|---|---|---|
| Financial <--> Information | −0.055 | −0.003 | 0.593; 0.461 | Established |
| Financial <-->Split incentives | 0.347 | 0.120 | 0.593; 0.490 | Established |
| Financial <--> Decision-making | 0.672 | 0.451 | 0.593; 0.653 | Established |
| Split incentives <--> Information | 0.158 | 0.024 | 0.490; 0.461 | Established |
| Decision-making <--> Information | 0.109 | 0.0118 | 0.653; 0.461 | Established |
| Decision-making <--> Split incentives | 0.641 | 0.4108 | 0.653; 0.490 | Established |
| Convergent Validity | Information | Financial | Decision-Making | Split Incentives |
|---|---|---|---|---|
| AVE value > 0.5 | 0.461 | 0.593 | 0.653 | 0.490 |
| CR value > 0.7 | 0.771 | 0.897 | 0.919 | 0.711 |
| Factor loading | 0.878 | 0.947 | 0.958 | 0.843 |
| Error variance 1 − CR | 0.229 | 0.103 | 0.081 | 0.289 |
| Convergent validity | Established | Established | Established | Established |
Disclaimer/Publisher’s Note: The statements, opinions and data contained in all publications are solely those of the individual author(s) and contributor(s) and not of MDPI and/or the editor(s). MDPI and/or the editor(s) disclaim responsibility for any injury to people or property resulting from any ideas, methods, instructions or products referred to in the content. |
© 2023 by the authors. Licensee MDPI, Basel, Switzerland. This article is an open access article distributed under the terms and conditions of the Creative Commons Attribution (CC BY) license (https://creativecommons.org/licenses/by/4.0/).
Share and Cite
Azimi, S.; Hon, C.K.H.; Tyvimaa, T.; Skitmore, M. Barriers to Energy Efficiency: Low-Income Households in Australia. Buildings 2023, 13, 954. https://doi.org/10.3390/buildings13040954
Azimi S, Hon CKH, Tyvimaa T, Skitmore M. Barriers to Energy Efficiency: Low-Income Households in Australia. Buildings. 2023; 13(4):954. https://doi.org/10.3390/buildings13040954
Chicago/Turabian StyleAzimi, Samaneh, Carol K. H. Hon, Tanja Tyvimaa, and Martin Skitmore. 2023. "Barriers to Energy Efficiency: Low-Income Households in Australia" Buildings 13, no. 4: 954. https://doi.org/10.3390/buildings13040954