Article

Design—Construction Phase Safety Risk Analysis of Assembled Buildings

School of Architectural Engineering, Dalian University, Dalian 116622, China
*
Author to whom correspondence should be addressed.
Buildings 2023, 13(4), 949; https://doi.org/10.3390/buildings13040949
Submission received: 7 March 2023 / Revised: 27 March 2023 / Accepted: 28 March 2023 / Published: 3 April 2023

Abstract

:
To reduce the impact of safety risks on assembled buildings, this paper explores the factors affecting the safety risks of constructed buildings from the perspective of linkage between the design and construction phases. The method identifies 10 first-level risk indicators and 25 s-level safety risk indicators in five dimensions of prefabricated components, personnel, management, environment, and technology in both the design and construction phases, utilizing literature induction, expert interviews, questionnaire surveys, and Porter’s diamond model. The structural equation model was used to quantify the weights of the 25 s-level safety risk indicators to highlight the safety risk analysis of the assembled building and avoid risk. The results of the study show that it is important to analyze the safety risk linkage between the design phase and construction phase of the assembled building; from the perspective of the design-construction phase linkage, controlling the safety risk in the design phase can effectively reduce the safety risk in the construction phase.

1. Introduction

In recent years, the construction industry has been actively responding to the concept of green building, assembled buildings that have the characteristics of environmental protection, energy saving, and high efficiency, fully demonstrating the global responsibility and firm determination to adhere to green development and address climate change. The development of assembled buildings has attracted widespread attention from countries and communities around the world and has become the focus of many scholars’ discussions. Assembled building, also known as prefabricated building, refers to the transportation of prefabricated components such as floor slabs and stairs produced in the factory to the construction site, splicing, and assembling components on the spot similar to “building blocks”, giving full play to the advantages of high quality and high efficiency of assembly. In order to better implement the green development strategy and accelerate the development of assembled buildings, clarifying the safety risks of assembled buildings is an important prerequisite for achieving this goal.
Many university researchers in the field of construction, technical personnel in construction projects, personnel engaged in assembly project management, and personnel who have certain research on project safety risks have studied the safety risks of buildings. Li Cong [1] carried out safety risk analysis during the construction stage of traditional building engineering, introduced the set pair analysis theory into the matter-element model, constructed the five-element connection number matter-element model and the partial connection number matter-element model, and realized the safety evaluation and risk prediction of construction projects. Long Danbing [2] used the knowledge graph to improve the construction behavior safety risk analysis method and dangerous location identification algorithm to conduct a safety risk assessment and dangerous location identification of construction behavior. Prefabricated construction projects are different from traditional buildings. Traditional safety risk analysis is difficult to be directly applied to assembled buildings. At present, the safety risk assessment of assembled buildings in the world is mainly system dynamics [3], analytic hierarchy process [4], and so on. In some countries, there are few achievements in the safety risk assessment of assembled construction projects. Li [5] analyzed the correlation between risk factors and prevented construction safety accidents from the perspective of prefabricated components through structural equation modeling. Dong Xiang [6] and other scholars used the 4M1E theory combined with the ternary interval number theory to establish a construction risk evaluation index system for super high-rise prefabricated buildings. Chen Wei et al. [7] established the DEMATEL-Bayesian network (BN) model of construction safety risk transmission by using the WSR method to calculate the transmission path of risk factors. Ding Yan [8] used the analytic hierarchy process and ABC classification method to classify and rank the risk factors of the project, distinguish the key risks, and improve the project risk control effect. Scholars such as Chang [9] proposed the WBS-RBS-G1 method, which combines the G1 method with the WBS-RBS method, to identify the risks in the construction process, and to control and prevent weak links and key links. In order to ensure the safety of the construction process of assembled buildings, Li Wenlong [10] constructed a safety risk assessment model for assembled building construction based on the entropy weight-unascertained measure theory. Yang Siling [11] proposed a structural entropy weight method combining subjective and objective weighing methods. At the same time, based on the evidence theory modified by the Bayes approximation method, the multi-level hierarchical evaluation of the safety risk of assembled building construction was carried out. Chen Weigong [12] used Hall ‘s three-dimensional structure idea to construct a prefabricated building safety evaluation index system considering vulnerability and introduced the C-OWA operator to objectively empower the indicators to determine the main obstacle factors affecting the safety level of assembled buildings. Tao Mengting [13] used the system dynamics simulation software Vensim PLE v5.9d to construct the causal relationship feedback diagram of the safety risk of the construction of the matching building and used the G1 method and the entropy weight method to determine the weighted comprehensive weighing method. Set the weight and construct the risk assessment flow chart; Zhao Tingsheng [14] introduced the Bayesian modeling method to analyze the accident characteristics and safety hazard mechanism of the tower crane in the use stage and identified four key safety influencing factors of the tower crane in use stage through sensitivity analysis. Xia [15] considered the safety management problem in the design stage through the DFS method to eliminate or reduce the safety risk of the whole life cycle of the project. Lu [16] combined SEM and fuzzy comprehensive evaluation methods to analyze construction safety. Yang [17] analyzed the artificial unsafe factors in the construction process by SEM. Duan Yonghui et al. [18] used the structural equation model (SEM) to study the main factors affecting the safety of prefabricated building construction and improve the safety risk management and control ability of prefabricated building construction. It can be seen that there are many studies on safety risks in the construction stage of assembled buildings, and there are few safety risks in the linkage analysis between the design stage and the construction stage. The prefabricated building has a complex construction process, and its construction is closely related to the design stage and cannot be ignored.
Therefore, this paper intends to link the design phase of assembled buildings with the construction phase, i.e., the design-construction phase safety risk analysis. Based on the five dimensions of prefabricated components, personnel, management, environment, and technology, by constructing a safety risk structural equation model for the linkage analysis of assembled building design and construction stage, the potential relationship between risk factors is quantified, the risk weight is calculated, and the comprehensive analysis and evaluation of safety risks in the design and construction stage is realized.

2. Identification of Factors Affecting Safety Risks in Assembled Buildings

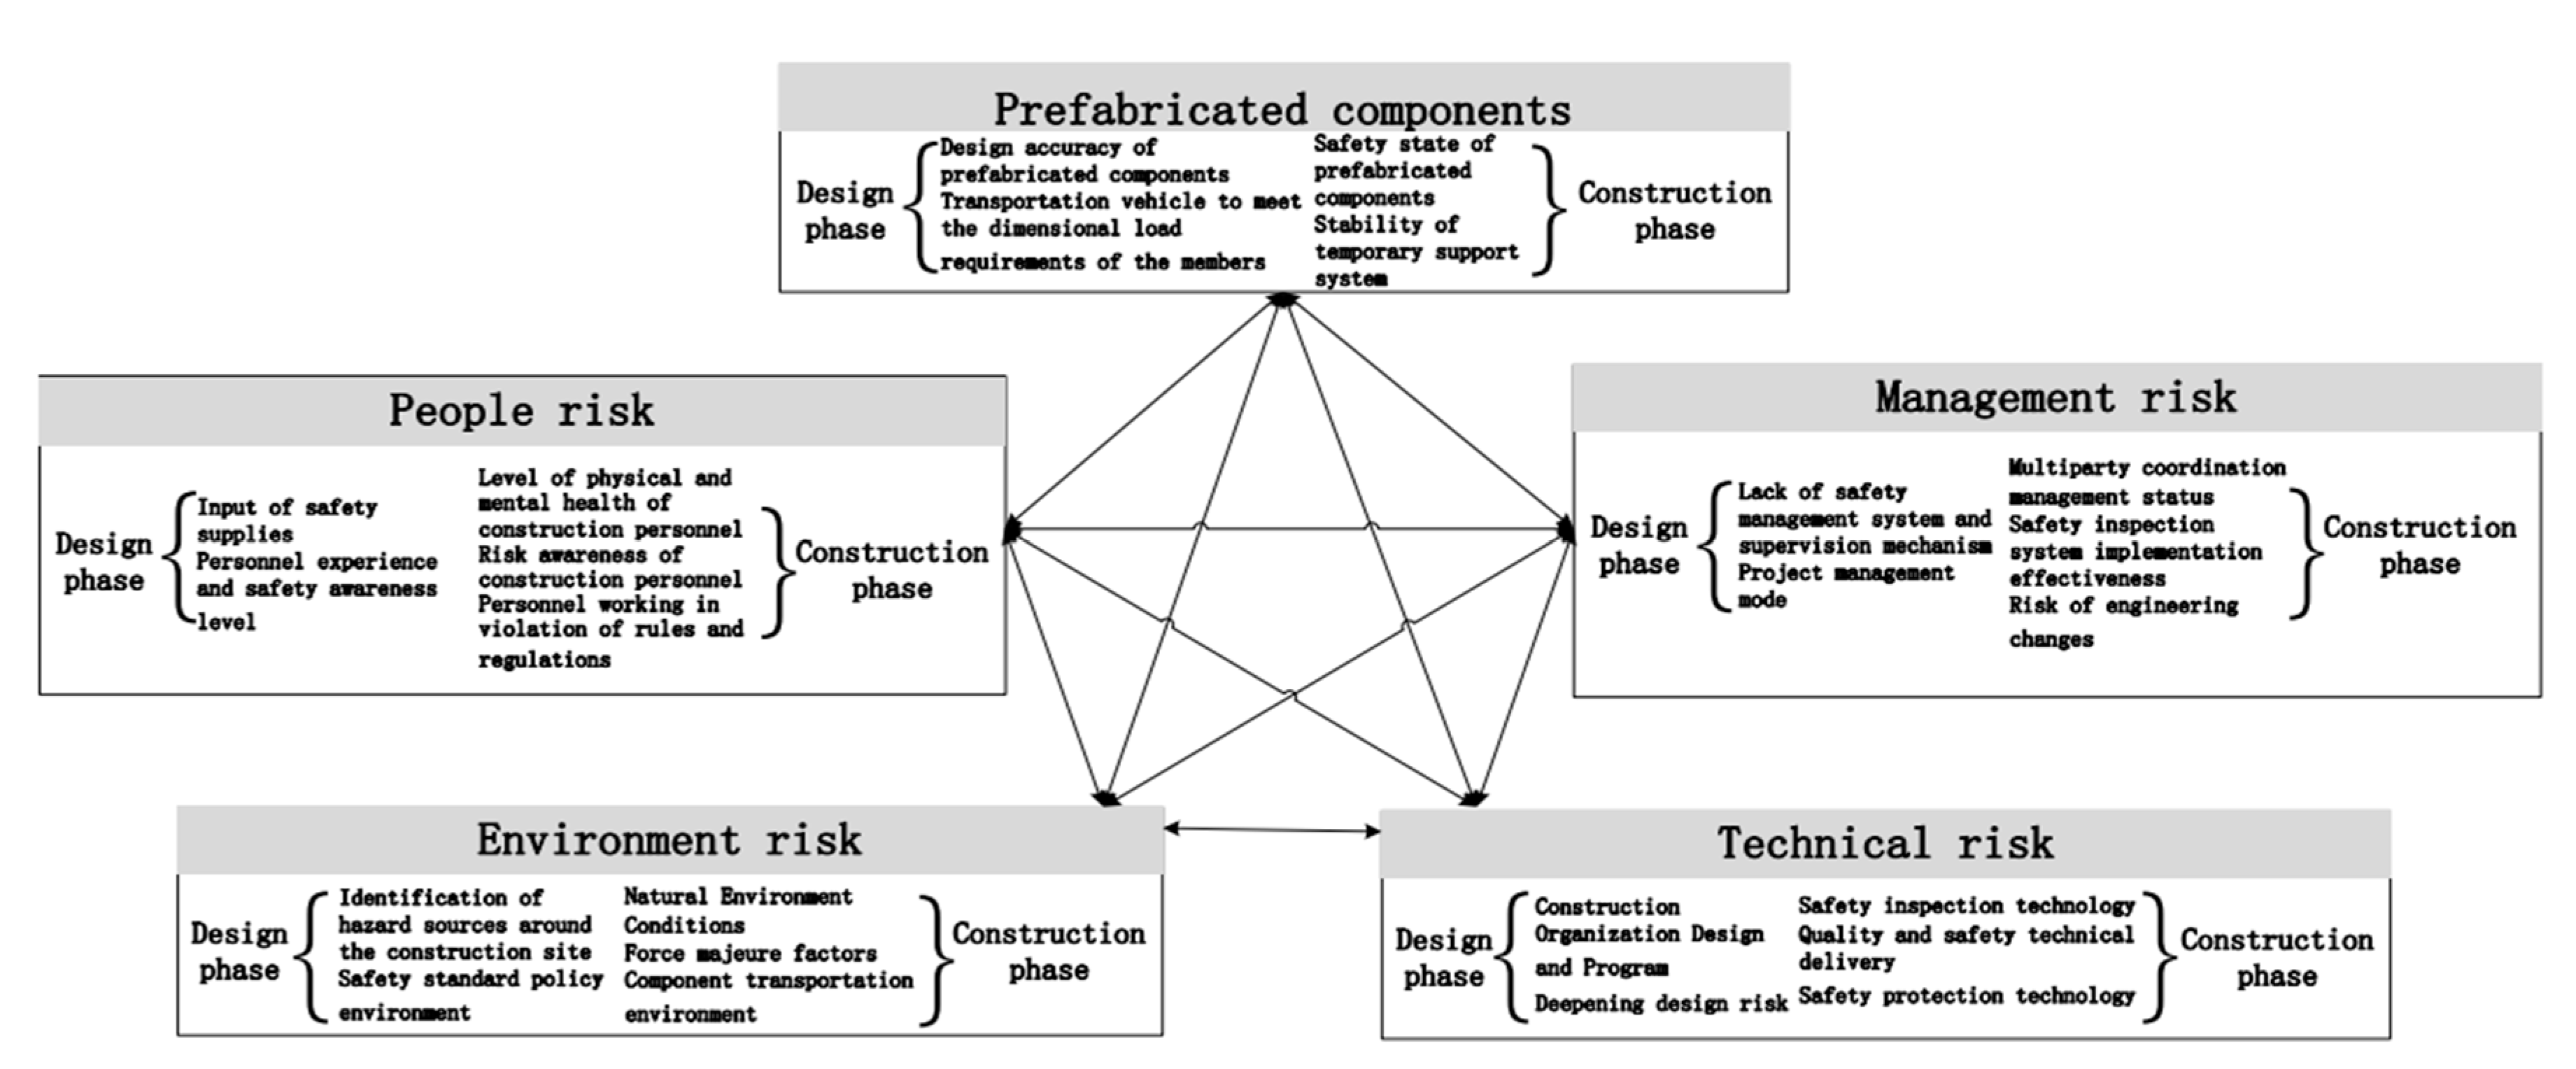
2.1. Risk Presence Stage

Compared with traditional cast-in-place concrete buildings, assembled buildings have many advantages. As shown in Table 1, they can promote the efficient development of the construction industry. The most striking feature of assembled buildings is that the design and construction phases are particularly closely linked. Therefore, to reduce losses and avoid the potential risks associated with the completed buildings, consideration should be given to the factors affecting safety in both phases of the design-construction phase. The design of prefabricated components, design personnel, management of design, environmental design, and technical design risks are identified in the assembly building design phase; the assembled building construction phase is identified as prefabricated component construction, construction personnel, construction management, construction environment, and construction technology risks, with a total of 10 first-level risk indicators in the design-construction phase.

2.2. Identification of Safety Risk Factors

Based on the above five dimensions of components, personnel, management, environment, and technology, the types of safety risks affecting the design stage and the construction stage are identified, namely the first-level safety risk factors. Based on the principle of objectivity and comprehensiveness, combined with the literature analysis and expert investigation, this paper comprehensively combs the relevant literature on “design”, “construction” and “safety risk” of prefabricated buildings [5,6,7,8,9,10,11,12,13,14,15]. The first-level safety risk is “prefabricated component design, designer, management design, environmental design, technical design, prefabricated component construction, construction personnel, construction management, construction environment, construction technology risk”. On the basis of the first-level risk, the risk is further analyzed in detail, and the second-level security risk factors are gradually summarized, which are more specific, as shown in Table 2.
At present, the main manifestation of the industrialization of construction is the construction of assembled buildings [7,8,9,10,11], however, less analysis of safety risks in the linked role of design and construction of assembled buildings. The diamond model is also known as the diamond theory and national competitive advantage theory [19]. Porter’s diamond model is used to analyze why a certain industry of a country is competitive in the international arena and is a common model in the field of strategic management research. The analysis of safety risks in the design-construction phase of assembled buildings can be used to determine if the identified risks are reasonable by using the elements in the diamond model as a breakthrough point.
Based on the Porter diamond model [19], this paper analyzes the above risk factors that pose a greater threat to the safety of the prefabricated building design-construction phase. From the design-construction stage (Figure 1), the above five dimensions are linked to enhance the competitiveness of the prefabricated construction industry. Based on the analysis of the factors affecting the safety risk of the project by the diamond model, the structural equation model is constructed by correlating and interacting with the factors. The structural equation model can more accurately express the logical relationship between risk factors in a structured form, and further, consider the longitudinal phase difference to reflect the safety risk in practical engineering.

3. Questionnaire Survey and Analysis

3.1. Design and Analysis of the Questionnaire

According to the summarized risk factors, a questionnaire of “prefabricated building design-safety risk analysis in construction stage” was compiled. This questionnaire is divided into two parts, namely to collect the personal information of the respondent and information on the measurement of factors affecting safety risks in the assembled building design and construction phase. To ensure the comprehensiveness and reliability of the questionnaire, the five-point Likert scale method was used to score the magnitude of the influence of the primary factors on the safety risks in the assembled building design-construction phase, which includes the background information of the respondents, such as age, education, title, nature of the work unit, and work experience involved in the assembled building work, as shown in Table 3; the respondents’ opinion on whether the analysis of safety risks in assembled buildings is important as well as scoring the degree of danger of each safety risk in the list in Table 2, with 1 to 5 representing their different degrees of impact on the safety of assembled buildings. The questionnaire was distributed electronically, and 350 copies were distributed. Relevant public platforms were utilized in the process of questionnaire distribution, with a target group of mainly scholars engaged in assembled buildings or related research. After the elimination of invalid questionnaires, there were 302 remaining questionnaires. The rate of valid questionnaires collected was 86.29%.

3.2. Reliability and Validity Analysis

The reliability and validity of the collected data were tested using SPSS 26.0 software as a prerequisite for data reading in AMOS 24.0 software. At present, the most widely used reliability analysis is the Cronbach Alpha coefficient to measure the internal consistency and stability of the data. An alpha coefficient value higher than 0.8 indicates high reliability; an alpha coefficient between 0.7 and 0.8 indicates good reliability; an alpha coefficient between 0.6 and 0.7 indicates acceptable reliability; and an alpha coefficient less than 0.6 indicates poor reliability [20]. The Cronbach’s alpha coefficient of the questionnaire data calculated by SPSS 26.0 software is 0.957, which is greater than 0.80, indicating that the designed questionnaire has high stability and meets the requirements of the reliability analysis. When conducting validity analysis, the KMO (Kaiser Meyer Olkin) value and Bartlett’s (Bartlett) sphere tests were applied to reflect whether the data were suitable for factor analysis. The KMO value obtained after the SPSS26.0 analysis was 0.963. The KMO value tended to be 1. Meanwhile, Bartlett’s test was significant at the level of p = 0.000, and both above indicators demonstrate that there is a high correlation between the data of the questionnaire, which is suitable for factor analysis, and that the questionnaire meets the validity criteria. The cumulative variance explained after rotation is 64.449% > 50%, which indicates that the amount of information on the research items can be effectively extracted, and this questionnaire has good structural validity.

4. Construction and Analysis of the Structural Equation Model

The structural equation model (SEM) can be divided into the measurement model and the structural model. The measurement model is the study of abstract, conceptual factors that cannot be directly measured and observed, where the potential variables are the independent variables and the measured variables are the dependent variables; the structural model is the study of linear regression equations between variables, which is analyzed with AMOS 24.0 [21]. AMOS structural equation model analysis is a validation analysis. The software disaggregates the complex correlations into several linear regression models according to the plotted paths. The overall breakdown of linear regression models is called the structural model, and the data collected by the questionnaire fits the structural equation model well.

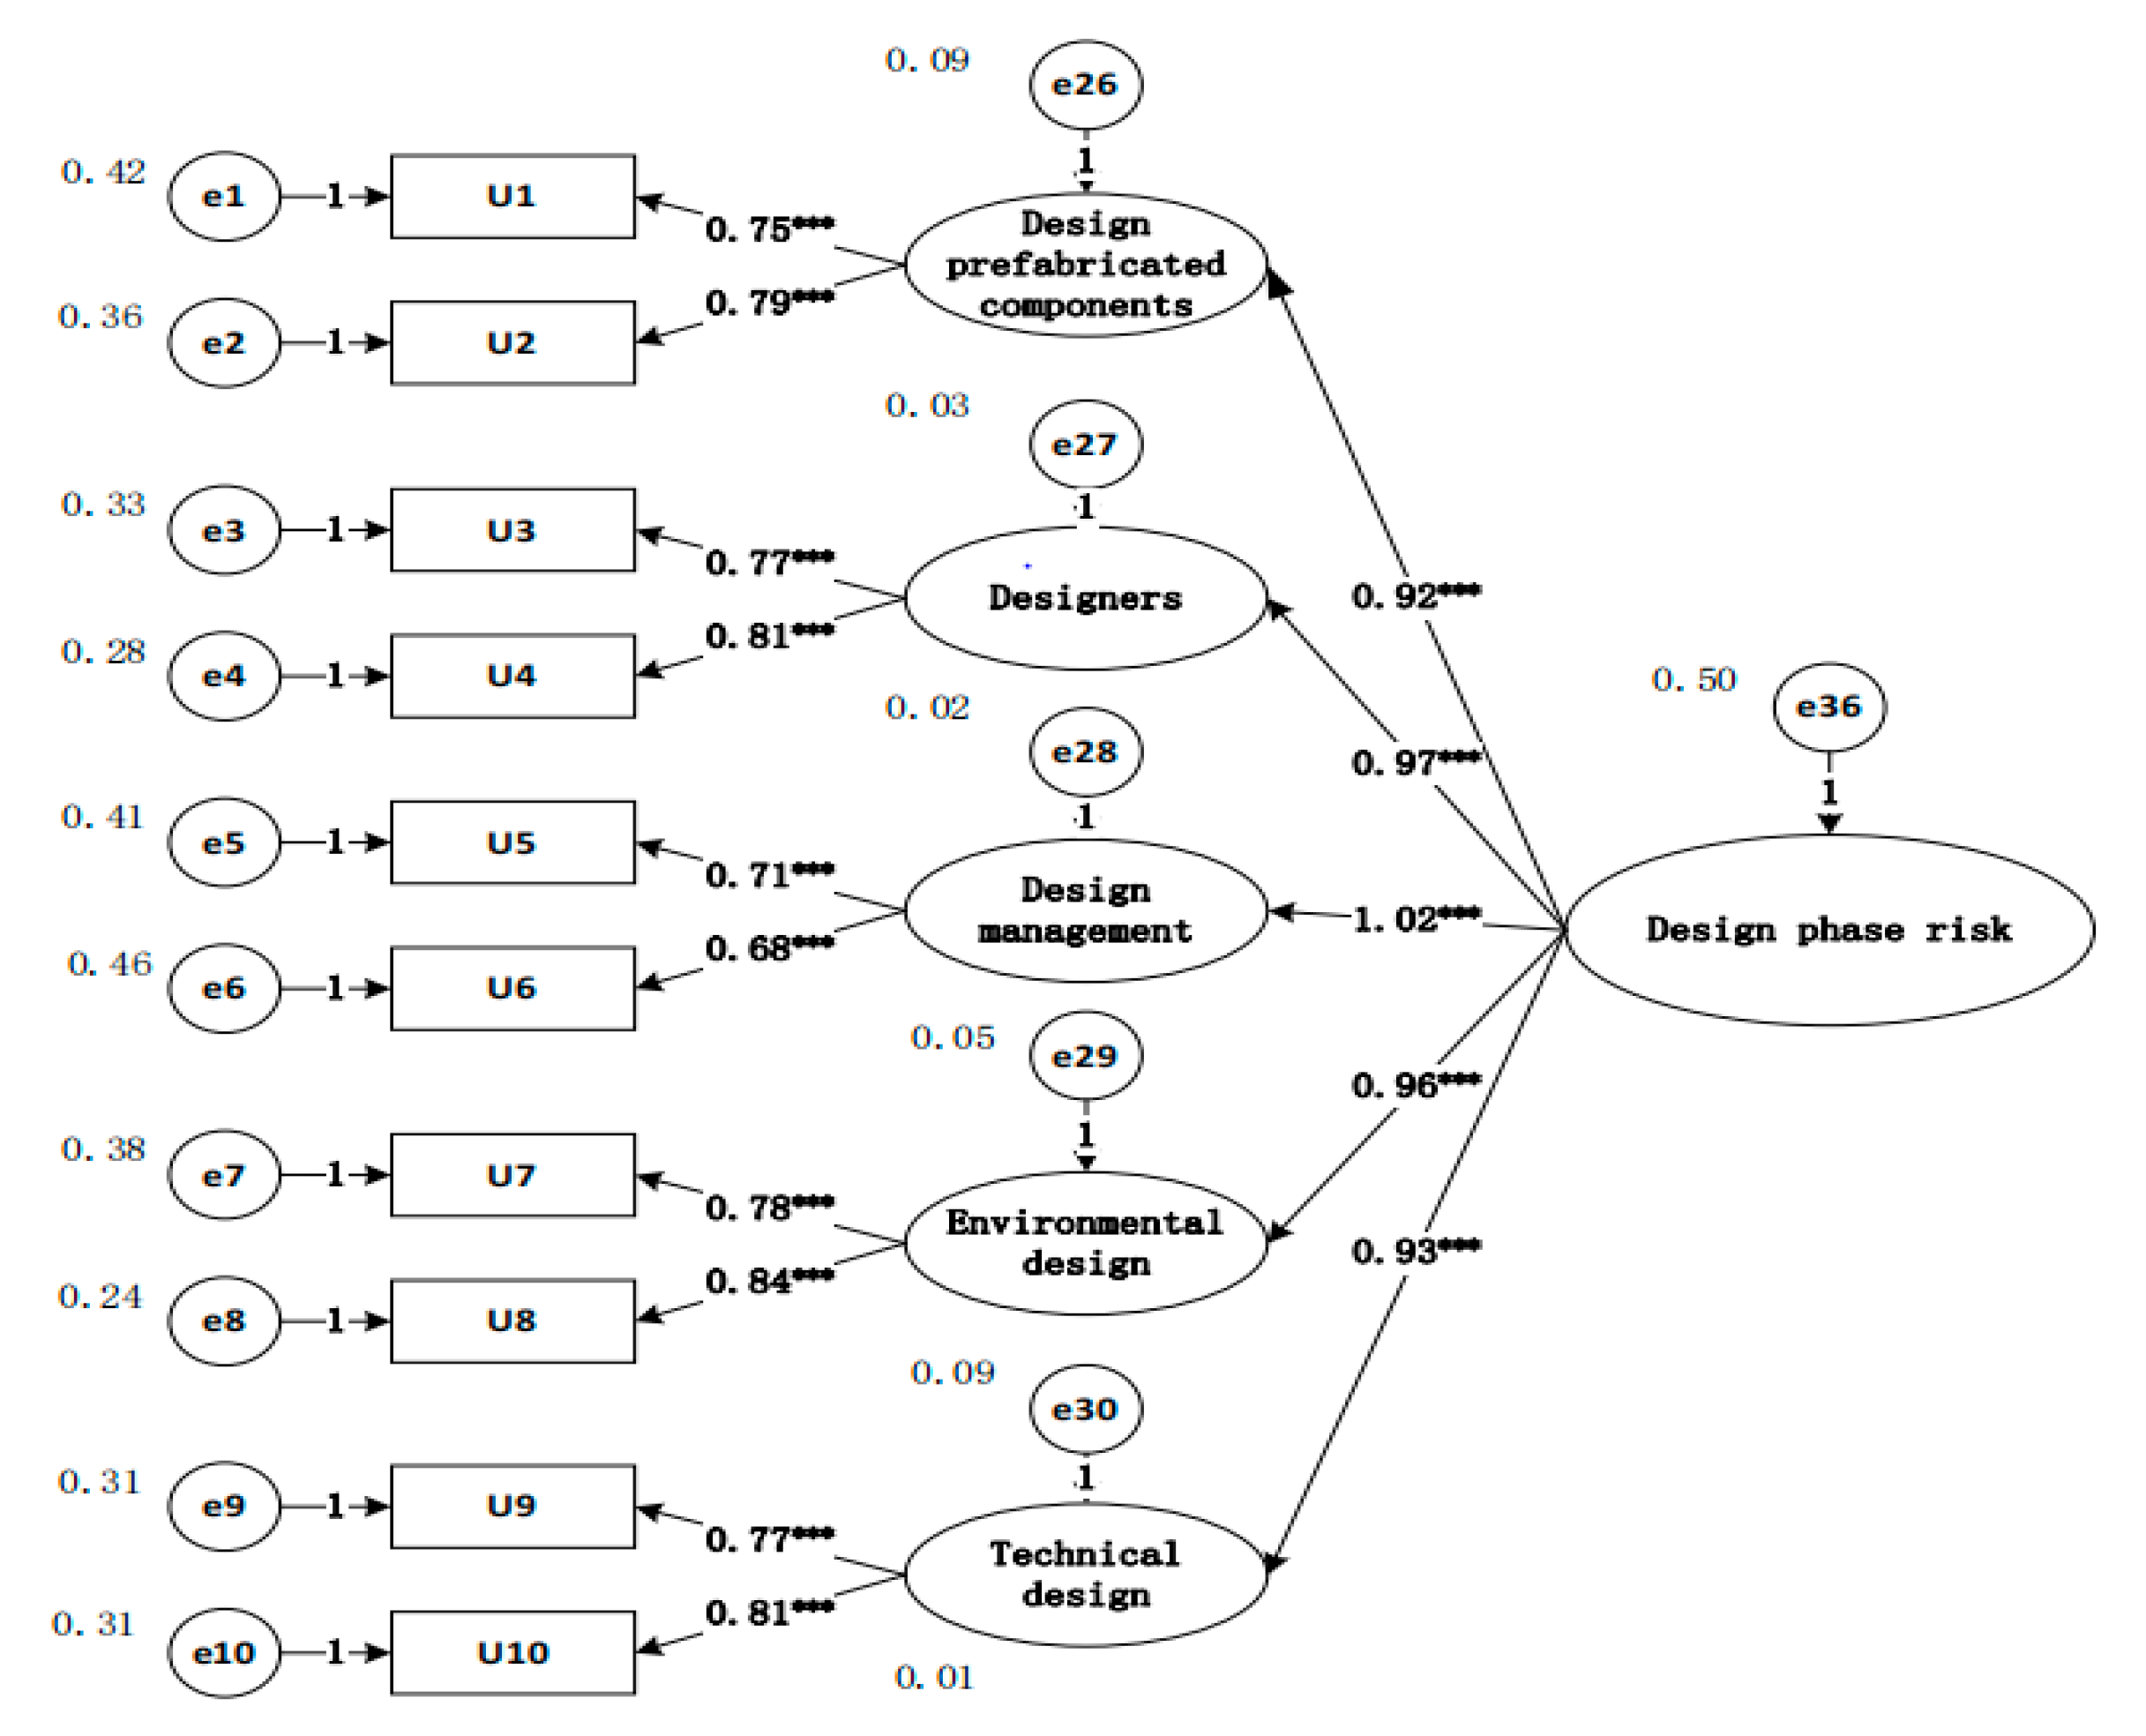
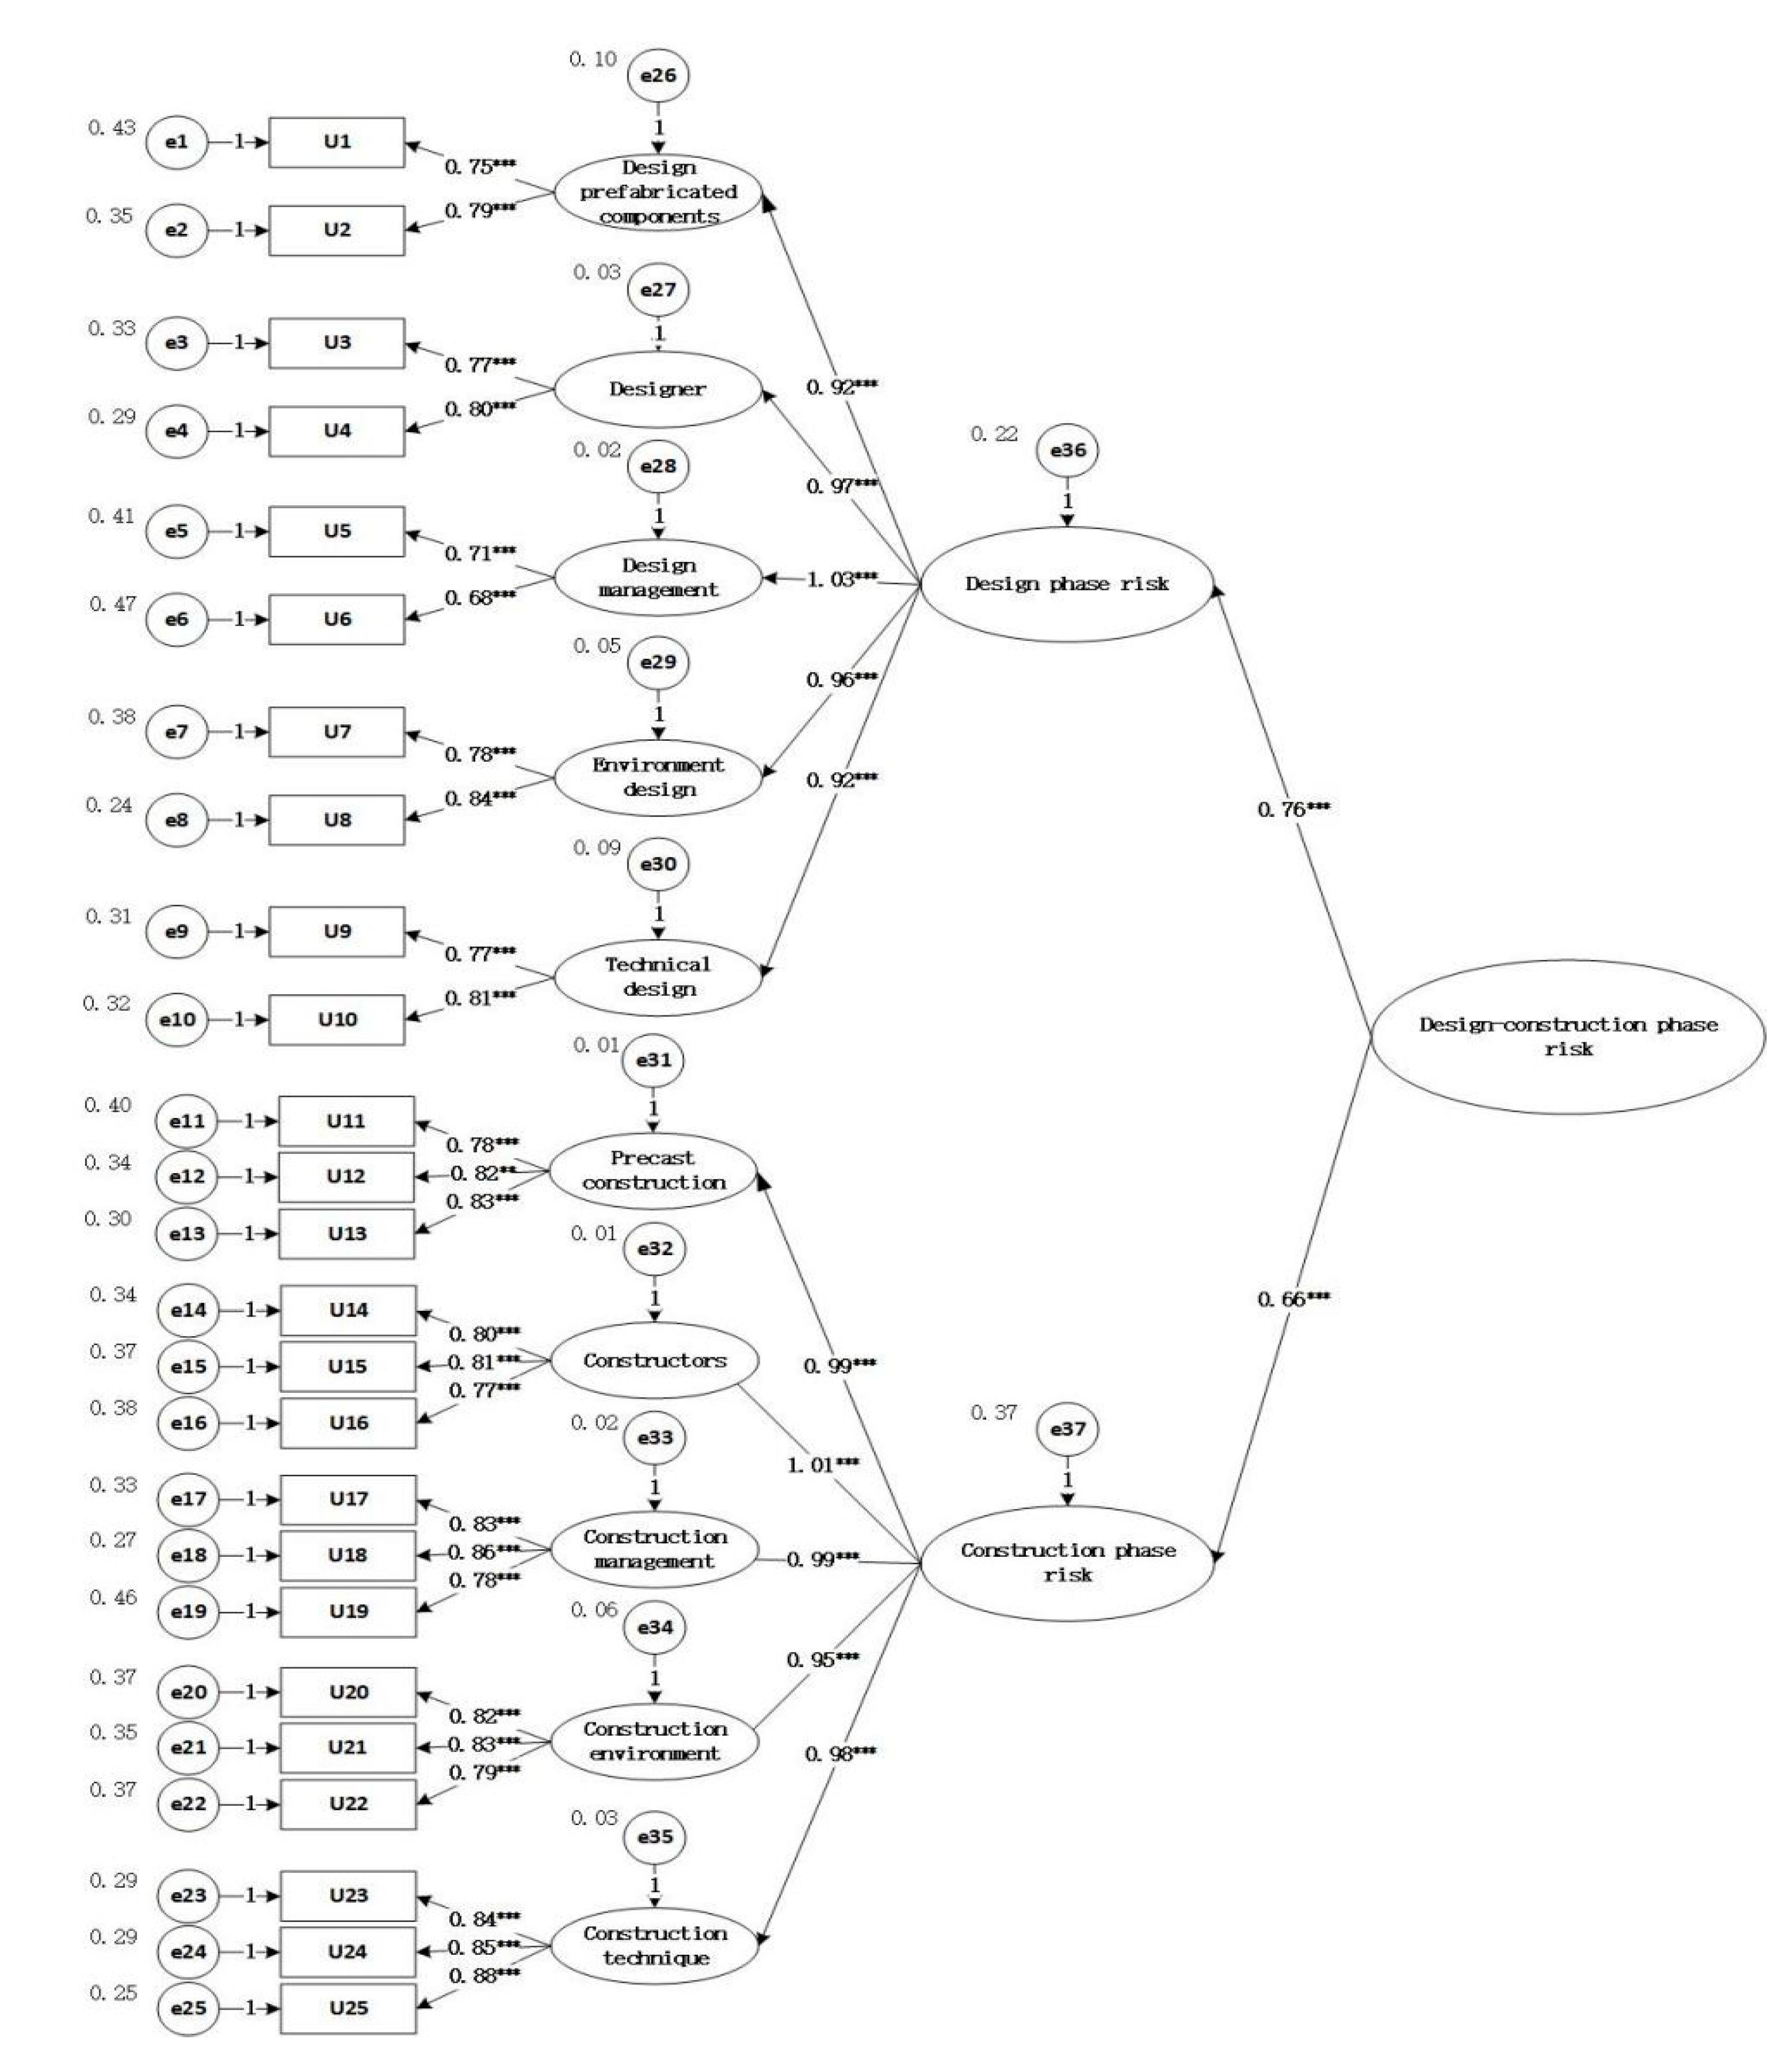
4.1. First-Order Structural Equation Model

The constructed structural equation models were subjected to (CFA) validation factor analysis, and the cardinal values χ2/df, root mean square error of approximation (RMSEA), fitness index (GFI), adjusted fitness index (AGFI), value-added fit index (IFI), Tucker-Lewis index (TLI), comparative fit index (CFI), square root of residual (RMR) and other indicators were used to test the fitness of the model and determine the acceptable range. For this index, the acceptable range is set at greater than 0.9 by domestic scholars [16], and several papers that have been published on SCI in recent years consider the acceptable range of AGFI to be greater than 0.8 [22]; an acceptable range greater than 0.8 is used in the paper. Each fitness index and the acceptable range are shown in Table 4.
By analyzing the logical relationships, single-factor measurement models are constructed for the design phase and construction phase to integrate into a first-order measurement model, with arrows indicating the interrelationships between the latent variables.
According to Figure 2, the results of the first-order structural equation model are all a good fit, where χ2/df = 2.302, AGFI = 0.925, IFI = 0.977, TLI = 0.965, CFI = 0.977, RMR = 0.025, GFI = 0.959, RMSEA = 0.066. The p-value reflected the significance level between the variables are shown as all kinds of good significance in the model, while p < 0.05 indicates significance at/within the 95% confidence interval with an acceptable level of significance (*); p < 0.01 indicates significance at the 99% confidence interval with a good level of significance (**); p < 0.001 indicates significance at the 99.9% confidence interval with an extremely high level of significance (***).
As shown in Figure 3, the first-order structural equation model for the construction phase is good fitted as well, while χ2/df = 2.791, AGFI = 0.855, IFI = 0.962, TLI = 0.952, CFI = 0.961, and RMR = 0.034 for a good fit, where GFI = 0.897 and RMSEA = 0.077 for a better fit. GFI and RMSEA are identified as a better fit, while the others are identified as a good fit. Therefore, the fit of this model does not reach the optimal criteria, so the model must be revised and optimized again to reach the optimal fit.
The modified first-order validated factor analysis model for the construction phase is shown in Figure 4, and the data of each index are compared with the original model, as shown in Table 5, with corresponding improvement and compliance with the standard requirements.
The coefficients between the design-construction phase latent variables and the observed variables both reached significant levels, and the two phases were significantly influenced by each of the respective five first-order safety risk factors. There was a high correlation between the latent variables, so it was inferred that there might be another higher-order common factor influencing them. Therefore, a second-order model was used for further analysis.

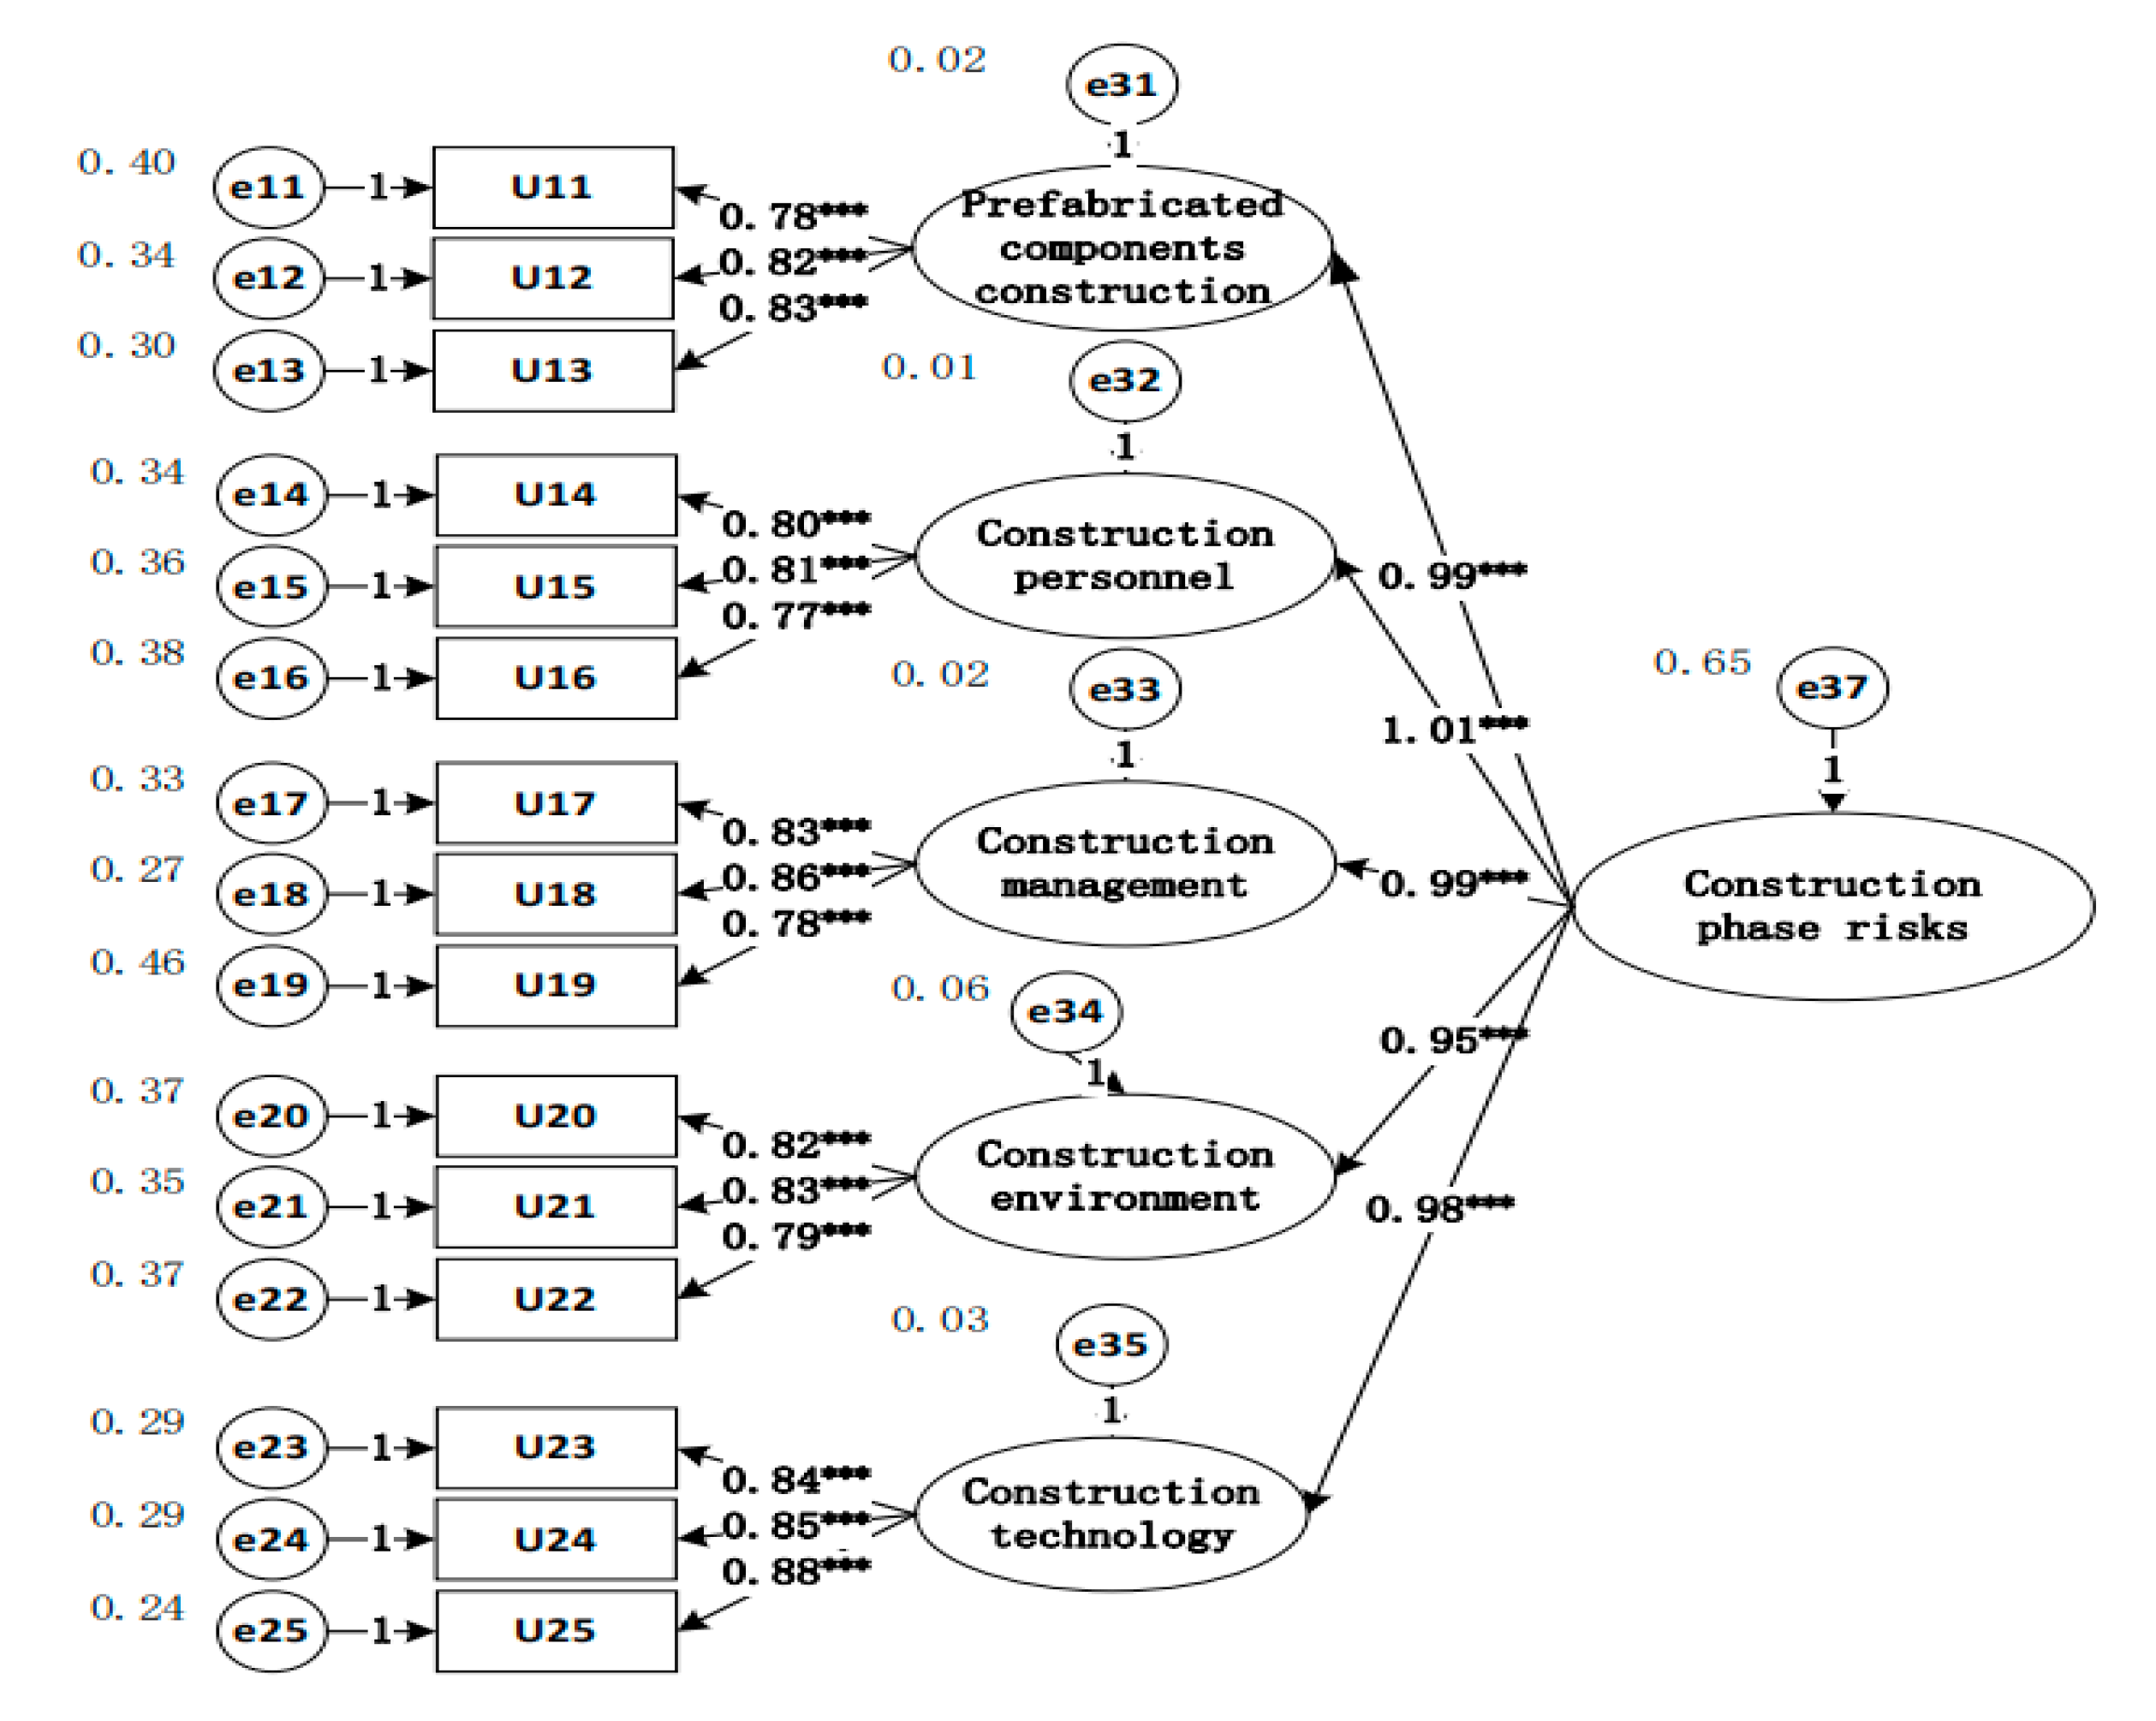
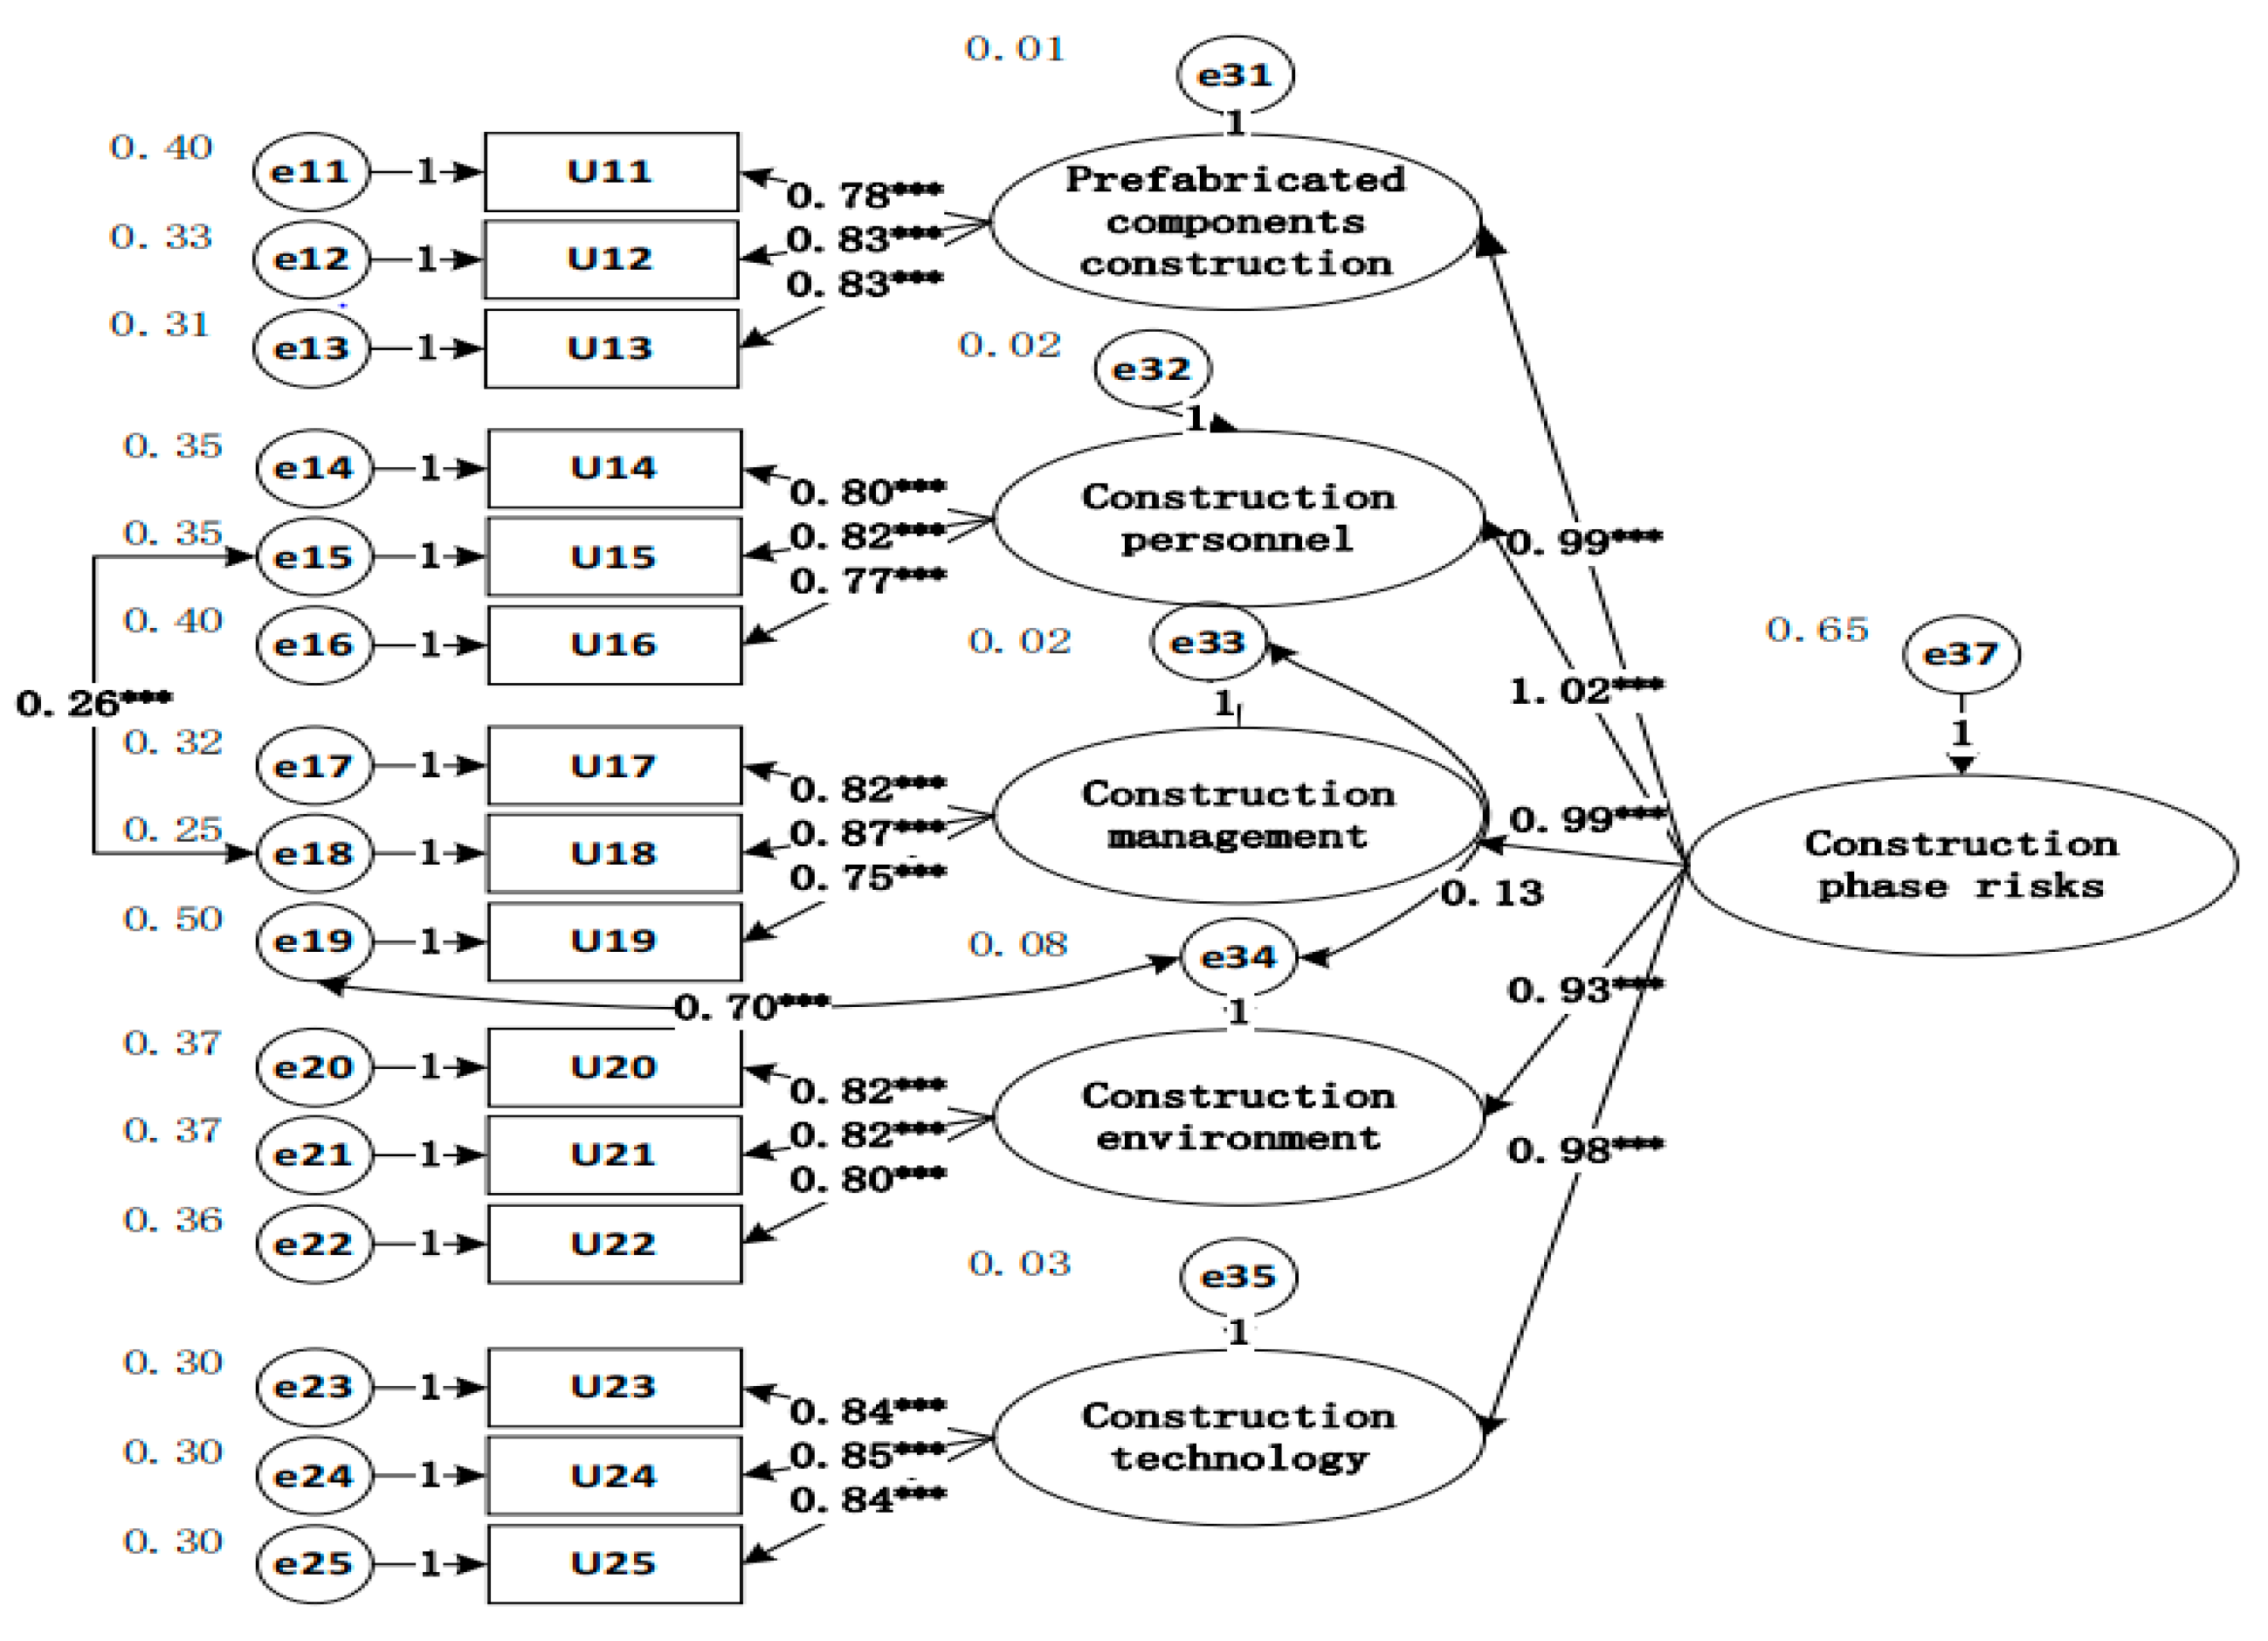
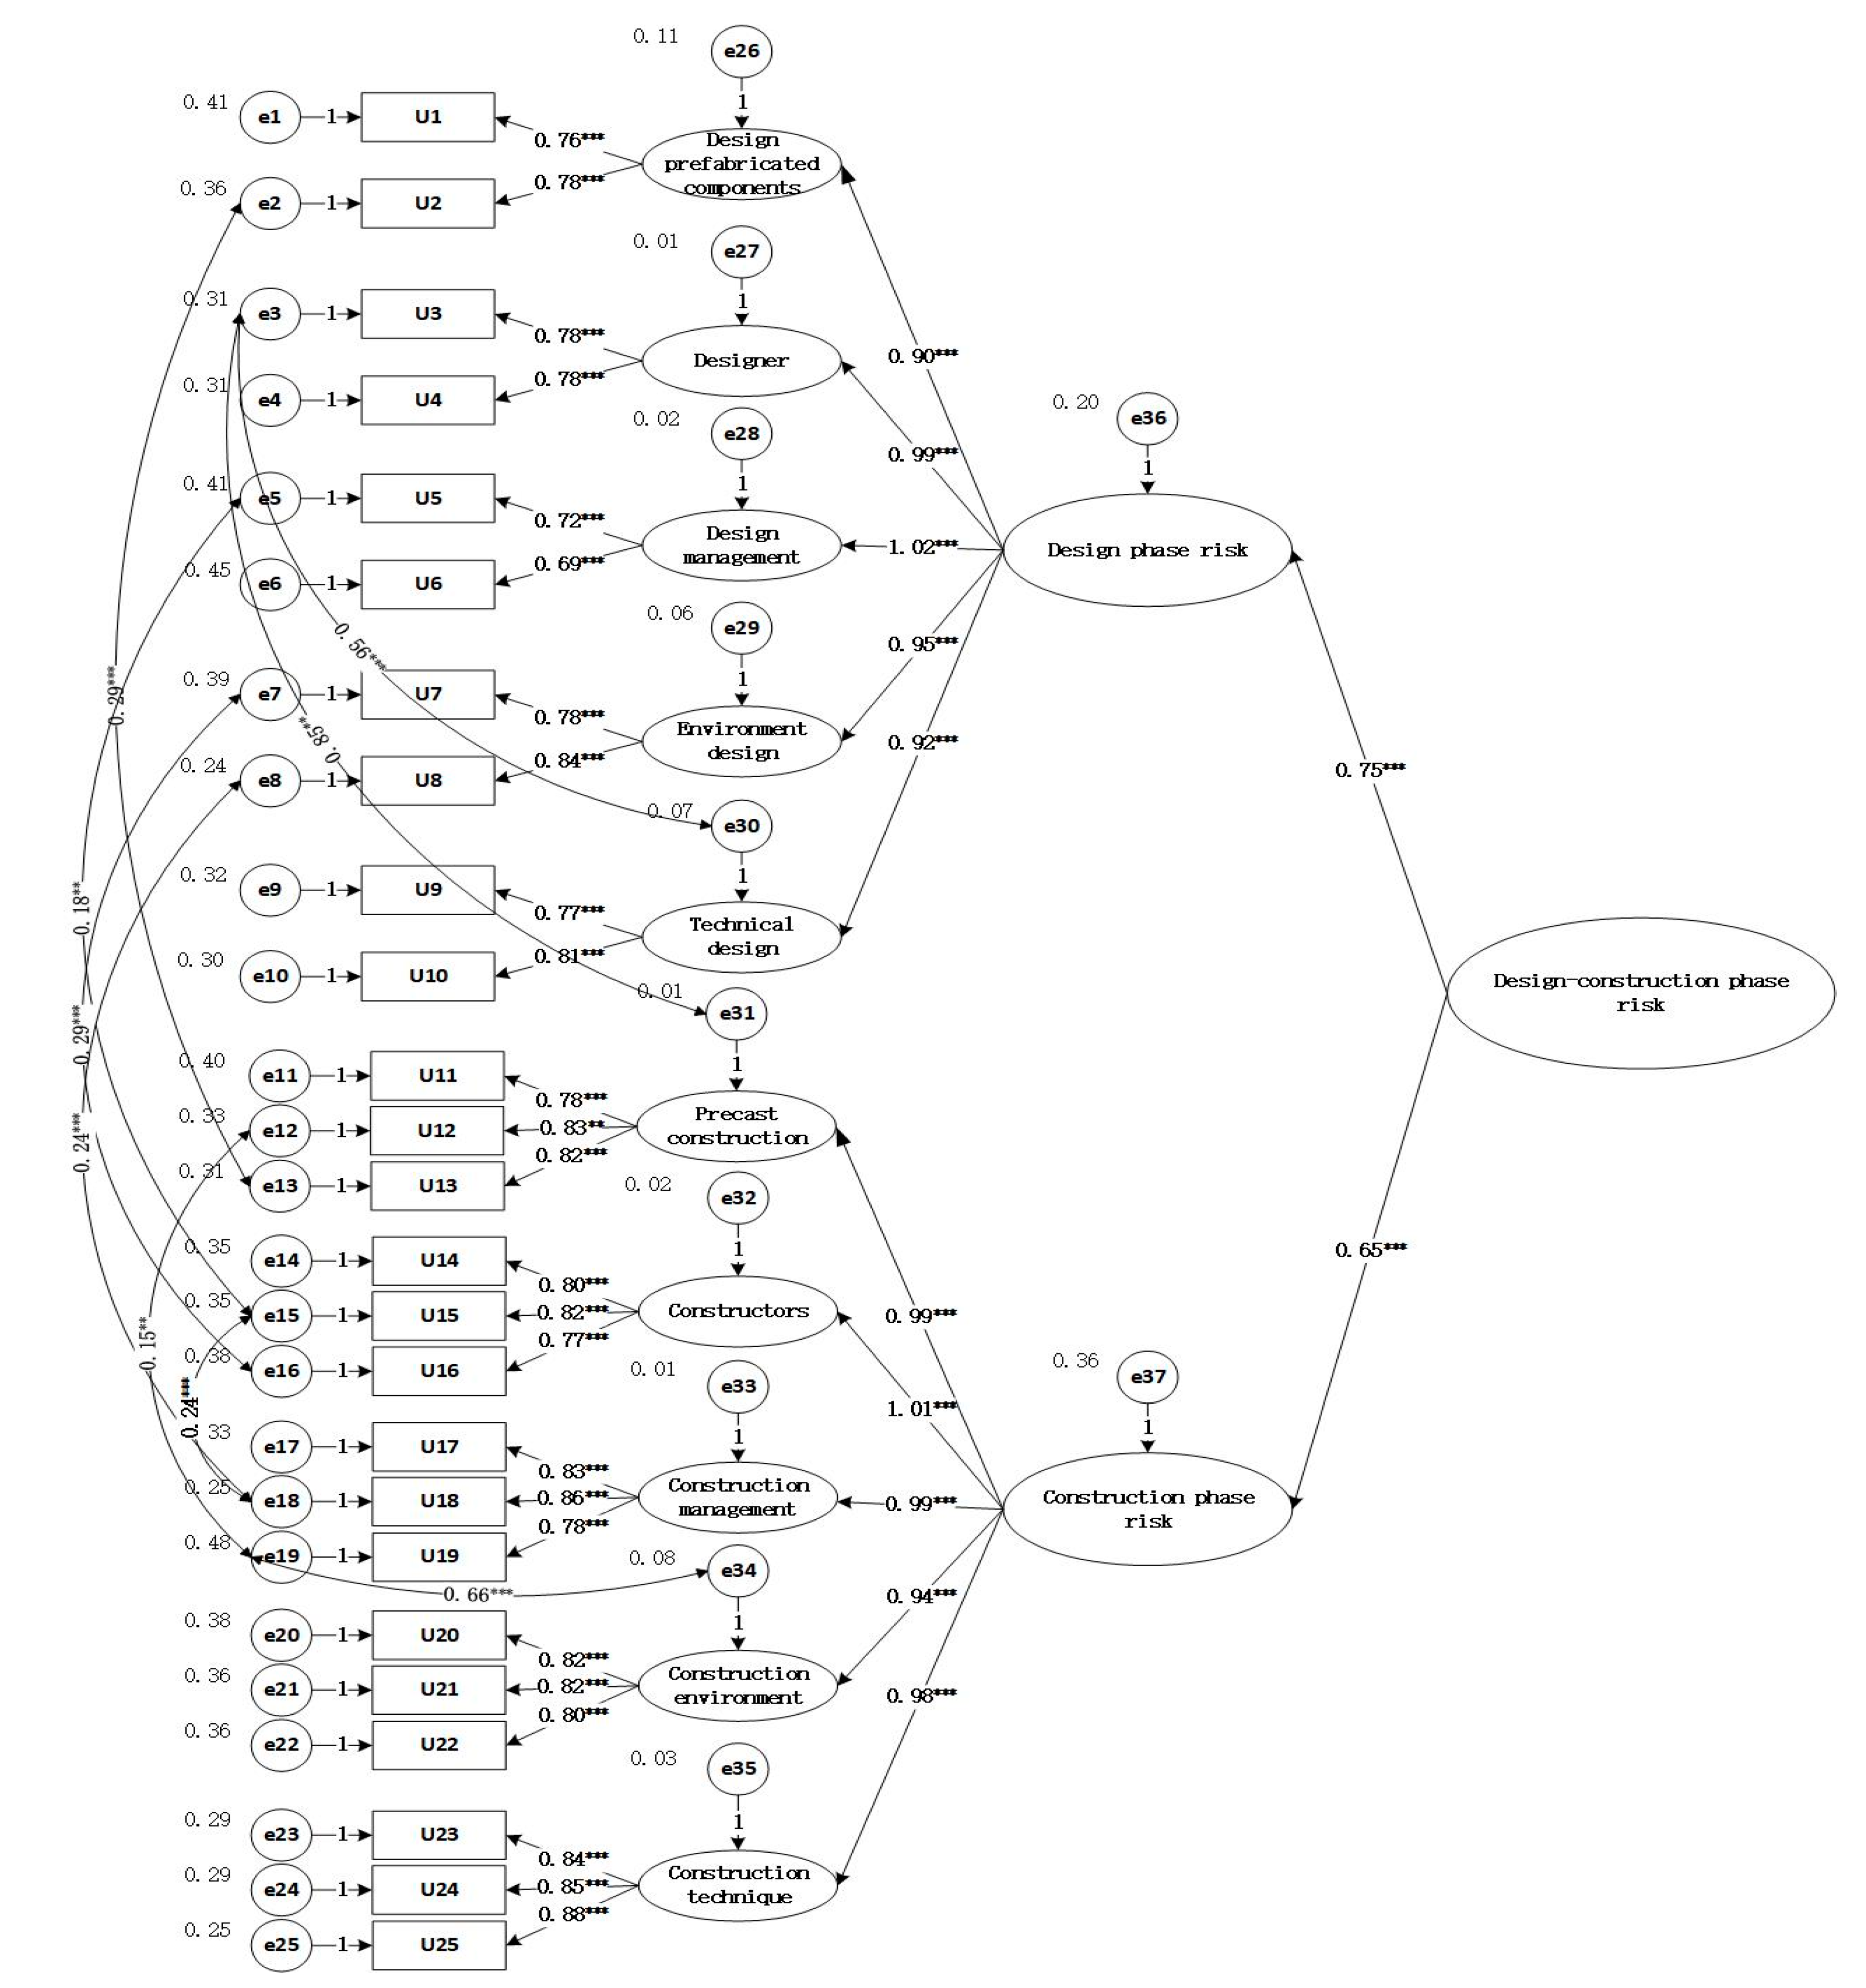
4.2. Second-Order Structural Equation Model

Based on the list of safety risks identified in Table 2, a second-order validated factor analysis model of safety risks in the assembly building design-construction phase was constructed. As shown in Figure 5, 10 first-order safety risks in each of the five dimensions in the two phases are latent variables, and 25 s-order safety risk indicators (U1-U25) are observed variables.
The software AMOS 24.0 was used to test the fit of the data for the risk indicators according to Table 2. Analysis of the model output shows that the residuals of each observed variable are positive. The χ2/df = 2.162, AGFI = 0.825, IFI = 0.948, TLI = 0.940, CFI = 0.947, and RMR = 0.038 fit well, where GFI = 0.858 did not reach the standard of 0.9 or more, RMSEA = 0.062, which was a good fit but did not achieve a good fit. The model was revised according to the data shown and the revised model is shown in Figure 6.
The modified indicators are compared in Table 6. The results show that the fitness is good and that the modified model has a good fit.

4.3. Calculation and Analysis

The weights of each risk factor were further obtained from the standard path coefficients of each indicator to quantify and analyze the safety risks, and the calculation method utilizes the weighted average algorithm as follows.
Q i = P i i = 1 5 P i
Q = P i , j j = 1 k P i , j   ( k   corresponds to the observed variable )
Qj = Qi × Qi,j
where Pi (i = 1, 2,…, 5): second-order path coefficients between the first-order latent variable and the second-order latent variable; Pi, j (j = 1, 2,…, 25): first-order path coefficients between the first-order latent variable and each of the corresponding observed variables (U1-U25); Qi: contribution value of the first-order latent variable to the second-order latent variable. Qi,j: the contribution values of the observed variables (U1-U25) to their corresponding first-order latent variables; Qj: the contribution values of the observed variables (U1-U25) to the second-order latent variables.
In summary, the results of the first-order and second-order structural equation models were summarized, and the weights were calculated as shown in Table 7.

5. Conclusions

The assembled building has significant advantages in terms of efficiency, cost, energy savings, and environmental protection. However, due to the existence of interrelated safety risk factors in the design-construction phase, the current actual project completion is far from the ideal state, and safety accidents occur from time to time. This paper summarizes the safety risk factors through literature analysis, expert interviews, diamond model analysis, and other methods. In addition, by issuing questionnaires to different groups of people, 25 s-level safety risk factors were identified based on 10 first-level risk factors from five dimensions of prefabricated components, personnel, environment, management, and technology in two stages. Based on the structural equation model, the influence relationship analysis and weight analysis between potential variables and observed variables are carried out. The standard path coefficients of each influence factor were then obtained through the model, and the reliability of the model was ensured according to the validation factor analysis. The weights of each influence safety risk factor were calculated by substituting the data analyzed by the model into the formula. The weights were ranked and summarized as follows.
  • The safety risk analysis of an assembled building needs to link the design phase with the construction phase, and the comparison shows that the safety risk analysis of the construction phase is more important than the safety risk of the design phase.
  • In order of importance among the 10 first-level risks: management design risk > construction personnel > prefabricated component construction > construction management risk > design personnel > construction technology risk > environmental design risk > design prefabricated component > construction environment risk > technical design risk.
  • The design of first-level safety risk management design in the design phase has the greatest impact on the safety risk of assembled buildings; the first-level safety risk prefabricated component construction in the construction phase has the greatest safety risk.
  • After linkage analysis of the design-construction phase, the top five second-level risks that jointly affect project safety in the two phases are, in order, the effectiveness of the implementation of the safety inspection system, the risk awareness of construction personnel, the lack of safety management system and supervision mechanism, the level of physical and mental health of construction personnel, and the provision of safety supplies.
  • According to Pareto‘s law, 20% of the key factors affecting safety risks cause 80% of accidents. From the perspective of design-construction stage linkage, the primary measure to prevent the safety risk of prefabricated buildings is to improve the safety management system (U5) in the design stage, and truly implement standardization for a safety inspection and other work in the construction stage to enhance the safety risk awareness of construction personnel (U15). Secondly, the first person responsible for controlling safety risks should be clearly defined, and the safety personnel should be fully equipped in the design stage (U4). According to the characteristics of the project, the safety education of construction personnel should be carried out to improve the risk awareness of construction personnel (U15). Ensure that the site is equipped with sufficient safety management personnel, implement regular follow-up supervision and inspection, and timely detect and correct violations of safety regulations. Third, during the construction process, pay attention to the physical and mental health of construction personnel (U14), and formulate positive and effective risk prevention measures. The design phase strictly follows the safety policy standards and fully considers the policy environment (U8), and clarifies the responsibilities of all parties in safety management. The implementation of a safety post-responsibility system, the responsibility to the people, strengthens the construction stage safety inspection system implementation effectiveness (U18), to improve the project life cycle safety control to contribute.
Based on the above conclusions, the linkage analysis of the design-construction phase can promote the development of assembled buildings, and the safety risks in the construction phase can be reduced by controlling the safety risks in the design phase. The risk factors that affect the project safety in both phases can greatly reduce the safety risks in assembled buildings, reduce the occurrence of safety accidents in the project, and ensure personal safety and property safety. The structural equation model can analyze the relationship and mechanism of safety risks in the design-construction phase and analyze the important risks affecting the safety of assembled buildings in the design-construction phase by calculating the weights, which is a theoretical supplement to the safety risk analysis of completed buildings.
This study can enable the project to avoid risks in a targeted manner, give full play to the advantages of prefabricated buildings in the industry, reduce losses, save costs, respond to the protection of the environment, reduce resource waste, maintain a good living environment for future generations, and enhance the core competitiveness of built buildings.

Author Contributions

Conceptualization, Q.S.; Original draft: R.L.; Formal analysis, J.C., Z.Y. All authors have read and agreed to the published version of the manuscript.

Funding

This research received no external funding.

Data Availability Statement

Data were obtained from questionnaires and structural equation modeling fits.

Acknowledgments

We would like to thank all scholars and experts for filling out the questionnaire and providing their professional opinions, and we thank you for your help with this paper.

Conflicts of Interest

The authors declare no conflict of interest.

References

  1. Li, C.; Chen, J.H. Application of physical element model of contact number in building safety evaluation and prediction. J. Saf. Environ. 2016, 16, 71–75. [Google Scholar] [CrossRef] [PubMed]
  2. Long, D.B.; Wei, J.H.; Yang, C. Knowledge graph improved algorithm for construction behavior safety risk and hazard location identification. Chin. J. Saf. Sci. 2021, 31, 10–16. [Google Scholar] [CrossRef]
  3. Li, C.Z.; Xu, X.; Shen, G.Q.; Fan, C.; Li, X.; Hong, J. A model for simulating schedule risks in prefabrication housing production: A case study of six-day cycle assembly activities in Hong Kong. J. Clean. Prod. 2018, 185, 366–381. [Google Scholar] [CrossRef]
  4. Gunduz, M.; Birgonul, M.T.; Ozdemir, M. Development of a safety performance index assessment tool by using a fuzzy structural equation model for construction sites. Autom. Constr. 2018, 85, 124–134. [Google Scholar] [CrossRef]
  5. Li, H.; Li, Q.M.; Lu, Y. SEM-based safety critical risk analysis of assembly building construction. Chin. J. Saf. Sci. 2019, 29, 171–176. [Google Scholar]
  6. Dong, X.; Xie, Q.; Ji, X.; Liang, X. Safety risk evaluation of super high-rise assembly building construction. Constr. Econ. 2020, 41, 290–293. [Google Scholar] [CrossRef]
  7. Chen, W.; Yang, Z.; Xiong, W.; Xiong, F.; Yang, D.; Niu, L. DEMATEL-BN model for construction safety risk transmission in assembled building projects. Chin. J. Saf. Sci. 2020, 30, 1–6. [Google Scholar] [CrossRef]
  8. Ding, Y.; Tian, Y. Research on quality and safety risk evaluation of assembled building construction. Constr. Econ. 2019, 40, 80–84. [Google Scholar] [CrossRef]
  9. Chang, C.; Wu, X. Research on safety risk evaluation of assembled building construction. Constr. Econ. 2018, 39, 49–52. [Google Scholar] [CrossRef]
  10. Li, W.-L.; Li, H.-M.; Meng, H.; Pei, X.-W. Safety risk assessment of assembly building construction based on entropy power-uncertainty measure theory. J. Xi’an Univ. Archit. Technol. (Nat. Sci. Ed.) 2019, 51, 369–374. [Google Scholar] [CrossRef]
  11. Yang, S.L.; Huang, H.; Liu, W.; Liu, L. Safety risk evaluation of assembly building construction based on structural entropy power and modified evidence theory. Saf. Environ. Eng. 2019, 26, 143–149+153. [Google Scholar] [CrossRef]
  12. Chen, W.G.; Yang, H.Y.; Gao, C.G. Life-cycle safety evaluation of assembled buildings considering vulnerability. J. Saf. Environ. 2020, 20, 2069–2078. [Google Scholar] [CrossRef]
  13. Tao, M. Research on evaluation and control of safety risk of assembly building construction based on system dynamics. Xi’an Univ. Technol. 2021. [Google Scholar] [CrossRef]
  14. Zhao, T.; Zhou, W.; Xu, K.; He, L. Safety risk analysis and Bayesian modelling of tower crane use phase. Sci. Technol. Eng. 2019, 19, 350–356. [Google Scholar]
  15. Xiahou, Y.; Yue, Y.; Lu, Y.; Yuan, J.; Li, Q. A review of safety-oriented design research. J. Eng. Manag. 2016, 30, 7–12. [Google Scholar]
  16. Lu, Y.; Zhang, X. Safety risk assessment of prefabricated building construction based on SEM and fuzzy comprehensive evaluation method. J. Chang. Univ. Sci. Technol. (Nat. Sci. Ed.) 2021, 18, 38–44. [Google Scholar] [CrossRef]
  17. Yang, Z.; Ding, G.; Zhang, T.; Xiang, M. Study on the influencing factors of unsafe behavior transmission of construction workers based on SEM. J. Saf. Environ. 2018, 18, 987–992. [Google Scholar] [CrossRef]
  18. Duan, Y.; Zhou, S.; Guo, Y.; Wang, X. Safety risk and strategy of prefabricated building construction based on SEM. Accord. J. Civ. Eng. Manag. 2020, 37, 70–75+121. [Google Scholar] [CrossRef]
  19. Yang, M.; Zhou, J.; Yang, J.; Chen, Y. Identification of influencing factors of prefabricated building cost and ISM-MICMAC analysis. Proj. Manag. Technol. 2022, 20, 60–68. [Google Scholar]
  20. Wu, M.L. Questionnaire Statistical Analysis Practice—SPSS Operation and Application; Chongqing University Press: Chongqing, China, 2010. [Google Scholar]
  21. Hou, J.T. Structural Equation Modelling and Its Applications; Educational Science Publishing House: Beijing, China, 2004. [Google Scholar]
  22. Zaira, M.M.; Hadikusumo, B.H.W. Structural equation model of integrated safety intervention practices affecting the safety behaviour of workers in the construction industry. Saf. Sci. 2017, 98, 124–135. [Google Scholar] [CrossRef]
Figure 1. Assembled Building Design—Construction Phase Safety Risk Diamond Model.
Buildings 13 00949 g001
Figure 2. First-order confirmatory factor analysis model in the design stage.
Buildings 13 00949 g002
Figure 3. First-order confirmatory factor analysis model in the construction stage.
Buildings 13 00949 g003
Figure 4. Revised first-order confirmatory factor analysis model in the construction stage.
Buildings 13 00949 g004
Figure 5. Second-order confirmatory factor analysis model.
Buildings 13 00949 g005
Figure 6. Revised second-order confirmatory factor analysis model.
Buildings 13 00949 g006
Table 1. Comparison between traditional buildings and prefabricated buildings.
DimensionalityTraditional Building Features and DisadvantagesFeatures and Advantages of Assembled Buildings
Prefabricated componentsHigh consumption of materials on siteControllable dimensional deviation, easy quality assurance
PeopleHigh personnel requirements and high costsInformation and standardization, improve production efficiency
ManagementLow degree of mechanization, the high influence of uncertaintiesIntegrated design-construction management
EnvironmentThe construction site is not suitable for management, and pollution is seriousLess construction waste, energy saving, and environmental protection
TechnologyThe complex construction process, many personnel, long construction periodSimple construction and short construction period
Table 2. Identification list of influencing factors of safety risks in prefabricated building design-construction stage.
Potential VariablesStage DivisionObserved Variables
Prefabricated componentsDesign PhaseDesign accuracy of prefabricated components U1 [5,6,12]
Transportation vehicle to meet the dimensional load requirements of the members U2 [6,9]
Construction PhaseSafety state of prefabricated components U11 [5]
Stability of temporary support system U12 [8,9,10,11,12,13]
Input of safety supplies U13 [5,8]
OperatorsDesign PhasePersonnel experience and safety awareness level U3 [6,7,10,11,13,15]
Safety staffing arrangement U4 [8,9,14,16]
Construction PhaseLevel of physical and mental health of construction personnel U14 [10,13]
Risk awareness of construction personnel U15 [6,9,10,16]
Personnel working in violation of rules and regulations U16 [4,7,13]
Management riskDesign PhaseLack of safety management system and supervision mechanism U5 [2,8,11]
Project management mode U6 [16]
Construction PhaseMultiparty coordination management status U17 [3,5,16]
Safety inspection system implementation effectiveness U18 [6,8,11,13]
Risk of engineering changes U19 [7]
Environmental riskDesign PhaseIdentification of hazard sources around the construction site U7 [2,8,11,16]
Safety standard policy environment U8 [12,15,16]
Construction PhaseNatural Environment Conditions U20 [4,8,14]
Force majeure factors U21 [16]
Component transportation environment U22 [9,13]
Technology riskDesign PhaseConstruction Organization Design and Program U9 [2,8,16]
Deepening design risk U10 [7,11]
Construction PhaseSafety inspection technology U23 [10,12]
Quality and safety technical delivery U24 [2]
Safety protection technology U25 [5,10,13]
Table 3. Distribution of basic information of respondents.
PropertiesClassificationPercentage of %PropertiesClassificationPercentage of %
IndustryConstruction Unit15.18Years of work1–3 years34.32
Construction Unit18.483–5 years14.85
Design Unit17.825–10 years23.76
Consulting Unit5.9410–20 years18.8
Component Manufacturers6.620 years or more8.25
Universities and Research Institutes27.72
Others8.25TitleSenior5.94
Education backgroundDoctor13.53Associate High23.1
Master23.76Intermediate36.3
Undergraduate47.85Junior and below21.45
Specialized and below14.85Other13.2
Table 4. The acceptable range of indicators.
Indicator NameAcceptable RangeIndicator NameAcceptable Range
χ2/df≤3.00 Good fitIFI>0.90
RMSEA<0.05 Good fitTLI>0.90
<0.08 Good fitCFI>0.90
<0.10 Fair fitRMR<0.05 Good fit
GFI>0.90<0.08 Good fit
AGFI>0.80
Table 5. Analysis and comparison of the first-order confirmatory factors in the revised construction stage.
Indicator NameStandardBefore AmendmentAfter AmendmentChanges
χ2/df≤3.00 Good fit2.7911.954Improvement of 30.0%
RMSEA<0.05 Good fit0.0340.028Improvement of 18.0%
<0.08 Good fit
<0.10 Fair fit
GFI>0.900.8970.932Improvement of 3.9%
AGFI>0.800.8550.900Improvement of 5.0%
IFI>0.900.9620.980Improvement of 1.9%
TLI>0.900.9520.975Improvement of 2.4%
CFI>0.900.9610.980Increase by 2.0%
RMR<0.05 Good fit0.0770.056Improvement of 27.3%
<0.08 Good fit
Table 6. Comparison of the modified second-order validated factor analysis.
Indicator NameStandardBefore AmendmentAfter AmendmentChanges
χ2/df≤3.00 Good fit2.1621.599Improvement of 26.1%
RMSEA<0.05 Good fit0.0380.035Improvement of 7.9%
<0.08 Good fit
<0.10 Fair fit
GFI>0.900.8580.900Improvement of 4.7%
AGFI>0.800.8250.873Improvement of 5.5%
IFI>0.900.9480.974Improvement of 2.7%
TLI>0.900.9400.969Improvement of 3.0%
CFI>0.900.9470.974Improvement of 2.8%
RMR<0.05 Good fit0.0620.045Increase by 27.5%
<0.08 Good fit
Table 7. Safety risk weight of prefabricated building design-construction stage.
Stage
Divisions
Potential VariablesQiFirst-Level Risk RankingObservations
Variables
Qi,jQjSecond-Level Risk
Intrastage Ranking
Average
Weight
Second-Level Risk
Total Ranking
Design StageDesigning prefabricated components0.1298U10.4880.06380.02125
U20.5120.06650.02215
Designers0.1355U30.4870.06660.02216
U40.5130.06920.0238
Managing design risks0.1401U50.5110.07210.0243
U60.4890.06830.0239
Environmental design risk0.1307U70.4840.06390.02121
U80.5160.06740.02212
Technical design risk0.12810U90.4890.063100.02123
U100.5110.06570.02217
ConstructionStagePrecast construction0.1363U110.3200.044110.02218
U120.3400.04650.0236
U130.3400.04640.0235
Construction personnel0.1402U140.3310.04630.0234
U150.3440.04820.0242
U160.3250.04670.02310
Construction management risk0.1354U170.3360.04580.02311
U180.3570.04810.0241
U190.3070.041150.02124
Construction environment risk0.1289U200.3370.043120.02219
U210.3360.043130.02220
U220.3270.042140.02122
Construction technology risk0.1356U230.3270.044100.02214
U240.3310.04590.02213
U250.3420.04660.0237
Disclaimer/Publisher’s Note: The statements, opinions and data contained in all publications are solely those of the individual author(s) and contributor(s) and not of MDPI and/or the editor(s). MDPI and/or the editor(s) disclaim responsibility for any injury to people or property resulting from any ideas, methods, instructions or products referred to in the content.

