Article

Effect of Fibre Orientation on the Bond Properties of Softwood and Hardwood Interfaces

School of Engineering, Deakin University, Geelong, VIC 3216, Australia
*
Author to whom correspondence should be addressed.
Buildings 2023, 13(4), 1011; https://doi.org/10.3390/buildings13041011
Submission received: 16 February 2023 / Revised: 3 April 2023 / Accepted: 5 April 2023 / Published: 12 April 2023
(This article belongs to the Special Issue Recent Developments in Timber Engineering)

Abstract

:
Increasing concerns regarding carbon emissions and climate change are prompting a shift toward the use of sustainable materials in the construction industry. Engineered timber products are gaining attention in the construction industry due to advancements in lamination techniques and adhesives as well as the renewable characteristics of wood. Bond properties play a significant role in engineered timber products. In Australia, Radiata Pine (RP, softwood) and Shining Gum (SG, hardwood) share a large proportion of local and native plantation forest resources. The present paper investigates the bond behaviours of Australian softwoods (RP–RP), hardwoods (SG–SG) and hybrid-wood (RP–SG) combinations in both parallel (PAL) and perpendicular (PER) bonding directions using one-component polyurethane adhesives. The results indicate that most of the softwood samples were subjected to wood-side (timber) failure, whereas hardwood samples failed due to delamination but exhibited higher strength and stiffness regardless of bond direction. In contrast, bond direction had a significant effect on the bond characteristics of hybrid configurations. Improved bond properties were observed when bonded in PAL directions; however, negative effects were seen when bonded in PER directions. Obtained characteristic (5th percentile) shear bond strengths for RP–RP–PAL, RP–SG–PAL and SG–SG–PAL samples were 3.88 MPa, 6.19 MPa and 8.34 MPa, whilst those for RP–RP–PER, RP–SG–PER and SG–SG–PER samples were 3.45 MPa, 2.96 MPa and 7.83 MPa, respectively.

1. Introduction

Engineered timber products are normally made from sawn boards, veneers and/or lamellae, which are glued together using structural adhesives. Appropriate lamination techniques could ensure strength properties that are comparable to traditional construction materials and that show good potential to be widely used in future sustainable construction [1]. Various species have been used to manufacture laminated products, such as European wood species (Norway Spruce [2,3,4,5,6], Irish Sitka Spruce [7] and Beech [8,9]), North American softwoods [10], Canadian Black Spruce species [11,12], Hemlock [13], Japanese Cedar [14], New Zealand and Australian Radiata Pine [1,15,16], etc. However, the composite action of these products relies strongly on the bond behaviour at the interface between lamellae [17]. In glue-laminated timber (GLT), the fibres of the lamellae run parallel to each other [18]. However, for cross-laminated timber (CLT), the fibres are oriented in orthogonal directions (Figure 1) [19]. Previous research [20] indicates that differences in the fibre orientation of anisotropic materials affect the bond properties. This effect of difference in fibre orientation between two consecutive layers can be magnified if multiple species, e.g., different species of softwood / hardwood or combinations of hardwood and softwood, are used to make cross-laminated timber.
Wood species and adhesives are reported to affect the bond behaviours of engineered timber products [2,9,21,22,23,24,25]. Bond performance at the wood interface is influenced by a number of factors, which include, but are not limited to, the species, the treatment of wood (chemical/thermal), the type of adhesive used, the bond line thickness attained, the curing period, the environment in which bonding and curing are performed, the surface of the timber substrate, the manufacturing process (amount of adhesive, pressure applied, duration of pressure, etc.) and the moisture content [26]. Hardwood usually exhibits relatively complex anatomy compared to softwood [27]. Hardwoods have vessels/lumen which have different diameters and sizes along the length of a specimen, whereas softwoods do not contain lumen. In general, maximum bond performance at a wood interface is achieved when the applied adhesives ‘wet’ the wood surface and allow effective components to sufficiently penetrate the wood structures [27]. However, the dense structure of hardwood species makes the penetration process relatively difficult, affecting the bond strength in a negative way [17,28].
Figure 1. Bond directions in mass timber products, GLT and CLT [28].
Buildings 13 01011 g001
At present, Australia has a total plantation area of 125 million hectares, out of which 45% and 55% are planted with various hardwood and softwood species, respectively [29]. Softwood species, such as Radiata Pine (Pinus radiate D. Don), are used as general purpose timber since they are planted widely across South Australia, Victoria and New South Wales. In recent years, due to the advantage of relatively higher mechanical properties, environmentally managed plantations consisting of hardwood species have increased. For instance, Shining Gum (Eucalyptus nitens) is used for the manufacturing of engineered timber products (CLTP Tasmania). In terms of the structural adhesives used for gluing timbers, melamine-urea-formaldehyde (MUF), phenol-resorcinol-formaldehyde (PRF), one-component polyurethane (PUR) and emulsion-polymer-isocyanate adhesives (EPI) can be used, as recommended in some standards [19,30] and industrial handbooks [31,32]. Among these structural adhesives, PRF and PUR are widely used since they are easily accessible and cost-effective. Moreover, they have high strength in both dry and wet conditions and exhibit good resistance to water and damp atmospheres [33]. In addition, PRF excels at being more resistant to wood at high temperatures and during chemical ageing. PUR shows a gap-filling property that enhances the penetration of adhesive into wood, which may be beneficial to bond hardwoods. It is commercially available in the Australian market, and it has been adopted by XLam, Australia (Australia’s largest CLT manufacturer) for manufacturing their mass timber products [34].
Research on the bond performance of softwoods or hardwoods has been conducted in recent years. For instance, the bond properties of softwood Canadian hem-fir lumbers (a species combination of western hemlock, Tsuga heterophylla, and amabilis fir, Abies amabilis) in perpendicular to fibre directions were investigated by J.B Wang et al. [21]. They reported that the adhesive type and applied pressure affected the bond properties of hem-fir lumbers. A bond strength of 2.7 MPa was obtained when a PUR adhesive was used under an applied pressure of 0.83 MPa during manufacturing. M. Li et al. [22] conducted research on the bond properties of CLT made from Larix kaempferi (softwood). They found that the bonding pressure and absorption of adhesives within the wood affected the bond performance. In terms of bond strength using PUR, a mean value of 2.0 MPa was reported. Z. Lu et al. [23] conducted research on the bond properties of small-diameter Eucalyptus timber (Eucalyptus urophylla × E. grandis, hardwood) to examine the effects of adhesives and surface treatment. They reported that surface treatment could generally enhance the bond performance and mechanical properties of eucalyptus CLT when PUR adhesives were used; a bond strength of 3.5 MPa was attained. N.M Yusofa et al. [24] used a block shear test to investigate the bond properties of two-layer laminated lumber (with grains parallel to each other) made from Acacia mangium (hardwood) with the aim of considering the effects of bonding pressure using PRF and PUR adhesives. They reported that the shear strength increased with the bonding pressure regardless of adhesive type and recommended using higher pressure for hardwoods to achieve higher properties for fabricating mass timber products.
The adoption of lamination techniques for making mass timber products has been beneficial to the upcycling of residual lower-grade timber [1], and further optimisation of these products could be achieved by using multiple species. P. Santos et al. [25] investigated the bonding quality of orthogonally arranged lamellae made from Maritime pine (Pinus pinaster Ait., softwood) combined with Australian blackwood (Acacia melanoxylon R.Br., hardwood) using a one-component polyurethane adhesive. Their study reported that the hybrid sample showed slightly better shear bond strength than samples made from the same species when lower bonding pressure was applied during manufacturing. In contrast, M. Brunetti et al. [9] investigated the bond properties of beech–spruce (hardwood–softwood) using various adhesives (PUR, MUF and primer) and press systems. They reported that the use of hybrid lamellae affected the bond properties; significantly lower bond strength was obtained for beech–spruce samples (4.0 MPa, PUR) when compared with that of beech–beech samples (6.1 MPa, PUR). In addition, they found that different adhesives yielded similar outcomes regarding bond properties for hybrid configurations. Despite the fact that PUR showed less favourable performance for hardwood configurations, the use of primer improved the overall bond quality. These studies highlight the challenges, e.g., changes in bond performance, that arise when using multiple species in manufacturing engineered timber products.
In recent years, hardwood CLT has become a research focus due to the availability of hardwood in Australia and around the world. However, pure hardwood also adds weight due to its higher density. Accordingly, the authors are working on producing softwood–hardwood hybrid CLT. In order to produce hybrid CLT, it is important to evaluate the bond performance first. As such, the effect of multiple species (softwood and hardwood) on bond strength are investigated in this study. In addition, the effect of relative fibre orientation is also considered due to the fact that sawn boards are oriented orthogonally to each other between layers, which is reported to be another influential parameter [20].
The current study investigates bond behaviour at the interface of Australian softwoods (Radiata Pine–Radiata Pine), hardwoods (Shining Gum–Shining Gum) as well as their combination (Radiata Pine–Shining Gum). Furthermore, for all three combinations, the bond performance was observed when the fibres of the adjacent layers were parallel and perpendicular to each other. PUR was selected as the adhesive due to its widespread use for producing cross-laminated timber. Typical loading histories and failure modes were carefully observed. Obtained test results were used to assess bond strength and bond stiffness, and how these parameters are affected due to changes in bond directions, species (lamellae combinations) as well as failure modes.

2. Test Methodology

2.1. Material and Sample Preparation

Commercial timber lamellae made from Australian softwood (Radiata Pine, RP) and hardwood (Shining Gum, SG) with the dimensions of 35 mm × 120 mm × 1400 mm (thickness t × width w × length l) were used as raw materials in the current study. The Radiata Pine was sourced from AKD softwoods, which are grown in Colac, Victoria. The Radiata Pine, which is mostly used for structural timber in Australia, was purchased off-the-shelf and had a strength grade of MGP 10 (machine-graded). The Shining Gum was sourced from the Bambra Agroforestry Farm in Colac, Victoria. The Shining Gum was cut at the age of 25 years and was kiln-dried. In order to minimise the effects of variation in the mechanical properties of the wood, all of the specimens related to Shining Gum were sourced from one tree. Radiata Pine is a standard product with good consistency and has a vigorous process of strength-grading. Its typical material properties are shown in Table 1. High-performing one-component polyurethane adhesives (PUR, LOCTITE® HB S309 PURBOND) from Henkel Australia were used. These adhesives are formaldehyde-free and meet the requirements of adhesive type I according to the standard AS/NZS 4364 [35]. As per the manufacturer datasheet, the assembly and press times were 30 and 75 min, respectively. The HB S309 had a viscosity of approximately 24,000 MPa/s and a density of 1160 kg/m3. It is worth noting that no primer was used for the hardwood samples.
Samples were prepared to examine the bond behaviours of RP–RP, SG–SG and RP–SG. To investigate the bond behaviour in different fibre directions, 35 (t) × 120 (w) × 1400 (l) mm sized lamellae were glued in both parallel-to-grain (PAL) and perpendicular-to-grain (PER) directions. All specimens were manufactured in the structural laboratory of Deakin University, including sample preparations and subsequent cutting processes. Preparation of the samples involved cutting and planing the specimens to the specified dimensions. PUR was then applied on the target areas at an amount of 160 g/m2, as recommended in the handbook (LOCTITE HB S309 PURBOND). Lamellae were assembled following the aforementioned design configurations and then placed under a press machine with a distribution load of 0.8 MPa for 2.5 h, as illustrated in Figure 2. After that, the samples were stored in a conditioning chamber for 24 h. At the end of the conditioning period, block shear testing samples, with dimensions of 60 (30 × 2) (t) × 50 (w) × 50 (l) mm, were cut from the continuous beam. Natural defects and knots were avoided while the block shear samples were cut. The densities of the lamellae were measured prior to testing; recorded values at an equilibrium moisture content of 8% were 481 ± 10.5 kg/m3 and 900 ± 28 kg/m3 for Radiata Pine and Shining Gum, respectively. Details of the specimen categories are summarised in Table 2. Sample designations represent lamellae type–bond directions and serial numbers.

2.2. Test Setup and Evaluation

Block shear tests were carried out using a custom-designed rig, as shown in Figure 3a. EN16351 (Annex D) [19] was followed for the block shear testing. Samples were supported laterally to ensure that pure shear forces were acting at the interface. The load was applied using a 300 kN INSTRON universal testing machine at a displacement control rate of 0.25 mm/min until the bond surface was sheared. For both the PAL and PER configurations, a compressive load was applied parallel to the grain direction, as shown in Figure 3b. In the RP–SG scenario, the Radiata Pine board was kept parallel to the force direction (Figure 3c) where the load was applied. In addition, for the perpendicularly glued boards, an RT plane was used in all scenarios, as illustrated in Figure 3c.
The bond strength τbond and bond stiffness ks are two important parameters that were obtained from the tests using Equations (1) and (2).
τ b o n d = V u A b o n d
k s = τ b o n d , 2 τ b o n d , 1 δ 2 δ 1
where Vu is the maximum shear load of the test sample; Abond is the bonding area; τbond,1 and τbond,2 represent the bond stresses recorded from the test related to 0.1 τbond and 0.4 τbond; and δ1 and δ2 are relevant displacements corresponding to aforementioned τbond,1 and τbond,2, respectively.

2.3. Statistical Analysis

Analysis of variance (ANOVA) and pairwise comparisons using Fisher’s least significant difference (LSD) test were used for pairwise comparisons of groups using the commercial software Minitab. An analysis of variance was conducted to determine standard error, R2 value and p-value (at 5% level of significance). When there were more than two entities (e.g., more than two combinations) which affected the outcome (rolling shear modulus and strength), a pairwise t-test was conducted to determine how different the outcome values were from one entity to the other. Finally, combined (or interaction) effects of multiple parameters (species, relative fibre orientation) were also evaluated and depicted in the interaction plots.

3. Results and Discussion

3.1. Failure Modes

Typical failure modes of the bonded interface included timber failure, bond line failure, combination of timber failure and adhesive failure. Timber failure refers to the complete failure of the wood rather than of the adhesive, whilst delamination at the interface is defined as bond line failure. N.M. Yusof et al. [24] reported that a high percentage of timber failure is preferred as the load characteristics used for design can be obtained directly from the known strength of the lamellae, which is not affected due to the quality of the bond line.
The current study considered two key variables, lamella combinations (RP–RP, RP–SG and SG–SG) and bond directions (parallel-to-grain vs. perpendicular-to-grain), that typically affect bond behaviour in mass timber products. The following section presents typical failure modes and the relevant loading histories of the samples considered in the current study.

3.1.1. RP–RP Samples

Figure 4 shows the loading curves for all tested RP–RP samples that were bonded in both parallel-to-grain (PAL) and perpendicular-to-grain (PER) directions.
For softwood PAL samples, the typical failure mode was timber failure, and all seven tested specimens fell in this category. This failure mode was characterised by major cracks in timber resulting in the crushing of timber at the end of shear loading, as illustrated in Figure 4a. Obtained curves exhibited a similar trend during the initial stages of loading but showed different slip patterns after cracking: RP–RP–PAL-1/3/5 samples had a rapid descending stage once cracking initiated, while RP–RP–PAL-2/4/6/7 samples were able to withstand additional loads, showing more ductile behaviours before the crushing of the lamellae. The ultimate load carrying capacity for RP–RP–PAL samples were in the range of 12.96–19.77 kN, resulting an average shear force of 17.07 kN and a COV of 0.145. Meanwhile, an initial stiffness of 11.53 kN/mm and a COV of 0.053 were obtained.
For softwood PER samples, timber failures (two out of seven) and mixed failures (five out of seven) were observed, as illustrated in Figure 4b. It is shown that the dominant failure mode was the mixed type, where delamination (bond failure) and tearing of grains occur simultaneously. Obtained curves exhibited similar trends during the initial stages of loading resistance, followed by a ductile but noticeable descending stage. However, when compared to samples with mixed failure modes, samples with timber failure showed higher load carrying capacities (14.17 vs. 11.03 kN) and initial stiffness (12.31 vs. 7.72 kN/mm). In general, the ultimate load carrying capacity for RP–RP–PER samples was 10.29 kN–14.68 kN (with a mean of 11.92 kN and a COV of 0.134).
It is worth noting that the failure mode affected the bond behaviour during the early stage of loading in the softwood–softwood configuration. Samples with timber failures showed considerably higher values of initial stiffness (59% higher) but lower slip at ultimate loads (20% lower) when compared to those recorded for mixed modes, as shown in Figure 4b. However, when considering the same failure modes regardless of bonding directions (timber failures, PAL 1-7 and PER 1/2), no significant difference was observed (6.3% difference in initial stiffness, 1.4% difference in slip at ultimate load, PAL vs. PER).

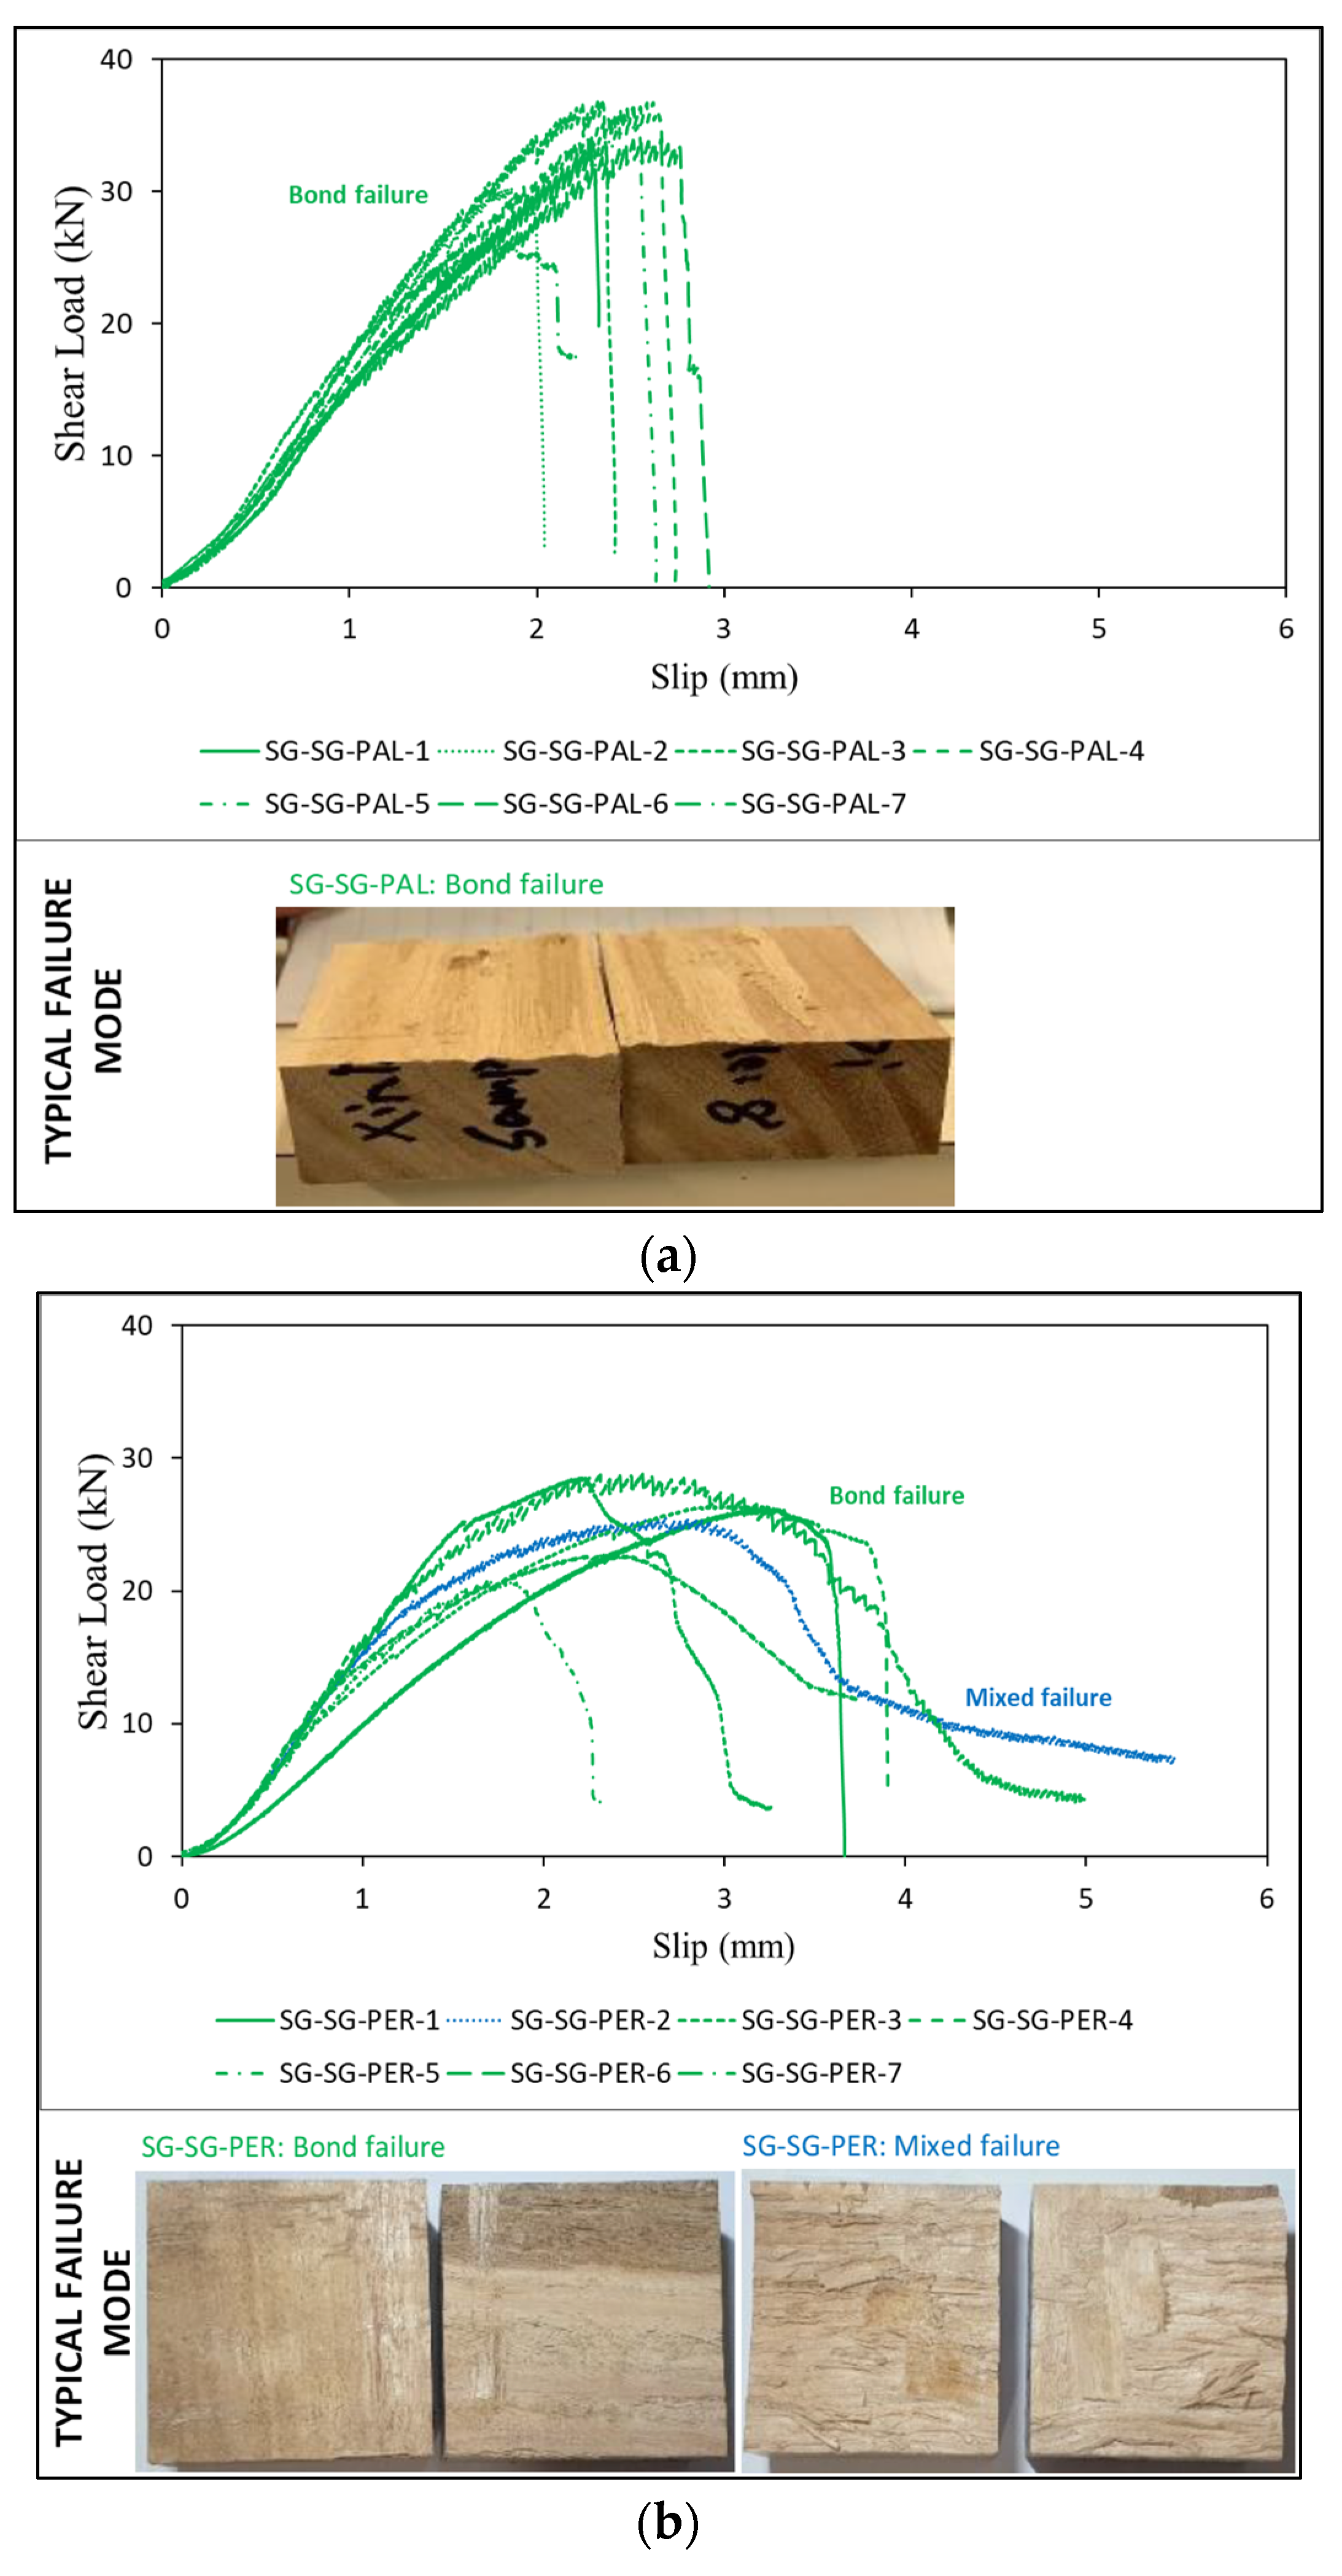
3.1.2. SG–SG Samples

Figure 5 shows the load vs. slip curves for all tested SG–SG samples.
The typical failure mode for tested hardwood SG–SG–PAL samples was observed to be bond failure. All samples failed with clear interface delamination at the bond line, as shown in Figure 5a. The observed type of failure was characterised by delamination of the entire bond interface without damage of woodside areas. This phenomenon could be caused by insufficient penetration of the adhesive into the wood components as a result of the denser microstructure of hardwoods, which makes the penetration progress relatively more difficult than in softwoods; therefore, the bond line becomes the weakest link contributing to the delamination during loading. Obtained curves showed a constant slip pattern with a nearly linear increase in load-up to the peak point followed by a sharp decline, indicating the delamination of the bond interface. The ultimate shear loads for SG–SG–PAL samples were in the range of 26.24–36.99 kN, showing an average shear load of 33.42 kN and a COV of 0.110, whereas relevant initial stiffnesses were 17.22–22.48 kN/mm, with a mean value of 19.91 kN/mm and a COV of 0.093.
Similar to the PAL samples, bond delamination was confirmed as the dominant failure mode in the PER samples. The only exception was the SG–SG–PER-2 sample, which exhibited mixed mode failure. However, woodside tearing was very close to the bond line. All of the other six samples showed clear bond line delamination, as illustrated in Figure 5b. In terms of slip histories, relatively ductile curves accompanied by some fluctuations were observed in the PER samples when compared to the PAL specimens. Nevertheless, differences in failure modes for the PER samples did not significantly affect their ultimate shear load and initial stiffness. The obtained mean ultimate shear forces for bond failure and mixed failure samples were 25.60 kN and 25.54 kN, respectively, while those two failure modes attained initial stiffness values of 18.10 kN/mm and 19.00 kN/mm, respectively.
Although load vs. slip curves for PAL and PER samples showed some obvious differences, relatively consistent values of initial stiffness and slip at ultimate loads were obtained for both samples. Obtained results showed a 9.2% difference in initial stiffness (PAL vs. PER) and a 9.6% difference in slip values (PAL vs. PER).

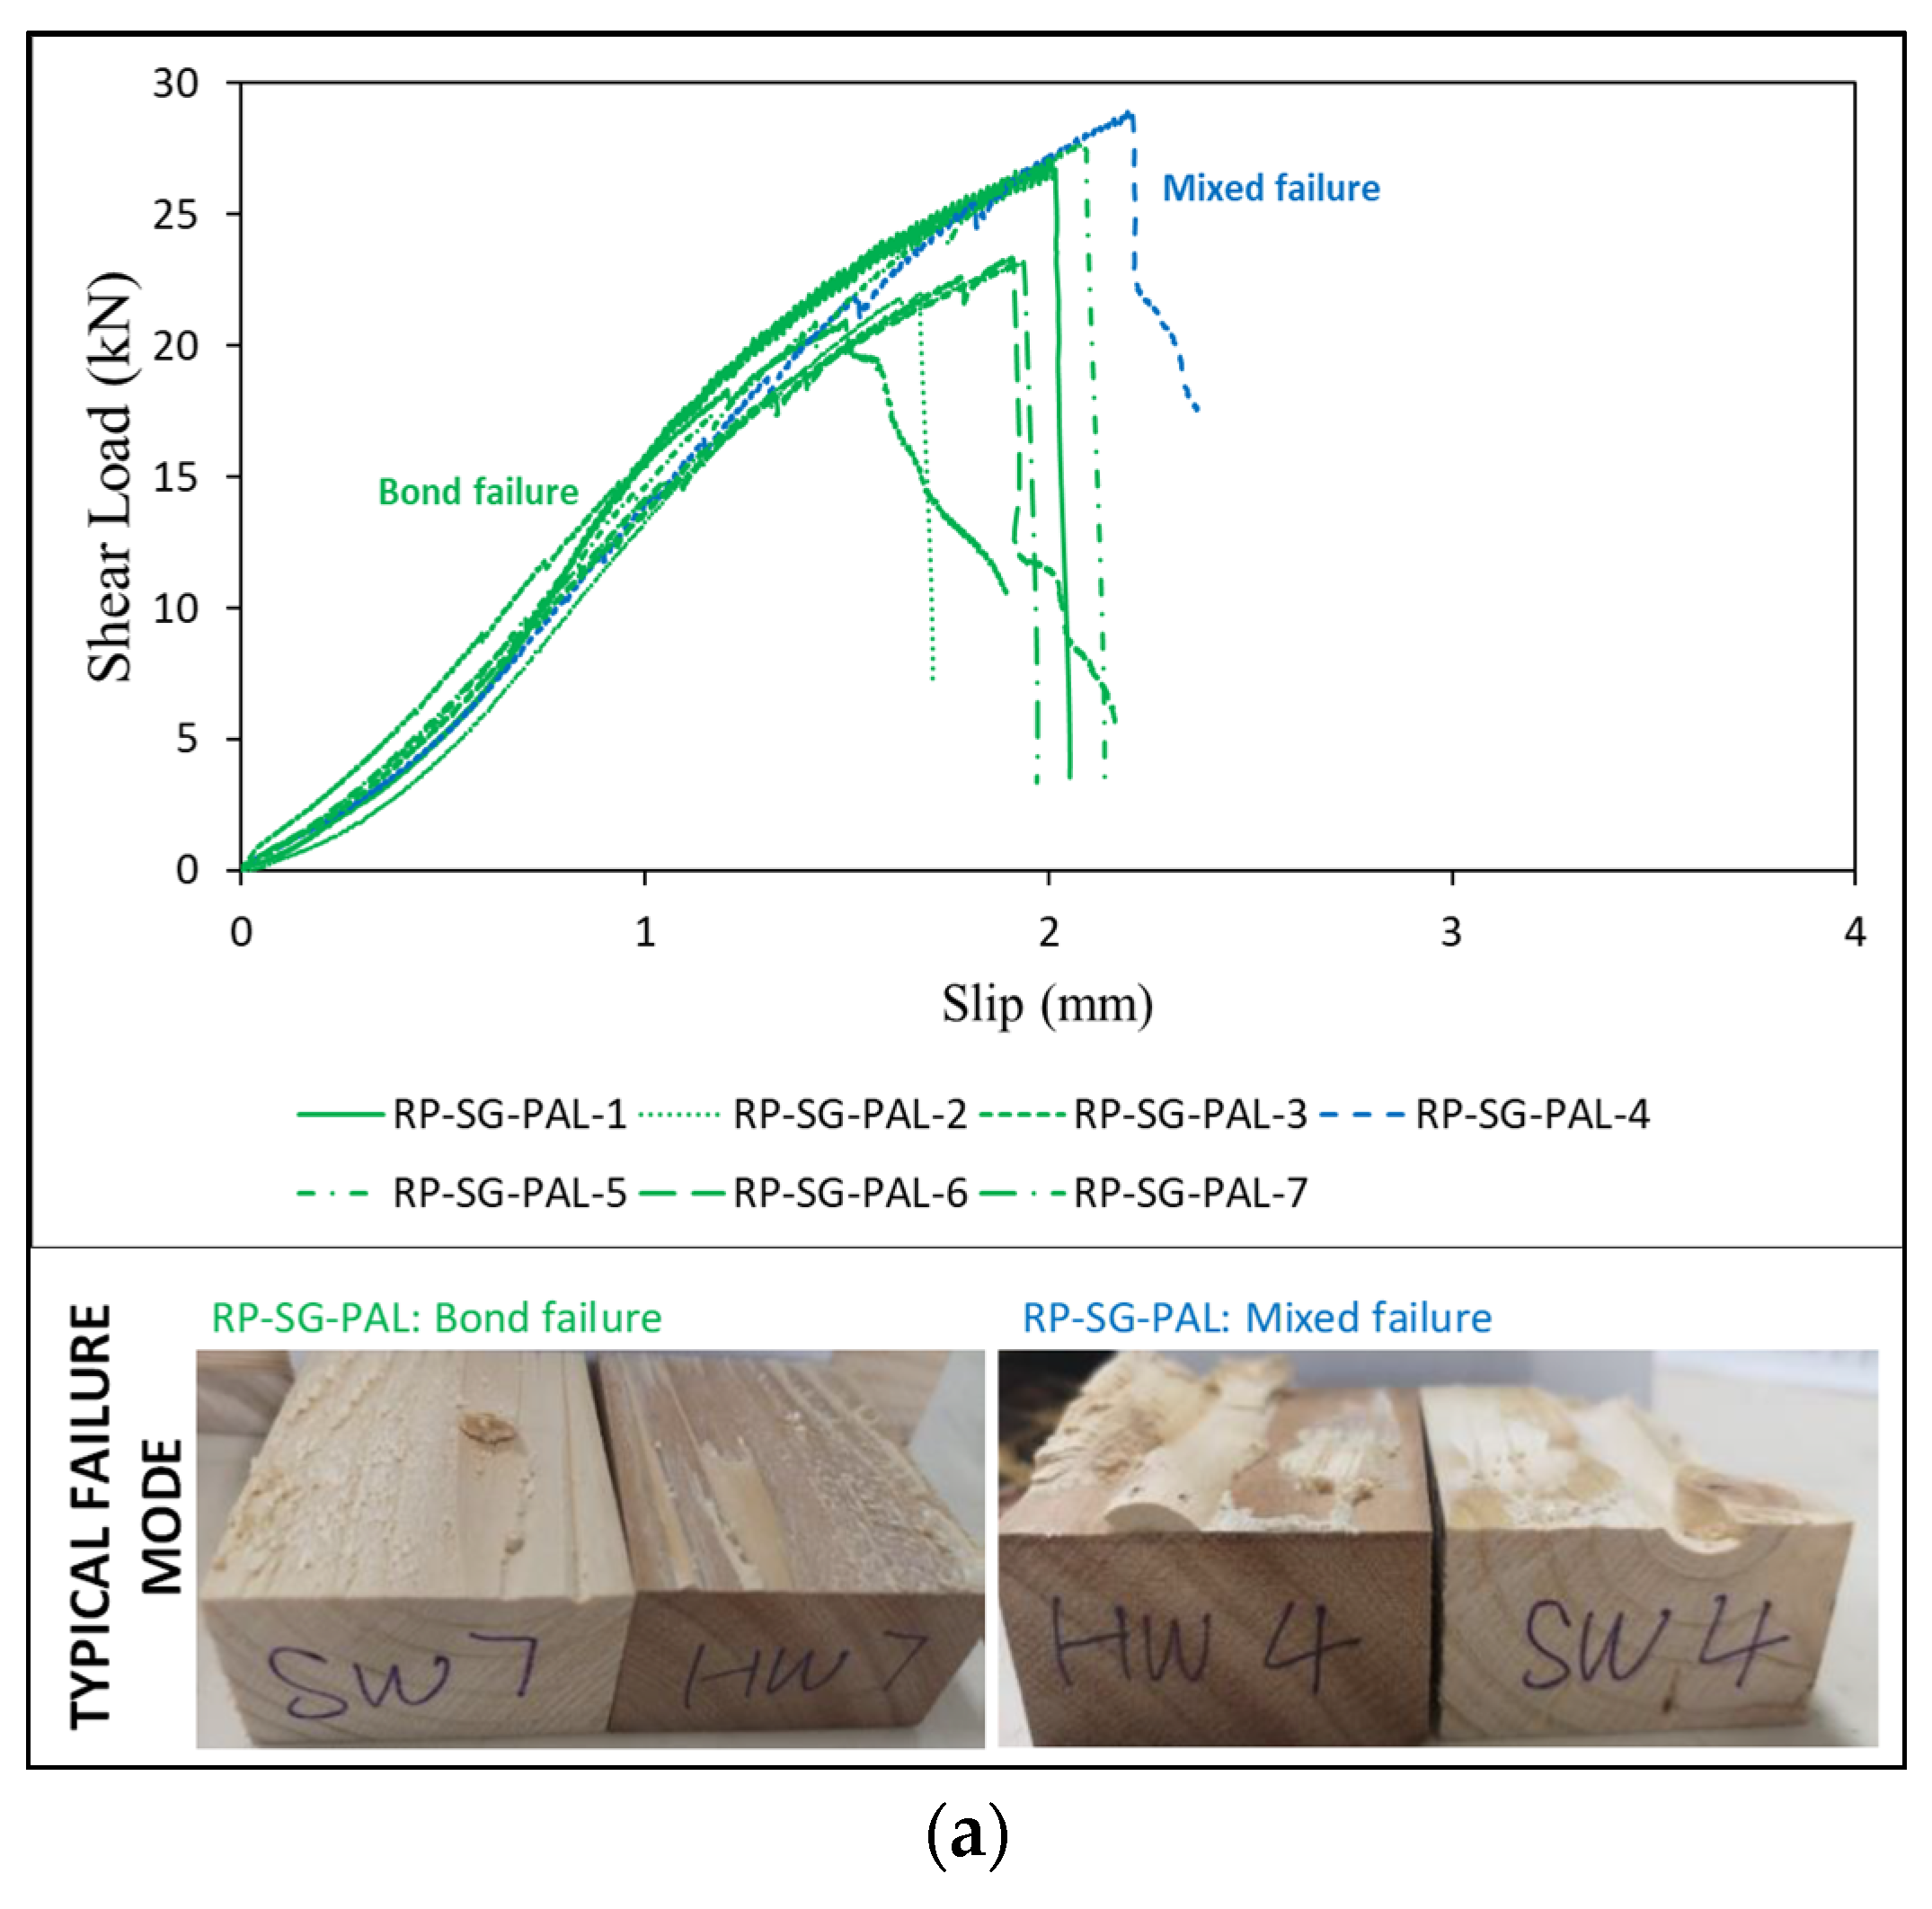
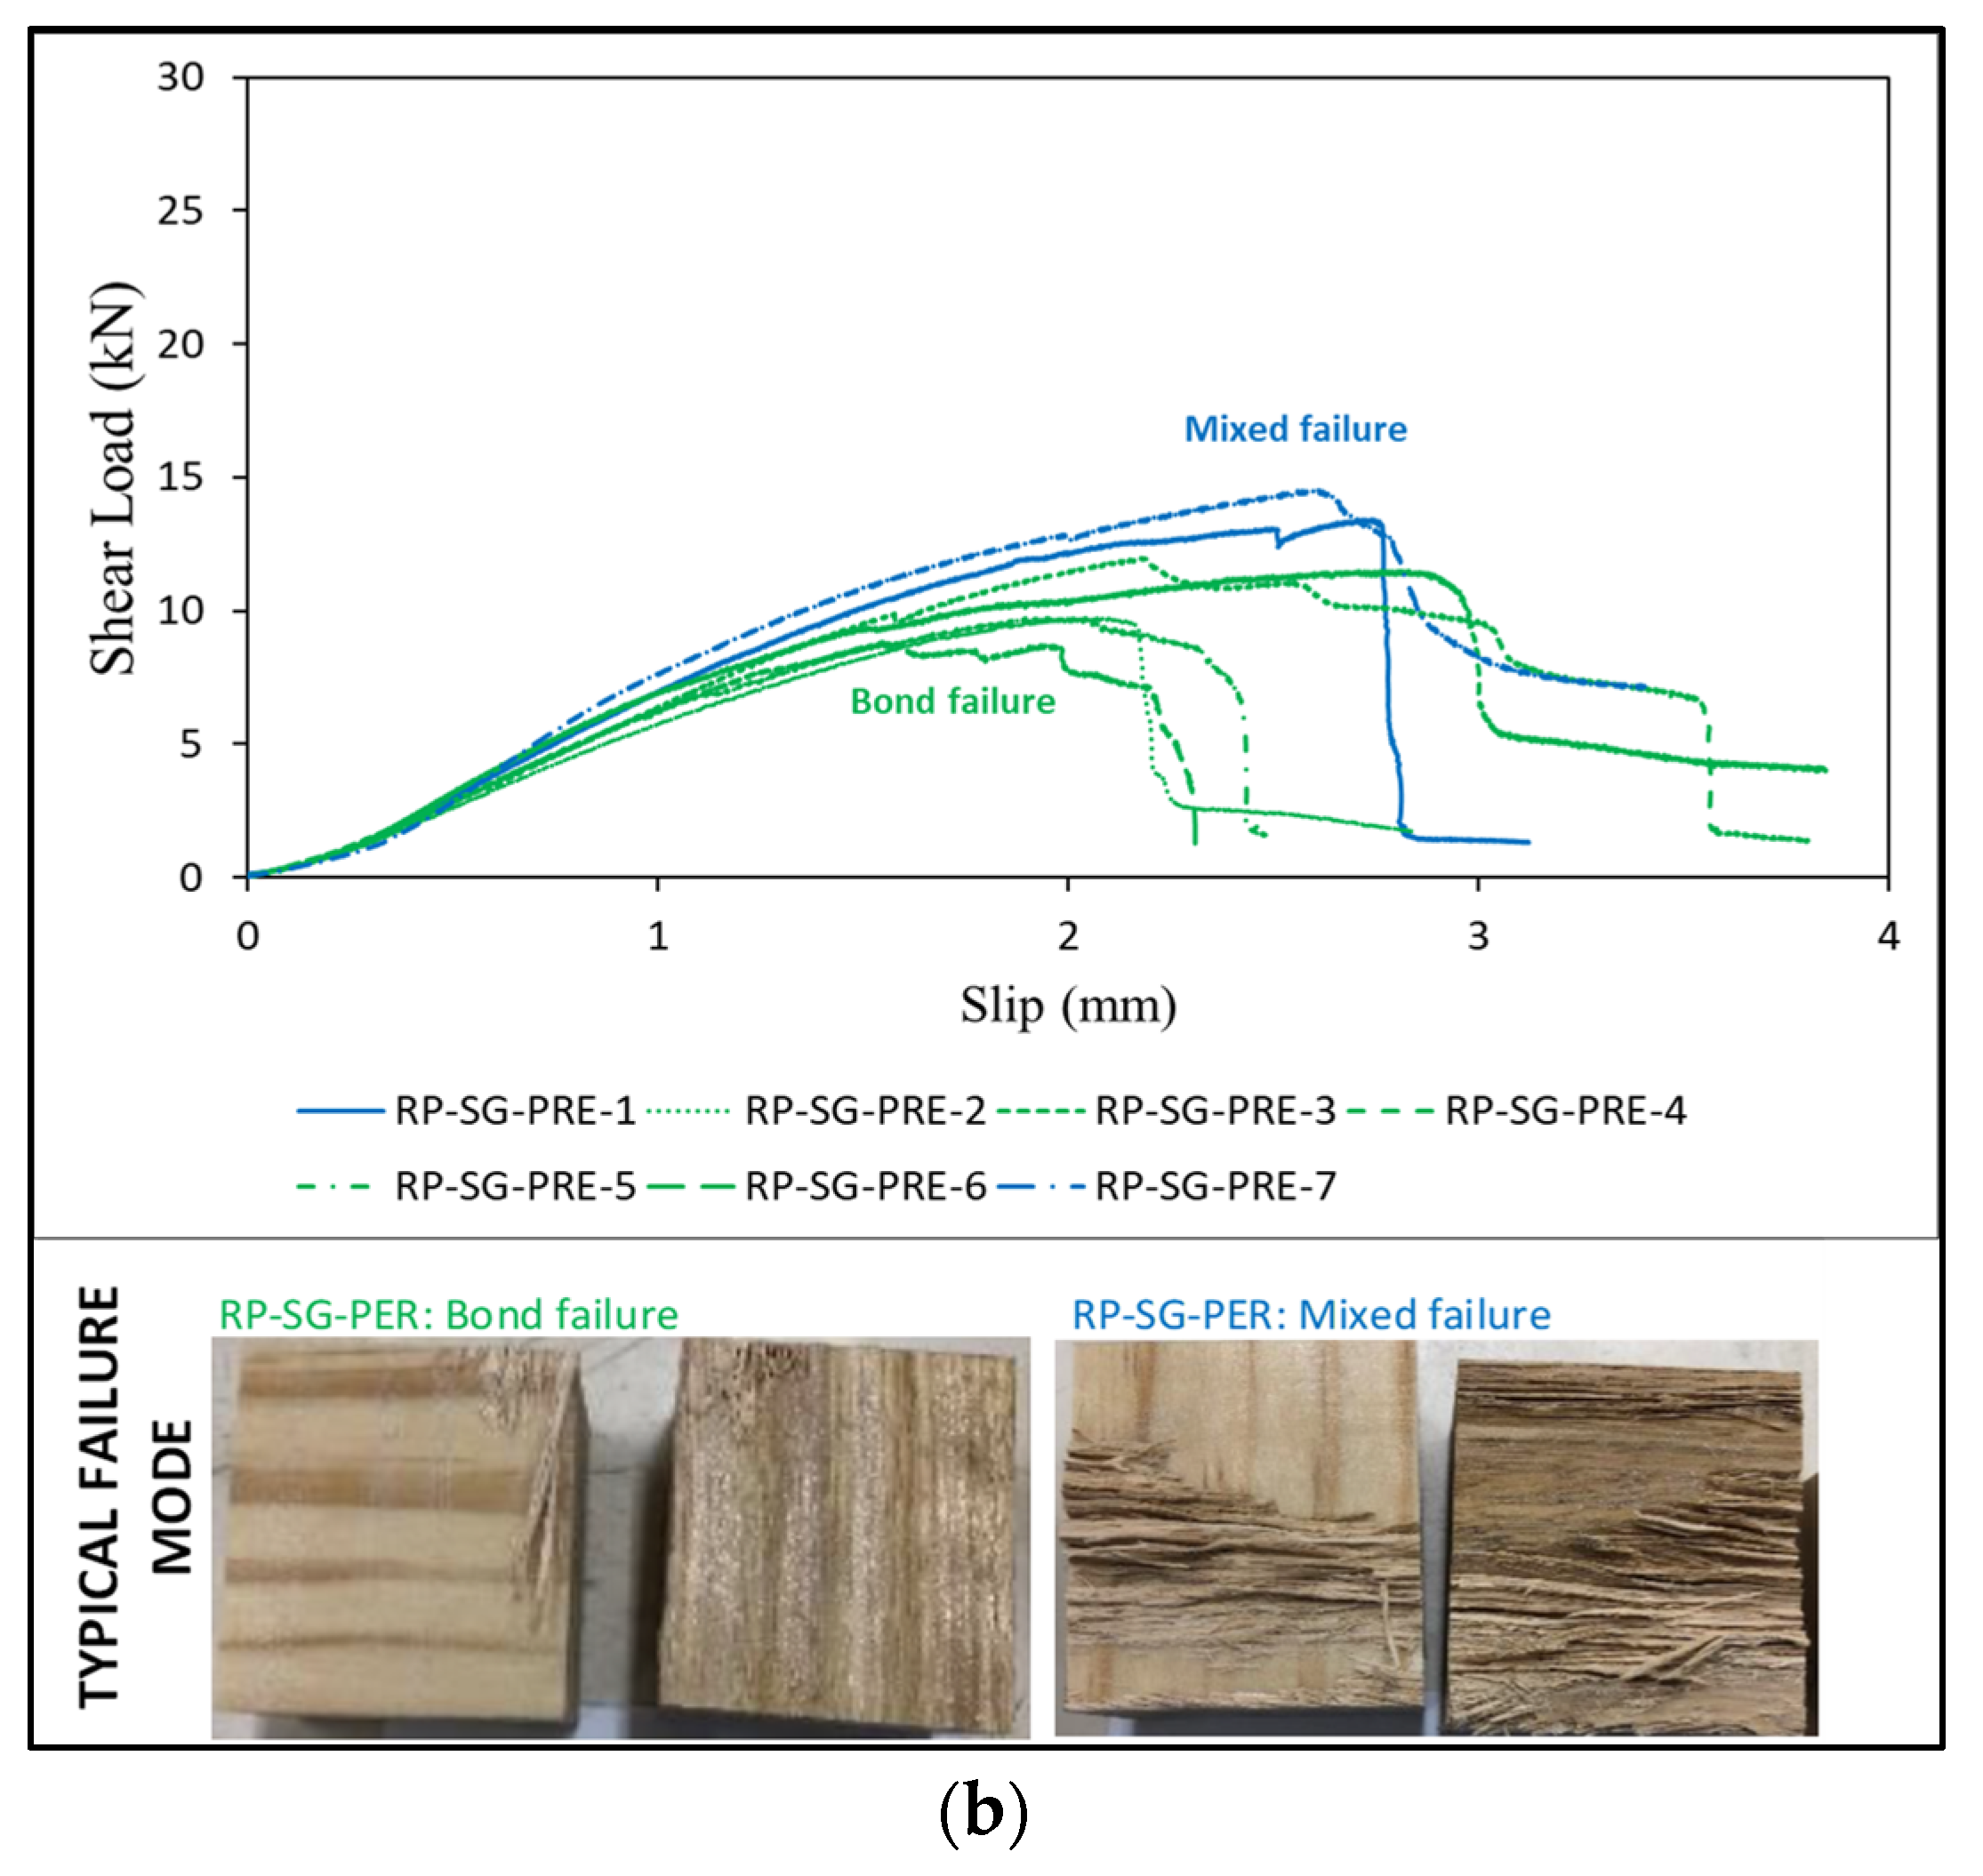
3.1.3. RP–SG Samples

Figure 6 shows the load vs. slip curves for all tested RP–SG samples.
For the RP–SG–PAL category, six out of seven samples showed typical bond failure modes, and the other sample showed a mixed mode failure. Obtained curves for these RP–SG–PAL samples (Figure 6a) showed similar deformation histories to those of hardwood SG–SG–PAL samples (Figure 5a). The range of ultimate shear load recorded from the tests was 20.95 kN–28.89 kN, giving an average value of 24.73 kN and a COV of 0.116, whilst the relevant initial stiffness was found to be within the range of 15.45–20.39 kN/mm, with a mean value of 17.24 kN/mm and a COV of 0.090.
In the case of the RP–SG–PER category, five out of seven samples showed delamination between the bond interface and the other two samples showed mixed failure modes, as illustrated in Figure 6b. Load carrying capacity of bond failure samples was within the range of 8.78 kN to 13.42 kN, with a mean value of 10.73 kN and a COV of 0.160, while the initial stiffness was between 6.69 kN/mm and 8.14 kN/mm, with an average value of 7.20 kN/mm and a COV of 0.068.
Samples suffering from mixed mode failure showed slightly better bond behaviours compared to the bond failure samples. These included 20.1%, 18.7% and 4.1% higher values in terms of ultimate shear force, slip and initial stiffness for the PAL sample, whilst those improvements for PER samples were 21.4%, 26.5% and 31.5%, respectively.

3.2. Bond Characteristics

In order to examine the effects of fibre orientation and species on bond performance, shear bond strength (τbond) and bond stiffness (ks) were determined using Equations (1) and (2). This section discusses how the bond direction, lamellae combination and failure modes affect both properties.
Figure 7 shows the box-and-whisker plots of shear bond strength (Figure 7a) and bond stiffness (Figure 7b) for all the tested samples. The PAL samples are solid-filled, whilst the PER samples are pattern-filled with horizontal strips. Relevant mean and characteristic values are summarised in Table 3.

3.2.1. Effects of Bond Direction

A one-way analysis of variance (ANOVA) was used to analyse the effects of bond direction on bond characteristics. Details for each group (RP–RP, SG–SG and RP–SG) are summarised in Table 4.
(a)
Bond strength
The p-values obtained from the RP–RP and SG–SG groups were 0.052 and 0.197, which are beyond the 5% level of significance (α = 0.05), indicating that there is not enough evidence to conclude that fibre orientation has any significant effect when the same species (lamellae configuration) are used. However, it can be noted that the R2 values for these two cases are also very low (0.279 and 0.135), indicating that more data points are required to obtain representative p-values. Therefore, based on the results, the effects of bond direction on shear bond strength in terms of RP–RP and SG–SG configurations are found to be not significant. This observation for the two groups could be attributed to the failure modes. The RP–RP samples, as discussed in Section 3.1.1, failed due to either timber failure or mixed failure. Accordingly, the failure was governed by the properties of timber. In contrast, for SG–SG samples all samples failed due to bond delamination, with only one exception (SG–SG–PER-2, mixed mode failure), but failure was very close to the bond line. The resistance of the bond line outweighs the effect of fibre orientation; therefore, the effect of fibre orientation is also found to be insignificant.
However, the p-value obtained from the RP–SG group is very close to zero, with R2 = 0.82, which means the bond directions have a significant effect on the bond strength in hybrid configurations. In the current study, the value of τbond for RP–SG–PER, was about 55.3% of its PAL counterpart, i.e., τbond,RP–SG–PAL. Therefore, it is important to consider the bond strength for hybrid cross-laminated timber panel designs, especially when cross-layers are made from different species.
(b)
Bond stiffness
Similar to bond strength, the p-values obtained from the RP–RP and SG–SG groups were 0.593 and 0.247, which are far beyond the 5% level of significance (α = 0.05). In other words, there is no significant effect on bond stiffness in these two groups due to the relative difference in fibre directions. In addition, R2 values for these two cases are also very low, which indicates that more data points are required to obtain representative p-values. In contrast, the RP–SG group showed a p-value of almost zero, with R2 = 0.87, indicating a significant effect of fibre orientation on bond stiffness. Values for ks,RP–SG–PER were about 54.6% of their PAL counterparts, i.e., ks,RP–SG–PAL.

3.2.2. Effects of Lamellae Combination

An ANOVA was performed to investigate the effects of species combination on shear bond characteristics for both the PAL and PER groups, and obtained results are shown in Table 5. All three combinations of species (RP–RP, RP–SG and SG–SG) and two directions, PAL and PER, were taken into account in this analysis.
(a)
Bond strength
For both groups, obtained p-values were nearly zero, confirming the significant effects of species on bond strength. It is noteworthy that the R2 value is very high, indicating a good fit in calculating the p-value. Hardwood configurations in the current study, i.e., SG–SG, always showed remarkably higher strengths than softwood RP–RP configurations, with increases of 95.8% and 114.8% in terms of PAL and PER directions, respectively. For hybrid RP–SG configurations, when bonded in PAL directions, a considerable increase of 44.8% was observed in comparison with their softwood RP–RP counterparts; however, hybrid configurations bonded in PER directions exhibited negative effects on bond strength, showing a decrease of 4.4% compared to RP–RP–PER samples. The reason behind these differences could be attributed to the response of timber or bond lines in response to shear loading. For RP–RP samples, bond lines were strong compared to timber resulting in failure on the timber side. Therefore, bond strength is governed by timber’s properties. For SG-SG samples, full potential of interface can be utilised which is governed by the failure of adhesive-SG interface. In contrast, for RP–SG samples, due to the combined actions of bond line and timber properties, values of bond strength could be in between the above two case scenarios.
Furthermore, post hoc analysis using Fisher’s least significant difference (LSD) method was conducted for pairwise comparison, as shown in Figure 8a. It shows the difference in means while comparing three combinations at a 95% confidence interval. The corresponding means can be considered significantly different, as the confidence interval does not contain zero. Therefore, the lamellae combination is found to significantly affect bond strength.
(b)
Bond stiffness
Similar to bond strength, obtained p-values for bond stiffness are very close to zero, with a reasonable R2 value of 0.522. Based on the post hoc pairwise comparison (Figure 8b), a similar conclusion can be made for (SG–SG)—(RP–RP) samples and (SG–SG)—(RP–SG) samples that species combinations have significant effects on bond stiffness. However, (RP–SG)—(RP–RP) samples did not exhibit significant differences regarding bond stiffness. In terms of values, bond stiffness in the PAL group increased when hardwood was involved. Mean increases of 50% and 73% for RP–SG and SG–SG samples were obtained compared to softwood RP–RP samples. In contrast, in the PER group, hybrid RP–SG samples showed the lowest stiffness, accounting for only 87% of the softwood RP–RP counterparts; however, bond stiffness attained from hardwood SG–SG samples was almost two times higher than that of the relevant RP–RP samples (Table 5).
It is worth noting that both bond line properties and timber properties could affect the load-slip curve. These include the shear strength of the timber parallel to the fibre direction (fv) in PAL configurations and perpendicular to the fibre direction (fr) in PER configurations. In general, fr is much lower than fv, and therefore, PER samples were more vulnerable to deformation, showing relatively ductile loading curves with lower stiffness when compared to PAL samples, as reflected in Figure 4, Figure 5 and Figure 6. Furthermore, when it comes to hybrid RP–SG configurations, asymmetric properties on two sides of the bond line could cause additional variations, which may explain the lowest bond stiffness that was obtained for RP–SG samples in the PER direction.

3.2.3. Effects of Failure Modes

Figure 9 shows the shear bond strength (Figure 9a) and bond stiffness (Figure 9b) for all the tested samples. RP–RP, SG–SG and RP–SG samples are illustrated in black, blue and green, and are classified by failure modes following Section 3.1. Since the scope of this section is on the effects of failure modes, only groups with samples exhibiting multi-failure modes will be discussed. In other words, the RP–RP–PAL group (all timber failure) and the SG–SG–PAL group (all bond failures) are out of consideration and are marked in lighter colours in Figure 9.
(a)
Bond strength
For the PAL group, RP–RP and SG–SG samples had the same failure modes within their respective groups. The RP–SG–PAL group was mostly governed by the bond failure with an average value of 8.01 MPa, although one sample yielded a value of 9.63 Mpa, which was associated with mixed failure mode. From this observation, mixed failure mode for the hybrid case (RP–SG) was found to have increased. For the RP–SG–PER group, the same behaviour was observed, i.e., the mixed failure mode attained a 21.5% (4.29 vs. 5.21 MPa) higher bond strength compared to the samples that failed due to delamination. In case of the RP–RP–PER group, the mixed failure mode was found to be weaker (28.6% lower) than the samples with timber side failure (4.41 vs. 5.67 MPa). The effect of failure modes on ultimate bond strength was found to be negligible for the SG–SG–PER samples. However, only one sample failed due to mixed failure.
(b)
Bond stiffness
The bond stiffness for the RP–SG–PAL group obtained from samples with bond failures had a mean value of 5.71 N/mm3, which was found to be 4.2% lower than the sample with mixed failure mode (5.95 N/mm3). The same trends were also observed in the case of the RP–SG–PER and SG–SG–PER groups, i.e., the mixed failure mode attained 31.6% (2.88 vs. 3.79 N/mm3, RP–SG–PER) and 5% (7.24 vs. 7.60 N/mm3, SG–SG–PER) higher bond stiffness compared to the samples which failed due to delamination. In terms of the RP–RP–PER group, the timber side failure mode was found to be 59.2% stronger than the samples with the mixed failure mode (4.92 vs. 3.09 N/mm3).

3.2.4. Comparison

Interaction effects considering lamellae configurations, bond directions and failure modes are further investigated. Figure 10 and Figure 11 show the interaction plot for bond strength and bond stiffness, respectively.

3.2.5. Comparison with Other Species

In this section, comparison in terms of bond strength is made for Shining Gum and Radiata Pine against other species. To the authors’ best knowledge, there is no data available for the PER configuration of bond testing. Therefore, a comparison for the PER combination cannot be made. However, literature associated with bond strength for the PAL configuration is compared in Table 6. Hardwood and softwood are also mentioned in the table as HW and SW, respectively.
Following the aforementioned discussions, some general comparisons and observations can be made:
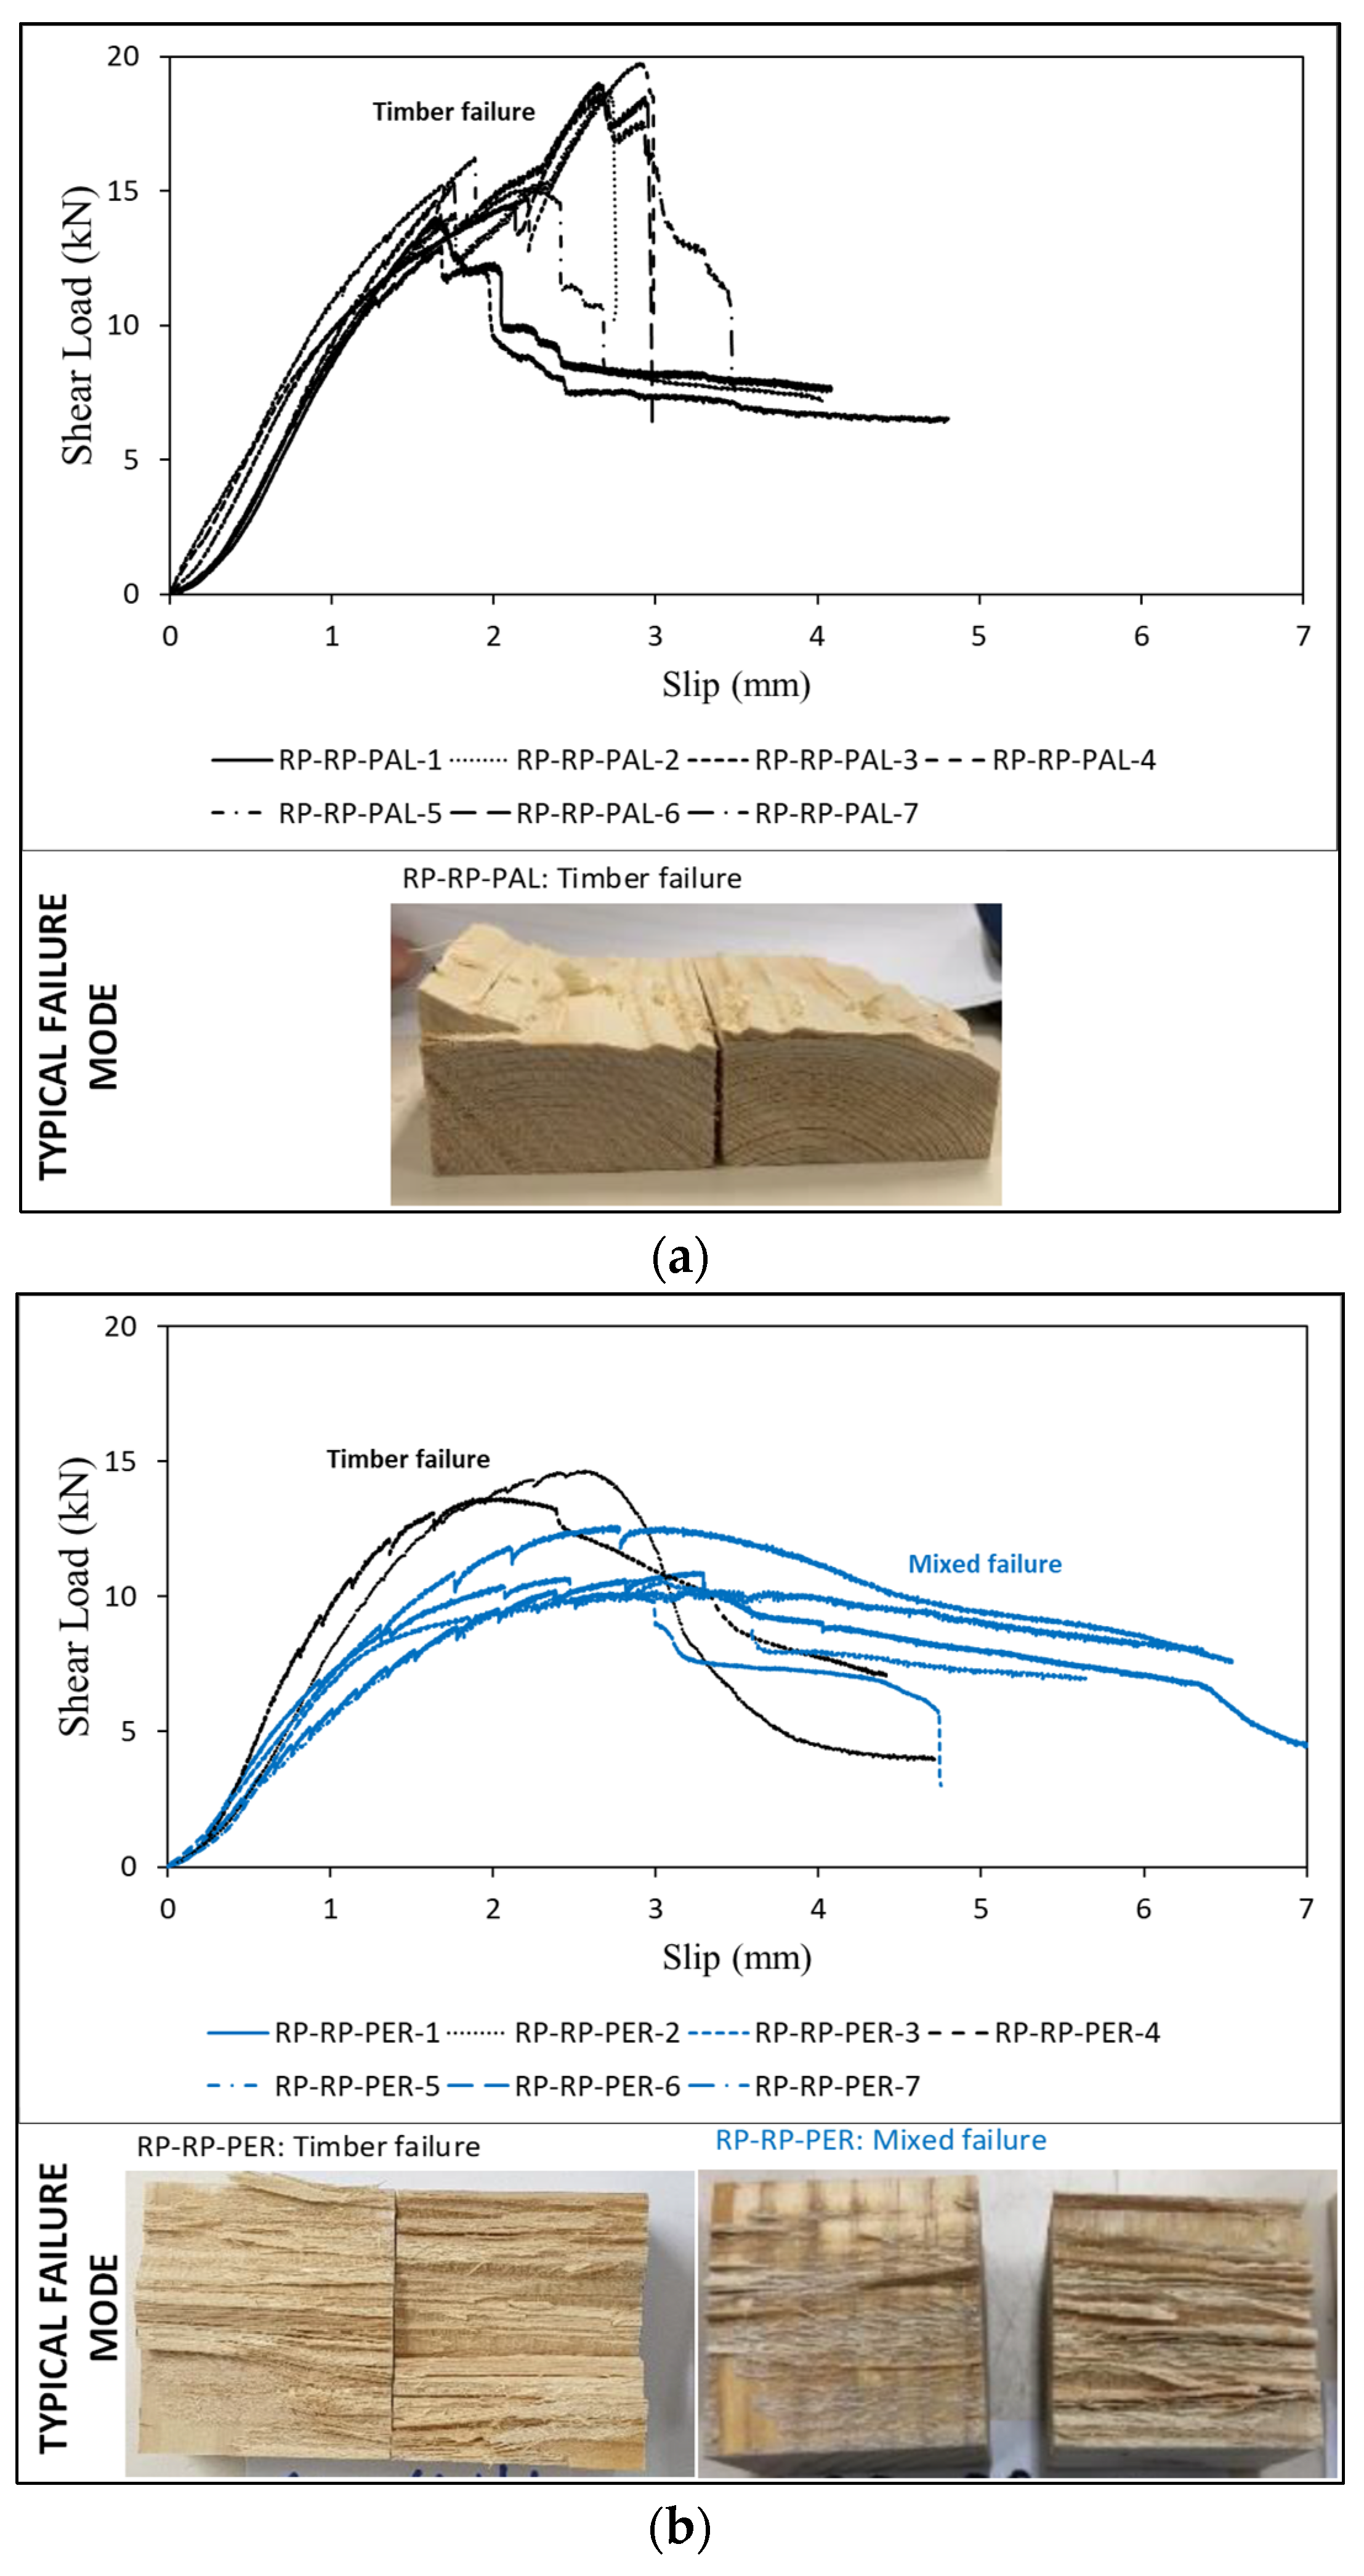
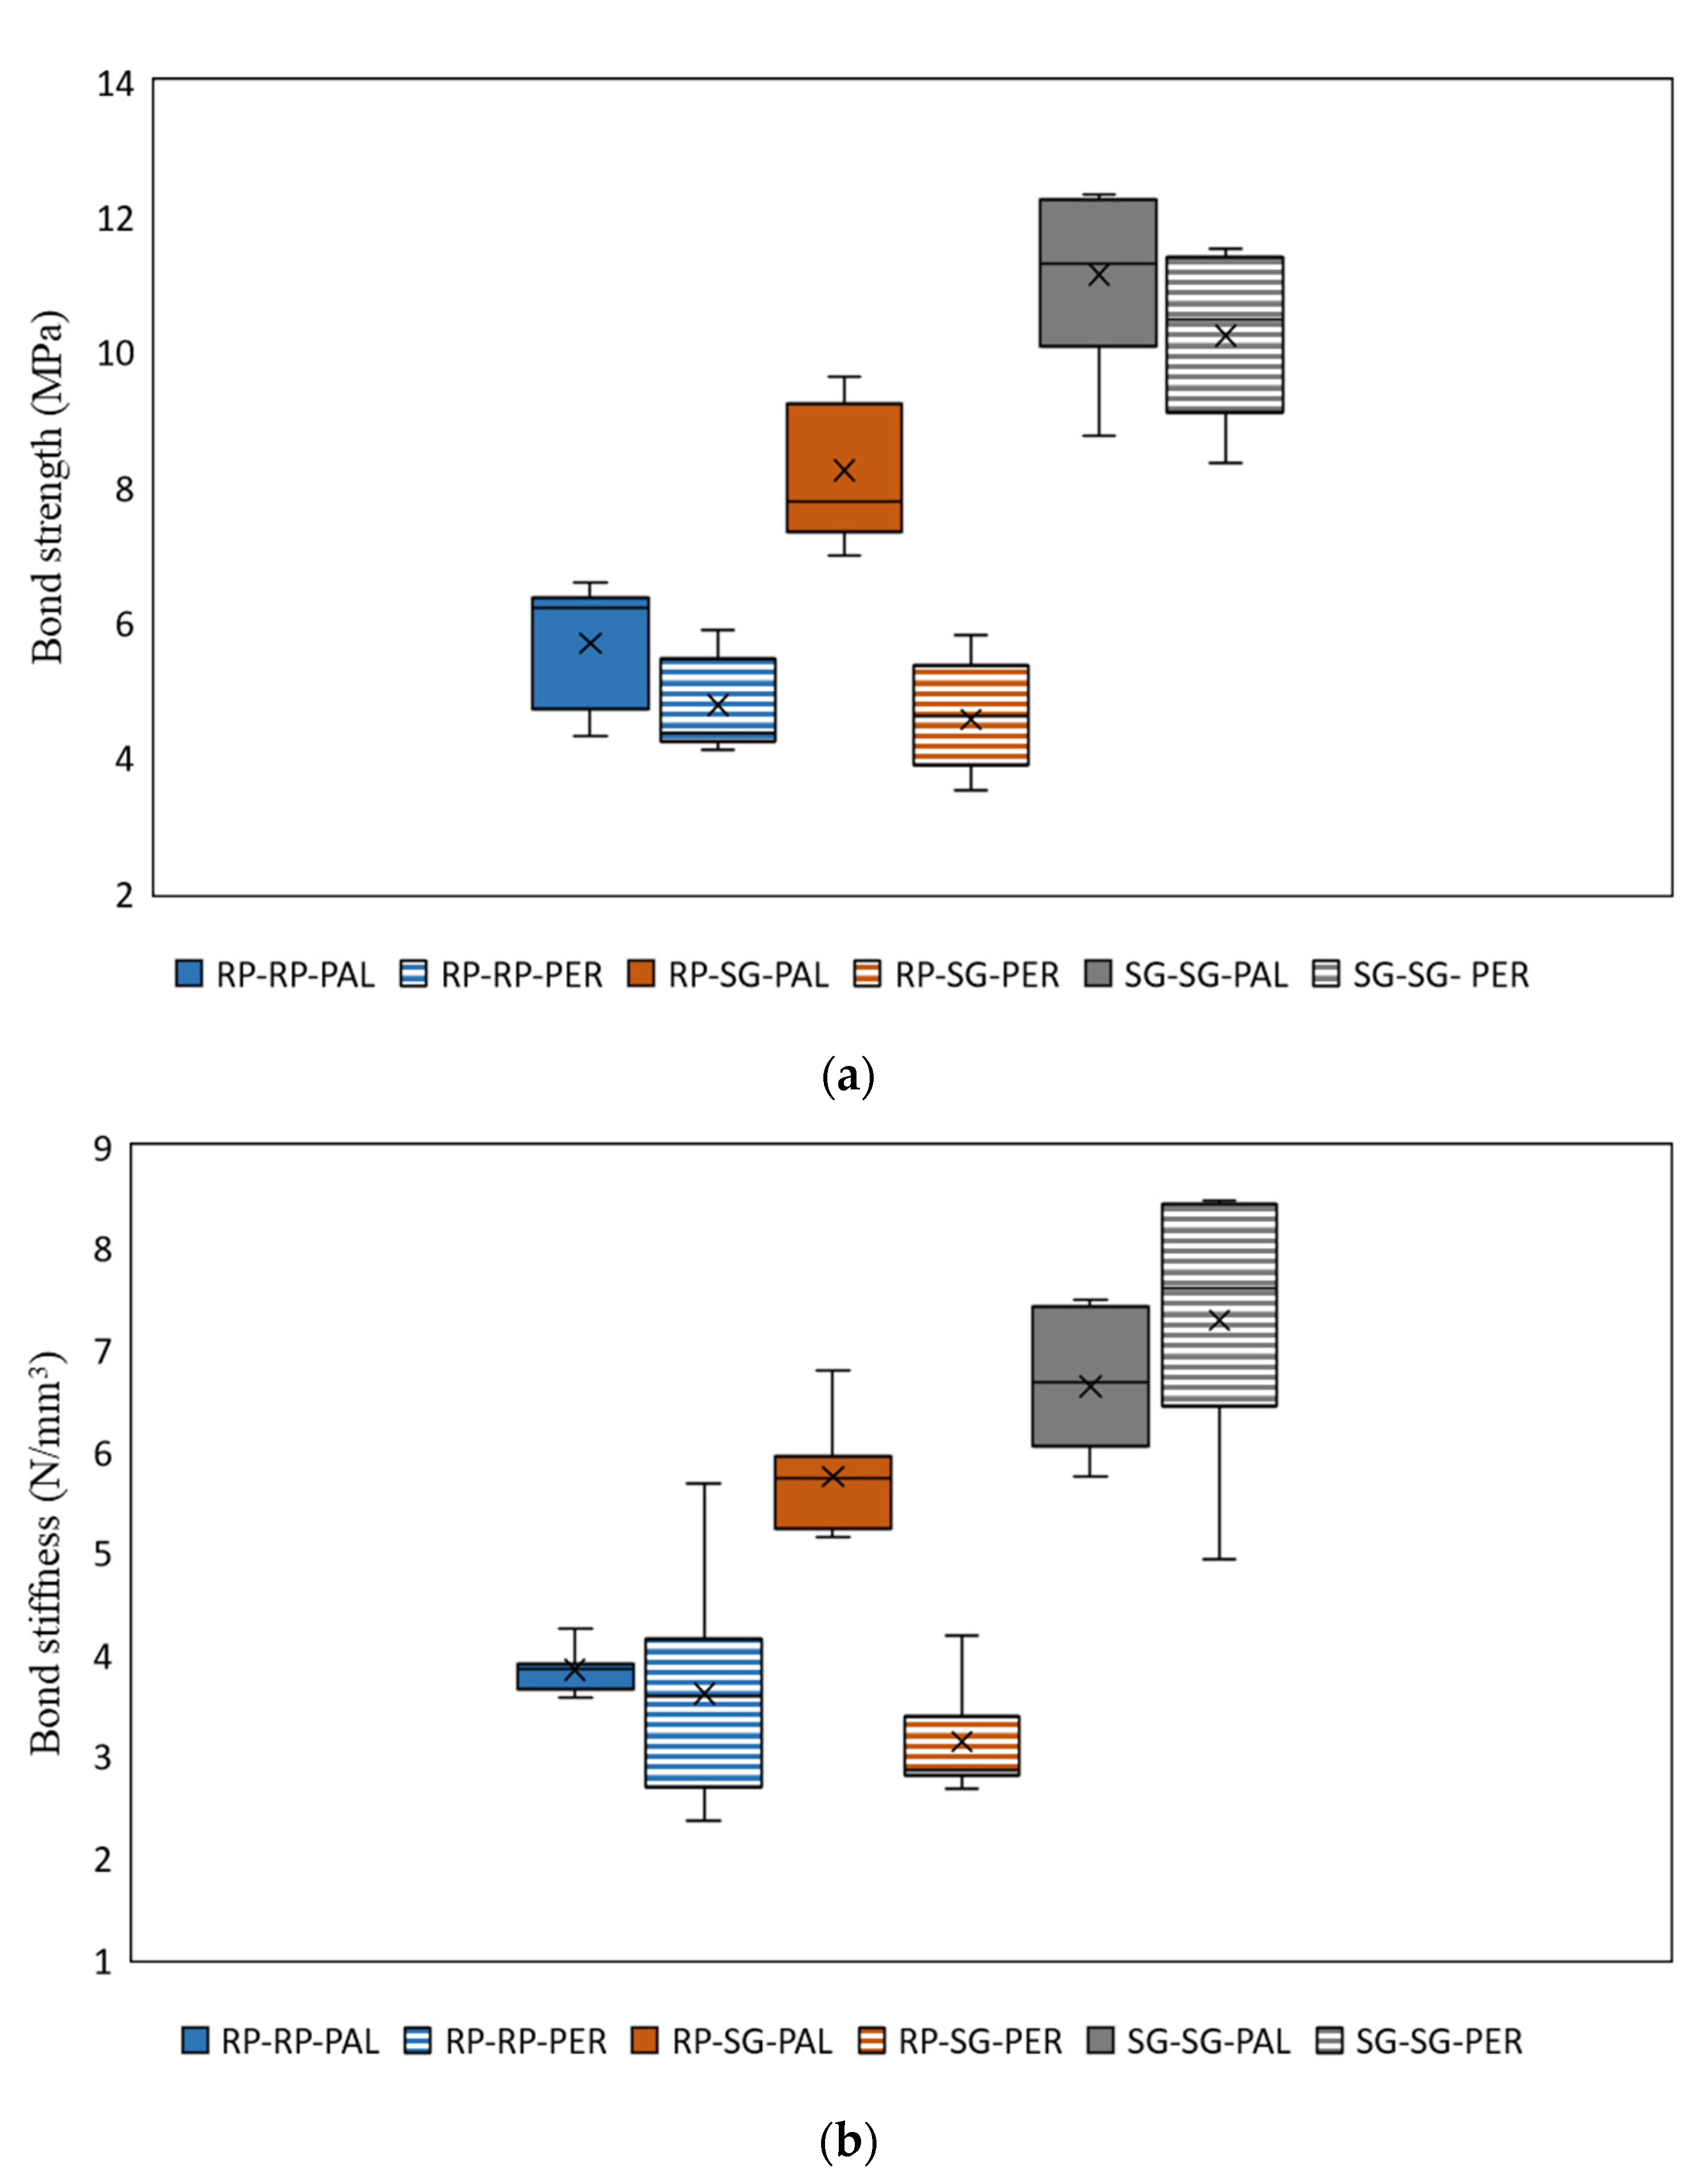
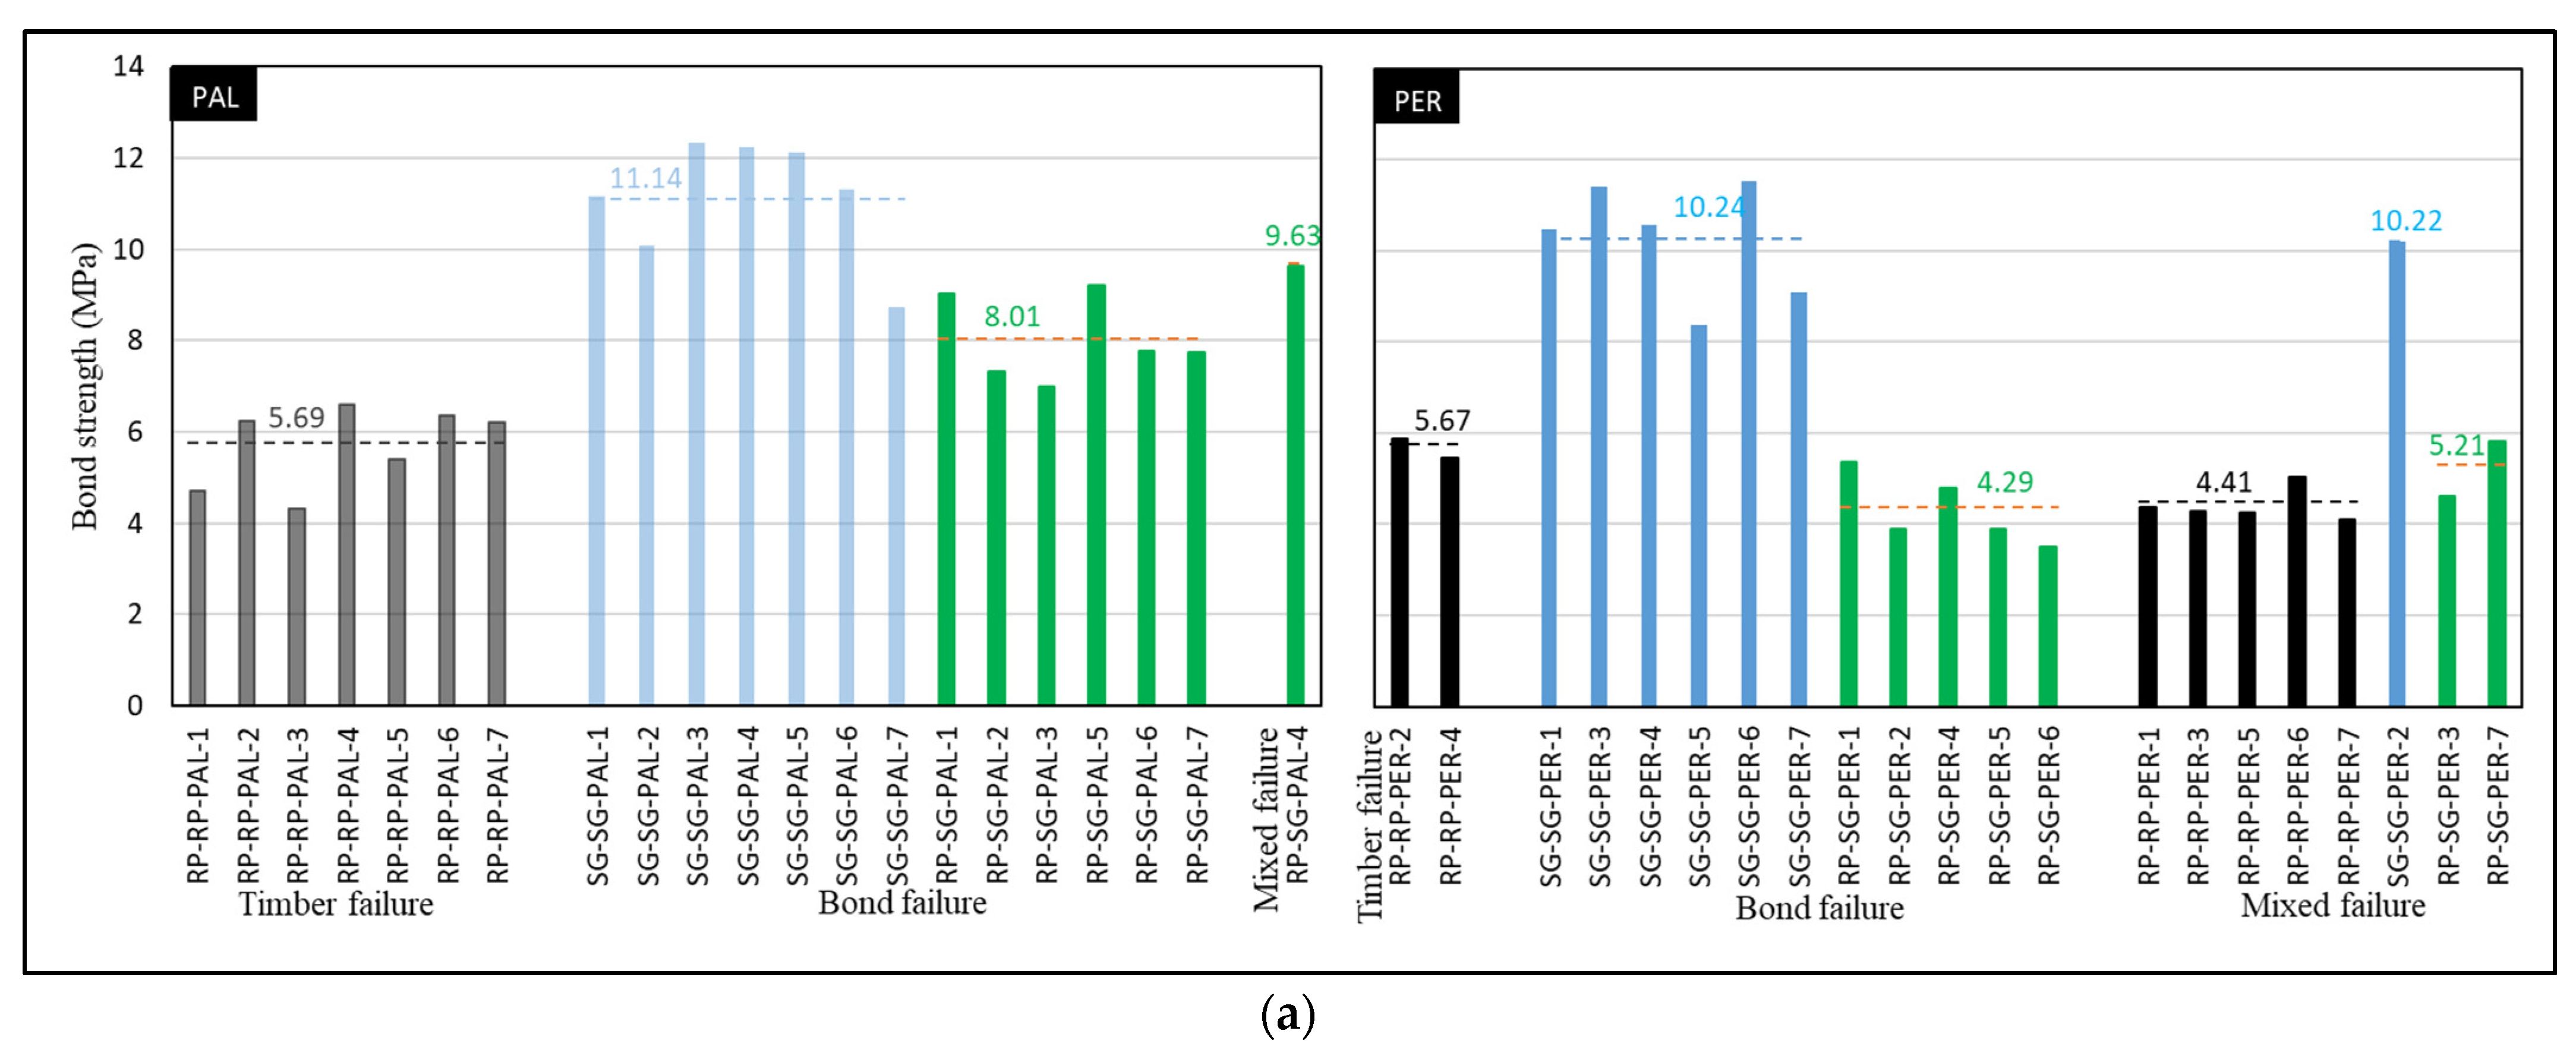
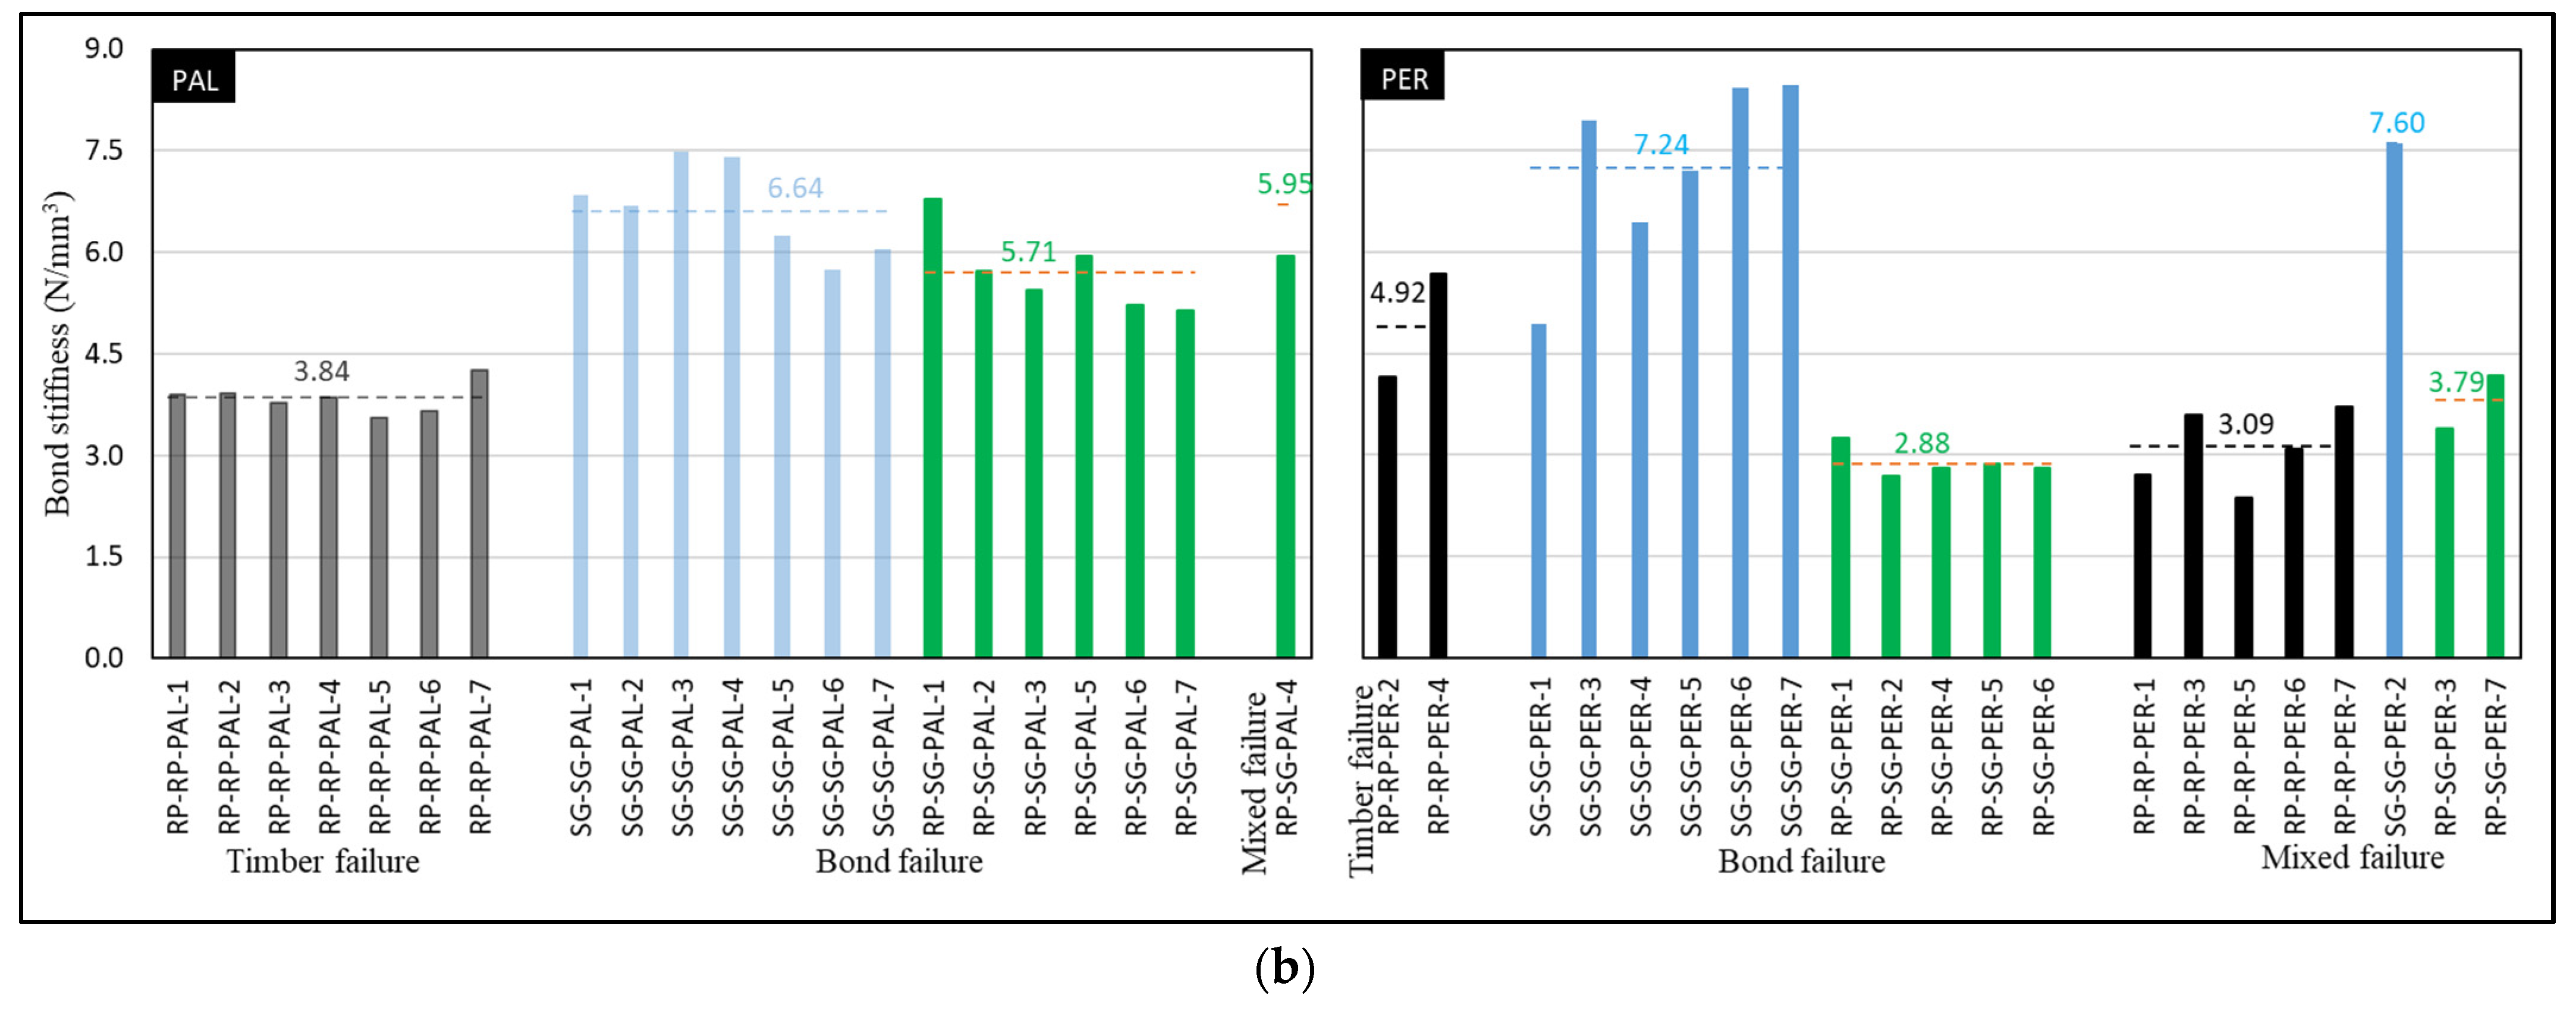
  • Softwoods bonded using PUR polyurethane adhesives could achieve high percentage timber side failure. This failure mode is preferred as the load characteristics could be designed based on the known wood strength and are not affected by the interface properties [24]. Characteristic bond strengths for current tested RP–RP–PAL and RP–RP–PER samples were 3.88 and 3.45 MPa, while characteristic bond stiffnesses were 3.87 and 3.30 N/mm3, respectively.
  • In this study, hardwoods bonded using PUR polyurethane adhesives failed due to delamination; however, their bond properties were nearly double those of similar softwood samples regardless of bond directions. Characteristic bond strengths for current tested SG–SG–PAL and SG–SG–PER samples were 8.34 and 7.83 MPa, and characteristic bond stiffnesses were 6.45 and 6.94 N/mm3, respectively.
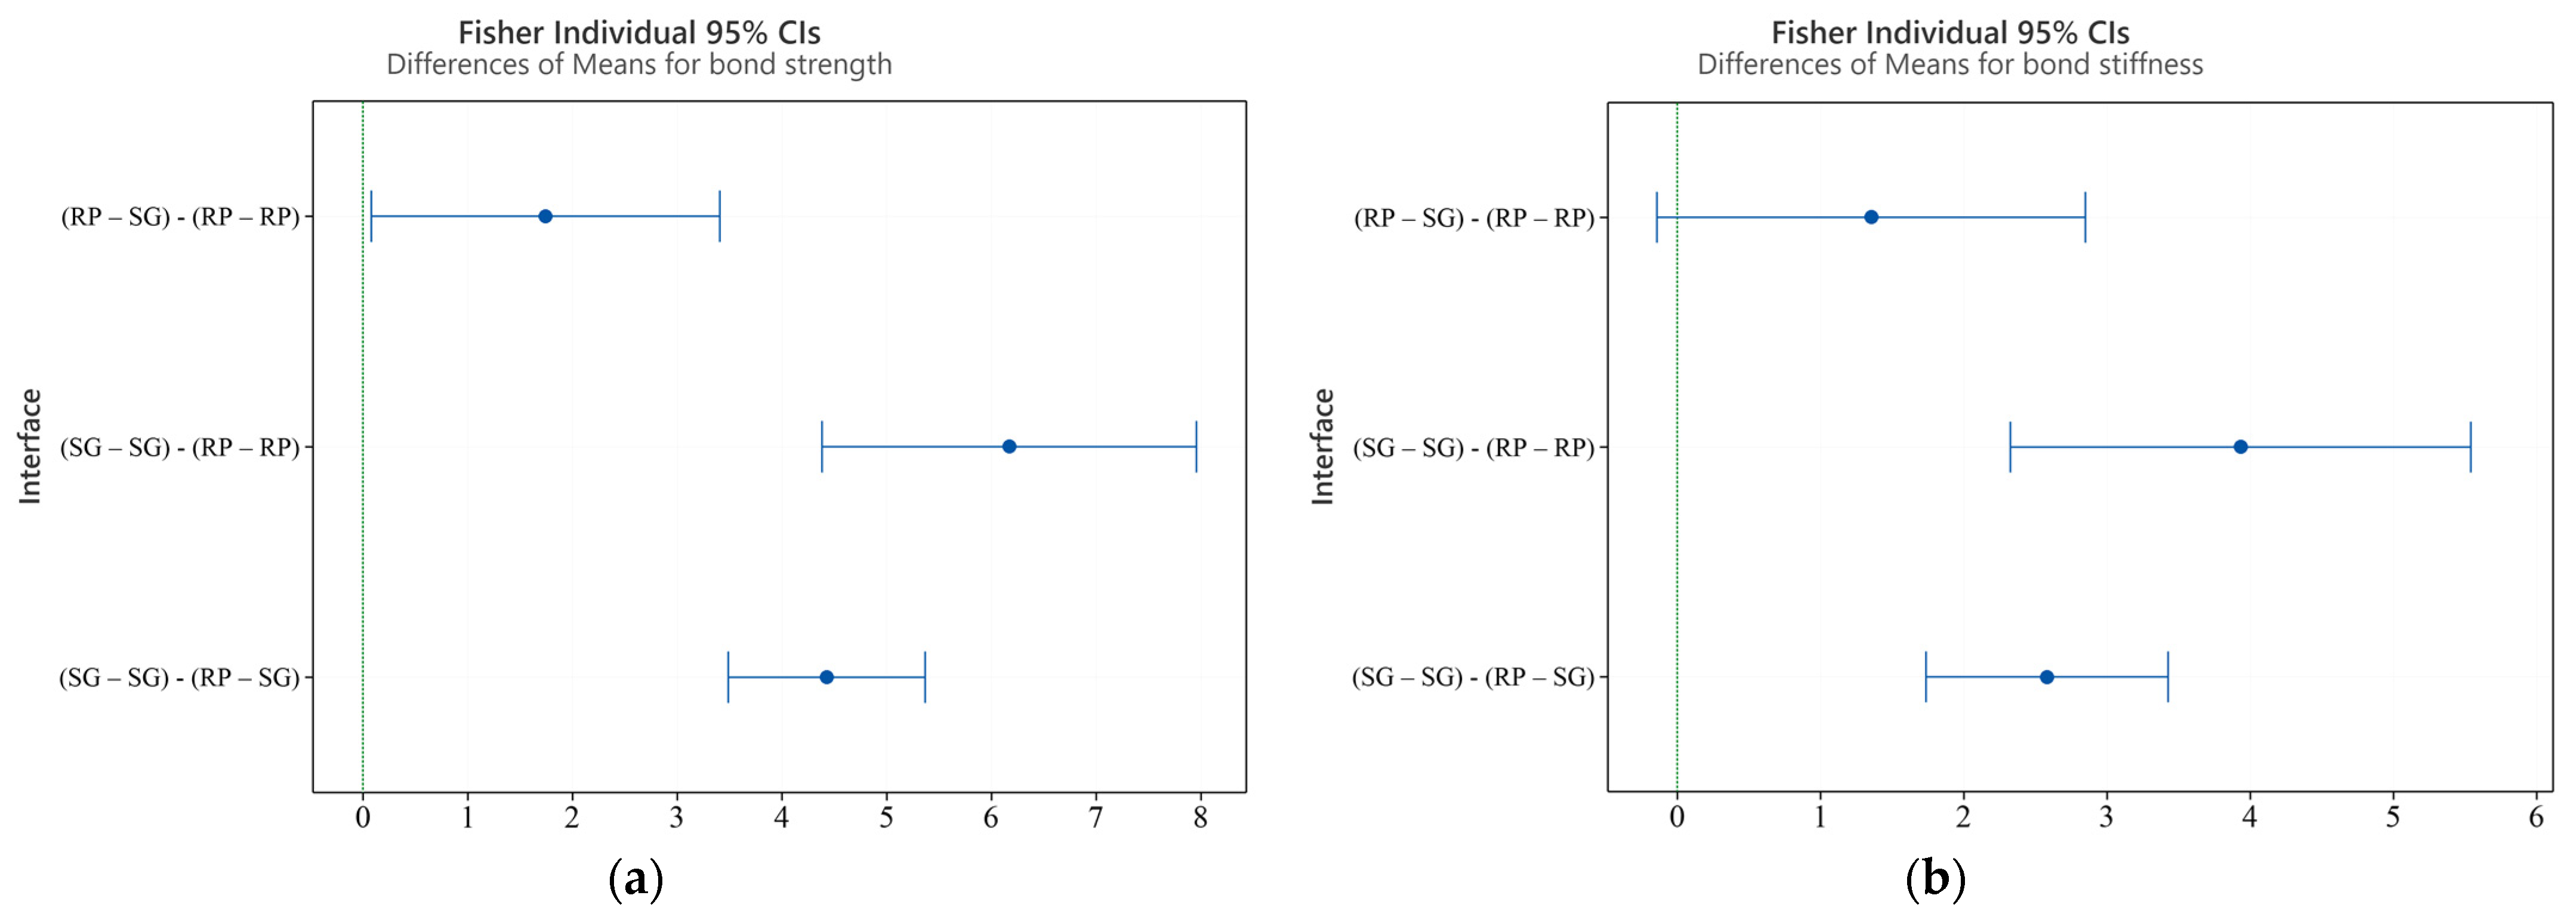
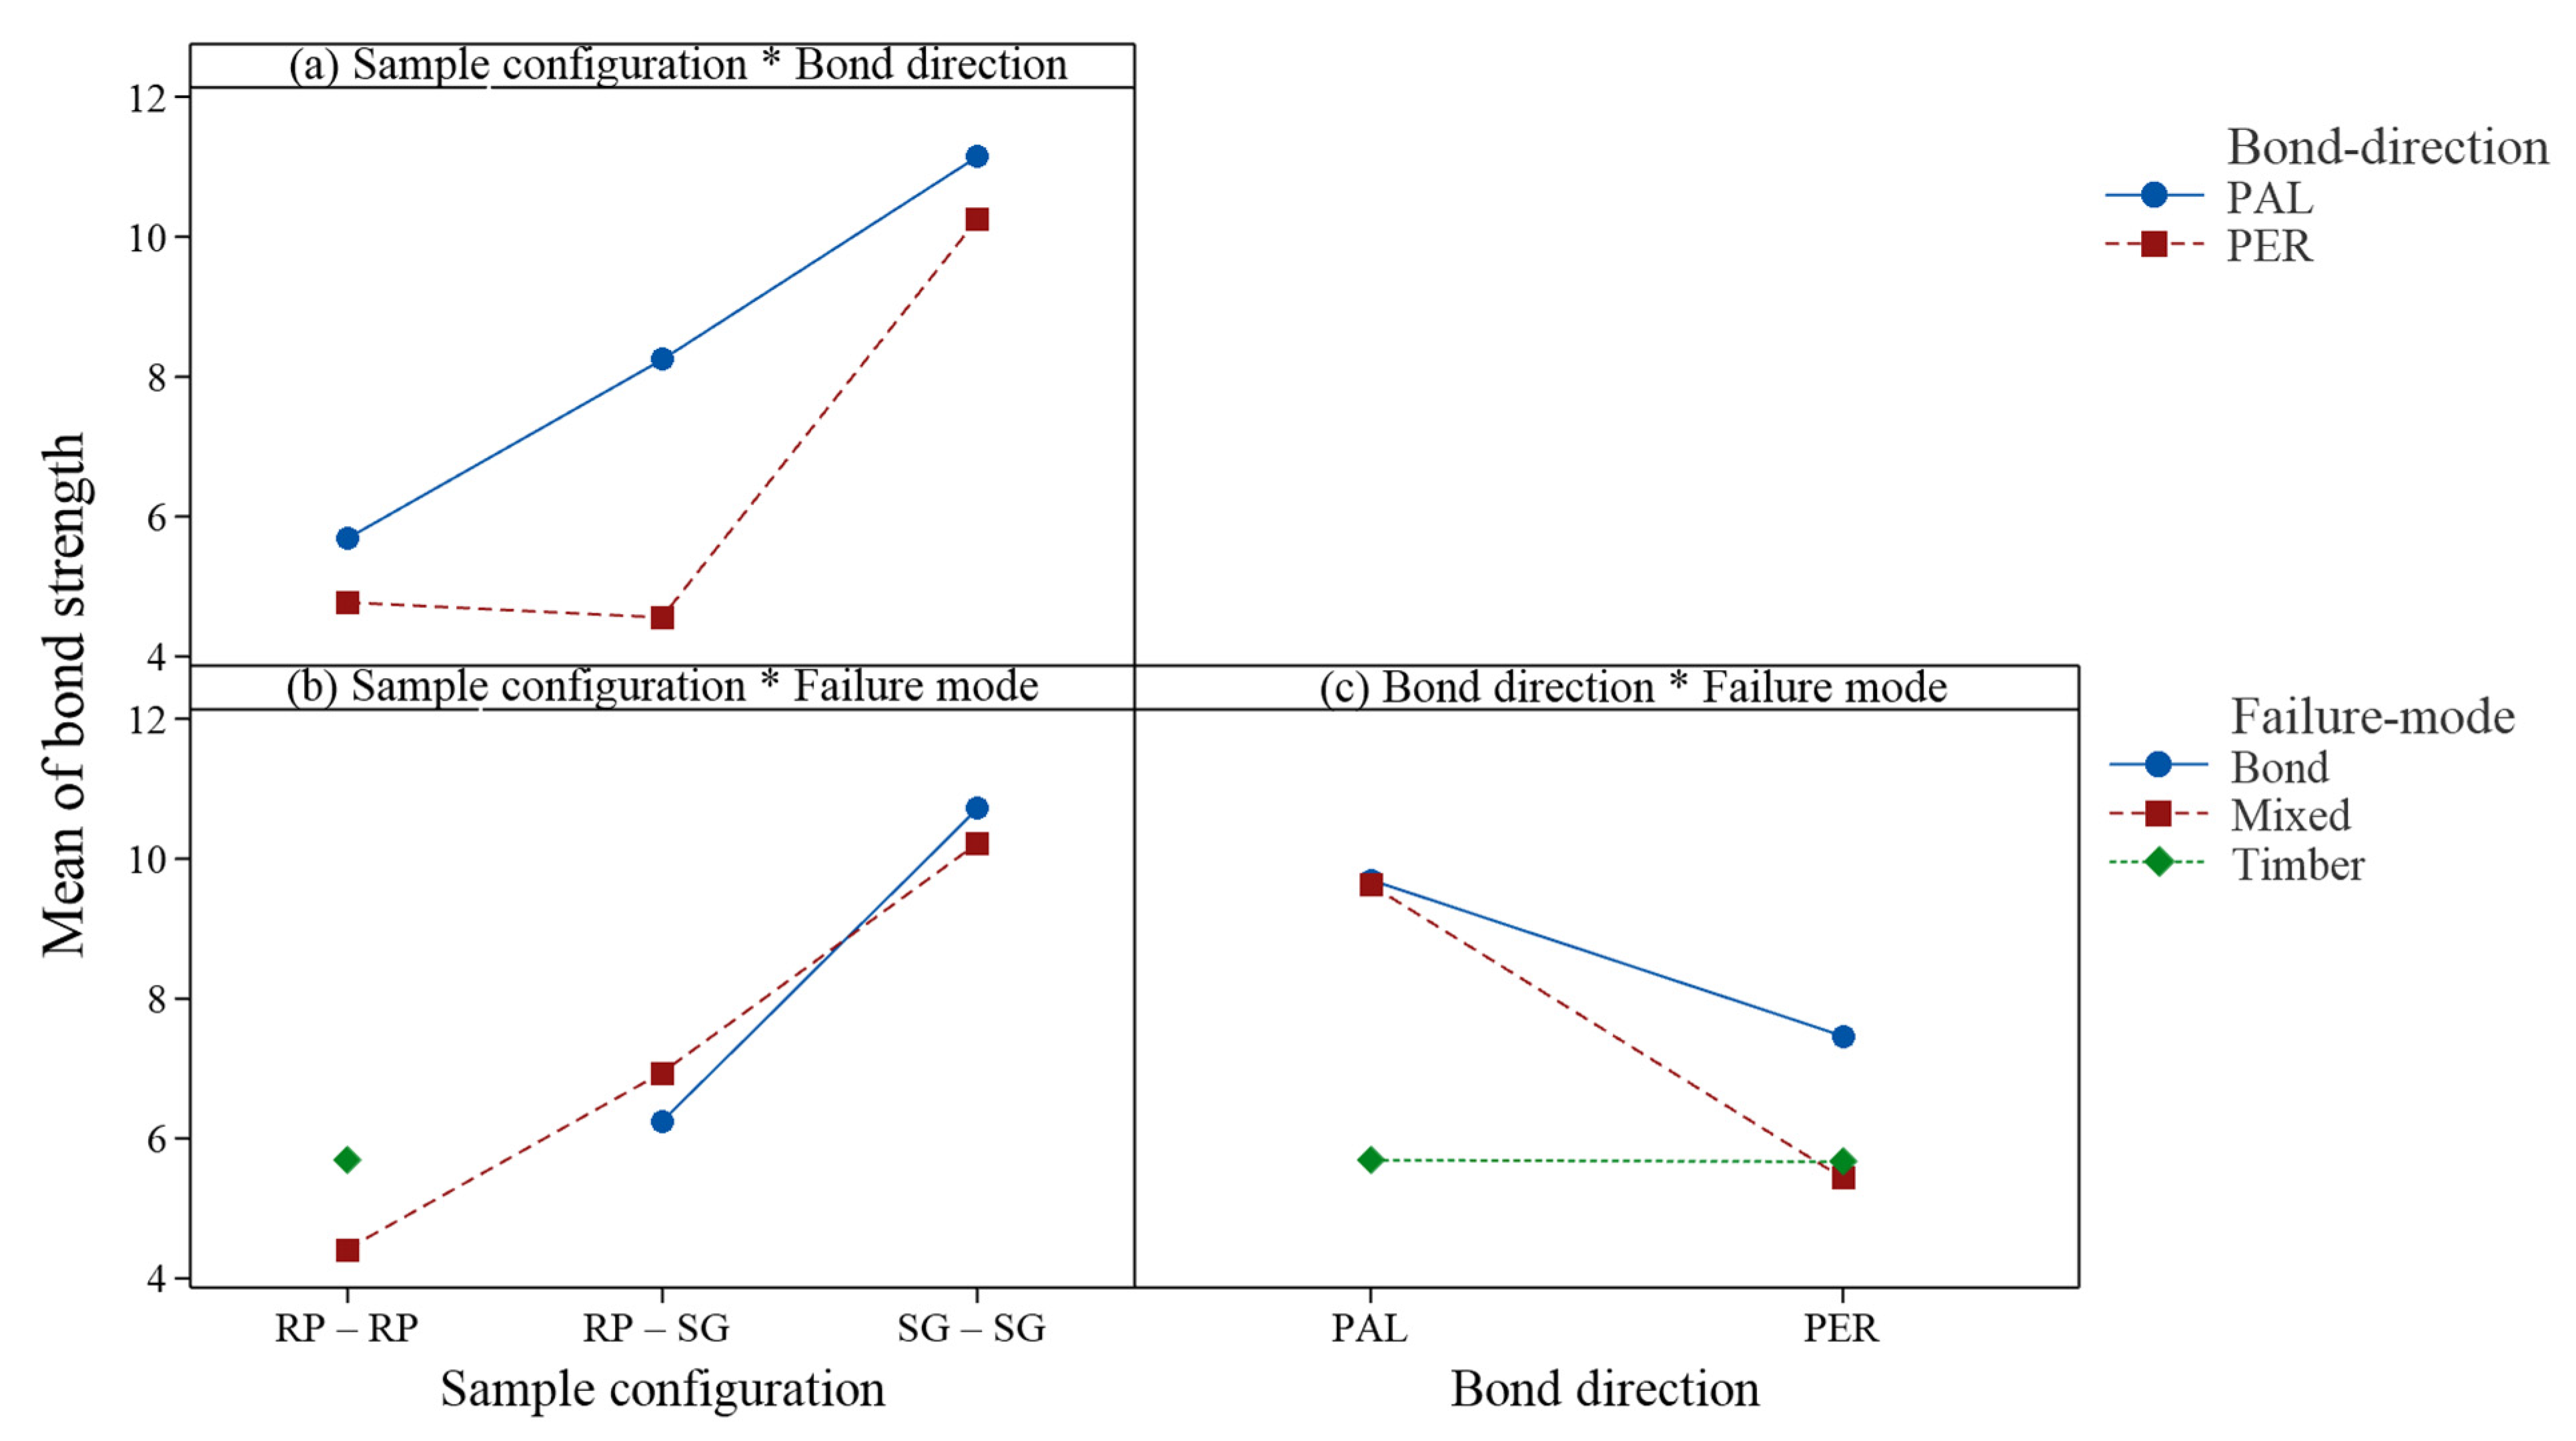
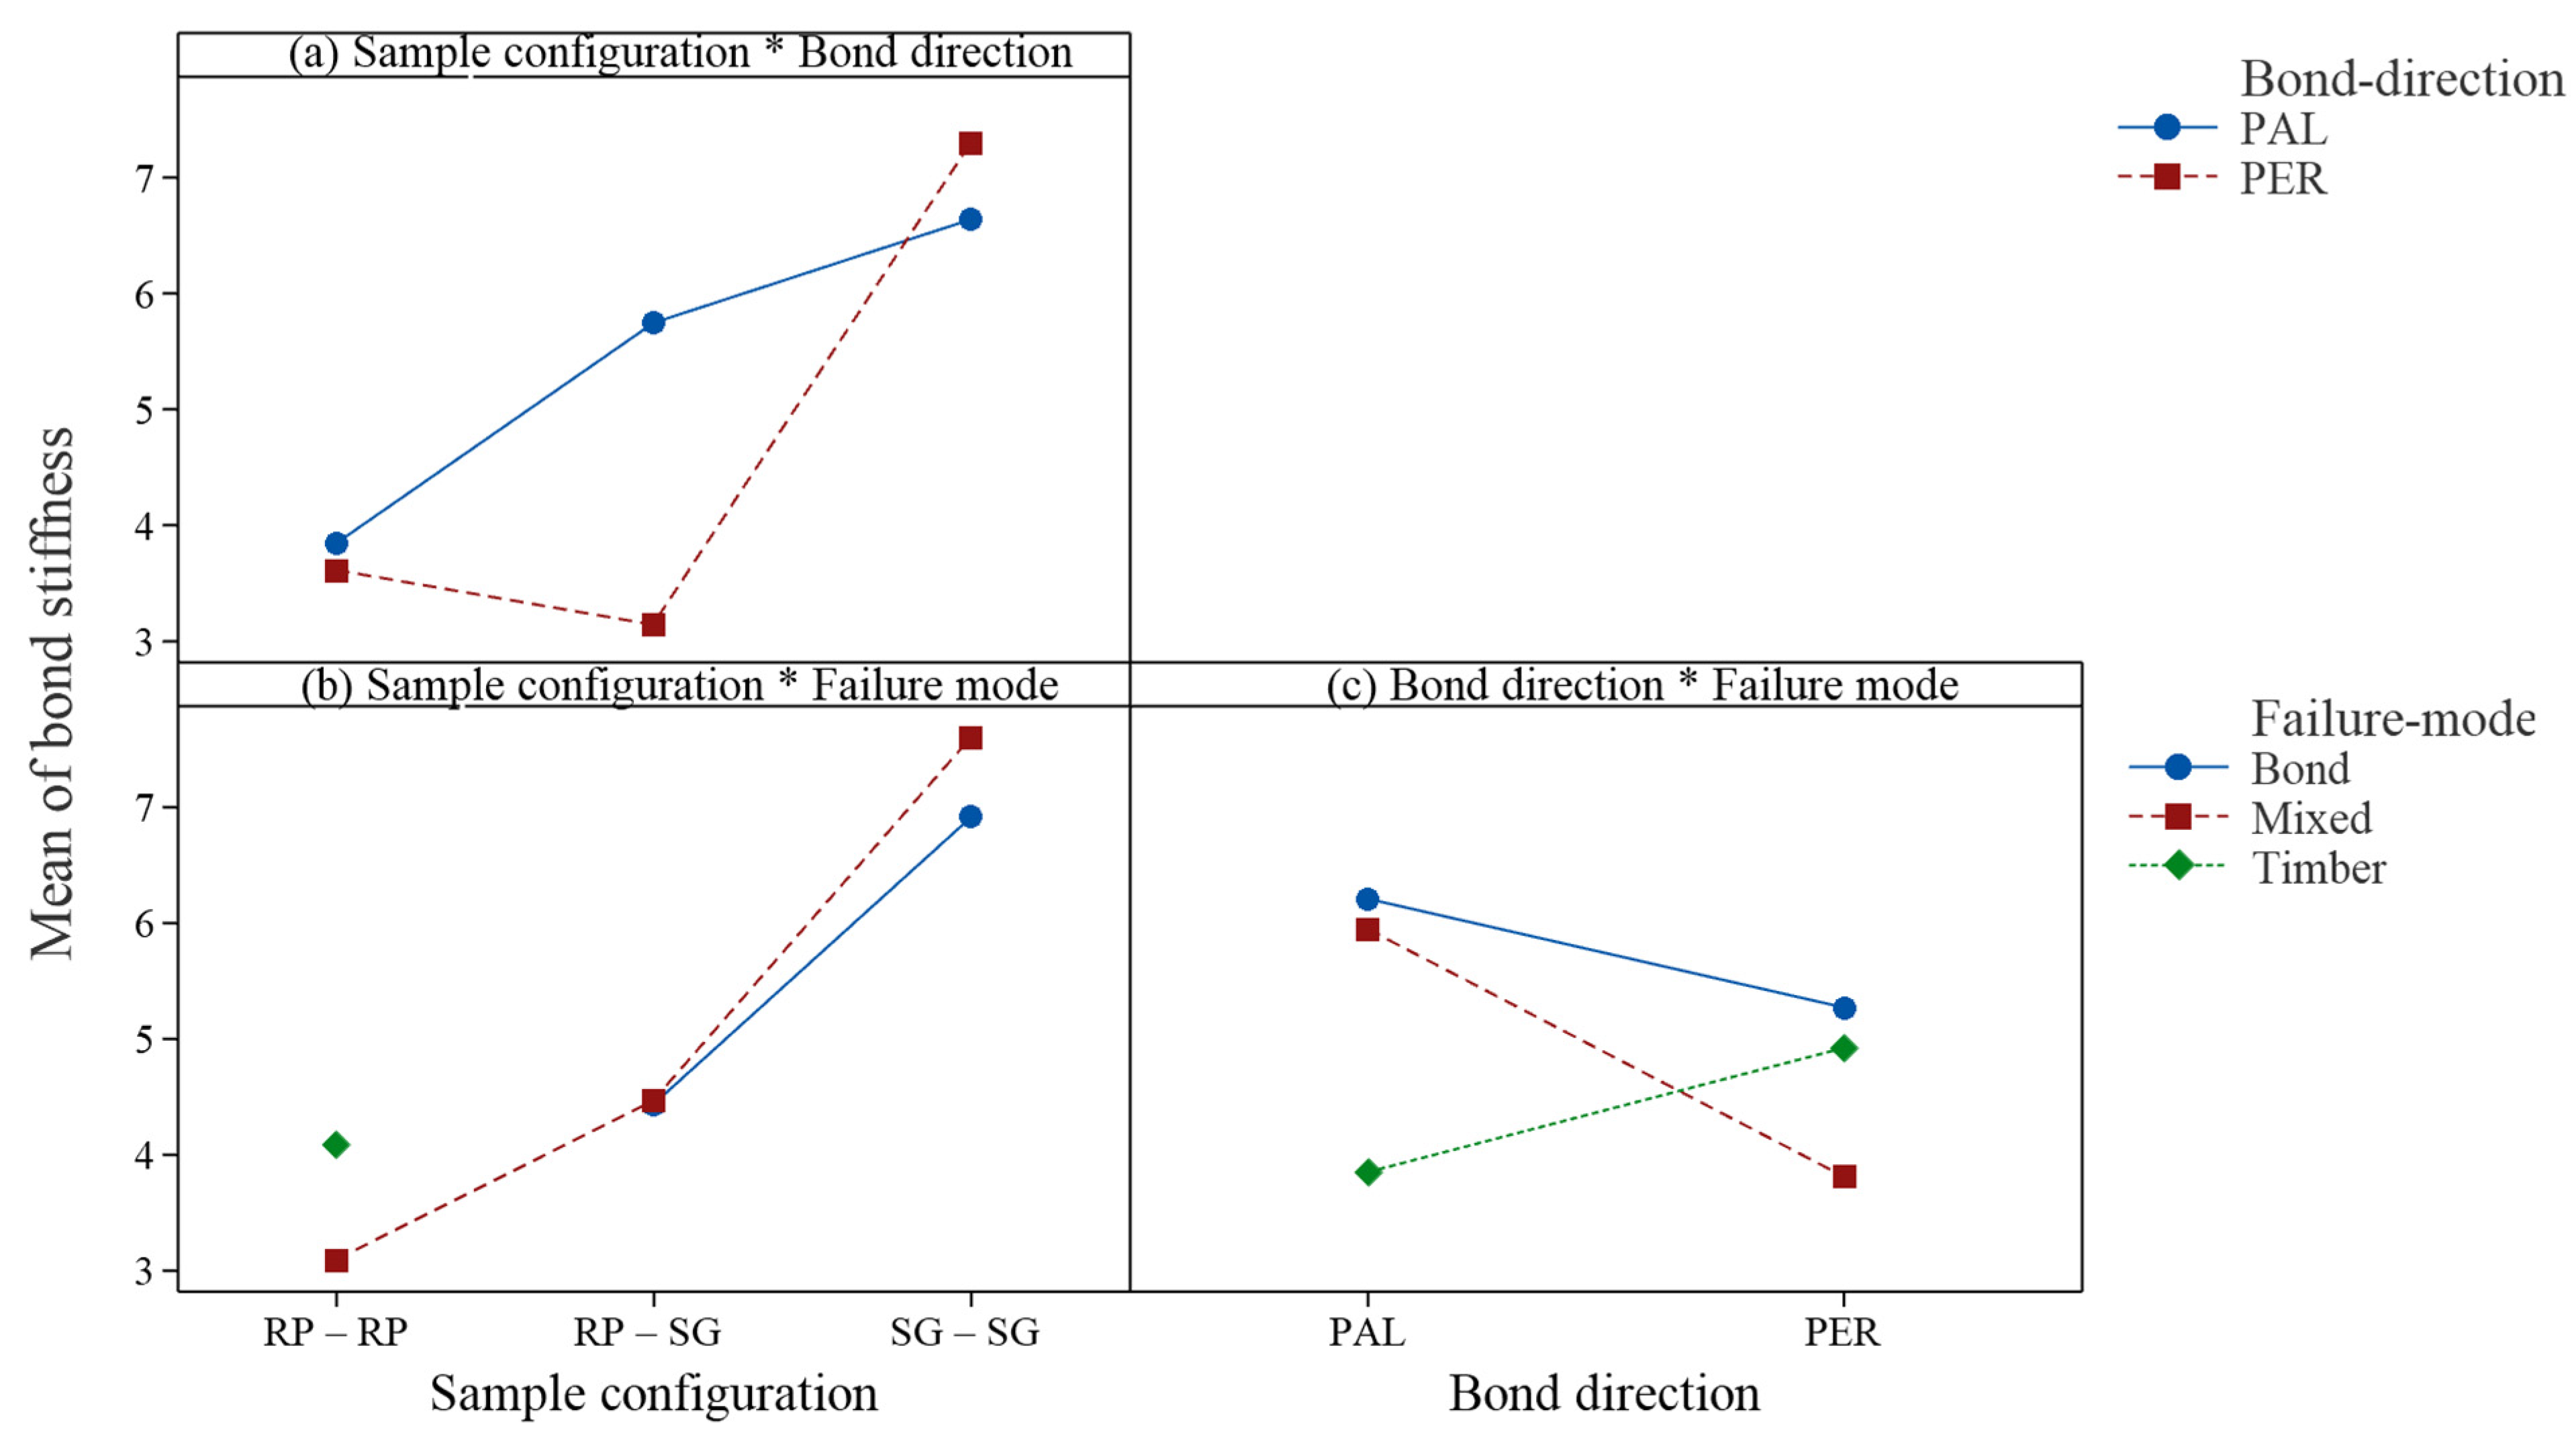
  • Lamellae configurations and bond directions affect bond properties. A general increasing trend of bond properties was observed when hardwood was involved in sample configurations, as shown in Figure 10a and Figure 11a. However, the only exception and the worst-case scenario was found to be hybrid samples combining softwood and hardwood that bonded perpendicularly to the fibre direction (RP–SG–PER). Bond properties attained positive improvements when samples were bonded in PAL directions, whilst those in PER directions showed adverse effects. Characteristic bond strengths for current tested RP–SG–PAL and RP–SG–PER samples were 6.19 and 2.96 MPa, while characteristic bond stiffnesses were 4.38 and 2.99 N/mm3, respectively. The effect of relative fibre orientation should be taken into account when designing with a hybrid CLT panel. However, all observations revealed in the current study were based on the block shear tests and lacked any primer on the hardwood interface. Further research will be conducted to examine how hybrid combinations would affect the bond line through delamination tests and/or the effects of primer on shear bond properties.
  • The interaction between sample configurations and failure modes can be observed in Figure 10b and Figure 11b. Even the same failure mode yielded different bond strengths and stiffnesses when the configuration changed. For instance, the SG–SG samples had higher bond strength and stiffness compared to RP–SG samples for bond line and mixed failure mode. Under the same failure mode, RP–RP samples attained the lowest strength.
  • When it comes to bond direction, timber failure was not found to be affected by the bond direction (PAL vs. PER) (Figure 10c). An increase in bond stiffness was observed in PER samples for timber failure (Figure 11c). In contrast, for both bond line and mixed mode failure, the PER samples achieved lower bond strength and stiffness compared to the PAL samples.

4. Conclusions

Engineered timber products have been considered viable alternatives to traditional mineral-based materials that would contribute to future carbon emission reductions in the construction industry. The current study aimed at revealing one of the crucial concerns among engineered timbers, i.e., the bond properties of Australian softwoods—Radiata Pine (RP–RP), hardwoods—Shining Gum (SG–SG) and hybrid-wood (RP–SG) combinations in both parallel (PAL) and perpendicular (PER) bonding configurations using one-component polyurethane adhesives. Timber and mixed type failures commonly occurred in RP–RP samples, whilst delamination dominated the failure mode for SG–SG and RP–SG samples. Statistical analysis indicated that no significant effect due to bonding directions (PAL vs. PER) was found for RP–RP and SG–SG groups, but hardwood samples exhibited considerably higher bond strength and stiffness (both 55%) than softwood samples. However, when hybrid combinations were used in products, bond directions showed significant effects, both positive and negative, on RP–SG samples. Therefore, it is recommended that the bond direction should be taken into account while designing for hybrid cross-laminated timber.

Author Contributions

Conceptualisation, M.S.; methodology, M.S. and B.K.; formal analysis, M.S. and X.L.; investigation, M.S. and X.L.; writing—original draft, X.L., resources, M.S. and M.A.; writing—review and editing, M.S., B.K. and M.A.; supervision, M.S. and B.K.; data curation, X.L.; visualisation, X.L.; project administration, B.K. All authors have read and agreed to the published version of the manuscript.

Funding

This research received no external funding.

Data Availability Statement

Data can be shared by the authors upon request.

Acknowledgments

The authors would like to acknowledge Muhammad Talha, Sheher Dil Khalid, Xindi Zhang and Jasmine Zhang for their contributions to this project. The authors also gratefully acknowledge lab technicians Lube Veljanoski and Michael Shanahan for their generous support during the project. The authors would like to acknowledge the in-kind contribution made by Henkel to supply the adhesive used in this study.

Conflicts of Interest

The authors declare no conflict of interest.

References

  1. Li, X.; Ashraf, M.; Subhani, M.; Kremer, P.; Kafle, B.; Ghabraie, K. Experimental and numerical study on bending properties of heterogeneous lamella layups in cross laminated timber using Australian Radiata Pine. Constr. Build. Mater. 2020, 247, 118525. [Google Scholar] [CrossRef]
  2. Betti, M.; Brunetti, M.; Lauriola, M.P.; Nocetti, M.; Ravalli, F.; Pizzo, B. Comparison of newly proposed test methods to evaluate the bonding quality of Cross-Laminated Timber (CLT) panels by means of experimental data and finite element (FE) analysis. Constr. Build. Mater. 2016, 125, 952–963. [Google Scholar] [CrossRef]
  3. Fink, G.; Kohler, J.; Brandner, R. Application of European design principles to cross laminated timber. Eng. Struct. 2018, 171, 934–943. [Google Scholar] [CrossRef]
  4. Brandner, R.; Flatscher, G.; Ringhofer, A.; Schickhofer, G.; Thiel, A. Cross laminated timber (CLT): Overview and development. Eur. J. Wood Wood Prod. 2016, 74, 331–351. [Google Scholar] [CrossRef]
  5. Franzoni, L.; Lebée, A.; Lyon, F.; Foret, G. Bending behavior of regularly spaced CLT panels. Proceedings of World Conference on Timber Engineering (WCTE 2016), Vienna, Austria, 22–25 August 2016. [Google Scholar]
  6. Christovasilis, I.; Brunetti, M.; Follesa, M.; Nocetti, M.; Vassallo, D. Evaluation of the mechanical properties of cross laminated timber with elementary beam theories. Constr. Build. Mater. 2016, 122, 202–213. [Google Scholar] [CrossRef]
  7. Sikora, K.S.; McPolin, D.O.; Harte, A.M. Effects of the thickness of cross-laminated timber (CLT) panels made from Irish Sitka spruce on mechanical performance in bending and shear. Constr. Build. Mater. 2016, 116, 141–150. [Google Scholar] [CrossRef] [Green Version]
  8. Aicher, S.; Christian, Z.; Hirsch, M. Rolling shear modulus and strength of beech wood laminations. Holzforschung 2016, 70, 773–781. [Google Scholar] [CrossRef]
  9. Brunetti, M.; Nocetti, M.; Pizzo, B.; Negro, F.; Aminti, G.; Burato, P.; Cremonini, C.; Zanuttini, R. Comparison of different bonding parameters in the production of beech and combined beech-spruce CLT by standard and optimized tests methods. Constr. Build. Mater. 2020, 265, 120168. [Google Scholar] [CrossRef]
  10. Bendtsen, B.A. Rolling shear characteristics of nine structural softwoods. For. Prod. J. 1976, 26, 51–56. [Google Scholar]
  11. Zhou, Q.; Gong, M.; Chui, Y.H.; Mohammad, M. Measurement of rolling shear modulus and strength of cross laminated timber fabricated with black spruce. Constr. Build. Mater. 2014, 64, 379–386. [Google Scholar] [CrossRef]
  12. Zhou, Q. Develoment of Evaluation Methodology for Rolling Shear Properties in Cross Laminated Timber (CLT). Ph.D. Thesis, University of New Brunswick, Fredericton, NB, Canada, 2013. [Google Scholar]
  13. He, M.; Sun, X.; Li, Z. Bending and compressive properties of cross-laminated timber (CLT) panels made from Canadian hemlock. Constr. Build. Mater. 2018, 185, 175–183. [Google Scholar] [CrossRef]
  14. Ukyo, S.; Shindo, K.; Miyatake, A. Evaluation of rolling shear modulus and strength of Japanese cedar cross-laminated timber (CLT) laminae. J. Wood Sci. 2019, 65, 31. [Google Scholar] [CrossRef] [Green Version]
  15. Li, M. Evaluating rolling shear strength properties of cross-laminated timber by short-span bending tests and modified planar shear tests. J. Wood Sci. 2017, 63, 331–337. [Google Scholar] [CrossRef]
  16. Li, M.; Dong, W.; Lim, H. Influence of Lamination Aspect Ratios and Test Methods on Rolling Shear Strength Evaluation of Cross-Laminated Timber. J. Mater. Civ. Eng. 2019, 31, 04019310. [Google Scholar] [CrossRef] [Green Version]
  17. Frihart, C.R.; Hunt, C.G. Adhesives with wood materials: Bond formation and performance. In Wood Handbook: Wood as an Engineering Material; U.S. Dept. of Agriculture, Forest Service, Forest Products Laboratory: Madison, WI, USA, 2010; Volume 190, pp. 10.11–10.24. [Google Scholar]
  18. EN 14080; Timber Structures–Glued Laminated Timber and Glued Solid Timber–Requirements. European Committee for Standardization (CEN): Washington, DC, USA, 2013.
  19. EN 16351; Timber Structures. Cross Laminated Timber. Requirements. European Committee for Standardization (CEN): Washington, DC, USA, 2021.
  20. Subhani, M.; Globa, A.; Al-Ameri, R.; Moloney, J. Effect of grain orientation on the CFRP-to-LVL bond. Compos. Part B Eng. 2017, 129, 187–197. [Google Scholar] [CrossRef]
  21. Wang, J.B.; Wei, P.; Gao, Z.; Dai, C. The evaluation of panel bond quality and durability of hem-fir cross-laminated timber (CLT). Eur. J. Wood Wood Prod. 2018, 76, 833–841. [Google Scholar] [CrossRef]
  22. Li, M.; Zhang, S.; Gong, Y.; Tian, Z.; Ren, H. Gluing techniques on bond performance and mechanical properties of cross-laminated timber (CLT) made from Larix kaempferi. Polymers 2021, 13, 733. [Google Scholar] [CrossRef] [PubMed]
  23. Lu, Z.; Zhou, H.; Liao, Y.; Hu, C. Effects of surface treatment and adhesives on bond performance and mechanical properties of cross-laminated timber (CLT) made from small diameter Eucalyptus timber. Constr. Build. Mater. 2018, 161, 9–15. [Google Scholar] [CrossRef]
  24. Yusof, N.M.; Tahir, P.M.; Roseley, A.S.M.; Lee, S.H.; Halip, J.A.; James, R.M.S.; Ashaari, Z. Bond integrity of cross laminated timber from Acacia mangium wood as affected by adhesive types, pressing pressures and loading direction. Int. J. Adhes. Adhes. 2019, 94, 24–28. [Google Scholar] [CrossRef]
  25. Santos, P.; Correia, J.R.; Godinho, L.; Dias, A.; Dias, A. Bonding quality assessment of cross-layered Maritime pine elements glued with one-component polyurethane adhesive. Constr. Build. Mater. 2019, 211, 571–582. [Google Scholar] [CrossRef]
  26. Hänsel, A.; Sandak, J.; Sandak, A.; Mai, J.; Niemz, P. Selected previous findings on the factors influencing the gluing quality of solid wood products in timber construction and possible developments: A review. Wood Mater. Sci. Eng. 2022, 17, 230–241. [Google Scholar] [CrossRef]
  27. Wiedenhoeft, A.C.; Miller, R.B. Structure and function of wood. In Handbook of Wood Chemistry and Wood Composites; U.S. Dept. of Agriculture, Forest Service, Forest Products Laboratory: Madison, WI, USA, 2005; pp. 9–33. [Google Scholar]
  28. Ross, R.J. Wood Handbook: Wood as an Engineering Material; U.S. Dept. of Agriculture, Forest Service, Forest Products Laboratory: Madison, WI, USA, 2010. Available online: https://www.hyne.com.au/article/187/clt-and-glt-a-perfect-combination-for-many-structural-building-solutions (accessed on 4 April 2023).
  29. NFISC. Australia’s State of the Forests Report 2018; National Forest Inventory Steering Committee: Canberra, Australia, 2019. [Google Scholar]
  30. ANSI. NDS: National Design Specification for Wood Construction; American Forest and Paper Association: Washington, DC, USA, 2018. [Google Scholar]
  31. Karacabeyli, E.; Gagnon, S. Canadian CLT Handbook, 2019th ed.; National Library of Canada: Montreal, QC, Canada, 2019. [Google Scholar]
  32. Gagnon, S.; Pirvu, C. CLT Handbook: Cross-Laminated Timber. Canadian Edition; National Library of Canada: Montreal, QC, Canada, 2011. [Google Scholar]
  33. Developments in Structural Adhesives; Timber Queensland: Kedron, QLD, Australia, 2020.
  34. XLam. XLam Australian Cross Laminated Timber Panel Structural Guide; XLam Australia: Maryborough, QLD, Australia, 2017. [Google Scholar]
  35. AS/NZS 4364:2010; Timber—Bond Performance of Structural Adhesives. Standards NZ: Wellington, New Zealand, 2020.
  36. Bootle, K.R. Wood in Australia. Types, Properties and Uses; McGraw-Hill book Company: New York, NY, USA, 1983. [Google Scholar]
Figure 2. Lamellae preparation, clamping process and final specimens for testing.
Buildings 13 01011 g002
Figure 3. (a) Test setup, (b) direction of applied load, (c) shear plane for PER configuration.
Buildings 13 01011 g003
Figure 4. Loading curves and typical modes for RP–RP samples. (a) RP–RP–PAL, (b) RP–RP–PER.
Buildings 13 01011 g004
Figure 5. Loading curves and typical modes for SG–SG samples. (a) SG–SG–PAL, (b) SG–SG–PER.
Buildings 13 01011 g005
Figure 6. Loading curves and typical modes for RP–SG samples. (a) RP–SG–PAL, (b) RP–SG–PER.
Buildings 13 01011 g006aBuildings 13 01011 g006b
Figure 7. Bond characteristics of all tested samples. (a) Shear bond strength, (b) bond stiffness.
Buildings 13 01011 g007
Figure 8. Pairwise comparison between species combinations for bond properties. (a) Post hoc analysis for t-test (bond strength) (b) Post hoc analysis for t-test (bond stiffness).
Buildings 13 01011 g008
Figure 9. Bond characteristics regarding failure modes. (a) Shear bond strength, (b) shear bond stiffness.
Buildings 13 01011 g009aBuildings 13 01011 g009b
Figure 10. Interaction plot between sample configuration, bond direction and failure mode on bond strength.
Buildings 13 01011 g010
Figure 11. Interaction plot between sample configuration, bond direction and failure mode on bond stiffness.
Buildings 13 01011 g011
Table 1. Material properties of wood species (date taken from [36]).
SpeciesDensity (kg/m3)Modulus of Rupture (MPa)Modulus of Elasticity (GPa)Maximum Crushing Strength (MPa)
GreenDryGreenDryGreenDryGreenDry
Pine, Radiata80055042818101942
Gum, Shining1120680629910133158
Table 2. Details of samples’ dimensions for testing.
Sample DesignationDimensions (mm)
t × w × l
Bond DirectionNumbers
RP–RP–PAL60 (30 × 2) × 50 × 50Parallel 7
RP–RP–PERPerpendicular7
SG–SG–PAL60 (30 × 2) × 50 × 50Parallel7
SG–SG–PERPerpendicular7
RP–SG–PAL60 (30 × 2) × 50 × 50Parallel7
RP–SG–PERPerpendicular7
Table 3. Mean and characteristic properties of bond strength and stiffness.
GroupBond Strength τbondBond Stiffness ks
Mean
(MPa)
COV5th Percentile
(MPa)
Mean (N/mm3)COV5th Percentile (N/mm3)
RP–RP–PAL5.690.1393.883.840.0133.87
RP–SG–PAL8.240.1296.195.750.0554.38
SG–SG–PAL11.140.1578.346.640.0686.45
RP–RP–PER4.770.1003.453.610.3373.30
RP–SG–PER4.560.1572.963.140.0892.99
SG–SG–PER10.240.1307.837.290.2176.94
Table 4. Effects of bond direction on the shear bond strength and bond stiffness.
GroupBond Strength τbondBond Stiffness ks
Mean
(MPa)
R2Sums of Squares
(SS)
Fp-ValueMean (N/mm3)R2Sums of Squares
(SS)
Fp-Value
RP–RP–PAL5.690.2792.9614.6600.0523.840.0250.1910.3010.593
RP–RP–PER4.773.61
SG–SG–PAL11.140.1352.8711.8640.1976.640.1101.5031.4790.247
SG–SG–PER10.247.29
RP–SG–PAL8.240.81747.61353.5210.0005.750.87023.80379.9770.000
RP–SG–PER4.563.14
Table 5. Effects of species on shear bond strength and bond stiffness.
GroupBond Strength τbondBond Stiffness ks
Mean
(MPa)
R2Sums of Squares
(SS)
Fp-ValueMean (N/mm3)R2Sums of Squares
(SS)
Fp-Value
RP–RP–PAL5.690.827104.17143.3570.0003.840.81828.50252.5800.000
RP–SG–PAL8.245.75
SG–SG–PAL11.146.64
RP–RP–PER4.770.644145.12886.1930.0003.610.52272.38235.2660.000
RP–SG–PER4.563.14
SG–SG–PER10.247.29
Table 6. Bond strength of various species when the grain directions of the boards are parallel to each other.
SpeciesMean Density (kg/m3)Mean Bond Strength (MPa)Reference
Shining Gum (HW)90011.14This study
Acacia mangium6735.00[24]
Eucalyptus urophylla × E. grandis (HW)5804.00[23]
Fagus sylvatica L. (HW)7106.10[9]
Pinus pinaster Ait. (HW)5007.05[25]
Radiata pine (SW)4815.69This study
Hem-fir (SW)6333.89[21]
Larix kaempferi (SW)6802.21[22]
Disclaimer/Publisher’s Note: The statements, opinions and data contained in all publications are solely those of the individual author(s) and contributor(s) and not of MDPI and/or the editor(s). MDPI and/or the editor(s) disclaim responsibility for any injury to people or property resulting from any ideas, methods, instructions or products referred to in the content.

