Article

Performances of Heat-Insulating Concrete Doped with Straw Fibers for Use in Tunnels

1
College of Safety and Environmental Engineering, Shandong University of Science and Technology, Qingdao 266590, China
2
The Fifth Exploration Team of Shandong Coalfield Geology Bureau, Jinan 250100, China
*
Author to whom correspondence should be addressed.
Buildings 2023, 13(3), 818; https://doi.org/10.3390/buildings13030818
Submission received: 9 February 2023 / Revised: 9 March 2023 / Accepted: 13 March 2023 / Published: 21 March 2023
(This article belongs to the Section Building Materials, and Repair & Renovation)

Abstract

:
Current research efforts aim to develop insulating building materials to cope with hot tunnels by using crop straw fibers. The amount of straw fiber incorporated included different percentages of the gelling material mass: 0% (reference specimen), 2.5%, 5%, 7.5%, and 10%. The study focused on the concrete’s compressive strength, permeability, and thermal coefficient. The thermal coefficient of dry concrete decreased with increasing fiber content. However, the porosity of concrete mixed with more straw fibers increased, thus decreasing compressive strength. Concrete with a fiber content of 7.5% had the best overall performance, and it had a low thermal conductivity (0.158 W/(m·k)). According to COMSOL simulation results, the tunnel wind flow temperature of concrete with 7.5% fiber content was lower than the tunnel wind flow temperature of plain concrete. Thus, the obtained straw fiber heat-insulating concrete is a promising candidate material for tunnel insulation.

1. Introduction

In recent years, more and more tunnels have been built and operated in high temperature environments. In hot tunnels, excessive airflow temperatures increase heat-related diseases and damage human health [1]. The wet bulb air temperature exceeds 32.5 °C, which leads to decreased efficiency and increased accidents [2]. Traditionally, refrigeration systems are applied in high temperature areas to provide cool air to the workplace. The power consumption of this cooling system accounts for 25% of the total power consumption of the mine with high operating costs and low efficiency, thus making it difficult to solve the high temperature problem [3] completely. This is because 70% of the increased heat in the gas stream comes from the high temperature surrounding rock. An active insulation technique with additional insulation on the tunnel surface has been increasingly used in areas with temperature anomalies [4,5,6].
Due to the particular environment of underground tunnels, most of the applied insulation materials are based on inorganic concrete with good insulation properties, low density, and suitability for underground spraying and support [7,8]. Inorganic fiber concrete has a low thermal conductivity and good mechanical properties, which can reduce the tunnel cooling load and contribute directly to the energy economy [9]. However, synthetic-based insulating fiber materials have many shortcomings and hazards. Glass fiber and asbestos fibers produce floating silica dust, glass wool dust, and broken glass dust during production and on-site construction [10]. These dust specks endanger workers’ health, causing allergic skin diseases, respiratory diseases, and even cancer [11]. Basalt fibers are widely used in defense security facilities, but they have small production volumes and high production costs. They are an important strategic material that are making their way into general civilian construction [12]. The production of these synthetic-based insulating fiber materials is based on non-renewable resources, and the production process produces a large amount of industrial waste and carbon dioxide, which is against the concept of sustainable development. Following a sustainable development strategy, we are looking for a new fiber to replace synthetic fiber. Plant fiber is organic and is a promising green insulation material. In China, rice straw fiber has the advantages of comprehensive sources, abundant raw materials, low prices, and excellent mechanical properties [13,14,15]. The application of rice straw fibers for building wall insulation can reduce the reliance on non-renewable materials, reduce pollutant emissions, and reduce greenhouse gas emissions [16,17]. Most scholars use a very low percentage of natural fiber reinforcement (1–2%) when discussing mechanical properties. For concrete materials sprayed in high-temperature alleys, it is necessary to investigate a higher percentage of fiber reinforcement in the concrete mixture to achieve the desired thermal return.
Due to the difficulty of controlling many variables in field measurements, the expensive costs, and the time constraints, numerical simulations have been used to study the temperature fields of tunnels with different concrete spraying. Yicai Liu [18], in a study of ventilation in an underground hydroelectric power plant, found that the simulated data from the air outlet matched the measured values very well and had a similar trend. The data from the air outlet could greatly reflect the accuracy of the simulated air cooling effect. Wenhao et al. [19] compared the numerically simulated average air temperature at the excavated working face with the actual measured temperature in the field. They found that the two temperature profiles showed very similar trends, which proved the model’s accuracy. COMSOL Multiphysics software can predict changes in airflow temperature distribution.
This research work focused on adding straw fibers to concrete to create a new insulating concrete that would reduce airflow temperatures in hot tunnels. The apparent density, compressive strength, impermeability, and thermal conductivity of five specimens with different fiber percentage contents were tested. Finally, the temperature fields of plain concrete and fiber-insulating concrete tunnels were simulated separately. The produced straw fiber insulating concrete provides a new means to control the high temperature hazards of the tunnel.

2. Materials and Experimental Testing

2.1. Materials

The constituent materials of straw fiber concrete included cement, fly ash, sand with a particle size of less than 1 mm, Ceramic pellets with a particle size of 2–3 mm, and closed cell glass beads with a particle size of 0.5–1 mm. The straw fiber was sourced from local farmers. The type of cement was P.042.5 ordinary silicate cement (Nanfang Cement Plant, Shaoyang, Hunan Province, China). The fly ash used was ordinary high calcium fly ash (Hengxin Mineral Processing Co., Ltd., Shijiazhuang, China). Ceramic pellets and closed cell glass beads were from Muoi Building Materials Co. (Qingdao, China). The sand used was river sand (Maobo Building Materials Co., Shijiazhuang, China).

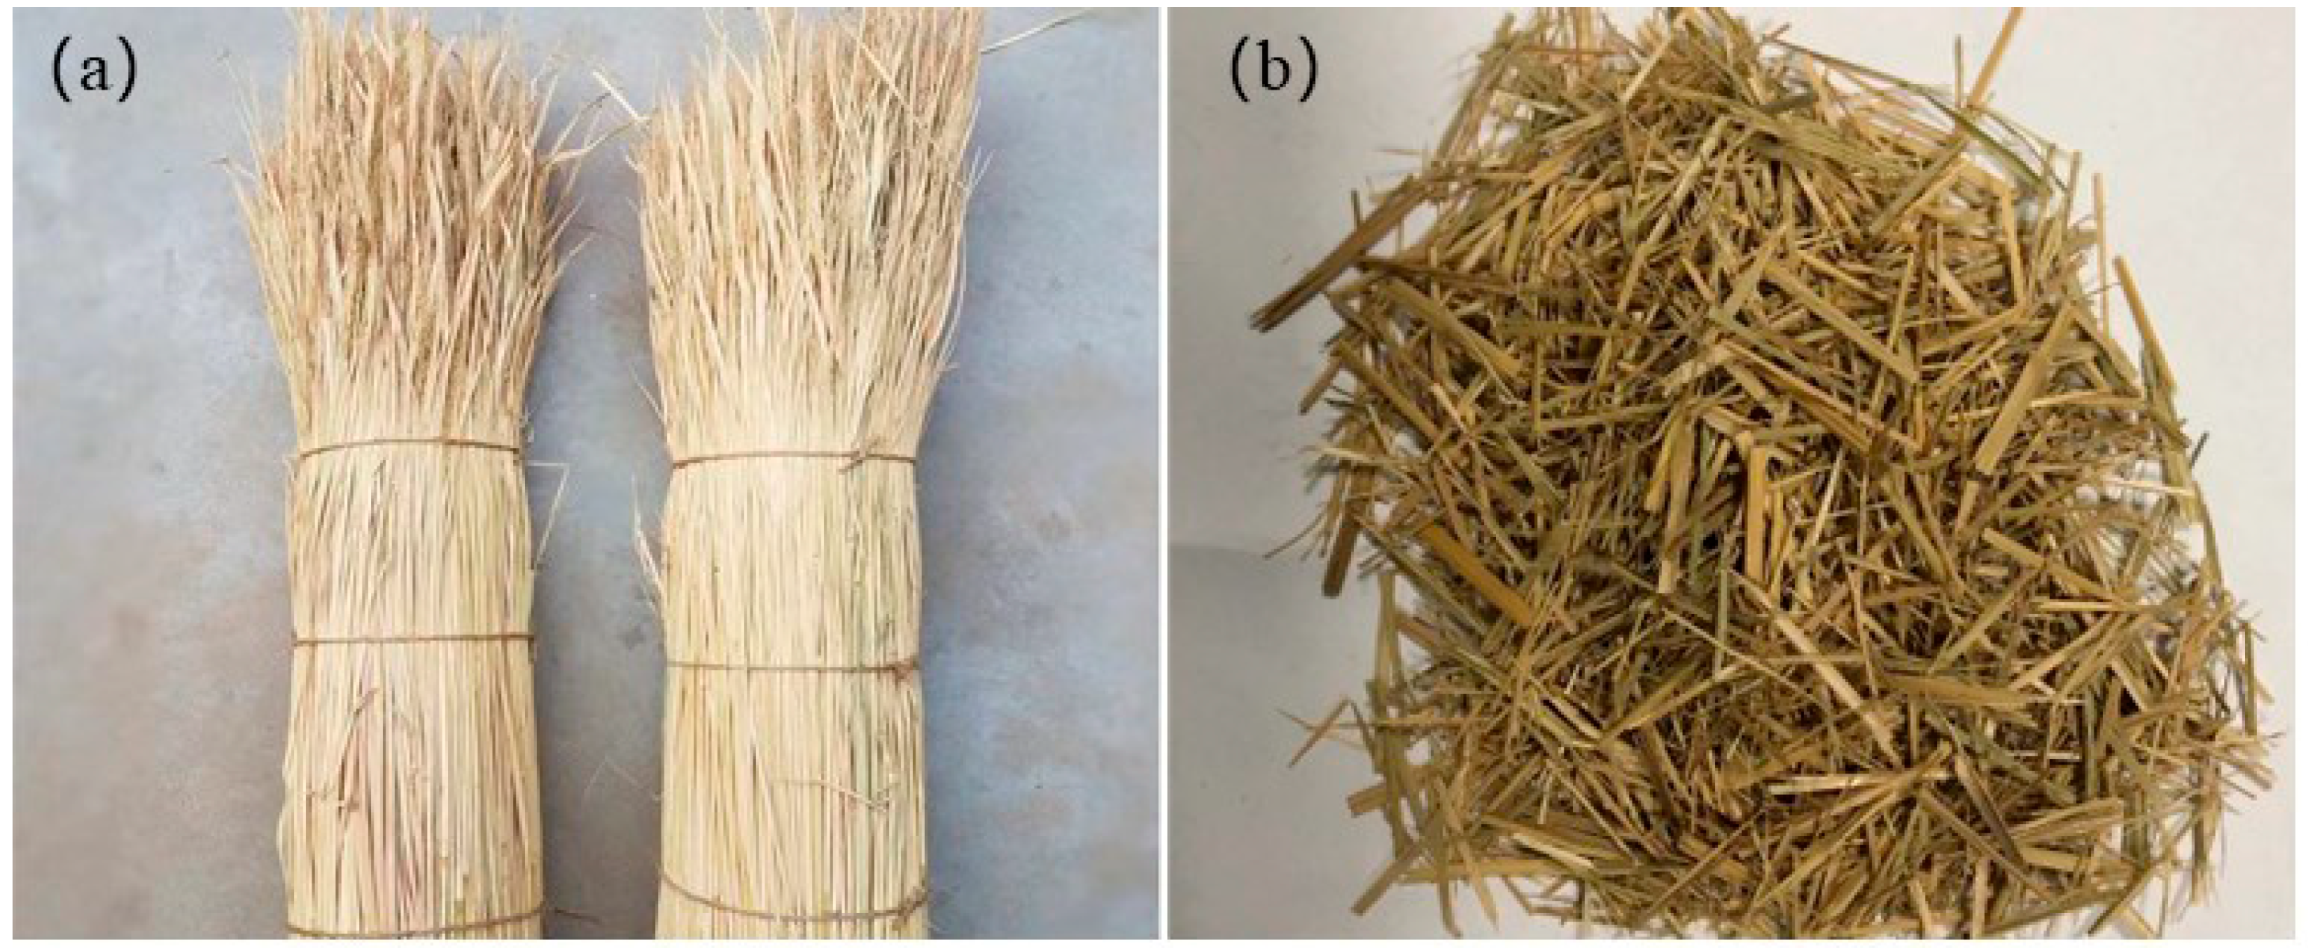
2.2. Preparation of Straw Fiber

After the autumn harvest, the straw was purchased from local farmers. After 2 months of natural drying, the straw was selected as the test sample with integrity, smoothness, and suitable thickness. A high speed multi-functional pulverizer was used to break the long straw to make fiber, and a filtering sieve removed the residue. The crushed fibers were 8–12 cm long and 0.3–0.4 cm thick. Figure 1 shows the natural rice straw and the finished fibers.

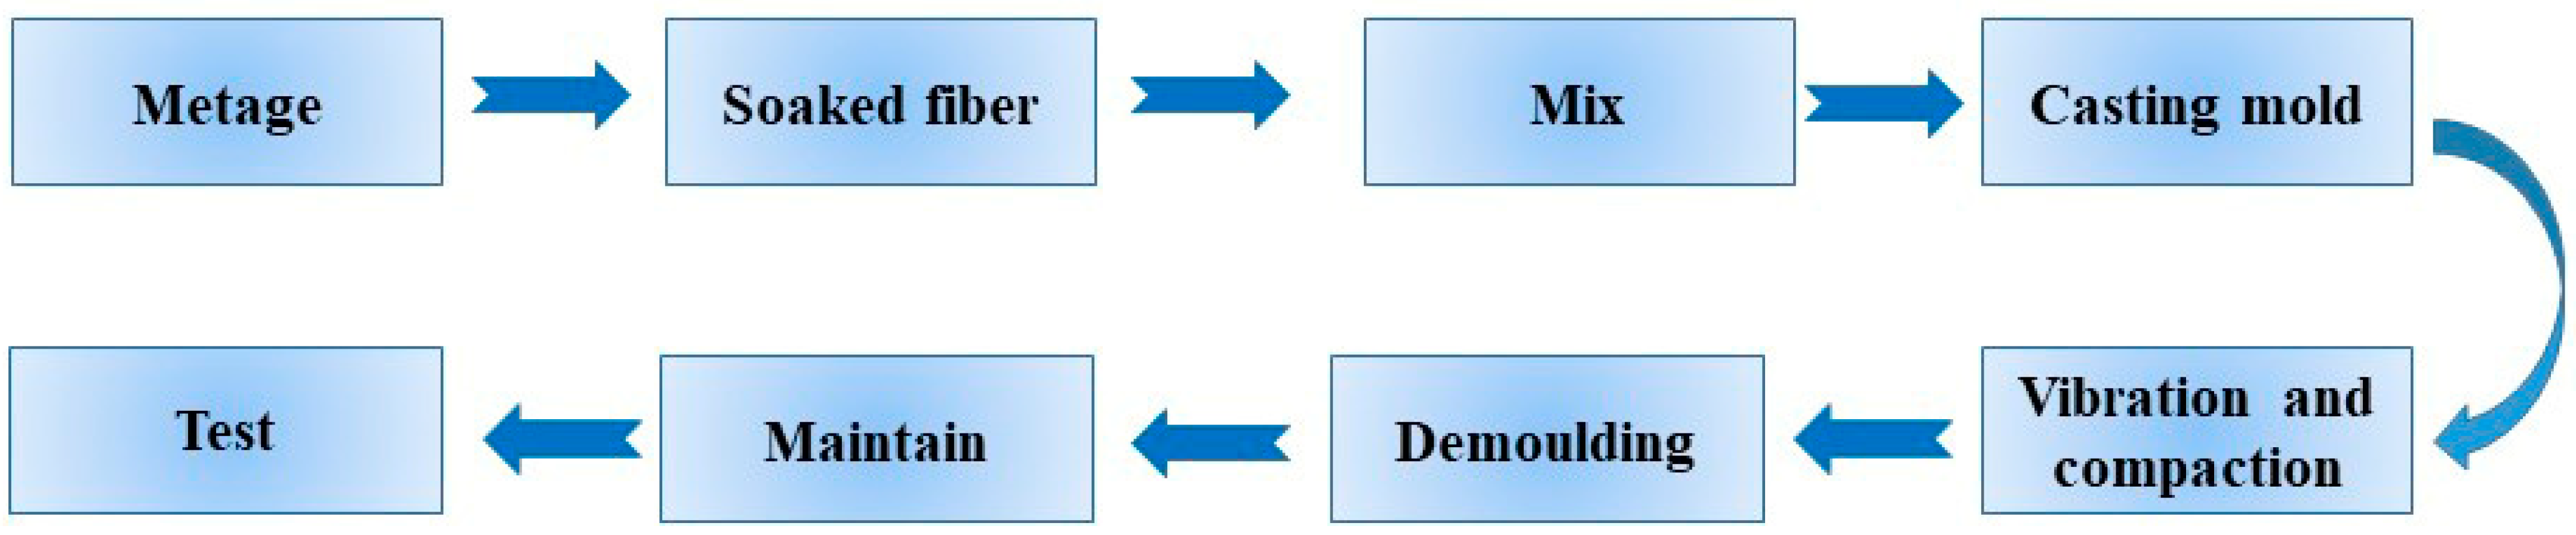
2.3. Preparation of Straw Fiber Concrete Samples

The mass ratio of fly ash, ordinary silicate cement, ordinary sand, and ceramsite was fixed as 1:4:11.5:6.5 with a water cement ratio of 0.55 by mass [20,21]. The amount of closed-cell glass beads added was half of the total volume of raw materials. Before sample making, we soaked the fiber in water to fully absorb water. The amount of straw fiber incorporated was different percentages of the gelling material mass (0%, 2.5%, 5%, 7.5%, 10%). We placed the fibers and other materials in a blender and mix thoroughly. The addition amounts of each component of concrete are shown in Table 1. Then, they were cast in a mold and put on the vibrating table to vibrate and compact, generally in about 10 s. The mixture was kept in the mold for 24 h and then demolded and maintained. The curing time for the samples to be tested for apparent density, compressive strength, and impermeability rating was 28 days. The samples were tested for thermal conductivity on the 3rd and 28th day of curing, respectively. To investigate the effect of moisture on the thermal conductivity of concrete, samples cured for 28 days were dried and tested for thermal conductivity (drying temperature of 100 °C and time of 50 min). Apparent density, compressive strength, and thermal conductivity test items were prepared with three identical samples, and the average value was taken as the final result. Six identical samples were prepared for the impermeability grade test, and the average value was taken as the final result. Figure 2 shows the sample preparation process.

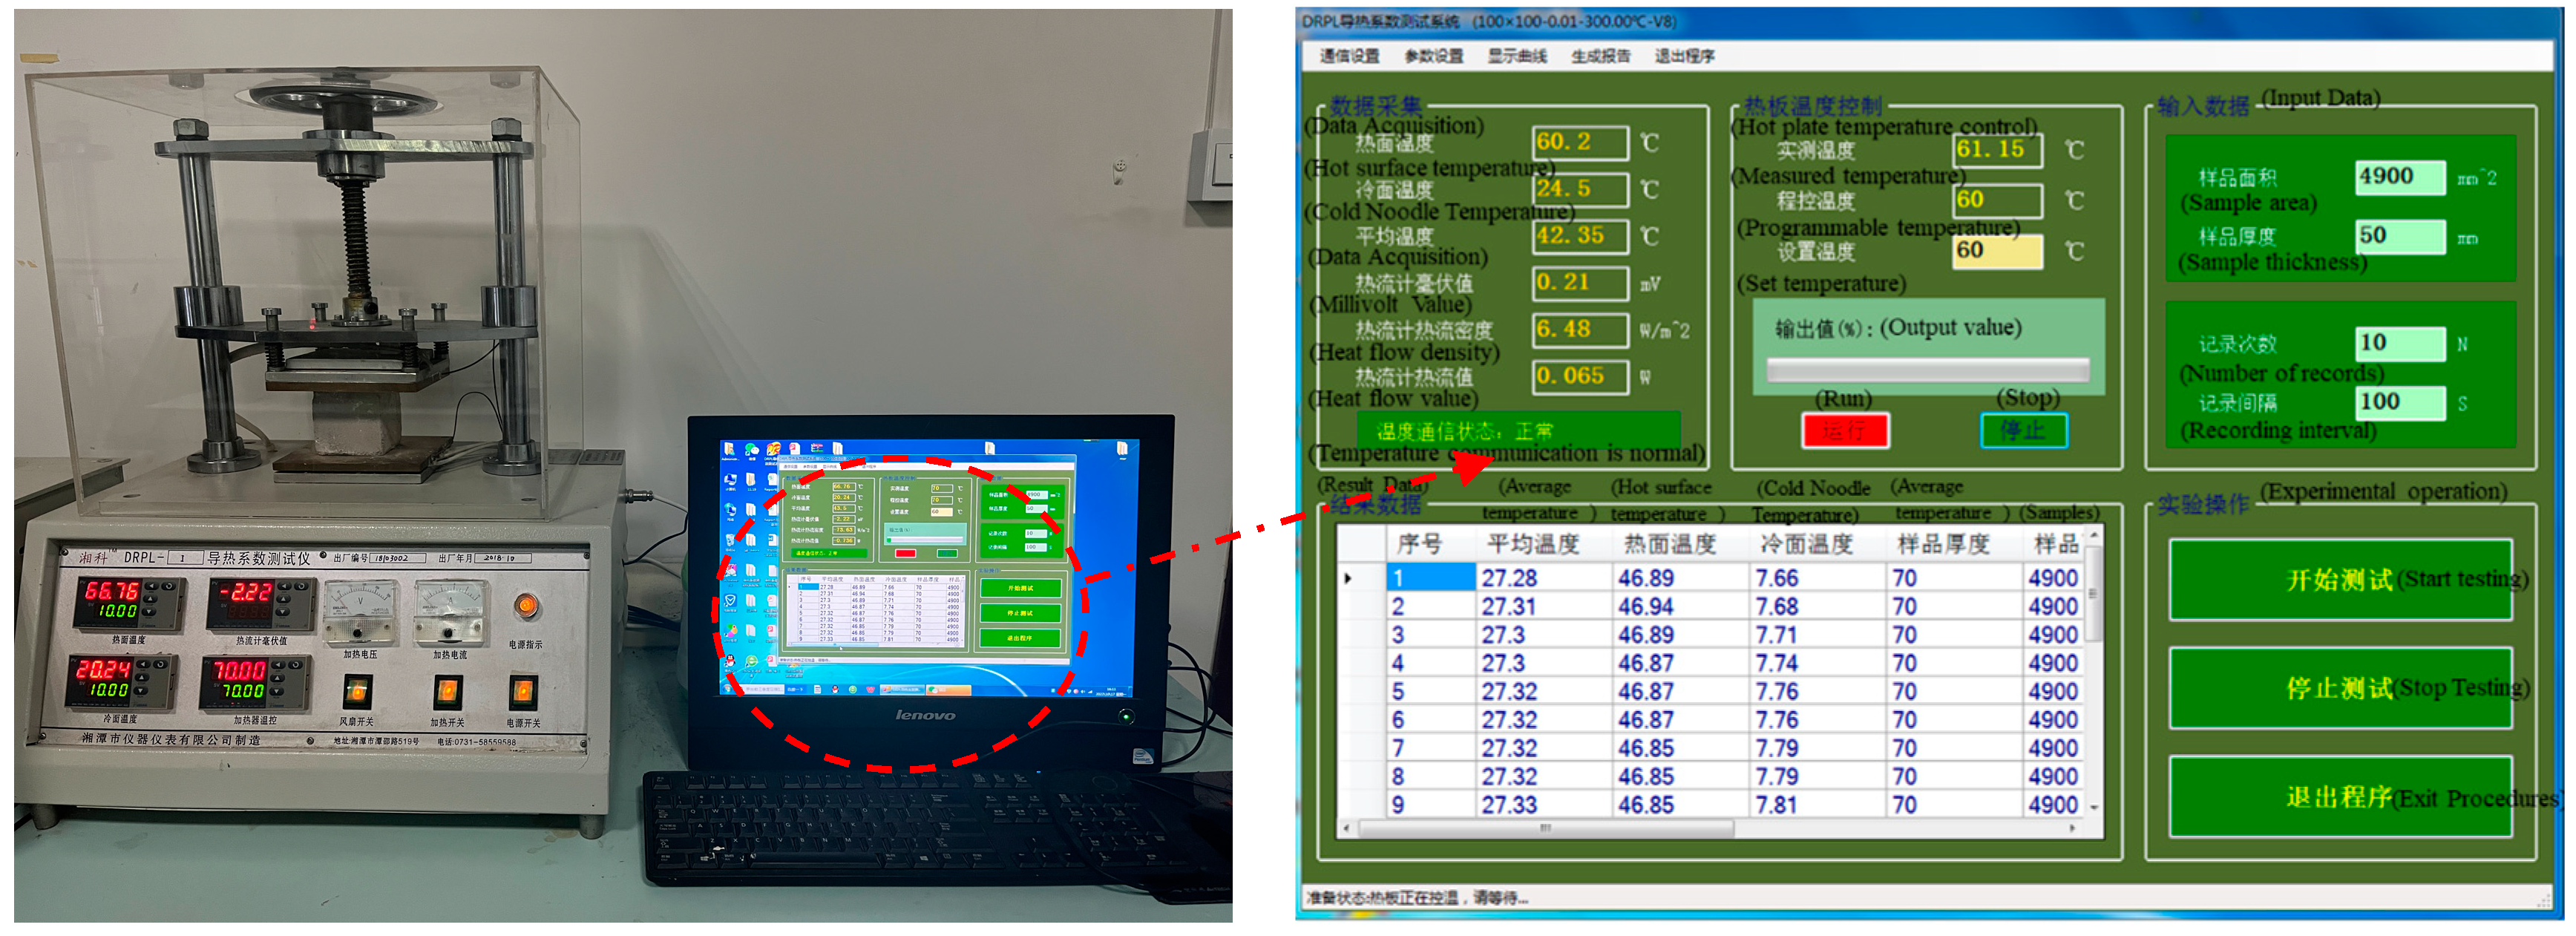
2.4. Experimental Testing

The thermal conductivity of the specimens was measured using a DRPL-I thermal conductivity tester (Xiangtan City, China) according to “Thermal Insulation-Determination of steady-state thermal resistance and related properties-Guarded hot plate apparatus” [22]. The DRPL-1 thermal conductivity meter (Figure 3) has a hot plate temperature adjustment range of 0–100 °C and a sample thickness range of 0–500 mm, and it takes about 40–60 min to calculate the thermal conductivity. The sample size was 150 mm × 150 mm × 50 mm. According to the “Standard for test method of mechanical properties on ordinary concrete,” the compressive strength of the specimens was measured using an AGX-250 electronic universal testing machine (Kyoto, Japan) [23]. This tester has a maximum load capacity of 2000 kN and a constant rate of 1 mm/min. The dimensions of the sample used to test the compressive strength were 100 mm × 100 mm × 100 mm. In accordance with the “Standard for long-term performance and durability of ordinary concrete test methods” [24], the penetration resistance level was tested with a concrete penetration tester of type SS-1.5 (Jinan, China). The dimensions of the samples were 175 mm in diameter at the top, 185 mm in diameter at the bottom, and 150 mm in height.
The interfacial bonding of straw fiber with concrete and the internal structure of fiber were investigated using an Apreo S HiVac scanning electronic microscope (Thermo Scientific, Beijing, China) with an accelerating voltage of 5 kV. The sputter coating of gold (Au) was done on samples to get quality images from SEM.

3. Analysis of Test Results

3.1. Apparent Density

The apparent density values are shown in Table 2, and the samples had an apparent density of 214~294 kg/m3. The density of the reference sample without added fibers was greater than that of the sample with added fibers. This is because the fibers in the concrete created indiscriminate gaps, and the plant fibers had a smaller mass than other raw materials. Straw fiber insulating concrete has the advantage of being lighter due to its lower apparent density.

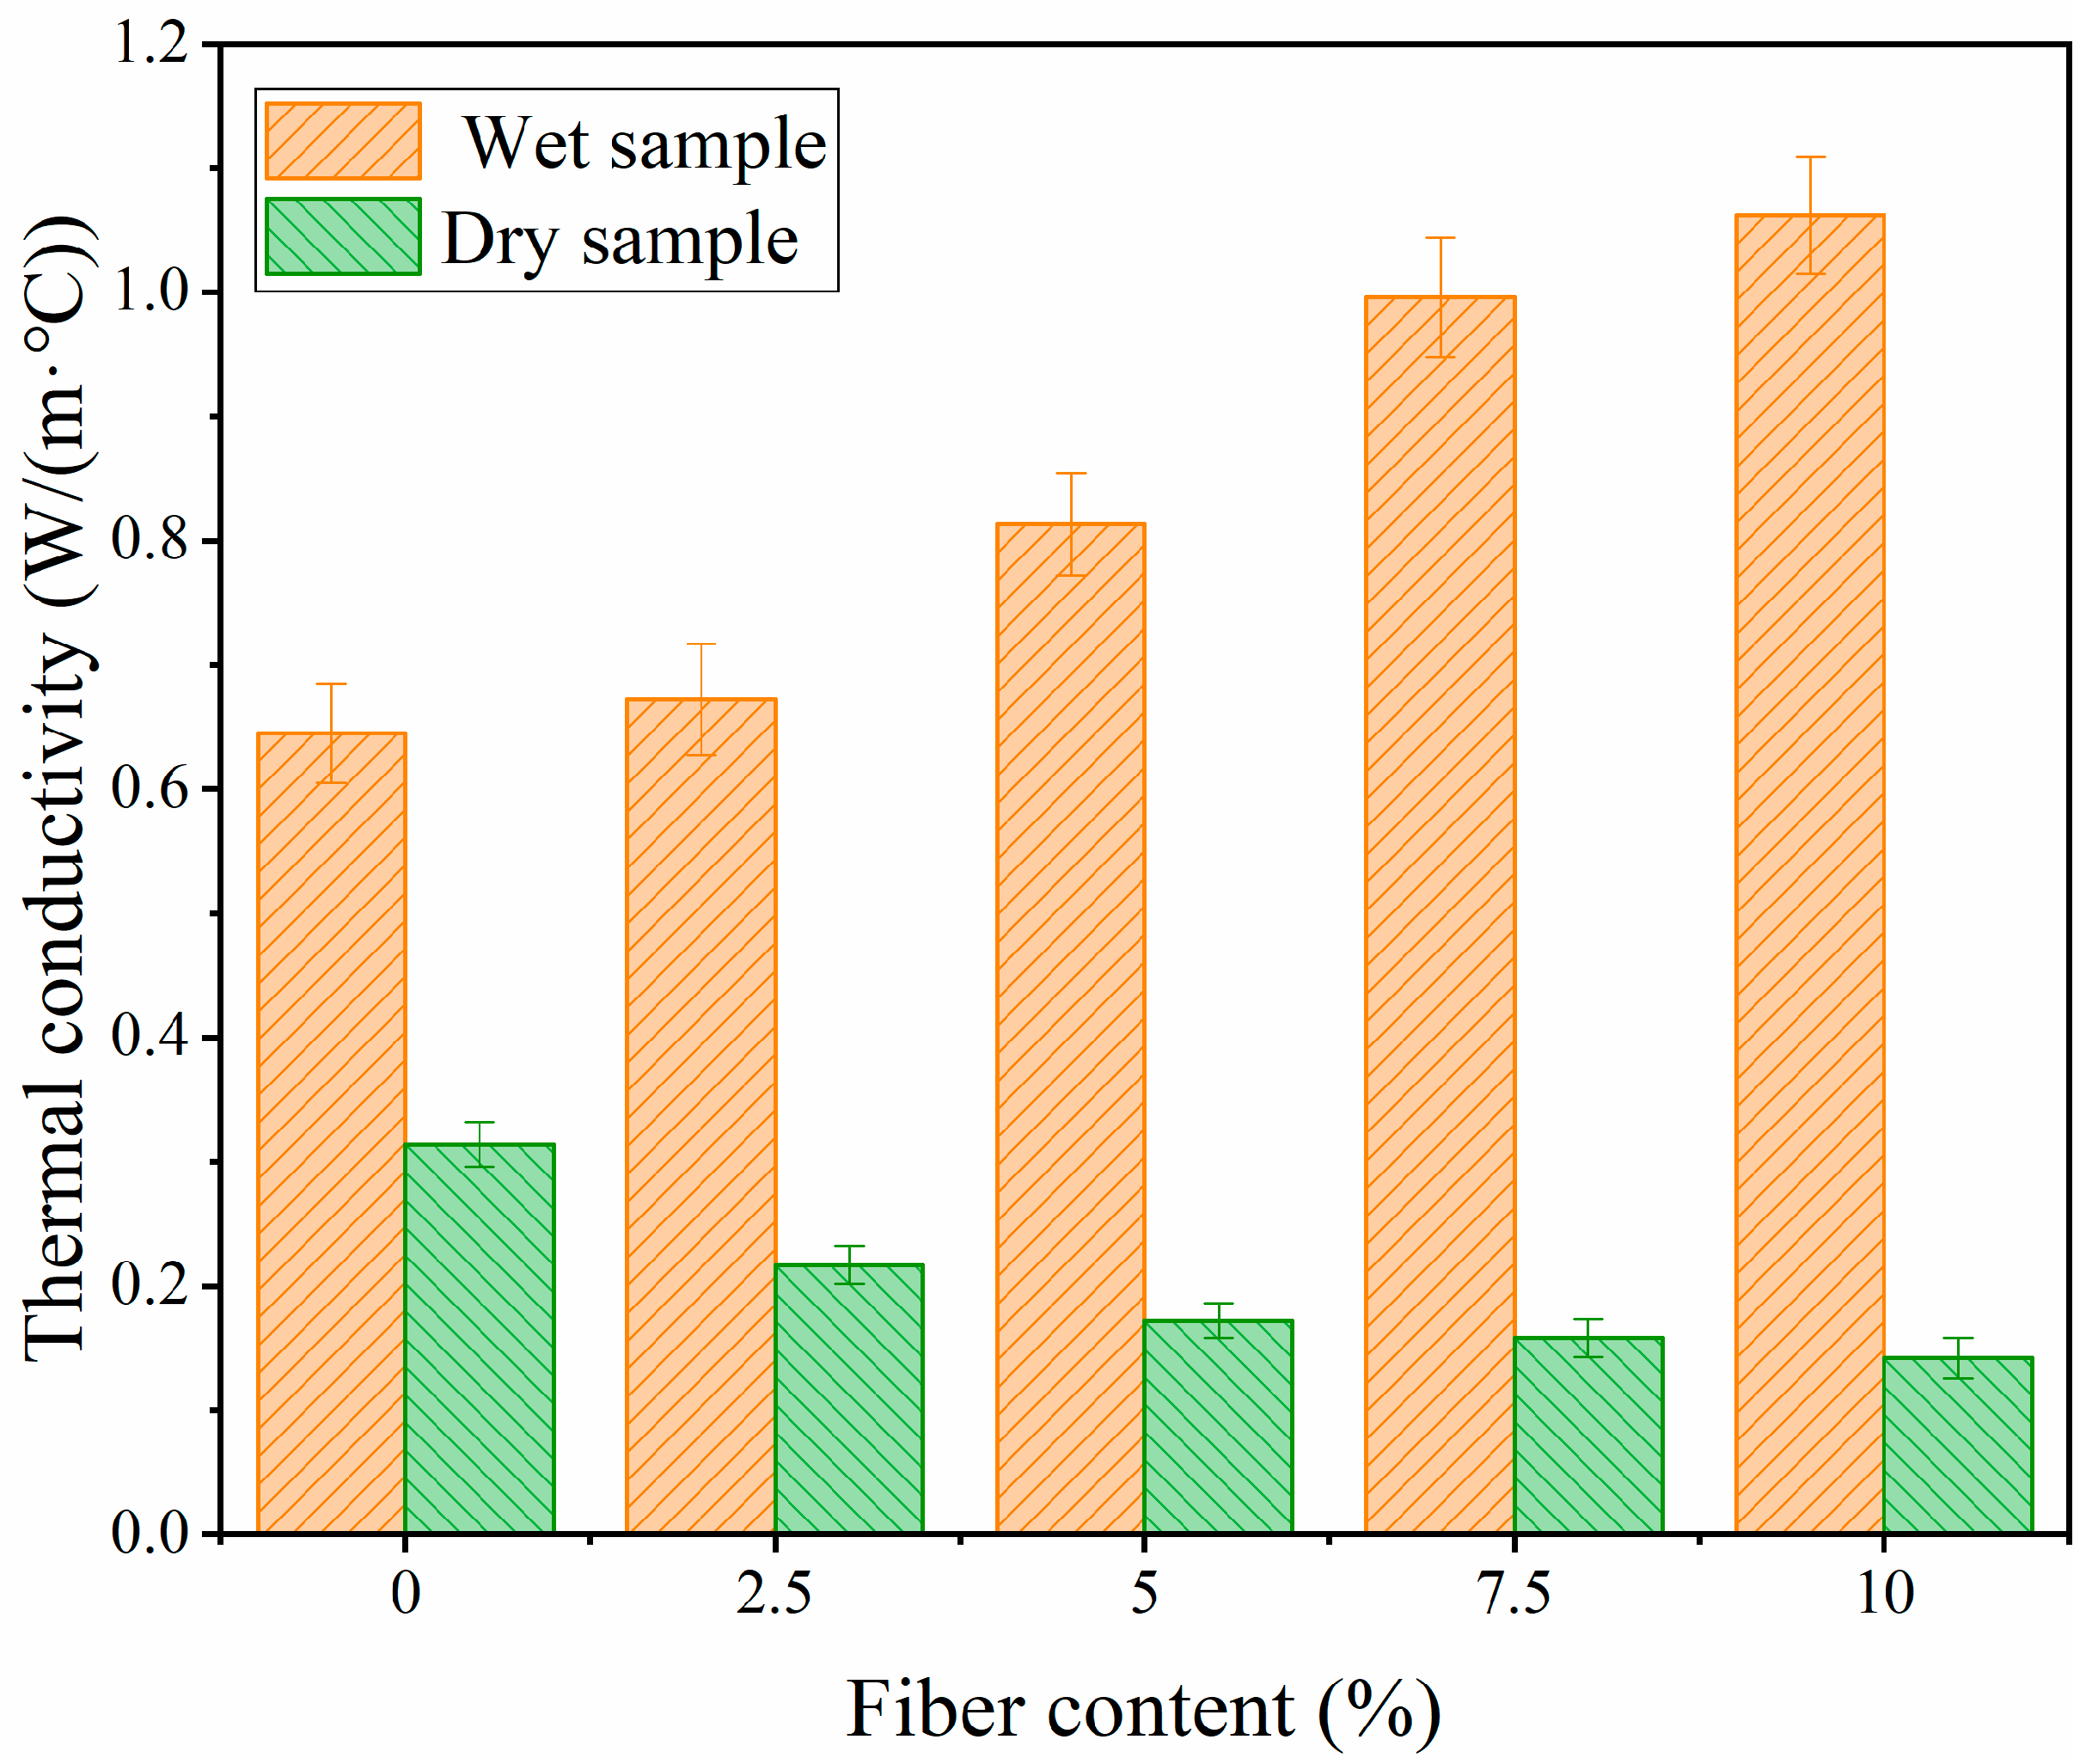
3.2. Thermal Conductivity

Figure 4 shows the thermal coefficient of concrete at room temperature. We observed that the thermal coefficient of fiber concrete in the moist condition was greater than that in the drying condition. During the natural drying process, the moisture content of the concrete gradually decreased. The moisture content on day 3 was greater than the moisture content after drying on day 28. Under normal pressure and temperature, the liquid water’s thermal coefficient was about 0.6 W/(m·°C), which had good heat transfer performance. In the early stages of fiber concrete forming (3d), the higher moisture content affects the insulation properties. For moist concrete, the thermal conductivity increased with increasing fiber content. The thermal conductivity ranged from 0.645 W/(m·k) for the control sample to 1.062 W/(m·k) for the 10% fiber sample. The addition of 10% fibers increased the thermal conductivity of the wet concrete by about 39.2%. Therefore, improving the water and moisture resistance of the concrete-based insulation materials was necessary.
Figure 4 also shows that the thermal conductivity of dry concrete decreased as the percentage of fibers increased. For dry concrete, it ranged from 0.314 W/(m·k) for the control sample to 0.142 W/(m·k) for the 10% fiber sample. The addition of 10% fibers increased the thermal insulation of the concrete by about 54.7%. The first reason for the improved thermal insulation of the concrete is the natural ability of the tiny hollow structure of plant fibers to resist heat flow [25,26]. During the curing of the fiber and the matrix, tiny voids were formed at the union of the fiber and the matrix. The interior of the void inside and around the fiber was filled with air, which has a very low thermal conductivity. Tiny voids can reduce the thermal conductivity of the material. Secondly, the straw fiber itself has a relatively low thermal conductivity, which is smaller than that of most of the raw materials. Only the thermal conductivity of glass beads and ceramic pellets is smaller than that of straw. Adding materials with small thermal conductivity will reduce the overall thermal conductivity of the concrete. The aggregate type significantly affects the thermal conductivity of the concrete [27].

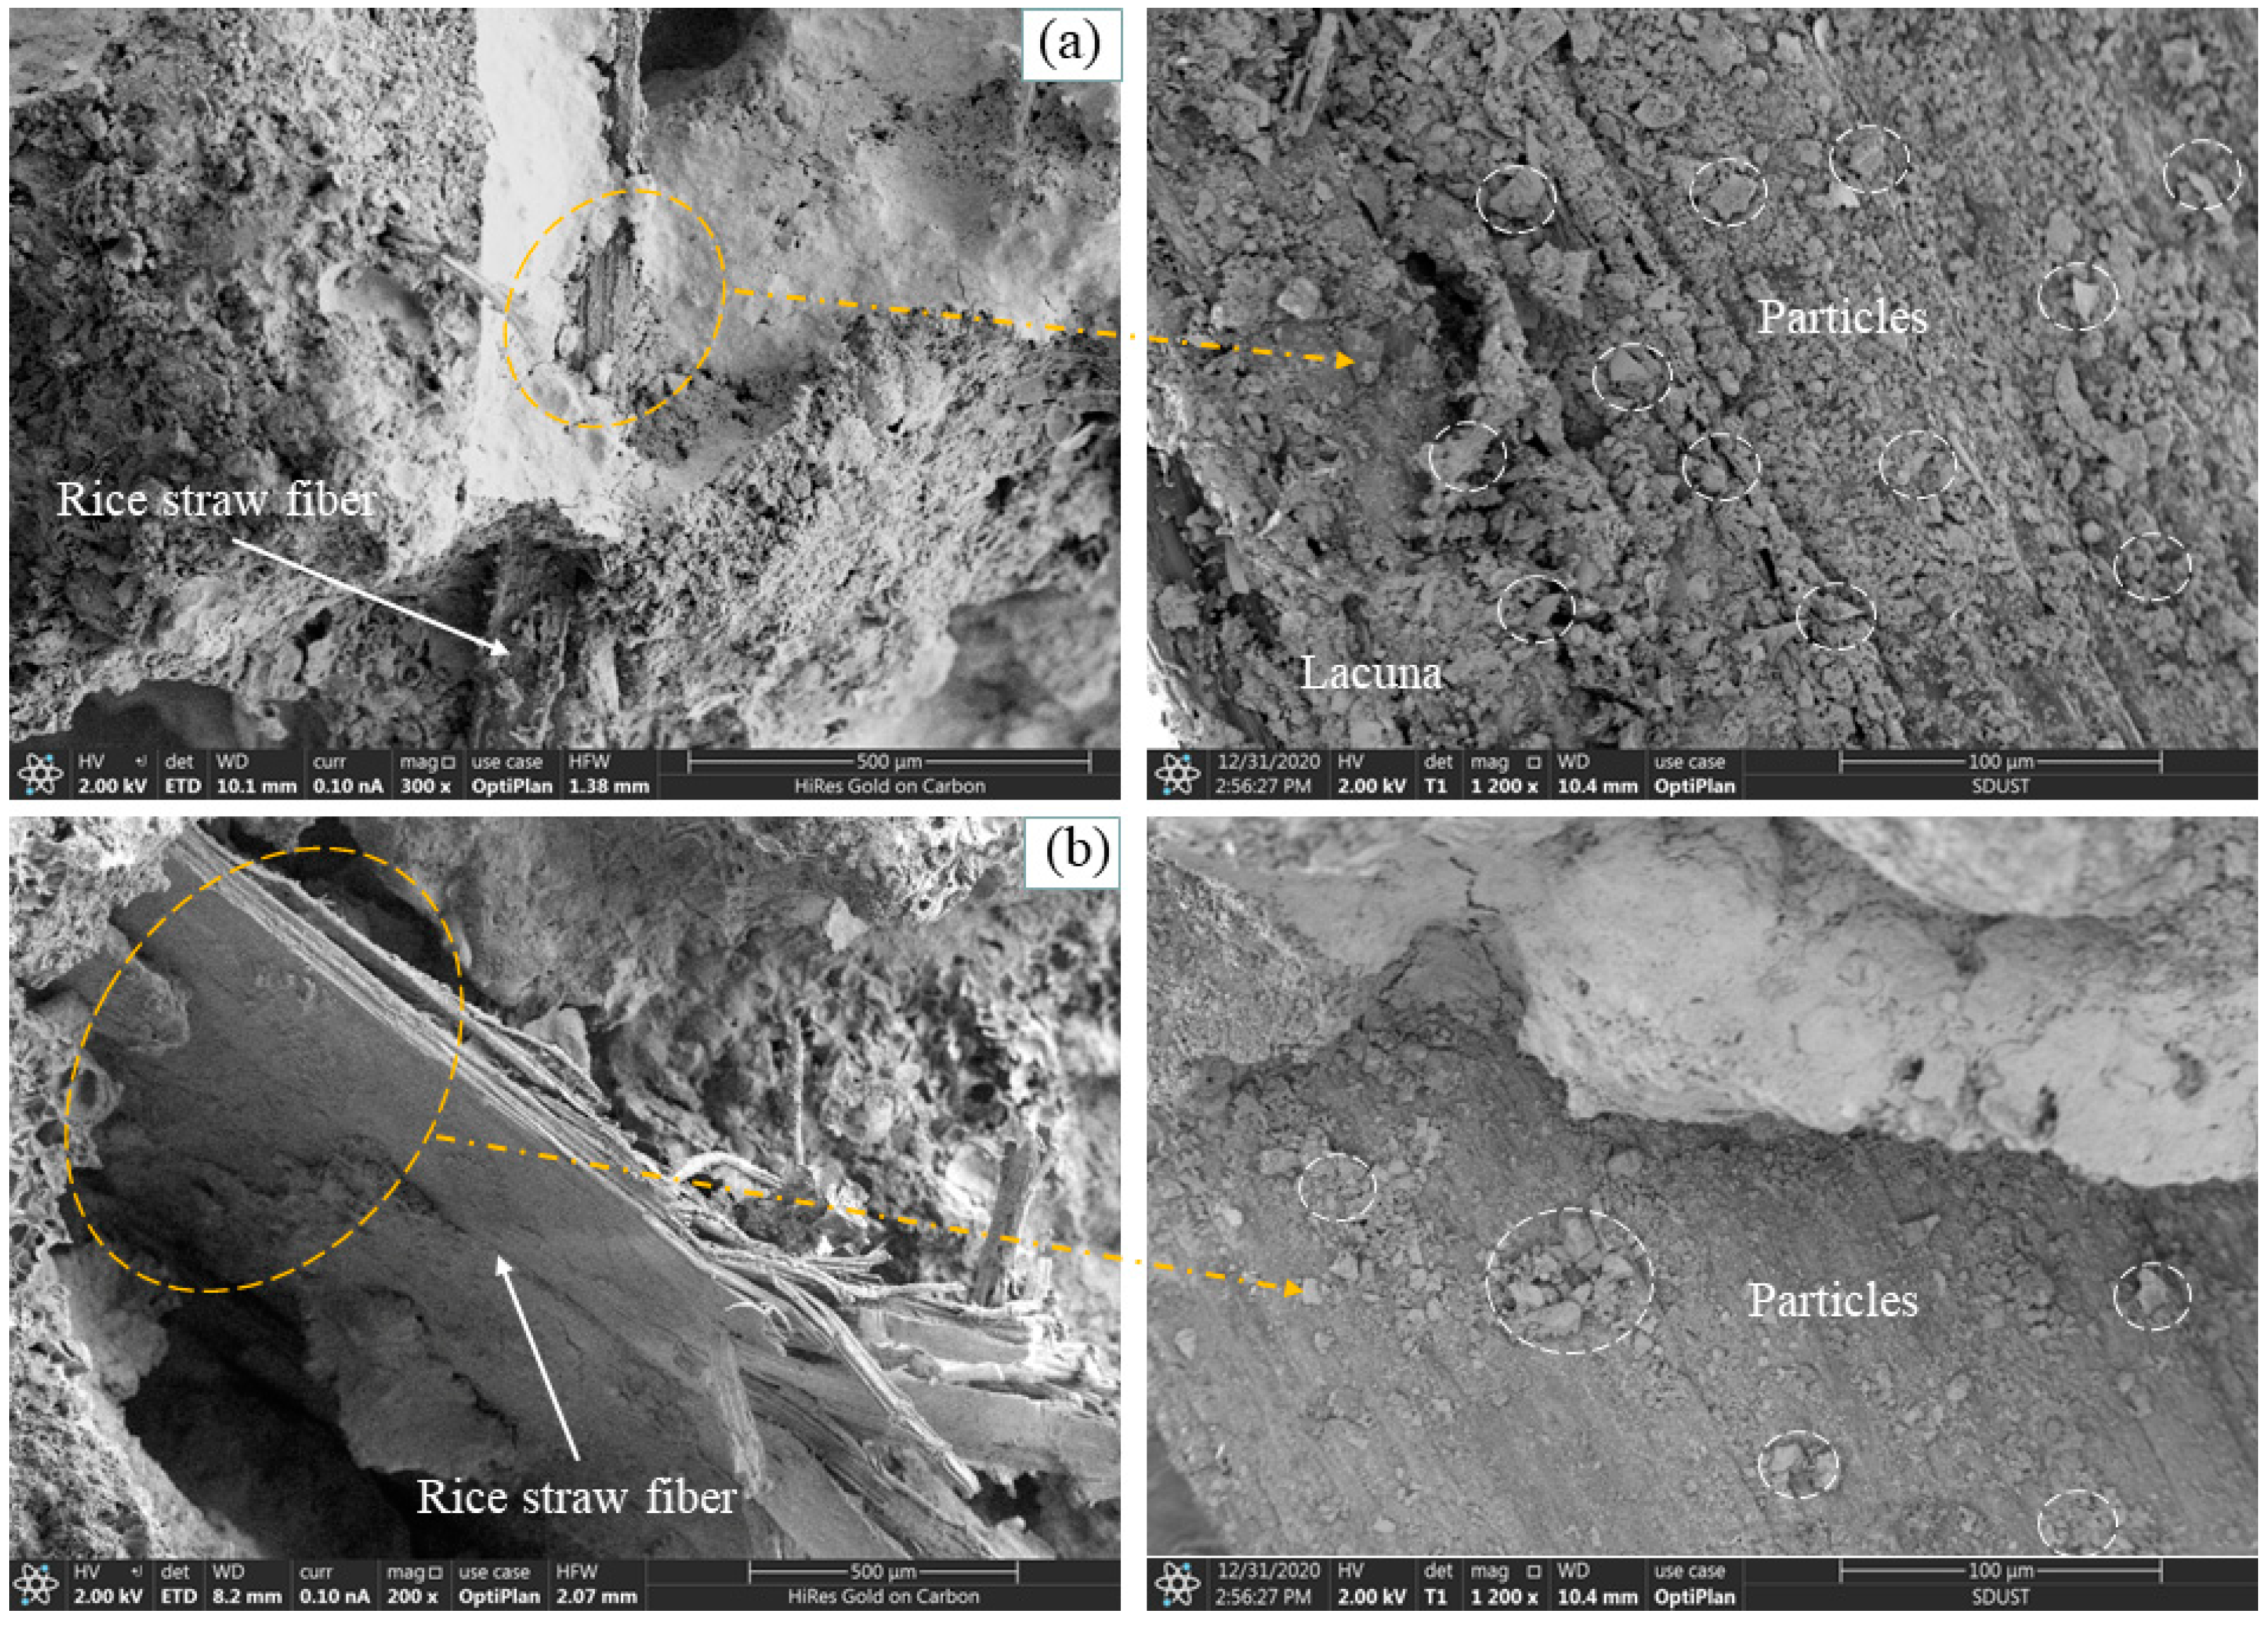
3.3. SEM Micrographs

Figure 5a shows SEM images of the fiber matrix-bonded interface and fiber surface collected from a concrete sample with low fiber content (2.5%) after compressive strength testing. The concrete matrix around the fibers was filled with ceramic particles and glassy microbeads. The glassy microbeads had been mostly destroyed and were hollow inside with high porosity. After the sample was disrupted, part of the fiber remained in the matrix, and the other part was detached from the matrix. The part of the fiber that remained in the matrix was firmly embedded in the matrix, and the fiber was highly bonded to the other raw materials. The part of the fiber that was detached from the matrix was very rough and could be observed from further magnified microscopic images. There was no bare surface of the fiber, and a thick layer of gelling material covered the surface of the fiber; there were dense sand particles on the surface of the gelling material. The fibers had a high degree of bonding with the matrix and could act as a bond for stress transfer, thus enhancing the strength of the concrete.
Figure 5b shows the SEM images of the fiber matrix bonding interface and the fiber surface collected from the concrete sample with 10% fiber content. The fiber matrix bonding was relatively poor, with large voids between the fibers and the matrix, and the fibers exposed outside the matrix were relatively smooth. It was observed from the magnified image of the fiber surface that the gelling material on the fiber surface was not uniformly distributed, and the gel material was relatively thin, with only a small amount of sand particles attached to the gelling material. The amount of gelling material added to the fiber concrete samples with 10% and 2% fiber content was the same. More fibers were added to the sample with 10% fiber content and less gelling material on the fiber surface, thus resulting in poorer fiber matrix bonding.

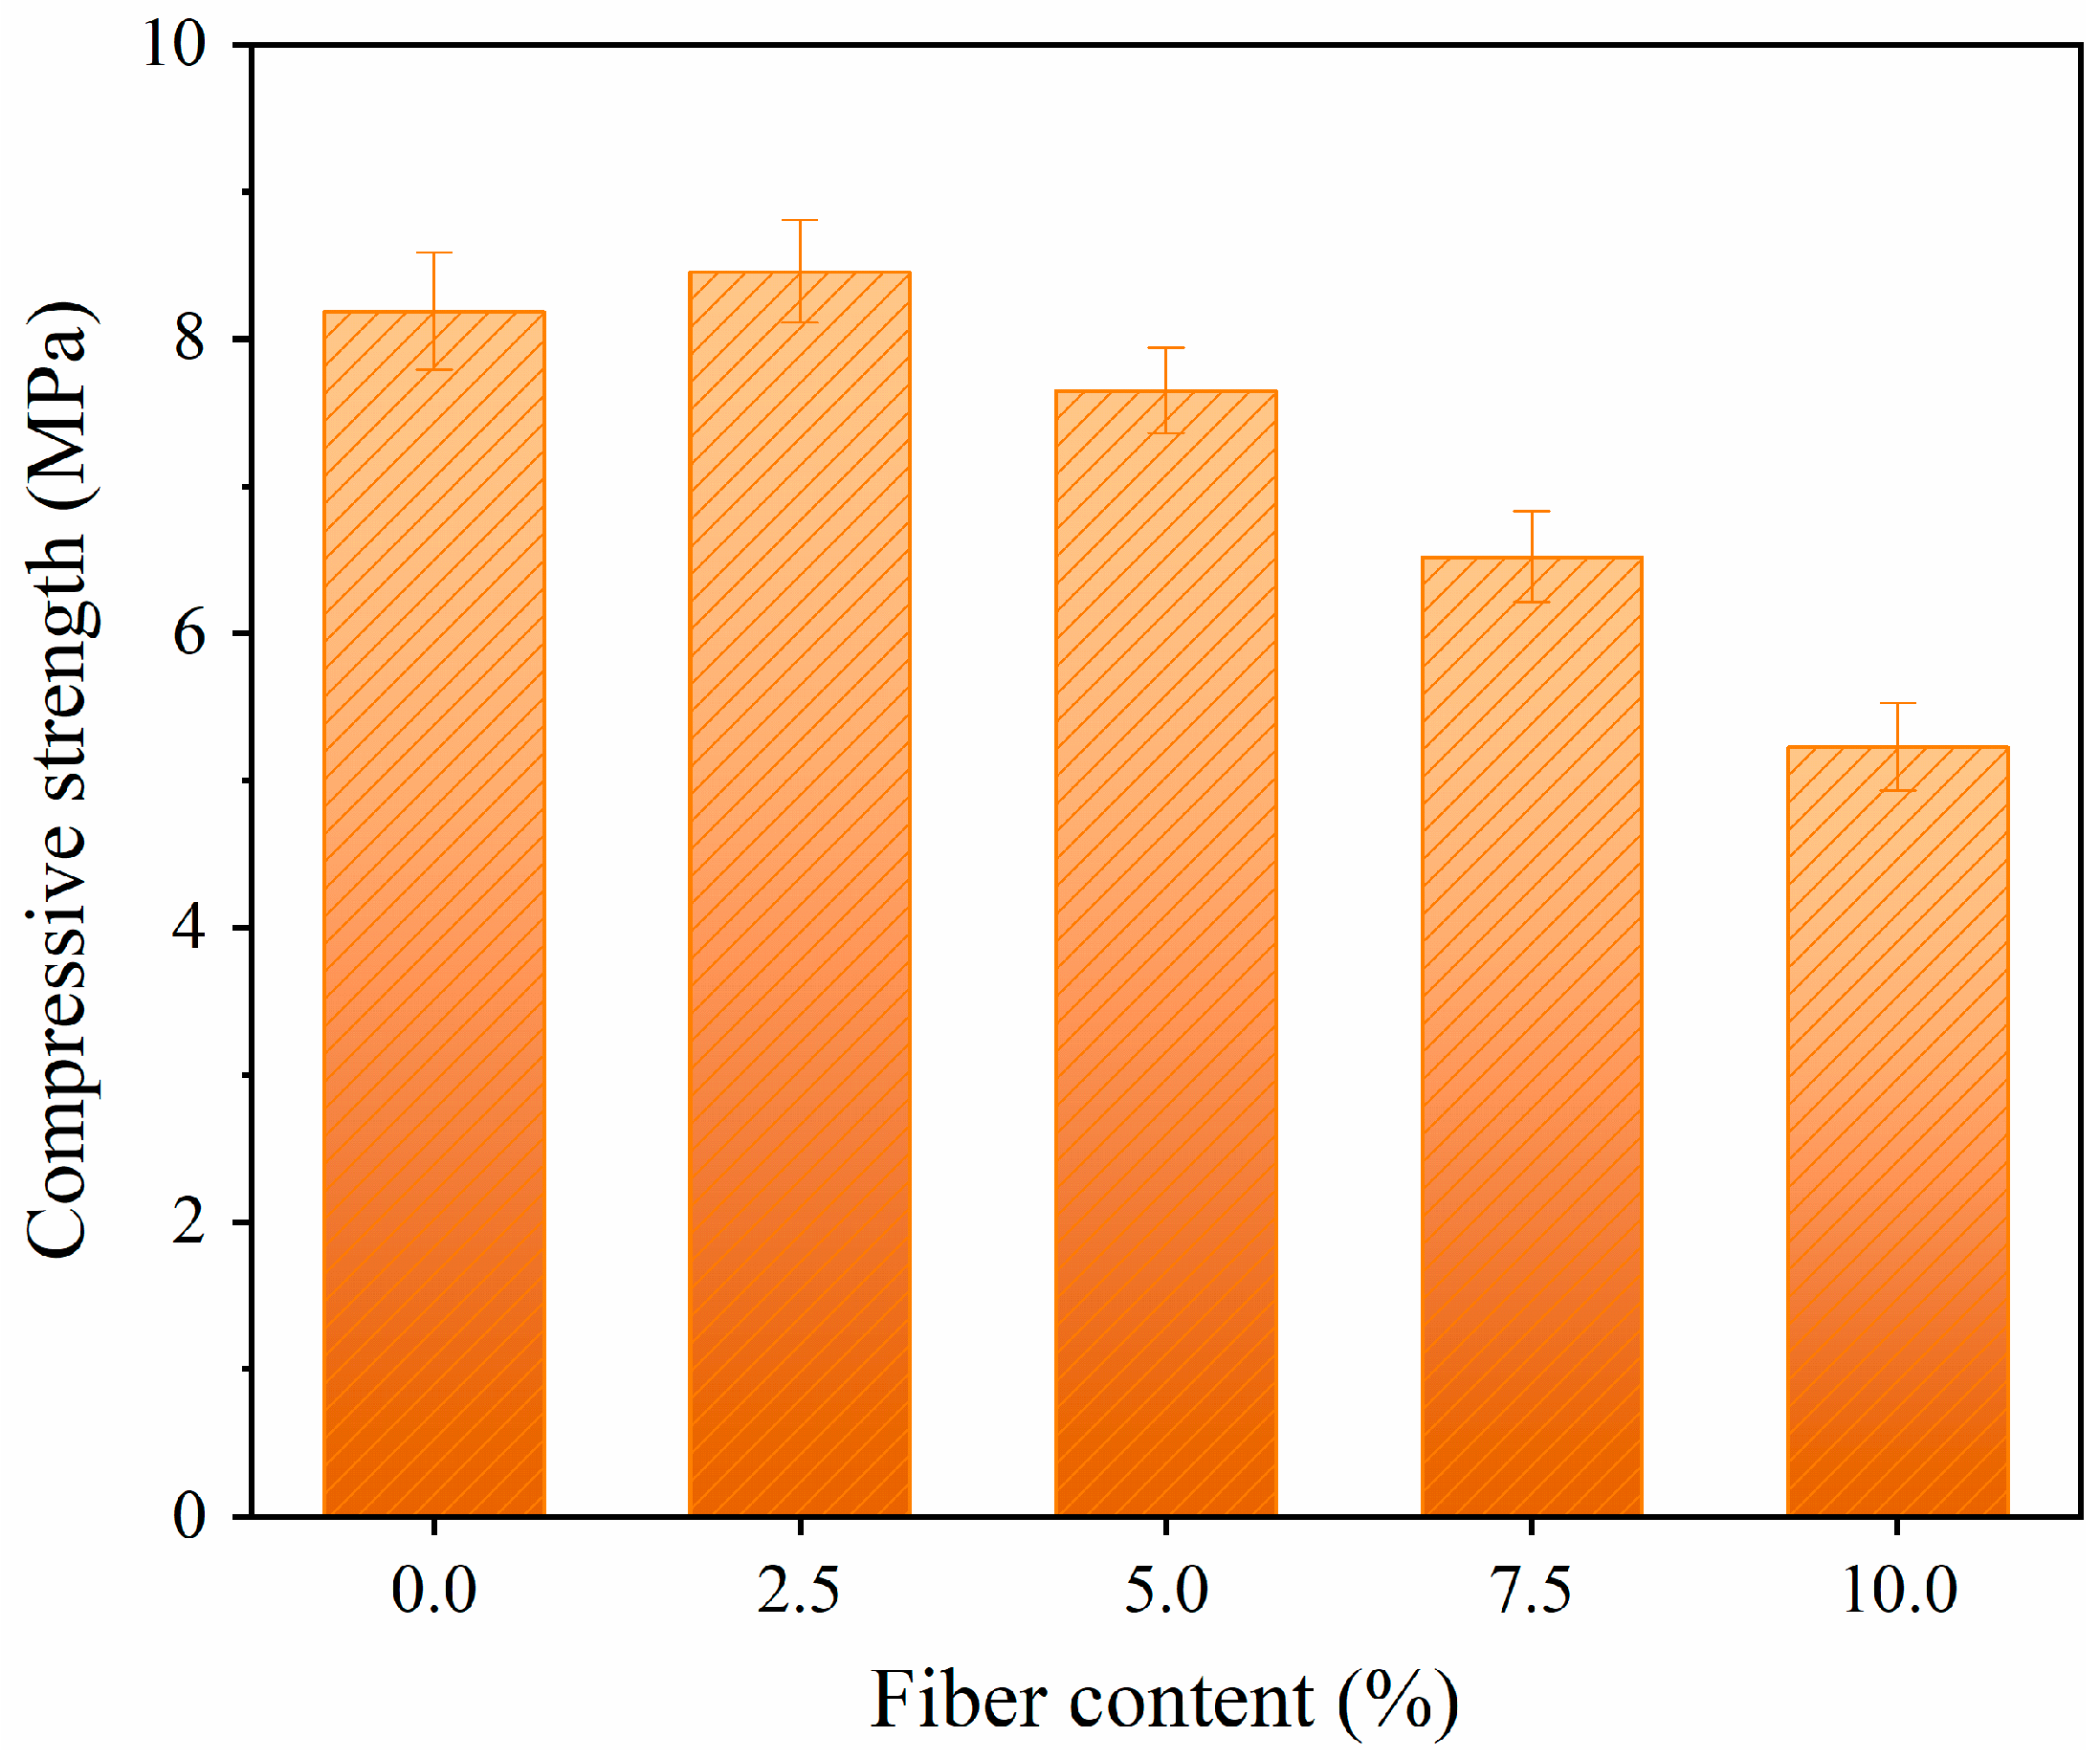
3.4. Compressive Strength
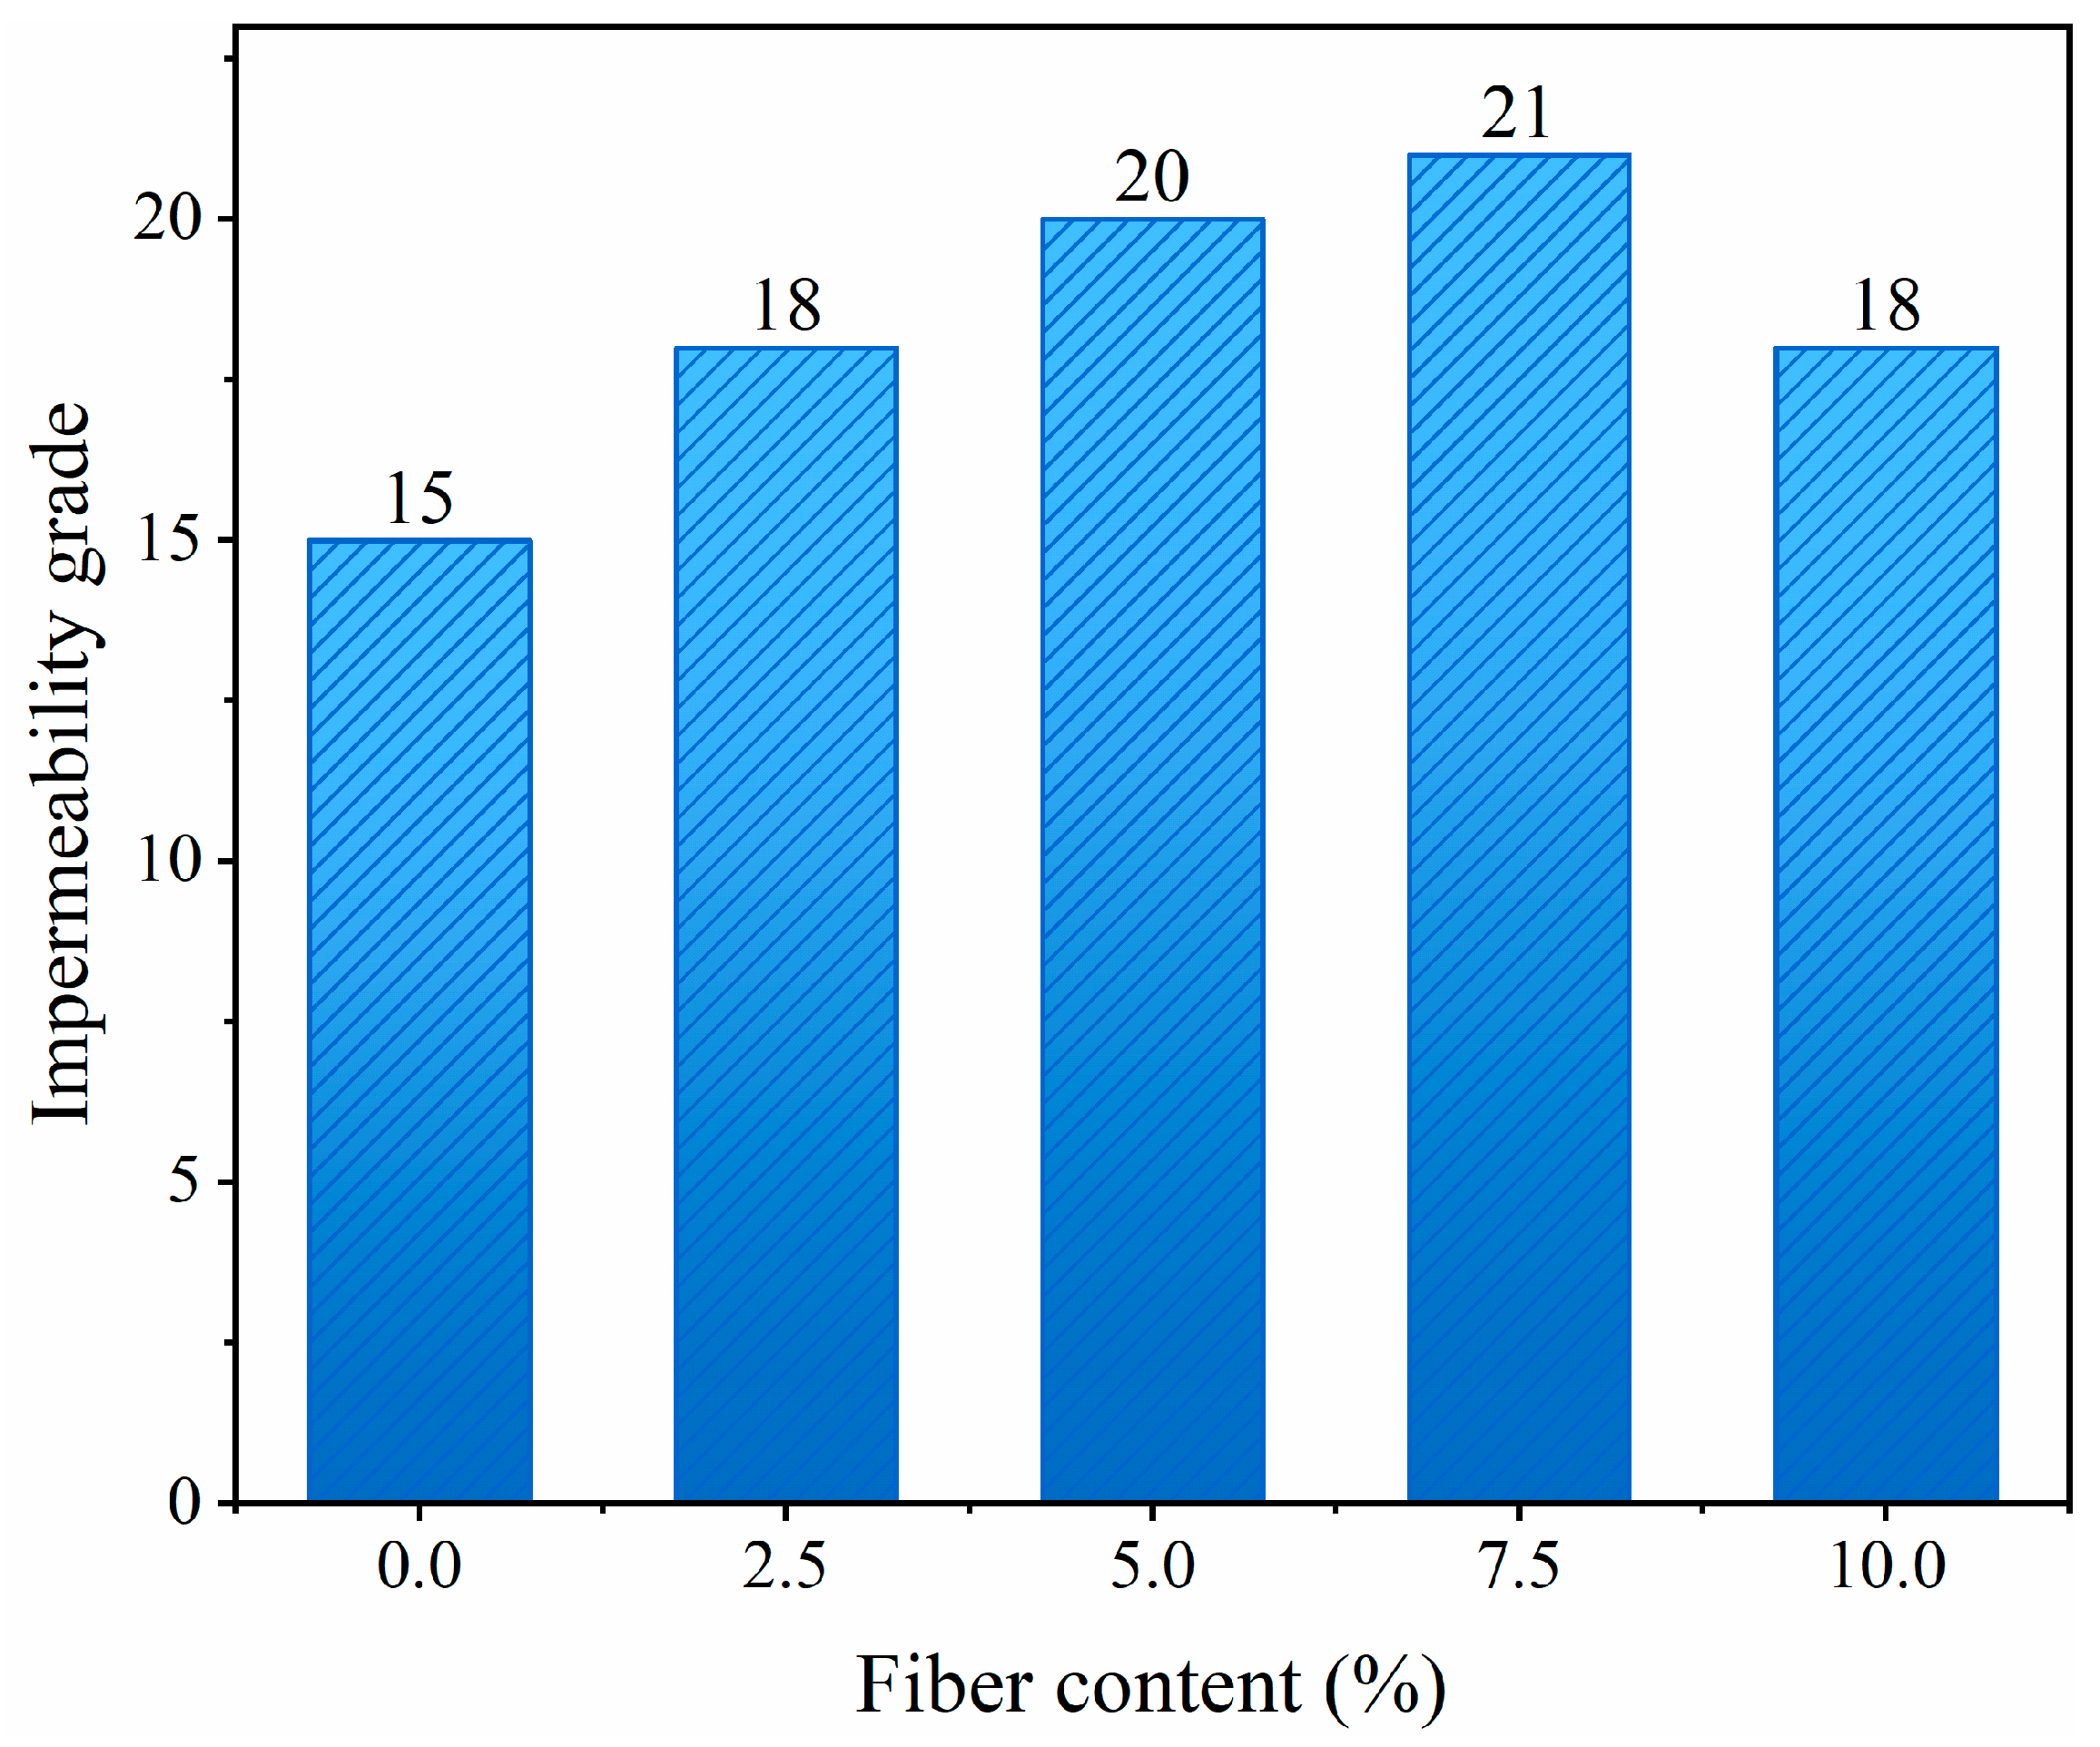
Figure 6 shows the compressive strength of the concrete with different fiber contents. We observed that the compressive strength decreased with increasing fiber content. Only with the addition of 2.5% fiber content was the compressive strength of the concrete improved. The compressive strength of concrete with 5%, 7.5%, and 10% fiber content was weakened by 6.6%, 20.4%, and 36.1%, respectively. If the fibers are well bonded to the matrix, the tension can be transferred to the fibers. This requires that the fibers are well bonded to the gel material in the material. When the concrete is subjected to external forces, the fibers can connect the two ends of the tiny cracks and transmit the external forces down to produce more tiny cracks, thus slowing down the overall breakage of the concrete ring and enhancing the mechanical properties. The right amount of fiber is evenly mixed by the machine and spread in the concrete to form a three-dimensional chaotic network system in space. This system can gather other raw materials, resist the development of micro-cracks, and improve the integrity of the concrete. In order to effectively reduce the thermal conductivity of concrete, the maximum fiber admixture reached 10%. Incorporating fibers will inevitably increase the number of interfaces inside the concrete. They will increase the number of dense and tiny voids, and the increased voids will be mainly distributed between the fiber surface and the cement matrix. We observed this phenomenon in the SEM microscopic concrete images with 10% fiber content. According to MacVicara et al. [28], the increase in porosity in concrete due to adding fibers is the main factor responsible for the decrease in compressive strength. As has been observed by other researchers, the mechanical properties of the cement–plant fiber composite concrete depend mainly on the fiber content, fiber orientation, and the quality of load transfer between the fibers and the matrix [29].

3.5. Impermeability

The impermeability grade of the fiber concrete is shown in Figure 7. Figure 7 shows that the seepage resistance of the concrete was significantly better than that of the reference concrete. Concrete with a fiber content of 7.5% had the best permeability resistance, with an impermeability grade of 21. Glass beads are a porous material with low strength and high permeability. Concrete, after the introduction of fibers, increased the porosity. The voids in the concrete matrix tended to form seepage channels under higher water pressure, thus enhancing the permeability of the concrete. However, the randomly distributed straw fibers in the concrete can block the seepage channels.
Although the compressive strength of the 7.5% fiber content insulating concrete was slightly reduced, the thermal insulation performance in the dry state was improved by 49.6%, and it had very low thermal conductivity. The thermal conductivity was only (0.158 W/(m·k)). Moreover, the concrete with 7.5% fiber content had the best permeability resistance. Overall, the concrete with 7.5% fiber content had the best overall performance.

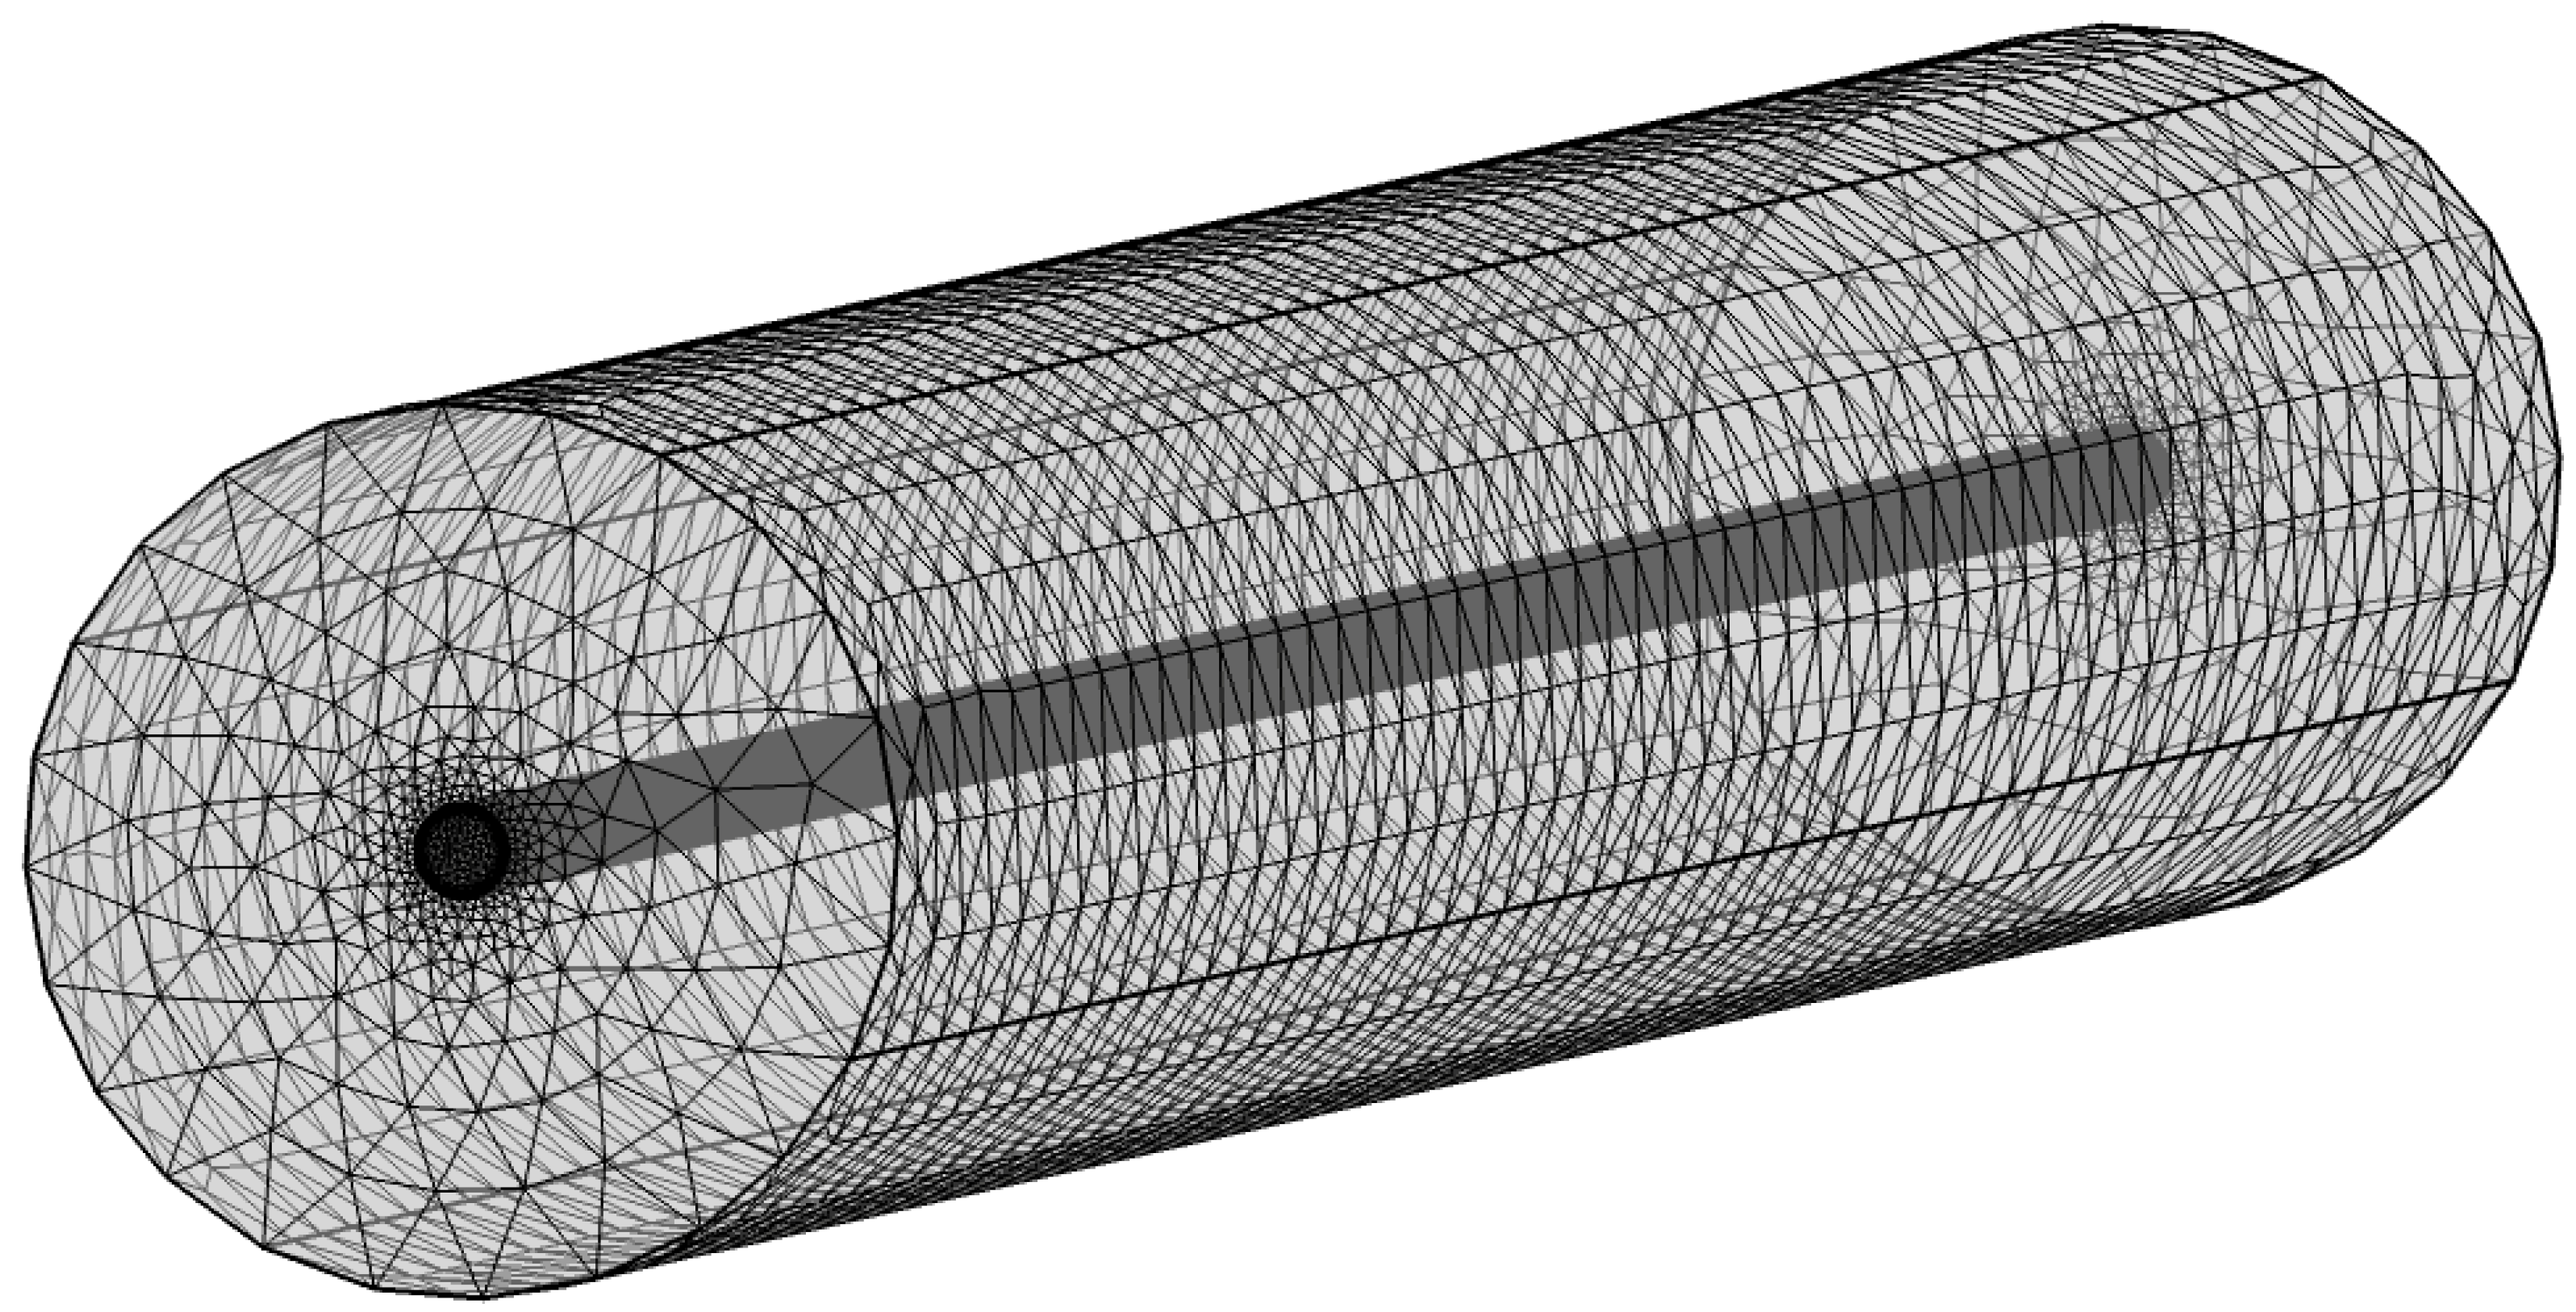
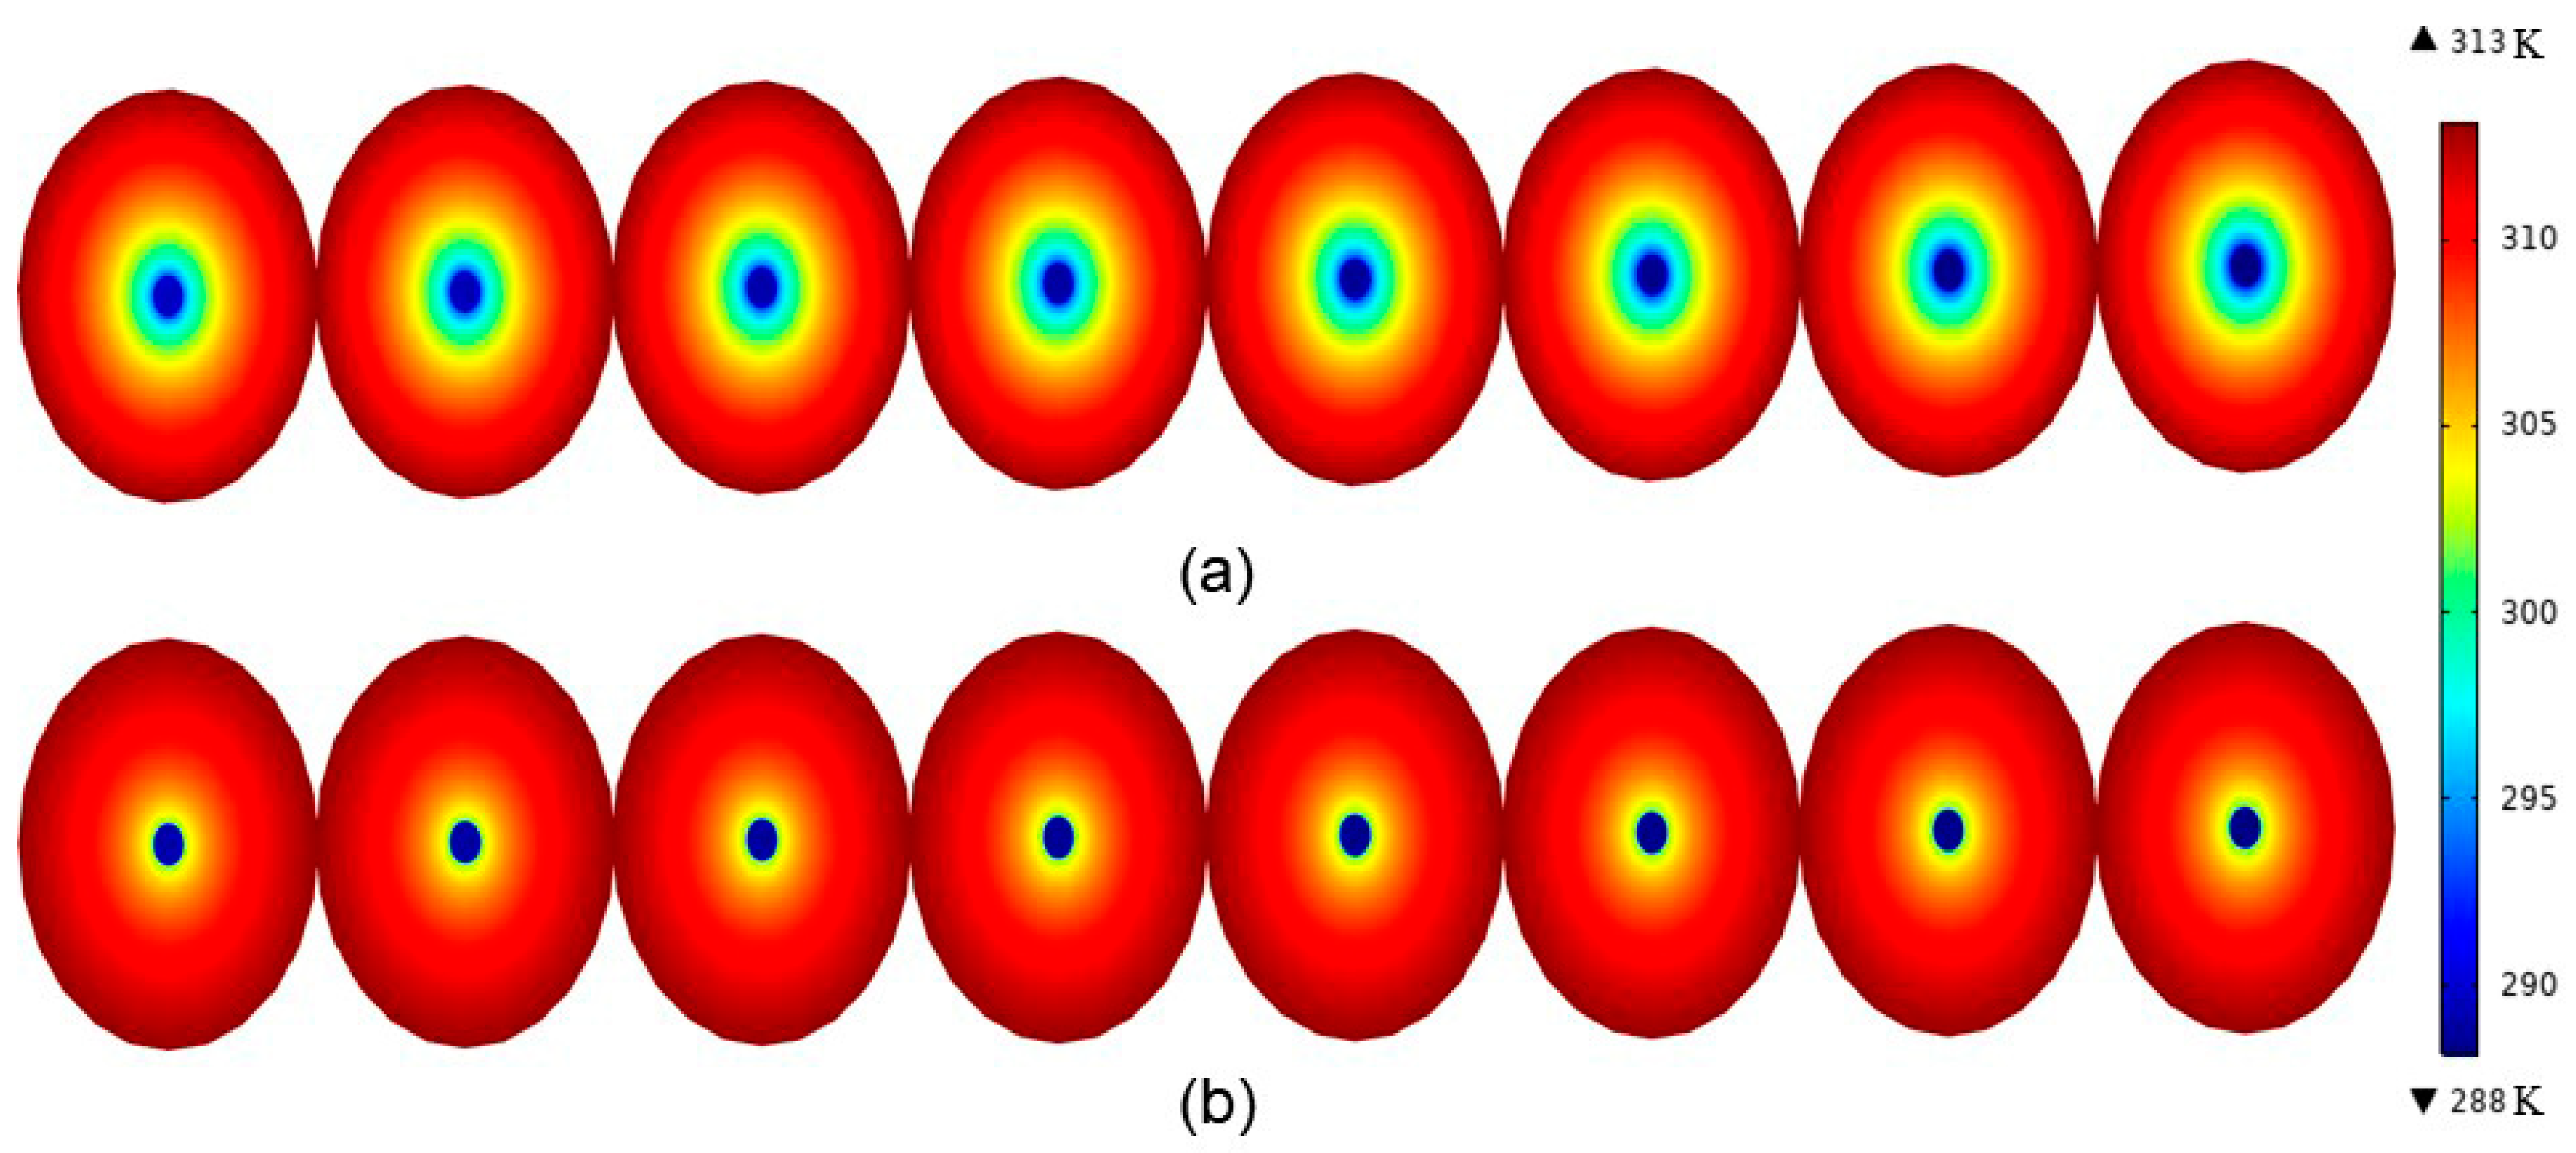
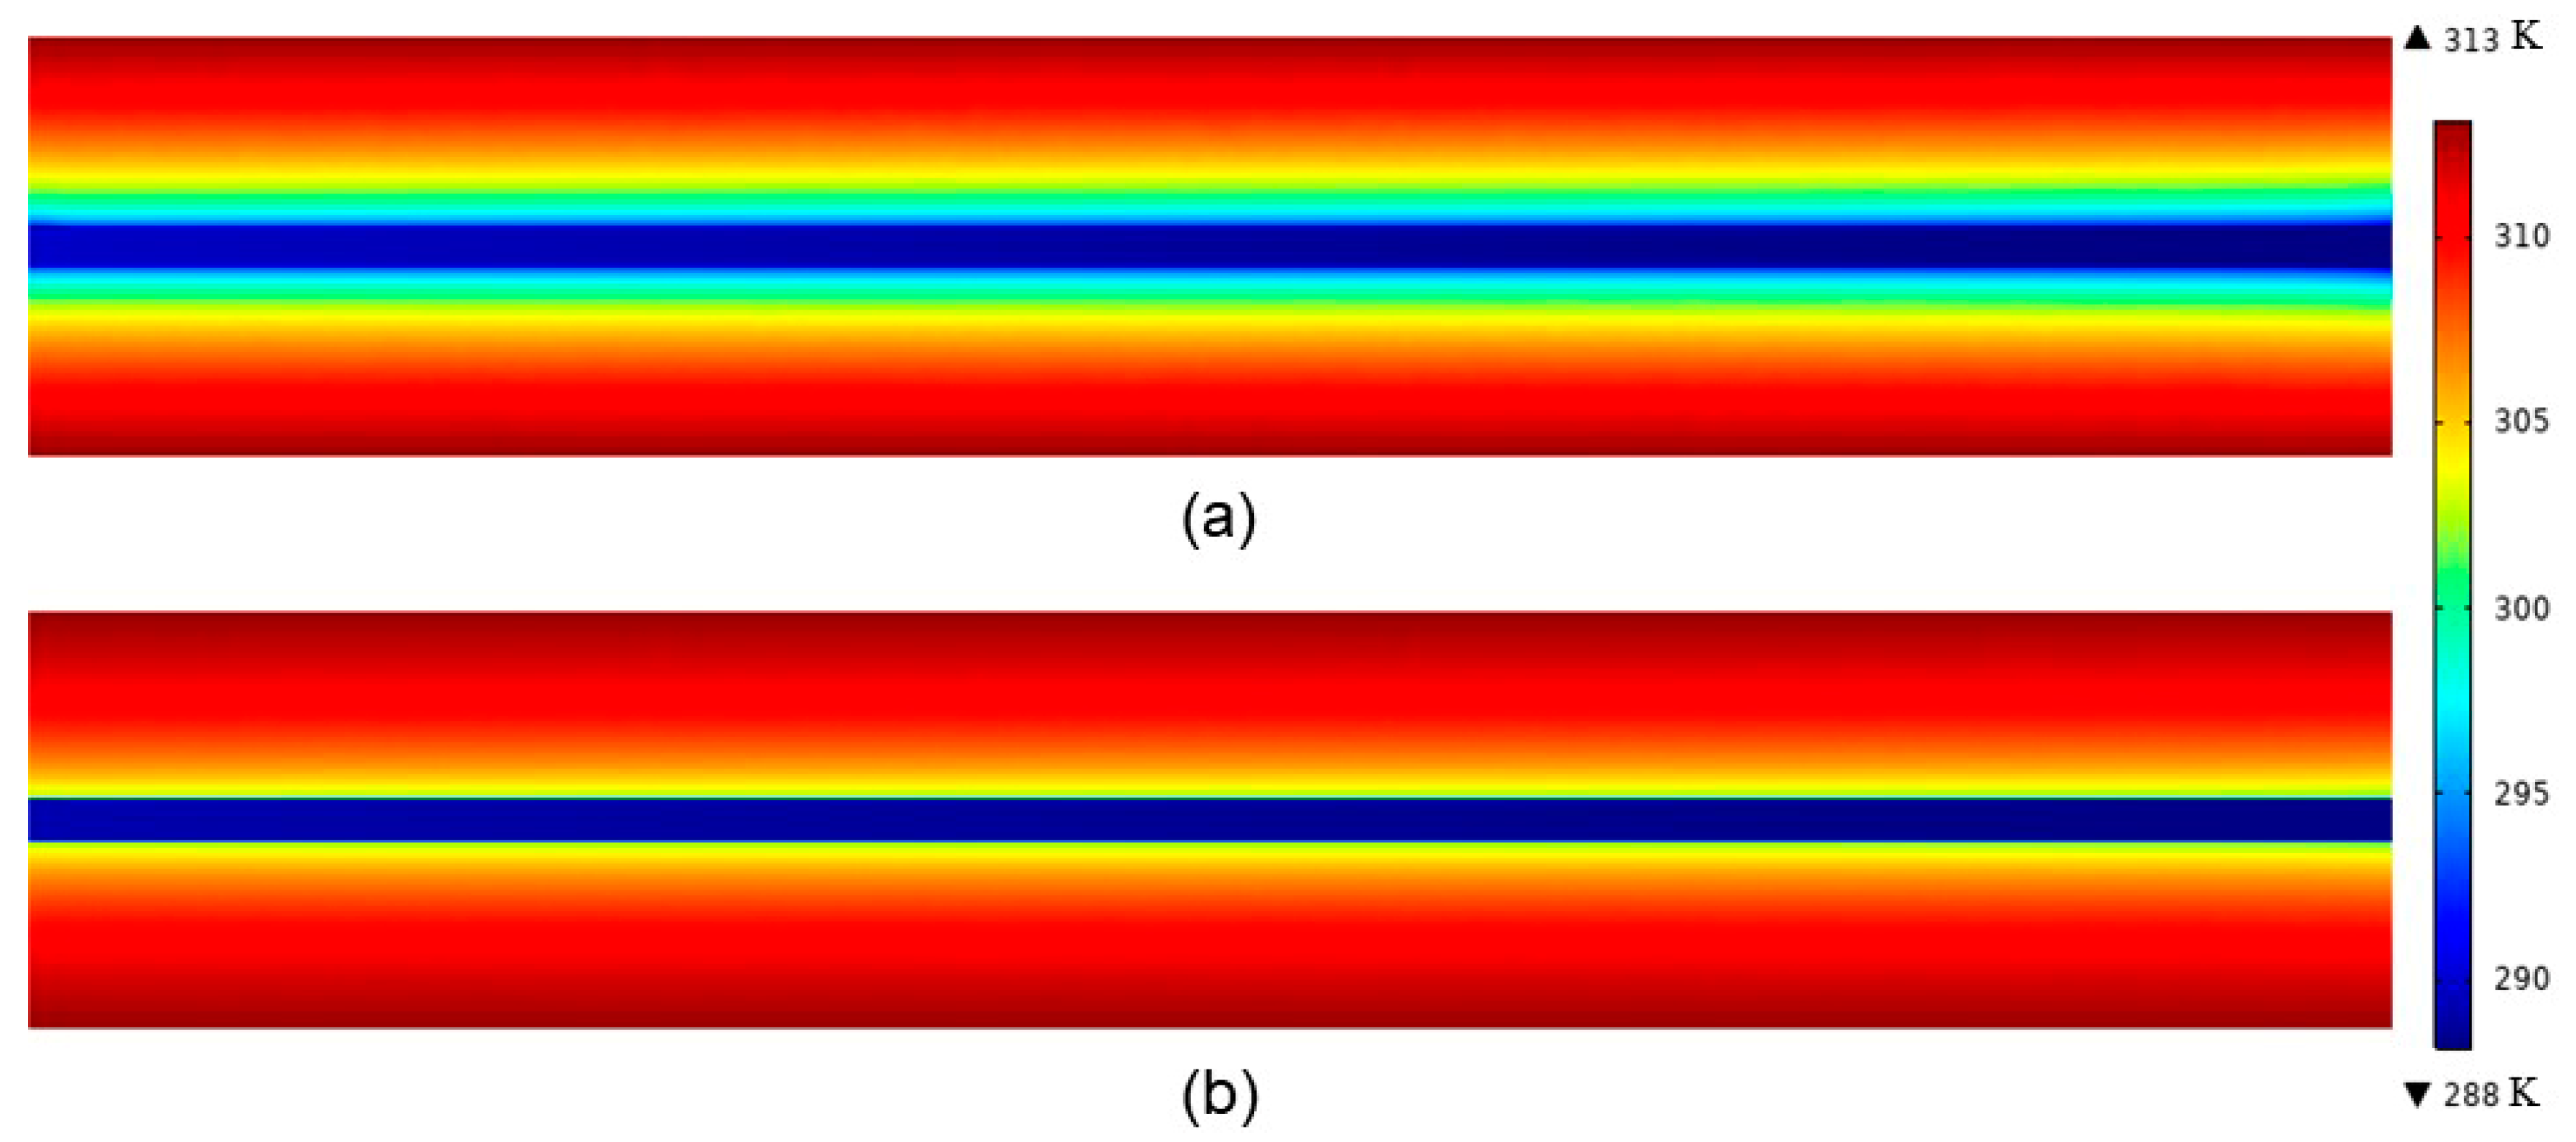
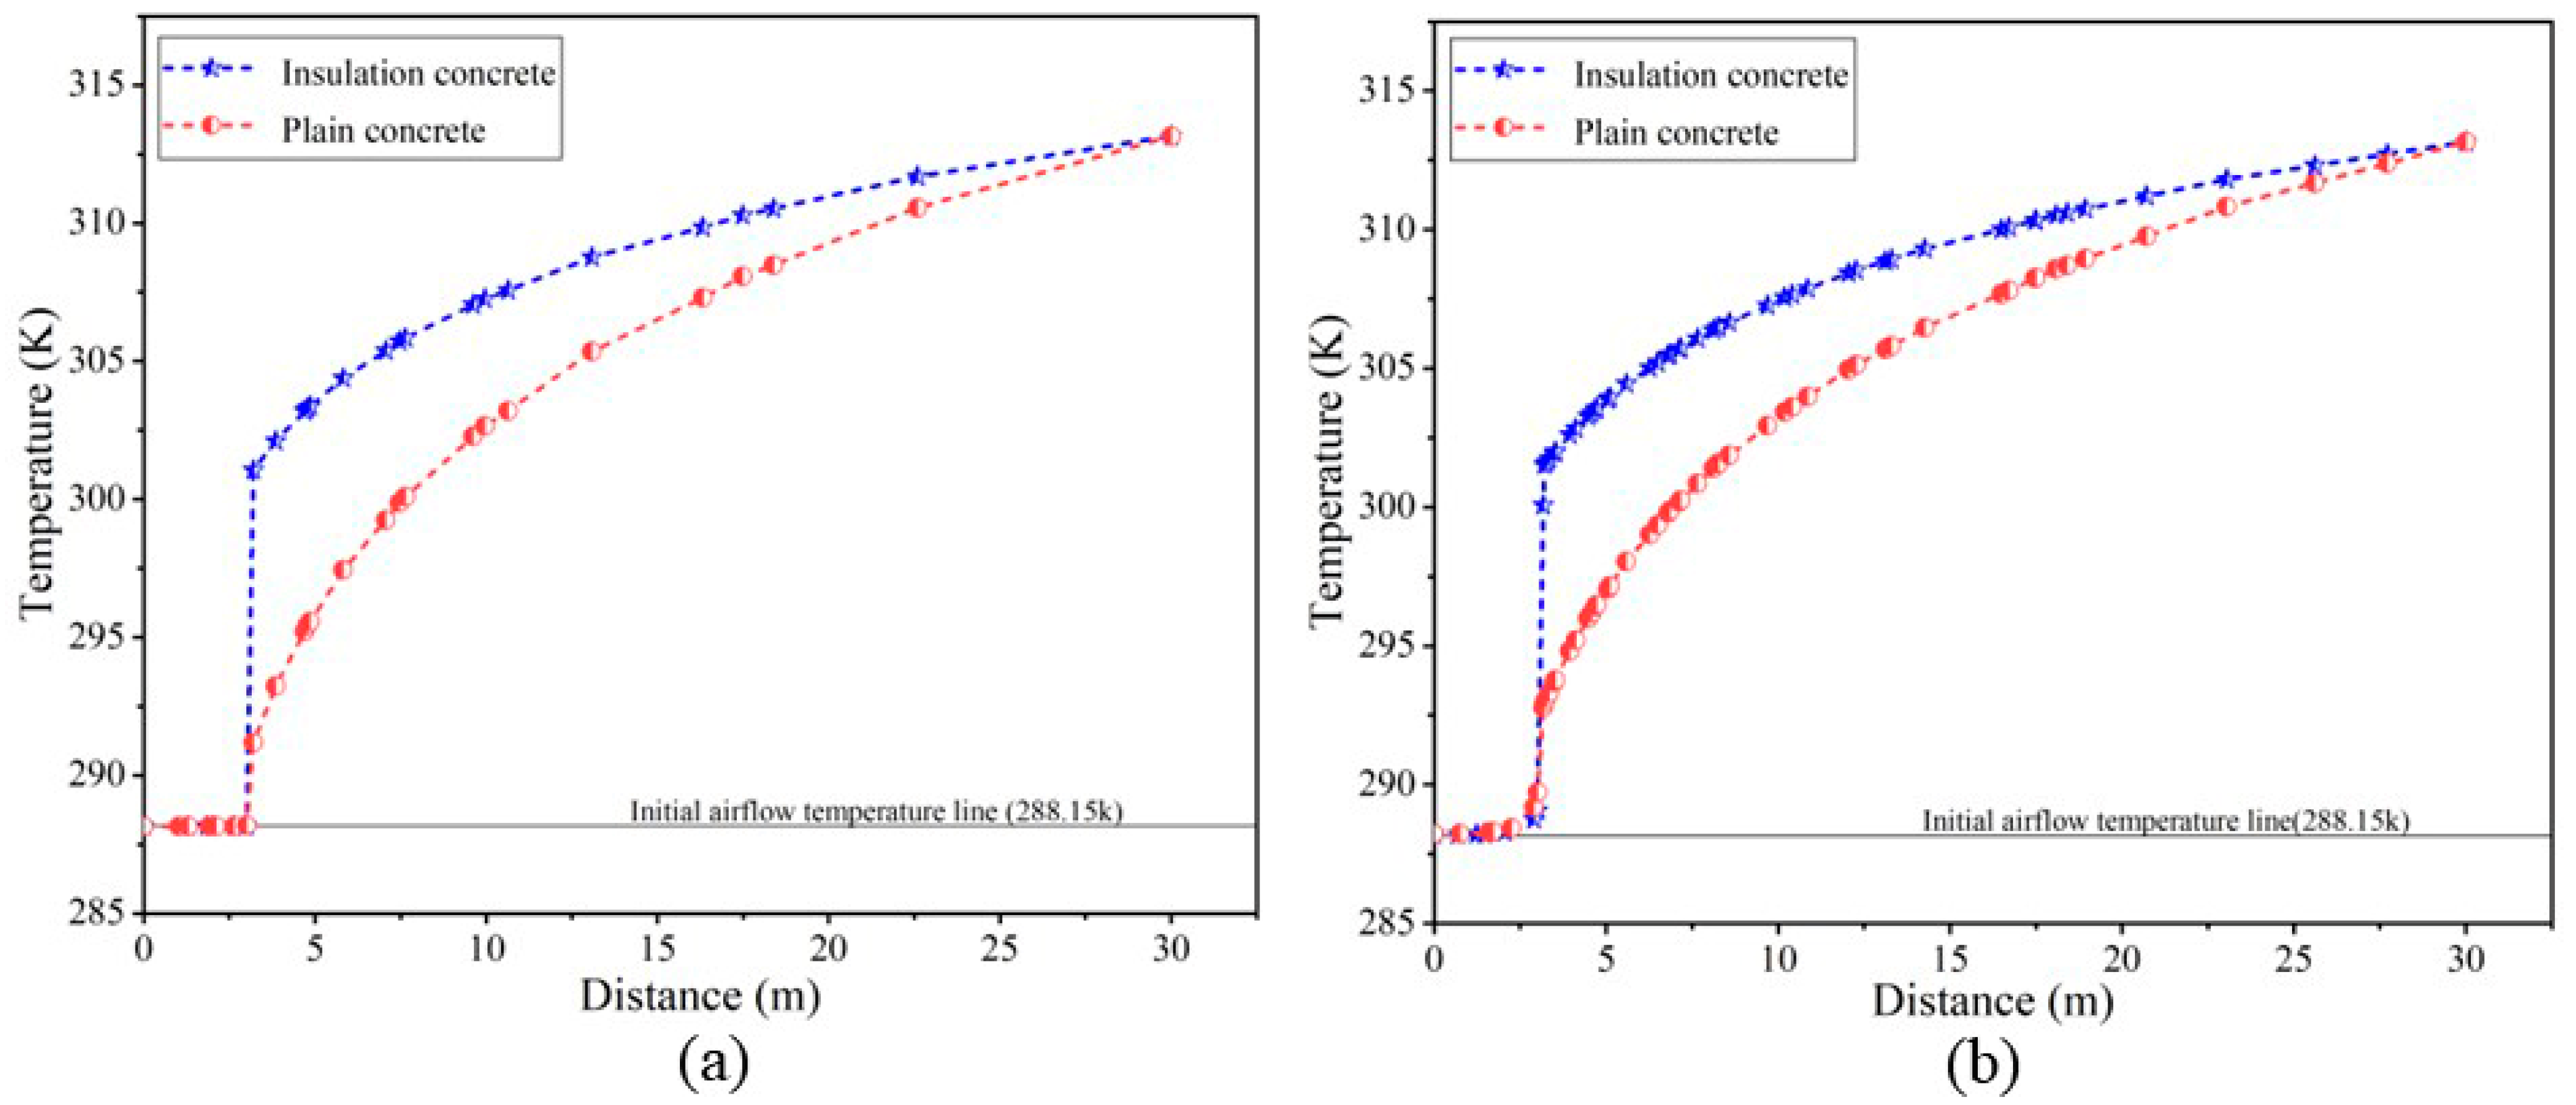
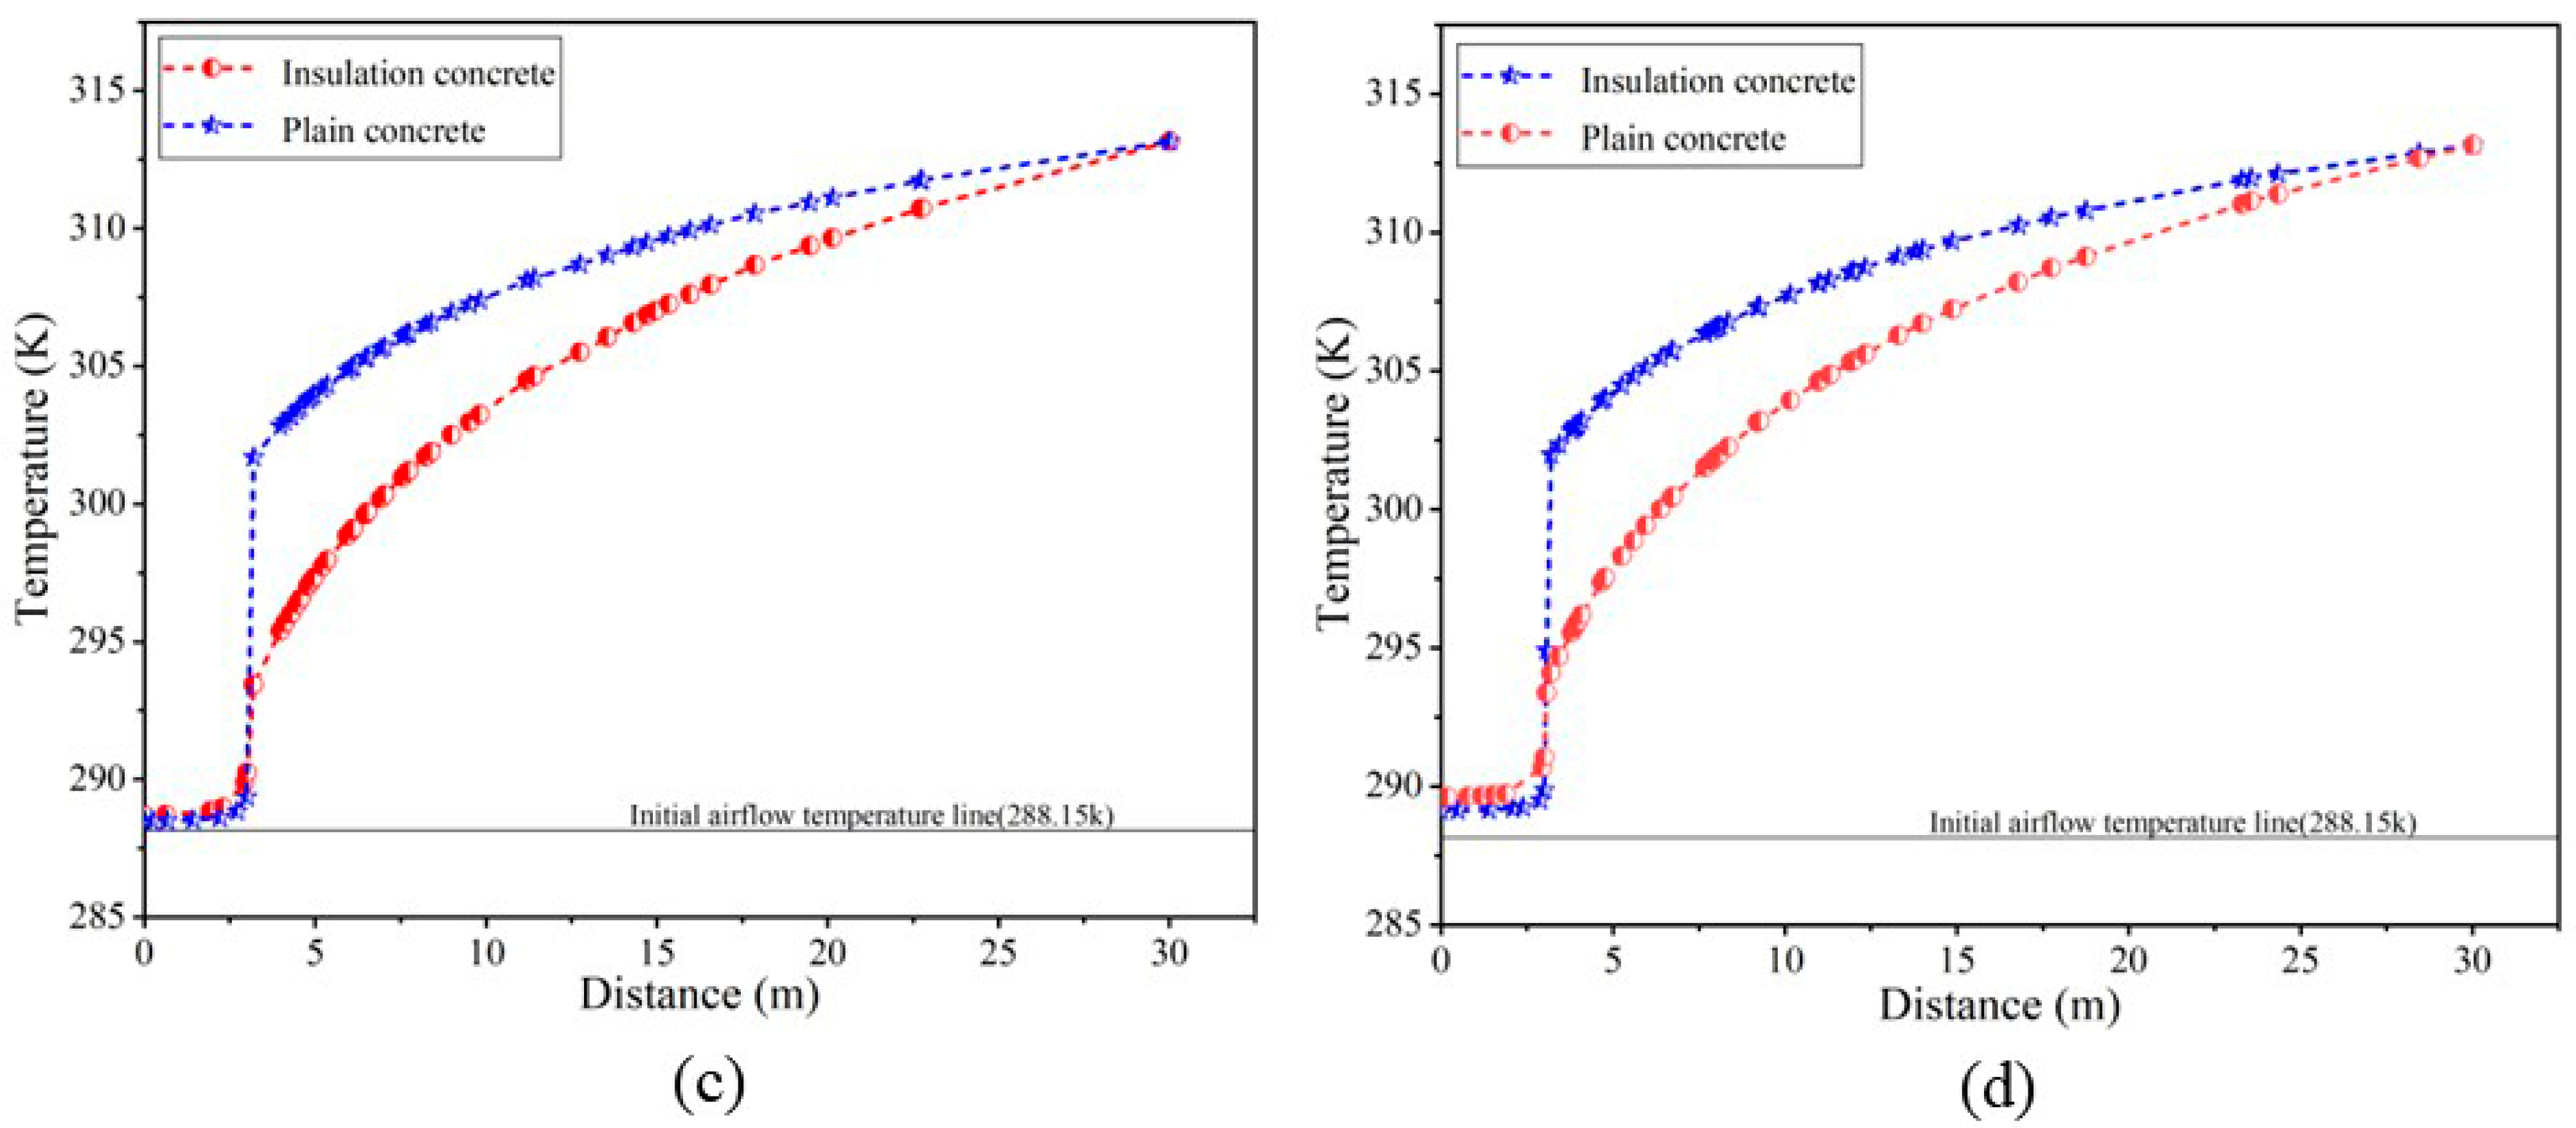
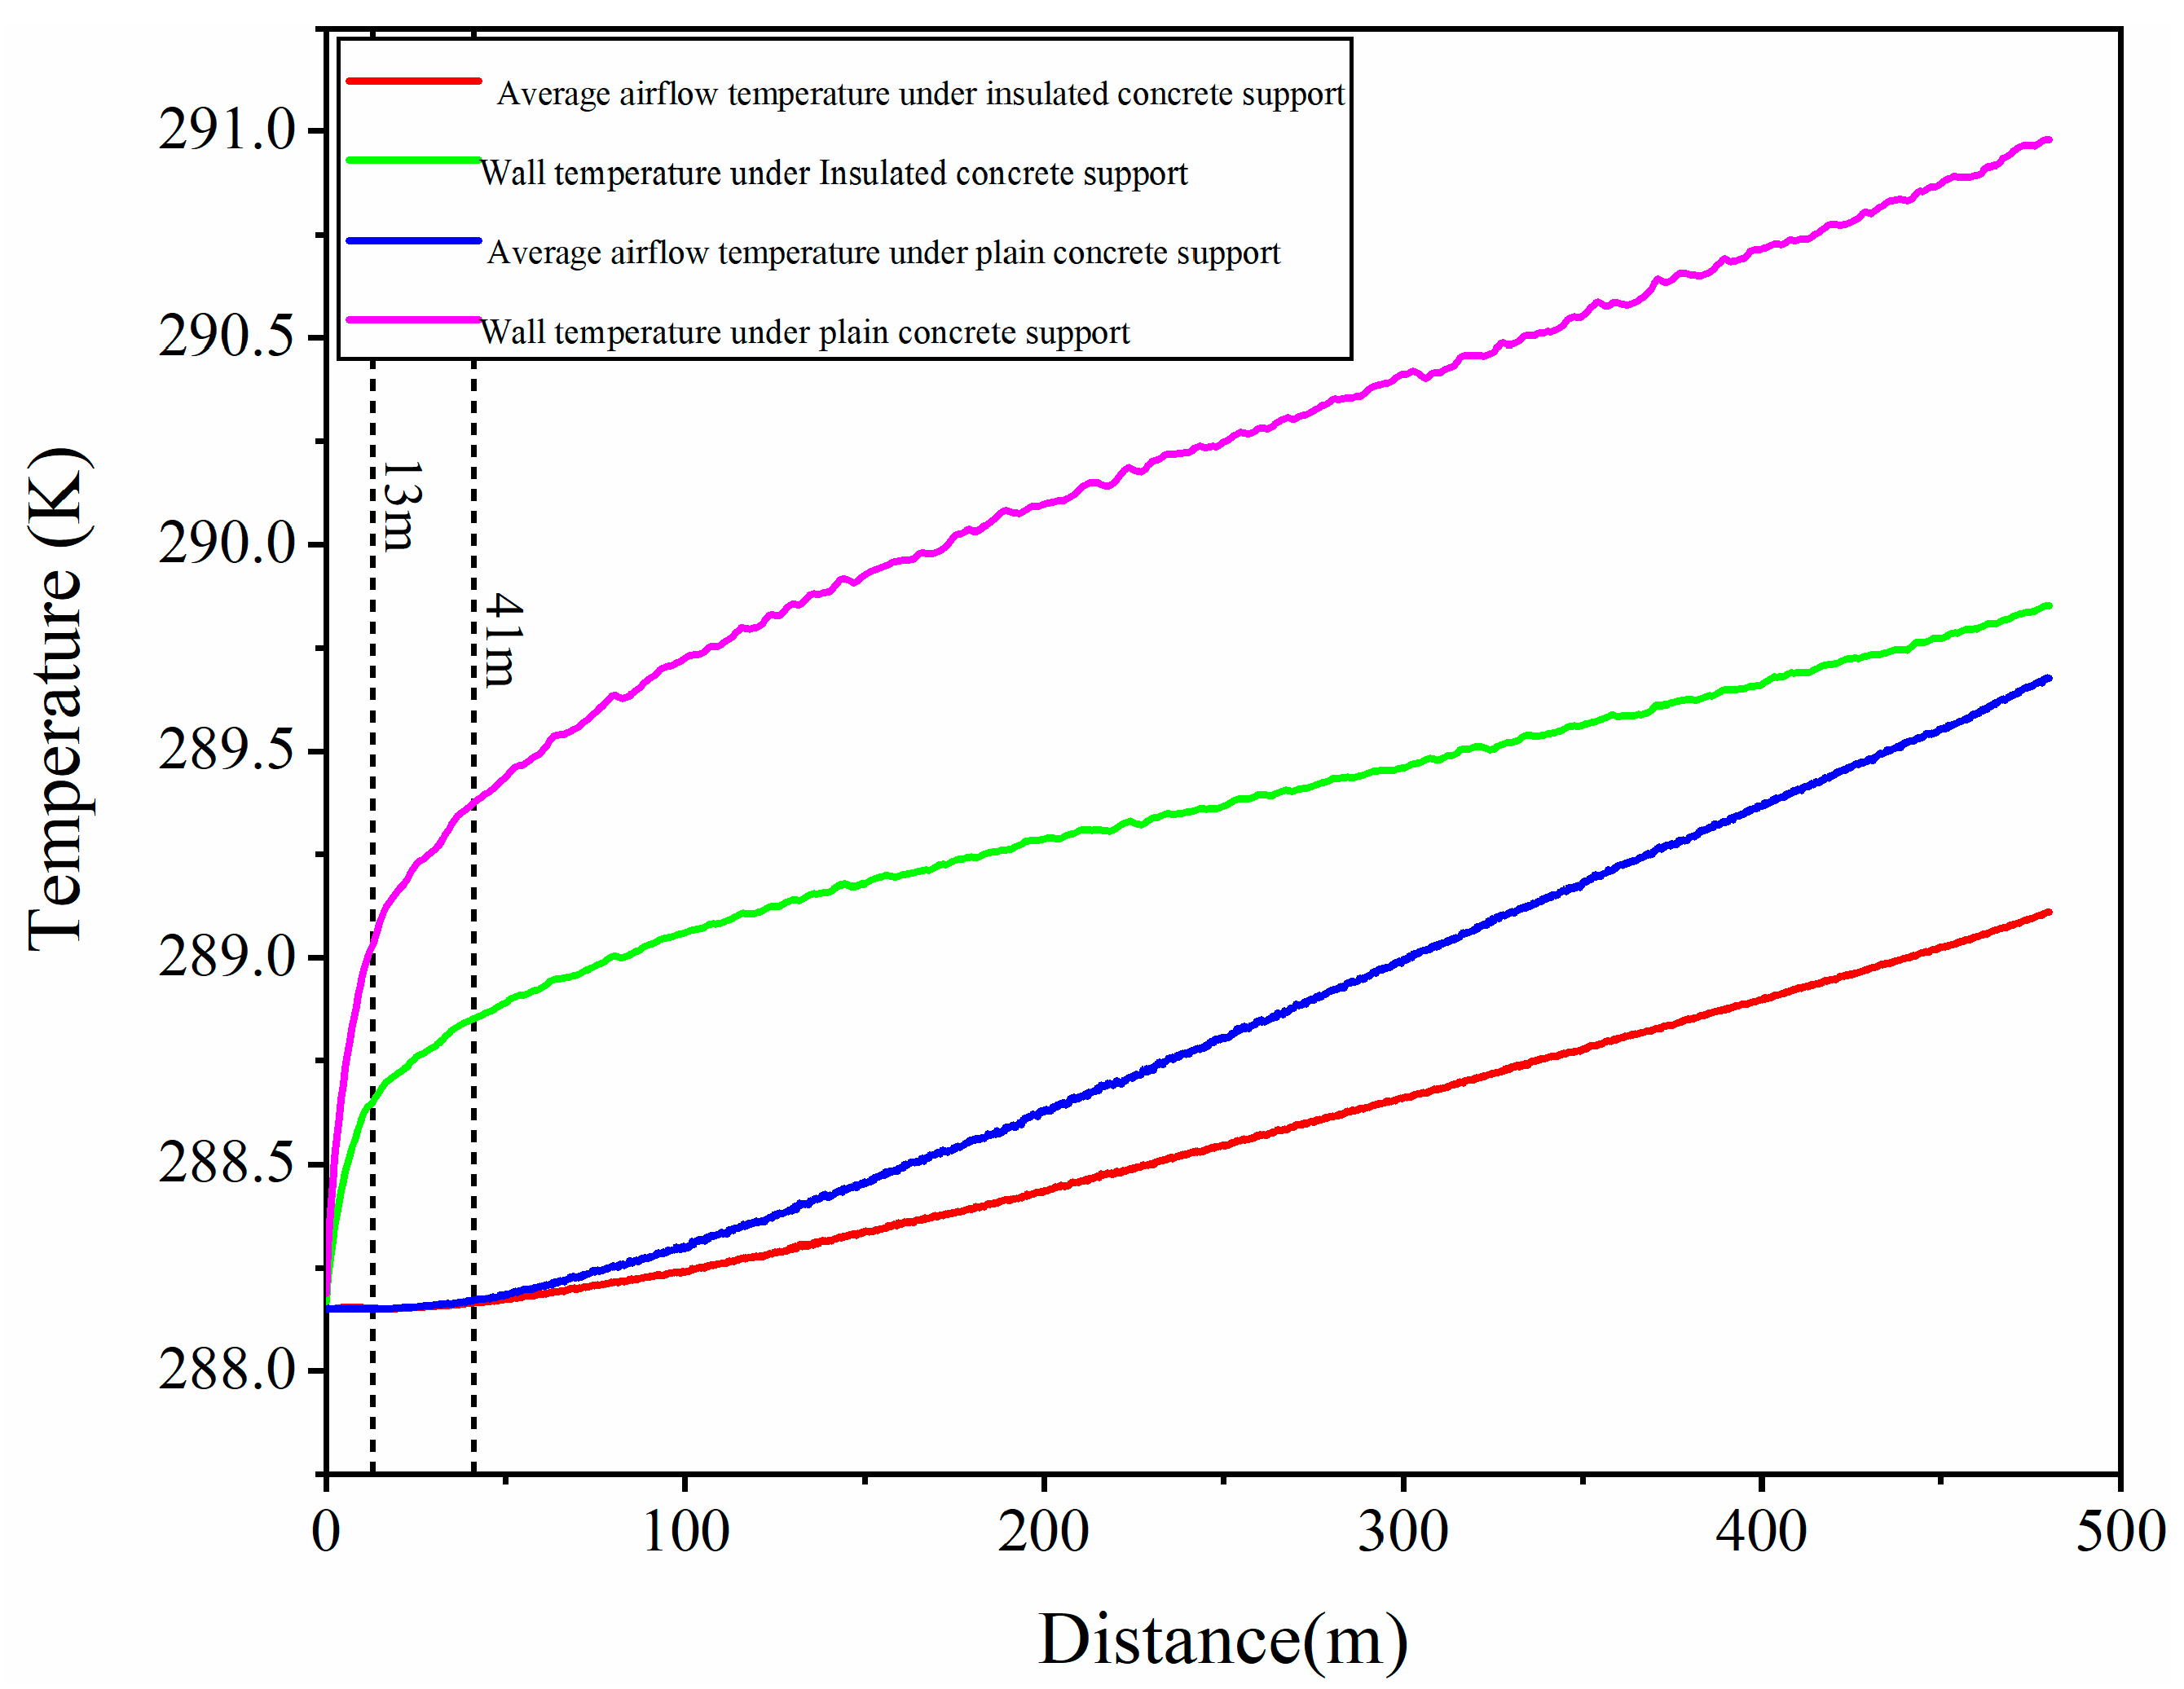
4. Numerical Simulation Study of Optimal Insulation Thickness

Straw fibers that are wet for a long period tend to decay and lose their reinforcing effectiveness. Enhancing the durability of wet straw fiber concrete was our next research work. Currently, straw fiber concrete can be used in specific high-temperature tunnels, such as transport alleys in dry, well-ventilated mines, concentrated flat alleys in mining areas, and mining alleys with a short service life (service life of no more than 1 year). The straw fiber insulating concrete we developed was very cheap and can be repainted with concrete at any time if it breaks down.
A 500 m, well-ventilated, dry, high temperature tunnel was simulated with COMSOL Multiphysics software. The thermal insulation effect of the insulated concrete was verified by comparing the effect of straw fiber insulated concrete and plain concrete of the same thickness on the temperature field.
The conjugate heat transfer system between the surrounding rock and the wind flow is divided into heat conduction and convection [30]. Their control equations are as follows.
Heat transfer equation:
ρ C P T t + · q = Q
q = λ T
where ρ is the density of the solid; C P is the specific heat capacity of the solid; T is the temperature of solid; t is the time; q is the heat flux density; Q is the total heat in the heat transfer process; and λ is the thermal conductivity of the solid.
Heat convection equation:
The heat convection equations include the continuity equation, the momentum equation, the energy equation, and the k-ε model equation. The k-ε model calculates the tunnel airflow temperature closest to the actual situation [31]. Their control equations are as follows.
Continuity equation:
ρ t + · ρ U = 0
Momentum equation:
t ρ U + · ρ U U = P + · ( τ ̿ ) + ρ g
where ρ is air density, P is the static pressure, U is the velocity vector, τ ̿ is the stress tensor, and ρ g is the gravitational body force.
Energy conservation equation:
t ρ E + U ρ E + ρ = · j h j J j + S q
where E is total energy, h j is the formation enthalpy of species, J j is the diffusion flux of species, and S q is the volumetric heat source.
k-ε two equation turbulence model:
t ρ k + · ρ U k = · μ + μ t σ k k + G k ρ ε
t ρ ε + · ρ U ε = · μ + μ t σ ε ε + C 1 ε ε G k k C 2 ε ρ ε 2 k
μ t = ρ C μ k 2 ε
where G k is the turbulent kinetic energy generated by the mean velocity gradient, μ is the dynamical viscosity of the fluid, C 1 ε and C 2 ε are model constants, σ k and σ ε are the turbulent Prandtl number, and μ t is turbulence consistency.
This study is based on a high temperature tunnel in China. We simplified the real tunnel to a 3D hollow cylinder. The length of the model was 500 m. The model consisted of wind flow, a concrete layer, and a surrounding rock mass. The thicknesses of the concrete layer, airflow, and surrounding rock were 0.2 m, 3 m and 26.8 m, respectively. A model was built based on the actual parameters. The settings of the numerical model are shown in Table 3. The insulating concrete used the best overall performance of straw fiber insulating concrete (7.5% fiber content). Thermophysical parameters of the surrounding rock mass, the concrete layer, and the wind flow are shown in Table 4.
The meshing is shown in Figure 8. The minimum cell mass, average cell mass, and cell volume ratio were 0.1394, 0.6584, and 2.005 × 10⁻⁵, respectively.
For spraying, the same thickness of plain concrete and insulated concrete tunnels have the same outer boundary conditions and the exact temperature of inlet air. As seen in Figure 9a, the temperature field of the rock mass showed a significant change. Due to fresh air’s cooling effect, the rock’s temperature near the tunnel wall decreased significantly. This cooling effect diminishes as one moves away from the tunnel. When the distance exceeded a certain threshold, the rock temperature remained almost at the original temperature (313.15 k), which indicates that the perturbation range of the surrounding rock temperature field was limited, and the heat flux was stable after a period of ventilation. In unit time, due to the high thermal conductivity of ordinary concrete, a large amount of heat was released from the surrounding rock into the tunnel, thus decreasing the surrounding rock’s temperature. In Figure 9b, the trend of the temperature field of the surrounding rock was not as significant as that in Figure 9a. The main reason is that the thermal conductivity (0.151 W/(m∙k)) of the insulating concrete mixed with rice straw fibers is relatively low, which greatly hinders the heat transfer from the surrounding rock to the wind flow. Therefore, the range and degree of temperature field disturbance in the rock mass under the heat-insulating concrete was small, and the heat was effectively blocked in the rock mass.
In Figure 10a, the high heat conduction performance of plain concrete allowed the surrounding rock mass to emit a large amount of heat, thus increasing airflow temperature. The temperature difference between the inlet airflow and the surrounding rock was the largest, and the heat exchange was the strongest. With the gradual increase in ventilation distance, the airflow temperature kept rising. The cooling of the wind flow had a decreasing range of influence on the temperature field of the rock mass. In Figure 10b, a similar trend is shown, although the change was not apparent. The airflow in the tunnel under the insulated concrete support had less temperature variation from start to finish, thus increasing the efficiency of airflow cooling utilization.
Figure 11 shows the radial temperature distribution curves at different ventilation distances. In Figure 11, we observe that the temperature changed from the outer boundary of the envelope to the center of the wind flow, with similar trends for both. However, the magnitude of the values and the temperature change rate in the wind flow region, the concrete region, and the envelope region were different. In the wind flow region, the temperature at the tunnel entrance (0 m) was kept at its original minimum (Figure 11a). When the wind flow reached 100 m (Figure 11b), the temperature of the wind flow near the tunnel wall started to rise, while the airflow temperature at other locations remained pristine. When the wind flow reached 250 m (Figure 11c), most wind flow temperatures rose, and only the airflow temperature near the tunnel’s center remained in its original state. When the wind flow reached 500 m (Figure 11d), the wind flow temperature throughout the tunnel exceeded its original value. The wind flow temperature in tunnels under plain concrete support rose faster than in tunnels under insulated concrete support. When the ventilation distance was 500 m, the airflow temperature in the center of the tunnel under plain concrete support was 0.5 k higher than the airflow temperature in the center of the tunnel under insulated concrete support; the airflow temperature at the tunnel wall under plain concrete support was 1.2 k higher than the airflow temperature at the tunnel wall under insulated concrete support. As is shown in Figure 11, a sharp increase in temperature occurred in the concrete area. During the whole ventilation process, the temperature difference between the inner and outer boundaries of the plain concrete was about 5 k, while the temperature difference between the inner and outer boundaries of the insulated concrete was about 14.5 k, thereby producing a significant temperature difference. In the peritectic region, the rock temperature increased gradually and steadily from the concrete to the farthest original boundary. The temperature of the rock mass of the sprayed plain concrete tunnel was always lower than that of the rock mass of the sprayed insulated concrete tunnel. It can be seen that, with the support of the insulating concrete, most of the heat was trapped in the rock mass outside the tunnel. The temperature variance between the rock of the sprayed plain concrete tunnel and the insulated concrete tunnel gradually decreased with increasing radial depth, and the surrounding rock temperatures of both were equal at the outermost original boundary.
The tunnel wall temperature and wind flow temperature directly affected the heat exchange between the surrounding rock mass and the wind flow, thus affecting the selection of ventilation fan. Figure 12 shows the variation curves of the tunnel wall temperature and the average temperature of the airflow. In Figure 12, we first observe that the temperature variation curve of the tunnel wall was not smooth overall, with small zigzags at different locations. Due to the roughness and unevenness of the tunnel walls after shotcrete, small eddies appeared in the wind flow, which led to an uneven temperature profile that was more pronounced in the tunnel supported by plain concrete. The temperature variance between the wind flow and the rock wall was the largest near the entrance of the tunnel, the heat exchange intensity between the wind flow and the rock was the strongest, and the temperature of the wall rose rapidly. When the ventilation distance exceeded 13 m, the wall temperature increased steadily and slowly. In the first 41 m of the ventilation distance, the average airflow temperature was maintained at the initial airflow temperature and then increased gradually and rapidly with the increase in the ventilation distance. After the ventilation distance exceeded 41 m, the temperature difference between the wall surface and the average temperature of the wind flow in the tunnel under plain concrete support was about 1.5 k, while the temperature difference between the wall surface and the average temperature of the wind flow in the tunnel under insulating concrete support was about 0.9 k. A more significant difference between the wall temperature and the average temperature of the airflow represents more heat added to the wind flow.

5. Conclusions

Performance tests and numerical simulations analyzed straw fiber concrete’s physical properties and thermal insulation effects for tunnel insulation. The following conclusions can be drawn:
(1)
The apparent density of fiber insulation concrete was 214~294 kg/m3, which is lightweight. The thermal conductivity of fiber concrete in the moist condition was more significant than that in the drying condition, and the higher water content affected the thermal insulation performance. The thermal conductivity of the dried concrete decreased with the increasing percentage of fibers. The addition of 10% fibers increased the thermal insulation of the dry concrete by about 54.7%.
(2)
The compressive strength decreased with the increase in fiber content. Compared to concrete without added fibers, the compressive strength of fiber concrete was improved when only 2.5% of fiber content was added. When the number of fibers was too much, the distribution was not uniform, which greatly increases the porosity of the concrete and led to a decrease in compressive strength. The impermeability of fiber concrete is significantly better than that of ordinary concrete. Concrete with a fiber content of 7.5% had the best impermeability.
(3)
By simulating and comparing the cooling effect of fiber insulation concrete and ordinary concrete, it could be found that the range and degree of temperature field disturbances of the surrounding rock under the support of fiber insulation concrete were smaller. The heat was effectively blocked in the surrounding rock, thus improving the efficiency of airflow cooling.
The humidity in general tunnels was high, and the straw fiber is relatively fragile; further research is needed to improve the durability of straw fiber insulated concrete.

Author Contributions

Conceptualization, X.Z. and W.L.; Methodology, W.L.; Validation, J.H.; Resources, M.C.; Data curation, M.C. and S.Z.; Writing—original draft, X.Z.; Project administration, J.H.; Funding acquisition, S.Z. All authors have read and agreed to the published version of the manuscript.

Funding

This research received no external funding.

Institutional Review Board Statement

This study was abandoned for ethical review and approval.

Informed Consent Statement

Informed consent was obtained from all subjects involved in the study.

Data Availability Statement

The study did not report any data.

Conflicts of Interest

The authors declare no conflict of interest.

References

  1. Guo, P.Y.; He, M.C.; Zheng, L.; Zhang, N. A geothermal recycling system for cooling and heating in deep mines. Appl. Therm. Eng. 2017, 116, 833–839. [Google Scholar] [CrossRef]
  2. Pretorius, J.G.; Mathews, M.J.; Maré, P.; Kleingeld, M.; van Rensburg, J. Implementing a DIKW model on a deep mine cooling system. Int. J. Min. Sci. Technol. 2019, 29, 319–326. [Google Scholar] [CrossRef]
  3. Liu, W.V.; Apel, D.B.; Bindiganavile, V.S. Cylindrical models of heat flow and thermo-elastic stresses in underground tunnels. Int. J. Numer. Methods Heat Fluid Flow 2016, 26, 2139–2159. [Google Scholar] [CrossRef]
  4. Wang, K.; Lou, Z.; Wei, G.; Qin, B.; Wang, L. A novel anti-air-leakage method and an organic polymer material for improving methane drainage performance. Process. Saf. Environ. Prot. 2019, 129, 152–162. [Google Scholar] [CrossRef]
  5. Li, S.Y.; Niu, F.J.; Lai, Y.; Pei, W.; Yu, W. Optimal design of thermal insulation layer of a tunnel in permafrost regions based on coupled heat-water simulation. Appl. Therm. Eng. 2017, 110, 1264–1273. [Google Scholar] [CrossRef]
  6. Zhang, G.Z.; Guo, Y.M.; Zhou, Y.; Ye, M.; Chen, R.; Zhang, H.; Yang, J.; Chen, J.; Zhang, M.; Lian, Y.; et al. Experimental study on the thermal performance of tunnel lining GHE under groundwater flow. Appl. Therm. Eng. 2016, 106, 784–795. [Google Scholar] [CrossRef]
  7. Hou, C.B.; Xin, S.; Zhang, L.; Liu, S.; Zhang, X. Foundation Research on Physicochemical Properties of Mine Insulation Materials. Coatings 2020, 10, 355. [Google Scholar] [CrossRef] [Green Version]
  8. Sun, P.-P.; Yang, X.-X.; Qiao, W.-G.; Song, W.-J.; Wu, Y.; Sun, D.-K. Optimally designed shotcrete material and its cooperating performance when integrated with sandstone. Constr. Build. Mater. 2020, 249, 118742. [Google Scholar] [CrossRef]
  9. Zhang, X.; Zhang, S.; Xin, S. Performance Test and Thermal Insulation Effect Analysis of Basalt-Fiber Concrete. Materials 2022, 15, 8236. [Google Scholar] [CrossRef]
  10. Gorny, R.L.; Golofit-Szymczak, M. Glass fibers as environmental hazard. Rocz. Ochr. Srodowiska 2016, 18, 336–350. [Google Scholar]
  11. Nasr, A.N. Pulmonary hazards from exposure to glass fibers. J. Occup. Med. 1967, 9, 345–348. [Google Scholar] [PubMed]
  12. Fiore, V.; Scalici, T.; Di Bella, G.; Valenza, A. A review on basalt fibre and its composites. Compos. Part B Eng. 2015, 74, 74–94. [Google Scholar] [CrossRef]
  13. Binici, H.; Aksogan, O.; Dıncer, A.; Luga, E.; Eken, M.; Isikaltun, O. The possibility of vermiculite, sunflower stalk and wheat stalk using for thermal insulation material production. Therm. Sci. Eng. Prog. 2021, 18, 100567. [Google Scholar] [CrossRef]
  14. Azzouzi, D.; Rabahi, W.; Seddiri, F.; Hemis, M. Experimental study of the fibres content effect on the heat insulation capacity of new vegetable composite plaster-pea pod fibres. Sustain. Mater. Technol. 2020, 23, e00144. [Google Scholar] [CrossRef]
  15. Ismail, B.; Belayachi, N.; Hoxha, D. Optimizing performance of insulation materials based on wheat straw, lime and gypsum plaster composites using natural additives. Constr. Build. Mater. 2020, 254, 118959. [Google Scholar] [CrossRef]
  16. Hamza, S.; Saad, H.; Charrier, B.; Ayed, N.; Bouhtoury, F.C.-E. Physico-chemical characterization of Tunisian plant fibers and its utilization as reinforcement for plaster based composites. Ind. Crops Prod. 2013, 49, 357–365. [Google Scholar] [CrossRef]
  17. Gustavsson, L.; Sathre, R. Variability in energy and carbon dioxide balances of wood and concrete building materials. Build. Environ. 2006, 41, 940–951. [Google Scholar] [CrossRef]
  18. Liu, Y.C.; Wang, S.C.; Deng, Y.; Ma, W.; Ma, Y. Numerical simulation and experimental study on ventilation system for powerhouses of deep underground hydropower stations. Appl. Therm. Eng. 2016, 105, 151–158. [Google Scholar] [CrossRef]
  19. Xin, S.; Wang, W.H.; Zhang, N.; Zhang, C.; Yuan, S.; Li, H.; Yang, W. Comparative studies on control of thermal environment in development headings using force/exhaust overlap ventilation systems. J. Build. Eng. 2021, 38, 102227. [Google Scholar] [CrossRef]
  20. Remesar, J.C.; Simon, F.; Vera, S.; Lopez, M. Improved balance between compressive strength and thermal conductivity of insulating and structural lightweight concretes for low rise construction. Constr. Build. Mater. 2020, 247, 118448. [Google Scholar] [CrossRef]
  21. Chen, L.J.; Li, P.C.; Liu, G.; Cheng, W.; Liu, Z. Development of cement dust suppression technology during shotcrete in mine of China-A review. J. Loss Prev. Process. Ind. 2018, 55, 232–242. [Google Scholar] [CrossRef]
  22. GB/T10294-2008; Thermal Insulation-Determination of Steady-State Thermal Resistance and Related Properties-Guarded Hot Plate Apparatus. GB Standards: Beijing, China, 2008.
  23. GB/T50081-2002; Standard for Test Method of Mechanical Properties on Ordinary Concrete. GB Standards: Beijing, China, 2002.
  24. GB/T50082-2009; Standard for Test Methods of Long-Test Performance and Durability of Ordinary Concrete. GB Standards: Beijing, China, 2009.
  25. Tsuchida, J.E.; Rezende, C.A.; De Oliveira-Silva, R.; Lima, M.A.; D’Eurydice, M.N.; Polikarpov, I.; Bonagamba, T.J. Nuclear magnetic resonance investigation of water accessibility in cellulose of pretreated sugarcane bagasse. Biotechnol. Biofuels 2014, 7, 127. [Google Scholar] [CrossRef] [Green Version]
  26. Walbrück, K.; Maeting, F.; Witzleben, S.; Stephan, D. Natural Fiber-Stabilized Geopolymer Foams—A Review. Materials 2020, 13, 3198. [Google Scholar] [CrossRef] [PubMed]
  27. Ledhem, A.; Dheilly, R.M.; Benmalek, M.L.; Quéneudec, M. Properties of wood-based composites formulated with aggregate industry waste. Constr. Build. Mater. 2000, 14, 341–350. [Google Scholar] [CrossRef]
  28. MacVicara, L.M.; Matuanab, J.J. Balatinecza, Aging mechanisms in cellulose fiber reinforced cement composites. Cem. Concr. Compos. 1999, 21, 189–196. [Google Scholar] [CrossRef]
  29. Ramakrishna, G.; Sundararajan, T. Impact strength of a few natural fibre reinforced cement mortar slabs: A comparative study. Cem. Concr. Compos. 2005, 27, 547–553. [Google Scholar] [CrossRef]
  30. Sasmito, A.P.; Kurnia, J.C.; Birgersson, E.; Mujumdar, A.S. Computational evaluation of thermal management strategies in an underground mine. Appl. Therm. Eng. 2015, 90, 1144–1150. [Google Scholar] [CrossRef]
  31. Gong, X.Y.; Li, G. Influence of Wall roughness on restricted wall-attached turbulent jet in excavation roadway. Min. Saf. Environ. Prot. 2017, 44, 28–31. [Google Scholar]
Figure 1. (a) natural straw; (b) straw fibers.
Buildings 13 00818 g001
Figure 2. Flow chart of concrete sample preparation.
Buildings 13 00818 g002
Figure 3. DRPL-I Thermal Conductivity Tester.
Buildings 13 00818 g003
Figure 4. Effect of fiber content on the thermal coefficient of insulating concrete.
Buildings 13 00818 g004
Figure 5. Fiber matrix bonding interface (left) and fiber surface (right) of (a) SEM micrographs of the concrete with 2.5% fibers and (b) SEM micrographs of the concrete with 7.5% fibers.
Buildings 13 00818 g005
Figure 6. Compressive strength of concrete with different fiber contents.
Buildings 13 00818 g006
Figure 7. Impermeability grade of concrete with different fiber contents.
Buildings 13 00818 g007
Figure 8. Mesh division.
Buildings 13 00818 g008
Figure 9. Concrete insulation effect comparison diagram (longitudinal section): (a) temperature field cloud of normal concrete supported tunnel (b) temperature field cloud of insulated concrete supported tunnel.
Buildings 13 00818 g009
Figure 10. Concrete insulation effect comparison diagrams (cross-section): (a) temperature field cloud of plain concrete supported tunnel; (b) temperature field cloud of insulated concrete supported tunnel.
Buildings 13 00818 g010
Figure 11. Temperature distribution along the radial direction at different ventilation distances (a) 0 m; (b) 100 m; (c) 250 m; (d) 500 m.
Buildings 13 00818 g011aBuildings 13 00818 g011b
Figure 12. Distribution of tunnel wall temperature and average airflow temperature along the axial direction.
Buildings 13 00818 g012
Table 1. Density of concrete components.
Fiber Content (%)The Addition Concrete of Each Component of Mortar (kg/m3)
CementFly AshSandWaterCeramic PelletsGlass BeadsFibers
026.246.5675.4418.0442.6529.150
2.526.246.5675.4418.0442.6529.150.82
526.246.5675.4418.0442.6529.151.64
7.526.246.5675.4418.0442.6529.152.64
1026.246.5675.4418.0442.6529.153.28
Table 2. Apparent density of concrete with each fiber content.
Fiber content (%)02.557.510
Apparent density (Kg/m3)294264258235214
Table 3. Setting of simulation parameters.
TypePropertyValueTypePropertyValue
InletVelocity inlet2.5 m/sWall of airwayKs0.05 m
Temperature288.65 kCs0.07
OutletPressure outlet1.1 atmSolution methodsSchemeCoupled
Viscous modelK-epsilonStandardSpatial discretizationTurbulent kinetic energySecond order upwind
Far Field boundaryTemperature\Turbulent dissipation rateSecond order upwind
GeneralSolver typePressure-basedPressurePRESTO!
Table 4. Thermophysical parameters of the surrounding rock mass, the concrete layer, and the wind flow.
MaterialThermal Conductivity (W/(m∙k))Density (kg/m3)Specific Heat (J/(kg∙k))
surrounding rock mass5.12593790
plain concrete2.51200900
heat-insulating concrete0.1581650\
wind flow0.02421.2251006.43
Disclaimer/Publisher’s Note: The statements, opinions and data contained in all publications are solely those of the individual author(s) and contributor(s) and not of MDPI and/or the editor(s). MDPI and/or the editor(s) disclaim responsibility for any injury to people or property resulting from any ideas, methods, instructions or products referred to in the content.

