Article

Towards a Model That Sees Human Resources as a Key Element for Competitiveness in Construction Management

1
Facultad de Ingeniería, Universidad Panamericana, Álvaro del Portillo 49, Zapopan 45010, Mexico
2
Department of Civil and Environmental Engineering, Universidad del Bío-Bío, Concepción 4051381, Chile
*
Author to whom correspondence should be addressed.
Buildings 2023, 13(3), 774; https://doi.org/10.3390/buildings13030774
Submission received: 23 February 2023 / Revised: 7 March 2023 / Accepted: 13 March 2023 / Published: 15 March 2023
(This article belongs to the Special Issue Advances in Project Management in Construction)

Abstract

:
The construction industry is continuously affected by external and internal agents that modify and define its competitiveness. Changing markets, currency fluctuations, and tremendous competition have made the issue of competitiveness increasingly important. The literature highlights factors that determine the competitiveness of construction firms, including easy-to-measure elements, such as financial, sales, return on investment, etc., while other elements are not as easily measurable, such as customer satisfaction, employee satisfaction, loyalty, and leadership, among many others. Within these factors, Human Resources (HR) has occupied a central place in the last decade, due to the enormous impact that labor has on project execution. This research mainly focuses on the study of HR and its components to reach a deeper understanding of the impact that HR has on the competitiveness of construction companies. After defining the most relevant variables, an interrelationships model was proposed with the Partial Least Square (PLS) technique. These HR variables impact the competitiveness variables: cost, utility, time, quality, Staff retention, and Health & Safety. The PSL analyses met the evaluation criteria using the structural model, confirming its viability. It was found that there are three important variables related to competitiveness: (i) leadership, (ii) innovation, and (iii) competitiveness.

1. Introduction

The competitiveness of the construction industry is determined by a variety of factors which should be seriously and comprehensively taken into consideration when making policies and regulations [1]. The acceleration of globalization, the reduction of costs, the evolution of information and communication technologies, as well as the internationalization of companies has resulted in a drastic change to the global economy. Companies and nations are faced with the challenge of being more competitive and adapting to new trends, a situation that is becoming increasingly crucial for industries such as construction, thus defining its role in globalization [2].
The term competitiveness is adopted from the administrative/economic field and aims to be a top indicator that goes beyond profitability, productivity, or market share, all of which seem insufficient when trying to give the most accurate definition of a company’s performance [1,3].
On the other hand, Berisha [4] notes that Human Resources (HR) is a firm’s most important asset. It designs, creates research and innovation in projects, and creates differences among companies. In recent years, management schools have begun to appreciate the importance of HR as a source of competitive advantage. People and development systems are difficult to copy from a competitor, making companies responsible for providing their sources of competitive advantage [4].
Man [5] goes further by stating that HR is the main asset for the development and growth of a nation and organization. In other words, Man [5] argues that HR can improve the productivity of a nation and contribute to the growth of the economy, especially in the Industrial Revolution 4.0, which requires very specific knowledge in terms of technology, digitization, artificial intelligence, computing, etc.
According to Lin [6], HR is increasingly important for the awarding of tenders as the construction industry expands from local to global markets, which makes the hiring of competent local, temporary employees, as well as regular employees, increasingly strategic.
Likewise, van Heerden et al. [7] mention the importance of soft skills in HR, which can have a significant impact on the internal competitiveness of a construction company, since these skills function as differentiators. Taris and Wandebori [8] posit that organizations that make efficient use of resources and internal capabilities may be more likely to have a competitive advantage. A greater infrastructure is needed for HR management. Investment in HR must be part of the corporate strategy of any construction company.
Thus, to encourage a strong union between company strategy and HR management, metrics that measure and evaluate all aspects of the company, and not just financial ones, are needed. Even though there are extensive strategies and various programs for HR development, structured strategies focused on the worker are further needed in the construction industry [9].
In terms of competitiveness, HR aims to optimize costs related to employees, customer orientation, increased profitability, and company growth. At the same time, employees must adapt to the needs of the organization, its mission, and strategy through communication and promotion of company values, strengthening internal relationships, and teamwork [10,11,12].
However, there are many reasons why HR is undervalued in comparison with departments like finance, information technology, marketing, etc. Most firms have a bureaucratic system that relies on inertia and is used to the way things have always been done. Most firms were not designed with HR management as a factor of competitive advantage [13].
Therefore, this study aims to understand more deeply, through an interrelationship model, if, and how various elements of HR impact variables related to company competitiveness in the construction sector. In this sense, Orozco et al. [14] developed a model related to the interrelationship of variables that affect competitiveness, including some related to HR. However, this study intends to focus and go into greater detail on HR impacts competitiveness. Consequently, the present study aims to create an HR-Competitiveness model for decision-makers in construction companies to increase their awareness of the most HR-relevant factors that contribute to competitiveness.

2. Literature Review

For the development of a proposed interrelationship model, three main concepts were explored: competitiveness, human resources (HR), and corporate strategies, which are explained below as follows.

2.1. The Concept of Competitiveness in the Construction Industry

Since the 1980s, the concept of competitiveness has received attention from practitioners seeking to increase their companies’ competitiveness and researchers who want to understand it in light of Porter’s book, Competitive Strategies. However, there is no definitive understanding of the word competitiveness within construction firms [15,16].
Several studies in the field of competitiveness have been conducted to analyze the business environment, investigating both internal and external effects that are mainly long-term [15,16,17,18]. In terms of construction, one of the main industry definitions of competitiveness refers to the ability to acquire the necessary resources in the appropriate quantities and qualities. Thus, one of its main focuses is on resources [19]. Forcael et al. [20], state that the construction industry lives with enormous uncertainty that can interfere with the success of any project. Thus, HR emerges as an inexhaustible source of competitiveness that contributes to the success of projects and could contribute to minimizing said uncertainty in certain processes. Duy Nguyen et al. [21] add that construction projects are complex and difficult to understand in their management towards success, which factors such as communication, comfort, competition, and HR commitment influence.
Within the different definitions of competitiveness, Flanagan et al. [22] mention in their research on Measuring Competitiveness in Select Countries, that competitiveness can be understood on three levels, namely nation, firm, and industry. At the country/nation level, competitiveness focuses on human development, growth, and equality. On the industry level, competitiveness is defined as consumer satisfaction with an appropriate product-service combination, including price, quality, innovation, the satisfaction of customer needs, offering an attractive return on investment with growth potential. At the firm level, competitiveness is related to market performance, with high productivity being the key to success [15,16,23].
Even though productivity is mentioned as a key element, it is difficult to define it. The limitations of measuring productivity include the absence of feasibility and lack of reliable data on things like the effectiveness of project management, the level of quality achieved, and innovations, as well as the difficulty of comparing productivity between two industries [24,25].
As Porter [24] mentions, there is no consensus on the definition of competitiveness, but the definitions that do exist contain trends that highlight how competitiveness is thought of and conceptualized. These trends point to competitiveness’ direct relationship with capacity, quality, effectiveness, and human talent. A literature review of the concept of competitiveness is presented in Table 1.
Other authors, such as Porter [29], have contributed to the concept of competitiveness. They note that, although it cannot be defined exactly, it resembles productivity, which refers to the efficient use of resources, it can help decisively increase individuals’ standards in terms of quality of life. On the other hand, competitiveness is a multidimensional term but can become a competitive force in which skills, people, and their qualities contribute to and freely exchange in the organization [30,31].
The definitions organized in Table 1 show that there is a tendency to associate competitiveness with the good use of resources, skills, talent, etc., and that it has a considerable impact on customer and staff satisfaction, in addition to producing value as a part of a project’s processes and final results.
As can be seen in Table 2, various authors mention that competitiveness in a construction company is strongly linked to the measurement of the performance of various factors, such as cost, time, quality, profitability, as well as external and internal strategies. Performance evaluation is also relevant. Added to this, leadership appears as a relevant element in competitiveness. Complementing the information in Table 2, Han et al. [32] mention that it is necessary to determine the competitiveness of the company and incorporate new competitiveness tools into corporate strategies. add that companies have to endow themselves with their competitive attractiveness to have a greater share of the market.

2.2. HR as a Concept in Construction Industry

The firm’s HR is considered its most important asset since it is the department that carries out research, designs, and projects. The HR department ultimately differentiate one firm from another [12,40]. In recent years, the main administration schools have begun to appreciate the importance of HR as a source of competitive advantage [31,40]. Even as a competitive advantage, people and development systems are difficult to copy from a competitor, so companies are forced to provide their sources of competitive advantage [4].
In fact, at the end of the year, many construction firms report that HR is the asset on which they place the greatest emphasis or effort. It indicates that HR is becoming an important factor in strategies and decision-making [10]. HR has the potential to be a sustainable source of competitive advantage, but for this, employees have to have the right skills and motivation [41,42,43,44].
Currently, the effectiveness of HR training is an increasingly critical issue since a trained worker tends to have better productivity. This is why motivation directly impacts various factors of the employee, being one of the main agents in the effectiveness of training [45].
Consequently, Berisha & Kutllovci [4] mention that incorporating HR into corporate strategies first requires knowing the factors workers appreciate most within the company, e.g., development within the company, a higher salary, new experiences with international firms, the monotony of the work, the low appreciation of their work, working near the home, reasonable pressure at work, new challenges, changes in the business or poor relationships among workers, to mention just a few. In this way, by knowing what the employee appreciates, motivation and development systems can be generated that promote greater employee competitiveness. Berisha & Kutllovci [4] add that innovation and HR management plays an increasingly important and frontline role in competitiveness.
Omoraka [46] adds that correctly executing a construction project is influenced by the availability of professionals with the required skills. This means that employees’ talents and skills can become fundamental in the execution and success of a project. Managers and directors can reflect on the importance of HR in generating competitiveness through these skills.
Moreover, managers and decision-makers should ask themselves what gives their workers the greatest satisfaction so that they may integrate HR and its contribution to competitiveness into their corporate strategies. In addition, Ni et al. [47] also suggested that several factors influence employee satisfaction, such as personal issues such as educational level and competence, as well as elements of the work they do, such as professional development, work intensity, work environment or company culture, salary, rewards, teamwork, leadership style, values and; finally, he adds that the social environment in which they operate also influences, such as respect inside work and family-work balance. All these elements are used to formulate the factors of the present investigation.
As can be seen in Table 3, the HR factors of various authors who investigate and support the importance of HR within the construction industry were categorized. These factors that appear in the table, will later form the PLS model and be changed in the latent variables. These variables will be interrelated with those of competitiveness.
It can be seen in Table 3, how the HR factors were categorized according to the number of appearances in the Construction Industry research; e.g., the Motivation factor is the variable with the highest appearance, followed by Leadership, non-financial Competitiveness, Innovation, Communication, Incentives and Rewards, Training, Company Culture, Teamwork, Staff Satisfaction, Values, Development Systems, Health and Safety, and lastly with the least amount of mention appear Commitment Systems.

2.3. HR Management in the Construction Industry

The definition of HR management is directly related to the term “management” which can be understood in terms of administration and consists of organization, planning, supervision, control, etc. That is, it refers to managing the internal affairs of the company [83].
Thus, it is very important not only to know the HR factors that contribute to competitiveness, but also how they are managed and incorporated into corporate strategies.
Several authors highlight the importance of HR in organizations’ corporate strategy.
Lawler [84] mentions that, according to a survey of executives around the world, the two biggest challenges in administration are as follows: (1) Recruitment of highly qualified staff throughout the world, particularly when competing for emerging talent, which is the most intense; and (2) improving the attractiveness of the company’s culture and work environment.
The term “human resources” is used both in the business world and in terms of people working in organizations. HR (employees) are the most important assets and valuable resources for a company’s performance; workers are a very important element since knowledge, experience, and skills increase an organization’s market value, especially within a competitive industry [83]. Therefore, it is necessary to become familiar with what employees most appreciate at work, whether it be salary, promotion opportunities, independence, supervision, time, etc. [4].
HR policies should integrate business strategies and use them to reinforce organizational culture, where they could be seen as a competitive advantage, promote commitment thereto, and consequently foster goodwill. The current concept of HR management sees people as the company’s most important asset, combining the intelligence, skills, and experience that gives the company its distinctive character. However, it should be noted that just because a company has a competitive advantage does not mean it will last forever [85,86].
Now, HR is connected to the organizational processes. Their needs, missions, and corporate strategy should respect areas such as customer orientation, communication and the promotion of organizational values, internal relations, internal communication, and teamwork in the construction industry [10]. Internal strategies can be created in the company, and efforts can be redirected to enhance what truly generates competitiveness through HR. In this way, it is possible to create corporate strategies that motivate the use of HR as a competitive advantage.

3. Methodology

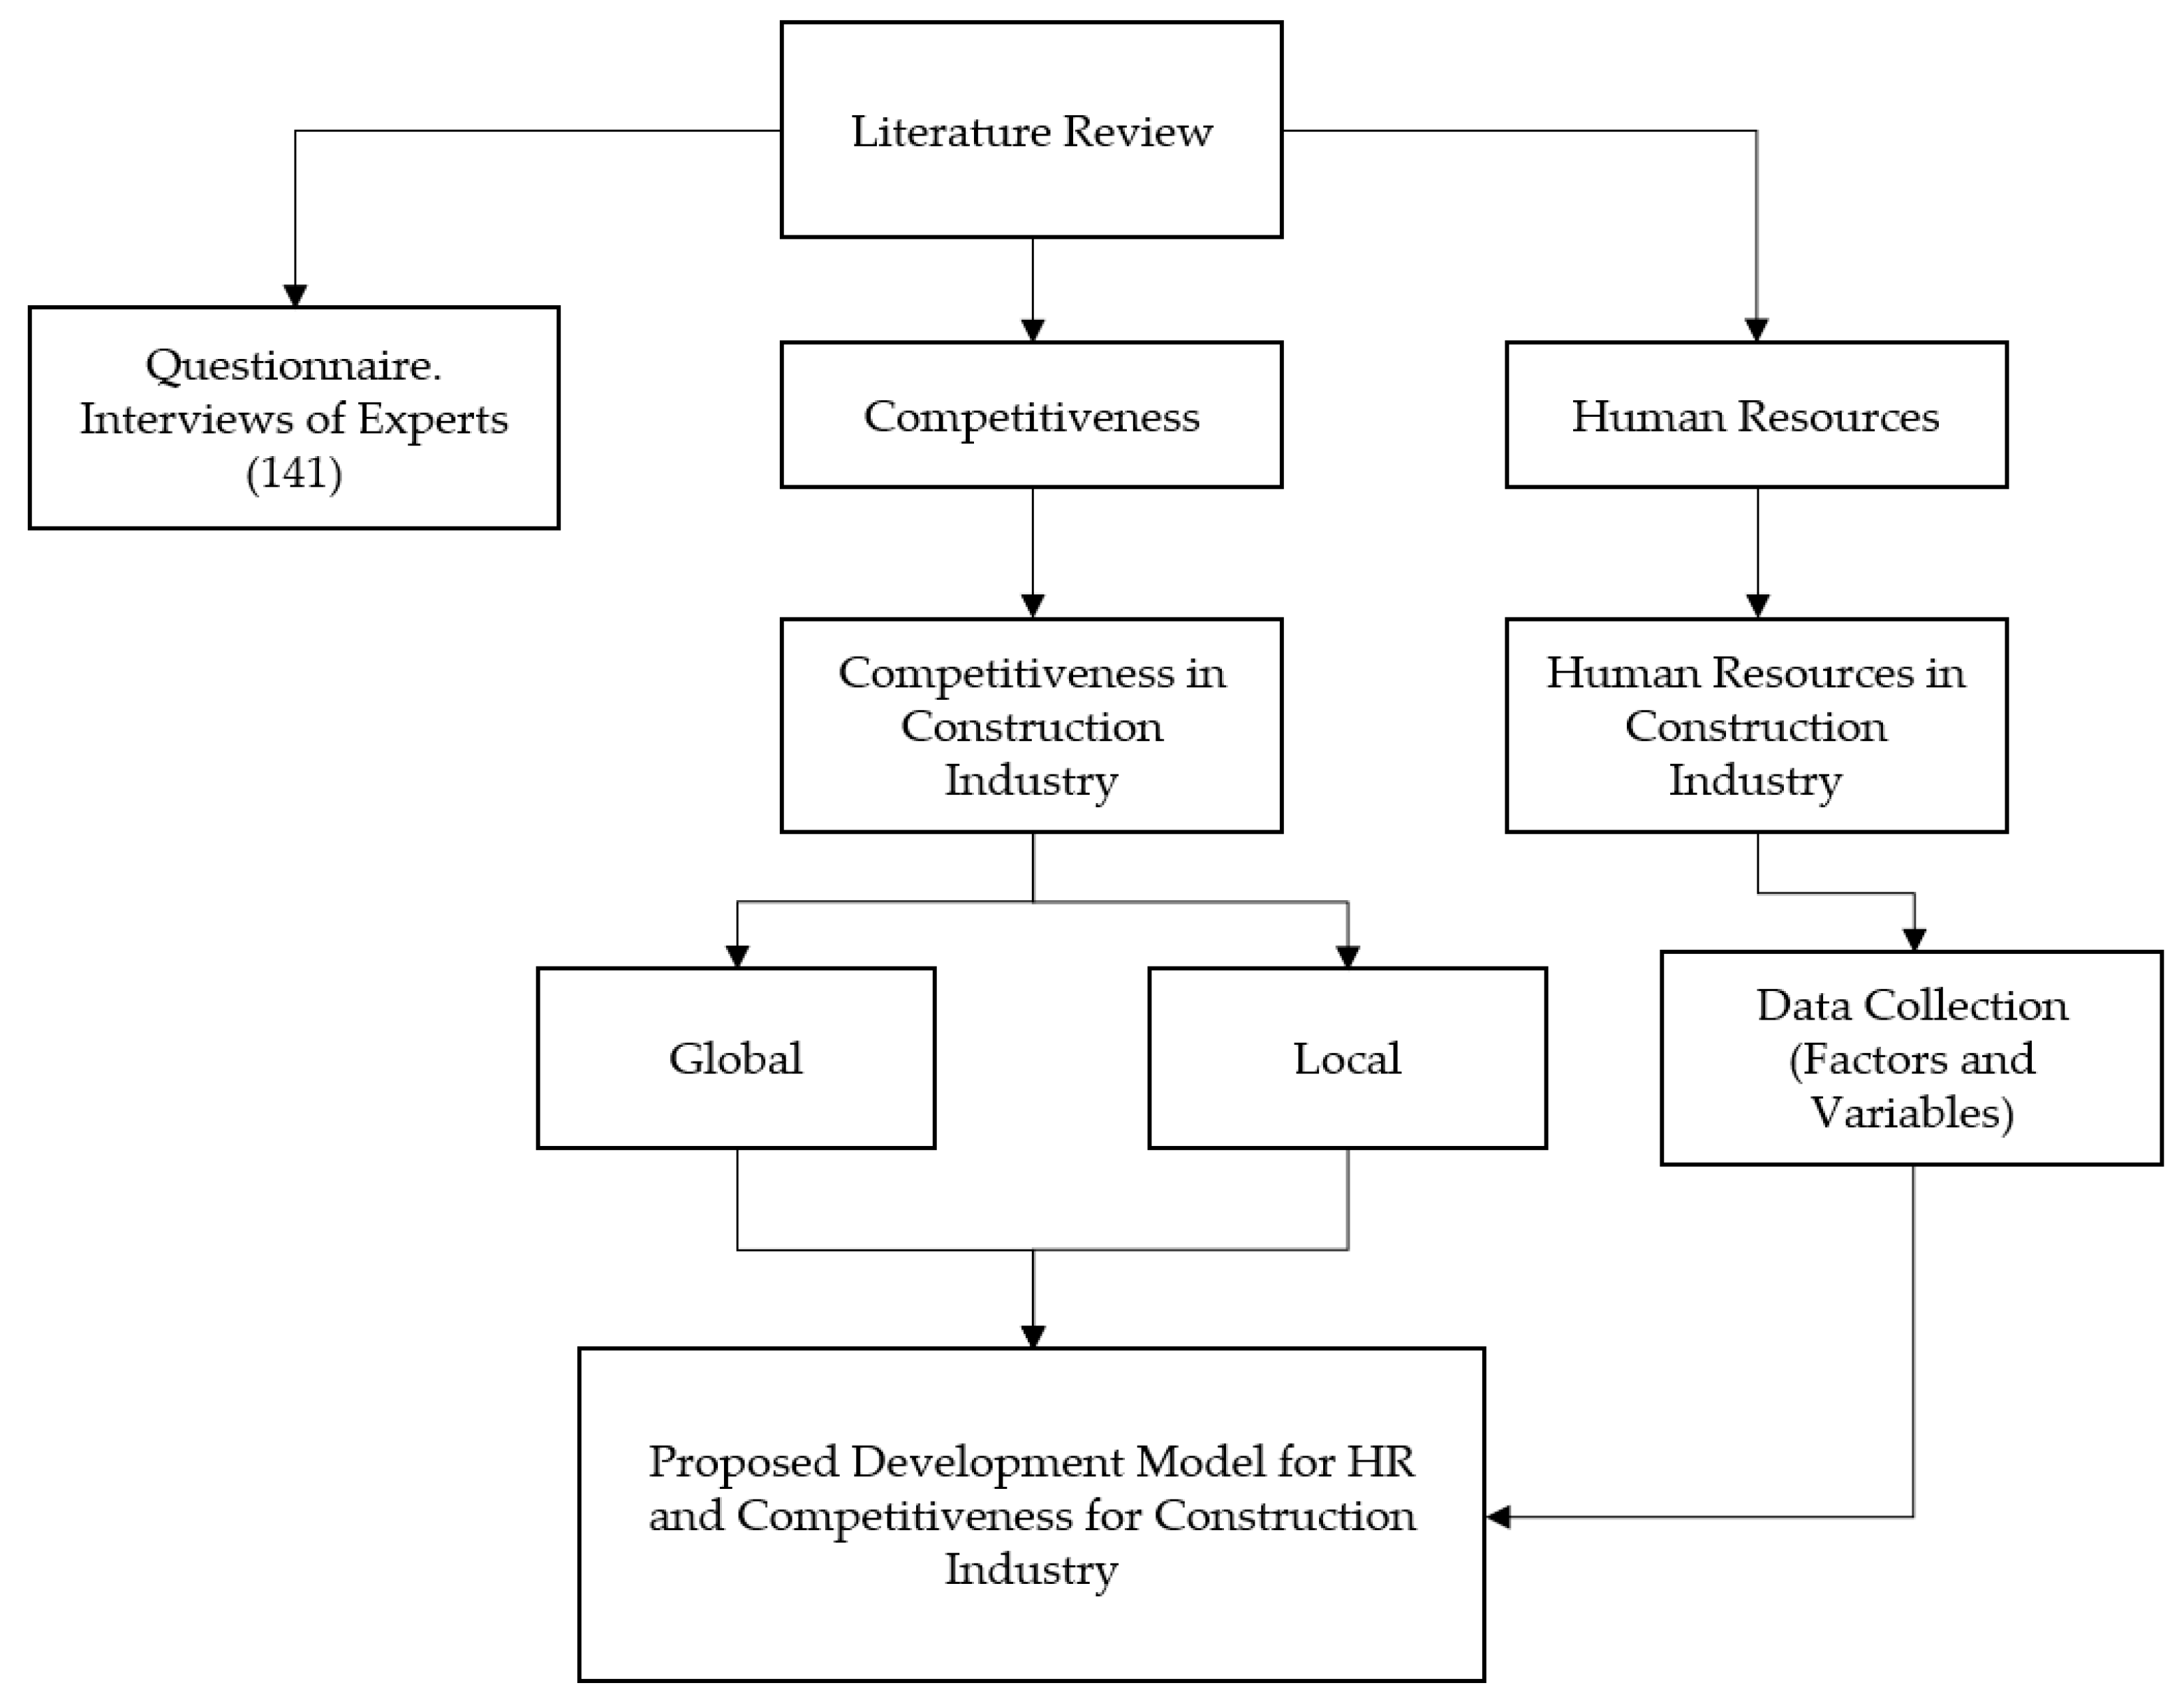
3.1. Overall Flow of This Study

This study measures the relationship between HR factors and competitiveness factors in the construction industry from contractors’ perspectives. The research hypothesis proposes that there is a relationship between HR factors and competitiveness factors in a construction company and that a PLS model can be formulated to explain this relationship.
This study aims to investigate the relationship between HR factors and competitiveness in a construction company. The research hypothesis proposes that there is a relationship between these two factors, and a PLS model can be formulated to explain this relationship. To achieve this objective, the study will address the following research questions: (1) Is there a relationship between HR and competitiveness factors? and (2) What are the most relevant HR factors for generating competitiveness in a construction company? Thus, by collecting and analyzing data on various HR and competitiveness factors and using partial least squares (PLS) analysis, the study aims to identify the most significant HR factors that contribute to competitiveness in the construction industry.
Based on the findings, corporate strategies could be focused on enhancing the identified HR factors to improve the competitiveness of the construction company.
Due to the lack of studies on this subject and the exploratory nature of the present study, a qualitative research approach is proposed, which includes semi-structured questionnaire interviews as a data collection tool to obtain the perception of the respondents towards various HR concerning the competitiveness of the industry. Initially, a robust review of the literature is carried out, both on the concept of competitiveness and HR, to later, specifically, on the construction industry. From the literary base, the factors, and variables most mentioned by the authors about HR and competitiveness are extracted. In addition, the application of a questionnaire and interviews with 141 experts in the construction industry helped validate these variables and obtain data collection.
The overall flow of this study is shown in Figure 1.

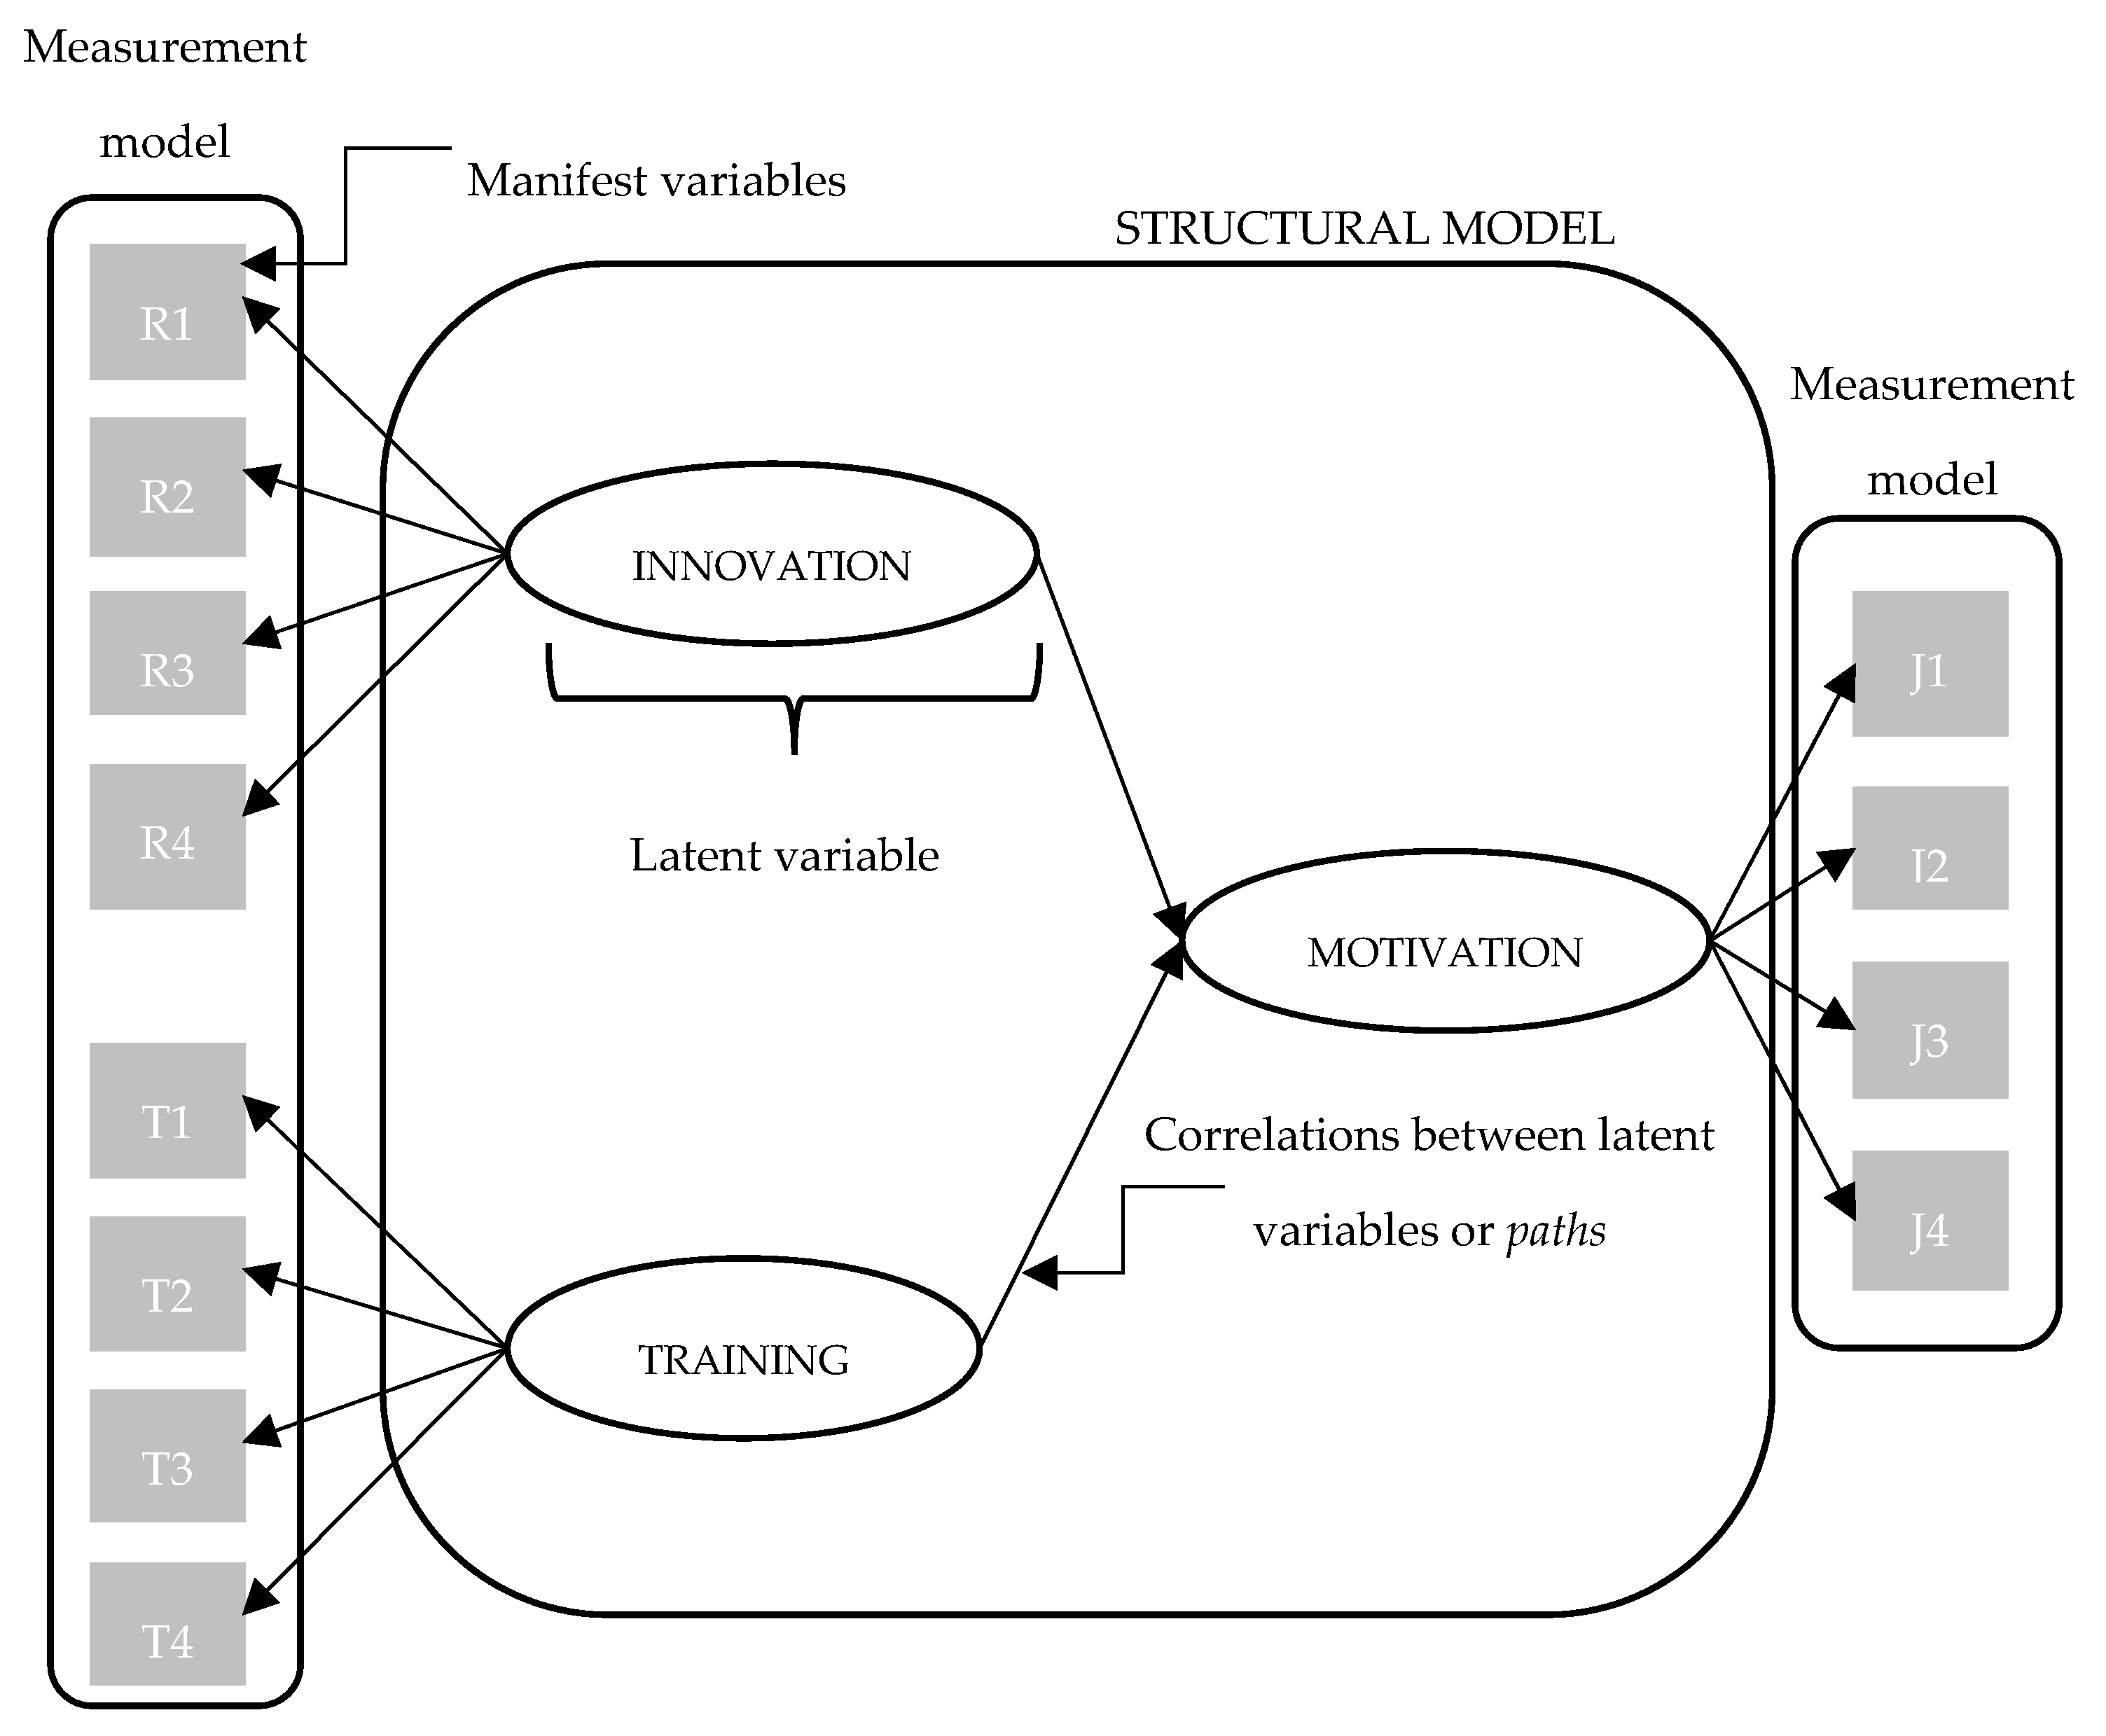
3.2. Partial Leas Square as the Method to Build the Model

To analyze this model, Partial Least Square (PLS) was used. In recent years, the use of PLS as an analysis method has gained more strength due to the large number of advantages that the model has, such as the prediction of latent variables [87]. Structural equations are based on carrying out study models that consist of relating criteria and concepts employing arrows to determine the interrelationships between factors. The PLS method is a modeling technique based on the theory of structural equations, which focuses mainly on predictive causal analysis supported by variance through modeling between parameters and their indicators and evaluating the cause-effect of the relationships [39].
Structural equation modeling can be classified in two ways: measurement model and structural model [88,89]. Through these tools, it is possible to represent reality through increasingly complex models with the emergence of techniques such as structural equation modeling (SEM) that allows multiple regressions between latent variables [90].
Researchers have begun to use PLS because it makes it possible to model factors and variables that are difficult to observe through structural equations, like in the case of HR. PLS data modeling can also be a good option in the early stages of research, especially when working with information that is difficult to measure [91].
It is important to mention that hypothesized relationships herein between measures and latent variables are guided by literature and theory. Adamy & Bakar [92] mention that the use of the PLS method in the construction industry helps to analyze the correlation of factors, where the model is used in an innovative way to measure variables that are difficult to observe. Ingle and Ingle & Mahesh [93] add that, by using PLS as a method of analysis, it is possible to observe how the results can orient guidelines in construction management and can improve a project’s performance and competitiveness, as well as serve as a useful guide in decision-making.
As can be seen in Figure 2, the PLS model has the following structure proposed by Chin [94]:
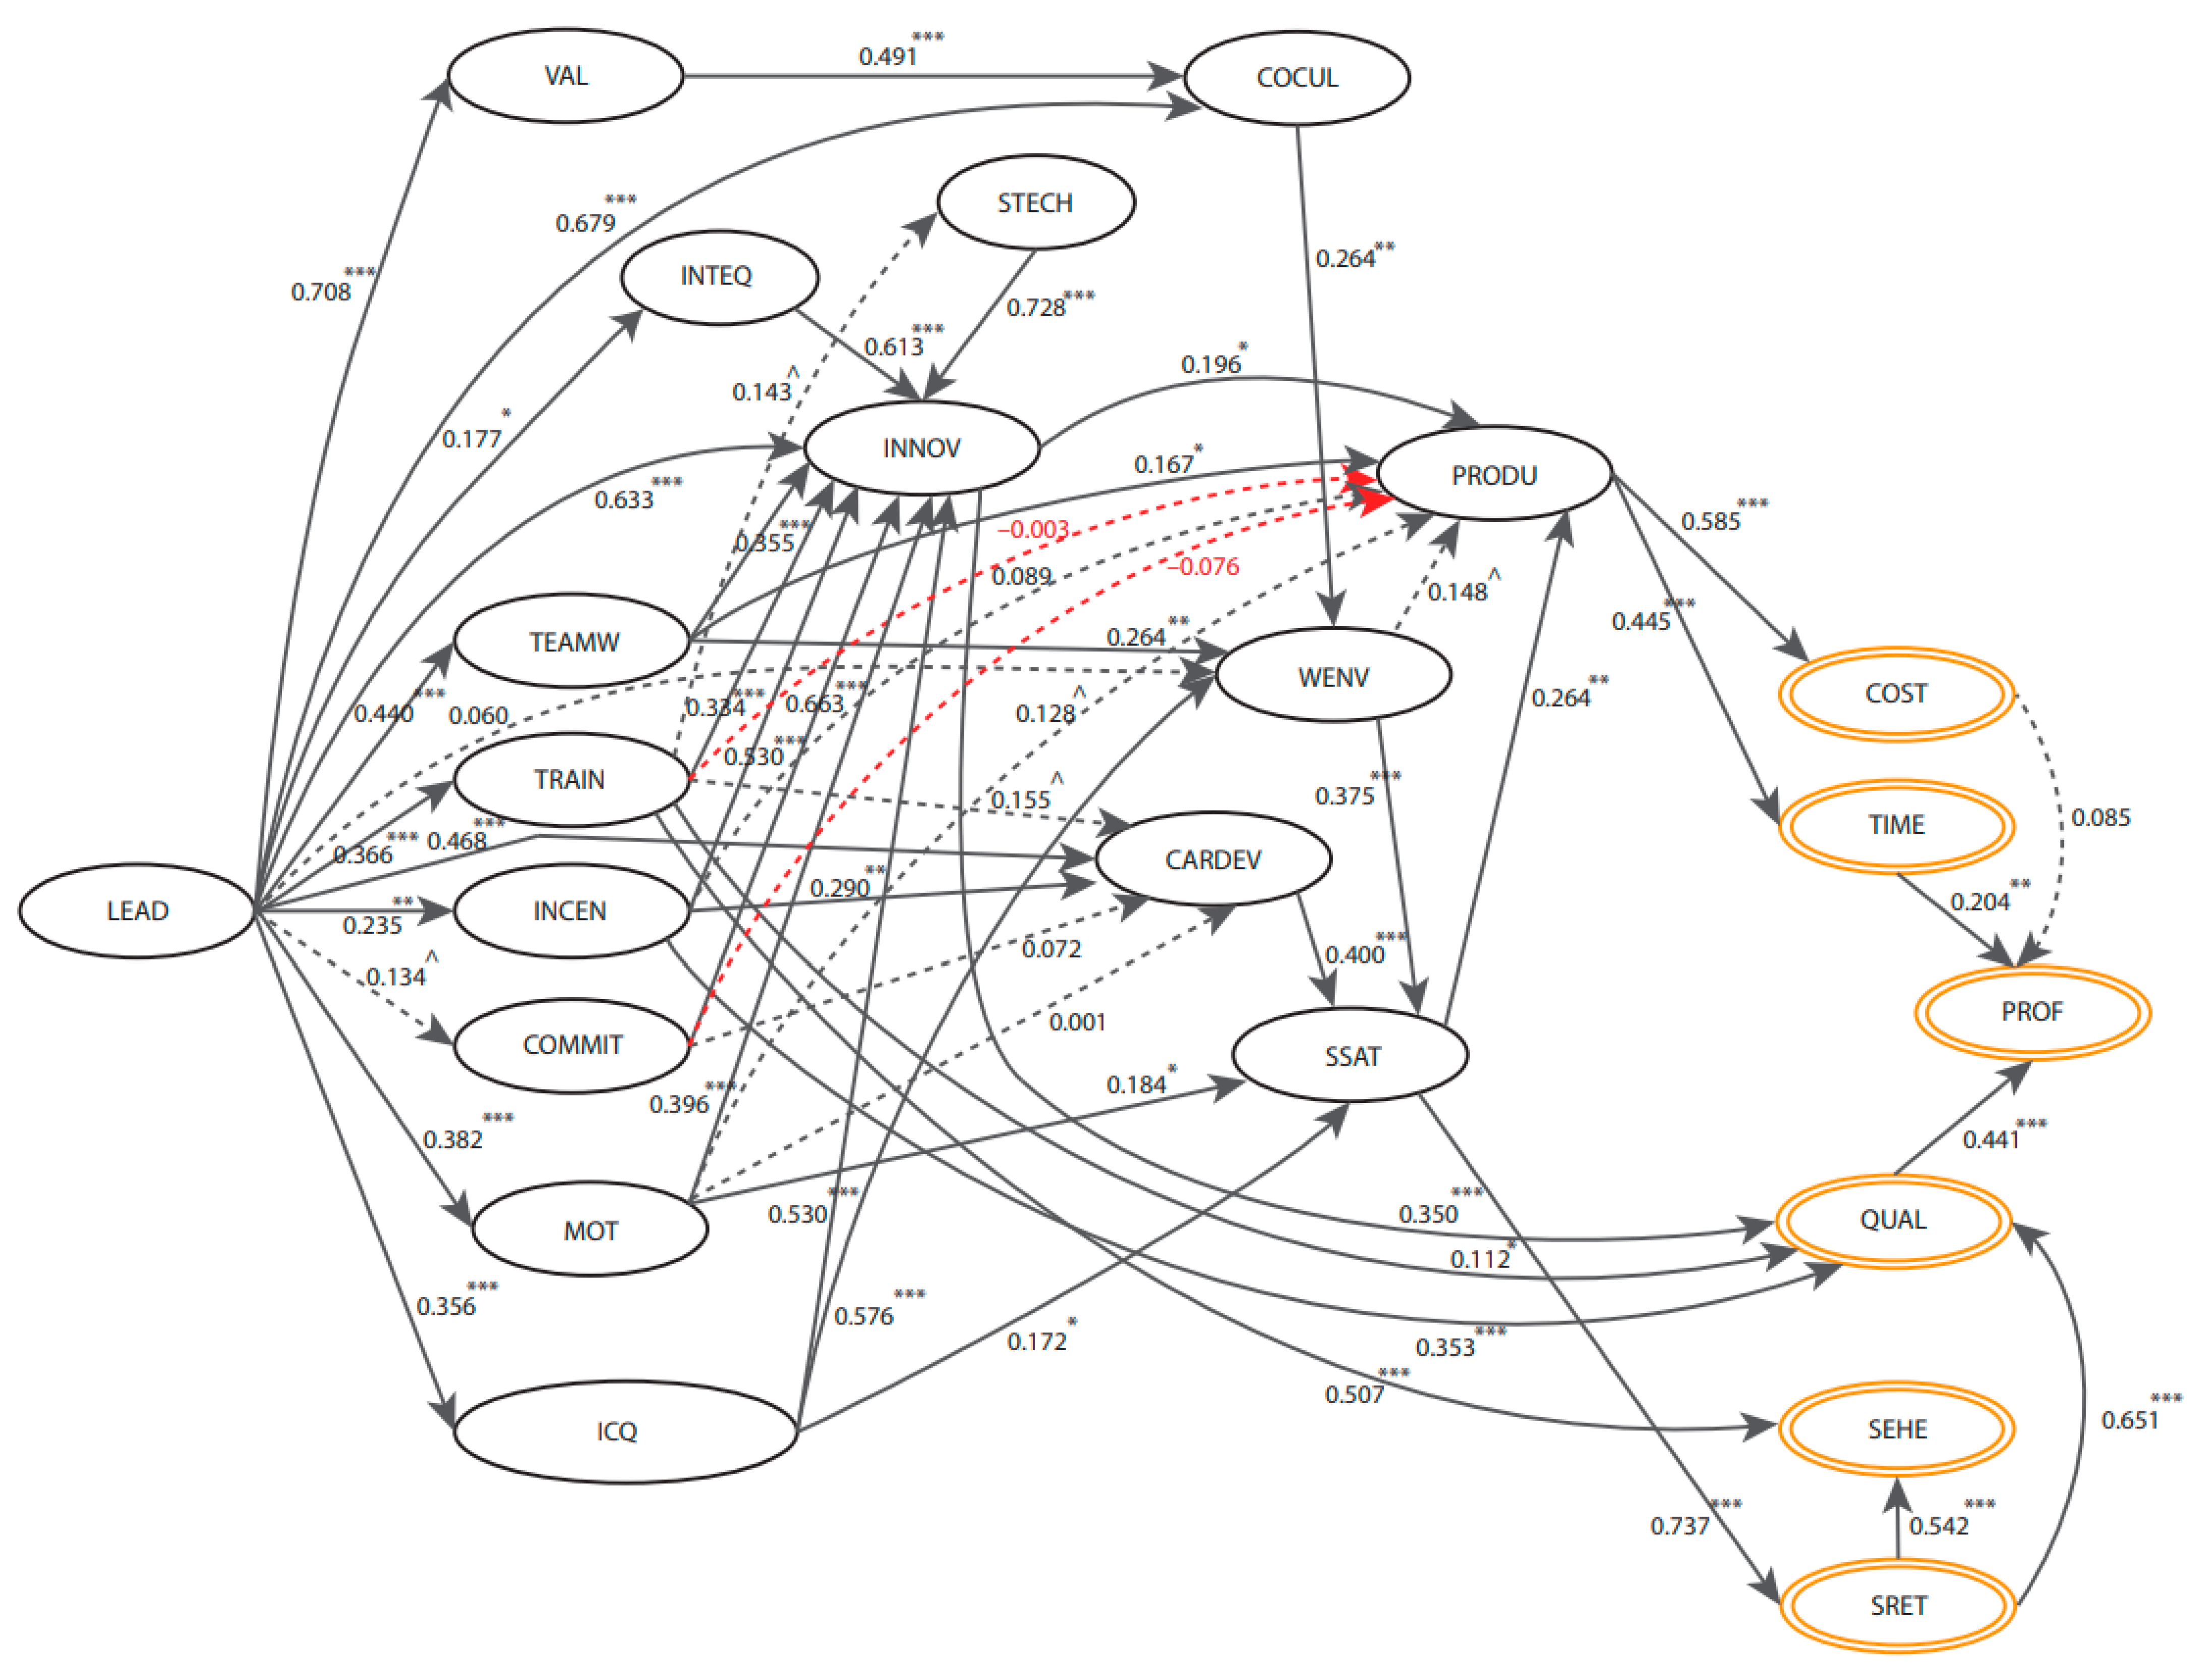
  • Manifest variables are represented in rectangular form.
  • Latent variables are represented with an oval.
  • Relationships between variables are represented by straight arrows (paths).
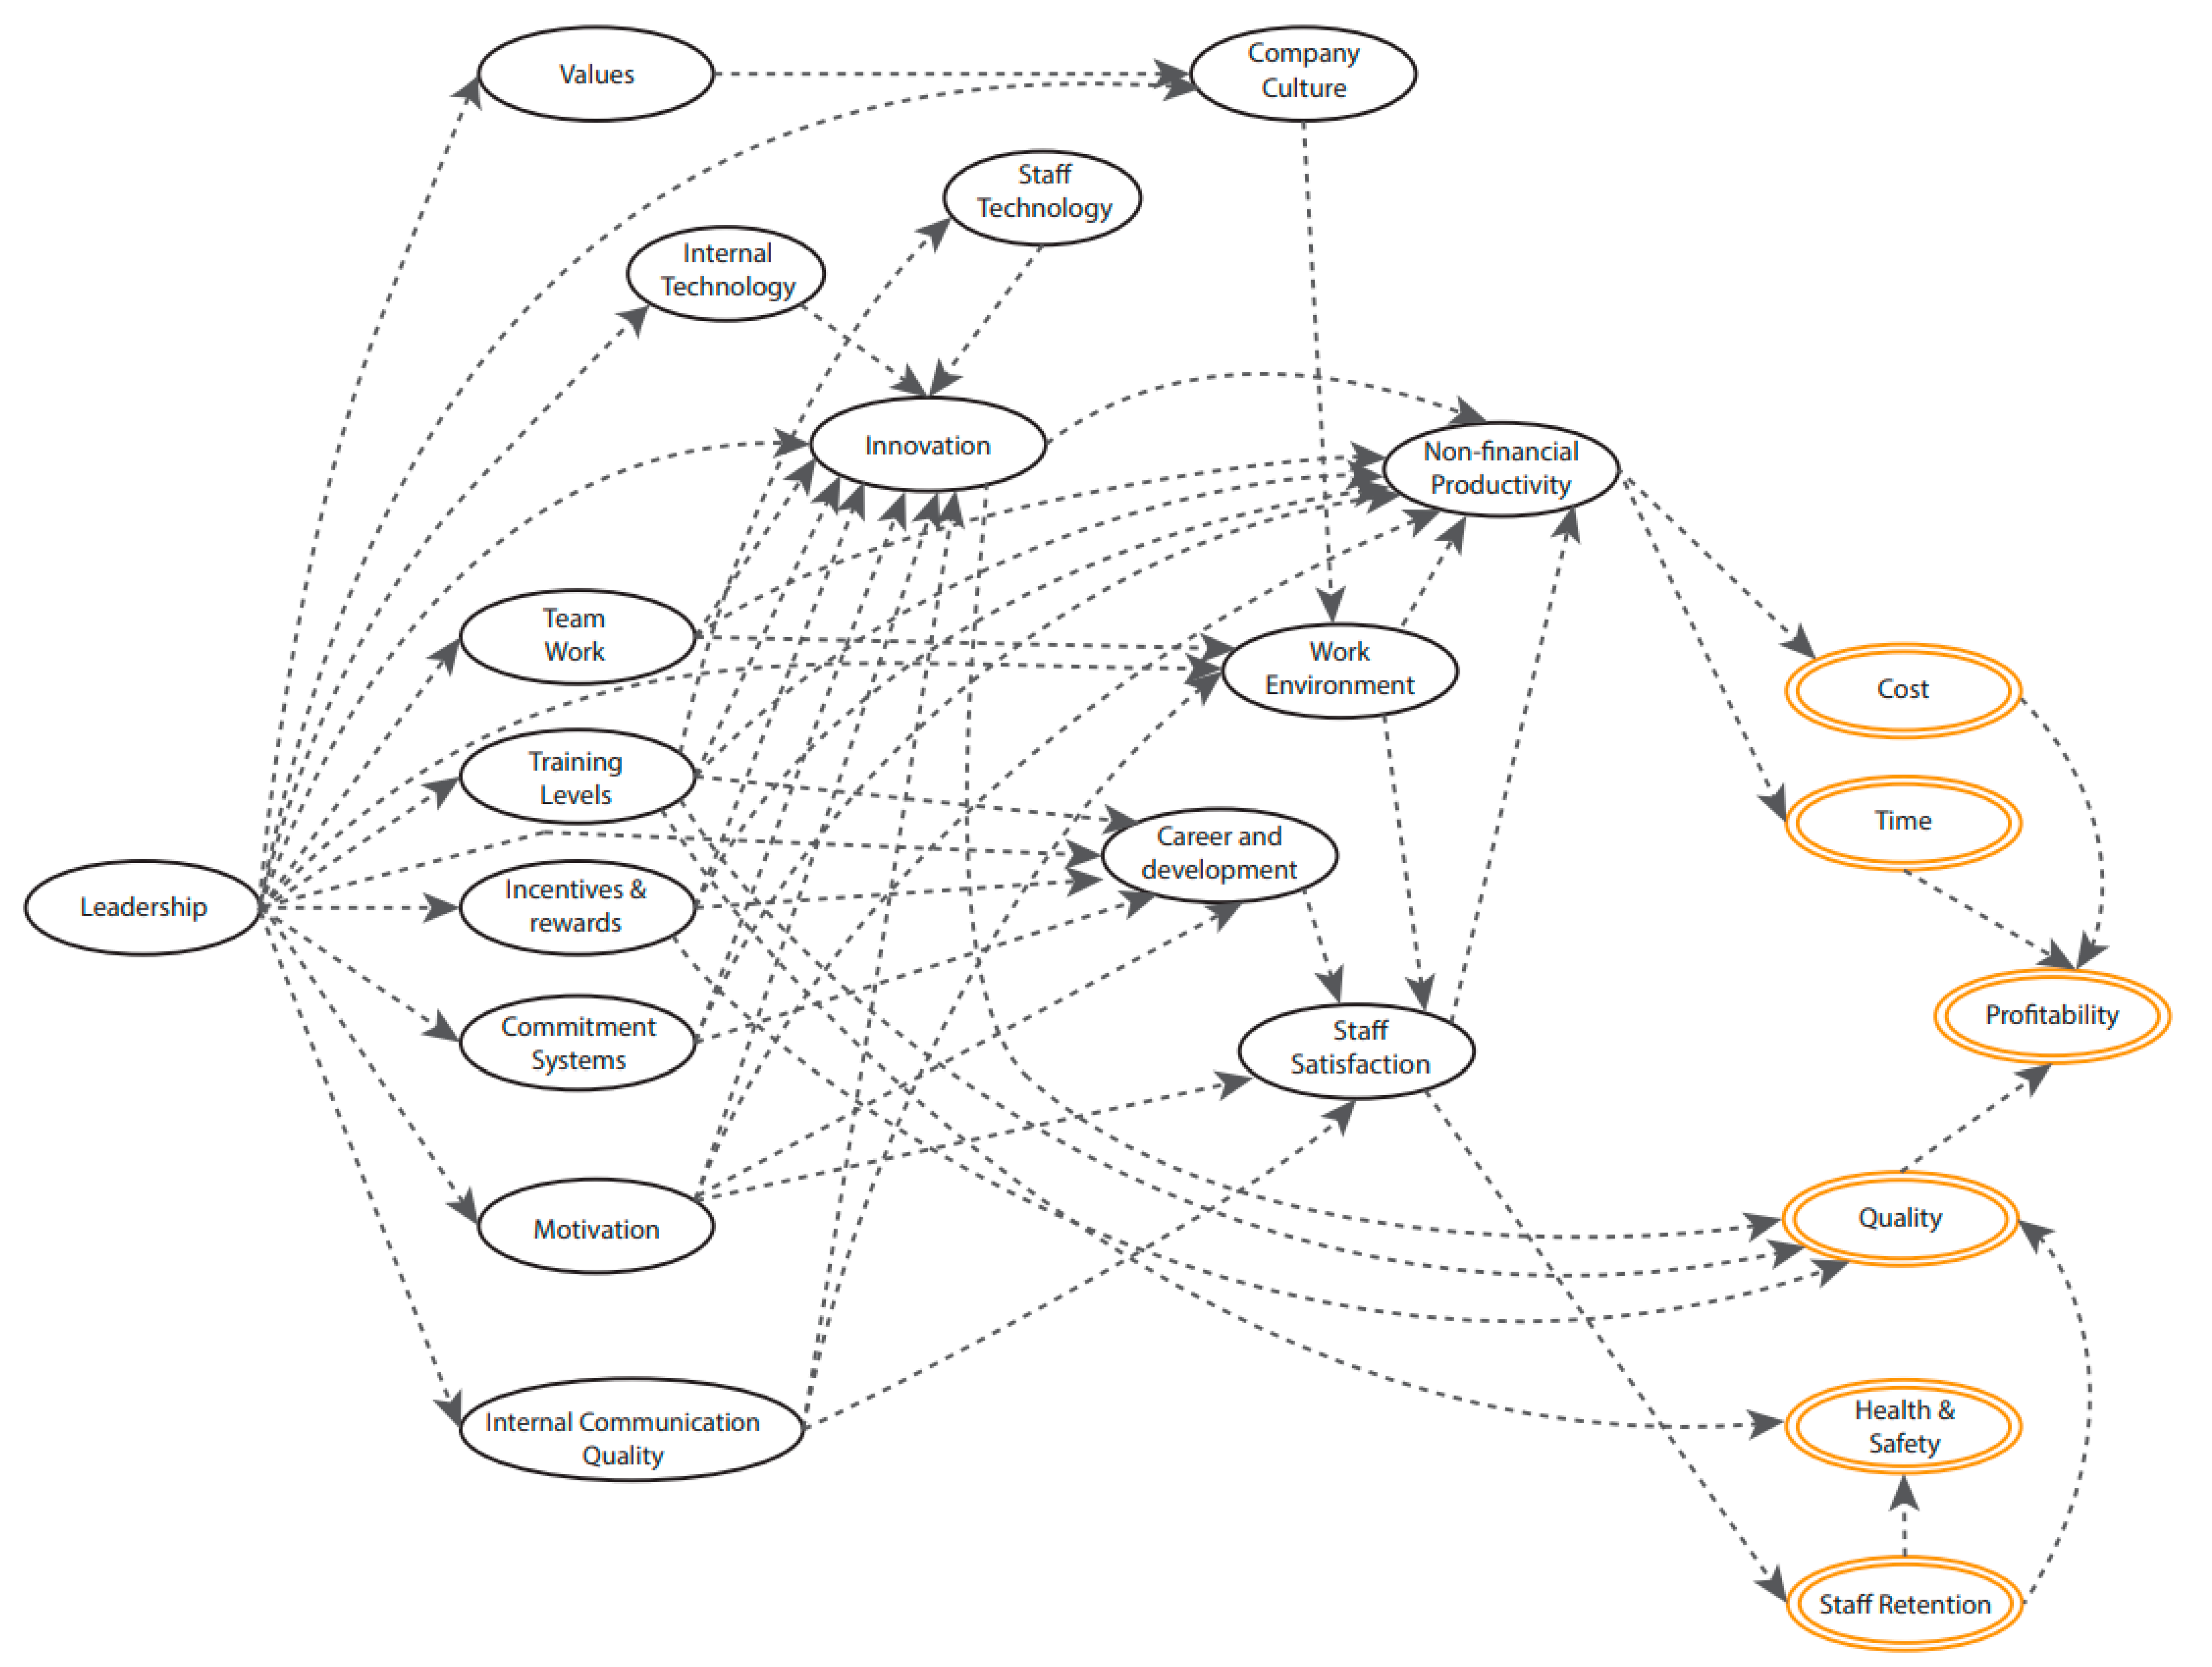
Managers and directors of construction companies can use the proposed model as follows: the model shows the interrelation of variables, as well as the force and impact that certain variables have on others; the model’s main benefit is as a source of understanding and decision-making for HR and its relationship with competitiveness [95,96].
Finally, PLS models are characterized by several advantages whose attributes are summarized in Table 4.

3.3. Proposed Model

The proposed model, shown in Figure 3, seeks to understand the interrelation of variables that intervene in HR and are determinants of competitiveness. Many of these interrelations are based on the literature, while others are hypothetical. It is important to mention that this is a confirmatory model, meaning it will only confirm if the parameters are within the general evaluation criteria.
As can be seen in the proposed model in Figure 3, leadership is the main driving factor. Authors like Orozco [14] and Wilson & Collier [97], referring to models from Malcolm Baldrige and the European Foundation for Quality Management [98], suggest that leadership is the main factor that drives other decisive factors within the company. However, these models consider aspects such as financial index, sales, productivity, management strategy, technological and technical effects, as well as the market, etc.; the present investigation differs in its pure approach to HR to competitiveness.
Some variables are highly interrelated with others, such as innovation, which is affected by a large number of factors, internal communication, motivation systems, training levels, and teamwork, among others.
Another interrelationship example could be staff motivation, which is directly impacted by training levels, incentives, rewards, internal communication, and commitment systems, among others. This, in turn, has a direct impact on delivery times, costs, profitability, quality, health and safety, as well as the retention of personnel, and thus contributes to companies’ level of competitiveness.
The model is useful to explain the degree of interrelation between the HR variables and the competitiveness indicators and to try to validate if the proposed model explains, to a certain extent, the relationship between these variables. Knowing the degree of variables’ interrelation, as well as their statistical significance, a director or manager can guide decisions and consider certain elements within corporate strategy.
HR is one of the most complex departments when it comes to measuring and determining its level of importance [99]. The variables within this model seek to provide decision-makers with a validated proposal on how these variables relate to a company’s results and, ultimately, its competitiveness to guide a company strategy based on it.
HR factors will be measured to determine the degree of the interrelationship between them and other factors. As seen in Figure 3, HR variables are expressed in one simple ellipse, while the competitiveness variables are represented with a double ellipse, and interrelationships between variables are represented with a dashed arrow.
Once the bibliographic review was carried out, the 22 variables that would make up the model were defined, and these were validated both by the literature and by the leading experts and managers of the construction industry. The 22 variables shown in Table 2 were established, and these were required to be validated by a panel of experts, consisting of architects, engineers and construction managers working at executive-level positions.
Variables of the proposed model, as mentioned above in the Literature Review, are obtained from the list of authors concerning HR and competitiveness in the construction industry.
Table 5 shows the abbreviations of variables correlated in the PLS model. These variables are extracted from the literature and represent the most important factors related to HR that impact competitiveness in the construction industry.
To collect the required data, a questionnaire was developed to measure the 22 HR and competitiveness factors or latent variables, while each of these variables was measured through their manifest variables. The review of the variables was carried out through a questionnaire applied to a panel of experts made up mainly of directors, managers, leaders, and owners of construction companies in Mexico with knowledge of internal HR, as well as its vision, mission, and objectives. Through this review, the parameters and variables shown in the model were analyzed and refined so that could be validated, corrected, or deleted.
The selected construction companies were medium to large, depending on the number of workers. This is because medium and large-size companies know their objectives, mission, and vision since they have a greater organizational structure.
Once the variables that make up the model were obtained, the measurement instrument was developed to collect the information on the manifest variables that will make up and measure the latent variables or factors. The instrument chosen was a questionnaire since it can be used to ask questions about one or more variables. Krosnick [100] suggests using questionnaires in studies where it is necessary to generalize the results. For the investigation, the instrument used was a structured questionnaire with 79 questions: 76 closed questions and three open ones.
The questionnaire was grouped by areas, depending on the variable to be measured, e.g., Leadership (LEAD), Motivation (MOT), Staff Satisfaction (SSAT), Productivity (PRODU), and the rest of the 22 variables. Additionally, a section of three open questions was included to obtain opinions about the HR barriers to competitiveness in the construction industry and its limitations within corporate strategies.

4. Analysis of Results

4.1. Measurement Model

The measurement model, also known as the external model, mainly characterizes the relationships between each latent variable and the corresponding manifest variables. Its formulation depends on the direction of these relationships, that is, the direction of the paths. Thus, it can be seen as three types of measurement models: reflective, formative model, and MIMIC, which refers to a combination of the reflective and formative models [101]. To validate the measurement model and confirm that the variables are being measured correctly, tools such as unidimensionality, communality, and cross-loadings are used.
Communality serves to corroborate that latent variables are well explained by their manifest variables, while loads serve to explain the close relationship between variables [101]. E.g., if a communality of 0.3025 is obtained, this means that only 30% of the manifest variable’s variance is related to the latent variable. The most accepted empirical rule is to accept a manifest variable as a member of a latent variable, it must have a load equal to or greater than 0.7 [102,103].
Thus, communalities greater than 0.7 are included and deemed acceptable because they represent 0.7 2 50 % of the common variability between a manifest variable and its latent variable. When a variable displays a lower communality value, it can be eliminated from the model [90].
To evaluate and analyze the degree to which a latent variable is different from others, cross loads are used. They represent the manifest variable loads as compared to the rest of the latent variables other than the one associated with it. This usually helps understand if the manifest variable is associated with its latent variable or with another. When the load is greater with another variable (different from the already associated one), it becomes necessary to consider whether they are well associated in the model [89,94,104].
Loads ( λ p q ) refer to correlations between a latent variable and its manifest variable(s), and are expressed with Equation (1):
λ p q = c o r ( ξ q , x p q )
In a PLS model, the variables’ reliability is assessed by examining the loads, or simple correlations, of the measures or indicators with their respective latent variable.

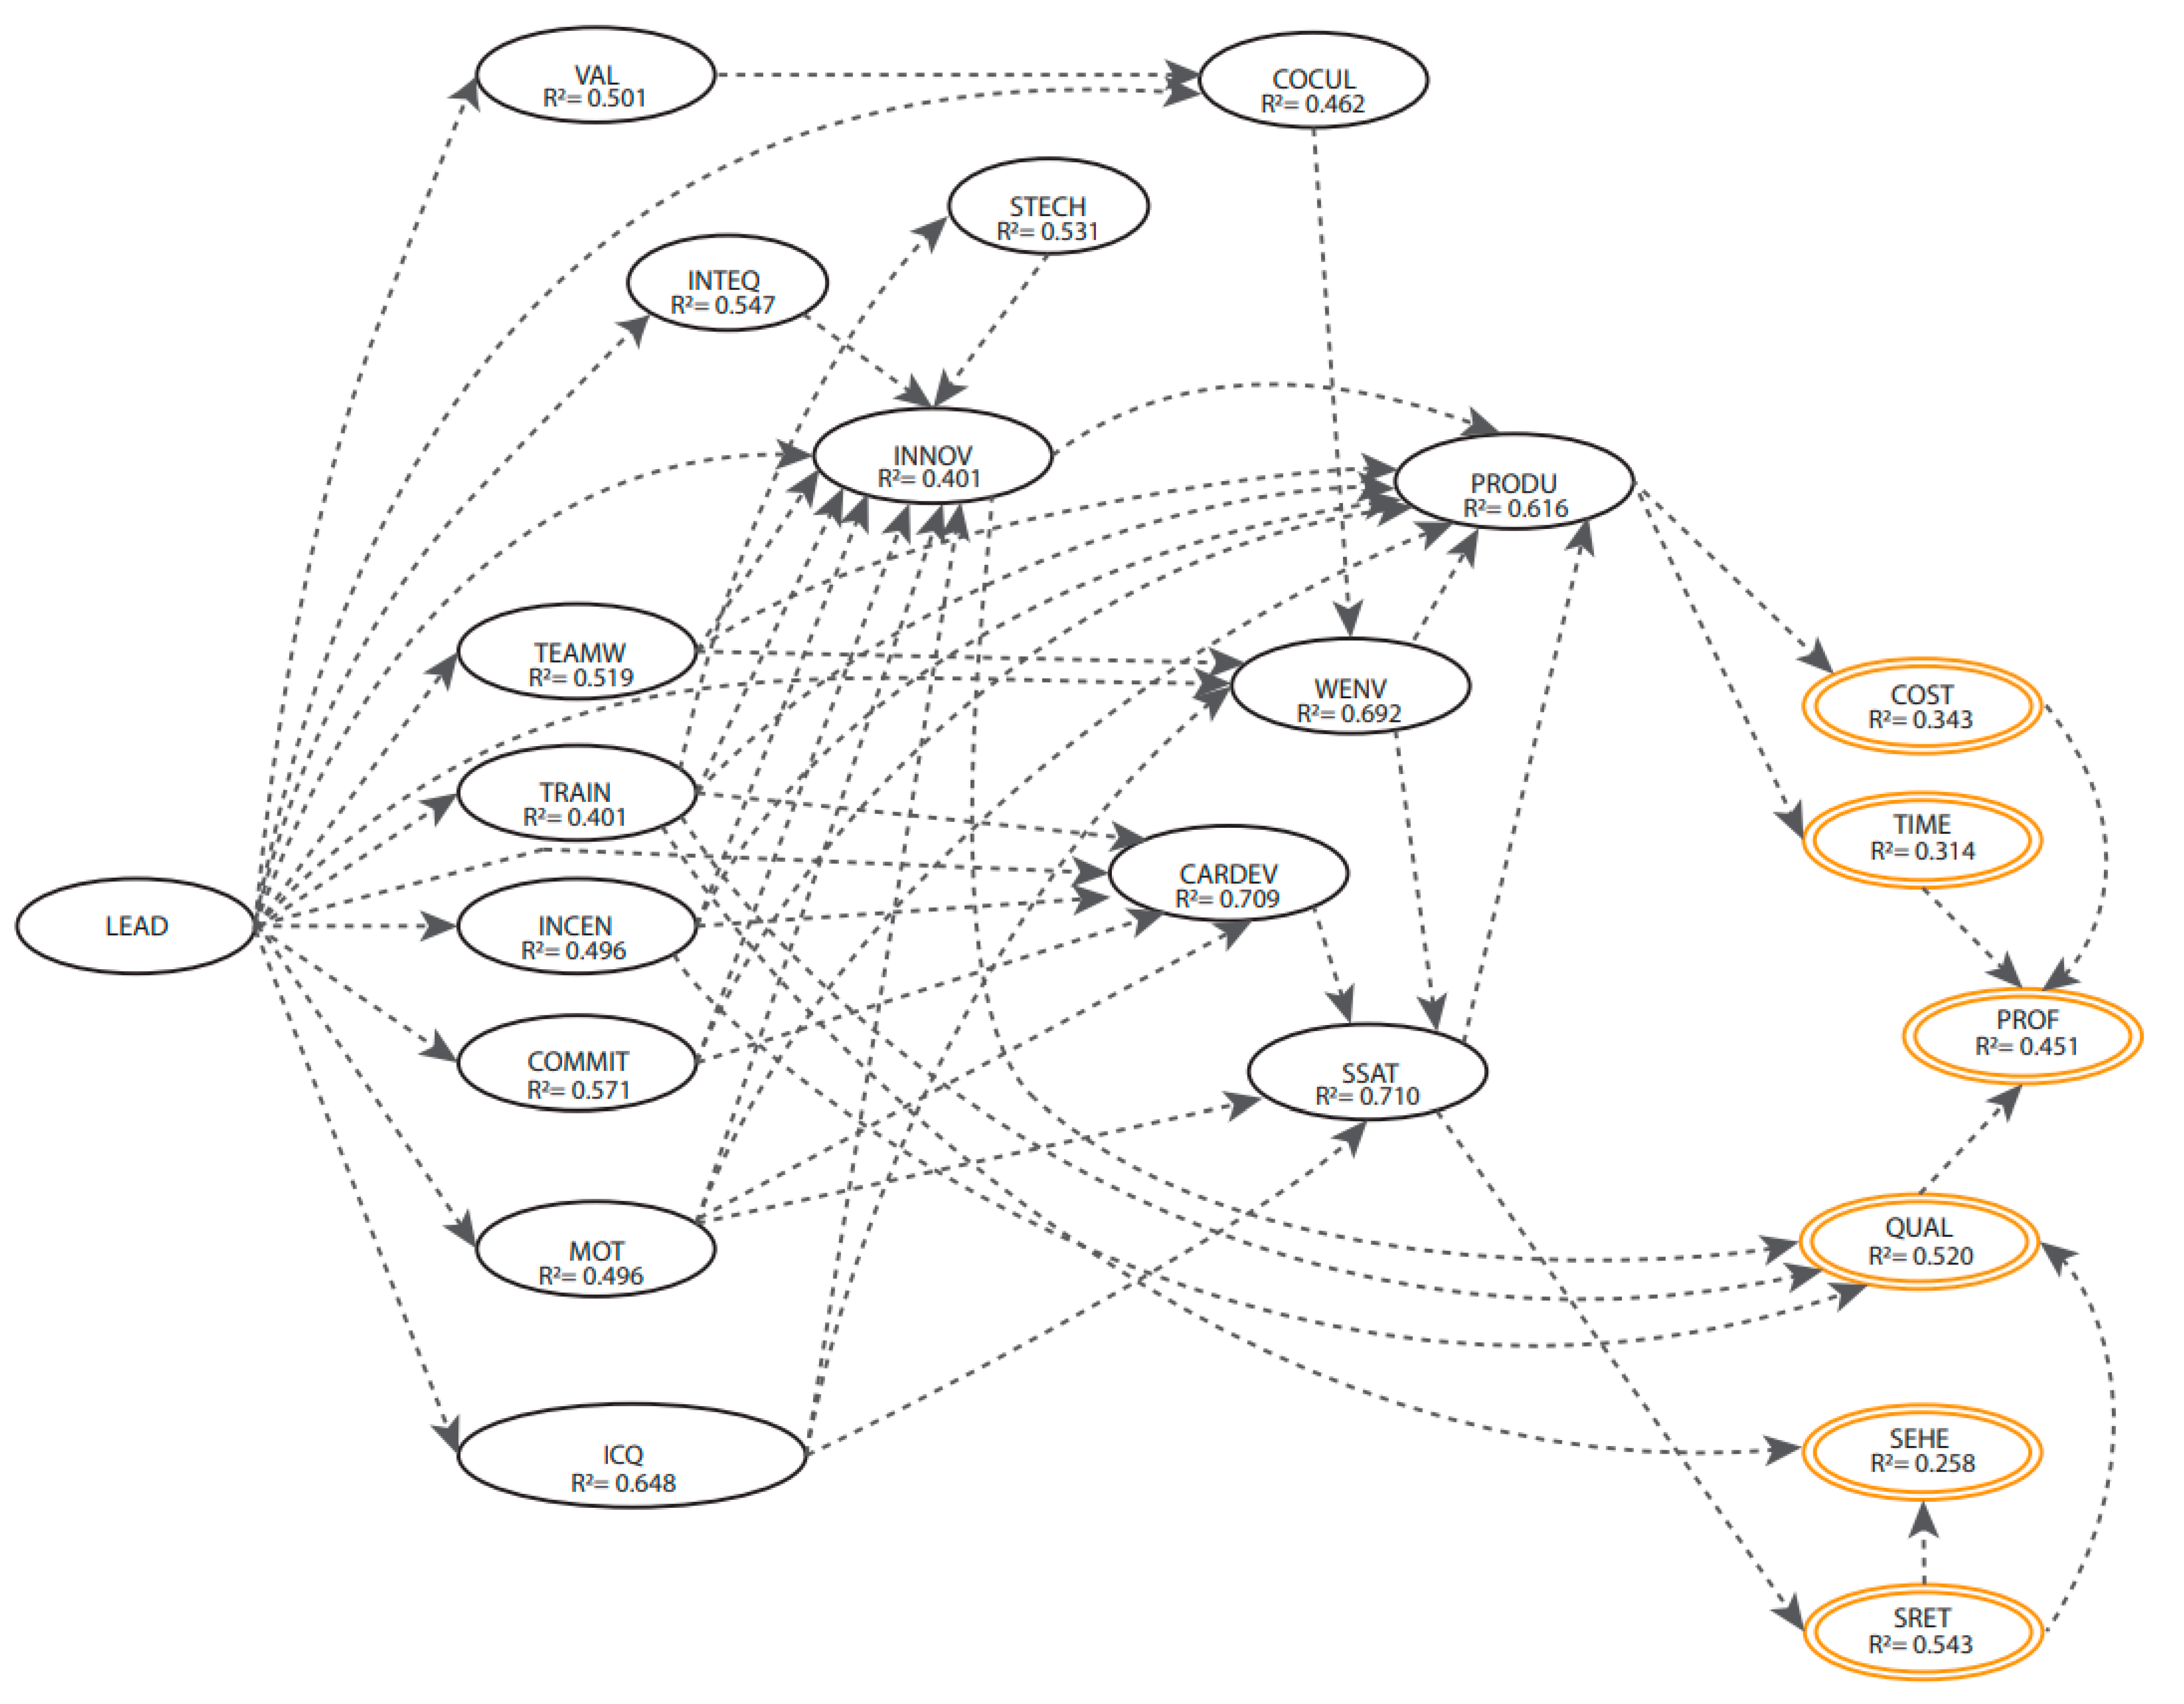
4.2. Structural Model

Having evaluated the quality of the measurement model, we proceed to evaluate the quality of the structural model, studying the results obtained in each regression of the equation structure. The quality of the structural model can be measured based on two indices: determination coefficient R 2 and the redundancy index [101].
According to the structure involved in the PLS model, a series of measurements and hypotheses are evaluated to validate each of the model’s parts; the measurement model, the structural model, and the complete model must be verified.
The coefficient of determination R 2 only applies to endogenous latent variables or dependents. The coefficient of determination R 2 measures the amount of variance in the endogenous latent variable explained by its independent latent variables through the proposed model. A value of 0.6 is considered acceptable, although it should be noted that this coefficient is not enough to evaluate the complete model since it only considers the adjustment of each regression equation in the structural model [94].
R 2 is calculated with Equation (2) [101]:
R 2 ¯ = 1 J R 2 ( ξ ^ j , ξ ^ q : ξ q ξ j )
As we can see in Table 6 and Figure 4, all factors meet the R 2 criterion, which mentions that a value above 0 indicates that the predictability of the model is relevant, which is a predictive measure in the model. for dependent latent variables, this measure indicates the amount of construct variance that is explained by the model. The explained variance of the variables must be greater than or equal to 0.1; less than 0.1 means that the variables provide or have little information to the model having a low predictive level [90,105]. As can be seen, the model has an acceptable R 2 .
AVE is a measure used to assess the degree to which a set of indicators (or items) measures a latent construct. According to Fornell and Larcker [106] and Duarte and Raposo [107], the recommended cutoff for AVE is 0.50 or higher, which indicates that more than 50% of the variance of the construct is explained by its indicators. In other words, the AVE value represents the average amount of variance that each indicator shares with the other indicators in the same construct.
However, it is important to note that AVE can only be applied to externally directed blocks, which means that the indicators should be related based on a theoretical rationale. If the indicators are not related to each other, AVE cannot be computed.
In the context of Table 6, all the variables meet the AVE evaluation criteria except for the SEHE variable, which does not meet the cutoff of 0.50. This may indicate that the indicators of the SEHE variable are not strongly related to each other, or that they may not be measuring the same latent construct. Further analysis and interpretation are needed to understand the reasons behind the low AVE value of the SEHE variable.
In a PLS analysis, adequate discriminant validity is established when a latent variable shares more variance with its measurements or indicators than with another latent variable in a determined model [104]. To assess the discriminate validity, the use of the average variance extracted (AVE) is recommended, that is, the mean variance shared between a construct and its measures [106,108]. This measurement should be greater than the variance shared between the construct with the model’s other constructs (the squared correlation between two constructs). As an acceptable indicator, the AVE must be greater than 0.5; as can be seen in Table 6, most of the HR variables have an AVE greater than 0.5 [107]. Health and Safety (SEHE) alone did not meet the qualifications of this measure.
The PLS model results obtained from this analysis can be seen in Figure 5. Variables such as Leadership (LEAD) are highly related to other variables such as Values (VAL) and Company Culture (COCUL), while variables such as Staff Satisfaction (SSAT) are highly related to Staff Retention (SRET).
However, there are also important variables that lack a relevant direct relationship, such as Training (TRAIN) to Productivity (PRODU), as well as Commitment (COMMIT) to Productivity (PRODU). The model also presents the p-value, which reflects the variables’ statistical reliability; that is, the smaller the value, the higher its statistical significance: *** p < 0.01, ** p < 0.05, * p < 0.1, ^ p < 0.15 as seen in Figure 5.
The structural model represents the correlation between the latent variables that are hypothesized in the proposed model. Barroso et al. [90] mention that the PLS model lacks a well-identified global optimization criterion, so there is no truly global adjustment function to assess the model’s Goodness of Fit. Furthermore, it is a variance-based model aimed at making predictions. Therefore, the validation of the model mainly focuses on its predictive capacity.
The PLS model is analyzed according to various factors. One of these is the Goodness of Fit index (GoF), which, although there is no general rule for an optimal number, the higher, the better. Tenenhaus et al. [109] proposed a global criterion to evaluate the model in a general way when PLS is applied; the GoF index considers the structural model and measurement and provides a single value for the model’s overall quality.
The GoF index is obtained as the geometric mean of the communality mean index and the mean R 2 , as expressed by Equation (3):
G o F = C o m ¯ × R 2 ¯
The GoF index is represented as the model’s percentage of validity [94]. The present PLS model has a Goodness of Fit of 63%. Other authors who have applied the PLS method have obtained a GoF percentage similar to the one obtained in the present research, such as Orozco [14] in his model of Competitiveness in the Construction Industry in Chile. It is also, similar to, and even greater than, the GoF obtained by Duarte & Raposo [107] in their telephone market analysis study.
The GoF obtained here is considered acceptable based on the previous criterion, meaning that the model works in general and responds statistically in an acceptable way, with the correct measurement of both its latent and manifest variables.
Specifically, the statement indicates that the results included in Figure 5 are those that have a p-value less than 0.1 (i.e., p < 0.1) or are marginally significant with a p-value between 0.1 and 0.15 (i.e., 0.1 < p < 0.15), and have a total effect greater than 0.15. The smaller the p-value, the stronger the evidence for the sample to reject the null hypothesis, and it could be rejected [98]. Although there were p-values above 0.15, it was decided to keep them in the model because of the exploratory nature of the present study.
In the PLS model, there are three indices for checking unidimensionality: Cronbach’s alpha, Dillon-Goldstein’s rho, and the first eigenvalue of the manifest variables’ correlation matrix.
Table 7 shows the indices obtained for each latent variable; the type of measurement appears in the first column, the number of manifest variables associated with each latent variable in the second, Cronbach’s alpha appears in the third, while the fourth includes the Dillon-Goldstein rho and the fifth and sixth columns display the first and second eigenvalues of the manifest variables’ correlation matrix, respectively. As a general rule, both Cronbach’s alpha and the Dillon-Goldstein index have to be greater than 0.7 to be considered unidimensional [94].
As can be seen in Table 7, the lowest factor is Health and Safety (SEHE), with a C. alpha of 0.665. On the other hand, values above 0.7 for the Dillon-Goldstein’s rho and Cronbach Alpha tests are acceptable; as the table demonstrates, most have high acceptable levels.
Table 8 reveals another important result. It contains the effects each latent variable has on the rest, considering the total number of connections in the internal model. The direct effects are given by the path coefficients; however, there are also indirect effects and total effects.
An indirect effect is the influence of one latent variable on another through an indirect path and is obtained by multiplying the path coefficients of the two indirectly connected variables with the intermediate variable that allows for said connection. Total effects are the sum of the direct and indirect effects.

5. Discussion and Implications

Analyzing Table 6, the main variables with an outstanding total effect can be highlighted, such as Leadership (LEAD) with both direct and indirect relevant effects on various variables, Career Development (CARDEV), Values (VAL), Internal Communication Quality (ICQ), Company Culture (COCUL), Teamwork (TEAMW), Staff Satisfaction (SSAT), Motivation (MOT), Innovation (INNOV), Productivity (PRODUCT), Training (TRAIN), Incentives and Rewards (INCEN), Internal Technology (INTEQ), Commitment (COMMIT), Quality (QUAL), Staff Retention (SRET), Time (TIME), Costs (COST), among others. This means that leadership is the most important variable in the interrelation, which supports various previously mentioned theories that see leadership as a driving source of competitiveness.
Innovation (INNOV) is also one of the variables with the highest impact rates and impacts variables such as Staff Technology (STECH), Commitment (COMMIT), Internal Technology (INTEQ), Quality (QUAL), Internal Communication Quality (ICQ), Productivity (PRODU), Work Environment (WENV), Motivation (MOT), Teamwork (TEAMW), Training (TRAIN), Profitability (PROF), and Staff Satisfaction (SSAT). This is possible because innovation currently plays an important role in generating competitiveness among construction sector companies. Productivity (PRODU) has an elevated total effect on variables such as Cost (COST) and Time (TIME), which makes sense because having a high productivity index is reflected in a project’s cost and execution time. In this way, it can be concluded that the Leadership (LEAD), Innovation (INNOV), and Productivity (PRODU) variables have the most elevated total effect on other HR variables and competitiveness in the construction sector.
The R 2 coefficient can be interpreted as the amount of variance that exists between the variables and that is explained by the model. Particularly in this study, despite the complexity of building the model with 22 interrelated variables, an acceptable R 2 was obtained in all the variables.

5.1. Lessons Learned

This research’s main objective lies in understanding the impact of each HR variable, especially its impact on the variables associated with competitiveness. Knowing which variables have a relevant statistical and direct effect allows managers to reflect on the importance of these variables, as well as discard others that are not relevant, and thus modify and improve upon their indices depending on the strategies in place. Figure 5 of the PLS model highlights that leadership (LEAD) has a significant total effect on several variables, which supports theories that sustain leadership as one of the most important factors in generating competitiveness, including the models proposed by Orozco et al. [14], EFQM [98] and Wilson & Collier [97], which underline leadership as a factor that drives competitiveness in a company. However, there are variables strongly related to competitiveness that can have a significant impact on its variables.
On the other hand, directors and managers accept that there is an area of opportunity for HR concerning competitiveness, and there is a need to investigate this topic more and more to integrate it into corporate strategies.

5.2. Implications for Practitioners

The main suggestions fall on decision-making within a construction company, considering HR as a relevant factor within the organizational structure and internal policies can lead to HR as a unique and distinctive element as a competitive advantage within a company. As mentioned in previous chapters, HR is a unique factor that is difficult to imitate, it cannot be copied, giving companies differentiation when competing. On the other hand, the promotion of HR can help staff to have better productivity and performance by concentrating efforts to improve motivation, training, staff development, and satisfaction; employees will have a better work culture and will be able to improve their internal competitiveness.

6. Conclusions

As stated in the research questions, relationships were found between the HR variables and competitiveness in a construction company. The PLS model serves to explain these relationships.
Leadership is the variable that shows high relevance and statistical significance. Leadership in the construction industry can be seen as a significant competitive advantage, Orozco et al. [14] argue that it has the greatest impact on the competitiveness of construction organizations, followed by contract management and health and safety management. Azeem et al. [110] add that the competitiveness of a construction company is difficult to measure and understand, which is why it is important to create strategies to measure and evaluate it. Competitiveness has become a prominent term over the past three decades, and its meaning continues to be the subject of research.
The proposed PLS model has acceptable indices; despite having a large number of interrelated variables and the complexity of the data, the model exceeds the evaluation criteria that the authors established in the measurement and structural models. The results of this analysis and the use of the PLS method are apt for guiding decision-making in strategic HR planning for a construction company, helping managers and directors reflect on and guide their efforts toward the HR factors that most contribute to the variables of competitiveness. However, it should be noted that the results of a company can also determine the level of the factors, (e.g., the level of profitability can determine the level of investment in internal technology, access to training, and innovation, and that can improve its administrative procedures.
HR contains factors that are difficult to imitate from company to company, e.g., values, which cannot be copied or distributed, but rather become implicit in workers and contribute to, as well as impact factors such as teamwork, commitment to the company, motivation, etc. In this sense, Dabirian et al. [111] emphasize that the success of projects is correlated with good HR management. They add that correctly selecting talent for a project is decisive for its successful conclusion and suitable performance, with considerable impact on cost and execution time.
Because of these factors, HR is a complex topic to study and a possible source of competitive advantage. There is still much to explore regarding the impact of HR on construction companies’ competitiveness, as well as on their corporate strategies. Due to this complexity, skills, stress management, training, and clarity of procedures, can have a significant impact on the success of the project [112]. Finally, Hwang B. et al. [113] add that the new trends in construction management see the adaptability of the worker to the training to adopt these changes as the main challenge; the importance of HR in the construction industry is increasingly important.
Regarding future lines of research within HR, it is important to continue with research on the relationship between HR and competitiveness, as well as to delve into the leadership profile that has the most impact on the construction industry. Other important topics include how to encourage innovation in the industry through HR, and measuring the impact of variables that are difficult to observe, such as motivation, satisfaction, and values, on the generation of productivity.
It’s important to acknowledge the limitations of any research methodology, including PLS. As the reviewer mentioned, one of the main limitations of PLS is the complexity of interrelationships. As the number of variables and latent variables in a model increases, the statistical efficiency of PLS decreases, which can introduce bias and affect the final results. It’s essential to consider this limitation when interpreting the results of the study.
Another limitation of this study is that it mainly explores the interrelationships between factors and does not delve into the causal relationship between HR and competitiveness. This study presents an explanation of the perception of the construction industry based on the experience of directors and managers. Moreover, HR management practices in the construction industry may differ depending on the size of the company, investment allocation, and the vision and mission of each firm, which can also affect the results.
However, despite these limitations, the study recognizes the need to investigate the relationship between HR and competitiveness and highlights the importance of HR in enhancing competitiveness in the construction industry. Finally, as a future research line, new studies should include the perspective coming from other stakeholders within the construction industry, such as designers and owners, along with developing more specific models focused on particular areas within the construction industry.

Author Contributions

Conceptualization, R.R. and F.O.; methodology, R.R., F.O. and E.F.; software, R.R. and F.M.; validation, F.O., E.F. and F.M.; formal analysis, R.R. and F.M.; investigation, R.R., F.O. and E.F.; resources, R.R. and F.O.; data curation, R.R. and F.M.; writing—original draft preparation, R.R., F.O. and E.F.; writing—review and editing, R.R., F.O. and E.F.; visualization, R.R. and F.M.; supervision, F.O. and E.F.; project administration, R.R. and F.O.; funding acquisition, R.R. and F.O. All authors have read and agreed to the published version of the manuscript.

Funding

This research received no external funding.

Institutional Review Board Statement

Not applicable.

Informed Consent Statement

Not applicable.

Data Availability Statement

The data presented in this study are available on request from the corresponding author.

Acknowledgments

The authors would like to acknowledge the support provided by the Universidad Panamericana, Mexico, and the Universidad del Bío-Bío, Chile.

Conflicts of Interest

The authors declare no conflict of interest.

References

  1. Deng, F.; Liu, G.; Jin, Z. Factors Formulating the Competitiveness of the Chinese Construction Industry: Empirical Investigation. J. Manag. Eng. 2013, 29, 435–445. [Google Scholar] [CrossRef]
  2. Pellicer, E.; Yepes, V.; Rojas, R.J. Innovation and Competitiveness in Construction Companies: A Case Study. J. Manag. Res. 2010, 10, 103–115. [Google Scholar]
  3. Lielgaidina, L.; Geipele, I. Theoretical Aspects of Competitiveness in Construction Enterprises’. Bus. Manag. Educ. 2011, 9, 67–80. [Google Scholar] [CrossRef]
  4. Berisha Qehaja, A.; Kutllovci, E. The Role of Human Resources in Gaining Competitive Advantage. J. Hum. Resour. Manag. 2015, 18, 47–61. [Google Scholar]
  5. Man, M.M.K. Human Resource Development Requirements in Industrial Revolution 4.0. In Contemporary Global Issues in Human Resource Management; Emerald Publishing Limited: Bingley, UK, 2020; pp. 129–139. [Google Scholar]
  6. Lin, K.-L. Human Resource Allocation for Remote Construction Projects. J. Manag. Eng. 2011, 27, 13–20. [Google Scholar] [CrossRef]
  7. van Heerden, A.; Jelodar, M.B.; Chawynski, G.; Ellison, S. A Study of the Soft Skills Possessed and Required in the Construction Sector. Buildings 2023, 13, 522. [Google Scholar] [CrossRef]
  8. Taris, G.N.; Wandebori, H. Proposed Business Strategy to Gain a Competitive Advantage for Construction Consultant Company. Int. J. Curr. Sci. Res. Rev. 2023, 6, 238–244. [Google Scholar] [CrossRef]
  9. Brandenburg, S.G.; Haas, C.T.; Byrom, K. Strategic Management of Human Resources in Construction. J. Manag. Eng. 2006, 22, 89–96. [Google Scholar] [CrossRef] [Green Version]
  10. Gabcanova, I. Human Resources Key Performance Indicators. J. Compet. 2012, 4, 117–128. [Google Scholar] [CrossRef] [Green Version]
  11. Duffy, V.G. Handbook of Digital Human Modeling; CRC Press: Boca Raton, FL, USA, 2016; ISBN 9780429164002. [Google Scholar]
  12. Alaiwi, Z.K.; Khalfan, M.M.A.; Sagoo, A.; Georgy, M. Towards Improving the Planning and Scheduling of Construction Projects in the UAE: A Review of the Human Factor “Towards Improving the Planning and Scheduling of Construction Projects in the UAE: A Review of the Human Factor”. Int. J. Bus. Compet. Growth 2017, 6, 28–46. [Google Scholar] [CrossRef]
  13. Anitha, J. Determinants of Employee Engagement and Their Impact on Employee Performance. Int. J. Product. Perform. Manag. 2014, 63, 308–323. [Google Scholar] [CrossRef]
  14. Orozco, F.A.; Serpell, A.F.; Molenaar, K.R.; Forcael, E. Modeling Competitiveness Factors and Indexes for Construction Companies: Findings of Chile. J. Constr. Eng. Manag. 2014, 140, B4013002. [Google Scholar] [CrossRef]
  15. Flanagan, R.; Lu, W.; Shen, L.; Jewell, C. Competitiveness in Construction: A Critical Review of Research. Constr. Manag. Econ. 2007, 25, 989–1000. [Google Scholar] [CrossRef]
  16. Li, S.; Li, C.Z.; Xiong, M.; Zhen, Y.; Guo, Z. Performance of Prefabricated Construction: A Critical Review From 2010 to 2020; Springer: Singapore, 2022; pp. 1013–1027. [Google Scholar]
  17. Bhawsar, P.; Chattopadhyay, U. Competitiveness: Review, Reflections and Directions. Glob. Bus. Rev. 2015, 16, 665–679. [Google Scholar] [CrossRef]
  18. Ho, P.H.K. Analysis of Competitive Environments, Business Strategies, and Performance in Hong Kong’s Construction Industry. J. Manag. Eng. 2016, 32, 04015044. [Google Scholar] [CrossRef]
  19. Vanags, J.; Geipele, I. System of the Assessment Indicators of the Competitiveness of the Construction Industry. Sci. J. Riga Tech. Univ. 2009, 11, 62–76. [Google Scholar]
  20. Forcael, E.; Morales, H.; Agdas, D.; Rodríguez, C.; León, C. Risk Identification in the Chilean Tunneling Industry. Eng. Manag. J. 2018, 30, 203–215. [Google Scholar] [CrossRef] [Green Version]
  21. Duy Nguyen, L.; Ogunlana, S.O.; Thi Xuan Lan, D. A Study on Project Success Factors in Large Construction Projects in Vietnam. Eng. Constr. Archit. Manag. 2004, 11, 404–413. [Google Scholar] [CrossRef]
  22. Flanagan, R.; Jewell, C.; Ericsson, S.; Henricsson, P. Measuring Construction Competitiveness in Selected Countries; Final Report; School of Construction Management and Engineering, University of Reading: Reading, UK, 2005. [Google Scholar]
  23. Mohamed, H.A.E.; Eltohamy, A.I. Critical Success Factors for Competitiveness of Egyptian Construction Companies. Sustainability 2022, 14, 10460. [Google Scholar] [CrossRef]
  24. Porter, M.E. Competitive Advantage. Creating and Sustaining Superior Performance. In Creating and Sustaining Competitive Advantage: Management Logics, Business Models, and Entrepreneurial Rent; The Free Press: New York, NY, USA, 1985. [Google Scholar]
  25. Chen, S.; Lin, N. Culture, Productivity and Competitiveness: Disentangling the Concepts. Cross Cult. Strateg. Manag. 2020, 28, 52–75. [Google Scholar] [CrossRef]
  26. Dwyer, L.; Kim, C.W. Destination Competitiveness: Development of a Model with Application to Australia and the Republic of Korea; Department of Industry Science and Resources: Canberra, Australia, 2001.
  27. Buckley, P.J.; Pass, C.L.; Prescott, K. Measures of International Competitiveness: A Critical Survey. J. Mark. Manag. 1988, 4, 175–200. [Google Scholar] [CrossRef]
  28. Dunning, J.H.; Zhang, F. Foreign Direct Investment and the Locational Competitiveness of Countries. In New Challenges for International Business Research; Edward Elgar Publishing: Cheltenham, UK, 2008; Volume 17, pp. 1–30. [Google Scholar]
  29. Porter, M.E. Book Review: The Competitive Advantage of Nations. J Intern. Am. Stud. World Aff. 1990, 32, 247–257. [Google Scholar] [CrossRef]
  30. Eriksson, K.; Johanson, J.; Majkgård, A.; Sharma, D.D. Experiential Knowledge and Cost in the Internationalization Process. In Knowledge, Networks and Power; Palgrave Macmillan UK: London, UK, 2015; pp. 41–63. [Google Scholar]
  31. Luo, Y.; Xue, Q.; Han, B. How Emerging Market Governments Promote Outward FDI: Experience from China. J. World Bus. 2010, 45, 68–79. [Google Scholar] [CrossRef]
  32. Han, J.; Park, H.; Ock, J.; Jang, H. An International Competitiveness Evaluation Model in the Global Construction Industry. KSCE J. Civ. Eng. 2015, 19, 465–477. [Google Scholar] [CrossRef]
  33. Pheng Low, S.; Gao, S.; Lin Tay, W. Comparative Study of Project Management and Critical Success Factors of Greening New and Existing Buildings in Singapore. Struct. Surv. 2014, 32, 413–433. [Google Scholar] [CrossRef]
  34. Jin, Z.; Deng, F.; Li, H.; Skitmore, M. Practical Framework for Measuring Performance of International Construction Firms. J. Constr. Eng. Manag. 2013, 139, 1154–1167. [Google Scholar] [CrossRef] [Green Version]
  35. Komarkova, L.; Pirozek, P.; Pudil, P. The Factors and Other Characteristics Influencing Competitiveness of Enterprises in Countries in the Post-Transition Phase of the Economy. Eng. Econ. 2014, 25, 513–521. [Google Scholar] [CrossRef] [Green Version]
  36. Zainul Abidin, N.; Adros, N.A.; Hassan, H. Competitive Strategy and Performance of Quantity Surveying Firms in Malaysia. J. Constr. Dev. Ctries. 2014, 19, 15. [Google Scholar]
  37. Omran, A.; Hussin, A.A. Determining the Key Competitiveness Indicators for Local Construction Contractors in the Libyan Construction Industry. J. Acad. Res. Econ. 2015, 7, 201–210. [Google Scholar]
  38. Rathnayake, I.; Wedawatta, G.; Tezel, A. Smart Contracts in the Construction Industry: A Systematic Review. Buildings 2022, 12, 2082. [Google Scholar] [CrossRef]
  39. Forcael, E.; Puentes, C.; García-Alvarado, R.; Opazo-Vega, A.; Soto-Muñoz, J.; Moroni, G. Profile Characterization of Building Information Modeling Users. Buildings 2022, 13, 60. [Google Scholar] [CrossRef]
  40. Klochkov, Y.; Klochkova, E.; Volgina, A.; Dementiev, S. Human Factor in Quality Function Deployment. In Proceedings of the 2016 Second International Symposium on Stochastic Models in Reliability Engineering, Life Science and Operations Management (SMRLO), Beer Sheva, Israel, 15–18 February 2016; IEEE: New York, NY, USA; pp. 466–468. [Google Scholar]
  41. Balkytė, A.; Tvaronavičienė, M. Perception of Competitiveness in the Context of Sustainable Development: Facets of “Sustainable Competitiveness”. J. Bus. Econ. Manag. 2010, 11, 341–365. [Google Scholar] [CrossRef] [Green Version]
  42. Hillman, A.J.; Withers, M.C.; Collins, B.J. Resource Dependence Theory: A Review. J Manag. 2009, 35, 1404–1427. [Google Scholar] [CrossRef] [Green Version]
  43. Jiang, K.; Lepak, D.P.; Hu, J.; Baer, J.C. How Does Human Resource Management Influence Organizational Outcomes? A Meta-Analytic Investigation of Mediating Mechanisms. Acad. Manag. J. 2012, 55, 1264–1294. [Google Scholar] [CrossRef]
  44. Stedmon, A.W. Human Factors Methods: A Practical Guide for Engineering and Design (Second Edition). Ergonomics 2014, 57, 1767–1769. [Google Scholar] [CrossRef]
  45. Ng, S.T.; Skitmore, R.M.; Sharma, T. Towards a Human Resource Information System for Australian Construction Companies. Eng. Constr. Archit. Manag. 2001, 8, 238–249. [Google Scholar] [CrossRef] [Green Version]
  46. Omoraka, A.E. A Principal Component Analysis of Supply Chain Management Skills for the Nigerian Construction Industry. Int. J. Constr. Manag. 2020, 22, 2413–2421. [Google Scholar] [CrossRef]
  47. Ni, G.; Li, H.; Jin, T.; Hu, H.; Zhang, Z. Analysis of Factors Influencing the Job Satisfaction of New Generation of Construction Workers in China: A Study Based on DEMATEL and ISM. Buildings 2022, 12, 609. [Google Scholar] [CrossRef]
  48. Li, R.Y.M.; Poon, S.W. Construction Safety; Springer: Berlin/Heidelberg, Germany, 2013; ISBN 978-3-642-35045-0. [Google Scholar]
  49. Siddiqi, K.M.; Oberle, R.; Thomas-Mobley, L.; Kangari, R. Motivation for Environmental Construction. Fed. Facil. Environ. J. 2004, 15, 91–111. [Google Scholar] [CrossRef]
  50. Cardoso, P.; Dominguez, C.; Paiva, A. Hints to Improve Motivation in Construction Companies. Procedia Comput. Sci. 2015, 64, 1200–1207. [Google Scholar] [CrossRef] [Green Version]
  51. Barg, J.E.; Ruparathna, R.; Mendis, D.; Hewage, K.N. Motivating Workers in Construction. J. Constr. Eng. 2014, 2014, 703084. [Google Scholar] [CrossRef] [Green Version]
  52. Andi, S. Motivation Perception of Construction Workers and Their Supervisors in Indonesia. In Proceedings of the International Symposium on Globalisation and Construction, AIT Conference Centre, Bangkok, Thailand, 17–19 November 2004; pp. 195–204. [Google Scholar]
  53. Fisk, G.M.; Friesen, J.P. Perceptions of Leader Emotion Regulation and LMX as Predictors of Followers’ Job Satisfaction and Organizational Citizenship Behaviors. Lead. Q. 2012, 23, 1–12. [Google Scholar] [CrossRef]
  54. Fassio, C.; Kalantaryan, S.; Venturini, A. Human Resources and Innovation: Total Factor Productivity and Foreign Human Capital. SSRN Electron. J. 2015, 43, 1–41. [Google Scholar] [CrossRef] [Green Version]
  55. Yusof, N.; Iranmanesh, M.; Mustafa, E. Kamal Innovation Practices in Construction Firms. Adv. Environ. Biol. 2015, 9, 124–126. [Google Scholar]
  56. de Valence Innovation, G. Procurement and Construction Industry Development. Australas. J. Constr. Econ. Build. 2010, 10, 50. [Google Scholar]
  57. Blayse, A.M.; Manley, K. Key Influences on Construction Innovation. Constr. Innov. 2004, 4, 143–154. [Google Scholar] [CrossRef] [Green Version]
  58. Ernst, G.; Huisman, M.; Mostowski, W.; Ulbrich, M. VerifyThis—Verification Competition with a Human Factor. In Tools and Algorithms for the Construction and Analysis of Systems; Springer: Cham, Switzerland, 2019; pp. 176–195. [Google Scholar]
  59. Ashkanasy, N.M. Emotions in Organizations: A Multi-Level Perspective. In Multi-Level Issues in Organizational Behavior and Strategy; Emerald Group Publishing Limited: Bingley, UK, 2003; pp. 9–54. [Google Scholar]
  60. Choudhary, N.; Naqshbandi, M.M.; Philip, P.J.; Kumar, R. Employee Job Performance. J. Manag. Dev. 2017, 36, 1087–1098. [Google Scholar] [CrossRef]
  61. Reunanen, T. Human Factor in Time Management. Procedia Manuf. 2015, 3, 709–716. [Google Scholar] [CrossRef] [Green Version]
  62. Duspara, L.; Požega, Ž.; Crnković, B. The Influence of the Human Factor on Competitiveness of Enterprises in the Metal Processing Industry in Croatia. Teh. Vjesn.-Tech. Gaz. 2017, 24, 579–584. [Google Scholar] [CrossRef] [Green Version]
  63. Maria, D. Jakubik the Human Factor of Organizational Development. In Proceedings of the Organizational Change and Development Conference, Larncaca, Cyprus, 11–12 September 2015. [Google Scholar]
  64. Tabassi, A.A.; Ramli, M.; Bakar, A.H.A.; Tenorio, A.F. Training and Development of Workforces in Construction Industry. Intern. J. Acad. Res. 2011, 3, 150. [Google Scholar]
  65. Tabassi, A.A.; Ramli, M.; Bakar, A.H.A. Effects of Training and Motivation Practices on Teamwork Improvement and Task Efficiency: The Case of Construction Firms. Int. J. Proj. Manag. 2012, 30, 213–224. [Google Scholar] [CrossRef]
  66. Odusami, K.T.; Oyediran, O.S.; Oseni, A.O. Training Needs of Construction Site Managers. Emir. J. Eng. Res. 2007, 12, 73–81. [Google Scholar]
  67. Smithers, G.L.; Walker, D.H.T. The Effect of the Workplace on Motivation and Demotivation of Construction Professionals. Constr. Manag. Econ. 2000, 18, 833–841. [Google Scholar] [CrossRef]
  68. Tabassi, A.A.; Bakar, A.H.A. Training, Motivation, and Performance: The Case of Human Resource Management in Construction Projects in Mashhad, Iran. Int. J. Proj. Manag. 2009, 27, 471–480. [Google Scholar] [CrossRef]
  69. Bower, D.; Ashby, G.; Gerald, K.; Smyk, W. Incentive Mechanisms for Project Success. J. Manag. Eng. 2002, 18, 37–43. [Google Scholar] [CrossRef]
  70. Nikityuk, L. Innovation Incentive Mechanism in the Construction Industry. IOP Conf. Ser. Mater. Sci. Eng. 2019, 667, 012067. [Google Scholar] [CrossRef]
  71. Taleb, H.; Ismail, S.; Wahab, M.H.; Mardiah, W.N.; Rani, W.M.; Amat, R.C. An Overview of Project Communication Management in Construction Industry Projects. J. Manag. Econ. Ind. Organ. 2017, 1, 1–9. [Google Scholar] [CrossRef]
  72. Zulch, B. Communication: The Foundation of Project Management. Procedia Technol. 2014, 16, 1000–1009. [Google Scholar] [CrossRef] [Green Version]
  73. Šandrk Nukić, I.; Matotek, J. Preliminary Research of the Organizational Culture of Construction Companies in Croatia. In Proceedings of the Interdisciplinary Management Research XII, Opatija, Croatia, 20–22 May 2016. [Google Scholar]
  74. Simon, S.M.; Varghese, K. Assessment of Organizational Culture in Construction—A Case Study Approach. In Proceedings of the 24th Annual International Group for Lean Construction (IGLC) Conference and Research Summer School, Boston, MA, USA, 18–24 July 2018; pp. 348–357. [Google Scholar]
  75. Wang, G.C.; Buckeridge, J.S. Ethics for Construction Engineers and Managers in a Globalized Market. In Engineering Ethics for a Globalized World; Springer: Cham, Switzerland, 2015; pp. 143–164. [Google Scholar]
  76. Huemann, M.; Keegan, A.; Turner, J.R. Human Resource Management in the Project-Oriented Company: A Review. Int. J. Proj. Manag. 2007, 25, 315–323. [Google Scholar] [CrossRef]
  77. Belout, A.; Gauvreau, C. Factors Influencing Project Success: The Impact of Human Resource Management. Int. J. Proj. Manag. 2004, 22, 1–11. [Google Scholar] [CrossRef]
  78. Lent, B. Human Factor Skills of Project Managers Derived from the Analysis of the Project Management Processes; PMI Arabian Gulf Chapter, 12th; Project Management Institute: Newtown Square, PA, USA; Manama, Bahrain, 2009. [Google Scholar]
  79. Karthikeyan, P.; Devi, N.; Mirudhubashini, J. A Study on Employee Engagement in Construction Firms with Special Reference to Coimbatore City. Int. J. Hum. Resour. Manag. Res. IJHRMR 2013, 13, 17–26. [Google Scholar]
  80. Stibe, A.; Oinas-Kukkonen, H. Designing Persuasive Systems for User Engagement in Collaborative Interaction. In Proceedings of the European Conference on Information Systems (ECIS), Tel Aviv, Israel, 9 June 2014. [Google Scholar]
  81. Prayogo, L.; Adi Suryo Pranoto, B.; Hardi Purba, H. Employee Satisfaction Analysis with Human Resource Index. Manag. Sci. Lett. 2017, 7, 233–240. [Google Scholar] [CrossRef]
  82. Sila, E.; Širok, K. The Importance of Employee Satisfaction: A Case Study of a Transportation and Logistics Service Company. Management 2018, 13, 111–136. [Google Scholar] [CrossRef]
  83. Batarliene, N.; Čižiuniene, K.; Vaičiute, K.; Šapalaite, I.; Jarašuniene, A. The Impact of Human Resource Management on the Competitiveness of Transport Companies. In Procedia Engineering; Elsevier Ltd.: Amsterdam, The Netherlands, 2017; Volume 187, pp. 110–116. [Google Scholar]
  84. Lawler, E. Make Human Capital a Source of Competitive Advantage; University of Southern California: Los Angeles, CA, USA, 2008. [Google Scholar]
  85. Armstrong, M. Armstrong’s Essential Human Resource Management Practices: A Guide to People Management; Kogane Page: London, UK, 2010. [Google Scholar]
  86. Harini, S.; Hamidah, H.; Luddin, M.R.; Ali, H. Analysis Supply Chain Management Factors of Lecturer’s Turnover Phenomenon. Int. J. Supply Chain Manag. 2020, 9, 589–591. [Google Scholar]
  87. Cepeda Carrión, G.; Roldán Salgueiro, J.L. Aplicando En La Práctica La Técnica PLS En La Administración de Empresas; University of Seville: Seville, Spain, 2004. [Google Scholar]
  88. Wong, P.S.P.; Cheung, S.O. Structural Equation Model of Trust and Partnering Success. J. Manag. Eng. 2005, 21, 70–80. [Google Scholar] [CrossRef]
  89. Collier, J.E. Applied Structural Equation Modeling Using AMOS; Routledge: London, UK, 2020; ISBN 9781003018414. [Google Scholar]
  90. Barroso Castro, C.; Cepeda-Carrión, G.; Roldán Salgueiro, J.L. Investigar En Economía de La Empresa: ¿Partial Least Squares o Modelos Basados En La Covarianza? Asociación Española de Dirección y Economía de la Empresa: Vitoria, Spain, 2007. [Google Scholar]
  91. Henningsson, M.; Sundbom, E.; Armelius, B.-A.; Erdberg, P. PLS Model Building: A Multivariate Approach to Personality Test Data. Scand. J. Psychol. 2001, 42, 399–409. [Google Scholar] [CrossRef] [PubMed]
  92. Adamy, A.; Bakar, A. Developing a Building-Performance Evaluation Framework for Post-Disaster Reconstruction: The Case of Hospital Buildings in Aceh, Indonesia. Int. J. Constr. Manag. 2021, 21, 56–77. [Google Scholar] [CrossRef]
  93. Ingle, P.V.; Mahesh, G. Construction Project Performance Areas for Indian Construction Projects. Int. J. Constr. Manag. 2020, 1–12. [Google Scholar] [CrossRef]
  94. Chin, W.W. The Partial Least Squares Approach to Structural Equation Modeling. Mod. Methods Bus. Res. 1998, 295, 295–336. [Google Scholar]
  95. Pfeffer, J. Building Sustainable Organizations: The Human Factor. SSRN Electron. J. 2010, 24, 34–45. [Google Scholar] [CrossRef]
  96. Cherkesova, E.Y.; Breusova, E.A.; Savchishkina, E.P. Competitiveness of the Human Capital as Strategic Resource of Innovational Economy Functioning. Adv. Res. Law Econ. 2016, 7, 1662–1667. [Google Scholar]
  97. Wilson, D.D.; Collier, D.A. An Empirical Investigation of the Malcolm Baldrige National Quality Award Causal Model. Decis. Sci. 2000, 31, 361–383. [Google Scholar] [CrossRef]
  98. EFQM. Introducing Excellence. Brussels: European Foundation of Quality Management. Available online: www.efqm.org (accessed on 1 November 2022).
  99. Proctor, R.W.; Trisha, V.Z. Human Factors in Simple and Complex Systems, 3rd ed.; CRC Press: Boca Raton, FL, USA, 2018; ISBN 9781315156811. [Google Scholar]
  100. Krosnick, J.A. Questionnaire Design. In The Palgrave Handbook of Survey Research; Springer International Publishing: Cham, Switzerland, 2018; pp. 439–455. [Google Scholar]
  101. González-Huelva, I. Modelos PLS-PM. Bachelor Thesis, University of Seville, Seville, Spain, 2018. [Google Scholar]
  102. Edward, G.; Richard, C.; Zeller, A. Reliability and Validity Assessment; Sage Publications: Thousand Oaks, CA, USA, 1979; Volume 17. [Google Scholar]
  103. Chin, W.W.; Marcolin, B.L.; Newsted, P.R. A Partial Least Squares Latent Variable Modeling Approach for Measuring Interaction Effects: Results from a Monte Carlo Simulation Study and an Electronic-Mail Emotion/Adoption Study. Inf. Syst. Res. 2003, 14, 189–217. [Google Scholar] [CrossRef] [Green Version]
  104. Barclay, D.W.; Higgins, C.; Thompson, R. The Partial Least Squares (PLS) Approach to Casual Modeling: Personal Computer Adoption Ans Use as an Illustration. Technol. Stud. 1995, 2, 285–309. [Google Scholar]
  105. Falk, R.F.; Miller, N.B. A Primer for Soft Modeling; The University of Akron: Akron, OH, USA, 1992. [Google Scholar]
  106. Fornell, C.; Larcker, D.F. Evaluating Structural Equation Models with Unobservable Variables and Measurement Error. J. Mark. Res. 1981, 18, 39–50. [Google Scholar] [CrossRef]
  107. Duarte, P.A.O.; Raposo, M.L.B. A PLS Model to Study Brand Preference: An Application to the Mobile Phone Market. In Handbook of Partial Least Squares; Springer: Berlin/Heidelberg, Germany, 2010; pp. 449–485. [Google Scholar]
  108. Hair, J.F.; Ringle, C.M.; Sarstedt, M. PLS-SEM: Indeed a Silver Bullet. J. Mark. Theory Pract. 2011, 19, 139–152. [Google Scholar] [CrossRef]
  109. Tenenhaus, M.; Amato, S.; Esposito Vinzi, V. A Global Goodness-of-Fit Index for PLS Structural Equation Modelling. Proc. XLII SIS Sci. Meet. 2004, 1, 739–742. [Google Scholar]
  110. Azeem, M.; Ullah, F.; Thaheem, M.J.; Qayyum, S. Competitiveness in the Construction Industry: A Contractor’s Perspective on Barriers to Improving the Construction Industry Performance. J. Constr. Eng. Manag. Innov. 2020, 3, 193–219. [Google Scholar] [CrossRef]
  111. Dabirian, S.; Abbaspour, S.; Khanzadi, M.; Ahmadi, M. Dynamic Modelling of Human Resource Allocation in Construction Projects. Int. J. Constr. Manag. 2019, 22, 182–191. [Google Scholar] [CrossRef]
  112. Magoua, J.J.; Wang, F.; Li, N.; Fang, D. Incorporating the Human Factor in Modeling the Operational Resilience of Interdependent Infrastructure Systems. Autom. Constr. 2023, 149, 104789. [Google Scholar] [CrossRef]
  113. Hwang, B.-G.; Ngo, J.; Teo, J.Z.K. Challenges and Strategies for the Adoption of Smart Technologies in the Construction Industry: The Case of Singapore. J. Manag. Eng. 2022, 38, 05021014. [Google Scholar] [CrossRef]
Figure 1. Methodology of the study.
Buildings 13 00774 g001
Figure 2. PLS Structure.
Buildings 13 00774 g002
Figure 3. Proposed Model: Interrelationship of HR and competitiveness.
Buildings 13 00774 g003
Figure 4. R 2 for Human resources.
Buildings 13 00774 g004
Figure 5. PLS model for Human Resources, which represents the direct effects and the p-value; the smaller the value, the more reliable the results of the study *** p < 0.01, ** p < 0.05, * p < 0.1, ^ p < 0.15.
Buildings 13 00774 g005
Table 1. The concept of competitiveness in the literature.
AuthorConcept
Dwyer & Kim [26]Competitiveness involves a combination of goods and processes, as well as the processes that transform goods to obtain profits derived from customer sales.
Orozco et al. [14]Competitiveness, in general terms, is related to having better skills and capabilities than competitors.
Buckley et al. [27]A firm is competitive if it can produce products and services with superior quality and lower costs than its competitors.
Vanags & Geipele [19]In the construction industry, competitiveness is the ability to acquire the necessary resources in terms of quantity and appropriate quality.
Dunning & Zhang [28]Competitiveness is a useful tool for identifying the units that are lagging but is not equipped to identify the reasons for aid lag.
Table 2. The concept of competitiveness in the Construction Industry.
Competitiveness in the Construction IndustryAdministrative Skills, Techniques and Corporate Image. KCIs, KPIsFormulation of Competitiveness
Factors
External and Internal Factors of Competitiveness in a CompanyStrategiesReputation, Customer Acquisition, Customer SatisfactionProfitabilityStrategies to Increase
Competitiveness
Corporate StrategiesPerformance EvaluationPerformance Sources: Cost, Time, QualityLeadershipDelays as an IndexCompany Structure as a
Competitive Advantage
PARTS (Players, Added Values, Rules, Tactics and Scope)
Lielgaidina & Geipele [3]
Low Sui et al. [33]
Fei Deng et al. [1]
Orozco et al. [14]
Jing et al. [34]
Komarkova et al. [35]
Nazirah Zainul et al. [36]
Abdelnaser et al. [37]
Han J. et al. [32]
Rathnayake et al. [38]
Forcael et al. [39]
Times mentioned47351232221211
Table 3. The concept of HR in the Construction Industry.
HR—Construction
Categories/Factors
MotivationLeadershipCompetitivenessInnovationCommunicationIncentives and RewardsTrainingCompany CultureTeam WorkStaff SatisfactionValuesDevelopment SystemsHealth and SafetyCommitment Systems
Li et al. [48]
Siddiqi M. et al. [49]
Cardoso et al. [50]
Barg et al. [51]
Andi, S. [52]
Fisk & Friesen [53]
Fassio et al. [54]
Nor’ Aini Yusof et al. [55]
De Valence [56]
Blayse [57]
Ernst et al. [58]
Ashkanasy [59]
Choudhary et al. [60]
Reunanen [61]
Duspara et al. [62]
Jakubik [63]
Tabassi (a) [64]
Tabassi (b) [65]
Odusami et al. [66]
Smithers & Walker [67]
Tabassi & Bakar [68]
Bower et al. [69]
Nikityuk [70]
Rani et al. [71]
Zulch [72]
Šandrk Nukić & Matotek [73]
Simon & Varghese [74]
Wang & Buckeridge [75]
Huemann et al. [76]
Belout & Gauvreau [77]
Lent [78]
Barg et al. [51]
Karthikeyan et al. [79]
Stibe et al. [80]
Prayogo et al. [81]
Sila & Širok [82]
Time mentioned1613121010967565542
Table 4. Summary of the PLS attributes (Adapted from Cepeda and Roldán [87]).
CriteriaPLS
ObjectiveOriented to forecast
ScopeBased on variance
AssumptionsPredictor specification (no parametric)
Parameters estimationAs the number of indicators increases, the sample increases
Latent variablesExplicitly estimated
Relationship between latent variables and their measurementsThey can be modeled both reflectively and formatively
ImplicationsOptimal for prediction accuracy
Model complexityHigh complexity
Sample sizeAnalysis based on the portion of the model with the largest number of predictors. The minimum recommendations are between 30 and 100 cases
Table 5. Most Relevant Human Resource Factors.
VariableDescription
LEADLeadership
INNOVInnovation
VALValues
COCULCompany Culture
TEAMWTeamwork
TRAINTraining Levels
INCENIncentives and Rewards
COMMITCommitment Systems
MOTMotivation
INTEQInternal Technology
ICQInternal Communication Quality
STECHStaff Technology
SEHEHealth and Safety
QUALQuality
CARDEVCareer and Development
WENVWork Environment
SSATStaff Satisfaction
PRODUNon-financial productivity
SRETStaff Retention
TIMETime
COSTCost
PROFProfitability
Table 6. Inner Model: Latent Variable, Type, R 2 , Block Community, Mean Redundancy, and Average Variance Extracted (AVE).
Latent VariableLV TypeR2Block CommunalityMean RedundancyAVE
LEADExogenous00.81400.814
INNOVEndogenous0.4010.8190.32860.819
VALEndogenous0.5010.8330.41780.833
COCULEndogenous0.4620.8810.40680.881
TEAMWEndogenous0.5190.8460.43930.846
TRAINEndogenous0.4010.7430.2980.743
INCENEndogenous0.4960.730.36220.73
COMMITEndogenous0.5710.8630.49290.863
MOTEndogenous0.4960.8280.41080.828
INTEQEndogenous0.5470.8230.450.823
ICQEndogenous0.6480.7350.47640.735
STECHEndogenous0.5310.8430.44740.843
SEHEEndogenous0.2580.320.08250.32
QUALEndogenous0.520.8090.42070.809
CARDEVEndogenous0.7090.8380.5940.838
WENVEndogenous0.6920.8320.57620.832
SSATEndogenous0.710.8690.61710.869
PRODUEndogenous0.6160.8230.50650.823
SRETEndogenous0.5430.870.47310.87
TIMEEndogenous0.3140.7580.23850.758
COSTEndogenous0.3430.7480.25650.748
PROFEndogenous0.45110.45141
Table 7. Indices of Unidimensionality.
MVsC.alphaDG.rhoeig.1steig.2nd
LEAD30.88578450.92925352.4422230.2978762
INNOV40.92612030.94763733.2763430.3439616
VAL30.89992720.93750892.5001490.2943567
COCUL20.86548380.93698051.7628660.2371341
TEAMW30.90916560.9429222.5389620.2591366
TRAIN50.91399730.93563833.720460.4440576
INCEN50.90259660.93012283.6532480.6979245
COMMIT20.84100920.92635871.7256390.2743608
MOT30.89607250.9353412.4849280.3314688
INTEQ40.928380.94908813.2935250.2984944
ICQ50.90918310.9325933.674690.6323467
STECH30.90716380.94174122.5304250.2663746
SEHE40.66527250.80353112.2365181.014931
QUAL40.92110910.94415093.2346880.3275837
CARDEV40.93548640.95390563.3522390.3172588
WENV30.89855250.93689982.4961580.3480818
SSAT20.85016610.93030441.7393820.2606183
PRODU20.78513340.90298891.6462710.3537287
SRET20.85125640.93077651.7410320.2589675
TIME30.84035410.90397012.275390.4370404
COST30.83185840.89931462.2460270.4371407
PROF11110
Table 8. Most relevant HR factors that affect each other according to Total Effects greater than 0.15.
RelationshipDirectIndirectTotalRelationshipDirectIndirectTotal
LEAD -> CARDEV 0.468860.296900.76576LEAD -> TIME 0.000000.367960.36796
SSAT -> SRET 0.737220.000000.73722INNOV -> TEAMW 0.355910.000000.35591
INNOV -> STECH 0.728380.000000.72838INCEN -> QUAL 0.353480.000000.35348
LEAD -> VAL 0.708050.000000.70805LEAD -> COST 0.000000.347290.34729
LEAD -> ICQ 0.356890.335840.69273INNOV -> TRAIN 0.334460.000000.33446
LEAD -> COCUL0.679390.000000.67939INNOV -> PROF 0.000000.330490.33049
LEAD -> TEAMW 0.440310.225420.66574INNOV -> SSAT 0.000000.325080.32508
INNOV -> COMMIT 0.663310.000000.66331LEAD -> PROF 0.000000.320740.32074
LEAD -> SSAT 0.000000.661730.66173LEAD -> WENV 0.060100.575230.63532
LEAD -> MOT 0.382420.251320.63374CARDEV -> SRET 0.000000.295020.29502
LEAD -> INNOV 0.633380.000000.63338LEAD -> SEHE 0.000000.293580.29358
INNOV -> INTEQ 0.613870.000000.61387INCEN -> CARDEV 0.290390.000000.29039
LEAD -> PRODU 0.000000.593170.59317WENV -> SRET 0.000000.276830.27683
PRODU -> COST 0.585470.000000.58547SSAT -> PRODU 0.264460.000000.26446
LEAD -> TRAIN 0.366290.211840.57813INNOV -> TIME 0.000000.264380.26438
ICQ -> WENV 0.576540.000000.57654TEAMW -> WENV 0.264130.000000.26413
INNOV -> QUAL 0.350160.225160.57532INNOV -> COST 0.000000.262120.26212
LEAD -> INCEN 0.235630.336280.57191INNOV -> CARDEV 0.000000.254650.25465
LEAD -> INTEQ 0.177740.388810.56656WENV -> PRODU 0.148400.099310.24771
LEAD -> COMMIT 0.134710.420120.55484MOT -> TIME 0.163650.078940.24259
INNOV -> INCEN 0.530940.000000.53094INNOV -> SRET 0.000000.239650.23965
INNOV -> ICQ 0.530230.000000.53023TEAMW -> PRODU 0.167630.065430.23306
TRAIN -> SEHE 0.507810.000000.50781ICQ -> SSAT 0.000000.216490.21649
LEAD -> QUAL 0.000000.488740.48874TIME -> PROF 0.204740.000000.20474
LEAD -> SRET 0.000000.487840.48784MOT -> SSAT 0.184180.000680.18486
LEAD -> STECH 0.000000.461340.46134MOT -> PRODU 0.128320.048890.17721
INNOV -> PRODU 0.196220.251480.44771INCEN -> PROF 0.000000.173030.17303
PRODU -> TIME 0.445480.000000.44548INNOV -> SEHE 0.000000.169840.16984
QUAL -> PROF 0.441480.000000.44148ICQ -> SRET 0.000000.159600.15960
CARDEV -> SSAT 0.400180.000000.40018TRAIN -> CARDEV 0.155100.000000.15510
INNOV -> WENV 0.000000.399710.39971SSAT -> COST 0.000000.154830.15483
INNOV -> MOT 0.396790.000000.39679
WENV -> SSAT 0.375500.000000.37550
Disclaimer/Publisher’s Note: The statements, opinions and data contained in all publications are solely those of the individual author(s) and contributor(s) and not of MDPI and/or the editor(s). MDPI and/or the editor(s) disclaim responsibility for any injury to people or property resulting from any ideas, methods, instructions or products referred to in the content.

