1. Introduction
Arch bridges are extensively used for bridge projects with their unique structural motifs and excellent mechanical characteristics. However, in the case of aging bridges in long-term operation, previous design criteria and structural optimization have not achieved a certain level of robustness [
1]. As a result, aging bridges are at risk of the safety hazard of collapse damage following failure of local components due to external factors [
2]. The numerical simulation of progressive collapse of bridges under different extreme accidents has been investigated by current scholars [
3,
4,
5,
6,
7]. In order to clarify critical loaded members and provide a basis for theoretical analysis to investigate the causes of collapse, a virtual scenario of the collapse of a bridge is accurately reproduced in this study.
Considering cables are the key components of cable-supported arch bridges, they play an important role in transmitting the load of the main girder to the arch ribs. However, due to environmental erosion [
8], vehicle-bridge coupling vibration [
9], fire accidents [
10], and accidental impacts [
11] while in operation, the cables may undergo constant damage, or even break suddenly, which is one of the crucial causes of progressive collapse which cannot be overlooked.
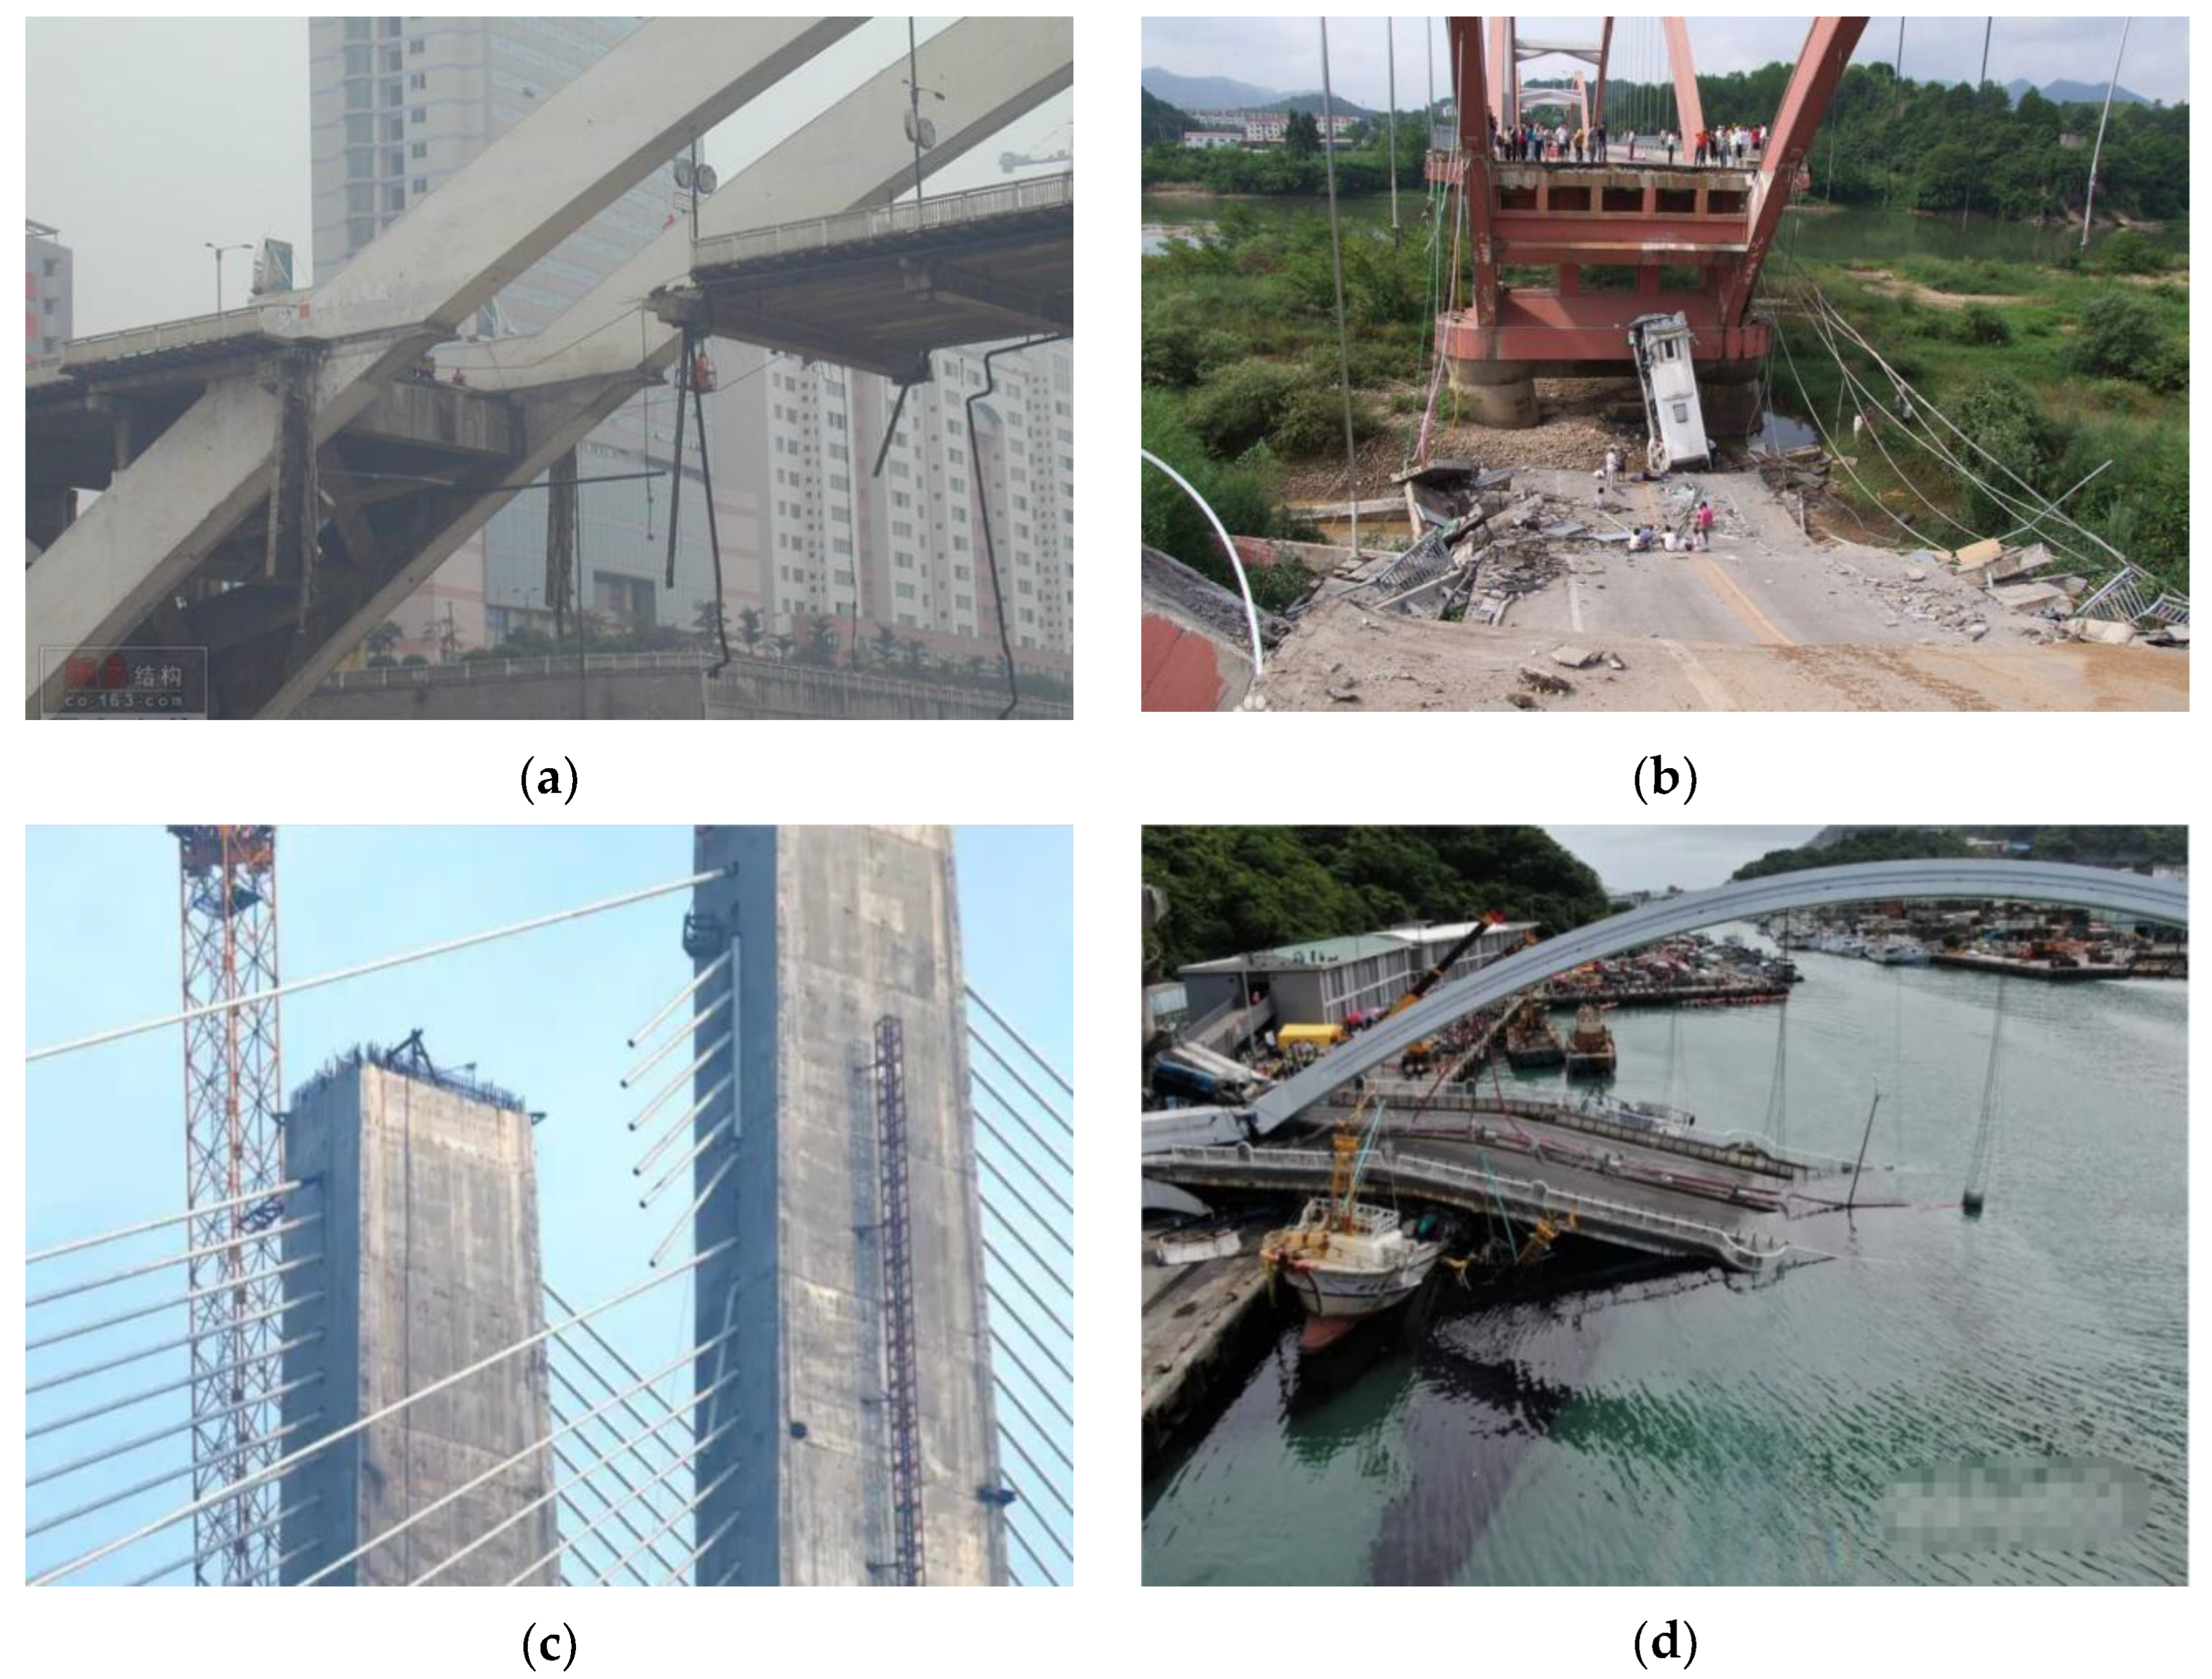
In recent years, numerous unforeseen bridge collapses have occurred while in operation owing to cables accidentally snapping in succession. For instance, on 11 November 2001, Sichuan Yibin South-Gate Bridge, the short cables were exposed to a corrosive environment for an extended period of time resulting in four pairs of eight cables rupturing at the base of the arch (
Figure 1a). On 14 July 2011, Fujian Wuyishan Bridge suffered from a continuous collapse of single-span cables due to the presence of multiple overloaded vehicles (
Figure 1b). On 29 October 2014, nine cables on the single side of the pylon on Hunan Chishi Bridge experienced a fire accident and burned off one after another before its girder was closed (
Figure 1c). On October 2019, overall collapse from a successive cable breakage occurred on the Taiwan Nanfang’ao Bridge; the cause of accident was insufficient redundancy leading to the adjacent cables unable to withstand the impulse (
Figure 1d). As can be seen from the above examples, the occurrence of cable breaking accidents threatens the stability and safety of the entire structure. Therefore, it is necessary to analyze the effects of cable-loss scenarios through the numerical simulation of different bridge types.
At present, degradation rules in structural loading-bearing capacity after cable failure, has become a research hotspot, and some scholars have uncovered dynamic responses of cable loss by means of indoor models’ cable-breaking simulation experiments.
Chen et al. [
12] conducted an experiment on the combustion of HDPE cables at various tilt angles (18°, 24°, and 30°) and found that the degree of burning, flame height, and flame propagation rate of the cables increased with the increment of cable inclination angle. Chen et al. [
13] fabricated a 1:6.4 scale model of a concrete-filled steel tubular arch bridge, carried out cable fracture simulation tests, and adopted ANSYS/Ls-dyna software to perform numerical simulation of cable fracture for half-through and through concrete-filled steel tubular arch bridges with different spans and summarized the reasonable dynamic coefficients. Ma et al. [
14] designed a cable-stayed bridge segment model with a scale ratio of 1:40 to analyze the tendency of static performance degradation under cable breakage and local damage to the girder. Lu et al. [
15] fabricated a planar truss string structure with a 6 m span, through which the bottom cable of sudden rupture experiments show that the plastic strain first appeared in the bottom chord in the span, followed by the successive buckling of the upper chord and web, and finally full collapse occurred. Vu Hoang et al. [
16] studied the sudden impact of a heavy object on 16 steel strands at different shock locations and under different initial stresses to obtain the dynamic response of cables when subjected to lateral impulse power.
Some scholars have investigated the influence on different types of bridges subjected to the impulse response of cable breaking using finite element numerical simulation. Zhang et al. [
17] studied the structural response of a long-span cable-stayed bridge to cable loss during construction; and the static performance of the Chishi Bridge when subjected to multiple cable loss caused by a fire accident was investigated in detail by field inspection and finite element simulation. Qiu et al. [
18] studied the effects of local vibration of the main cable, flexural stiffness of the main cable, the mass of the clamp, model damping ratio, and initial state of the hanger stress on the dynamic response of a suspension bridge caused by suspender cables breaking. Wu et al. [
19] studied the dynamic response of a suspension bridge to sudden rupture of a single cable under different cable corrosion levels and then studied the response to different numbers of corroded cables. Wang et al. [
20] investigated the variations in acceleration and displacement of a train and bridge deck of a cable-stayed bridge after the sudden breaking of the stay cable while the train was traveling. Ruiz-Teran et al. [
21] carried out a full dynamic response analysis of broken cables for a cable-stayed bridge with tension cables below the girder slab, where the number of broken cables and the active traffic load were used as parameters to analyze whether this type of bridge can withstand two-fifths of its cables being broken. Cai et al. [
22] improved four analytical methods for consideration of the initial state: linear static, nonlinear static, linear dynamic, and nonlinear dynamic methods, and simulated cable failure using the alternating path method. Mozos et al. [
23,
24] established a finite element modeling of 10 cable-stayed bridges and simulated analysis of broken cables by varying the parameters of local components, such as number of cable planes, cable type, girder section thickness, girder stiffness, etc. Yukari Aoki et al. [
25] investigated the influence of the load position, broken cable position, damping ratios, and geometric nonlinearity on the ability of a cable-stayed bridge to gradually collapse. Zhou et al. [
26] studied the variation rule of shock response of long-span cable-stayed bridges to sudden cable break under random traffic load, wind load excitation, and wind-vehicle-bridge coupling. Wolff et al. [
27] argued that the dynamic amplification factor (DAF) recommended by the code, which is 2, was too large, and suggested that the dynamic amplification factor is determined by looking at structural damping, transverse vibration, and cable sag. Niel soto et al. [
28] proposed a multi-model optimization scheme to obtain the minimum amount of steel used in the cables when considering the impact of broken cables.
The above literature review reveals that although there have been some research studies on the dynamic response of structure to cable breaking, these are not sufficient. The objects of these existing studies are mostly conventional bridges, while the force transmission mechanism of the special-shaped arch bridge composed of an inclined arch and a curved beam are more complex, and there are few studies on the impact effect of cable breaking on such bridges. Therefore, using Haixin Bridge in Guangzhou as the engineering background, the impact effect of cable breaking for a new type of arch bridge is studied by finite element simulation. The effects of cable position, number of broken cables and different failure modes on the bridge’s dynamic response including cable force, deflection of girder, and DAF are investigated in detail.
3. Description of the Numerical Modeling and Analysis
3.1. Material Properties and Load
The mechanical properties of the materials used in Haixin Bridge are shown in
Table 1.
The main purpose of this research is to study the dynamic impact response of the remaining structure to cable breaking. Therefore, the finite element model only considers the first-phase dead load and second-phase dead load which have a great influence on the internal force of the structure. The first-phase dead load includes the self-weight of the arch rib, main girder, filled concrete, and suspender cables. The second-phase dead load includes the weight of the railings, bridge deck pavement, and saddle weight in the side span.
The weight of the railings is 5.8 kN, 5 kN, and 20 kN, respectively, applied on the flange diaphragm, the web of the main beam and the anchorage point of the girder and cable. The weight of the pavement is 2.8 kN/m2, 7.5 kN/m2 and 11 kN/m2, respectively, imposed on the position of the quick-walkway, the viewing platform, and the slow-walkway. The saddle weight applied to the side span is 863.97 kN.
There are 23 suspender cables in total, from south to north, the cables are numbered from 1# to 23# as shown in
Figure 5.
3.2. Description of the FE Modeling
A cable-breaking reaction involves high transient change on internal forces and structural matrix, making it difficult to simulate this dynamic incidence. Finite element software ANSYS with excellent transient analysis function is used to model and simulate the background bridge.
Figure 6 shows the outline of the FE model.
A SHELL181 element is applied to the main girder and diaphragm plate, and the stiffening ribs of the girder are equivalent to plate thickness. A BEAM188 element is applied for the arch rib. LINK10 element is applied for the suspender cables. The weight of the railings is modeled by using MASS21 element added at the corresponding position. The weight of the pavement and saddle weight are applied using distributed load on the bridge deck.
The boundary conditions of the FE model used fixed-arch ends, a simply supported girder and the cables were hinged to the anchorage points on the girder and the arch rib. The joint position between the arch and girder is modeled by coupling DOFS of nodes. In this numerical model, the bridge is completed after only one construction stage, and no cable force adjustments are considered. The calculated cable force after construction under dead load is shown in
Figure 7.
3.3. Selection of Cable Breaking Time
The breaking of a cable causes a dynamic load whose magnitude varies depending on the breaking time from the load acting on the anchorages of the cable before its rupture to zero. The breaking time is one of the parameters that must be adequately considered in the dynamic analysis to obtain an accurate response of the structure.
Mozos et al. [
29] studied the role that breaking time plays in the response of the structure from a theoretical and a numerical perspective, and found that the average breaking time observed is 0.0055 s for undamaged wires and 0.00375 s for those with local damage. Qiu et al. [
30] introduced the cable force loss function and the failure time Δt to discuss the change of the maximum dynamic response value of the remaining structure under the impact of cable breaking. Shao et al. [
31] pointed out that if the breaking duration is less than 1.0 s, the dynamic response curves almost coincide, and the maximum response is consistent.
Due to the different structural forms and force transmission modes in different types of bridges, the influence of the breaking time of cable on the structural dynamic response also differ. A parametric analysis is conducted in this section to study the suspender cable breaking time on the dynamic response of the new type arch bridge composed of an inclined arch and a curved beam, and the worst cable breaking time is selected.
Without loss of generality, the cable breaking time is presented as the function of the natural vibration period. 2 T, T, T/2, T/10, T/20, T/50, T/100, T/300, and T/500 are selected as the breaking time to conduct a finite element parametric analysis, where T is the first order vertical vibration period. Modal analysis of the Haixin Bridge is conducted by using ANSYS 18.0 software, and the first five order natural frequencies, periods, and modal shapes are shown in
Table 2.
As the first order modal of the bridge is characterized by the symmetric vertical bending of the girder, the first natural vibration period is selected as the most significant mode vibration period T dominated by vertical vibration. Cable 12# is selected as the breaking cable to carry out the parametric analysis on the breaking time of a suspender cable.
Figure 8 shows the internal force time history of cable 11# after cable 12# ruptured with a different breaking time;
Figure 9 shows the deflection time history of the anchorage point between cable 12# and the girder after cable 12# ruptured with a different breaking time. From the figures, it can be seen that the fluctuation of cable force and girder’s deflection becomes smaller with the increase of cable breaking time. When the cable breaking time is 2 T, T and T/2, the fluctuation of cable force and deflection tends to be gentle, and the maximum value of dynamic response is nearly equal to the static response, which weakens the impact effect caused by the cable sudden break. When the cable breaking time is T/100, T/300 and T/500, the time history curves of cable force and girder’s deflection are nearly the same. That is to say, the dynamic response caused by cable breaking no further variates with time when the breaking time is less than 1% of the first order natural vibration period of the structure. In terms of the efficiency of numerical simulation, T/300 is chosen as the cable breaking time in this paper, that is, 0.0055 s.
3.4. Selection of Structural Damping
The sudden breaking of the suspender cable will lead to reciprocating vibrations in the whole structure, the vibration energy of the structural system will be consumed due to the existence of damping, and the dynamic response of the remaining structure will eventually decay to a stable state. Therefore, when conducting a dynamic time-history analysis of cable breaking, a reasonable damping value will improve the accuracy of the simulation and reflect the true rule of the dynamic response of the bridge after sudden cable failure. In this paper, the widely used Rayleigh damping is used as the proportional viscous structure damping, the expression the damping is as follows [
32]:
where:
α is the coefficient of mass matrix,
β is the coefficient of stiffness matrix, [
M] is the mass matrix, [
K] is the stiffness matrix,
ωi is the
ith modal frequency,
ωj is the
jth modal frequency,
ξ is the damping ratio.
In this paper, the first and second order natural frequencies are used to calculate coefficients
α and
β, and according to “Specifications for seismic design of highway bridges” [
33], the damping ratio of this bridge is set to 0.03.
3.5. Simulation Steps of Cable Breaking
Finite element software ANSYS is used to conduct numerical simulation, the simulation steps are as follows: 1. Perform modal analysis to obtain the first and second order modal frequencies, then substitute them into Equations (2) and (3) to calculate the mass matrix coefficient a and stiffness matrix coefficient b. 2. Close time integration effect and apply acceleration of gravity, open stress hardening effect. Perform transient analysis to obtain the initial state of the arch bridge before cable breaking under self-weight and secondary dead weight. 3. Open time integration effect, using “birth-death” function of element in ANSYS software to kill the element of broken cable in 0.0055 s. 4. Set enough load substeps to perform transient analysis until the obtained dynamic response becomes stable.
4. Analysis of the Structural Response Caused by a Single Cable Breaking
The cable at different locations bears different degrees of dead and live loads on the bridge deck system, so the overall structural stiffness changes caused by cable breaking at different locations are different, and the final impact on the static and dynamic response trends of the remaining members are also different. In this section, the single cable at typical locations including the long cable in the mid-span area, the moderate-length cable in the L/4 arch rib area, and the short cable in the arch end area are selected as the proposed broken cable for the finite element simulation. The following six cases of single cable breaking are selected: ① Cable 1# (arch end area) breaking; ② Cable 2# (arch end area) breaking; ③ Cable 6# (L/4 arch rib area) breaking; ④ Cable 7# (L/4 arch rib area) breaking; ⑤ Cable 11# (mid-span area) breaking; ⑥ Cable 12# (mid-span area) breaking.
4.1. Dynamic Response of Cable Force
Since abrupt cable breakage only has a large impact on the neighboring cables [
13,
19],
Figure 10 presents the cable force variation of six cables near the failed cable 3 s after a single cable breaks.
It can be seen from
Figure 9 that the dynamic response caused by single cable breakage at different locations is different, and the closer the cable to the broken cable, the more force will be distributed to resist the structural deformation caused by the impact effect of cable breakage. At the moment of breakage, the neighboring cable force has a steep surge process; after reaching the maximum dynamic response, the force change curve oscillates up and down, and after 3 s of breakage the force variation is less than 1 kN, that is, the impact response caused by the breakage tends to a stable state.
For different typical locations under the impact of broken cables, only the neighboring cable with the largest incremental value of static and dynamic response of the cable force is analyzed. For the abrupt breakage of the short cable in the arch end area, the maximum force increment of the adjacent cable 2# caused by the breakage of cable 1# is 82.72 kN, and the final force variation is stabilized at 60.46 kN. Compared with the initial cable force before breakage, the increment percentages of maximum dynamic response and static stability value for cable 2# are 8.9% and 6.5%, respectively. For the abrupt breakage of the middle length cable in the L/4 arch rib area, the maximum force increment of the adjacent cable 5# caused by the breakage of cable 6# is 211.43 kN, and the final force variation is stabilized at 151.59 kN. Compared with the initial force before the breakage, the maximum dynamic response and static stability value of cable 5# are 21.2% and 15.2%, respectively. For the sudden breakage of the long cable in the mid-span area, the maximum force increment of the adjacent cable 10# caused by the breakage of cable 11# is 155.13 kN, and the final change of the cable force is stabilized at 110.81 kN. Compared with the initial cable force before the breakage, the increment percentages of the maximum dynamic and static stability value for cable 10# are 19.2% and 13.7%, respectively.
The impact response caused by the abrupt breakage of the moderate-length cable in the L/4 arch rib area is larger than the other two areas, and the cable force increment ratio of the neighboring cables near the broken cable is also the largest. The cable force released after the breakage of the cable in this area needs more transmission paths to share the corresponding load-bearing capacity. It can also be found that, considering the cable force distribution ratio of the neighboring cables with the same distance at the left and right sides of the broken cable, the cable force redistribution ratio of the shorter cable is larger than that of the longer one. For example, after the abrupt breakage of cable 6#, the maximum cable force increment of cable 5# is 12.93 kN larger than that of the value of cable 7#. In the actual engineering construction and maintenance, the cable damage or breaking should give priority to the neighboring cable with shorter length to meet the requirements of the cable-bearing capacity.
Figure 11 shows the maximum dynamic and static stresses of the remaining cables after the breakage of the cable in different typical areas. In this figure, σ
dyn represents the maximum dynamic stress of the remaining cable after breakage, and σ
st represents the static stress value of the remaining cable after breakage when it finally reaches the steady state. As shown in
Figure 10, after the breakage of a single cable, the cable forces of the whole bridge cause stress redistribution in different proportions, and the impact effect of the broken cable decreases with the distance from the broken cable. Comparing the whole bridge cable stress changes after sudden breakage of cables at three typical locations, the maximum dynamic and static stresses of the neighboring cable caused by the sudden breakage of the cable in L/4 arch rib area is the largest. So detailed analysis should be focused on the cable damage or breaking on this location to improve the safety factor of the cable in this area. According to the “Technical Specification for concrete-filled steel tubular arch bridge” [
34], in order to reduce the stress amplitude in the cable and improve its safety, a safety factor of 3.0 is taken, and steel strand with a tensile strength of 1,860 MPa is adopted as per the cable of Haixin Bridge and the admissible stress of the cable is 620 MPa. Under the six kinds of breaking conditions in this paper, the stress of the whole bridge’s cables considering the impact of the cable breaking does not exceed the design’s admissible stress, which shows that the sudden breakage of a single cable at different locations does not cause successive breakage of neighboring cables.
Table 3 shows the comparison of the total cable force increment of remaining cables after cable breakage and the released amount of the broken cable. Due to the symmetrical structure of the bridge, only half of the cables are listed. From this table, it can be seen that the sum of the remaining cables’ force caused by the sudden breakage of a cable in the area from the L/4 arch rib to the middle of the span is close to the released cable force of the corresponding broken cable. This indicates that most of the broken cable’s forces in this area are redistributed to the remaining cables according to the principle of internal force redistribution. However, after the five cables near the arch end break, the sum of the remaining cables’ force is smaller than the released force of the broken cable, and the corresponding difference between cable 1# and cable 2# is more than 500 kN, which is because part of the force of the broken cable in this area is distributed to the remaining cables according to the principle of internal force redistribution and the rest is directly transferred to the arch rib through the arch-beam joint.
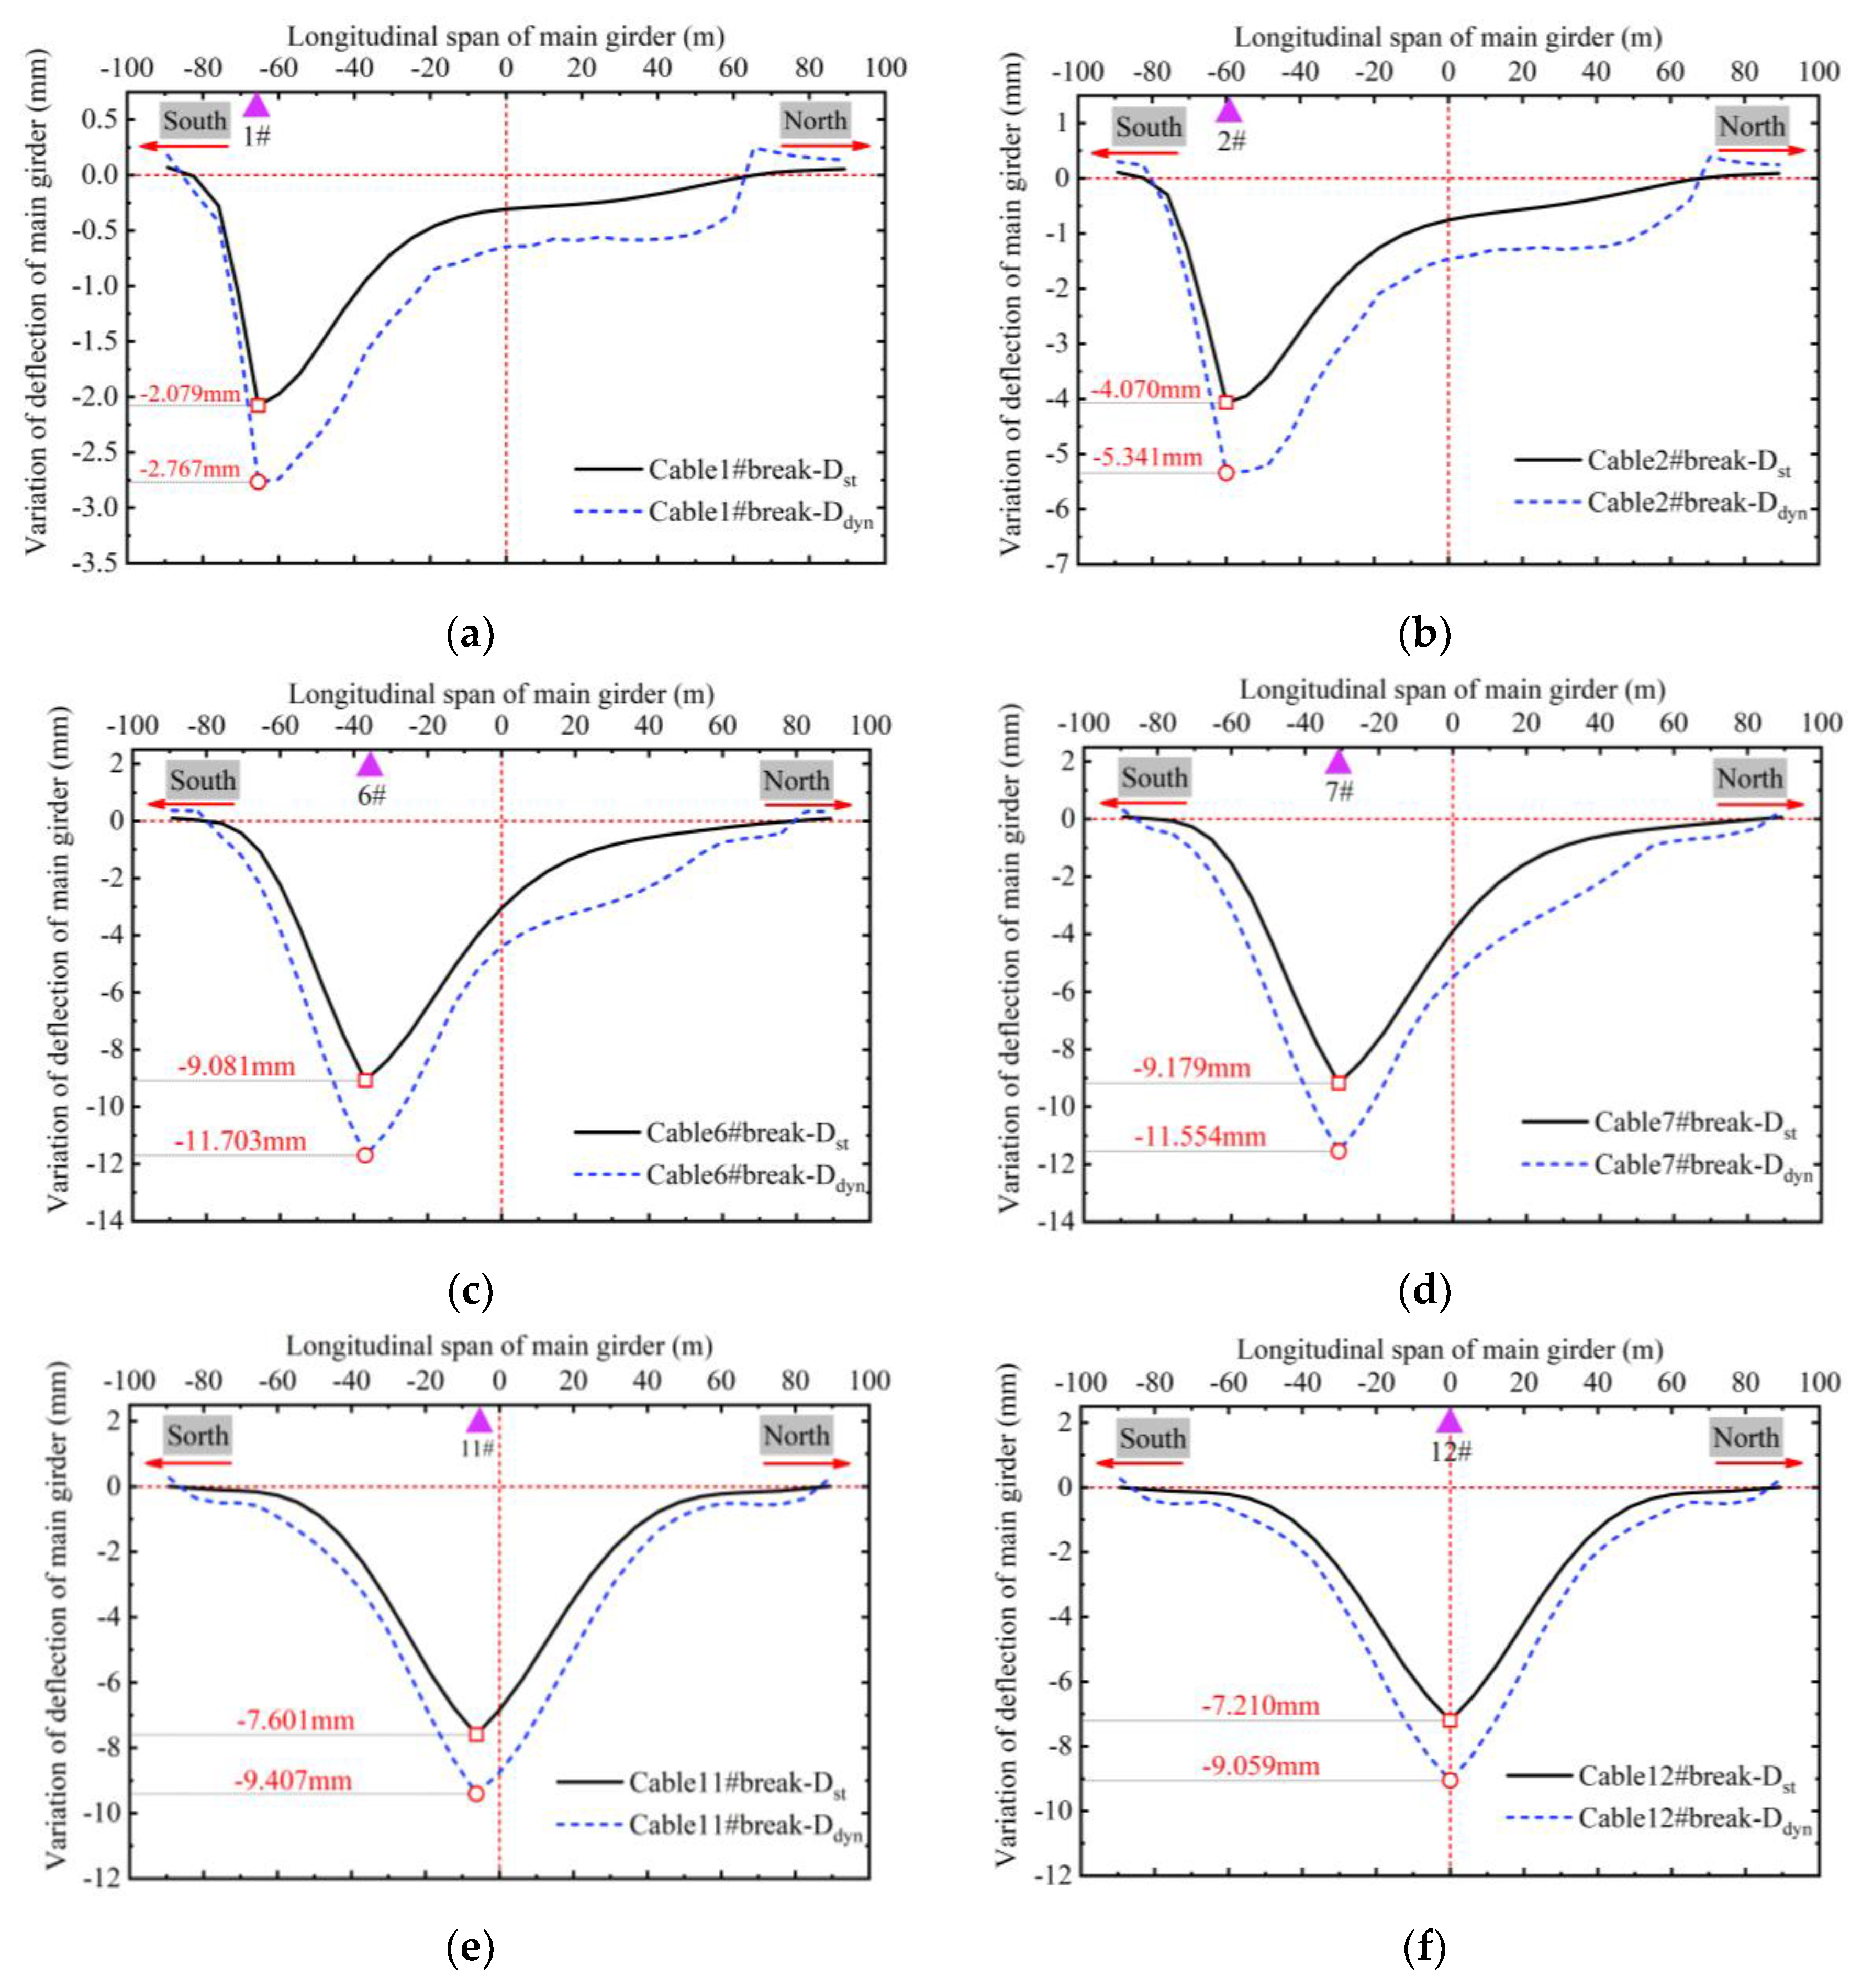
4.2. Deflection Response of Main Girder
Figure 12 shows the variation of the main girder’s deflection after the breakage of the cable at different locations. Ddyn indicates the maximum dynamic deflection of the main girder after cable breakage, and Dst indicates the static deflection of the main girder when it reaches the stable state after the cable breaking. It can be seen that the deflection change of the main girder near the broken cable area is the largest, shown as the extreme point on the deflection curve, selecting the anchorage point of the main girder at the broken cable as the center point, the deflection change value shows the decreasing trend of “V” to both sides. The deflection of the main girder caused by the sudden breakage of the cable at the L/4 arch rib is relatively large, for example, after the sudden break of cable 7#, the static deflection and the maximum dynamic deflection of the main girder are 9.179 mm and 11.554 mm, respectively. As shown in
Figure 12a, the variation of deflection of the main girder caused by the sudden break of cable 1# at arch end is less than the value at other positions, which is due to the supporting effect of the arch end.
4.3. Sensitivity Assessment of Impact Effects
Under actual conditions, it is a more complex and time-consuming work to analyze the dynamic response of cables broken for every bridge, so it is necessary to introduce the dynamic amplification factor (DAF) as a simplified index to assess the sensitivity of the remaining structure to the impact effects of broken cables, which is defined in the following equation:
where:
is the absolute value of the maximum dynamic response of the remaining structure in the dynamic time history analysis of the arch bridge subjected to cable breaking.
is the initial state values of the bridge before cable breaking.
is the stability value of the remaining structure after cable breaks when it reaches its final resting state.
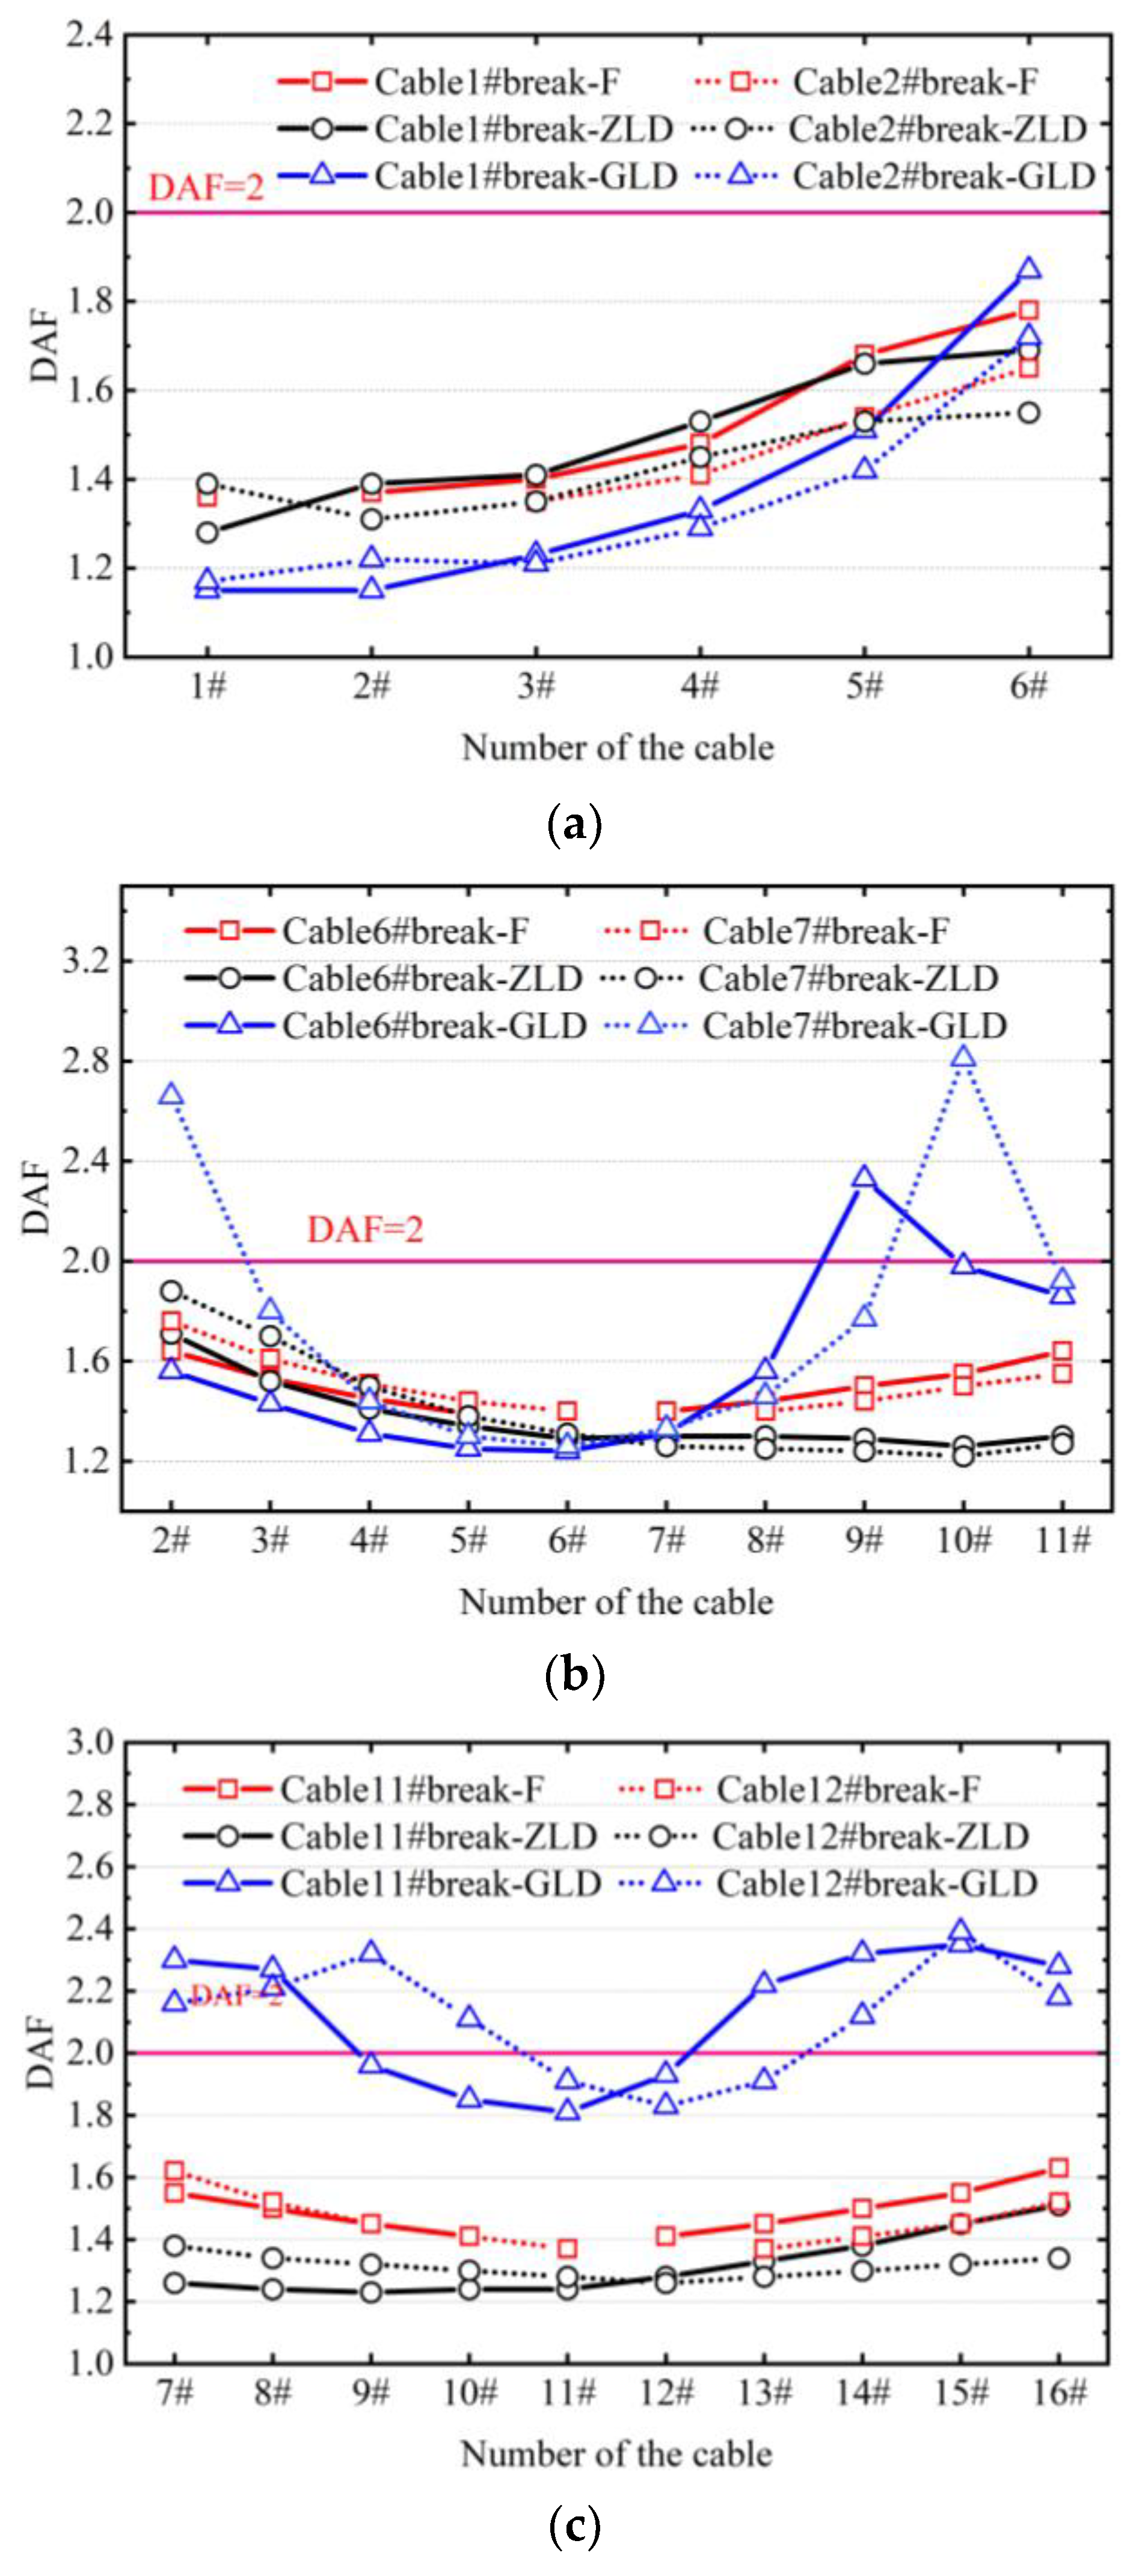
Figure 13 shows the DAF values of the remaining members after the cable breaking at different locations. In this figure, F represents the DAF of the remaining cable’s force; ZLD represents the DAF of the deflection at the anchorage point of the main girder and the cable; GLD represents the DAF of the deflection at the anchorage point of the arch rib and the cable. The further away from the broken cable area, the smaller the change in its cable force and deflection; only the DAF values of the members within the area of 4–5 cables adjacent to the broken cable are considered in this paper. As can be seen from
Figure 12, the DAF of the remaining cable’s force after the cable breaking is between 1.35 and 1.78, and the DAF of the main girder’s deflection is between 1.22 and 1.88, which are both less than the requirement of code (DAF of 2) from PTI [
35]. Therefore, it is conservative to use the DAF values specified in the code to calculate the impact effects of the cable force and main girder’s deflection. It can also be observed that the DAF value of the anchorage point’s deflection of the arch ribs is greater than 2 after the cable abruptly breaks in the L/4 arch rib and mid-span area, and the range of DAF values is from 1.15 to 2.81. Therefore, it is unsafe to simulate the impact effect of the anchorage point’s deflection of the arch ribs by the pseudo-dynamic method with the DAF of 2 specified in the code.
7. Conclusions
In this paper, a model of Guangzhou Haixin Bridge is established based on general finite element software ANSYS, and a semi-dynamic simulation based on the “birth-death element” method is used to simulate cable breakage. The impact effect caused by sudden cable breakage is accurately reflected by comparing and analyzing different breaking durations. The dynamic response of single and double cables after sudden break in three typical areas is analyzed, and the main conclusions are as follows.
(1) The dynamic impact caused by sudden break of the cable decreases with the increase of cable breaking time. When the cable breaking time is greater than T/2 (T is the first order vertical vibration period), the maximum dynamic response value of the remaining members tends to be closer to the static response results, which weakens the impact effect caused by the cable breaking. When the cable breaking time is less than T/100, the impact effect can be accurately reflected.
(2) The impact effect caused by the cable break decreases with the increase of distance from the broken cable, the cable closer to the location of the broken cable has greater final cable force redistribution ratio. For cables with same distance from the broken cable, the shorter has greater increment of the cable force than the longer. Thus, after cable damage or breakage, priority attention should be paid to the shorter of the adjacent cables to ensure the bearing capacity to meet the requirements. After the cable breakage in L/4 arch rib area and mid-span area, all the released cable force is distributed to the remaining cables. However, for short cable breakage near the arch end, part of the cable force is distributed to the remaining cables according to the internal force redistribution principle, and the other is directly transferred to the arch rib through the main girder.
(3) Based on the incremental force of the neighboring cable after a single cable breakage, the dynamic response of the cable force after two cables breaking can be calculated by the ratio of the static and dynamic response increment, taken as 1.7 at the arch end and 2.3 at the L/4 arch rib and mid-span area, conservatively.
(4) The dynamic response of the remaining structure caused by cable breakage differs at different locations. The displacement response and the cable force response caused by sudden cable breakage at the L/4 arch rib area are most significant, the safety factor of cables in this area should be improved. The impact response of the remaining cables caused by the simultaneous breakage of the neighboring two cables is greater than that of the successive breaking condition.
(5) The DAF values of the adjacent cable force caused by single or double cable abrupt breakage at the three typical locations are in the range of 1.35~1.78, and the DAF values of the main girder deflection near the failed cable are in the range of 1.22~1.88. Using the DAF value of 2 according to the specification, the proposed dynamic method reflected that the main girder deflection and the adjacent cable’s force are safe under the impact of cable breakage. At some positions in the L/4 arch rib area and mid-span area, the DAF values of arch rib’s deflection are larger than the code specified value of 2. Therefore, it is unsafe to simulate the impact effect of the anchorage point’s deflection of the arch ribs using the pseudo-dynamic method with the DAF value of 2 specified in the code.
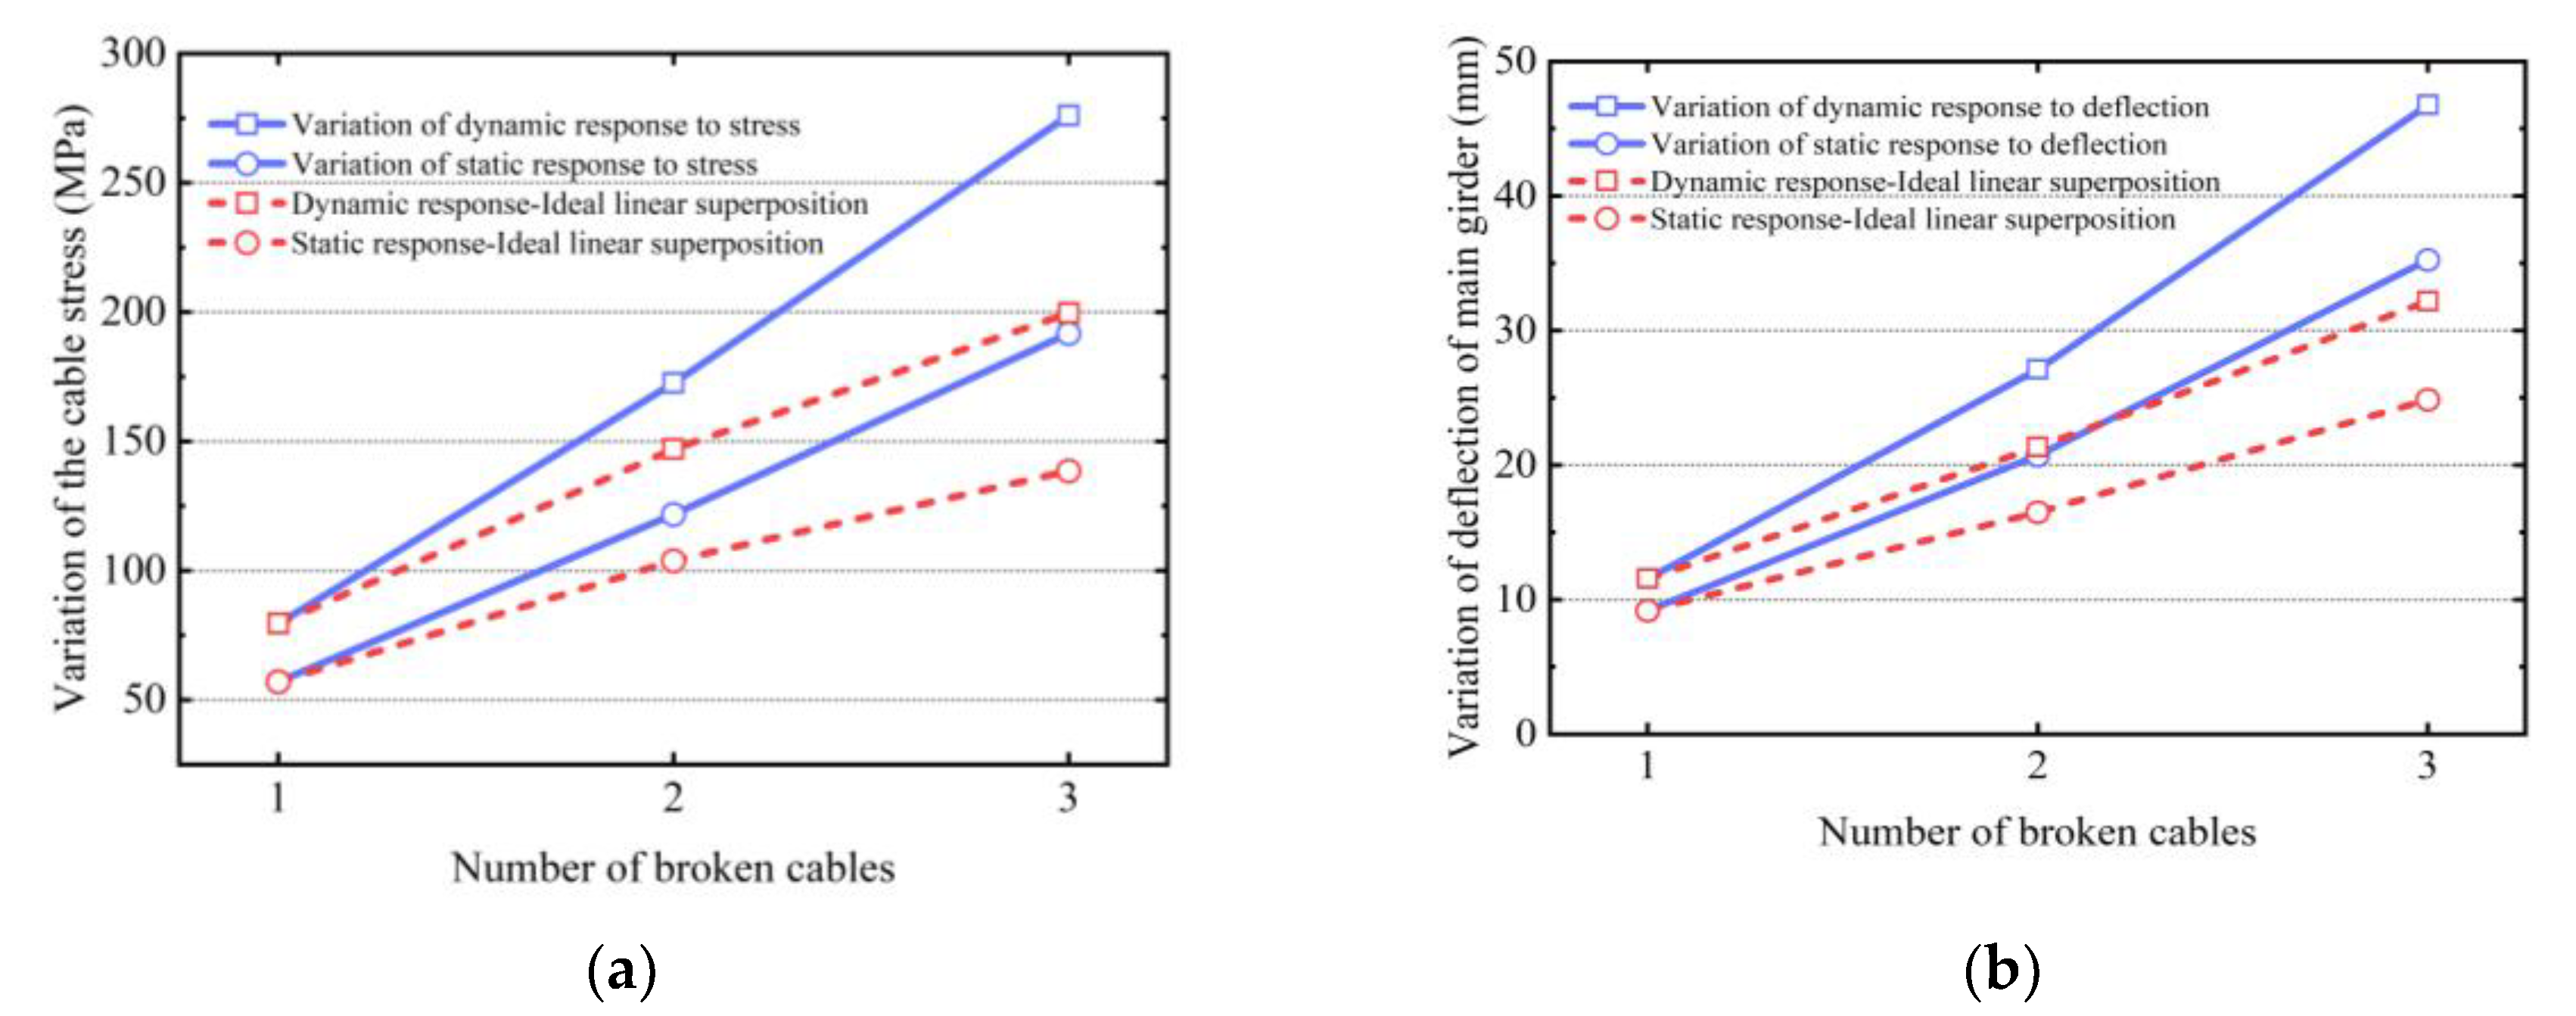
(6) The dynamic response after the simultaneous breakage of multiple cables cannot be simplified to a linear superposition of the corresponding successive breakage of single cable. The dynamic and static response changes in cable stress and main girder deflection caused by simultaneous breakage of multiple cables are higher than those after the corresponding breakage of single cable, and the amplification effect is more significant with the increase in number of broken cables.


