1. Introduction
Ultra-high performance concrete (UHPC) is a type of cementitious composite material with high strength and durability [
1,
2,
3,
4]. The bridging effect of steel fibers randomly dispersed within UHPC can confine the propagation of microcracks [
5] and lead to high tensile strength and ductility [
5]. As a result, using UHPC can decrease the maintenance costs and environmental footprint compared with conventional concrete structures [
6]. Moreover, because of its high early-age strength, UHPC is increasingly attracting interest with respect to accelerated bridge construction [
7,
8].
For example, the fourth Yingde Bridge is a simply supported girder bridge with a span of 102 m. As shown in
Figure 1, it was assembled in situ using precast steam-cured UHPC members. UHPC wet joints connected the precast steam-cured members. The bond behavior of the interface between the precast member and wet joint remains a critical problem for bridge design and is affected by four mechanisms: adhesion, friction, mechanical interlocking, and dowel action (when reinforcement is present) [
9].
The bond behavior of an interface is usually studied under shear or tension conditions. The shear strength of the interface is related to the ultimate limit state in the bridge design and is usually determined via push-off [
10,
11], bi-surface shear [
12,
13], and slant shear [
14,
15] tests. The shear behavior is affected by all four mechanisms [
9]. Therefore, the shear strength can be efficiently improved via surface preparations, such as sandblasting [
13,
14,
16], shear keys [
17], grooving [
12,
18], drilled holes [
11,
12,
13,
18,
19], expanded meshes [
4], and exposed aggregates [
15,
16].
In the structural concrete design, the tensile strength of an interface is related to the serviceability limit state and is usually studied using direct tension [
15], pull-off [
15,
20], three- or four-point bending [
10,
19], and splitting [
14] tests. The bond strength under tension is primarily determined by adhesion [
9]. Prado et al. did not find any surface treatment that was capable of reaching the flexural tensile strength of a monolithic structure; their best result was 4.25 MPa [
9]. Moreover, surface treatments cannot easily improve adhesion and cannot efficiently transmit tensile stress [
9]. Compared with normal- or high-strength concrete, the interface treatment for a precast steam-cured substrate UHPC member is more complicated. First, there is no coarse aggregate in a UHPC mixture. As a result, the interface is very compact, and no exposed coarse aggregate is present on the surfaces, which plays an essential role in determining the tensile bond strength [
9]. Second, no steel fibers are exposed at the interface as a result of the mold. Accordingly, the bridging effect contributing to the high tensile strength of UHPC vanishes at the interface. Third, the interface agent for normal-strength concrete has difficulty permeating into the substrate UHPC because the UHPC matrix is extremely dense (this is discussed in the following sections). Consequently, Semendary et al. found a very low tensile bond strength between precast UHPC and cast-in-place UHPC in direct tension tests [
21]. Due to the compactness of the UHPC interface, the coarse aggregate can is not exposed in the precast UHPC well, resulting in very low bond strength. The highest measured bond strength was only 0.88 MPa for all surface preparations [
21].
This study focuses on the improvement method of flexural tensile behavior of the interface between precast steam-cured and cast-in-place non-steam-cured UHPC members under four-point bending. A new method of exposing fibers using expandable polyethylene (EPE) foam to improve the interface performance was proposed. As a comparison, two traditional interface methods are also tested: coating with epoxy glue and coating with a cement-based concrete interface agent. The measured load-displacement curves and the flexural tensile strength of each specimen are presented and discussed. The numerical model is then proposed to simulate the bond behavior of an interface treated with exposed fibers.
2. Experimental Design
2.1. Materials
2.1.1. Mixture, Curing Procedure, and Mechanical Properties of the UHPC
A UHPC premix was used in this test. The UHPC premix contained Portland cement, silica fume, crushed quartz, and steel fibers. As shown in
Table 1, the UHPC mixture included a superplasticizer and a water reducer. The water to binder ratio was 0.18.
Two types of steel fiber were used in the UHPC mixture: (i) straight and (ii) hooked steel fibers. The geometry and parameters of the steel fibers are presented in
Table 2. The volume fractions of the straight and hooked steel fibers were 1.4 % and 0.6 %, respectively.
During construction, the precast member is cured using steam, whereas the wet joint is not steam cured. Accordingly, steam-cured and non-steam-cured specimens were cast in the mechanical property test.
The steam-cured and non-steam-cured UHPC specimens used the same mixture. A solid blender was used to dry-mix the dry components for 5 min to achieve a uniform mixture. The water, water reducer, and superplasticizer were premixed and then gradually added to the mixture and mixed for an additional 8 min. The molds were filled and compacted on a vibration table. After casting, the specimens were immediately sealed with plastic sheets and stored in a curing room at 20 ± 2 C with a relative humidity of 95% until testing. After curing for the first 48 h, the non-steam-cured specimens were demolded and stored in the same curing room with the plastic covers. Conversely, the steam-cured specimens were heated to 90 C at a rate of 15 C/h after demolding and were stored in the steam-curing equipment for an additional 48 h. After steam-curing, the specimens were cooled to 20 C at a rate of 15 C/h and placed in the same curing room as the non-steam-cured specimens.
Both the compressive strength and the flexural tensile strength of the UHPC were tested. The compressive strength was tested using cylinder specimens with a diameter of 100 mm and a height of 200 mm. The flexural tensile strength was tested with a rectangular specimen with the size of 100 × 100 × 400 mm. For each group, three specimens were tested to assess the statistical variation in the strengths. The results are presented in
Table 3.
2.1.2. Ordinary Concrete
The ordinary concrete with a strength grade of C60 is composed of cement, sand, stone, fly ash, slag, and water-reducer. The mix is shown in
Table 4. The water-cement ratio of the material is 0.31. After standard curing for 28 days, the compressive strength is 74.6 MPa, and the elastic modulus is 34.5 GPa.
2.1.3. Epoxy Glue
Epoxy glue was used in this study. The mechanical properties of this epoxy glue are shown in
Table 5.
2.1.4. Cement-Based Concrete Interface Agent
Cement-based concrete interface agents are primarily used to repair existing concrete structures. An interface agent, which is painted on the old concrete surface, can strengthen the adhesive property of the new-to-old concrete interface and can improve the cohesive strength according to the adhesive model of microcosmic changes in new–old concrete. The cement-based cement interface agent adopted in this test consists of 95% ordinary Portland cement and 5% silica fume.
2.2. Interface Treatment
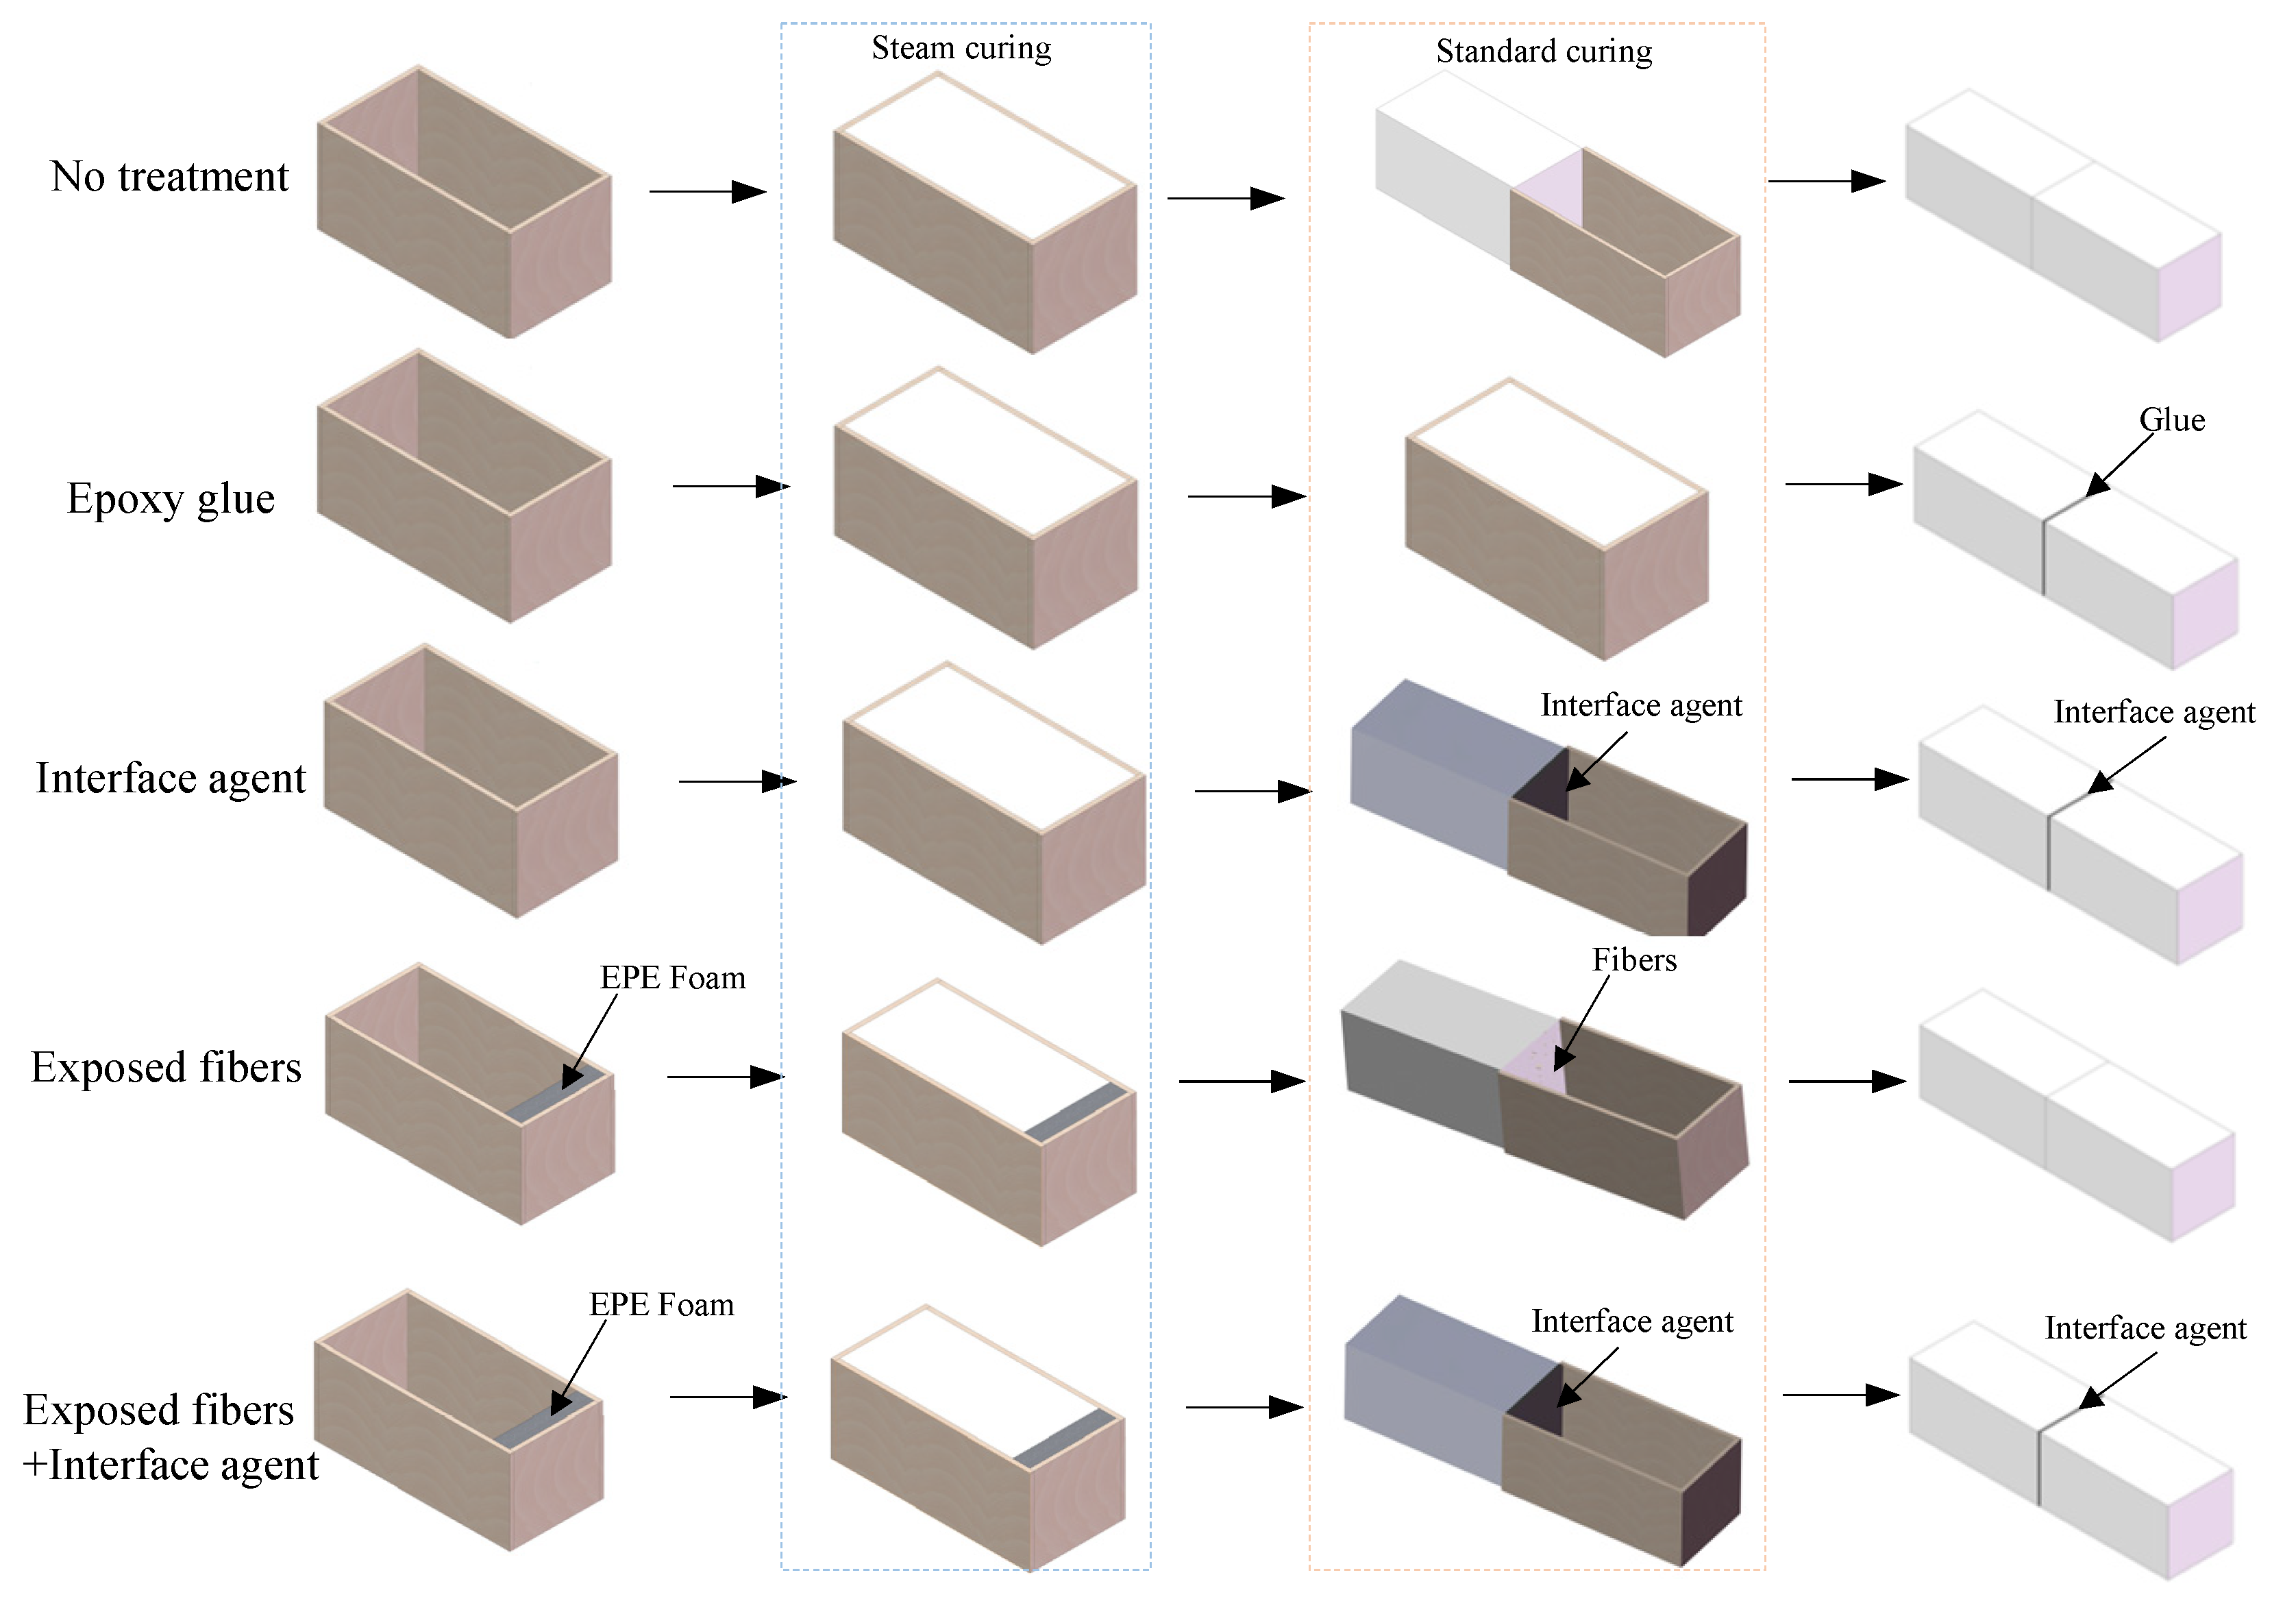
As shown in
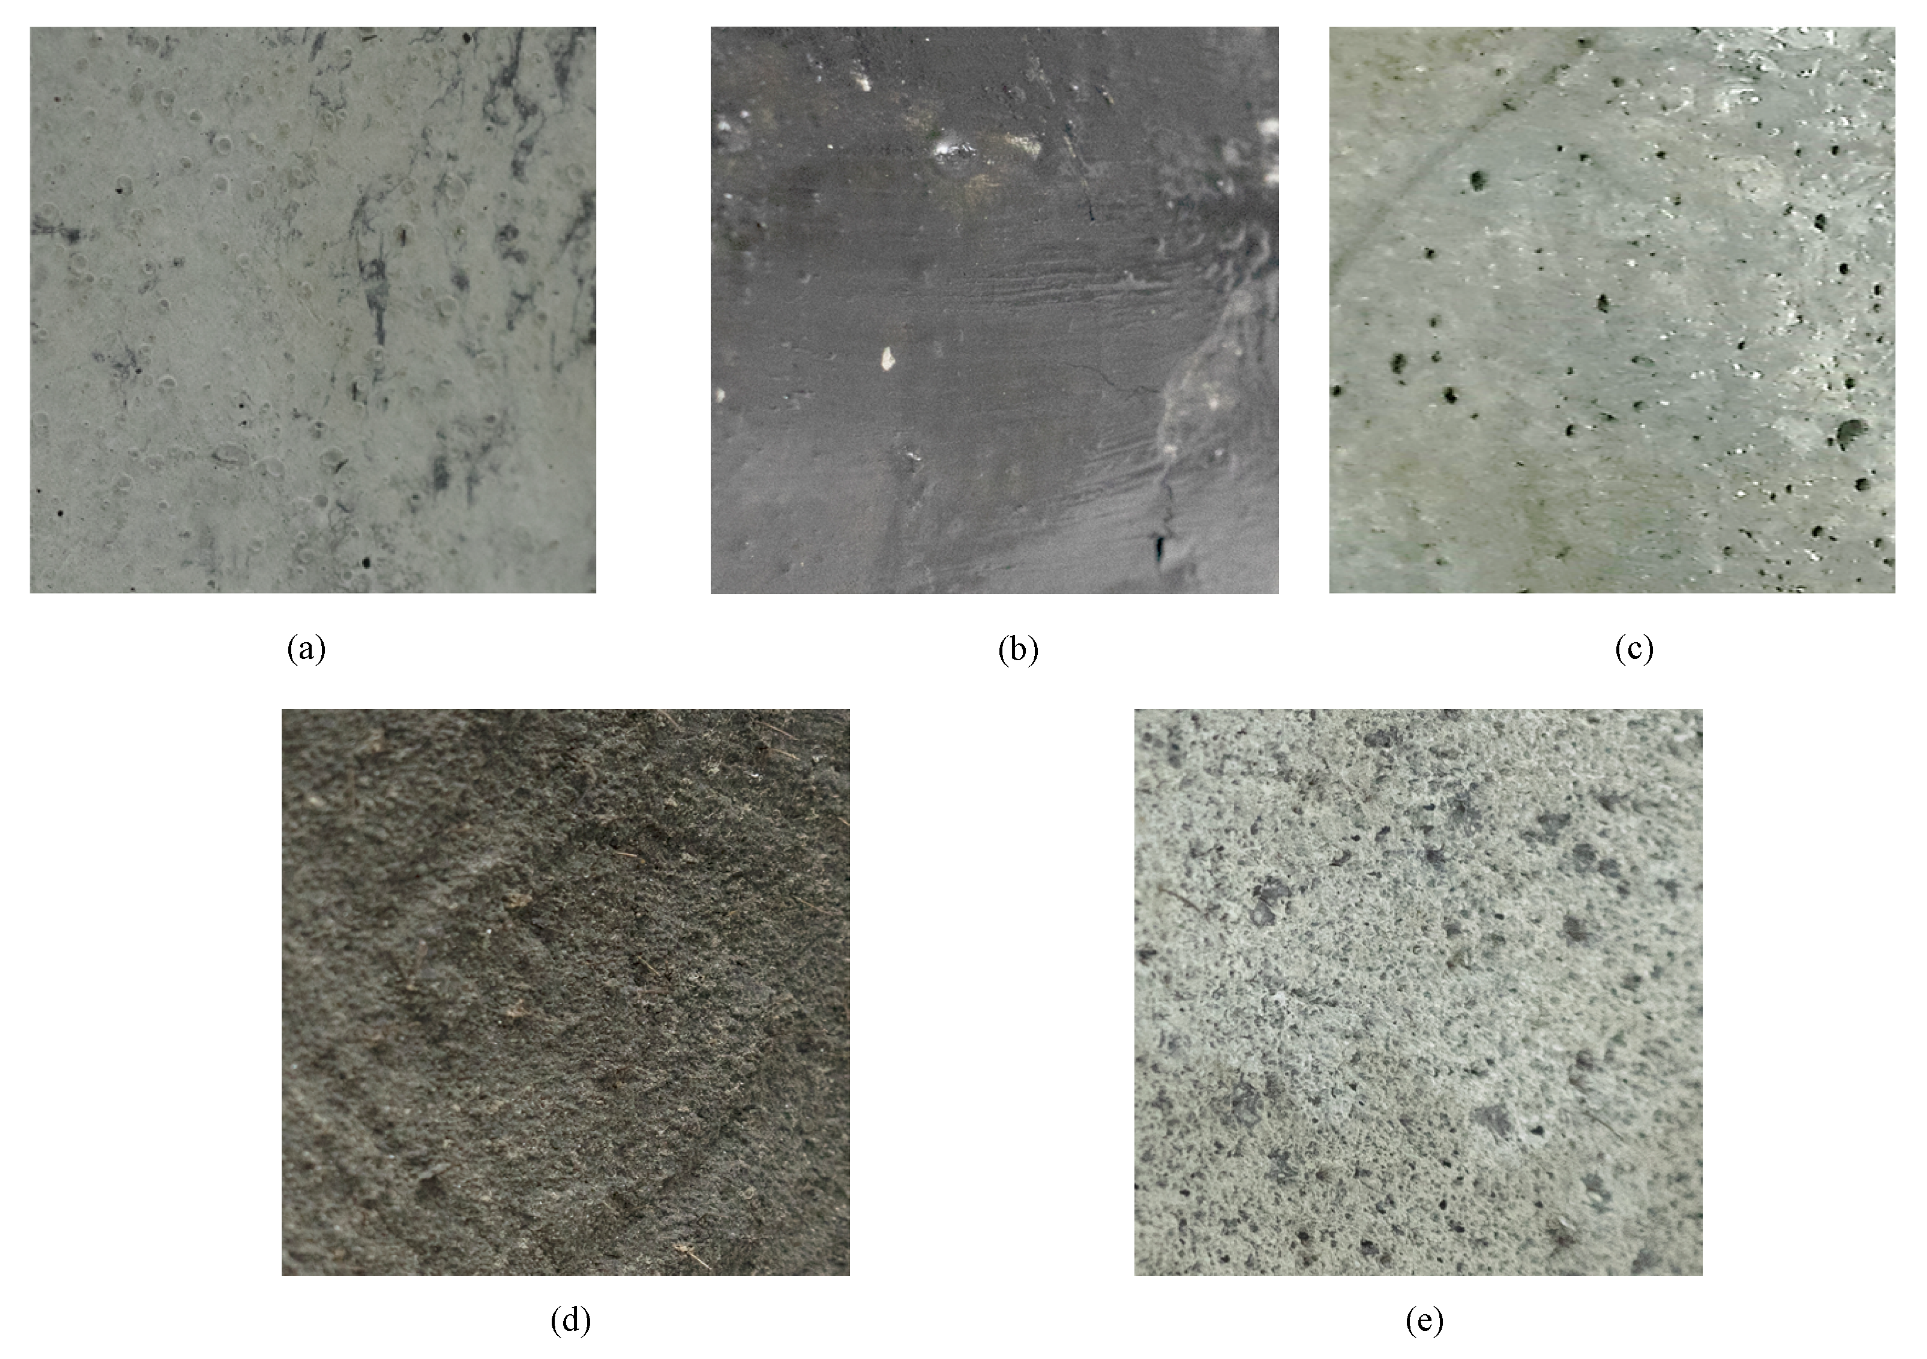
Figure 2, a total of five types of surfaces were prepared on the steam-cured UHPC substrate (i.e., no treatment: NT, epoxy glue: EG, cement-based concrete interface agent: IA, exposed fibers using EPE foam: EPE, and a combination of exposed fibers using EPE foam and the interface agent: EPE-IA). The surface preparations are detailed below.
2.2.1. No Treatment: NT
In the control group, the surfaces of the precast UHPC specimens were not treated. As shown in
Figure 2a, the surfaces were very smooth without any exposed coarse aggregate or fibers after steam curing.
2.2.2. Coating with Epoxy Glue: EG
In this group, the steam-cured precast members were connected using epoxy without a UHPC wet joint. The epoxy glue was coated on the interface of one of the UHPC precast members after 48 h of steam curing to provide the connection with the other precast member. As shown in
Figure 2b, the surface was similar to that without treatment. No exposed coarse aggregate or fibers can be observed.
2.2.3. Coating with the Cement-Based Concrete Interface Agent: IA
In this group, the cement-based concrete interface agent was coated on the interface of a UHPC precast member before the wet joint was cast.
Figure 2c shows that no exposed coarse aggregate or fibers were observed.
2.2.4. Exposing Fibers Using an EPE Foam: EPE
An EPE foam was used to expose the fibers at the interface of the precast UHPC member. As shown in
Figure 3, the EPE foam was attached to the internal surface of the end mold of the precast members. As a result of the rich voids in the EPE foam, the fibers were able to penetrate into the EPE foam. After steam curing, the EPE foam could then be removed.
Figure 2d shows that the surface is rougher and, more importantly, that many exposed fibers are observed at the surface. Then, the UHPC wet joint was cast between the two precast UHPC members.
2.2.5. Combination of Exposing Fibers and Coating with the Interface Agent: EPE-IA
This treatment was a combination of exposing fibers using the EPE foam and coating the interface with the interface agent. In the precast process, the EPE foam was used to expose the fibers at the interface of the precast UHPC members, as discussed above. Then, the cement-based concrete interface agent was coated on the interface after 48 h of steam curing and before the wet joint was cast. The surface, similar to that treated by just the EPE method, is rough and has exposed fibers, as shown in
Figure 2e.
2.3. Specimens
In accordance with the various interface treatment technologies, most of the precast members were connected using a wet joint, except for the treatment using epoxy glue. Therefore, the bond behavior of the former members was determined by the performance of the interface between the steam-cured precast UHPC and the non-steam-cured cast-in-place UHPC. In these cases, as shown in
Figure 4, one precast member with dimensions of 100 × 100 × 200 mm was cast first and then cured using steam. Immediately before casting the wet joint, the UHPC substrate surfaces were cleaned with an air jet, prepared using the corresponding interface treatment, and moistened with water to create saturated surface-dry conditions. The wet joint had the same dimension as the precast member. Ultimately, the tested specimen had a cross-section of 100 × 100 mm and a length of 400 mm.
For the interface treatment using epoxy glue, two precast members with the same dimensions of 100 × 100 × 200 mm were cast and cured using steam. The epoxy glue was coated on the interface of one of the UHPC precast members to provide the connection with the other precast member.
A total of seven groups of specimens were tested in this experiment. Each group included three specimens. As shown in
Table 6, the interfaces of the specimens are labeled UNT, UGL, or UIA to indicate that they were treated with nothing, epoxy glue, or the interface agent, respectively. In addition, the influence of the EPE foam thickness was tested. The interfaces of specimens labeled UEPE20, UEPE25, and UEPE30 had EPE foam thicknesses of 20, 25, and 30 mm, respectively. Accordingly, the combined effect of EPE and the interface agent was studied via the specimen labeled UEPE30A. The EPE thickness of this specimen was 30 mm.
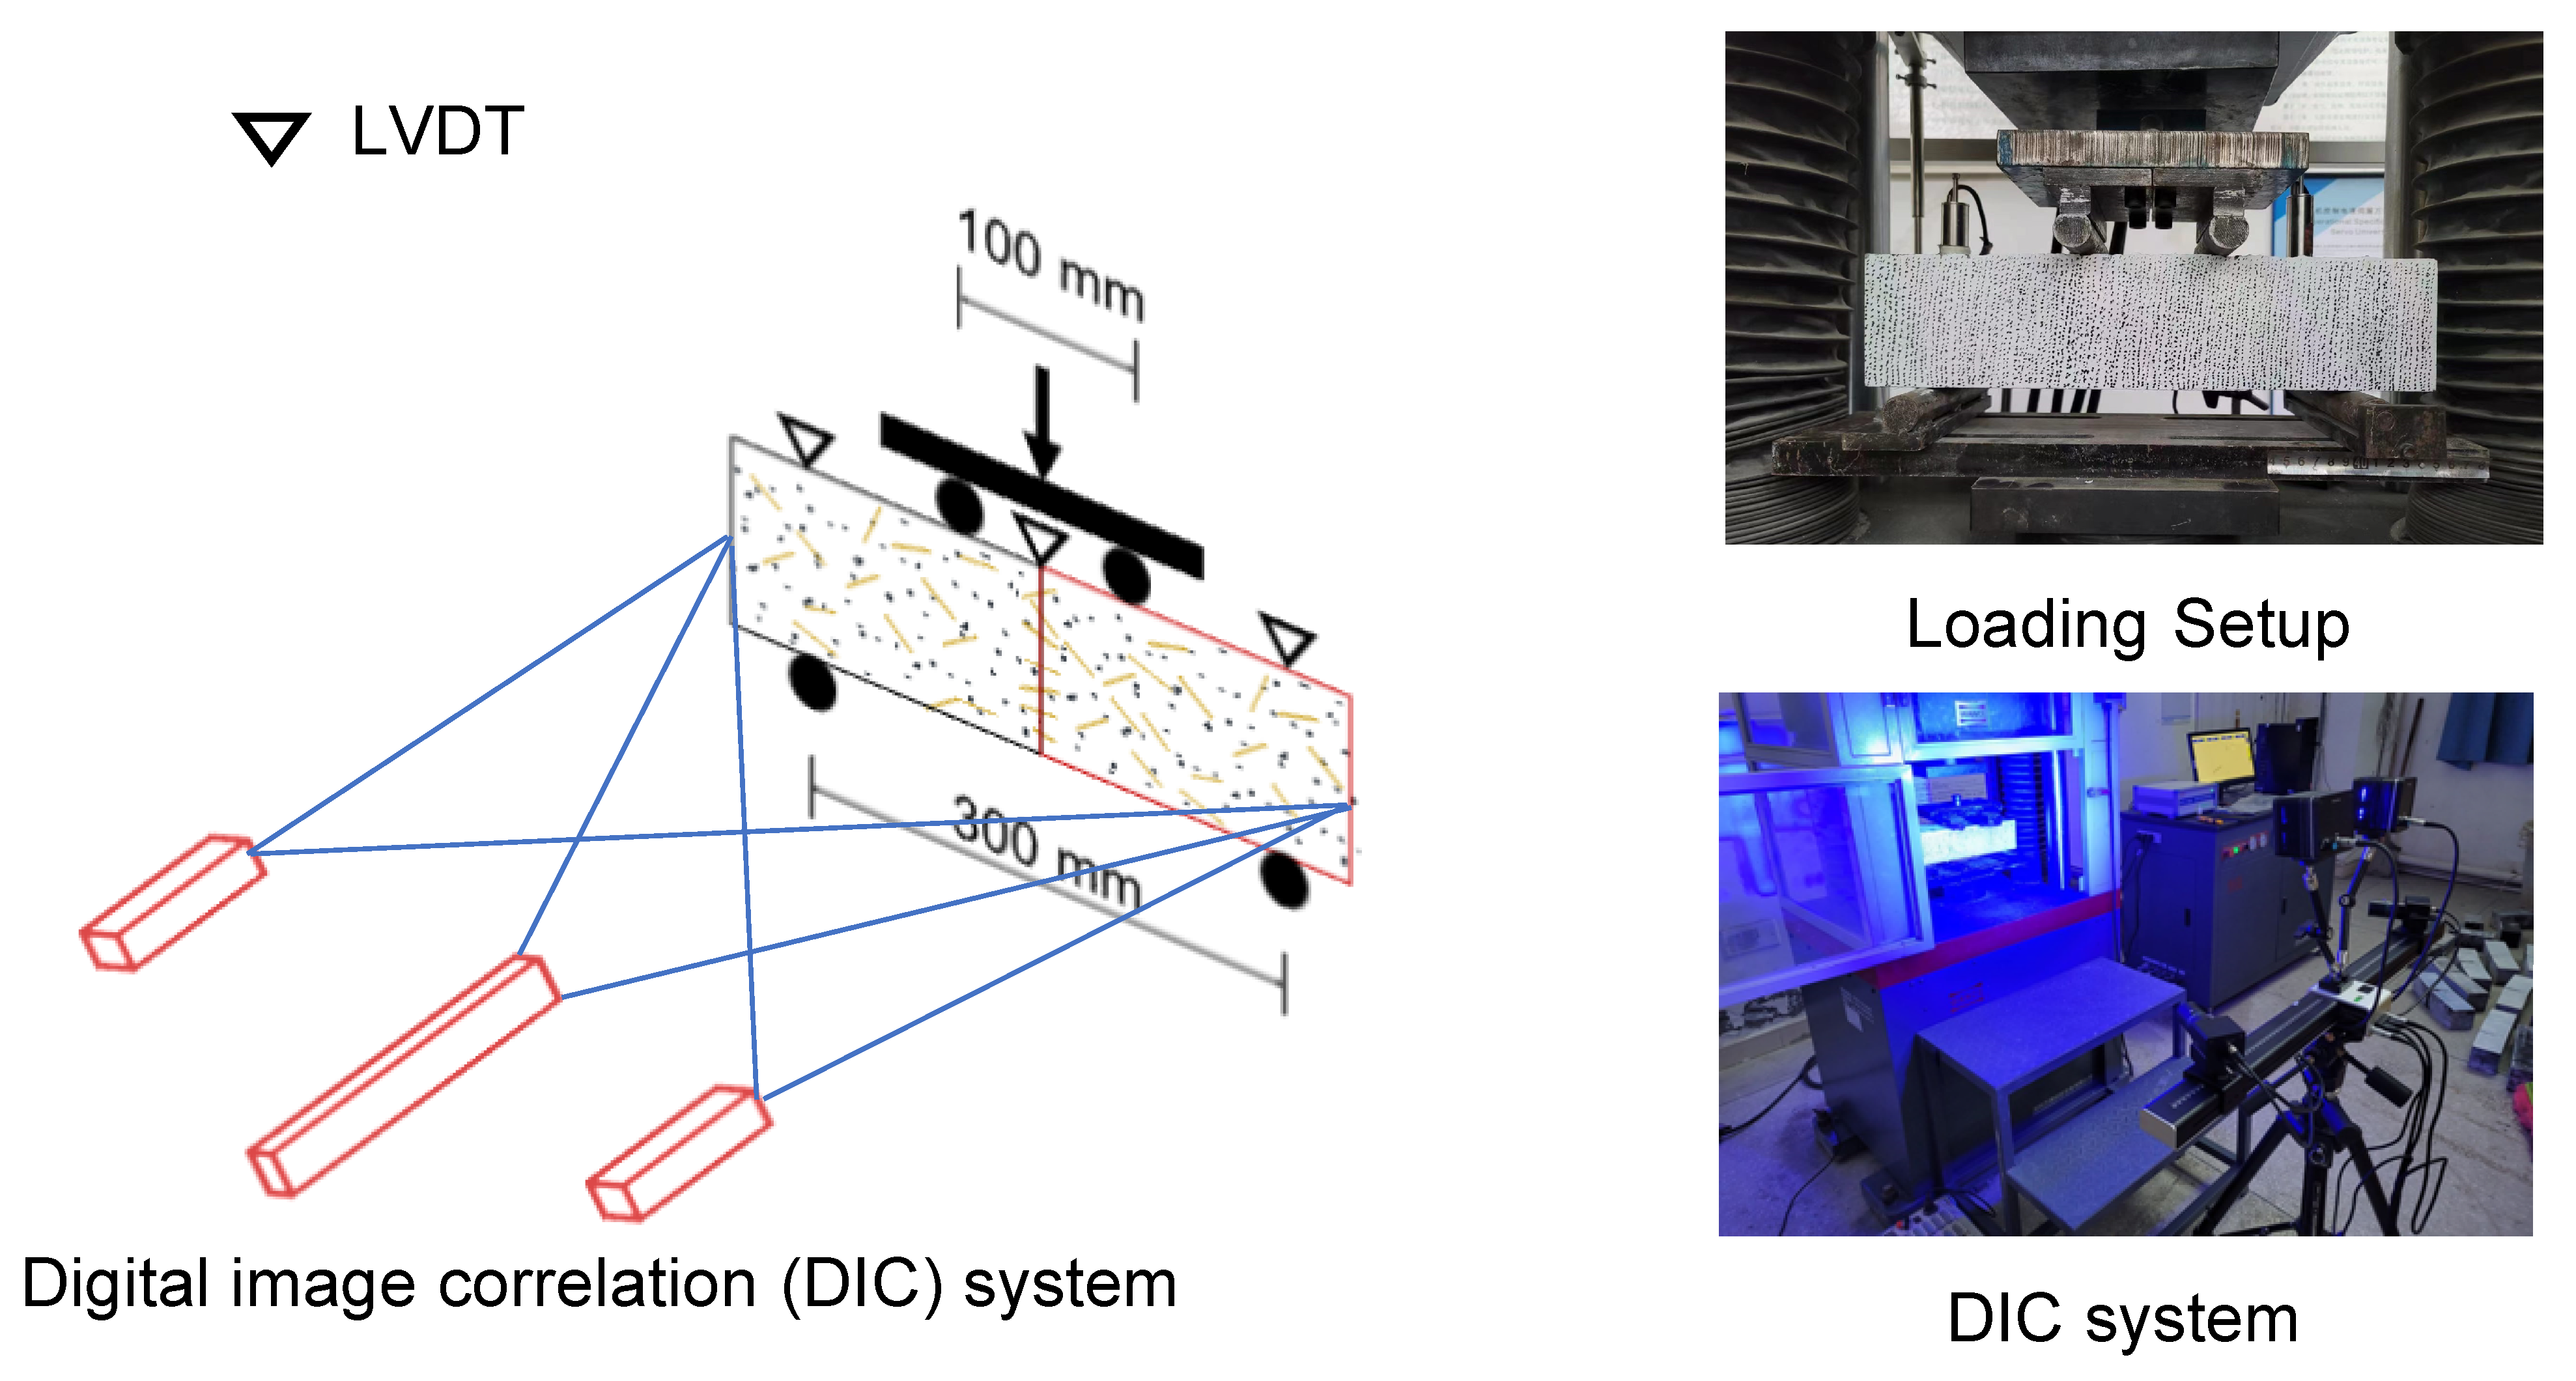
2.4. Loading Setup and Measurement Configuration
The flexural tensile properties of concrete materials are usually tested by the four-point bending test [
22,
23]. As shown in
Figure 5, all specimens were tested under four-point bending conditions with a supporting span of 300 mm and a loading span of 100 mm. The specimens were monotonically loaded using an electro-hydraulic servo universal testing machine under displacement control at a rate of 0.1 mm/s until failure. One linear variable displacement transducer (LVDT) was placed at the mid-span of the specimens to monitor the mid-span deflection. Two LVDTs were placed on the supports of the specimens to monitor the support deflection.
Digital image correlation (DIC) is a non-destructive testing technique capable of measuring the full-field displacement and, consequently, the deformation and strain fields. As shown in
Figure 5, the three-dimensional DIC system was set up on a base and positioned parallel to the front surface of the beam at a distance of approximately 300 mm. Two digital single-lens reflex cameras were used to obtain images of the test specimens throughout testing to enable three-dimensional measurements. An additional blue light was placed on the base and directed toward the region of interest to eliminate the shadow effect as well as maintain the white balance of the images throughout the loading process. To enhance the measurement accuracy for the concrete members, a speckle pattern was applied on the surfaces of the specimens prior to testing. The camera used in this test had a resolution of 4096 × 3000 px.
2.5. Mercury Intrusion Porosimetry Test
Mercury intrusion porosimetry (MIP) was used to determine the porosity and pore size distribution of the steam-cured UHPC and to analyze the effect of the cement-based concrete interface agent. MIP tests were conducted on an AutoPore IV 9500 with a maximum pressure of 400 MPa to measure pores down to a radius of 5.9 nm. For each test, samples were collected randomly from the specimens. Each sample had a weight of 4 g and was shaped prior to measurement. The contact angle and the mercury surface tension used were 130 and 485.0 dynes/cm, respectively.
3. Experimental Results
3.1. Failure Modes and Surface
All specimens had similar failure modes, in which only one crack occurred at the bottom of the interface and then propagated to the top, as shown in
Figure 6. Clearly, the interface is the weakest surface of the specimens, and its behavior determines the flexural tensile strength of the assembled member. Regarding the failure surface, several fibers can be observed across the interfaces that were treated using the EPE foam to expose the fibers (EPE and EPE-IA). For the NT, EG, and IA treatments, no fibers were observed across the interface.
3.2. Load-Deflection Relationship, Flexural Tensile Strength, and Ductility
Figure 7 shows the measured load-deflection relationships for each type of specimen. The UNT (without any treatment) specimen failed earliest when the force was only approximately 1.75 kN. When coating the interface with epoxy glue or the interface agent, the peak forces slightly increased, with values reaching 2.23 and 3.29 kN, respectively. Exposing fibers using the EPE foam significantly increased the peak force. This effect was influenced by the thickness of the EPE foam. The failure forces were 7.6, 10.6, and 12.0 kN with EPE thicknesses of 20, 25, and 30 mm, respectively. For the UEPE30A specimen, the peak force was further increased. The failure force was 14.4 kN, which was approximately equal to the sum of the values of the UIA and UEPE30 specimens.
For the force-deflection curves of the UEPE specimens, before the UHPC interface matrix is pulled apart, the force-deflection curve of the specimen is similar to that of the UHPC specimen without interface. At this time, the concrete matrix and fiber are carrying capacity together. With the increase in force, the UHPC interface is pulled apart, and the stiffness of the specimen begins to decrease. However, with the increase in slip, the pullout force provided by the hooked fiber increases. When the pullout force of the hooked fiber reaches the maximum value, the load of the test piece also reaches the maximum value. Subsequently, the pullout force provided by the fiber began to decline, and the force of the specimens showed a downward trend.
The flexural tensile strength of each specimen can be calculated according to the peak force. The average strength and the coefficient of variance (CoV) of each group of specimens are listed in
Table 7. It is clear that exposing fibers using the EPE foam effectively improves the flexural bond strength. The maximum flexural tensile strength reached 8.66 MPa, which is larger than that reported in Ref. [
9] (4.25 MPa).
The fiber-exposing treatment was also valuable with respect to improving flexural ductility and residual strength. The bending behavior of the UNT specimens was shown to be brittle failure, with the specimens failing immediately when the peak force was reached. However, specimens with the fiber-exposing treatment exhibited post-cracking behavior, as shown in
Figure 7. The deformation ductility index
D can be calculated as follows:
where
is the deflection corresponding to the peak force, and
is the ultimate deflection when the specimen fails.
Figure 8 presents the ductility index of the UEPE20, UEPE25, UEPE30, and UEPE30A specimens. The ductility index increased with increasing EPE foam thickness. For the UEPE20, UEPE25, and UEPE30 specimens, the values of the ductility index ranged from 4.10 to 5.69. In conjunction with the interface agent, the ductility index reached 6.30. In addition, the residual strength increased. As shown in
Figure 8, the UEPE20, UEPE25, and UEPE30 specimens had similar residual strengths with values of approximately 2 MPa. Including the effect of the interface agent can increase the residual strength by 2.73 MPa.
Based on the pullout behavior of steel fibers in UHPC reported by Wille and Naaman [
24], there is still a certain residual pullout force when the steel fiber is not pulled out from the concrete matrix, which still provides flexural tensile strength. Compared to the peak pullout force of the fiber, the residual pullout force is approximately 15% of the peak pullout force. Therefore, the UEPE20, UEPE25, and UEPE30 specimens had similar residual strengths with values of approximately 2 MPa. In addition, the addition of the interface agent enhanced the bond performance between the old and new concrete interfaces, making the steel fiber slip less in the specimens with the interface agent compared to the rest of the specimens. The residual pullout force of the steel fiber was improved, and the residual strength reached 2.73 MPa after using the interface agent.
3.3. Fracture Energy
The fracture energy
is often used to represent the resistance of concrete subjected to tension. It can best be determined via uniaxial tension tests. However, indirect tests, such as three- or four-point bending tests on notched beams, can be used and are easier to perform [
25,
26,
27].
According to the test results, the fracture energy can be calculated as follows:
where
is the area under the load-deflection curve;
;
is the mass of the beam between the supports;
is the mass of the loading frame not attached to the load machine;
g is the acceleration due to gravity; and
A is the area of the cross-section of the tested beam.
The test results for the fracture energy of the specimens are plotted in
Figure 9. The fracture energy of the specimens without any treatment was only 25.19 N/m. This value is much lower than that of ordinary, normal concrete (100–200 N/m:
[
26]). The figure shows that, when using a fiber-exposing treatment, the fracture energy significantly increases as a result of the increase in the flexural strength as well as the extension of the post-cracking component. The fracture energies of the UEPE30 and UEPE30A specimens were 5404 and 6785 N/m, respectively.
The specimens without interface treatment lost their bearing capacity rapidly after reaching the peak load, and the brittle characteristics were obvious. After the interface treatment, the steel fiber can prevent the crack from expanding, and the fracture resistance of the concrete is enhanced. With the increase in the number of steel fibers at the interface, the descending section of the load-displacement curve of the specimen becomes more gentle, and the fracture energy gradually increases. The increase in the fracture energy makes the higher ability of the specimen to suppress crack propagation, and the specimen turns into ductile failure. After the interface treatment, the load-displacement curve of the specimen after the peak load decreases smoothly, and the post-peak load capacity is strong.
3.4. Discussion concerning the Effect of Exposed Fibers
Exposed fibers spanning the interface provide a bond between the precast and cast-in-site UHPC surfaces as a result of the bridging effect. Obviously, the contribution of the exposed fibers depends on their quantity and the exposed length, which may be affected by the thickness of the foam.
A series of surfaces was produced using EPE foam with thicknesses ranging from 12 to 30 mm. The number of fibers spanning the interface was counted, and the exposed length of the fibers beyond the interface was measured. Note that only fibers whose exposed length was longer than 1 mm were considered. The results are shown in
Figure 10.
After being exposed by EPE foam, the fibers showed a random distribution. The fiber perpendicular to the interface direction contributes significantly to the bending capacity of the interface. Therefore, the length of the fiber perpendicular to the interface is statistically analyzed. As shown in
Figure 10a, the number of exposed fibers increased with increasing foam thickness. When the thickness was less than 20 mm, the growth was very rapid; then, it became stable. The exposed length of the fibers appears to be independent of the thickness of the foam. The average exposed length of the fibers was approximately 5.5 mm, slightly less than half of the full length (13 mm) of the fibers. These results are consistent for the bond behavior tests on the specimens with the fiber-exposing treatment using EPE foam (i.e., UEPE20, UEPE25, and UEPE30). For the UEPE30 specimens, the percentage of fibers left on the interface was calculated as 0.19%, which is much lower than the UHPC specimen without an interface. This leads to its tensile strength being much lower than those of the UHPC materials used.
3.5. Discussion concerning the Porosity of Steam-Cured UHPC and the Effect of the Interface Agent
The cement-based concrete interface agent consisted of ordinary Portland cement and silica fume. The silica fume was composed of very small particles that can seep into the substrate interface of normal-strength concrete to increase its adhesive strength. In this experiment, the silica fume was tested using the Malvern sizer. The average particle size of the silica fume was approximately 0.08 m.
The effect of the interface agent in the presented experiments was minimal. The flexural tensile strength of the interface treated with the interface agent was only 1.97 MPa, as shown in
Table 7. This effect is weaker than that observed for normal-strength concrete. This is related to the porosity of the steam-cured UHPC.
The porosity and pore size distribution of the steam-cured UHPC were measured via the MIP test. For comparison, the porosity and pore size distribution of normal-strength concrete with a compressive strength of 60 MPa (C60) were also measured. The results are given in
Table 8 and plotted in
Figure 11.
The steam-cured UHPC had a denser pore structure than C60. The cumulative pore volumes, which are related to the mercury volumes, of UHPC and C60 were 0.0171 and 0.0266 mL/g, respectively. As a result, the tested porosities of UHPC and C60 were 4.22% and 6.42%, respectively. Moreover, as shown in
Figure 11b, the main pore diameters of UHPC ranged from 1 to 50 nm, whereas the main pore diameters of C60 were between 40 and 270 nm. In addition, a principal peak can be observed in the pore size distribution curve in
Figure 11b; this is the so-called critical pore size
. The figure shows that the critical pore sizes
of UHPC and C60 were 12 and 114 nm, respectively.
Considering the average particle size of the silica fume (80 nm), this indicates that the cement-based interface agent can seep into the normal-strength concrete interface but not into the steam-cured UHPC interface. This appears to be the reason why the interface agent provided only a very limited bond between the precast and cast-in-place UHPC members.
4. Numerical Model and Verification
The material constitutive models of the UHPC members are shown in
Figure 12. For compression,
is 118.9 MPa;
is 3200
;
is 10,000
, and Young’s modulus is 40 GPa. The Poisson’s ratio of the UHPC is 0.2.
Static analysis is used with nonlinearity. As shown in
Figure 12, the interface was simulated with a hard contract (for compression) and with nonlinear springs (for tension). The connection between the two interfaces is made using the spring described above. For grid type, the concrete was set as a C3D8R unit with a mesh size of 10 × 10 mm. The constraint on the lower left end of the beam was set as a fixed hinge support, and the lower right end constraint was set as a rolling hinge support.
As shown in
Figure 12, the interface was simulated with a hard contract (for compression) and with nonlinear springs (for tension). The fibers through the interface were simulated as springs connecting the two interfaces. The interface is divided into 10 areas according to height, and each area is equipped with 2 springs. The spring’s constitution is obtained by converting the corresponding straight fiber and hooked fiber in this area. The nonlinear properties of the springs were determined according to the bond between the steel fibers and the UHPC matrix. Wille and Naaman reported the pullout behavior of steel fibers in UHPC [
24]. According to their test results for the straight fibers (S fibers) and hooked fibers (H fibers), which were used in this paper, simplified models were proposed and are plotted in
Figure 12. For all specimens treated with EPE foam at the interface, the fibers passing through the interface include straight fibers and hook fibers. The ratio of the two is approximately the same as in UHPC materials. The properties of the springs can be calculated according to these models, the numbers of the two types of steel fibers and the exposed length of the fibers.
Using the proposed numerical model, the load-deflection curves of the tested specimens can be calculated.
Figure 13 illustrates a comparison between the test and simulation results. The numerical model accurately predicts the bending behavior of the specimens, including the initial stiffness, cracking point, and flexural tensile strength.
Table 9 shows a comparison between the test and calculation of flexural tensile strengths. When the deflection is larger than 0.3 mm, the calculation cannot proceed because of a convergence problem resulting from the strong nonlinearity of the problem.
As shown in
Figure 5, the three-dimensional DIC system was set up on a base and positioned parallel to the front surface of the beam at a distance of approximately 300 mm. During the test, the DIC system was used to collect the loading point and fulcrum displacement of the specimen and the strain distribution at each stage of the loading process.
Figure 14 shows the test and simulation stress distributions of the specimens at the initial cracking point. Similar strain distributions for the specimens were observed. The maximum tensile stress originates at the bottom of the interface as a result of the bridging effect of the steel fibers.
The good agreement between the tests and the simulations indicates both the effectiveness of the model strategy and the fact that the flexural tensile behavior of the series of UEPE specimens depends on the bond between the exposed steel fibers and the UHPC.
5. Conclusions
In this study, the bond behavior of the interface between precast steam-cured and cast-in-place non-steam-cured UHPC members under four-point bending conditions was studied. The effects of four types of interface treatments were investigated. The following conclusions can be drawn.
1. Without any treatment, the flexural tensile strength of the interface is 1.06 MPa, which is very low. Treating the interface with an ordinary interface treatment method, such as coating with cement epoxy glue or a cement-based interface agent, has a limited effect on improving the flexural tensile strength. The flexural tensile strength of the above is 1.36 and 1.97 MPa. Compared with the flexural tensile strength of UHPC, the strength of these two treatments reached 6.6% and 9.5%, respectively.
2. Using an EPE foam, the steel fibers can be exposed across the interface in a non-destructive way. This treatment can significantly improve the flexural tensile strength, ductility, and residual strength of an interface. Compared with the traditional concrete interface treatment method, the use of EPE foam on exposed fiber is easier to apply and can better improve the flexural tensile strength of the UHPC interface. Compared with the specimens treated with the interface agent, the flexural tensile strength of the UEPE20 specimens is 4.68 MPa, and the flexural tensile strength is increased by 137%. As the thickness of the EPE foam increases, the bending and tensile strength gradually increases. Compared with the 20-mm-thick foam sample, the flexural tensile strength of the UEPE25 specimens and the UEPE30 specimens increased by 34% and 56%, respectively.
3. Both the experimental and calculated results confirm that the number of exposed steel fibers is a key factor affecting the improved performance of the interface. The enhancement effect positively correlates with the amount of fibers through the interface. For the specimens with an EPE foam thickness of less than 20 mm, a higher EPE foam thickness is appropriate for the deformability and toughness on account of its positive effect on the amount of fibers through the interface. However, when the foam thickness exceeds 25 mm, as the foam thickness increases, the number of fibers through the interface has no significant change. In such a case, the addition of EPE foam thickness could cause the weakening effect of flexural tensile strength. Further studies need to be performed while exposing a larger number of steel fibers across the interface.
4. A numerical model was presented for predicting the stress and deflection curve. The proposed numerical model can be used to simulate the flexural tensile strength of an interface with fiber-exposing treatments. The research results prove that beams can achieve both satisfied flexural behavior and operation convenience with the interfacial improvement technology. It should also be pointed out that further study on the relationship between the macroscopic mechanical response and microstructure evolution of UHPC with the interface is needed to better understand the underlying failure mechanism.
Author Contributions
Conceptualization, H.C. and Z.Z.; methodology, Z.L.; software, T.X.; validation, Z.L., H.C., and Z.Z.; formal analysis, Z.L.; investigation, Z.X.; resources, T.X.; data curation, Z.X.; writing—original draft preparation, H.C. and Z.Z.; writing—review and editing, Z.Z.; visualization, T.X.; supervision, H.C.; project administration, Z.Z.; funding acquisition, Z.Z. All authors have read and agreed to the published version of the manuscript.
Funding
This research was funded by National Key Research and Development Program of China with Grant No.2022YFB2602902.
Institutional Review Board Statement
Not applicable.
Informed Consent Statement
Not applicable.
Data Availability Statement
The data presented in this study are available on request from the corresponding author.
Conflicts of Interest
The authors declare no conflict of interest.
References
- Qi, J.; Ma, Z.J.; Wang, J. Shear strength of UHPFRC beams: Mesoscale fiber-matrix discrete model. J. Struct. Eng. 2017, 143, 04016209. [Google Scholar] [CrossRef]
- Wille, K.; Naaman, A.E.; El-Tawil, S.; Parra-Montesinos, G.J. Ultra-high performance concrete and fiber reinforced concrete: Achieving strength and ductility without heat curing. Mater. Struct. 2012, 45, 309–324. [Google Scholar] [CrossRef]
- Wille, E.; El-Tawil, S.; Naaman, A.E. Properties of strain hardening ultra high performance fiber reinforced concrete (UHP-FRC) under direct tensile loading. Cem. Concr. Comp. 2014, 48, 53–66. [Google Scholar] [CrossRef]
- Qi, J.; Cheng, Z.; Ma, Z.J.; Wang, J.; Liu, J. Bond strength of reinforcing bars in ultra-high performance concrete: Experimental study and fiber–matrix discrete model. Eng. Struct. 2021, 248, 113290. [Google Scholar] [CrossRef]
- Qi, J.; Wang, J.; Ma, Z.J. Flexural response of high-strength steel-ultra-high-performance fiber reinforced concrete beams based on a mesoscale constitutive model: Experiment and theory. Struct. Concr. 2018, 19, 719–734. [Google Scholar] [CrossRef]
- Garas, V.Y.; Kurtis, K.E.; Kahn, L.F. Creep of UHPC in tension and compression: Effect of thermal treatment. Cem. Concr. Comp. 2012, 34, 493–502. [Google Scholar] [CrossRef]
- Zhang, Z.; Xu, T.; Deng, K.; Tong, T.; Zhou, H. Experimental Study on Creep Failure of Non-Steam-Cured Ultrahigh-Performance Concrete under High Uniaxial Compressive Stress. J. Mater. Civ. Eng. 2022, 34, 04022105. [Google Scholar] [CrossRef]
- Zhang, Z.; Xu, T.; Castel, A. Damage of non-steam-cured UHPC under axial compression with and without short-term sustained loading history. Structures 2022, 38, 1066–1078. [Google Scholar] [CrossRef]
- Prado, L.P.; Carrazedo, R.; Debs, M. Interface strength of High-Strength concrete to Ultra-High-Performance concrete. Eng. Struct. 2022, 252, 113591. [Google Scholar] [CrossRef]
- Hussein, H.H.; Walsh, K.K.; Sargand, S.M.; Steinberg, E.P. Interfacial Properties of Ultra-high-Performance Concrete and High-Strength Concrete Bridge Connections. J. Mater. Civ. Eng. 2016, 28, 04015208. [Google Scholar] [CrossRef]
- Semendary, A.A.; Hamid, W.K.; Steinberg, E.P.; Khoury, I. Shear friction performance between high strength concrete (HSC) and ultra high performance concrete (UHPC) for bridge connection applications. Eng. Struct. 2020, 205, 110122. [Google Scholar] [CrossRef]
- Zhang, Y.; Zhu, P.; Liao, Z.; Wang, L. Interfacial bond properties between normal strength concrete substrate and ultra-high performance concrete as a repair material. Constr. Build. Mater. 2020, 235, 117431. [Google Scholar] [CrossRef]
- Valikhnai, A.; Jahromi, A.J.; Mantawy, I.M.; Azizinamini, A. Effect of mechanical connectors on interface shear strength between concrete substrates and UHPC: Experimental and numerical studies and proposed design equation. Constr. Build. Mater. 2020, 267, 120587. [Google Scholar] [CrossRef]
- Feng, S.; Xiao, H.; Li, H. Comparative studies of the effect of ultrahigh-performance concrete and normal concrete as repair materials on interfacial bond properties and microstructure. Eng. Struct. 2020, 222, 111122. [Google Scholar] [CrossRef]
- Semendary, A.A.; Svecova, D. Factors affecting bond between precast concrete and cast in place ultra high performance concrete (UHPC). Eng. Struct. 2020, 216, 110746. [Google Scholar] [CrossRef]
- Valikhnai, A.; Jahromi, A.J.; Mantawy, I.M.; Azizinamini, A. Experimental evaluation of concrete-to-UHPC bond strength with correlation to surface roughness for repair application. Constr. Build. Mater. 2019, 238, 117753. [Google Scholar] [CrossRef]
- Liu, T.; Wang, Z.; Guo, J.; Wang, J. Shear Strength of Dry Joints in Precast UHPC Segmental Bridges: Experimental and Theoretical Research. J. Bridge Eng. 2019, 24, 04018100. [Google Scholar] [CrossRef]
- Zhang, Y.; Zhang, C.; Zhu, Y.; Cao, J.; Shao, X. An experimental study: Various influence factors affecting interfacial shear performance of UHPC-NSC. Constr. Build. Mater. 2019, 236, 1–15. [Google Scholar] [CrossRef]
- Ganesh, P.; Murthy, A.R. Simulation of surface preparations to predict the bond behaviour between normal strength concrete and ultra-high performance concrete. Constr. Build. Mater. 2020, 250, 118871. [Google Scholar] [CrossRef]
- Jafarinejad, S.; Rabiee, A.; Shekarchi, M. Experimental investigation on the bond strength between Ultra high strength Fiber Reinforced Cementitious Mortar & conventional concrete. Constr. Build. Mater. 2019, 229, 116814. [Google Scholar]
- Semendary, A.A.; Svecova, D. Bond Characterization and Interfacial Coefficients at Precast UHPC and Cast-in-Place UHPC Interface. J. Mater. Civ. Eng. 2021, 33, 04021143. [Google Scholar] [CrossRef]
- Karalar, M.; Bilir, T.; Çavuşlu, M.; Özkiliç, Y.O.; Sabri Sabri, M.M. Use of recycled coal bottom ash in reinforced concrete beams as replacement for aggregate. Front. Mater. 2022, 9, 1064604. [Google Scholar] [CrossRef]
- Karalar, M.; Özkılıç, Y.O.; Aksoylu, C.; Sabri Sabri, M.M.; Beskopylny, A.N.; Stel’makh, S.A.; Shcherban’, E.M. Flexural behavior of reinforced concrete beams using waste marble powder towards application of sustainable concrete. Front. Mater. 2022, 9, 1–13. [Google Scholar] [CrossRef]
- Wille, K.; Naaman, A.E. Pullout Behavior of High-Strength Steel Fibers Embedded in Ultra-High-Performance Concrete. ACI Mater. J. 2012, 109, 479–487. [Google Scholar]
- Darwin, D.; Barham, S.; Kozul, R.; Luan, S. Fracture Energy of High-Strength Concrete. ACI Mater. J. 2001, 98, 410–417. [Google Scholar]
- CEB-FIP. fib Model Code for Concrete Structures 2010; Thomas Thelford: Lausanne, Switzerland, 2010. [Google Scholar]
- Yin, Y.; Qiao, Y.; Hu, S. Four-point bending tests for the fracture properties of concrete. Eng. Fract. Mech. 2019, 211, 371–381. [Google Scholar] [CrossRef]
Figure 1.
Accelerated bridge construction using ultra-high performance concrete (UHPC) for the fourth Yingde Bridge.
Figure 1.
Accelerated bridge construction using ultra-high performance concrete (UHPC) for the fourth Yingde Bridge.
Figure 2.
Surface preparation for the precast UHPC substrate: (a) no treatment (NT), (b) epoxy glue (EG), (c) cement-based concrete interface agent (IA), (d) exposed fibers using expandable polyethylene foam (EPE), and (e) a combination of exposed fibers using expandable polyethylene foam and the interface agent (EPE-IA).
Figure 3.
Interfacical improvement technology between precast members and the cast-in-site closure.
Figure 3.
Interfacical improvement technology between precast members and the cast-in-site closure.
Figure 4.
Interface treatments on the steamed-cured substrate.
Figure 4.
Interface treatments on the steamed-cured substrate.
Figure 5.
Loading setup and measurement configuration.
Figure 5.
Loading setup and measurement configuration.
Figure 6.
Failure modes and surfaces of the specimens.
Figure 6.
Failure modes and surfaces of the specimens.
Figure 7.
Measured load-deflection curves.
Figure 7.
Measured load-deflection curves.
Figure 8.
Ductility index and residual strength of the specimens.
Figure 8.
Ductility index and residual strength of the specimens.
Figure 9.
Fracture energy of the specimens.
Figure 9.
Fracture energy of the specimens.
Figure 10.
Statistics concerning the exposed fibers with increasing foam thickness: (a) Numbers of exposed fibers; (b) Exposed length of fibers.
Figure 10.
Statistics concerning the exposed fibers with increasing foam thickness: (a) Numbers of exposed fibers; (b) Exposed length of fibers.
Figure 11.
Distributions of the pore volume: (a) Cumulative pore volume curves; (b) Log differential pore volume curves.
Figure 11.
Distributions of the pore volume: (a) Cumulative pore volume curves; (b) Log differential pore volume curves.
Figure 12.
Numerical model of the tested specimens using ABAQUS [
25].
Figure 12.
Numerical model of the tested specimens using ABAQUS [
25].
Figure 13.
Comparison between the test and calculation load-deflection curves.
Figure 13.
Comparison between the test and calculation load-deflection curves.
Figure 14.
Strain distribution of specimens at the initial cracking point.
Figure 14.
Strain distribution of specimens at the initial cracking point.
Table 1.
Ultra-high performance concrete (UHPC) mixture (kg/m).
Table 1.
Ultra-high performance concrete (UHPC) mixture (kg/m).
| Materials | Mass |
|---|
| Portland cement | 680 |
| Fly ash | 200 |
| Silica fume | 170 |
| Crushed quartz | 1150 |
| Steel fibers | 100 |
| Water | 156 |
| Superplasticizer | 180 |
| Water reducer | 14 |
Table 2.
Properties of the steel fibers used in the UHPC premix.
Table 2.
Properties of the steel fibers used in the UHPC premix.
| | S | H |
| | ![Buildings 13 00745 i001]() | ![Buildings 13 00745 i002]() |
| Fiber shape | Straight | Hooked end |
| Length (mm) | 13 | 13 |
| Wire diameter (mm) | 0.2 | 0.2 |
| Aspect ratio | 65 | 65 |
| Tensile strength (MPa) | 2600 | 2600 |
| volume fractions | 1.4% | 0.6% |
Table 3.
Compressive strength and tensile strength of non-steam-cured and steam-cured UHPC specimens.
Table 3.
Compressive strength and tensile strength of non-steam-cured and steam-cured UHPC specimens.
| Curing Procedure | Age | Compressive Strength
| Flexural Tensile Strength
|
|---|
| (Days) | Mean Value | CoV | Mean Value | CoV |
|---|
| Steam-cured | 7 | 138.31 | 2.5% | 30.68 | 4.2% |
| 28 | 143.45 | 3.1% | 32.26 | 3.7% |
| Non-steam-cured | 7 | 71.24 | 6.6% | 10.35 | 7.2% |
| 28 | 118.89 | 4.8% | 20.60 | 5.6% |
Table 4.
Mixture of C60 (kg/m).
Table 4.
Mixture of C60 (kg/m).
| Materials | Mass |
|---|
| Cement | 448 |
| Sand | 626 |
| Stone | 1022 |
| Fly ash | 56 |
| Slag | 56 |
| Water | 174.7 |
| Water reducer | 2 |
Table 5.
Mechanical properties of the epoxy glue.
Table 5.
Mechanical properties of the epoxy glue.
| Mechanical Properties | Value |
|---|
| Tensile strength | 50.4 MPa |
| Tension elastic modulus | 6.6 GPa |
| Elongation | 2.60% |
Table 6.
Detailed summary of specimens.
Table 6.
Detailed summary of specimens.
| No | Specimen | Surface Treatment | Width of EPE (mm) |
|---|
| 1 | UNT | No | - |
| 2 | UGL | Epoxy glue | - |
| 3 | UIA | Interface agent | - |
| 4 | UEPE20 | Exposed fibers by EPE | 20 |
| 5 | UEPE25 | Exposed fibers by EPE | 25 |
| 6 | UEPE30 | Exposed fibers by EPE | 30 |
| 7 | UEPE30A | Exposed fibers + Interface agent | 30 |
Table 7.
Flexural tensile strength of the specimens.
Table 7.
Flexural tensile strength of the specimens.
| Specimens | Strength (MPa) |
|---|
| Mean | CoV |
|---|
| UNT | 1.06 | 2.80% |
| UGL | 1.36 | 1.02% |
| UIA | 1.97 | 1.39% |
| UEPE20 | 4.68 | 0.74% |
| UEPE25 | 6.48 | 0.53% |
| UEPE30 | 7.34 | 0.33% |
| UEPE30A | 8.78 | 0.37% |
Table 8.
Porosity, total intruded mercury volume, and critical pore size.
Table 8.
Porosity, total intruded mercury volume, and critical pore size.
| Specimen | Porosity (%) | Mercury Volume (mL/g) | (nm) |
|---|
| UHPC | 4.22 | 0.0171 | 12 |
| C60 | 6.42 | 0.0266 | 114 |
Table 9.
Comparison between the test and calculation flexural tensile strengths.
Table 9.
Comparison between the test and calculation flexural tensile strengths.
| Specimens | Tested Strength (MPa) | Calculated Strength (MPa) |
|---|
| Numerical | Error (%) |
|---|
| UEPE20 | 4.55 | 4.41 | 3.08% |
| UEPE25 | 6.35 | 5.96 | 6.14% |
| UEPE30 | 7.21 | 6.67 | 7.49% |
| Disclaimer/Publisher’s Note: The statements, opinions and data contained in all publications are solely those of the individual author(s) and contributor(s) and not of MDPI and/or the editor(s). MDPI and/or the editor(s) disclaim responsibility for any injury to people or property resulting from any ideas, methods, instructions or products referred to in the content. |
© 2023 by the authors. Licensee MDPI, Basel, Switzerland. This article is an open access article distributed under the terms and conditions of the Creative Commons Attribution (CC BY) license (https://creativecommons.org/licenses/by/4.0/).


