Article

Life Cycle Assessment of Concrete Using Copper Slag as a Partial Cement Substitute in Reinforced Concrete Buildings

by
John Paul Q. de Pedro
*,
Jil Andrew T. Lagao
and
Jason Maximino C. Ongpeng
Department of Civil Engineering, De La Salle University, 2401 Taft Avenue, Manila 0922, Philippines
*
Author to whom correspondence should be addressed.
Buildings 2023, 13(3), 746; https://doi.org/10.3390/buildings13030746
Submission received: 14 February 2023 / Revised: 28 February 2023 / Accepted: 9 March 2023 / Published: 12 March 2023
(This article belongs to the Collection Advances in Sustainable Building Materials and Construction)

Abstract

:
Cement, one of the main components of concrete, poses environmental risks, accounting for 7% of total global carbon emissions. To alleviate the environmental hazards related to cement manufacturing, supplementary cementitious materials (SCM) are employed to reduce the usage of cement in concrete. One SCM used is copper slag (CS). In this study, a life cycle assessment (LCA) is conducted by investigating the environmental impacts of concrete replacing different percentage of cement with CS. As a case study, the LCA was performed for low-rise and mid-rise structures designed with varying concrete strengths, and a cost analysis was performed for these structures when replacing different percentages of cement with CS. Based on the results, the usage of CS was established as being beneficial to the impact categories ADP (Abiotic Depletion Potential (Fossil)) and GWP (Global Warming Potential), but exerted damaging effects on ADP (Abiotic Depletion Potential) and HTP (Human Toxicity Potential). On the basis of the cost analysis, the use of CS as a partial cement replacement was found to reduce building costs by a maximum of 1.4%, which is statistically significant. When evaluating the risk in comparison to the benefit of using CS in buildings, it was found that the negative environmental influence outweighed the favorable influence and cost savings resulting from the use of CS as a cement alternative. However, when only considering GWP, which is the standard procedure for environmental assessment in buildings, the use of CS as a partial cement substitute in buildings was regarded as being beneficial, yielding a 12.80% reduction in carbon emissions.

1. Introduction

Concrete, due to the numerous benefits that it provides in terms of properties and suitability for varied uses, is one of the most frequently used construction materials. Concrete has substantial durability and mechanical properties that can be achieved at reasonably low cost [1]. While concrete has its advantages, its use is also accompanied by environmental risks, because one of its components—cement—is a distinct contributor to global warming because of the carbon emissions generated by its production [2]. The annual production of cement corresponds to approximately 5.3 billion cubic meters [3], accounting for an estimated 7% of total carbon emissions worldwide [4].
As a viable solution to this problem, pozzolans, or supplementary cementitious materials (SCM), have been applied as a partial cement substitute in concrete. Through the application of SCM as a partial cement alternative, carbon emissions from cement production have decreased significantly, because its production and usage require less energy than the production of cement [5]. Calcined clay and limestone filler, which are used as SCMs due to their abundance and availability, have been shown to reduce global warming potential by 4% to 7% in kg CO2 eq units when used to retrofit reinforced concrete columns [6]. Industrial by-products or waste can also be used as SCMs, which aids in the conservation of natural resources if they are recycled, safeguarding the environment through the reduction in landfill space employed; while the recycling of solid waste as building materials lessens the effect of this waste on ecological systems [7]. Several studies have focused on the use of recycled materials as SCMs for cement substitution, such as the study by Zeybek et al., who investigated waste glass powder, which was found to be a potential replacement for cement with an optimum dosage of 20% [8]. Karalar et al. explored the usage of waste marble powder, a waste product in marble production, in concrete beams, finding that it could be used effectively at a cement substitution rate of 10% [9]. Laila et al. studied the use of industrial waste granite pulver in self-compacting concretes, finding that it was beneficial to the concrete’s mechanical properties and durability when used as cement replacement at a rate of 15% [10]. Chindasiripan et al. studied the application of ground bottom ash as cement replacement at a rate of 50% in concrete, and discovered that with this percentage replacement, the concrete attained its maximum compressive strength and could be classified as high-strength concrete at an age of 7 days [11].
Another SCM employed as a partial cement substitute is copper slag (CS), which is a by-product of copper refining metallurgical operations. On an international scale, 44 million tons of this slag are produced annually from 20 million tons of copper [12]. The use of such huge quantities of CS raise environmental concerns, since the disposal of these industrial by-products requires large areas, leading to destructive consequences like air pollution, terrestrial surface damage, and erosion [13]. Thus, the use of CS as a partial cement alternative would serve to relieve both the environmental hazards resulting from cement production and the stockpiling of copper slag. Prior studies have determined that the application of CS as a partial cement substitute in concrete can enhance the mechanical properties of the concrete [14]. CS qualifies as a pozzolan due to its compliance with the required 70% minimum summation of oxides, as established by the American Society for Testing and Materials (ASTM) for pozzolans, possessing a chemical makeup of 30.5% SiO2, 45% Fe2O3, 5.9% Al2O3, and 4.8% CaO, on average [15]. Copper slag used as a partial cement substitute in concrete significantly improves its late-age compressive strength [16]; specifically, its strength at 90 days of age is increased by 100% [14]. Varying the percentage of cement replaced with copper slag also affects the strength of the concrete, as demonstrated in previous research, where it was found that the optimal replacement percentage by mass of cement is between 5 and 7.5 percent in order to achieve the greatest increase in concrete compressive strength [17]. Recent studies regarding the use of CS as a constituent of concrete have focused on the use of the by-product as a partial fine aggregate replacement. Manjunatha et al. conducted experimental tests on the mechanical properties of concrete utilizing waste copper slag as fine aggregate replacement [12]. Afshoon et al. experimentally and numerically investigated the properties of concrete utilizing CS as fine aggregate replacement in steel fiber-reinforced self-compacting concrete [18]. Raju and Dharmar investigated the flexural behavior of reinforced concrete beams in which fly ash was used as a partial cement replacement and CS was used as a fine aggregate replacement [19]. Mirnezami et al. studied the influence on the concrete’s thermal and mechanical properties of using copper and steel slags as a fine aggregate replacement [20]. Gu et al. investigated the use of CS as aggregate in place of quartz sand for the production of sustainable Ultra-High-Performance Concrete (UHPC) [21]. Arora et al. conducted a study exploring the strength, durability, and microstructure of self-compacting geopolymer concrete, also using CS as fine aggregate [22]. Lastly, Panda et al. experimentally investigated the interfacial transition zone (ITZ) of concrete with CS as a fine aggregate substitute [23].
LCA is a method for evaluating a product’s environmental impact over the course of its life cycle [24]. When it comes to prior life cycle assessment (LCA) studies involving CS, a life cycle inventory analysis in which Portland cement was substituted with CS was conducted by Kua, which investigated the emissions of specific heavy metals and gases related to this substitution [25]. Other LCAs involving CS have also been carried out, such as in the study by Khorassani et al. [26], who focused on the use of CS in ceramics, and in the study by Gursel and Ostertag [27], who used CS as a replacement for sand in high-strength concretes. Another study by Kua performed an LCA in which sand was replaced with used CS in construction, where it was found that landfilling the waste CS had the same effect as recycling it as a sand replacement in terms of embodied energy and global warming potential, thus suggesting its use as a cement replacement instead [28].
Based on recent studies, life cycle assessment (LCA) studies exploring the use of CS as a cement substitute have yet to focus specifically on its environmental impacts. Therefore, this study aims to address the absence of LCA on CS used as a cement substitute in concrete by carrying out an environmental impact assessment of concrete using CS as SCM through a presentation of quantitative environmental differences among concrete systems. Another objective of this study is to conduct an LCA covering a cost analysis and addressing the environmental impacts of using CS in the design phase of reinforced concrete buildings in the case of low-rise (three-story) and mid-rise (seven-story) buildings designed with differing concrete strengths. The study explores the economic and environmental impacts of using CS as a partial cement replacement following the 3Ps of the Triple Bottom Line (TBL) sustainability concept—People, Planet and Profit—wherein the economic criteria and environmental criteria are embodied by the “Profit” and “Planet” components, respectively. The “People” category is not included, since this involves the social aspect of the TBL. In Section 2 of this study, the methodology is discussed, starting with the calculation of the concrete design mix proportions, followed by the execution of the LCA process in the CS concrete systems, followed by an explanation of the case study involving the design of three-story and seven-story reinforced concrete buildings. The case study involves the structural design of the aforementioned structures, the calculation of building costs, and the implementation of LCA for the designed buildings. Section 3 presents the results related to and a discussion surrounding the environmental effects of using CS as a cement alternative on ADP, ADP (Fossils), GWP, and HTP. Section 4 tackles the effect on cost of using CS in the buildings, and its environmental influence when used in structures designed with various concrete strengths. Lastly, Section 5 summarizes the study through an enumeration of the key findings. Since the study focuses on the design phase, the cost and environmental impacts are determined based on data related to the designed mix, the designed structures, and the generic materials. By investigating the environmental impacts of using CS as a partial cement substitute and applying the by-product in reinforced concrete buildings, this study aims to contribute to a reduction in environmental emissions caused by the use of cement in the construction field as well as addressing concerns related to copper slag disposal. The study’s objectives and environmental assessment are also in line with the United Nations Sustainable Development Goals (UNSDG), particularly with respect to the climate action, life below water, life below land, and the industry, innovation, and infrastructure goals.

2. Methodology

2.1. Concrete Mix Proportions

The American Concrete Institute (ACI) mix proportioning method [29] was applied to calculate concrete mixes with strengths of 20.7 MPa, 27.5 MPa, 34.5 MPa, and 41.40 MPa at 28 days without admixtures. These concrete design strengths were selected due to their propensity for easy production without the use of admixtures and their corresponding to the usual design strengths of structures in the Philippines. The concrete mixes were composed of the proportions of cement, CS, water, coarse aggregates (CA), and fine aggregates (FA) per unit of concrete strength. The amount of CS used in the concrete is described on a percent mass basis of cement, with percent mass substitutions of 5%, 10%, and 15% [16]. The assumed slump for the designed mix was a 50 to 100 mm slump. The material unit weights used to calculate the proportions in the designed mix and the concrete strengths corresponding to the water–cement ratios based on ACI [29] are presented in Table 1 and Table 2, respectively. The material unit weights were obtained on the basis of the average data from a local batching plant for the corresponding material with the exception of CS, where its specific gravity and unit weight were based on Wang [30].
The concrete systems and design mix proportions were determined based on the stipulated data and are described as FC (value) and CS (value), where FC signifies the concrete strength in megapascals (MPa) and CS denotes the mass percentage of cement replaced with copper slag in the mix. The mix proportions calculated on a per cubic meter basis are shown in Table 3.

2.2. Life Cycle Assessment

Life Cycle Assessment (LCA) is a procedure for establishing the environmental influence of a certain process or product. In performing the LCA, the Life Cycle Procedure described in the International Organization of Standardization (ISO) 14040 [31] was adopted as a methodological framework. The research consisted of two phases: Phase 1 was the LCA of the concrete system with copper slag at 20.7 MPa, while Phase 2 was the environmental impact evaluation and cost analysis of the reinforced concrete structures utilizing CS and with various concrete design strengths.

2.2.1. Objectives, Scope, and Functional Units

The general objective of this research is to explore the environmental impacts of utilizing CS as a partial cement alternative in concrete when applied in reinforced concrete structures. The specific objectives of this study are: (a) to assess the environmental impacts of using substitution of various percentages of cement with CS—5%, 10% and 15% by mass—in concrete; (b) to perform a cost evaluation of using concretes with different levels of CS cement substitution in low-rise (three-story) and mid-rise (seven-story) reinforced concrete buildings with various concrete design strengths; and (c) to evaluate the environmental influence of employing concretes with CS as a partial cement alternative in low-rise and mid-rise structures. The methods employed in this study are in accordance with ISO 14040 [31], and adopt a cradle-to-gate perspective. Phase 1 consists of an LCA of a concrete consisting of 1 cubic meter of 20.7 MPa concrete produced in a central mixing plant as the functional unit. The environmental impact assessment performed in Phase 2 employed a three-story structure and a seven-story structure as functional units.

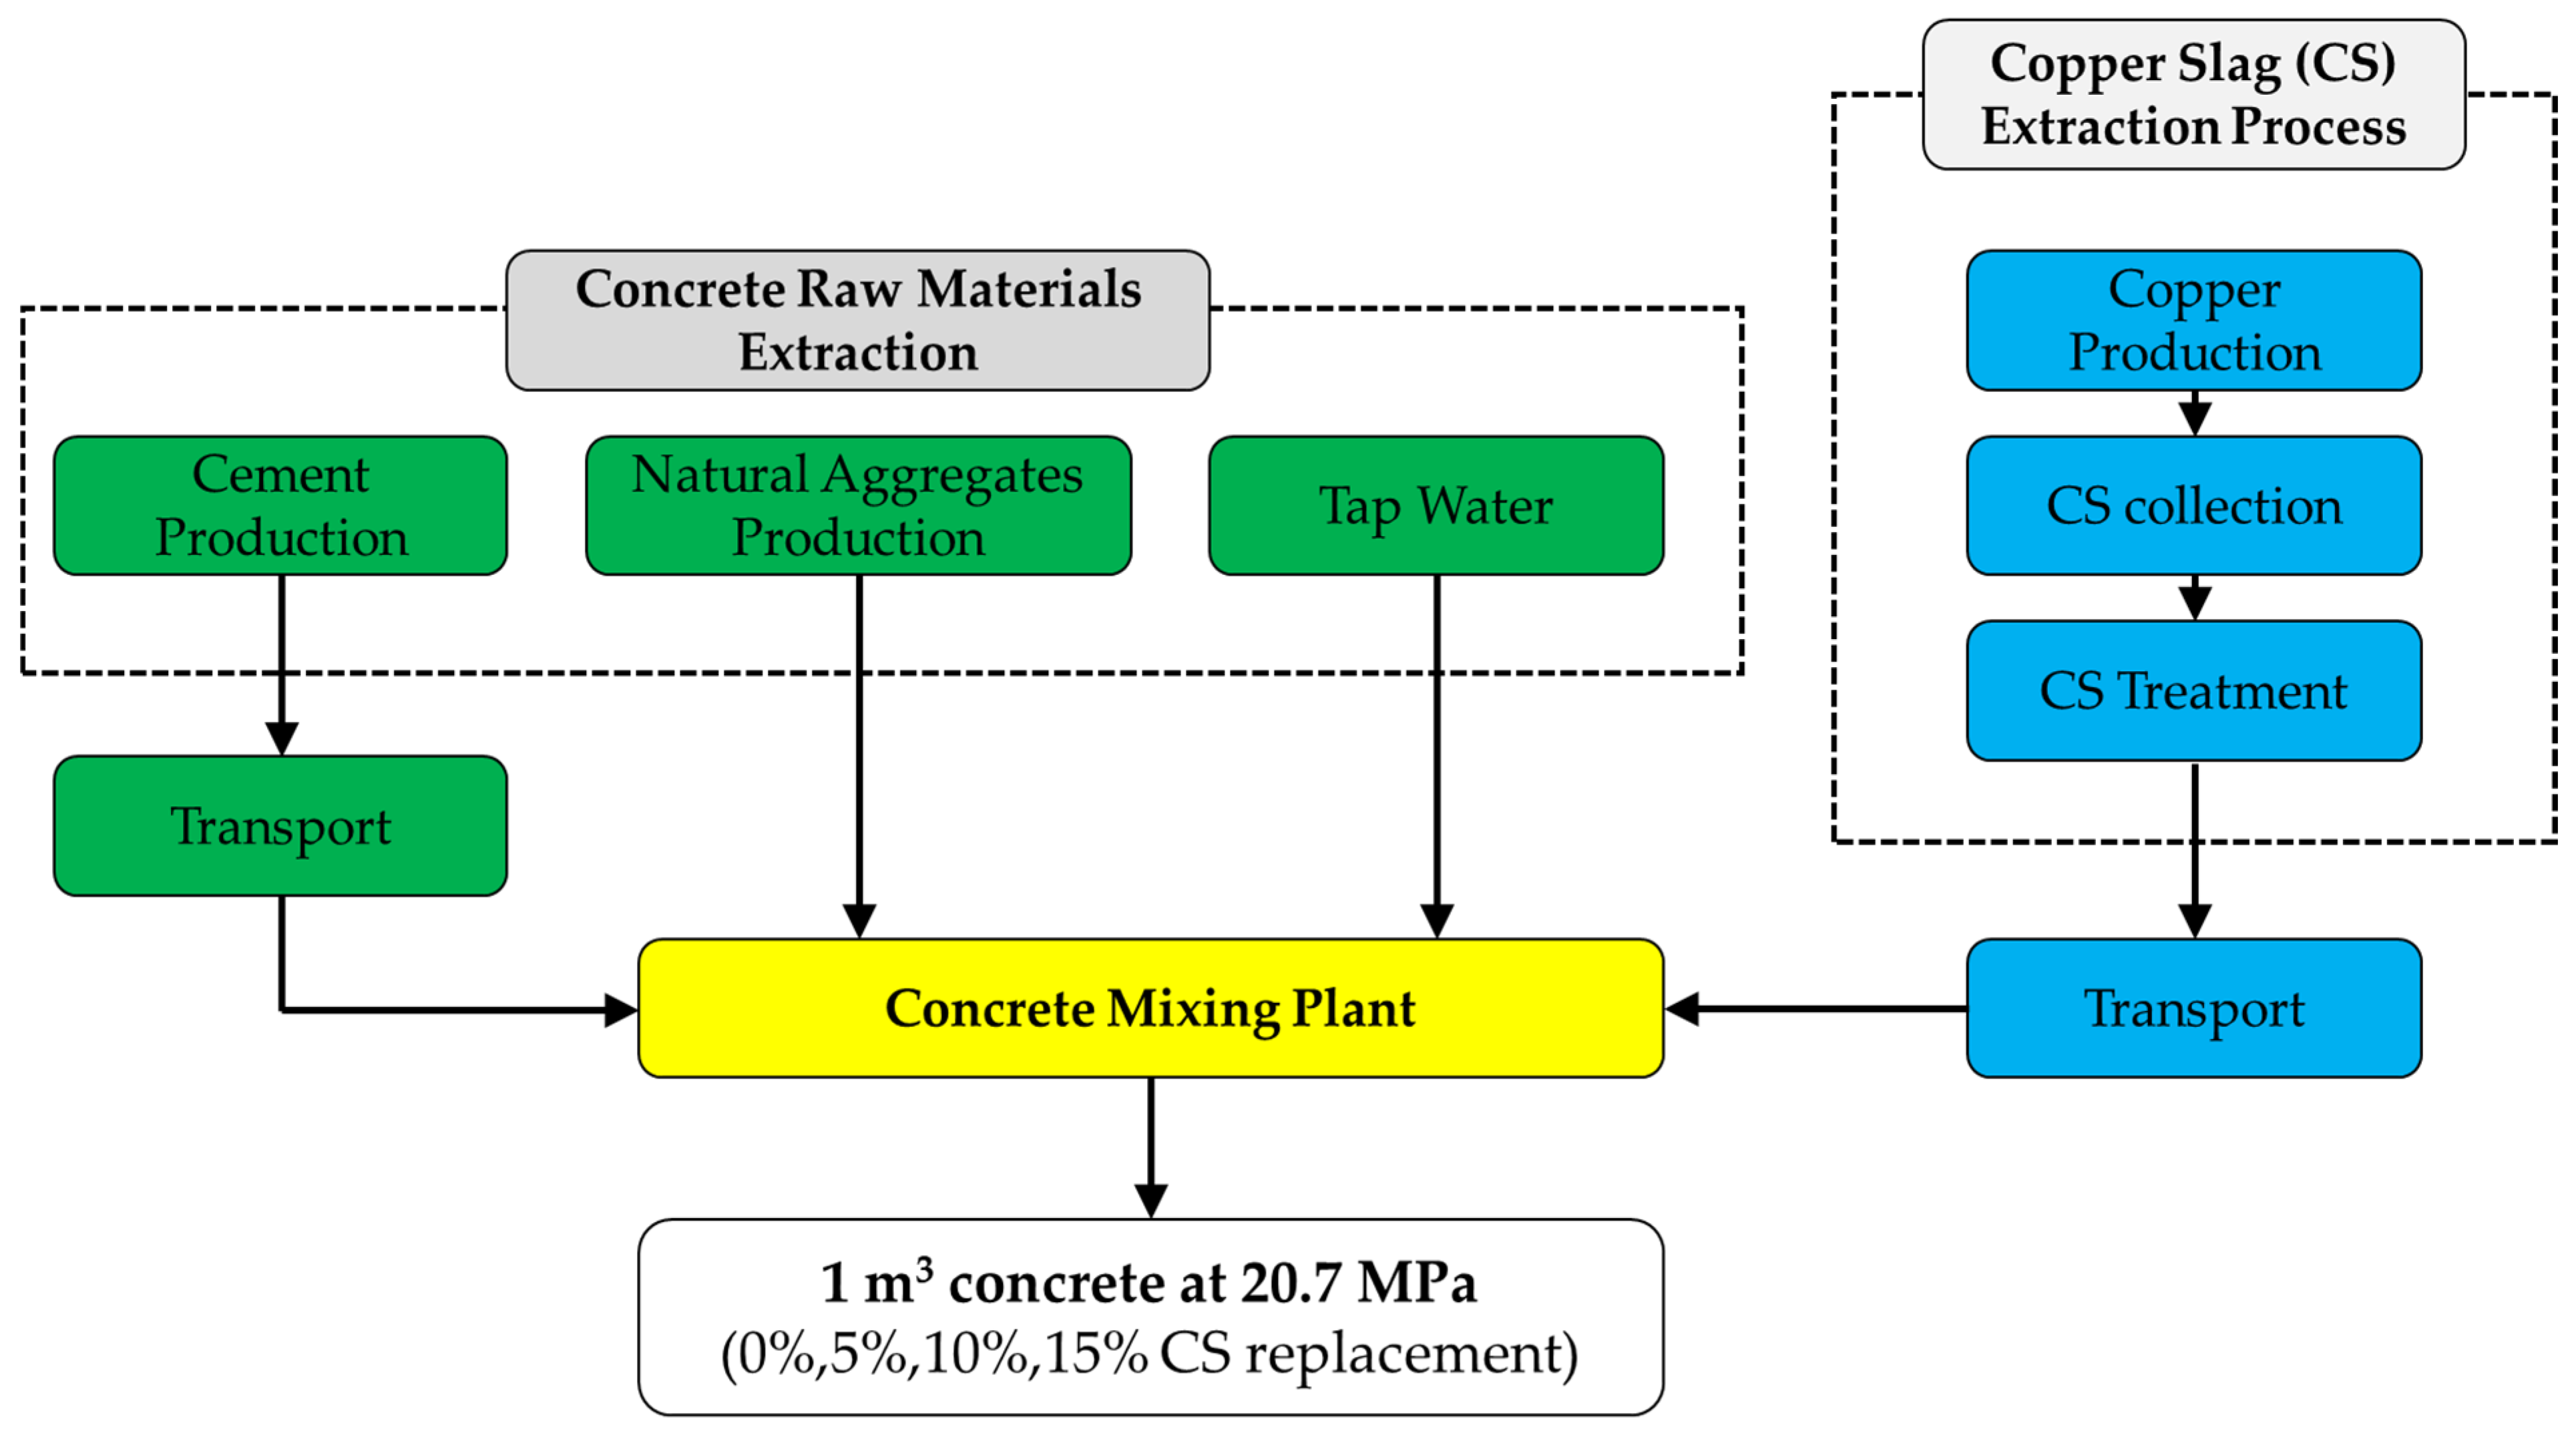
2.2.2. System Boundaries

As shown in Figure 1, considering an LCA adopting a cradle-to-gate perspective, the system commences with raw material extraction and lasts until concrete production. As one of the raw materials of concrete, cement is transported to the concrete mixing plant. Natural aggregates are assumed to be located close to the concrete mixing plant, and thus their transportation is considered negligible. The processes belonging to the construction phase and onwards are excluded in this study, because this study is focused on concrete that uses CS as a material, and because of the huge variance in the application of concrete in construction. CS is assumed to be a by-product, conforming to the criteria set by Directive 2008/98/EC [32]. Consequently, this assumption required the inclusion of environmental data related to the process of copper production, up until the recycling process of the CS for commercial purposes. The CS extraction process commences from copper production, wherein the CS is collected and treated, before being transported to the concrete mixing plant. The mixing plant then creates an output of 1 cubic meter of concrete with or without CS as a partial cement replacement using the raw materials of concrete and the copper slag delivered.

2.2.3. Data Sources

Data were acquired from the Ecoinvent v3.01 database, and Simapro v9.2.01 was used to process the obtained data in order to perform the environmental impact analysis. The CS recycling process was not contained in the database; therefore, in order to incorporate the recycling process of copper slag into the system, the emissions of the recycling process described in the study by Kua were used as the input in the software [25]. The following emissions were utilized as input data for the CS recycling process: As = 0.015 mg, Cd = 3.248 mg, Cr = 0.069 mg, Co = 8.712 mg, Pb = 6.027 mg, CO2 = 35.345 g, CO = 0.016 g, SO2 = 0.006 g, and NOx = 0.006 g. Data on the transportation distances were based on a selected supplier of cement and CS in the Philippines, as well as a local concrete mixing plant. For the cement, the local supplier location was located at a distance of 40 km from the concrete mixing plant, while for the CS, the supplier was located at a distance of 25 km from the concrete mixing plant. The concrete mixing plant selected in the Philippine setting was assumed to possess the same performance and employ the same system processes as those described in the available database.

2.2.4. Allocation

In this research, the CS was assumed to be a by-product of copper production, and it was considered to be purchasable from a local supplier. This assumption led to the assumption that the CS system includes the process of copper manufacturing, as slag is inadvertently generated during the copper smelting process. To account for the environmental impacts of the CS alone as a portion of the total system, in this study, the contribution of the CS was considered to correspond to 0.85% of the total impact of copper manufacturing. This value was derived using the economic allocation procedure, which is accepted in the ISO 14040 [31] and ISO 14044 [33] LCA standards, and the same procedure was also performed as part of a previous study by Khorassani et al. [26]. The input data used in Simapro for copper were based on those used in prior research, wherein 1 ton of copper was reported to generate 1.63 tons of slag [34]. In this study, therefore, 0.613 kg of copper was required for every 1 kg of copper slag.

2.2.5. Impact Assessment

CML-IA Baseline V3.06/World 2000, developed by the Center of Environmental Science of Leiden University in the Netherlands, was the LCA method selected to perform the impact assessment for the following categories: Abiotic Depletion Potential (ADP), Abiotic Depletion Potential of Fossil Fuels (ADP (Fossil)), Global Warming Potential (GWP), and Human Toxicity Potential (HTP). The reason for limiting the impact assessment of this study to the aforementioned categories was that the study focuses on the influence of using CS as a concrete SCM on the depletion and extraction of mineral and non-renewable resources (fossil fuels), which are denoted by ADP and ADP (Fossil), respectively [35]; its effects on the contribution of greenhouse gas emissions to global warming, as reflected in the GWP category [35]; and its effects on emissions that are toxic to human health, as depicted by the HTP category [36]. Impact assessments are expressed through percentage emissions of concrete systems with varying percentages of cement replaced with CS, while concrete containing 0% CS is set as the reference concrete system in the comparative analysis.

2.3. Case Study (Phase 2)

As a case study, the environmental impact of concretes with CS was applied to two reinforced concrete structures: a low-rise (three-story) building and a mid-rise (seven-story) building. The structures were designed with concretes with different strengths, and then subjected to direct cost estimates for the purposes of performing a life cycle analysis and a cost comparison when using concrete with the use of CS as a partial cement alternative.

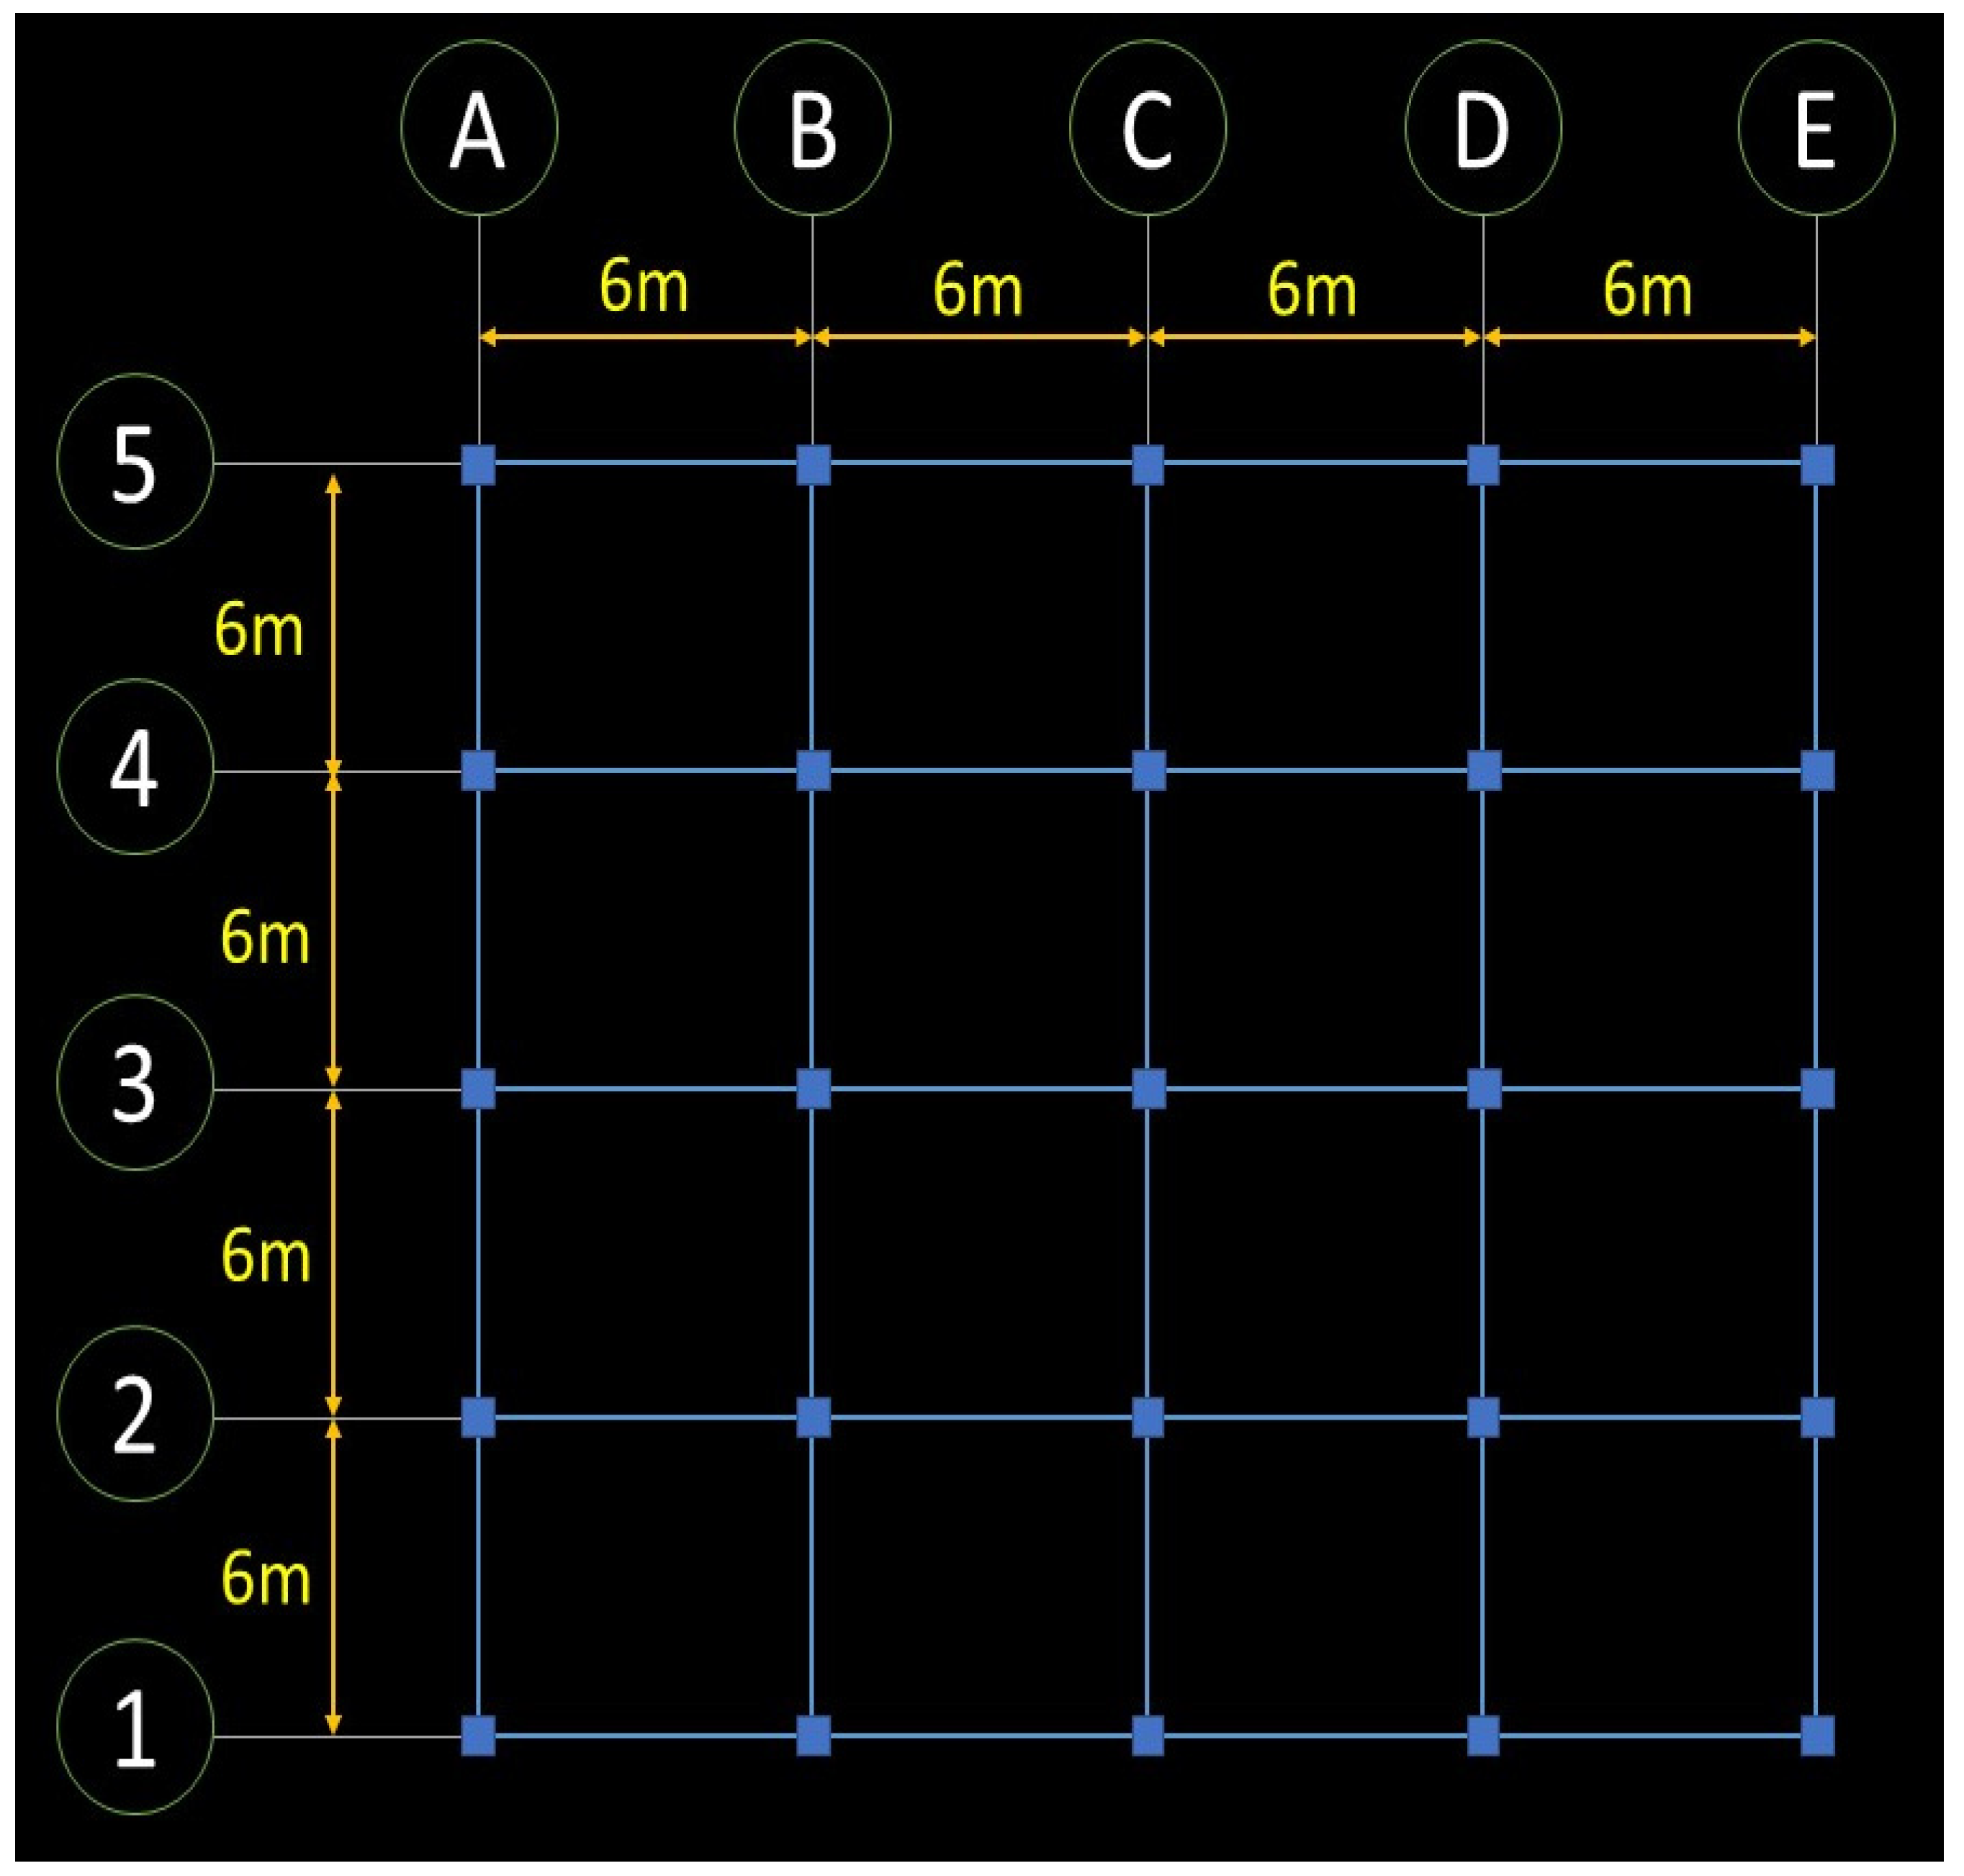
2.3.1. Structural Design

The three-story and seven-story structures were designed based on a typical floor plan from the previous literature, as shown in Figure 2 [37], with a typical 3.0-meter story height, and were designed with various concrete strengths: 20.7 MPa, 27.5 MPa, 34.5 MPa, and 41.5 MPa. The design strengths employed were selected because they are the typical concrete design strengths used in Philippine construction settings, and are concretes that are achievable without the use of admixtures. The yield strengths of the reinforcements used were 415 MPa for longitudinal reinforcements and 275 MPa for shear reinforcements, as this is the usual practice in the Philippines.
In total, eight (8) structural models were designed in this study. ETABS v.9.5 was used to design the models, using the loads presented in Table 4. Beams and columns were designed following the stipulations of the National Structural Code of the Philippines 2015 (NSCP) [38], such that they corresponded to the nearest design sizes before exceeding their capacity set by the code under the designated loadings. To establish the values of seismic factors obtained in Table 5 which were based on NSCP Chapter 2 – Minimum Design Loads under Section 208: Earthquake Loads [38], the structural models were situated hypothetically in Manila, Philippines. In this study, seismic loading was the only lateral load considered.
Upon modeling, the resulting beam sizes and reinforcements are indicated for every design strength in Table 6 and Table 7 for the three-story and seven-story buildings, respectively. Slabs are assumed to possess a constant thickness of 150 mm and to only support gravity loads; hence, the slab thickness was set to be constant, regardless of the concrete strength. For the columns, the details of the design reflecting the column size and vertical bar reinforcements are shown in Table 8 and Table 9 for the three-story and seven-story buildings, respectively, for every design strength. The column ties are set to be typical at ϕ10 at 100 mm for joint reinforcement, ϕ10 at 100 mm for confined reinforcements, and ϕ10 at 150 mm for tie reinforcement for every floor level.

2.3.2. Cost Analysis

Following their design, the costs of the buildings were estimated on the basis of the calculated concrete volume, total weight of reinforcements, and the area of formworks of the columns, beams, and slabs obtained. The concrete cost was taken as the summation of the material cost of the concrete components (cement, CS, CA, FA, and water). Unit costs of the items other than the CS were derived from the average of the costings of contractors having worked on past projects of the University of the Philippines during the year 2022. The CS costs were determined on the basis of the average costs of Indiamart suppliers. For this research, the unit costs shown in Table 10 were assumed to be accurate and effective for the year 2022. Unit costs were converted from PHP to USD by using an exchange rate of 1 USD = 50 PHP.

2.3.3. Environmental Impact Assessment

A similar methodology to that employed in Phase 1 was carried out for the environmental impact assessment in the case study. However, in this phase, the environmental impact of using CS was assessed for different concrete strengths based on the three-story and seven-story building designs. For the purpose of comparison, the reference concrete considered is the plain concrete system, or concrete with 0% CS replacement. The environmental impacts of concrete and copper slag are the only impacts considered, and the environmental influence of steel reinforcements and formworks are excluded. Furthermore, in order to summarize the environmental impact assessment along with the cost savings arising from using concrete containing varying amounts of CS as a partial substitute, the average percentage of environmental emissions or the impact of all categories per percentage of CS was plotted against the corresponding cost reductions in percent. The average environmental impact of the categories (ADP, ADP (Fossil), GWP, and HTP) was calculated assuming that every category possessed equal significance and weight. The cost reductions were calculated as the percent savings achieved compared to using the reference concrete of the specified strength.

3. Results and Discussion

3.1. Life Cycle Inventory

Table 11 presents the inventory data for the Phase 1 investigation for each concrete mix with a design strength of 20.7 MPa substituting 0%, 5%, 10%, and 15% of cement with CS, indicating the phase of the product system and the single unit data for the considered functional unit (FU) of 1 cubic meter.
The differing figures between mixes for the concrete components arose from the calculation of their respective design mixes or their mix proportioning. Transportation figures varied because they are based on the amount of cement and CS being transported, rather than the distance over which these materials will be hauled. With increasing percentage of CS used, the transportation amount decreased, as a result of the reduced amount of cement being transported across the 40 km distance from its source to the concrete mixing plant. The values corresponding to the facilities and energy required for production remain constant, since there are no considerable differences in the technology or plant used in the manufacturing stage.

3.2. Impact Assessment (Phase 1)

Figure 3 presents the results, obtained using Simapro, regarding the impact of using 20.7 MPa concrete with varying amounts of CS as partial cement replacement on the following environmental categories: ADP, ADP (Fossil), GWP, and HTP. It was observed that the use of CS in concrete alleviated risk in the environmental categories ADP (Fossil) and GWP. The environmental impact on GWP was reduced by a maximum of 12.41% when a 15% mass substitution of CS was used. Furthermore, this category was observed to possess the greatest reduction in emissions, due to the lower amount of cement used, which is a material acknowledged for being a major contributor to emissinos that cause global warming.
Comparing the results of GWP from an earlier LCA study by Gursel and Ostertag [27], when using CS as a replacement for sand in high-strength concretes, using CS as a replacement for sand causes a maximum reduction in GWP emissions of 30%, which is almost 2.4 times the reduction caused when CS is used as a cement replacement. This could be due to the amount of sand replaced compared to the amount of cement replaced by the CS, such that the replacement of sand resulted in a sizeable reduction in GWP emissions. However, it is also important to note that the calculations performed in the earlier study were related to Singaporean social, environmental, and economic paradigms.
As for the category of ADP (Fossil), there was also a reduction in impact observed with increased substitution of cement with CS, reaching a maximum of 9.22% with 15% replacement of cement with CS. Conversely, the use of concrete with CS as an SCM resulted in increases in ADP and HTP. In the ADP category, this impact reached its maximum—an increase of 50.32%—when 15% CS was used in concrete, while for the HTP, the maximum impact corresponded to a 27.75% increase when using the same amount of CS. The increasing effect in these categories could be attributed to the additional quantity of CS, which tends to be detrimental to such an extent that it outweighs the advantageous effects of using smaller amounts of cement.
With reference to Figure 4, for the ADP (Fossil) and GWP categories, the contributor governing the environmental impact of all concrete systems is cement, which provides the largest environmental emissions in these categories, accounting for 88.39% in the GWP category and 71.20% in the ADP (Fossil) category. Furthermore, the emissions of copper slag in these categories can also be considered to be relatively minimal, having a contribution of only 1.99% at most in the ADP (Fossil) category and only 1.11% at most in GWP; thus, employing CS in concrete is demonstrated to be beneficial in terms of the environmental effects for these categories, since they are impacted primarily by cement. On the other hand, for the ADP and HTP categories, wherein the additional use of CS as an SCM caused an increase in environmental emissions, the copper slag was shown to have a large influence. The use of CS made the greatest contribution to the emissions in the ADP category, wherein 54.72% of the could be attributed to the slag, while in HTP, it accounted for 33.75% of emissions. Since CS is a by-product of copper production, and this was incorporated in the environmental assessment, the emissions in the ADP category can be attributed to the extraction of mineral resources necessary to produce copper. Likewise, for HTP, the increase in adverse impacts in these categories arises because of the process of copper production, in which arsenic and other impurities from the copper ore [13] are discharged, causing toxicity to human health.

4. Case Study (Phase 2)

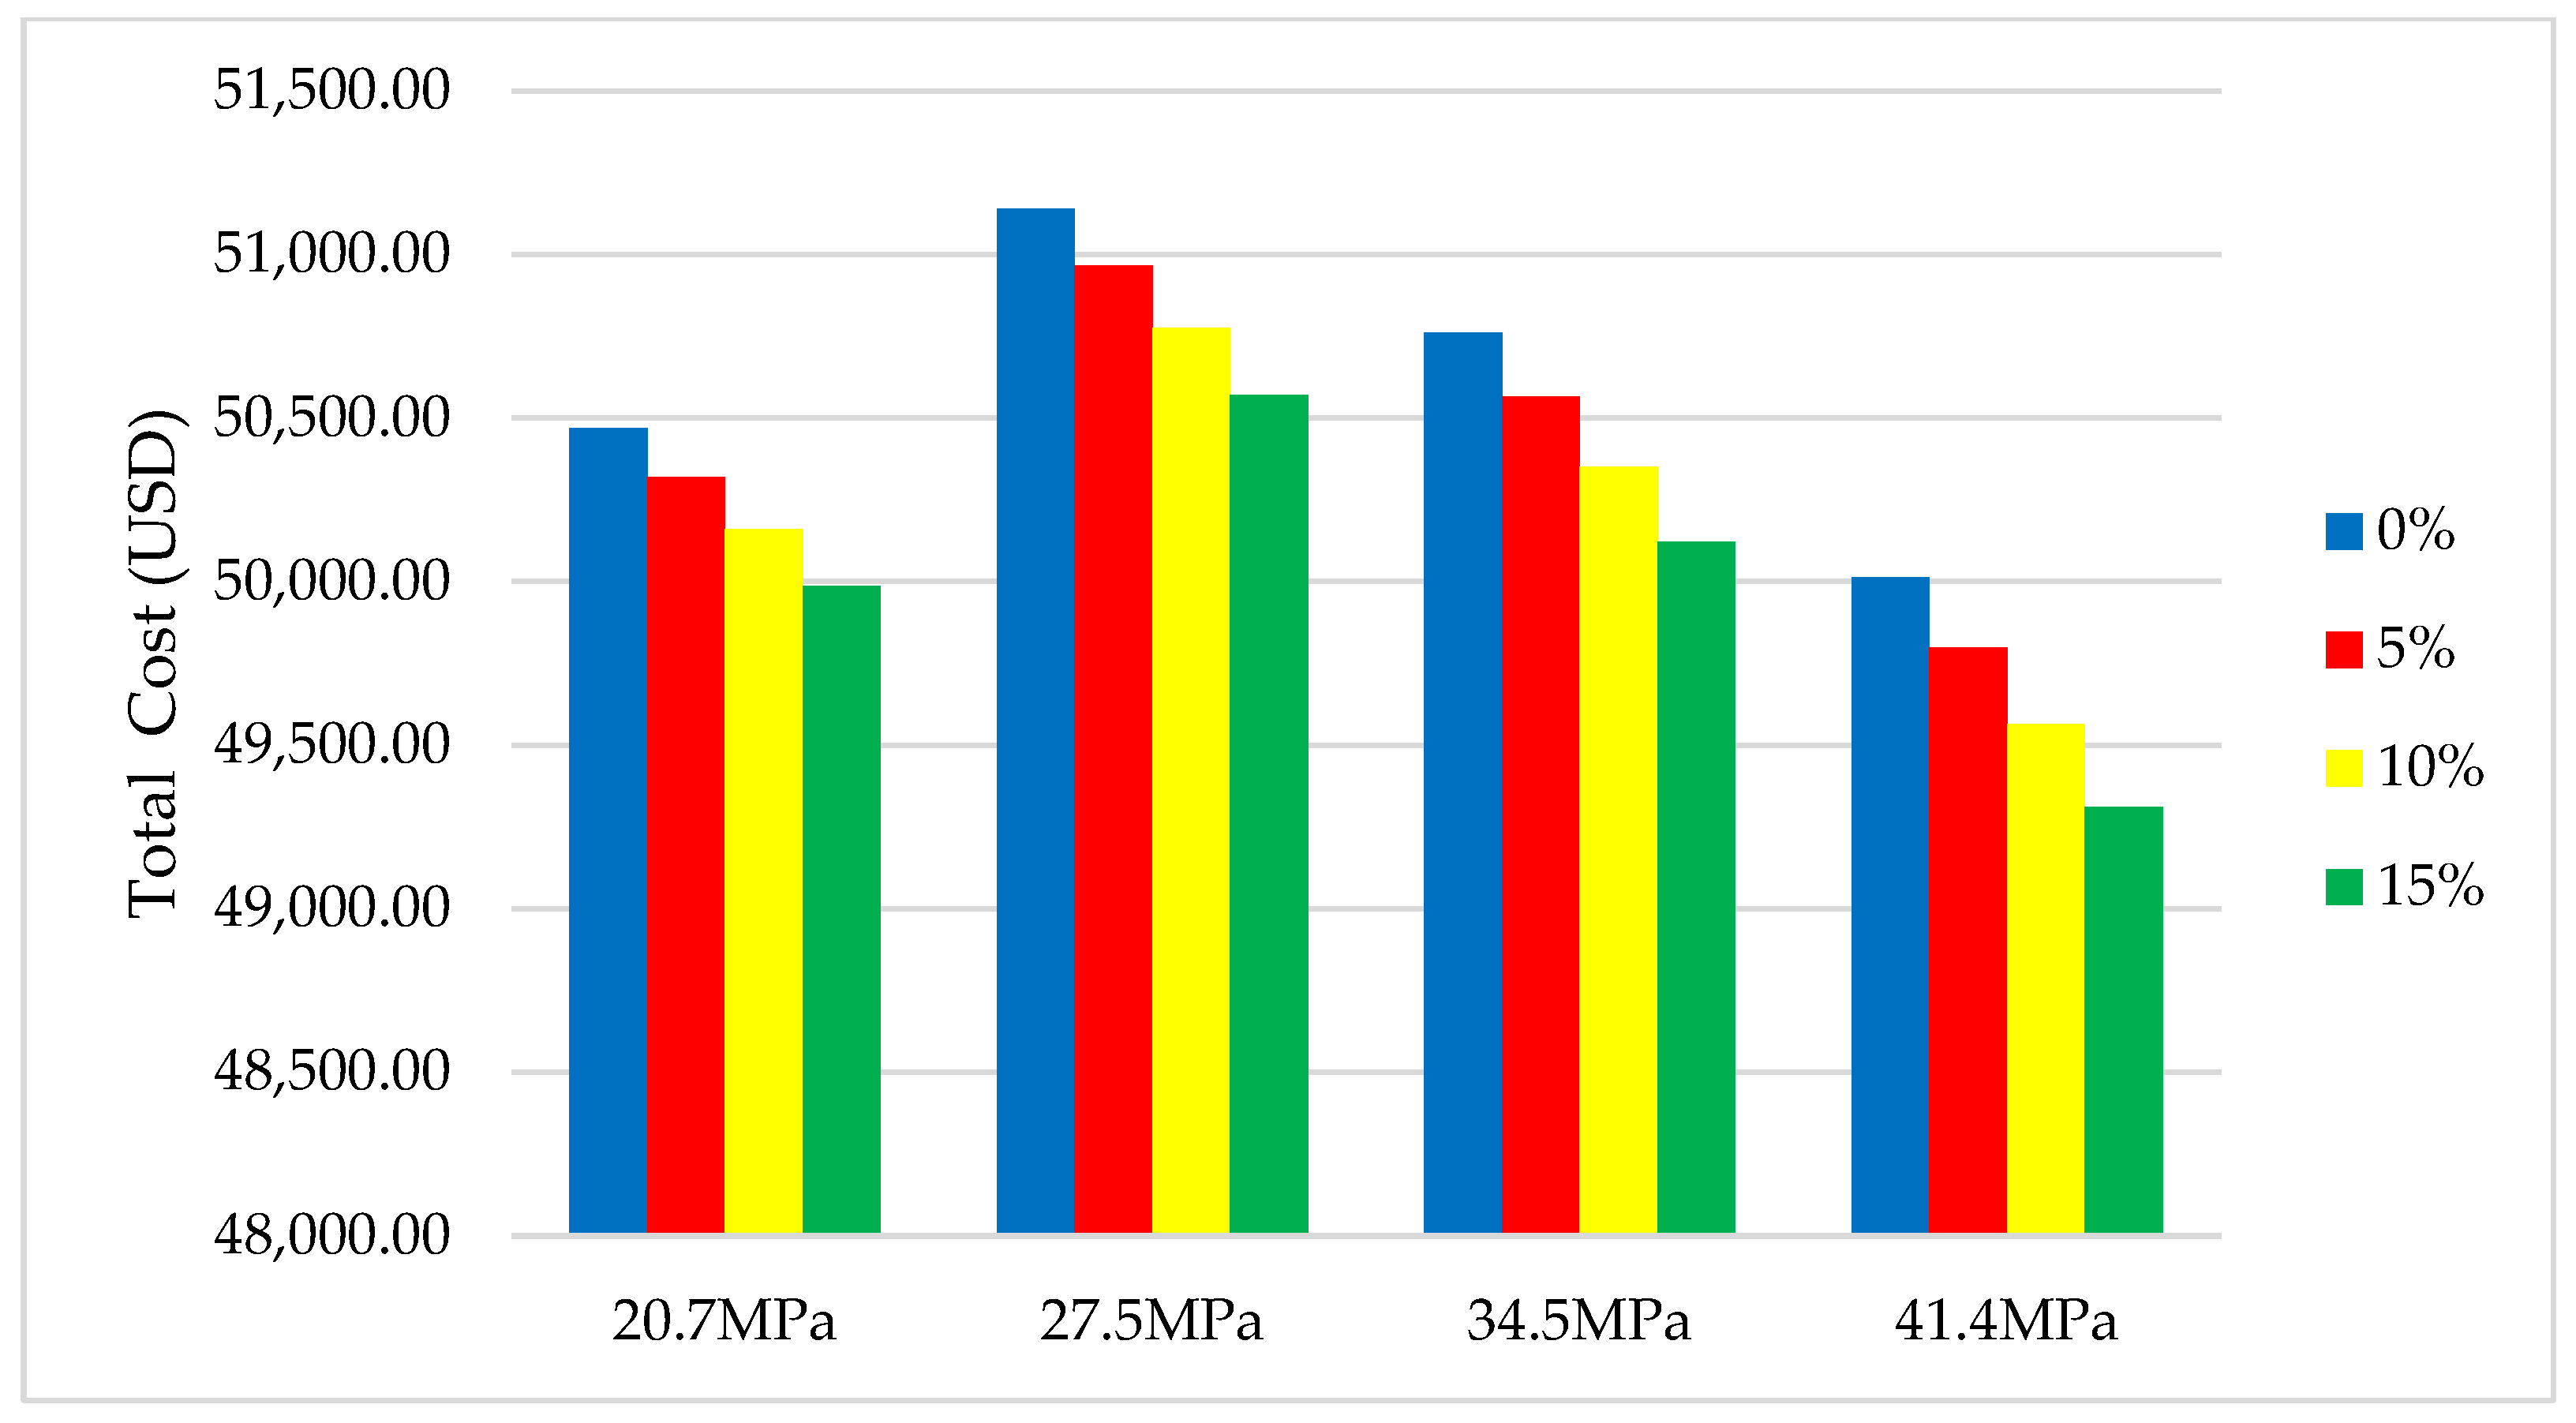
4.1. Total Building Costs Using Concrete with CS as SCM

The ETABS design results were further processed into slab, beam, and column schedules that were used as the basis of the cost estimates of concrete, reinforcements, and formworks of all building models. With reference to Figure 5 and Figure 6, it can be observed that the use of concrete CS as an SCM lowers the total cost of the structures, both three-story and seven-story, regardless of the design strength of the concrete. For both structures, when using concrete with a design strength of 20.7 MPa, the maximum replacement percentage of 15% of CS reduced the cost by a maximum of about 0.90%. As for the three-story and seven-story structures using concrete with a design were of 27.5 MPa with a CS substitution of 15%, the reductions in total building cost was only 1.0% and 1.10%, respectively. When the concrete strength was 34.5 MPa, for both structures, the maximum cost reduction was achieved with a CS substitution of 15%. Lastly, using concrete with a design strength of 41.4 MPa for both structures, the maximum cost reduction was also obtained at 15% CS, corresponding to a reduction of 1.40%. In the further interpretation of these results, the greater the replacement percentage of CS, the lower the total building costs incurred, both in the case of the low-rise and the mid-rise buildings, due to CS being lower in cost than cement.
To check the significance of the cost savings achieved when using CS with respect to the total building cost, the observed significance levels, or p-values, were determined, which is a procedure used in hypothesis testing [39], wherein, if the p-value is less than or equal to 0.10, which is the required significance level for papers, the cost savings are considered significant [40]. In Table 12 and Table 13, the p-values calculated for the building cost and the cost savings for the three-story and seven-story buildings are presented, respectively. Based on the values calculated in the tables, the p-values of all data are lower than 0.10. This indicates that the cost savings are statistically significant.

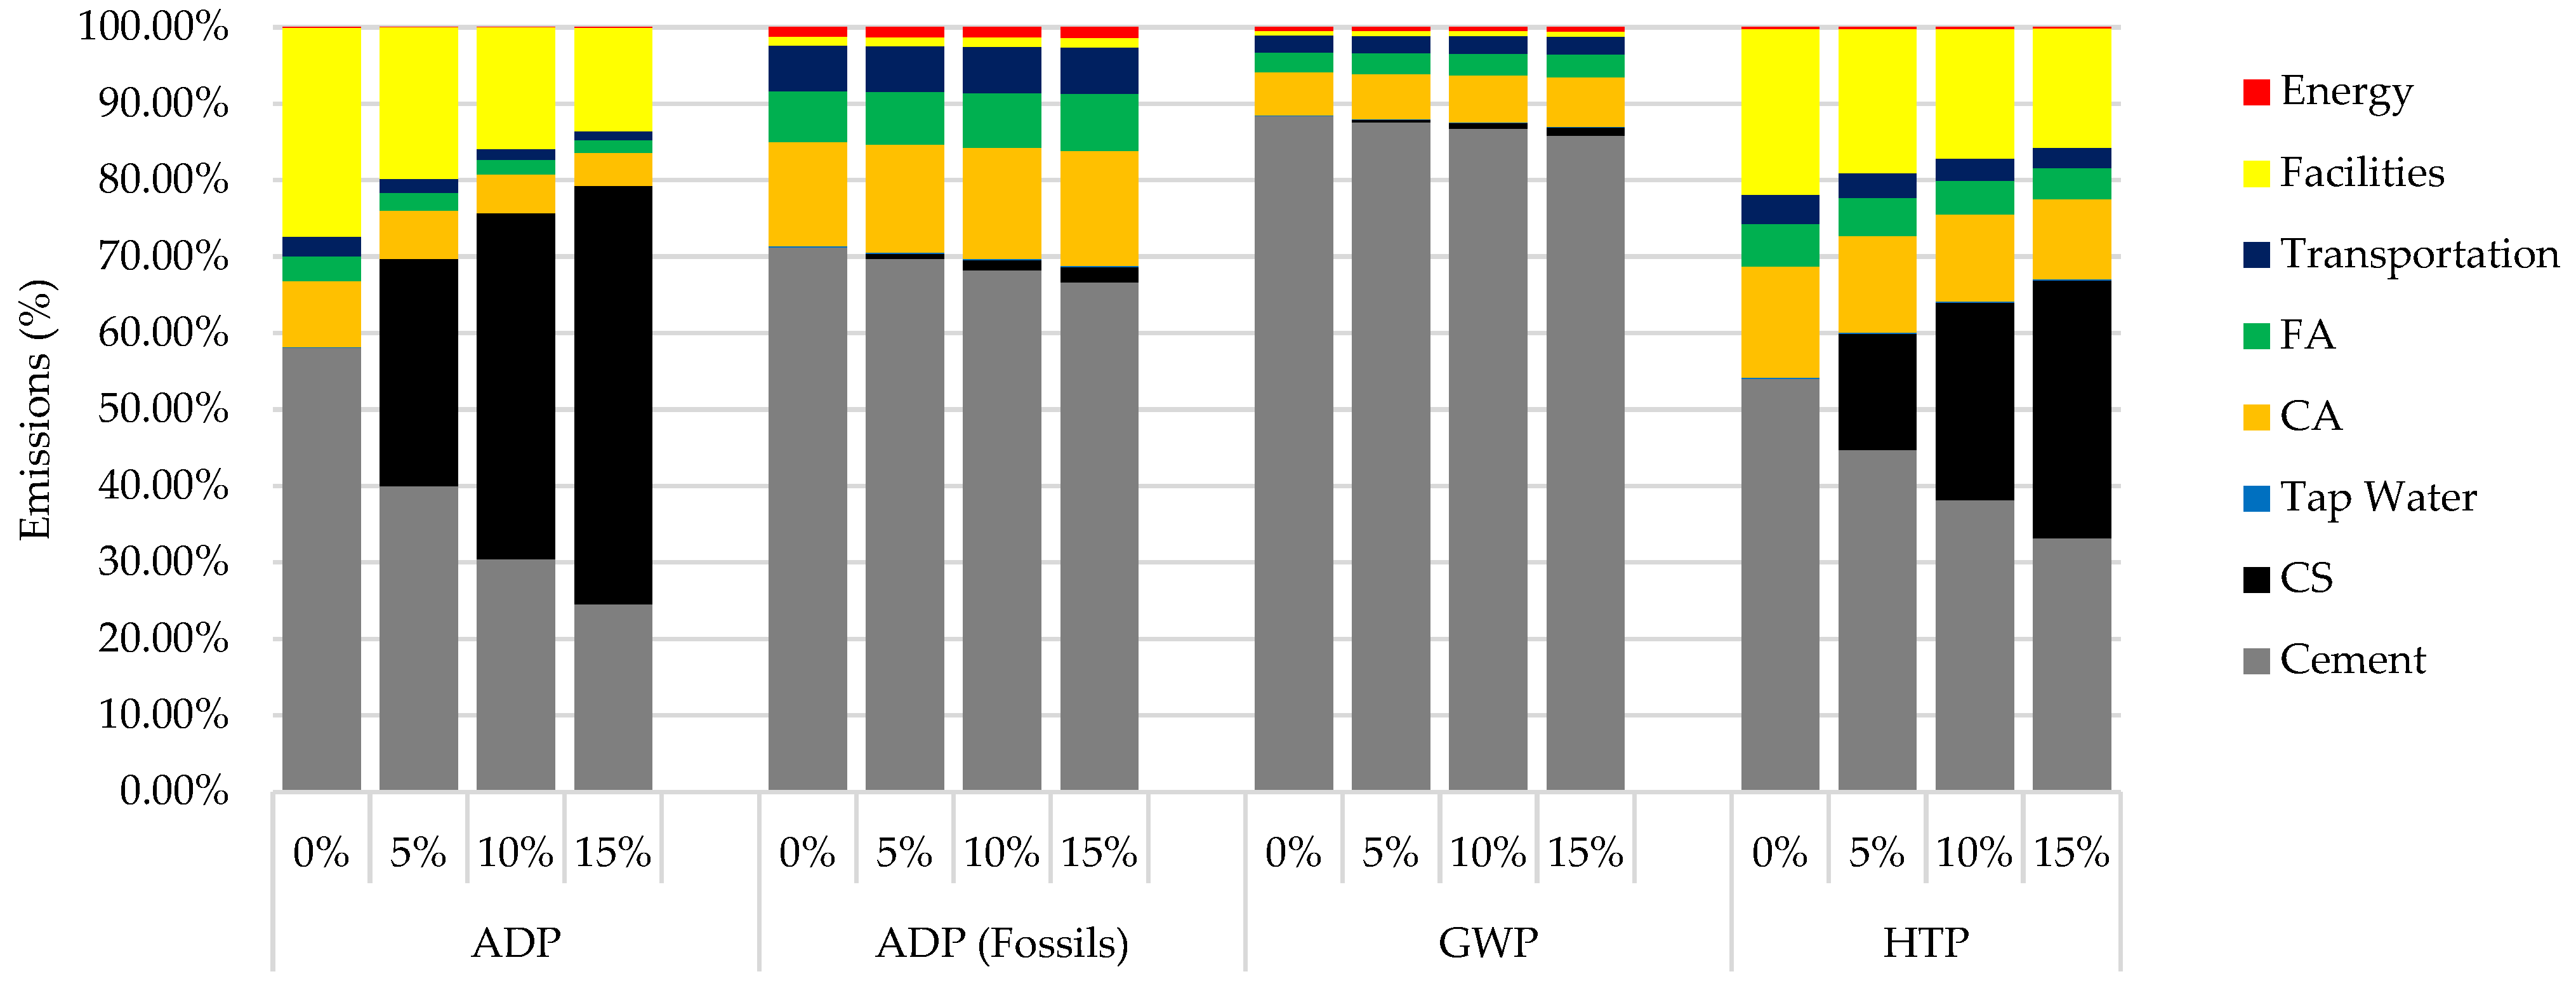
4.2. Environmental Impact Assessment (Phase 2)

Based on Figure 7 and Figure 8, the trends of emissions when replacing a portion of the cement with copper slag in the design of three-story and seven-story buildings were similar to the trends of emissions obtained as part of the LCA in Phase 1. This outcome was to be expected, since the emissions in the Phase 1 LCA, which considered the emissions of 1 cubic meter of concrete, will only be magnified in accordance with and proportionally to the computed concrete volume required for the specific concrete system of the building. While the absolute amount of emissions released by the system will increase with the increasing volume of concrete required for the three-story and seven-story buildings, respectively, the relative impact on emissions with respect to the reference concrete system in a given category will remain equal between the three-story and seven-story functional units. For example, in the GWP category of FC20.7CS5, the total emissions for the functional units corresponding to 1 cubic meter of concrete, a three-story building, and a seven-story building are 293.75 kg CO2 eq., 50,639.46 kg CO2 eq., and 843,701.93 kg CO2 eq., respectively. While the total emissions for the GWP in this concrete system vary and increase with the required volume of concrete, the percentage emission with respect to the baseline is the same for the 1 cubic meter, the three-story, and the seven-story basis, settled at 95.91%.
With reference to both Figure 8 and Figure 9, with increasing concrete strength, in some categories, the increasing amount CS used as SCM resulted in a further increase in emissions compared to concrete of the same strength with no CS. Additionally, a relative increase in emissions can be observed with increasing concrete strength. This trend can be observed in the ADP and HTP categories. Taking the ADP category as an example, in the case of the 20.7 MPa concretes, the emissions increase by 19.94% for FC20.7CS5, 15.78% for FC20.7CS10, and 14.76% for FC20.7CS15, thus resulting in an average increase in emissions of 16.79% with increasing CS in FC 20.7 concrete systems. Extending the same consideration to the other concrete systems in the ADP category, concrete systems with a strength of 27.5 MPa have an average increase in emissions of 17.35%, 34.4 MPa has an average increase in emissions of 17.83%, and 41.4 MPa yields an average increase in emissions of 18.23% with increasing addition of CS in concrete. This indicates that the higher the strength of the concrete used, the greater the increase in emissions to be expected is when increasing the amount of CS used as cement replacement with respect to ADP. This observation also holds true for the HTP category. This observation alludes to the increasing amount of CS being utilized with increasing concrete strength, because the ADP and HTP categories are primarily influenced by the CS, as suggested in Phase 1 of this study. Because increasing concrete strength demands higher amounts of cement, the CS corresponds to a percentage of the total cement mass required to achieve the specified strength. It therefore follows that increasing cement requirements would subsequently increase the amount of copper slag, thereby resulting in greater emissions in the mentioned categories.
To test the significance of the effect of increasing concrete strength on the average increase in emissions with increasing CS replacement, the p-values were also calculated for the ADP and HTP categories, as shown in Table 14 and Table 15, respectively. As can be seen from the tables, the p-values did not exceed the 0.10 requirement for either emission. Therefore, the effect of increasing concrete strength on the average increase in emissions in the ADP and HTP categories with increasing CS content can be regarded as statistically significant.
Concentrating on the GWP and ADP (Fossil) categories, the average reductions in emissions with different contents of CS among concretes with different strengths were approximately equal. Examining the GWP category, the average decreases in emissions when using CS for FC20.7, FC27.5, FC34.5, and FC41.4 were 8.24%, 8.24%, 8.50%, and 8.60%, respectively. This trend is similar to the average decreasing effect of emissions observable in the ADP (Fossil) category. Therefore, it can be observed that variations in concrete strength do not affect the decreasing effect on emissions of CS for the GWP and ADP (Fossil) categories. This trend can be attributed to the fact that cement is the governing component affecting these categories, as evidenced by the Phase 1 results. While the use of CS reduces GWP and ADP (Fossil) emissions, increasing the strength also increases the amount of cement required to produce the concrete. Therefore, even when considering the favorable effects of using CS and of using concretes with higher strength, thus decreasing the material quantities due to the smaller sizes of the structural members, the negative effect of increasing cement demand with the increasing design strength of the concrete cancels out these benefits. However, based on previous studies, LCA involving buildings has focused mainly on the discharge of carbon from the structure [41], which in this case is represented by GWP emissions. Hence, if GWP alone is to be the basis of the performance of the reinforced concrete buildings, the use of CS as cement replacement in concrete for the design of reinforced concrete buildings can be regarded as being favorable, causing a reduction in GWP emissions of 12.8%.
In order to be able to assess the risks compared to the advantages of using CS in reinforced concrete buildings, the environmental emissions were plotted against the cost reduction brought about by using concrete with CS as partial cement replacement, reflecting the environmental impact or increased emissions against the cost reductions as presented in Figure 9 and Figure 10. Examining Figure 9, a cost reduction of 0.96% in a three-story building will yield a 14.92% increase in emissions when using FC20.7CS15. With the highest cost savings of 1.40%, the environmental emissions or impact increase the most, by 15.83%, with the FC41.4CS15 concrete system. From Figure 10, it can be seen that, for a seven-story building utilizing FC20.7FC15, a cost reduction of 0.90% corresponds to a 14.12% increase in emissions, while a cost savings of 1.36% yields a 15.83% increase in environmental emissions when using the FC41.4CS15 concrete system. Nonetheless, even though there is an established relationship between cost savings and environmental impact, the cost savings obtained by using CS as SCM in reinforced concrete are minor in comparison to the increase in environmental emissions.

5. Conclusions

This paper investigated, on the basis of LCA, the environmental effects of using concrete with different amounts of CS as a partial alternative to cement at replacement levels of 5%, 10%, and 15% by mass, and applied this concrete in the design of low-rise and mid-rise reinforced concrete structures. The concrete buildings were designed with varying concrete strengths—20.7 MPa, 27.5 MPa, 34.5 MPa, and 41.4 MPa—and design mix proportions with or without CS were generated for each strength. Cost analysis was also conducted in order to explore the cost reduction achieved when the by-product was used as a substitute for cement. The following key conclusions were drawn:
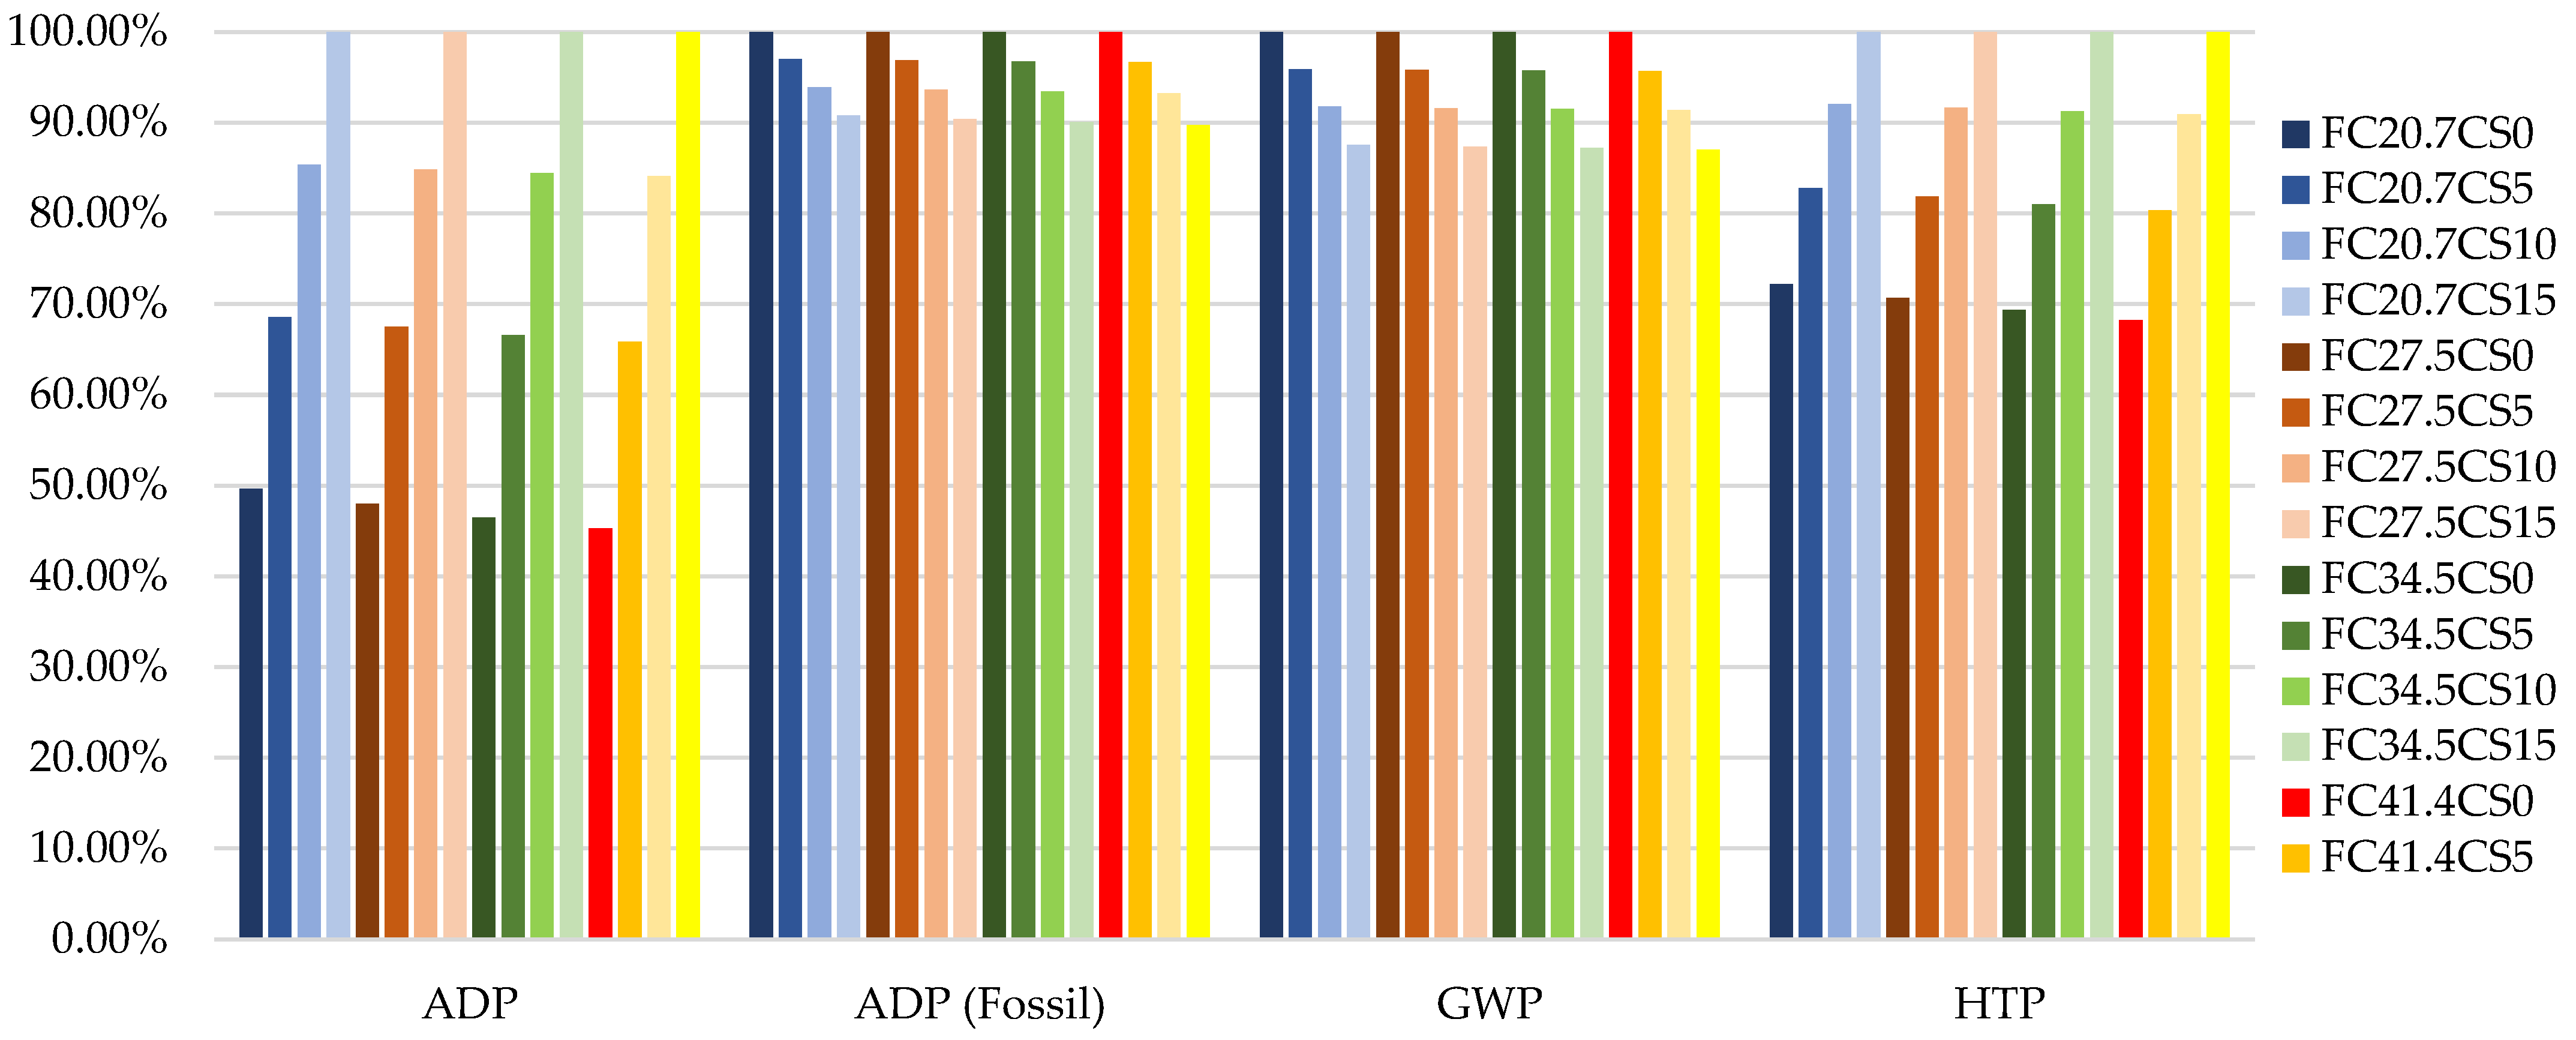
  • Replacement of cement with CS in concrete has favorable environmental effects on the GWP and ADP (Fossil) categories, but is detrimental to the ADP and HTP categories.
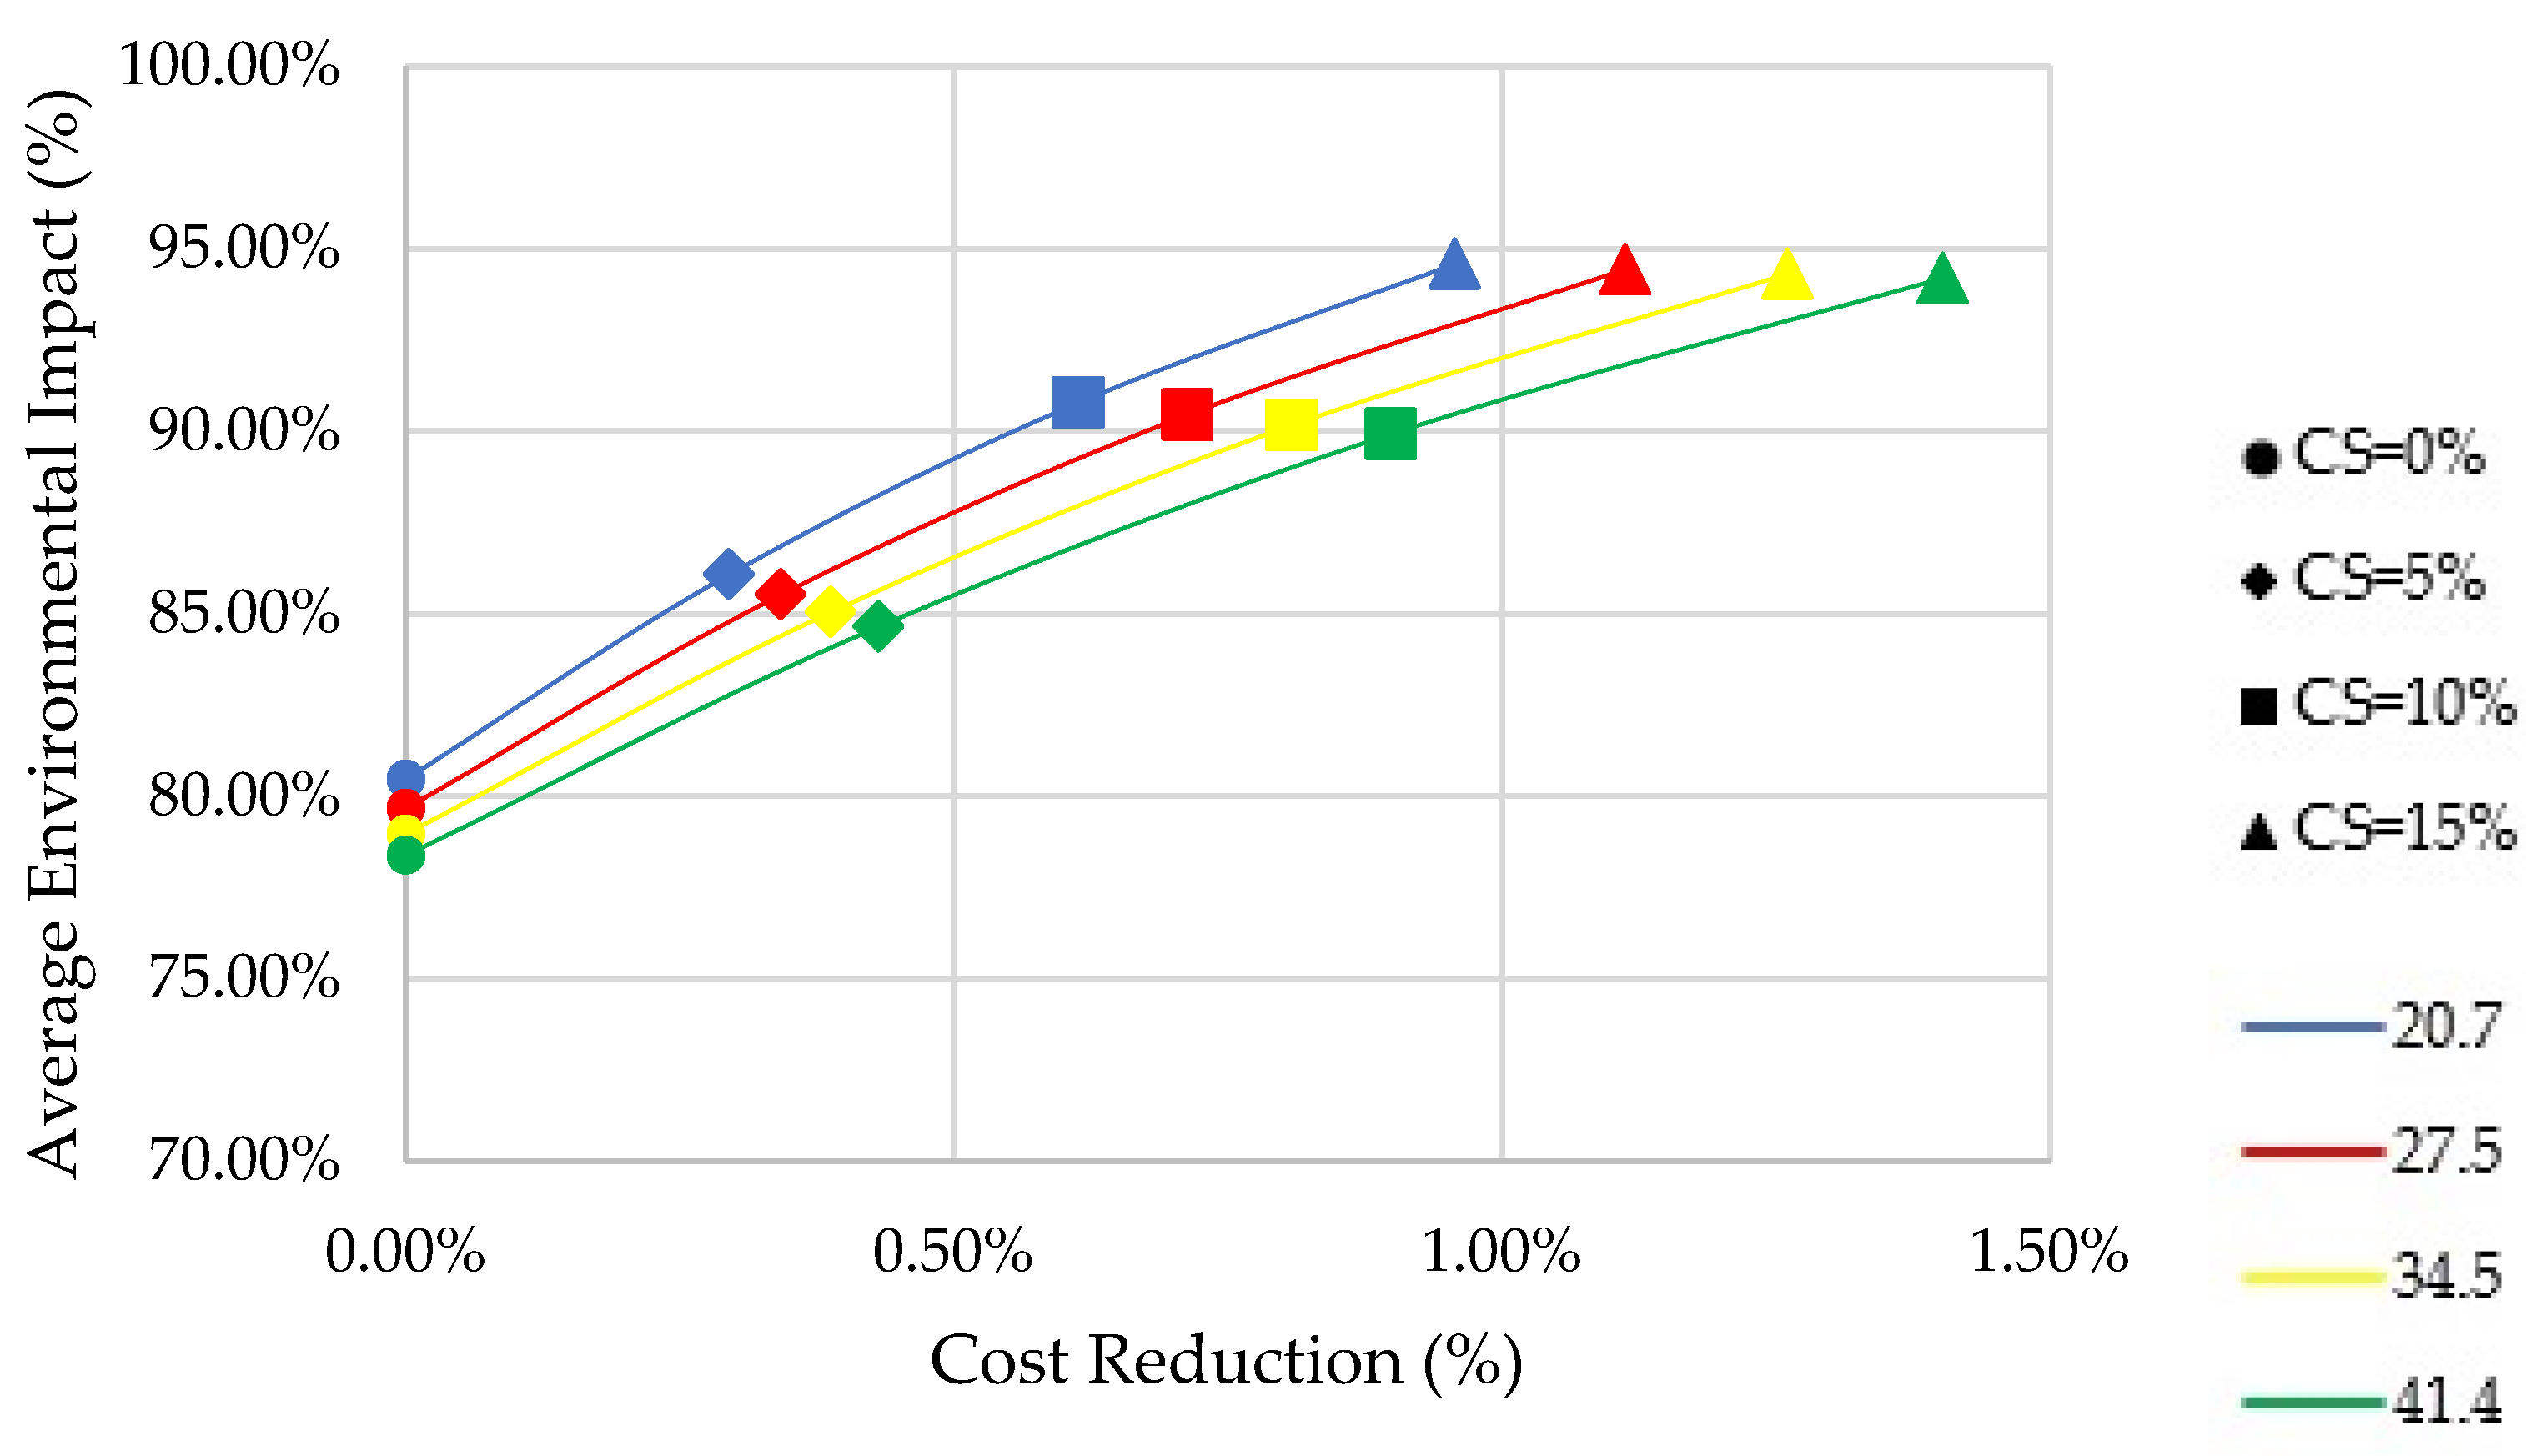
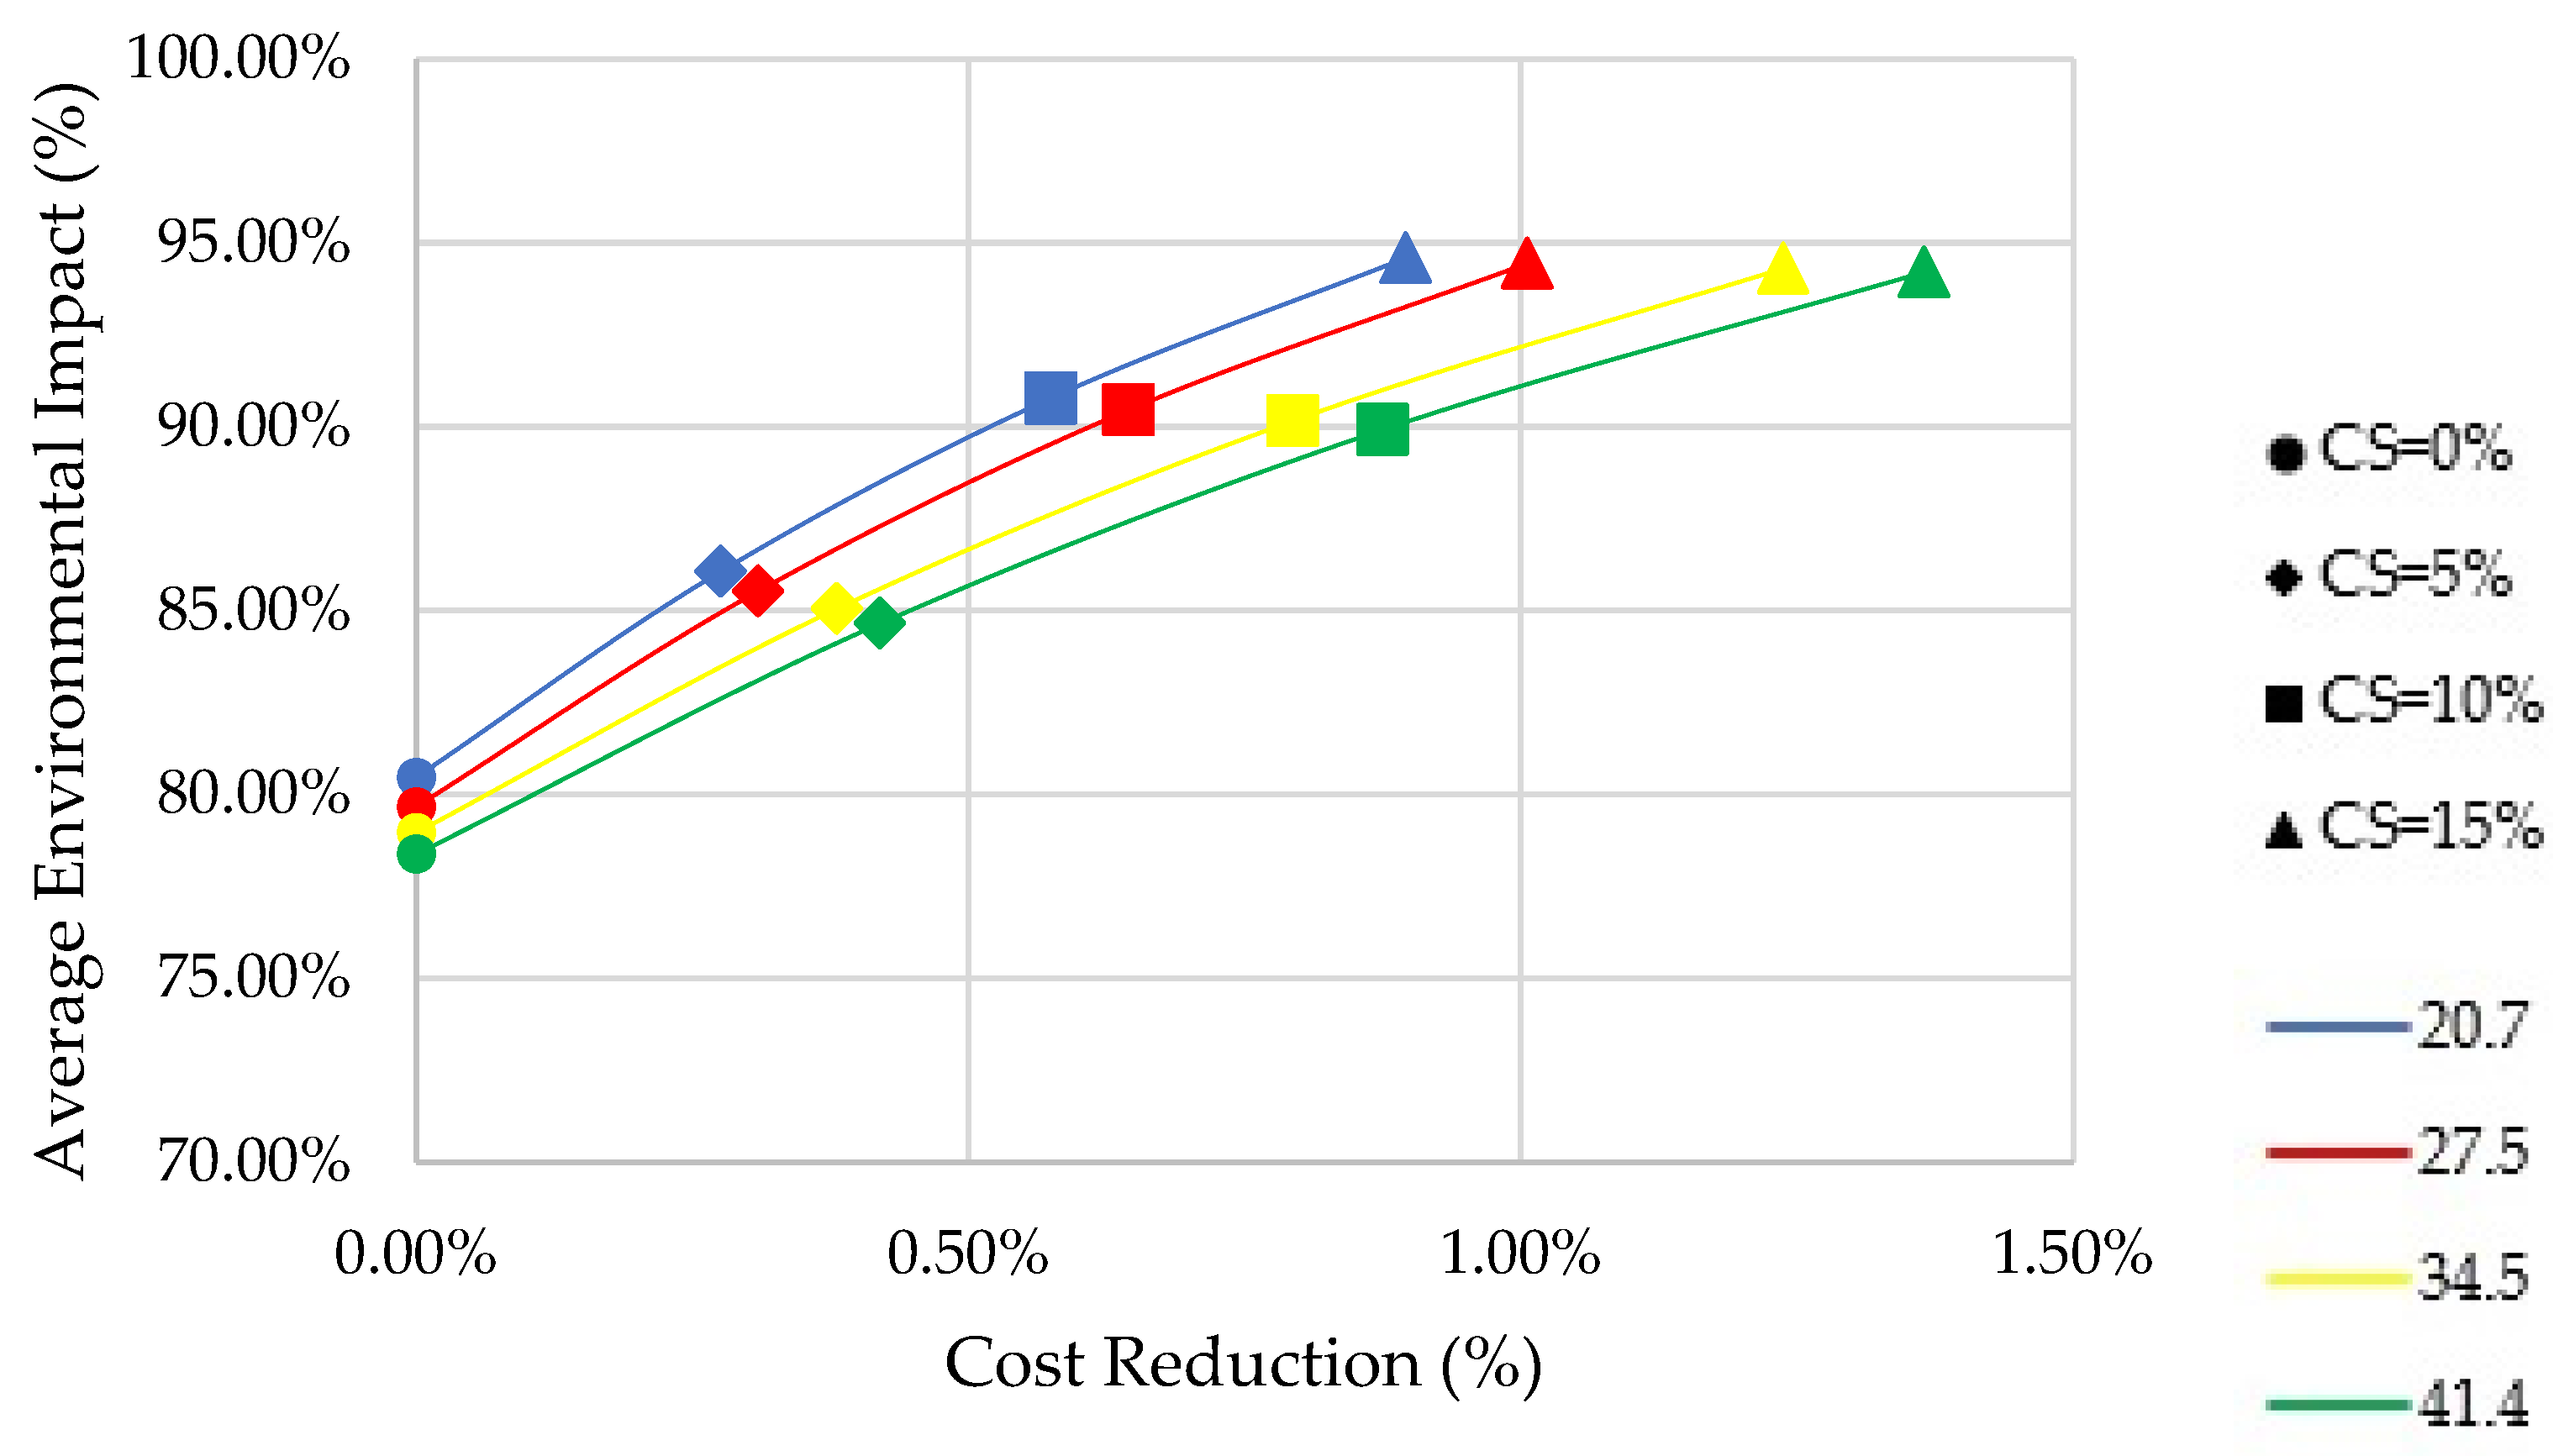
  • Using CS as a partial cement substitute in concrete for use in structures would incur statistically significant savings in building costs, amounting to a saving of 1.40% at most.
  • The influence of increasing the concrete strength on ADP and HTP emissions is statistically significant, but does not affect the ADP (Fossil) or GWP criteria.
  • The favorable impacts on GWP, ADP (Fossil), and building costs are negated by the impacts on ADP and HTP when using CS as a cement alternative in buildings.
  • When assessing environmental effects in buildings by focusing on carbon emissions or on GWP alone, the use of CS would be regarded as beneficial, resulting in a reduction in carbon emissions by up to 12.8%.
For future studies, it is recommended that LCA be conducted on the same concrete buildings as in this study, but instead of considering copper slag as a by-product, future work should consider the slag as waste. Future LCA studies involving CS as a cement replacement should also include environmental categories other than the ones considered in this paper. It is also recommended for future research that technical performance be considered in addition to environmental and economic criteria in the sustainability assessment of CS used as a partial cement alternative by conducting actual tests on concrete systems.

Author Contributions

Conceptualization, J.P.Q.d.P., J.A.T.L. and J.M.C.O.; Data curation, J.A.T.L.; Investigation, J.A.T.L.; Methodology, J.P.Q.d.P.; Software, J.A.T.L.; Supervision, J.M.C.O.; Writing—original draft, J.P.Q.d.P.; Writing—review and editing, J.M.C.O. All authors have read and agreed to the published version of the manuscript.

Funding

This research received no external funding.

Data Availability Statement

The data are contained within the article.

Conflicts of Interest

The authors declare no conflict of interest.

References

  1. McCormac, J.; Brown, R. Design of Reinforced Concrete, 9th ed.; Wiley and Sons: Hoboken, NJ, USA, 2014; p. 1. [Google Scholar]
  2. Van den Heede, P.; De Belie, N. Environmental Impact, and Life Cycle Assessment of Traditional and “Green” Concretes: Literature Review and Theoretical Calculations. Cem. Concr. Compos. 2012, 34, 431–442. [Google Scholar] [CrossRef]
  3. Ullah, K.; Irshad Qureshi, M.; Ahmad, A.; Ullah, Z. Substitution potential of plastic fine aggregate in concrete for sustainable production. Structures 2022, 35, 622–637. [Google Scholar] [CrossRef]
  4. Andrew, R.M. Global CO2 emissions from cement production. Earth Syst. Sci. Data 2019, 11, 1675–1710. [Google Scholar] [CrossRef] [Green Version]
  5. Lotenbach, B.; Scrivener, K.; Hooton, R.D. Supplementary Cementitious Materials. Cem. Concr. Res. 2010, 41, 217–229. [Google Scholar] [CrossRef]
  6. Bautista, B.E.; Ongpeng, J.M.C.; Razon, L.F. LCA of Mortar with Calcined Clay and Limestone Filler in RC Column Retrofit. Sustainability 2022, 14, 1175. [Google Scholar] [CrossRef]
  7. Shahas, S.; Girija, K.; Nazeer, M. Evaluation of pozzolanic activity of ternary blended supplementary cementitious materials with rice husk ash and GGBS. Mater. Today Proc. 2023; in press. [Google Scholar] [CrossRef]
  8. Zeybek, O.O.Y.; Karalar, M.; Celik, A.; Qaidi, S.; Ahmad, J.; Burduhos-Nergis, D.; Burduhos-Nergis, D. Influence of replacing cement with waste glass on mechanical properties of concrete. Materials 2022, 15, 7513. [Google Scholar] [CrossRef]
  9. Karalar, M.; Ozkilic, Y.; Aksoylu, C.; Sabri Sabri, M.; Beskopylny, M.; Stel’makh, S.; Shcherban, E. Flexural behavior of reinforced concrete beams using waste marble powder towards application of sustainable concrete. Front. Mater. 2022, 9, 1068791. [Google Scholar] [CrossRef]
  10. Laila, L.; Gurupatham, B.; Roy, K.; Lim, J. Influence of super absorbent polymer on mechanical, rheological, durability, and microstructural properties of self-compacting concrete using non-biodegradable granite pulver. Struct. Concr. 2020, 22, E1093–E1116. [Google Scholar] [CrossRef]
  11. Chindasiriphan, P.; Meenyut, B.; Orasutthikul, S.; Jongvivatsakul, P.; Tangchirapat, W. Influences of high-volume coal bottom ash as cement and fine aggregate replacement on strength and heat evolution of eco-friendly high-strength concrete. J. Build. Eng. 2023, 65, 105791. [Google Scholar] [CrossRef]
  12. Manjunatha, M.; Reshma, T.V.; Balaji, K.V.G.D.; Bharath, A.; Tangadagi, R.B. The Sustainable Use of Waste Copper Slag in Concrete: An Experimental Research. Mater. Today Proc. 2021, 47, 3645–3653. [Google Scholar] [CrossRef]
  13. Wang, J.; Erdenebold, U. A Study on the Reduction of Copper Smelting Slag by Carbon for Recycling into Metal Values and Cement Raw Material. Sustainability 2020, 12, 1421. [Google Scholar] [CrossRef] [Green Version]
  14. Trixier, R.; Devaguptu, R.; Mobasher, B. Effects of Copper Slag on the Hydration and Mechanical Properties of Blended Cementitious Mixtures. Cem. Concr. Res. 1997, 27, 1569–1580. [Google Scholar] [CrossRef]
  15. Dhir, R.K.; de Brito, J.; Mangabhai, R.; Lye, C.Q. 3–Production and Properties of Copper Slag. In Sustainable Construction Materials: Copper Slag; Woodhead Publishing: Sawston, UK, 2017; pp. 30–41. [Google Scholar] [CrossRef]
  16. Arino, A.M.; Mobasher, B. Effect of Copper Slag on the Strength and Toughness of Cementitious Mixtures. ACI Mater. 1996, 96, 68–73. [Google Scholar]
  17. Marku, J.; Vaso, K. Optimization of copper slag waste content in blended cement production. Zastista Mater. Sci. Pap. 2010, 51, 77–80. [Google Scholar]
  18. Afshoon, I.; Mahmoud, M.; Mousavi, S. Comprehensive experimental and numerical modeling of strength parameters of eco-friendly steel fiber reinforced SCC containing coarse copper slag aggregates. Constr. Build. Mater. 2023, 367, 130304. [Google Scholar] [CrossRef]
  19. Raju, S.; Dharmar, B. Studies on flexural behavior of reinforced concrete beams with copper slag and fly ash. Struct. Concr. 2019, 21, 107–116. [Google Scholar] [CrossRef]
  20. Mirnezami, S.; Hassani, A.; Bayat, A. Evaluation of the effect of metallurgical aggregates (steel and copper slag) on the thermal conductivity and mechanical properties of concrete in jointed plain concrete pavements (JPCP). Constr. Build. Mater. 2023, 367, 129532. [Google Scholar] [CrossRef]
  21. Gu, X.; Sun, W.; Ai, Y. Application of Copper Slag in Ultra-high Performance Concrete. JOM 2023. [Google Scholar] [CrossRef]
  22. Arora, S.; Jangra, P.; Lim, Y.; Pham, T.M. Strength, durability, and microstructure of self-compacting geopolymer concrete produced with copper slag aggregates. Environ. Sci. Pollut. Res. 2023, 30, 666–684. [Google Scholar] [CrossRef]
  23. Panda, S.; Sarkar, P.; Davis, R. Microstructural Characterization of ITZ in Copper Slag Concrete Composite. J. Mater. Civ. Eng. 2022, 34, 04022188. [Google Scholar] [CrossRef]
  24. Muralikrishna, I.; Manickam, V. Chapter Five—Life Cycle Assessment. In Environmental Management; Butterworth-Heinemann: Oxford, UK, 2017; pp. 57–75. [Google Scholar]
  25. Kua, H. Attributional and Consequential Life Cycle Inventory Assessment of Recycling Copper Slag as Building Material in Singapore. Trans. Inst. Meas. Control 2012, 35, 510–520. [Google Scholar] [CrossRef]
  26. Khorassani, S.M.; Siligardi, C.; Mugoni, C.; Pini, M.; Capucci, G.M.; Ferrari, A.M. Life Cycle Assessment of a Ceramic Glaze Containing Copper Slags, and its Application on Ceramic Tiles. Appl. Ceram. Technol. 2019, 1, 42–54. [Google Scholar] [CrossRef] [Green Version]
  27. Gursel, A.P.; Ostertag, C. Life Cycle Assessment of High-Strength Concrete Mixtures with Copper Slag as Sand Replacement. Adv. Civ. Eng. 2019, 2019, 6815348. [Google Scholar] [CrossRef]
  28. Kua, H. The consequences of substituting sand with used copper slag in construction. J. Ind. Ecol. 2013, 17, 869–879. [Google Scholar] [CrossRef]
  29. American Concrete Institute. ACI Committee 211: Standard Practice for Selecting Proportions for Normal, Heavyweight, and Mass Concrete (ACI 211.1-91); American Concrete Institute: Farmington Hills, MI, USA, 2002. [Google Scholar]
  30. Wang, G. 13—Slag use in cement manufacture and cementitious applications. In The Utilization of Slag in Civil Infrastructure Construction; Woodhead Publishing: Sawston, UK, 2016; pp. 305–337. [Google Scholar] [CrossRef]
  31. ISO 14040; Environmental Management—Life Cycle Assessment—Principles and Framework. ISO: Geneva, Switzerland, 2006.
  32. European Commission. Commission Decision 2014/955/EU of 18 December 2008 amending Decision 2000/532/EC on the list of waste under Directive 2008/98/EC of the European Parliament and of the Council. Off. J. European Union 2014, 370, 44–86. [Google Scholar]
  33. ISO 14044; Environmental Management—Life Cycle Assessment—Requirements and Guidelines. ISO: Geneva, Switzerland, 2006.
  34. Classen, M.; Althaus, H.J.; Blaser, S.; Doka, G.; Jungbluth, N.; Tuchschmid, M. Life Cycle Inventories of Metals. In Final Report Ecoinvent Data V.2 No.10; Swiss Center for Life Cycle Inventories: Dubendorf, Switzerland, 2009. [Google Scholar]
  35. Biron, M. 15—EcoDesign. In Material Selection for Thermoplastic Parts; William Andrew Publishing: Norwich, NY, USA, 2016; pp. 603–653. [Google Scholar] [CrossRef]
  36. Durante, S.; Comoglio, M.; Ridgway, N. Chapter 34—Life Cycle Assessment in Nanotechnology, Materials and Manufacturing. In Micromanufacturing Engineering and Technology; William Andrew Publishing: Norwich, NY, USA, 2015; pp. 775–804. [Google Scholar] [CrossRef]
  37. Mahzuz, H.M.A.; Choudhury, M.R.; Ahmed, A.R.; Ray, S. Effect of Material Strength on Cost of RCC Building Frames. Springer Nat. Appl. Sci. 2020, 2, 1–8. [Google Scholar] [CrossRef] [Green Version]
  38. Association of Structural Engineers of the Philippines. National Structural Code of the Philippines, 7th ed.; ASEP: Quezon City, Philippines, 2015. [Google Scholar]
  39. Alkharki, A. 6—The observed significance level (P-value) procedure. In Applications of Hypothesis Testing for Environmental Science; Elsevier: Amsterdam, The Netherlands, 2021. [Google Scholar]
  40. US Census Bureau. Statistical Quality Standard E1: Analyzing Data. Available online: https://www.census.gov/about/policies/quality/standards/standarde1.html (accessed on 27 February 2023).
  41. Dani, A.; Roy, K.; Masood, R.; Fang, Z.; Lim, J. A comparative study on the life cycle assessment of New Zealand residential buildings. Buildings 2022, 12, 50. [Google Scholar] [CrossRef]
Figure 1. System boundaries of 20.7 MPa concrete production.
Buildings 13 00746 g001
Figure 2. Typical floor framing plan [37].
Buildings 13 00746 g002
Figure 3. Impact assessment of 20.7 MPa concrete systems.
Buildings 13 00746 g003
Figure 4. Disaggregation of impact assessment of 20.7 MPa concrete systems.
Buildings 13 00746 g004
Figure 5. Three-story total cost with different concrete design strengths with CS as SCM.
Buildings 13 00746 g005
Figure 6. Seven-story total cost with different concrete design strengths with CS as SCM.
Buildings 13 00746 g006
Figure 7. Three-story building environmental impact assessment.
Buildings 13 00746 g007
Figure 8. Seven-story building environmental impact assessment.
Buildings 13 00746 g008
Figure 9. Three-story building environmental impact vs. cost reduction plots by concrete strength.
Buildings 13 00746 g009
Figure 10. Seven-story building environmental impact vs. cost reduction plots by concrete strength.
Buildings 13 00746 g010
Table 1. Material specific gravities and unit weights.
MaterialSpecific GravityUnit Weight in kg/cu.m
Cement3.153150
CA2.842840
FA2.402400
Water1.01000
CS3.503500
Table 2. Design strength and corresponding water–cement ratio.
Concrete Design StrengthWater–Cement Ratio
20.70 MPa0.68
27.5 MPa0.57
34.50 MPa0.48
41.40 MPa0.41
Table 3. Concrete mix proportions on a per cubic meter basis.
ComponentFC20.7
CS0
FC20.7
CS5
FC20.7
CS10
FC20.7
CS15
FC27.5
CS0
FC27.5
CS5
FC27.5
CS10
FC27.5
CS15
Cement (kg)301.47286.40271.32256.25359.65341.67323.68305.70
CS (kg)014.3227.1338.44017.0832.3745.86
Water (kg)205.00205.00205.00205.00205.00205.00205.00205.00
CA (kg)1122.551122.551122.551122.551122.551122.551122.551122.55
FA (kg)681.68683.34686.04689.77637.35639.34642.56647.01
ComponentFC34.5
CS0
FC34.5
CS5
FC34.5
CS10
FC34.5
CS15
FC41.4
CS0
FC41.4
CS5
FC41.4
CS10
FC41.4
CS15
Cement (kg)427.08405.73384.38363.02500.00475.00450.00425.00
CS (kg)020.2938.4454.45023.7545.0063.75
Water (kg)205.00205.00205.00205.00205.00205.00205.00205.00
CA (kg)1122.551122.551122.551122.551122.551122.551122.551122.55
FA (kg)585.97588.33592.15597.44530.42533.18537.65543.84
Table 4. Applied loads [37].
LoadLoad Values (kPa)Acting on
Wall load25Beam
Floor finish1.50Slab
Partition wall1.0Slab
Live load2.0Slab
Table 5. Seismic factor values.
FactorValue
Importance Factor1.0
Soil Profile TypeSd
Seismic Source Distance10 km
Seismic Source TypeA
Table 6. Three-story building beam sizes and reinforcements.
Concrete Design Strength Beam Size in Mm
(Width × Depth)
Rebar Diameter (mm) Reinforcement at Supports (Pieces) Reinforcements at Midspan (Pieces) Stirrups
Top BarsBottom BarsTop BarsBottom Bars
20.70 MPa325 × 6502563232-ϕ12 mm; 1@50,20@100,
Rest to Centerline@250
27.50 MPa325 × 6502563232-ϕ12 mm; 1@50,20@100,
Rest to Centerline @260
34.50 MPa300 × 6002563232-ϕ12 mm; 1@50,20@100,
Rest to Centerline @240
41.50 MPa275 × 5502563232-ϕ12 mm; 1@50,20@100,
Rest to Centerline @210
Table 7. Seven-story building beam sizes and reinforcements.
Concrete Design StrengthBeam Size in Mm
(Width × Depth)
Rebar Diameter (mm)Reinforcement at Supports in PiecesReinforcements at Midspan in PiecesStirrups
Top BarsBottom BarsTop BarsBottom Bars
20.70 MPa325 × 6502553232-ϕ12 mm; 1@50,20@100,
Rest to Centerline@310
27.50 MPa325 × 6502553232-ϕ12 mm; 1@50,20@100,
Rest to Centerline @280
34.50 MPa300 × 6002553232-ϕ12 mm; 1@50,20@100,
Rest to Centerline @300
41.50 MPa275 × 5502563232-ϕ12 mm; 1@50,20@100,
Rest to Centerline@220
Table 8. Three-story building column reinforcement detail.
Concrete Design StrengthSize (mm)Diameter of Vertical Bars (mm)Number of Vertical Bars (Pieces)
20.70 MPa475 × 4752520
27.50 MPa450 × 4502520
34.50 MPa450 × 4502520
41.50 MPa425 × 4252520
Table 9. Seven-story building column reinforcement detail.
Concrete Design StrengthSize (mm)Diameter of Vertical Bars (mm)Number of Vertical Bars (Pieces)
20.70 MPa575 × 5753220
27.50 MPa525 × 5253220
34.50 MPa525 × 5252820
41.50 MPa475 × 4752820
Table 10. Item unit costs in USD, effective for 2022.
ItemUnit Cost (USD)Unit
Cement0.110kg
CS0.054kg
Water0.040kg
CA0.010kg
FA0.010kg
Reinforcements1.040kg
Formworks15.400m2
Table 11. Inventory of concrete mixes for 20.7 MPa per 1-cubic-meter functional unit.
StageData Per FUUnitFC20.7CS0FC20.7CS5FC20.7CS10FC20.7CS15
MaterialCementkg301.47286.40271.32256.25
Waterkg205.00205.00205.00205.00
Coarse Aggregates (CA)kg1122.551122.5501122.5501122.55
Fine Aggregates (FA)kg681.68683.34686.04689.77
CSkg014.3227.1338.44
TransportLorry 3.5–7.5 metric tonst-km12.05911.81411.53111.211
FacilitiesConcrete Mixing Plantu0.0000004570.0000004570.0000004570.000000457
EnergyProductionMJ15.64315.64315.64315.643
Table 12. Three-story building cost and cost savings, along with corresponding p-value.
Concrete SystemTotal Building CostSavingsp-Value
FC20.7CS050,469.590.002.188 × 10−14
FC20.7CS550,320.91148.68
FC20.7CS1050,159.87309.72
FC20.7CS1549,986.48483.11
FC27.5CS051,139.920.005.442 × 10−14
FC27.5CS550,964.82175.10
FC27.5CS1050,775.17364.75
FC27.5CS1550,570.96568.96
FC34.5CS050,762.050.001.163 × 10−13
FC34.5CS550,565.08196.97
FC34.5CS1050,351.74410.31
FC34.5CS1550,122.04640.02
FC41.4 CS050,013.160.002.217 × 10−13
FC41.4CS549,797.36215.80
FC41.4CS1049,563.63449.54
FC41.4CS1549,311.96701.20
Table 13. Seven-story building cost and cost savings, along with corresponding p-value.
Concrete SystemTotal Building CostSavingsp-Value
FC20.7CS0171,186.870.001.465 × 10−14
FC20.7CS5170,714.85472.02
FC20.7CS10170,203.61983.26
FC20.7CS15169,653.141533.72
FC27.5CS0167,709.750.002.954 × 10−14
FC27.5CS5167,190.55519.20
FC27.5CS10166,628.201081.54
FC27.5CS15166,022.721687.02
FC34.5CS0161,884.620.001.038 × 10−13
FC34.5CS5161,268.07616.55
FC34.5CS10160,600.291284.33
FC34.5CS15159,881.282003.34
FC41.4 CS0158,533.010.001.882 × 10−13
FC41.4CS5157,867.13665.88
FC41.4CS10157,145.921387.09
FC41.4CS15156,369.372163.63
Table 14. ADP p-value for concrete strength and average increase in emissions with increasing CS.
Concrete StrengthAverage Increase in ADP Emissionsp-Value
20.7 MPa16.787%0.048
27.5 MPa17.347%
34.5 MPa17.833%
41.4 MPa18.233%
Table 15. HTP p-value for concrete strength and average increase in emissions with increasing CS.
Concrete StrengthAverage Increase in HTP Emissionsp-Value
20.7 MPa9.260%0.015
27.5 MPa9.760%
34.5 MPa10.213%
41.4 MPa10.597%
Disclaimer/Publisher’s Note: The statements, opinions and data contained in all publications are solely those of the individual author(s) and contributor(s) and not of MDPI and/or the editor(s). MDPI and/or the editor(s) disclaim responsibility for any injury to people or property resulting from any ideas, methods, instructions or products referred to in the content.

