1. Introduction
Reducing energy consumption is necessary not only to protect the environment, but also because of rising costs that could lead to energy poverty [
1]. Building air tightness and controlled ventilation are essential elements of energy performance [
2]. Not so long ago, it was believed that ventilation losses account for 30 to 40% of gross heat losses in continental climates [
3,
4]. However, these are not numbers that indicate the importance of airtightness on energy consumption. In fact, if we compare the airtightness of high-performance buildings with their heating energy consumption, the correlation is at most 5% [
5]. According to a Norwegian Ph.D. thesis, an increase in airtightness can reduce energy consumption by 20 kWh/m
2, making a non-negligible difference of 10% [
6]. Nevertheless, the effect of infiltration on energy consumption in buildings with higher airtightness is negligible [
7]. The reduction of air infiltration leads to higher ventilation demands. Therefore, airtightness influences the energy loss through ventilation only insignificantly. However, in contrast to the infiltration, we can influence the intensity and schedule of the ventilation, which is necessary regarding heating and summer cooling [
8]. Moreover, the air quality brought in by deliberate ventilation is even better than the infiltrating air per leakage.
The most common locations for air leakages are well-known and documented. According to the overview written by Gullbrekken and col. [
9], the most common location is between the external walls and floors or ceilings, at the joint of windows and external walls, and the penetrations in the barrier layers (e.g., due to electrical installations, chimneys, and others). Among the factors influencing airtightness, envelope structure and building method dominate, but supervision, quality, feedback, and guidance are also significant [
10]. Therefore, in addition to the choice of the construction system, thorough execution is also important for the airtightness of buildings.
According to multiple studies, envelope structures consisting of wood or steel frame have worse airtight results than those built of concrete, bricks, or masonry [
11,
12,
13,
14]. Moreover, there is a significant difference between prefabricated walls (higher airtightness) and those built on-site [
15]. A compact airtight envelope, necessary for modern timber houses, can be constructed in multiple ways, depending on the construction system and position. Due to its low permeability, a vapor-barrier foil is often preferred. However, high values of airtightness are possible only after thorough execution of multiple connections and joints throughout the construction. The means to connect each layer, foremost in intricate details, are crucial to ensure the desirable airtightness and depend on the type of the designed wall.
The measurements of various construction details were the focus of a study from Estonia [
16], according to which the most severe leakages were found in the joint between the external wall and the internal floor as well as in the external wall corners. Aside from sealing the vapor-barrier foil, the team also analyzed the influence of applying the weather membrane from the exterior side. The results support the importance and necessity of an airtight weather membrane, which is capable of causing a substantial air leakage decrement. Regarding the sealing importance, they state that the taping of the internal air and vapor barrier in the external wall and inserted floor connection had only minimal influence on the air tightness, as the two beams at the end of the wall already sufficiently sealed the connection.
There are two main approaches to providing an airtight layer using a vapor barrier. One of them is to tape the connections cautiously. On the other hand, the second is to create an adequate overlap and clamp it between the construction elements [
17]. Moreover, in the case of a diffuse-open structure, the foil can be substituted by some other material with differentiating airtightness [
18], one of them being an oriented strand board OSB. The air permeability, as a physical property of an OSB, is strongly dependent on the manufacturing process [
19].
Moreover, the OSB can also be used to provide a wind barrier. However, if the OSB comes into contact with water, its airtightness decreases. Applying a water bath, when the moisture content of the OSB increases from 10 to 17%, the air permeability in a pressure difference of 50 Pa increases by 5.6% [
20]. While being exposed to a humid environment, it is necessary to provide an appropriate compact wind barrier [
21].
Many European countries and North America have airtightness requirements regarding the air change rate n50 [1/h] during a pressure difference of 50 Pa [
22]. The measurements of building airtightness can be executed with a blower-door method according to the EN 13829 standard [
23]. On the other hand, to evaluate the materials, multiple devices are built in line with EN 12114 [
24]. The approach lies in placing the overpressure chamber on the interior side of the fragment.
The laboratory measurements regarding air permeability help compare different approaches. Moreover, evaluating different materials and fragments in actual in situ measurements is challenging. It is technologically tricky and often insufficient to seal the overpressure chamber properly and to prevent air leakages [
25]. Due to a low airflow rate, the measurements are executed by applying a higher pressure difference than the blower-door test [
26]. Acoustic methods, emerging in recent years, quantify the airflow based on the ultrasound reduction recorded between a sound transmitter on one side and the sound receiver on the other side of the envelope [
27].
According to EN 12114 [
24], it is necessary to correct the results depending on the climatic conditions, namely temperature and relative humidity. Specifically, it is an adjustment of physical relations regarding the airflow. The impact of seasonality and relative humidity on blower-door test results is the main focus of Paula Wahlgren [
26], executing five to six tests during ten months on timber-based houses built in 2004 and 1993 in Sweden. The measurements confirmed a higher airtightness during the summer compared to the colder winter months, the difference being approximately 10%. Moreover, a recent study discovered a significant discrepancy in measurements executed during a rainy day—n50 = 0.67 1/h, compared to the one carried out during a sunny day—n50 = 0.46 1/h [
21], creating an increase of 31%.
The seasonal diversity of buildings’ airtightness is another complication of the design. Should the regulations or the customer have a specific requirement on airtightness, and how can we ensure to fulfill them? The measurements right after the completion are unreliable and do not represent the real airtightness of the finished building. To provide reliable outcomes, it is necessary to execute multiple measurements in varying boundary conditions [
28].
This paper focuses on two primary goals. Firstly, we determine the difference in the air permeability after varying the moisture content of the supporting structure—increasing and gradually decreasing the moisture content. The second goal is to evaluate and quantify the difference between the two approaches in connecting the vapor-barrier layer and their influence on the fragments’ airtightness.
2. Materials and Methods
The difference in air pressure between the internal and external environment is an essential condition for the airflow through the envelope. A possible cause is the combination of wind, the temperature difference between the inner and outer environment, and the eventual mechanical ventilation system [
29].
An empiric equation presents the correlation between the airflow and the pressure difference:
where
is the volumetric airflow [m
3/h],
C is the leakage coefficient [m
3/(h*Pan)], Δ
p is the pressure difference [Pa], and
n is the flow exponent.
The parameters C and n directly relate to the airtightness of a construction. They determine the amount of air and its way of penetrating the structure. The leakage coefficient represents the volumetric airflow by the pressure difference of 1 Pa and thus determines the scale of a leakage. On the other hand, the flow exponent n characterizes the airflow [
29], its value being within the interval from 0.5 for turbulent to 1.0 for laminar flow. Should the element lack additional details, we can use the value of 0.67 [
19,
29].
2.1. Experimental Setup
The measurement of air leakage through the timber-based construction was conducted under laboratory conditions according to EN 12114 [
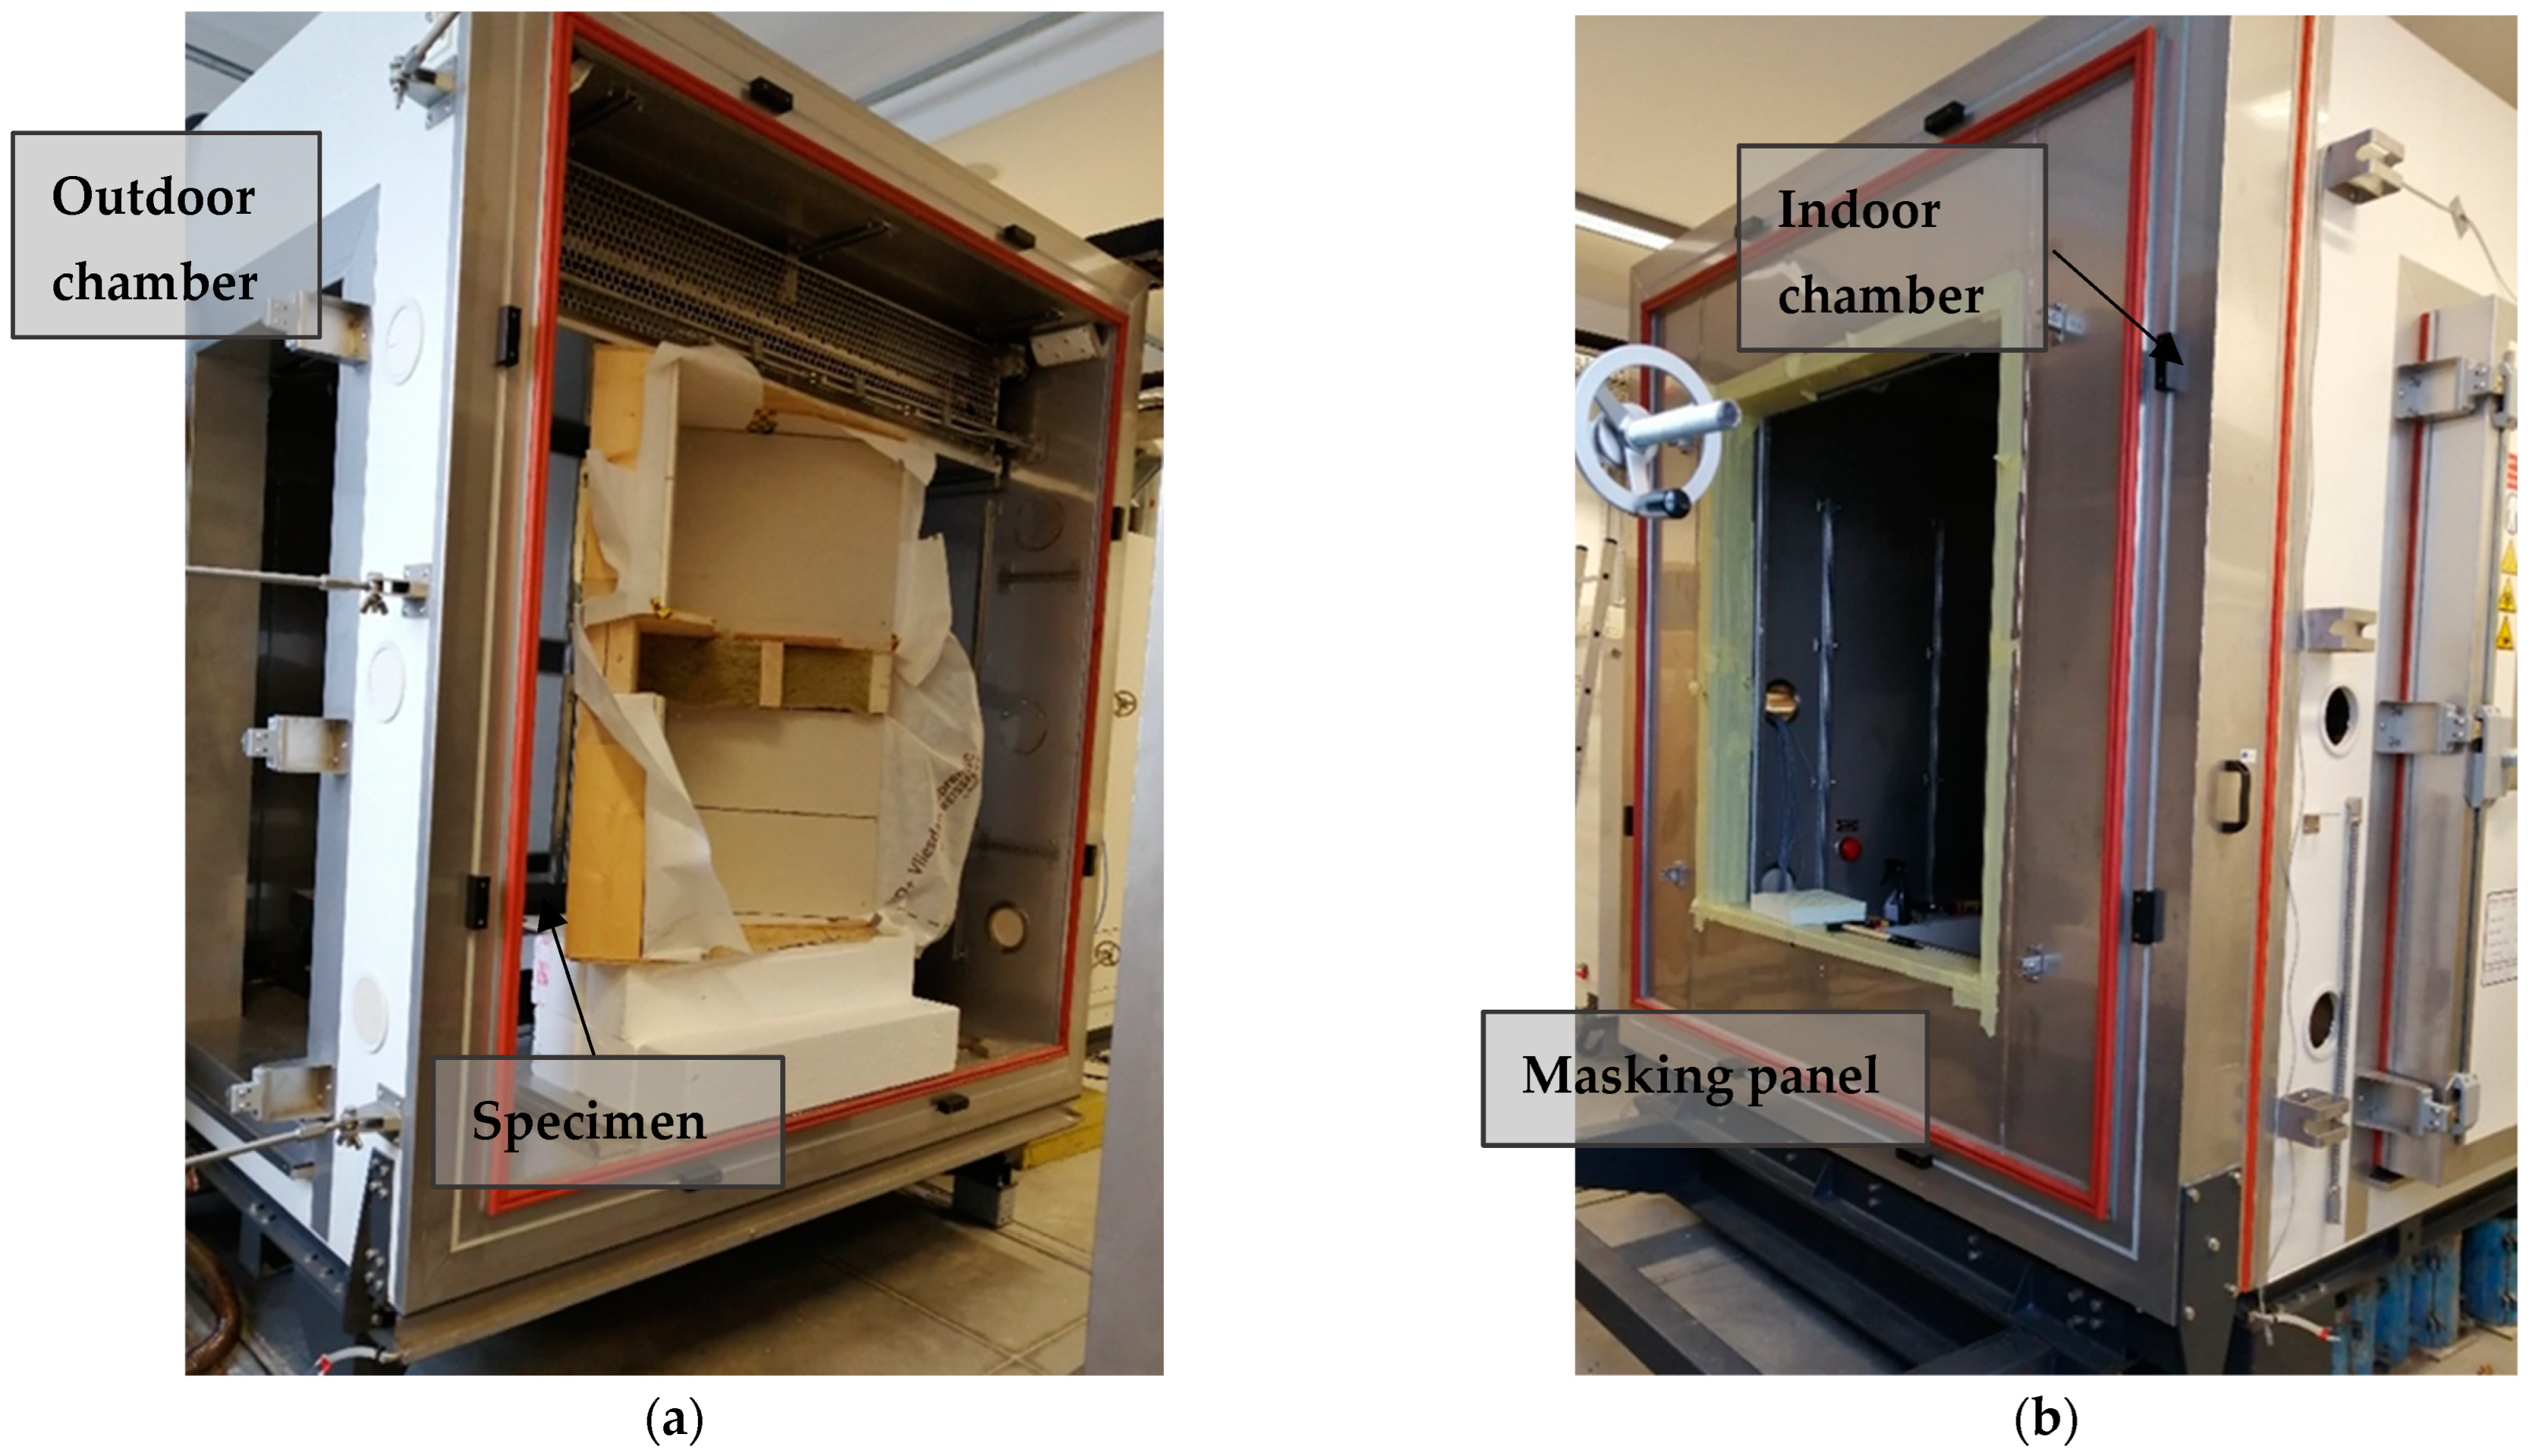
24]. The equipment consisted of a set of climatic chambers (
Figure 1), an evaluated fragment, and a specially designed steel cover (
Figure 2).
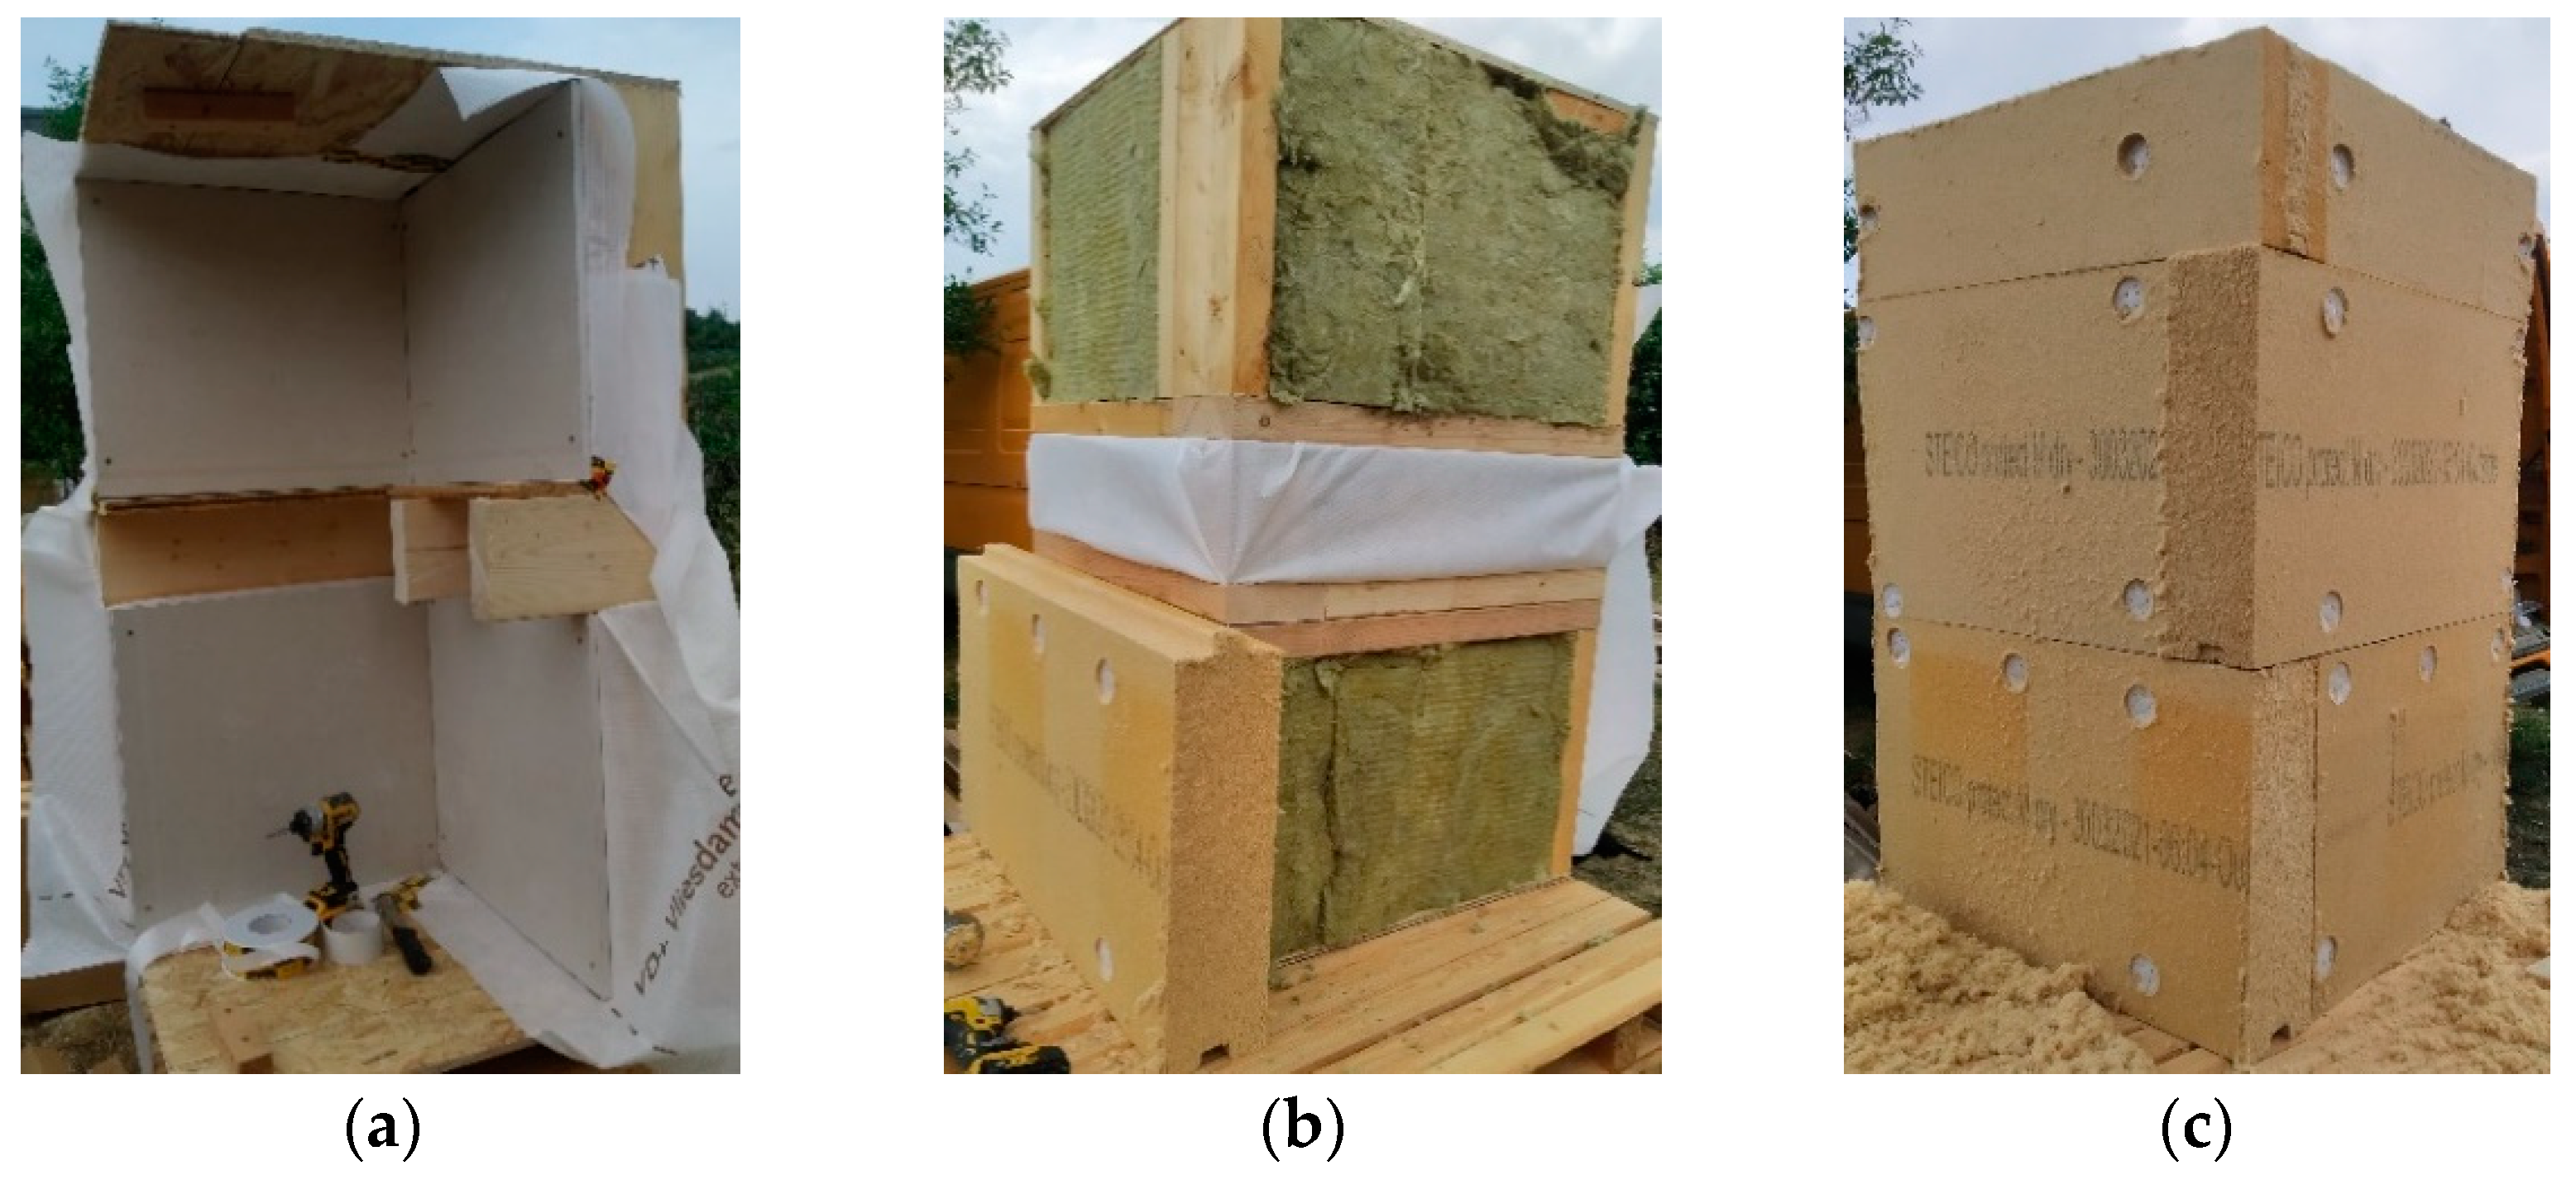
The set contains a hermetic climatic chamber to simulate the exterior conditions (
Figure 1a). It enables us to adapt temperature and humidity and to create an overpressure [
30], reaching a maximum of 500 Pa. The supply air quantity is regulated automatically based on barometer measurements. However, the outputs from the chamber do not contain data on the amount of air entering the chamber, so it is not part of the documentation. The second part of the set is a climatic chamber for simulations of stable interior conditions (
Figure 1b). The last part of the assembly is a masking panel connecting both chambers, made of 120 mm thick prefabricated sandwich wall elements with a cut-out for the specimen 1480 × 1230 mm.
The specimen (
Figure 3) is bound to be within the masking panel. However, in our case, the sample was three-dimensional, requiring a unique approach. It was placed within the outer chamber (
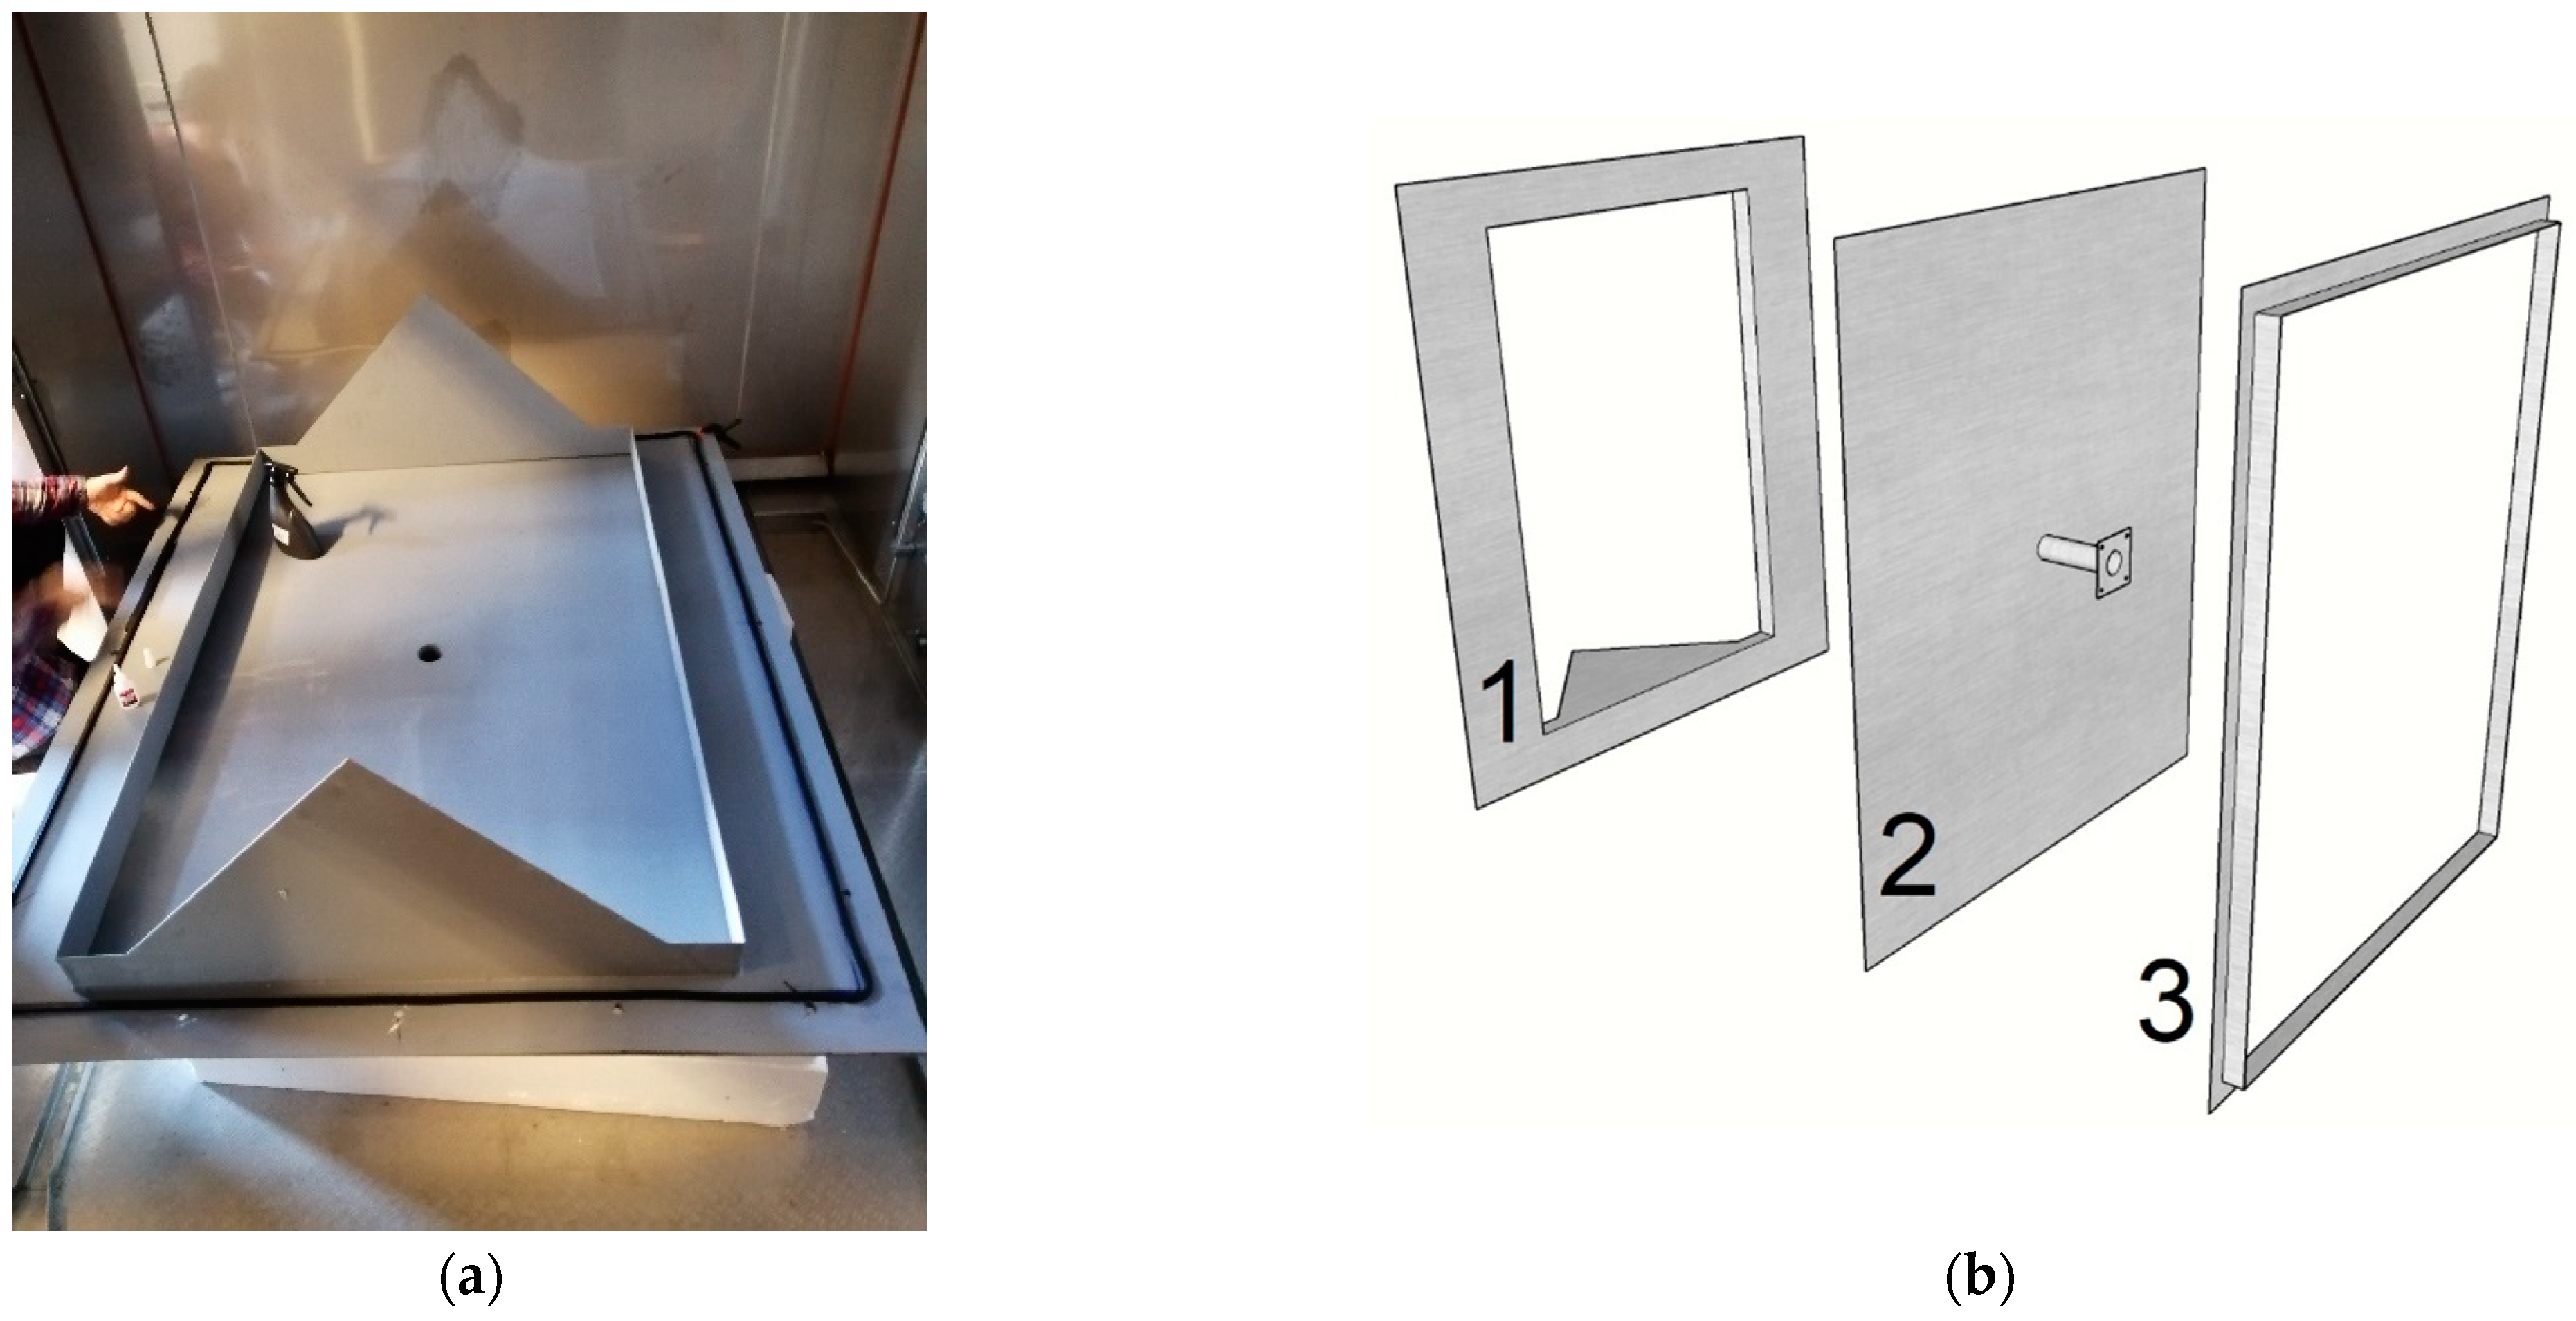
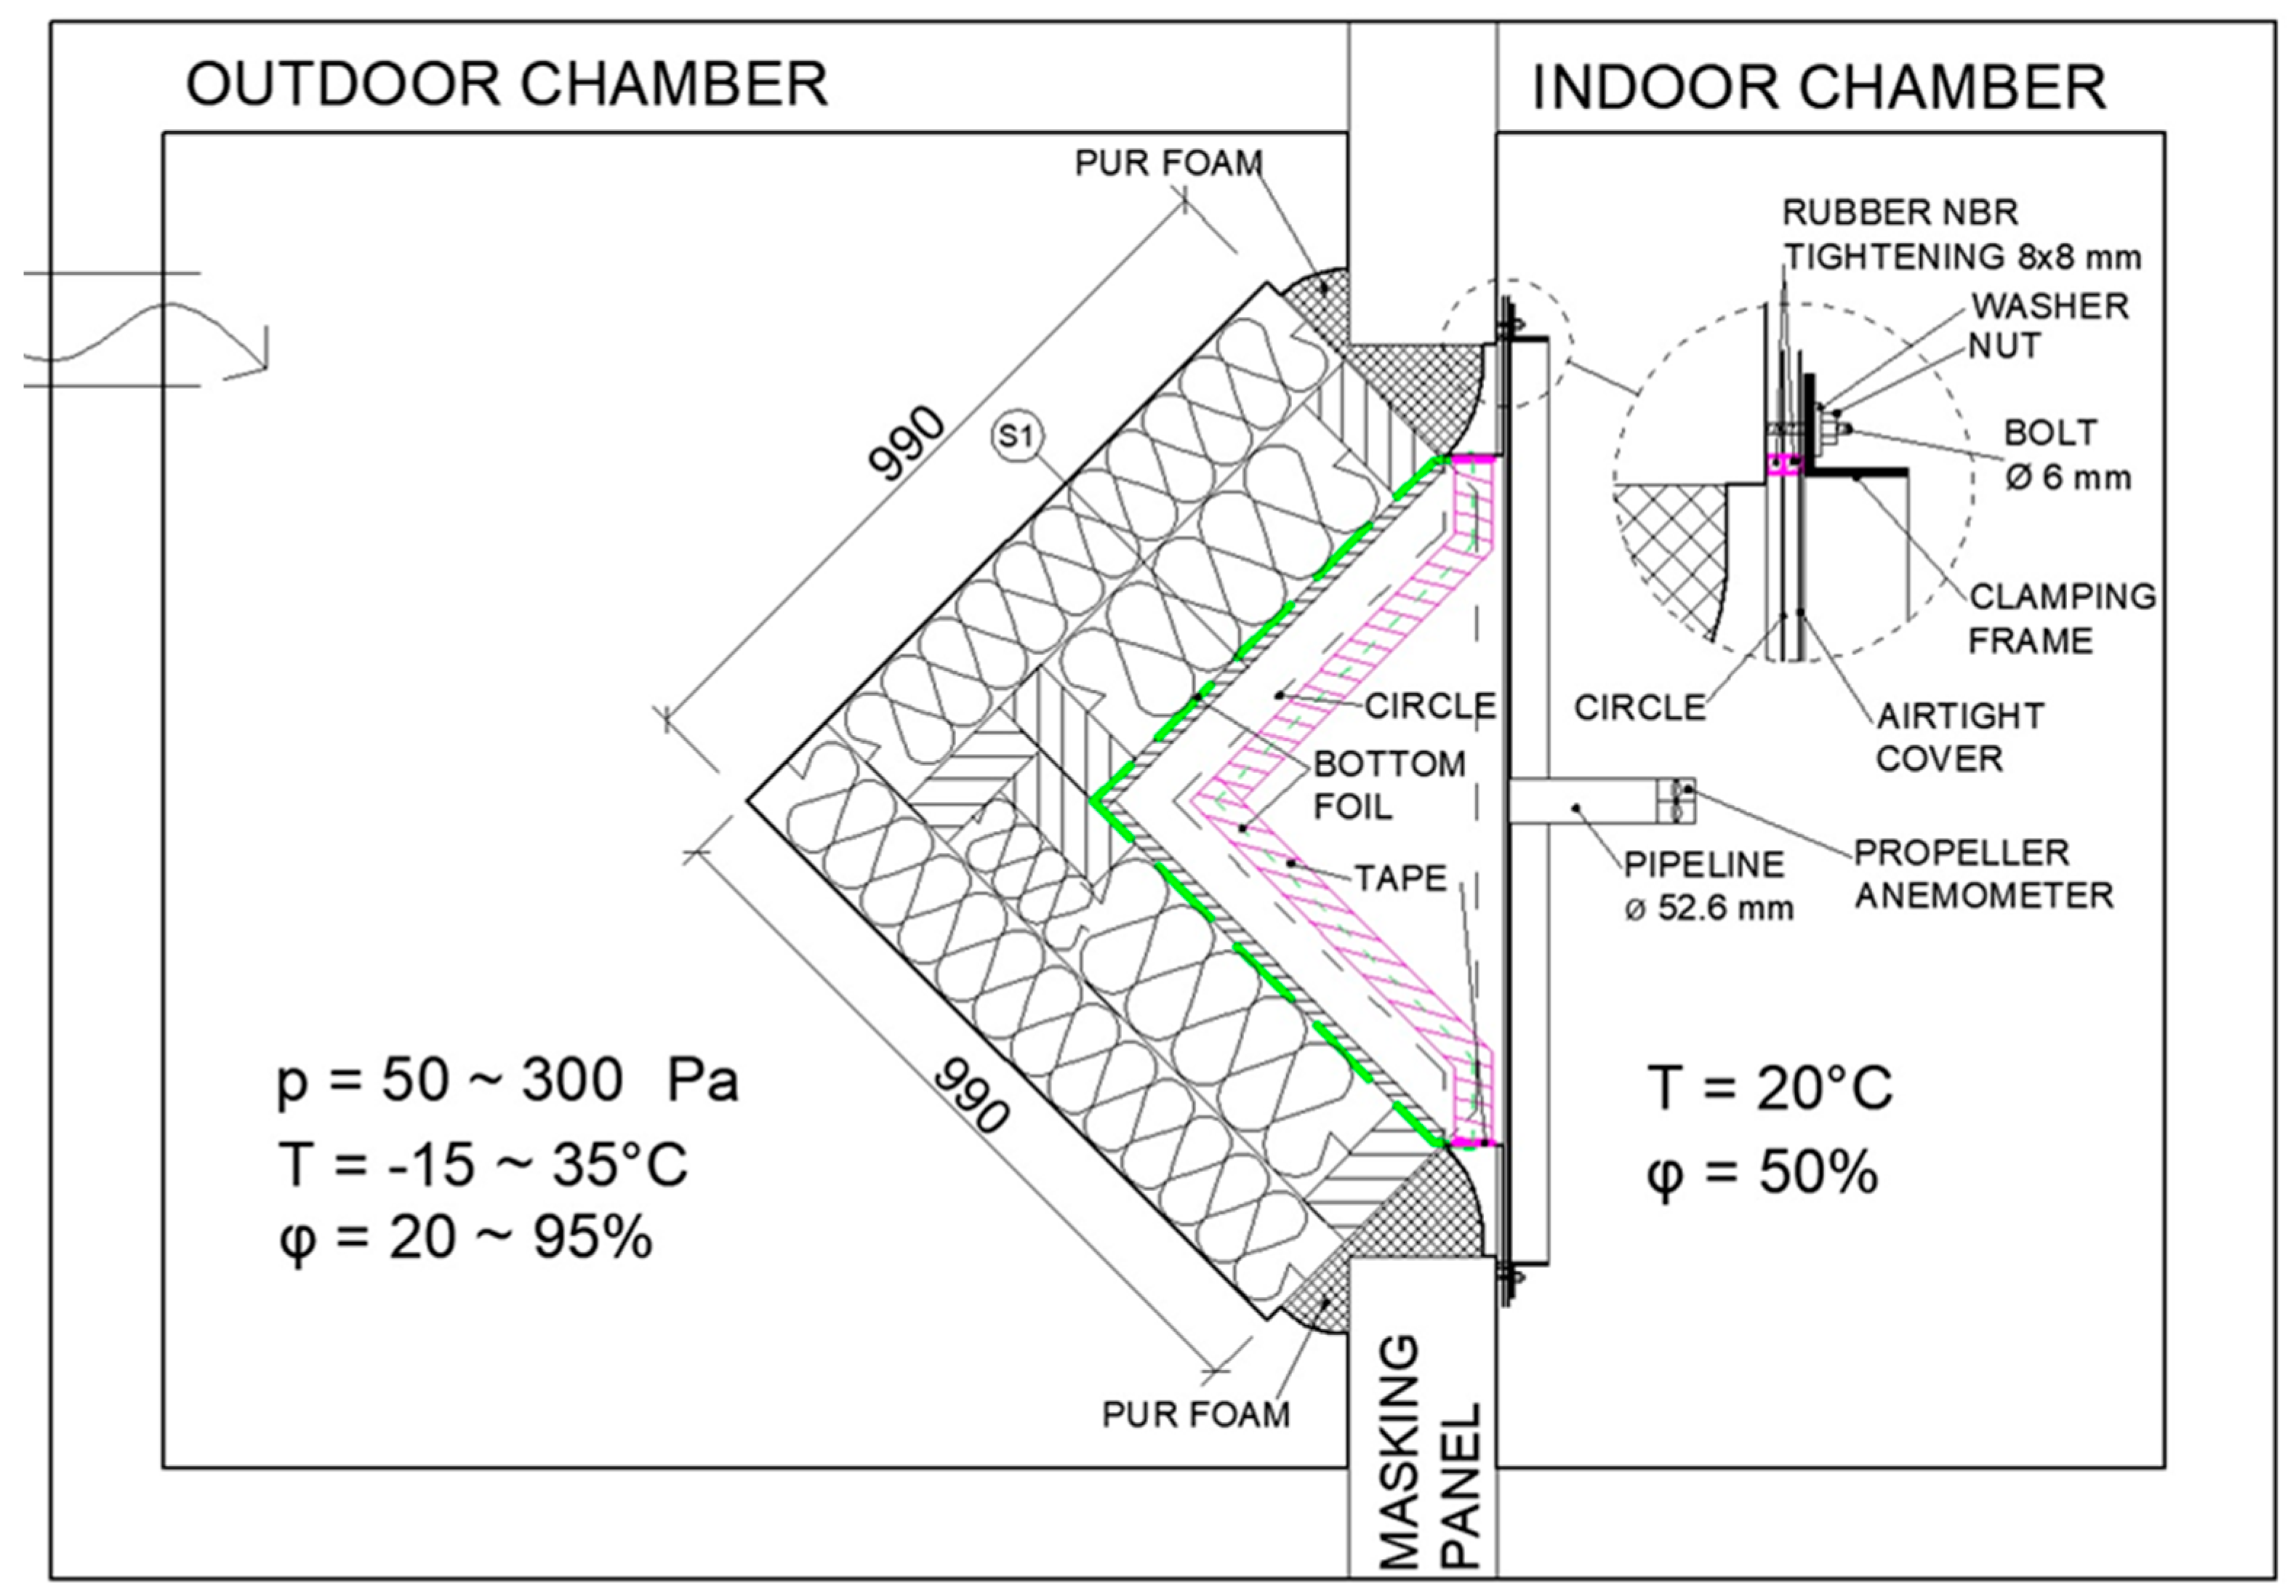
Figure 1a) and afterward thoroughly sealed to the panel. To enable the airflow measurements, we deliberately designed a steel cover (
Figure 2), placed from the interior side, and connected to the masking panel by a double rubber seal of an 8 × 8 mm profile. The triangular shape was necessary due to the three-dimensional layout of the corner construction.
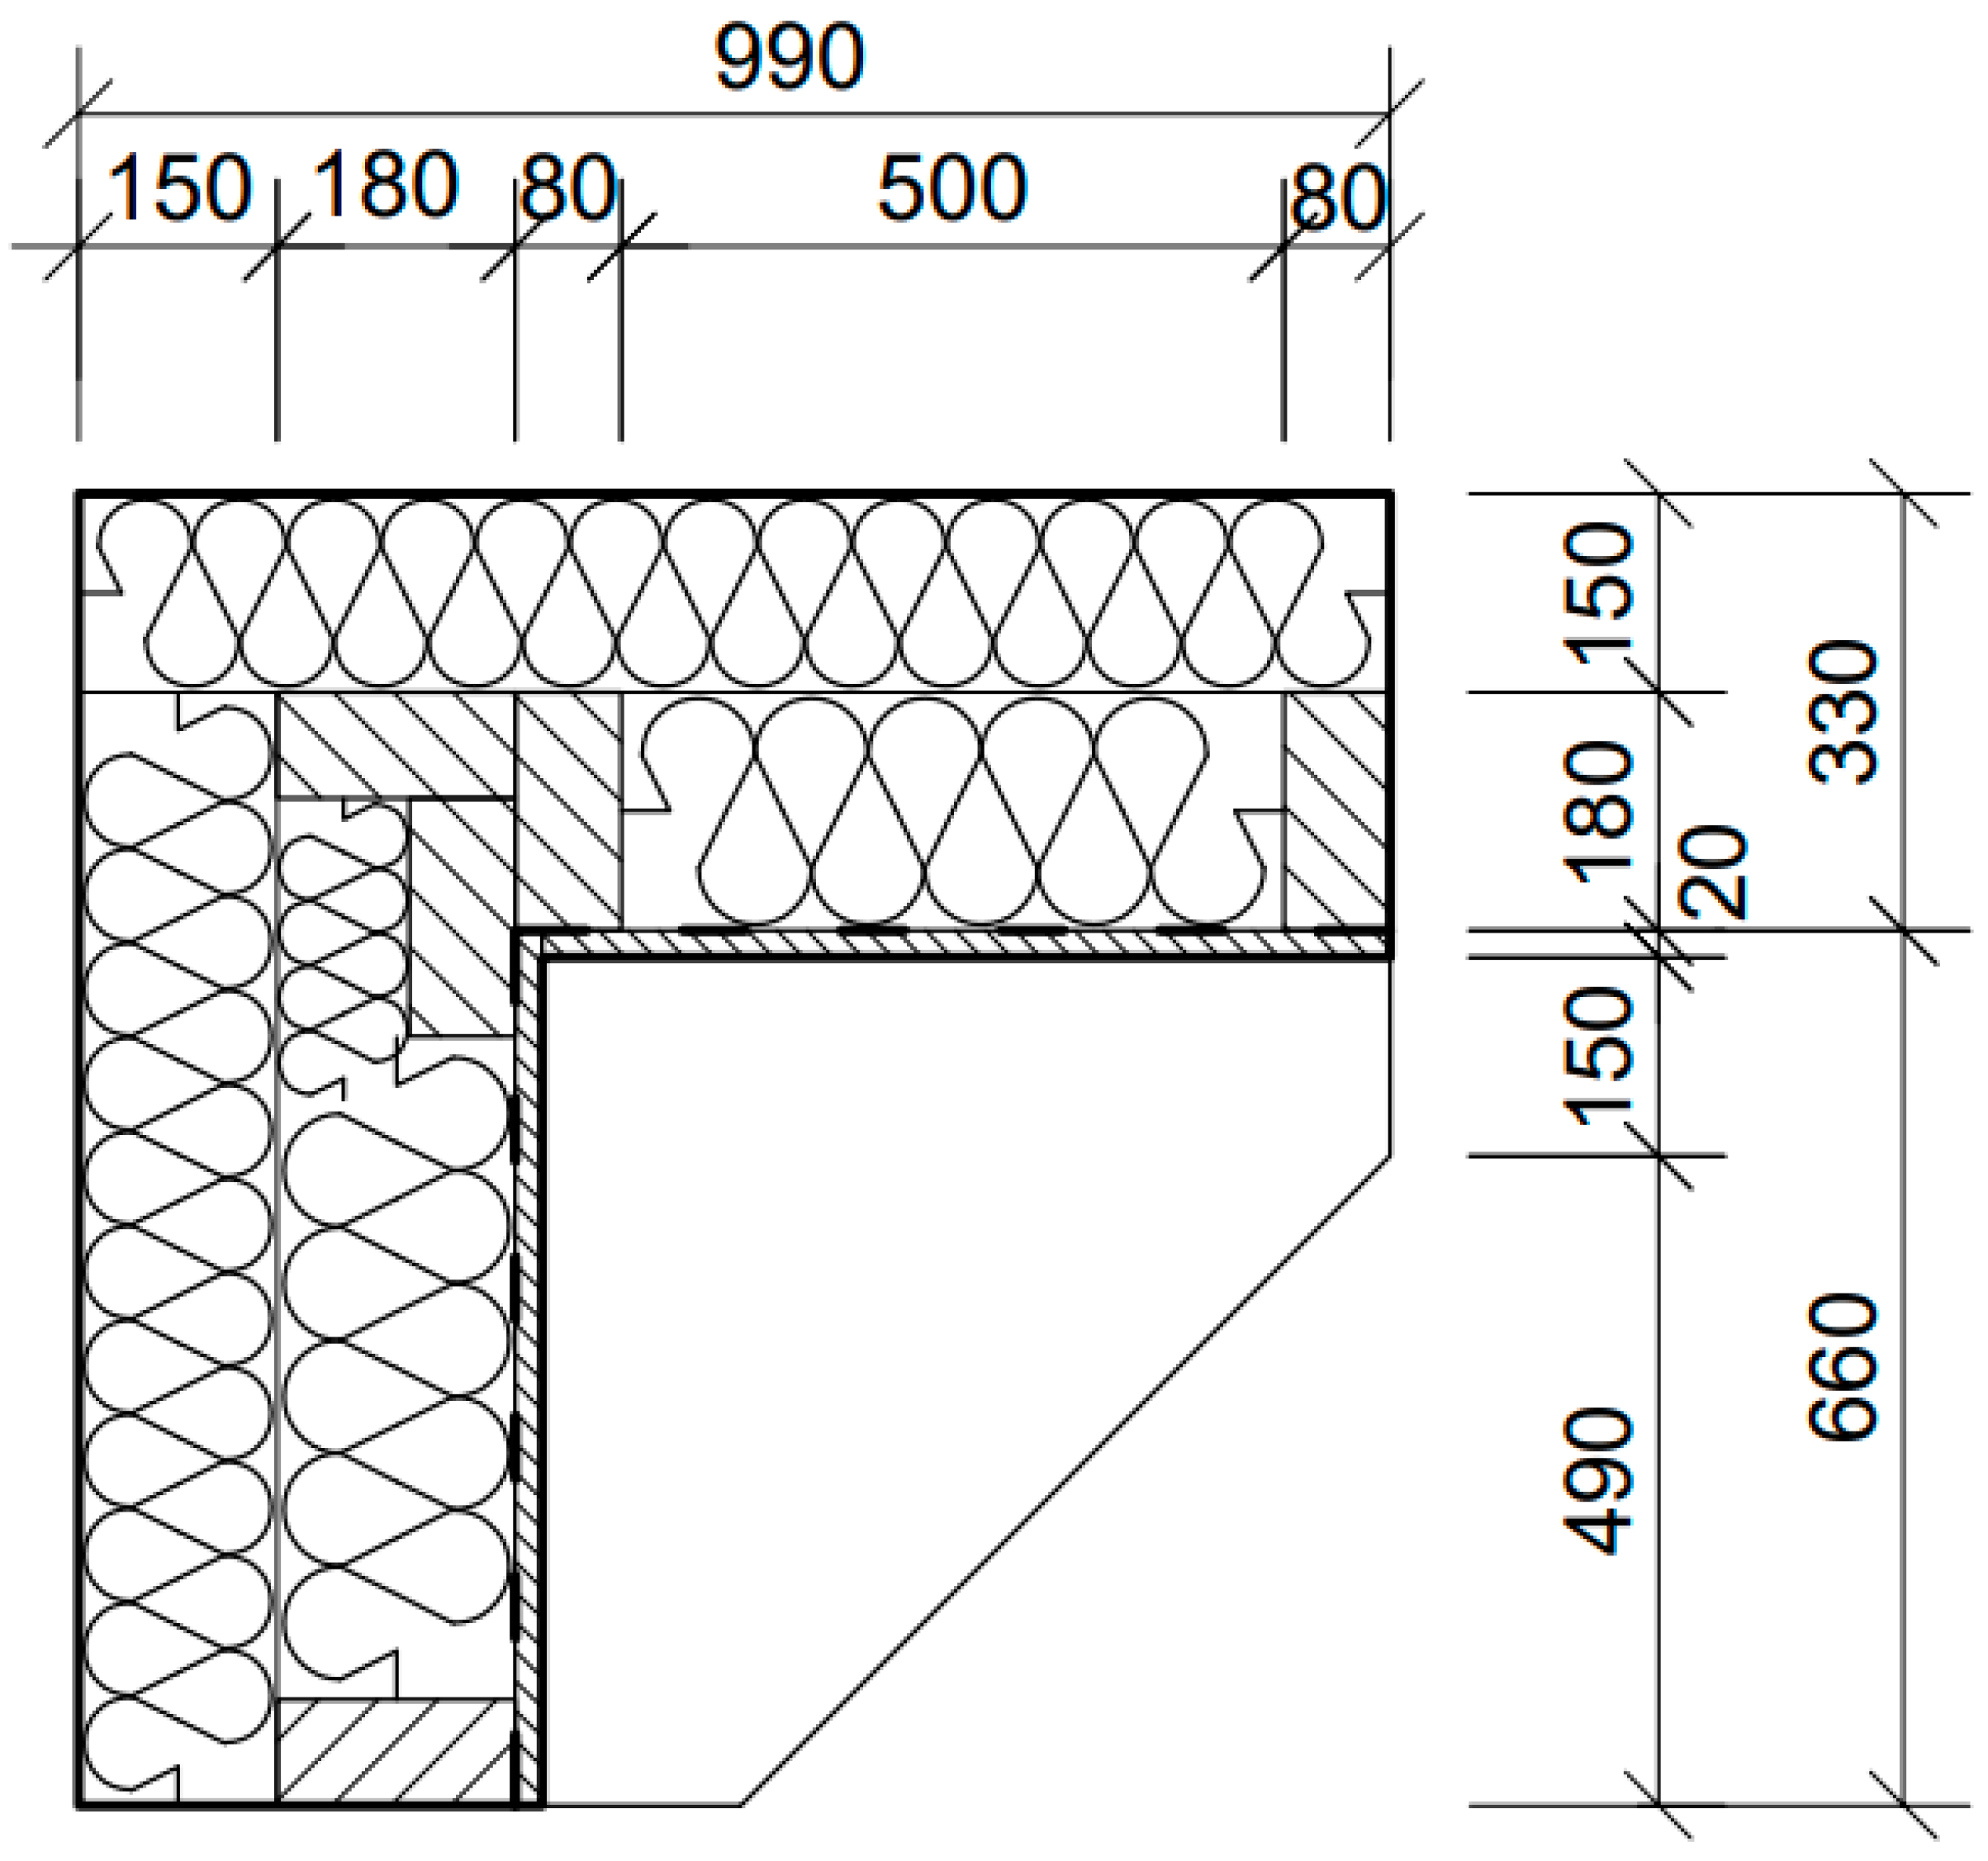
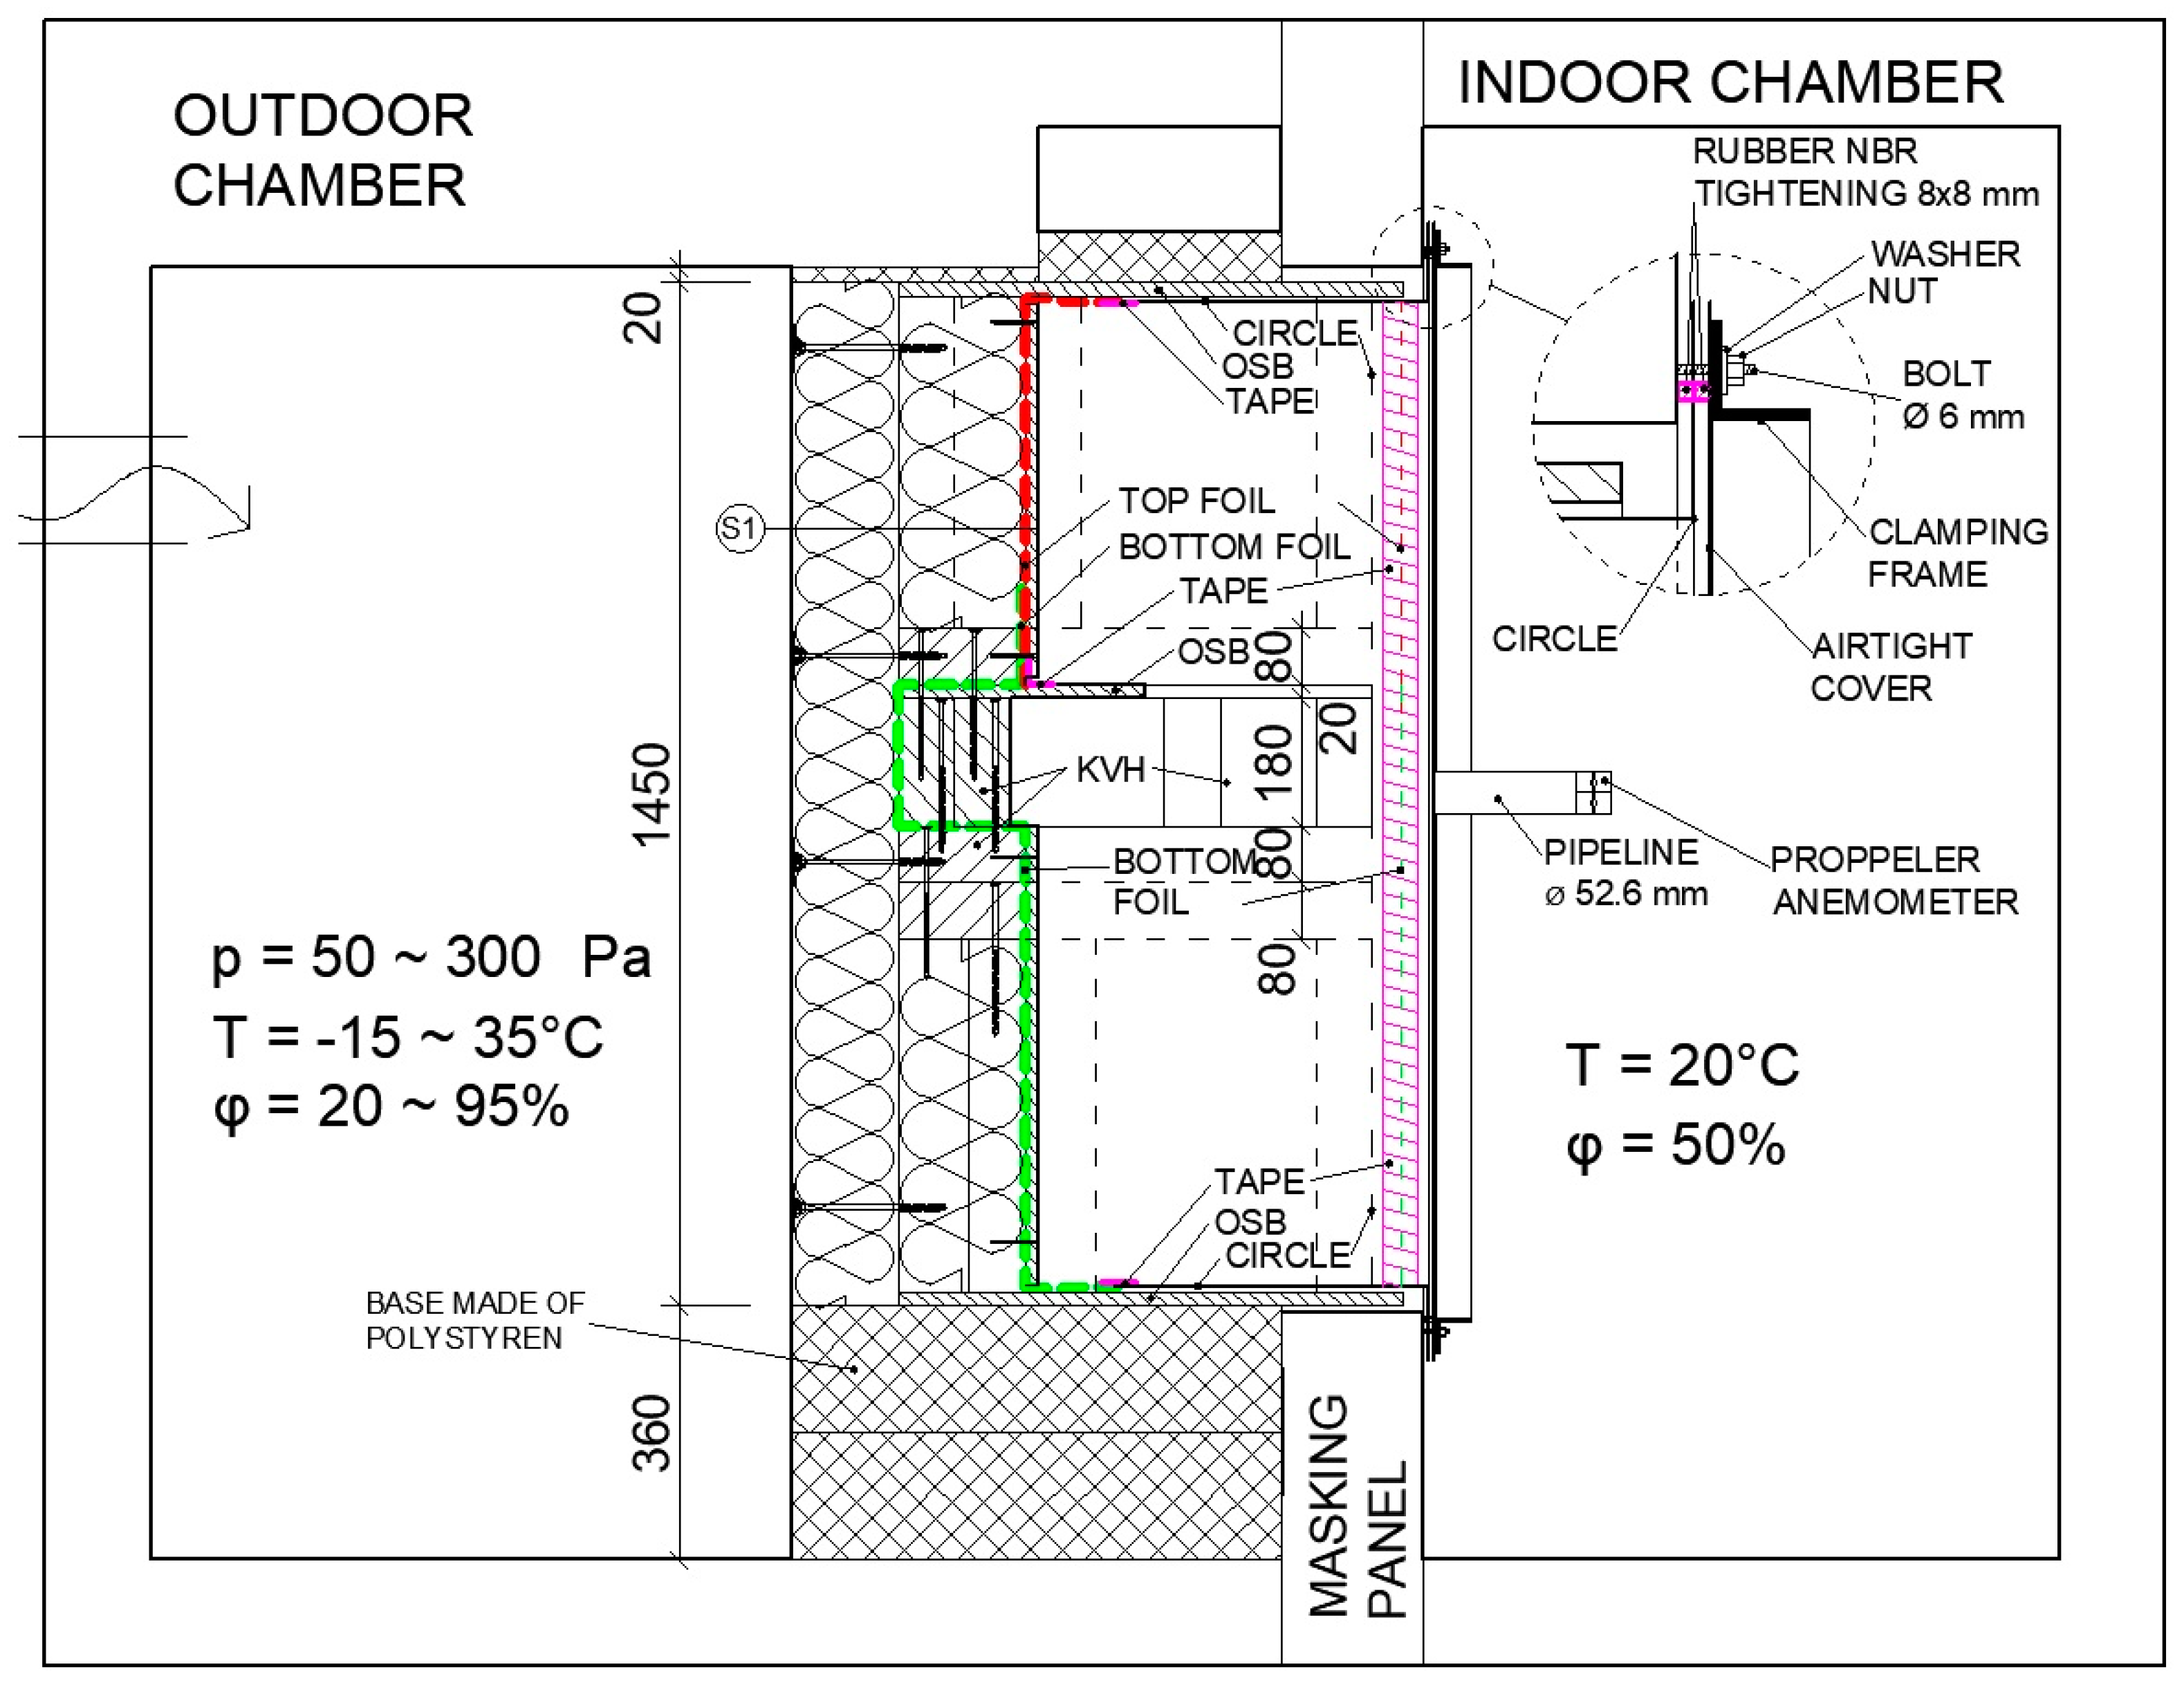
Figure 4 and
Figure 5 depict vertical and horizontal cross sections after installation to the climatic chambers.
The air leakage measurements in this study were conducted at a positive pressure difference and automatically recorded, including the airflow.
The miniature multi-sensor model with K (NICR-Ni) thermocouples measured the air temperature and temperature within the construction in the climatic chambers. They can conclude measurements within the range of +5 to +60 °C, with an accuracy of ±0.2 K. They can also measure the relative air humidity in the range of 10 to 90%, with an accuracy of 1.8% RH.
The process for airtightness measurements was identical to the one used for the blower-door test. The chambers are hermetically closed and connected to a vapor-barrier foil while forming an airtight layer within the fragment. The cover consists of three parts (
Figure 2b)—the sealing part to connect the airtight layer (1), the middle part for hermetical sealing of the measured area (2), and a pressure frame to provide a constant tightness across the perimeter (3). The cover dimensions are slightly larger than the opening in the masking panel to properly anchor and seal the structures dividing the two climatic environments.
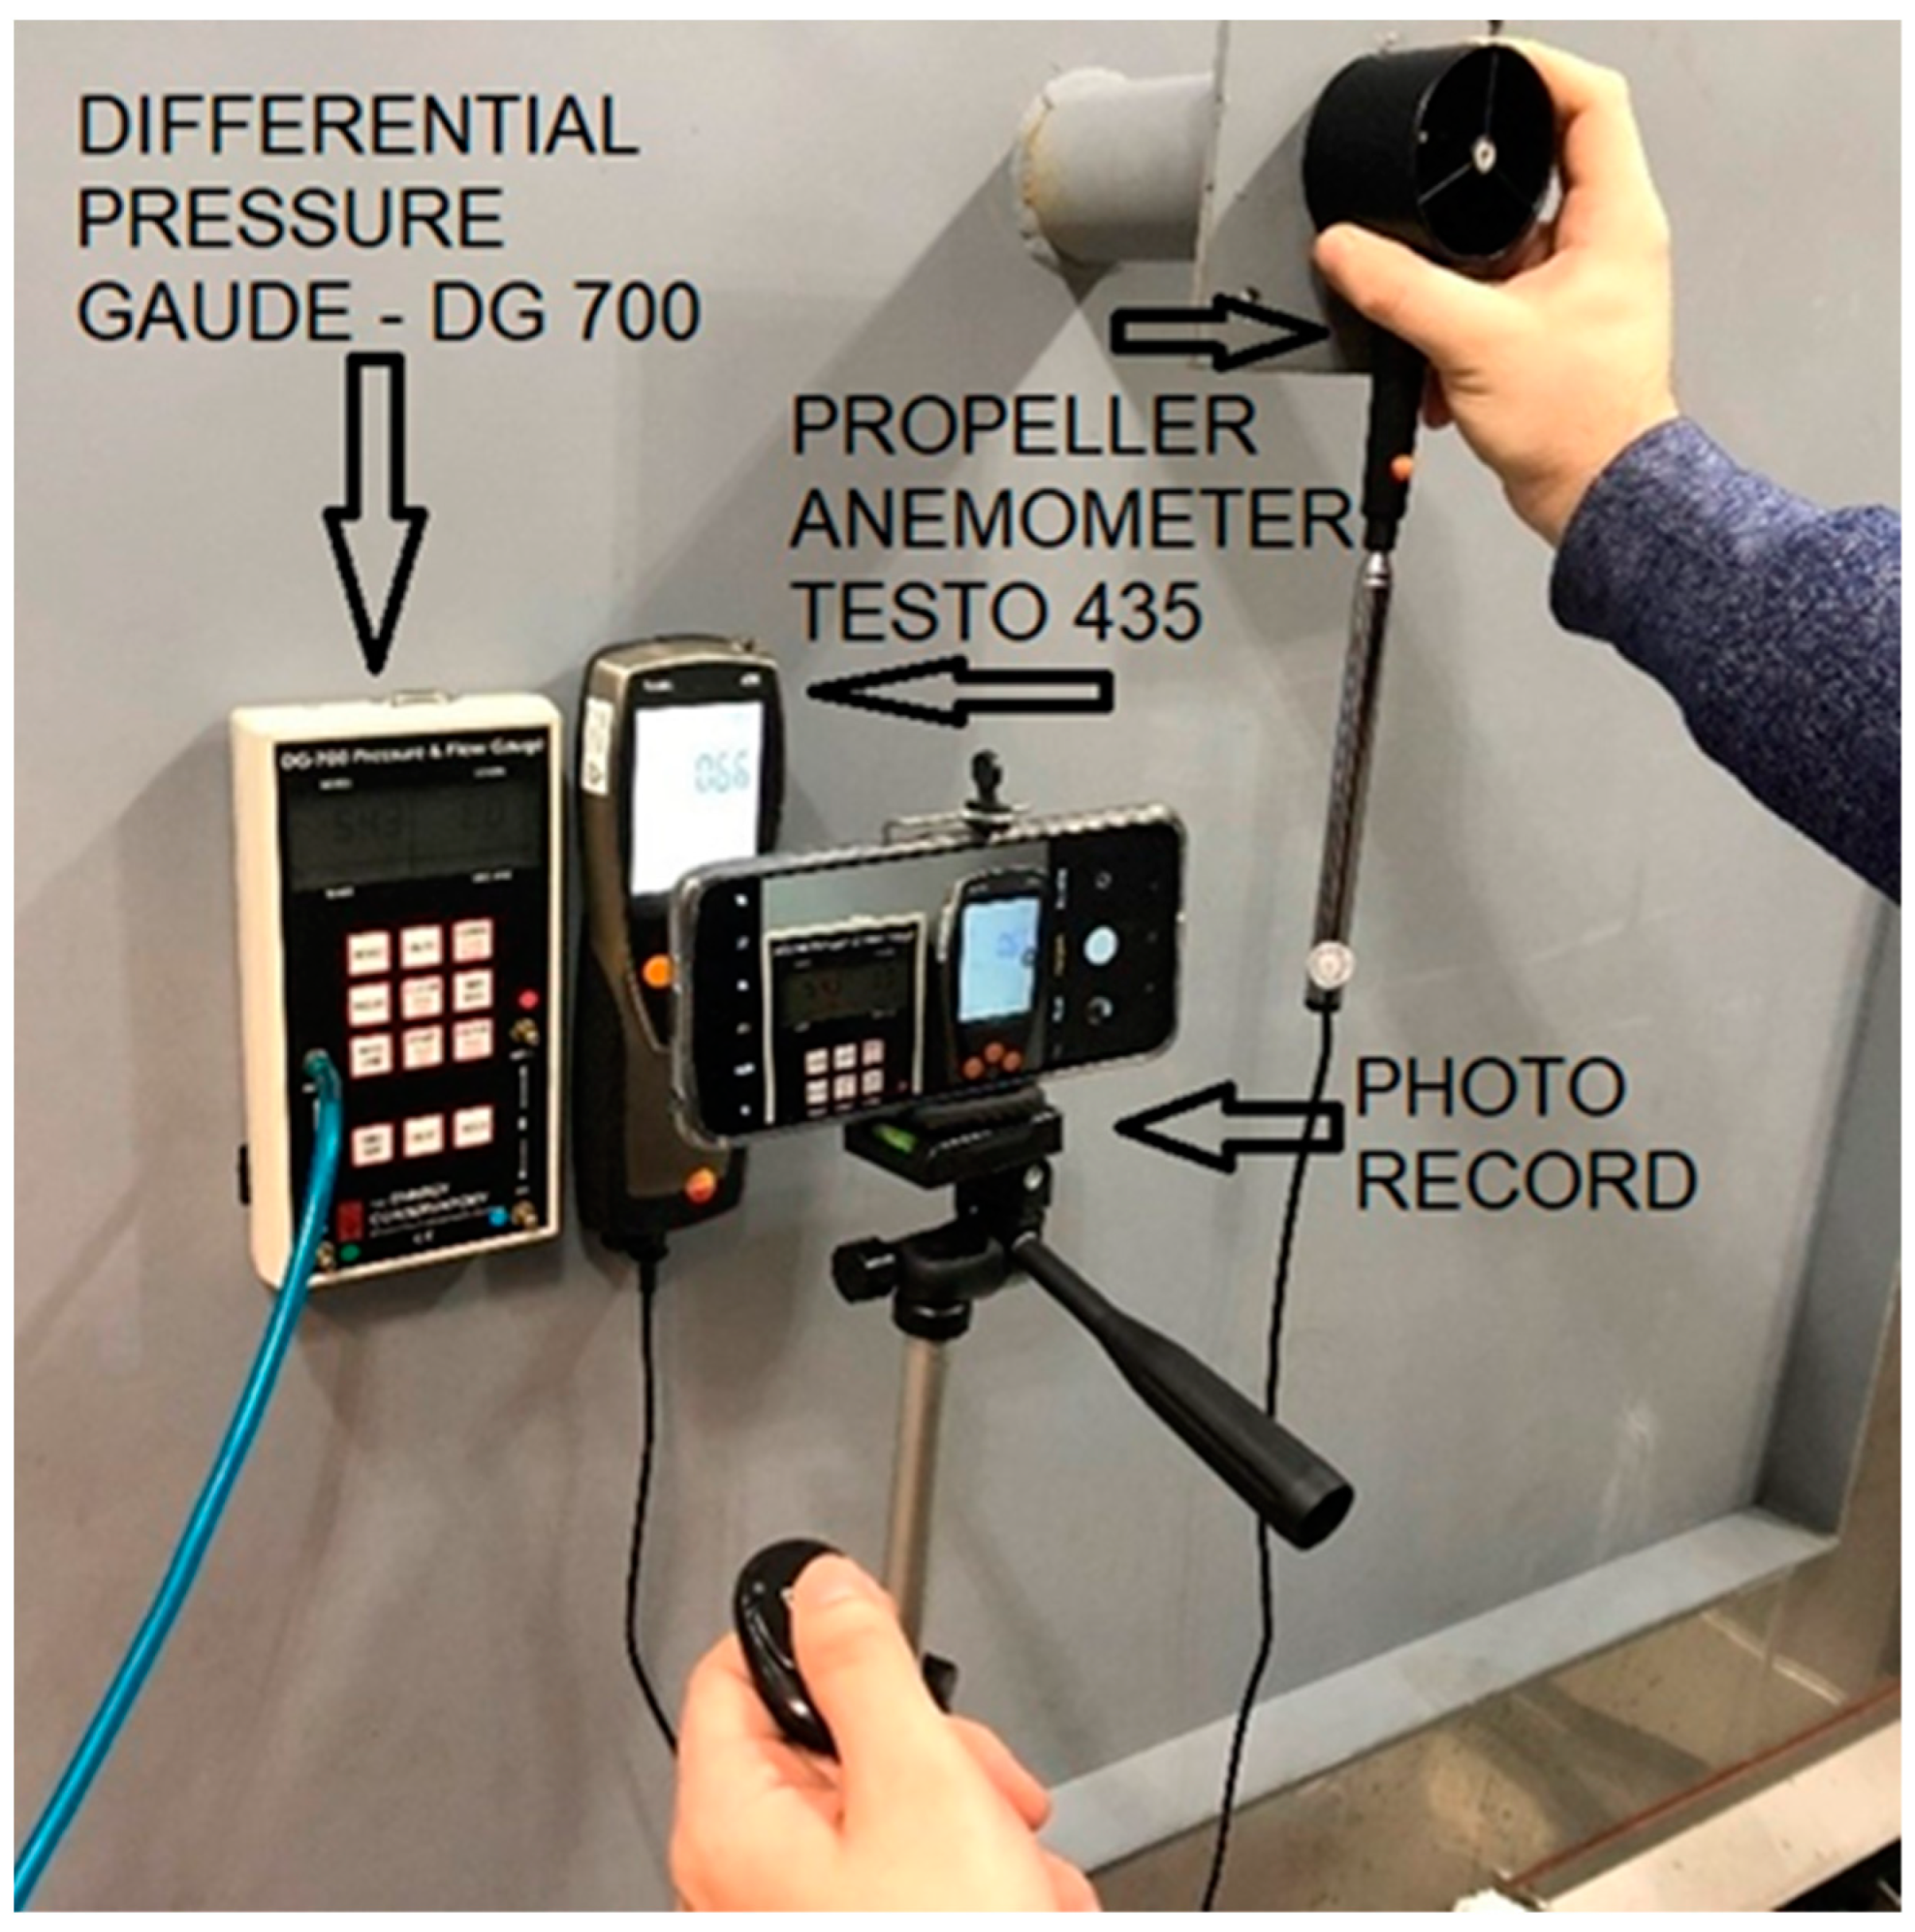
The air penetrating the fragment gets through a tube of 52.6 mm diameter, which is a part of the cover assembly. To measure the airflow and velocity, we used a vane anemometer Testo 435 with a 60 mm broad probe head, measuring in the range of 0.2 to 20 m/s with an accuracy of ±1.5% (
Figure 6).
A record of air pressure in the outdoor chamber is a part of the output regarding the air velocity flowing through the tube. The air pressure difference was measured with a multifunctional differential barometer with two independent pressure sensors DG-700, a part of Minneapolis Blower Door model 4.1 set with varying resolution—0.1 Pa resolution in the range from 0 to 200 Pa, 1 Pa in the range from 200 to 1250 Pa (
Figure 6).
Due to the known tube diameter, we can calculate the airflow rate through the tube at each moment, thus creating data regarding the pressure in the outdoor chamber and the airflow rate through the fragment. Therefore, one reading would contain information about the airflow velocity and the pressure in the outdoor chamber. The readings are in several intervals of 25 Pa from 0 to 300 Pa while obtaining multiple entries (approximately 20) to increase the validity.
2.2. Studied Specimen
The masking panel serves for specimen placement and helps to segregate two different climatic conditions with varying temperatures, relative humidity, and air pressure. According to the previously mentioned studies, the most common location of air leakage in timber frame structures is on the interface of the wall and the ceiling in the corner of the building. Using the analogy of a thermal bridge, it acts as a three-dimensional diffuse bridge on a 1:1 scale. The chosen construction system for the connection of the perimeter walls and the ceiling structure is the most commonly used solution for timber buildings, which corresponds to the TBF (two-by-four) system. This system is known for its simplicity but also for its variability. It has a solid base but a large number of variations. TBFs originated in the second half of the 19th century in the USA and are still the most widely used system in modern timber construction.
The process of the sample assembly is in
Figure 7. The load-bearing structure consists of KVH (konstruktionsvollholz) profiles 180 × 80 mm, containing vertical studs, horizontal joists, and a header for the following floor. The space between the vertical studs contains mineral fiber thermal insulation (TI) Knauf of 180 mm. The outside layer is wood-fiber boards STEICO Protect dry M of 150 mm. The vapor-barrier Vliesdampfbremse VD+ (Vinzenz Harrer GmbH) also carries the function of an airtight layer, with an equivalent diffusion thickness sD = 25 (−7; +15) m. The internal surface consists of gypsum plasterboards. The main characteristics of all integrated materials are summarized in
Table 1.
The masking panel connects directly to the thermal insulation of the sample by polyurethane foam. In order to fit the specimen into the masking panes, we had to place it on a pedestal of thermal insulation, also providing appropriate insulation against heat or cold from the outdoor chamber through the bottom part of the fragment. The upper part goes to the chamber’s top, except for an overhang supplemented with polystyrene, as presented in
Figure 4.
2.3. Installation of Sensors
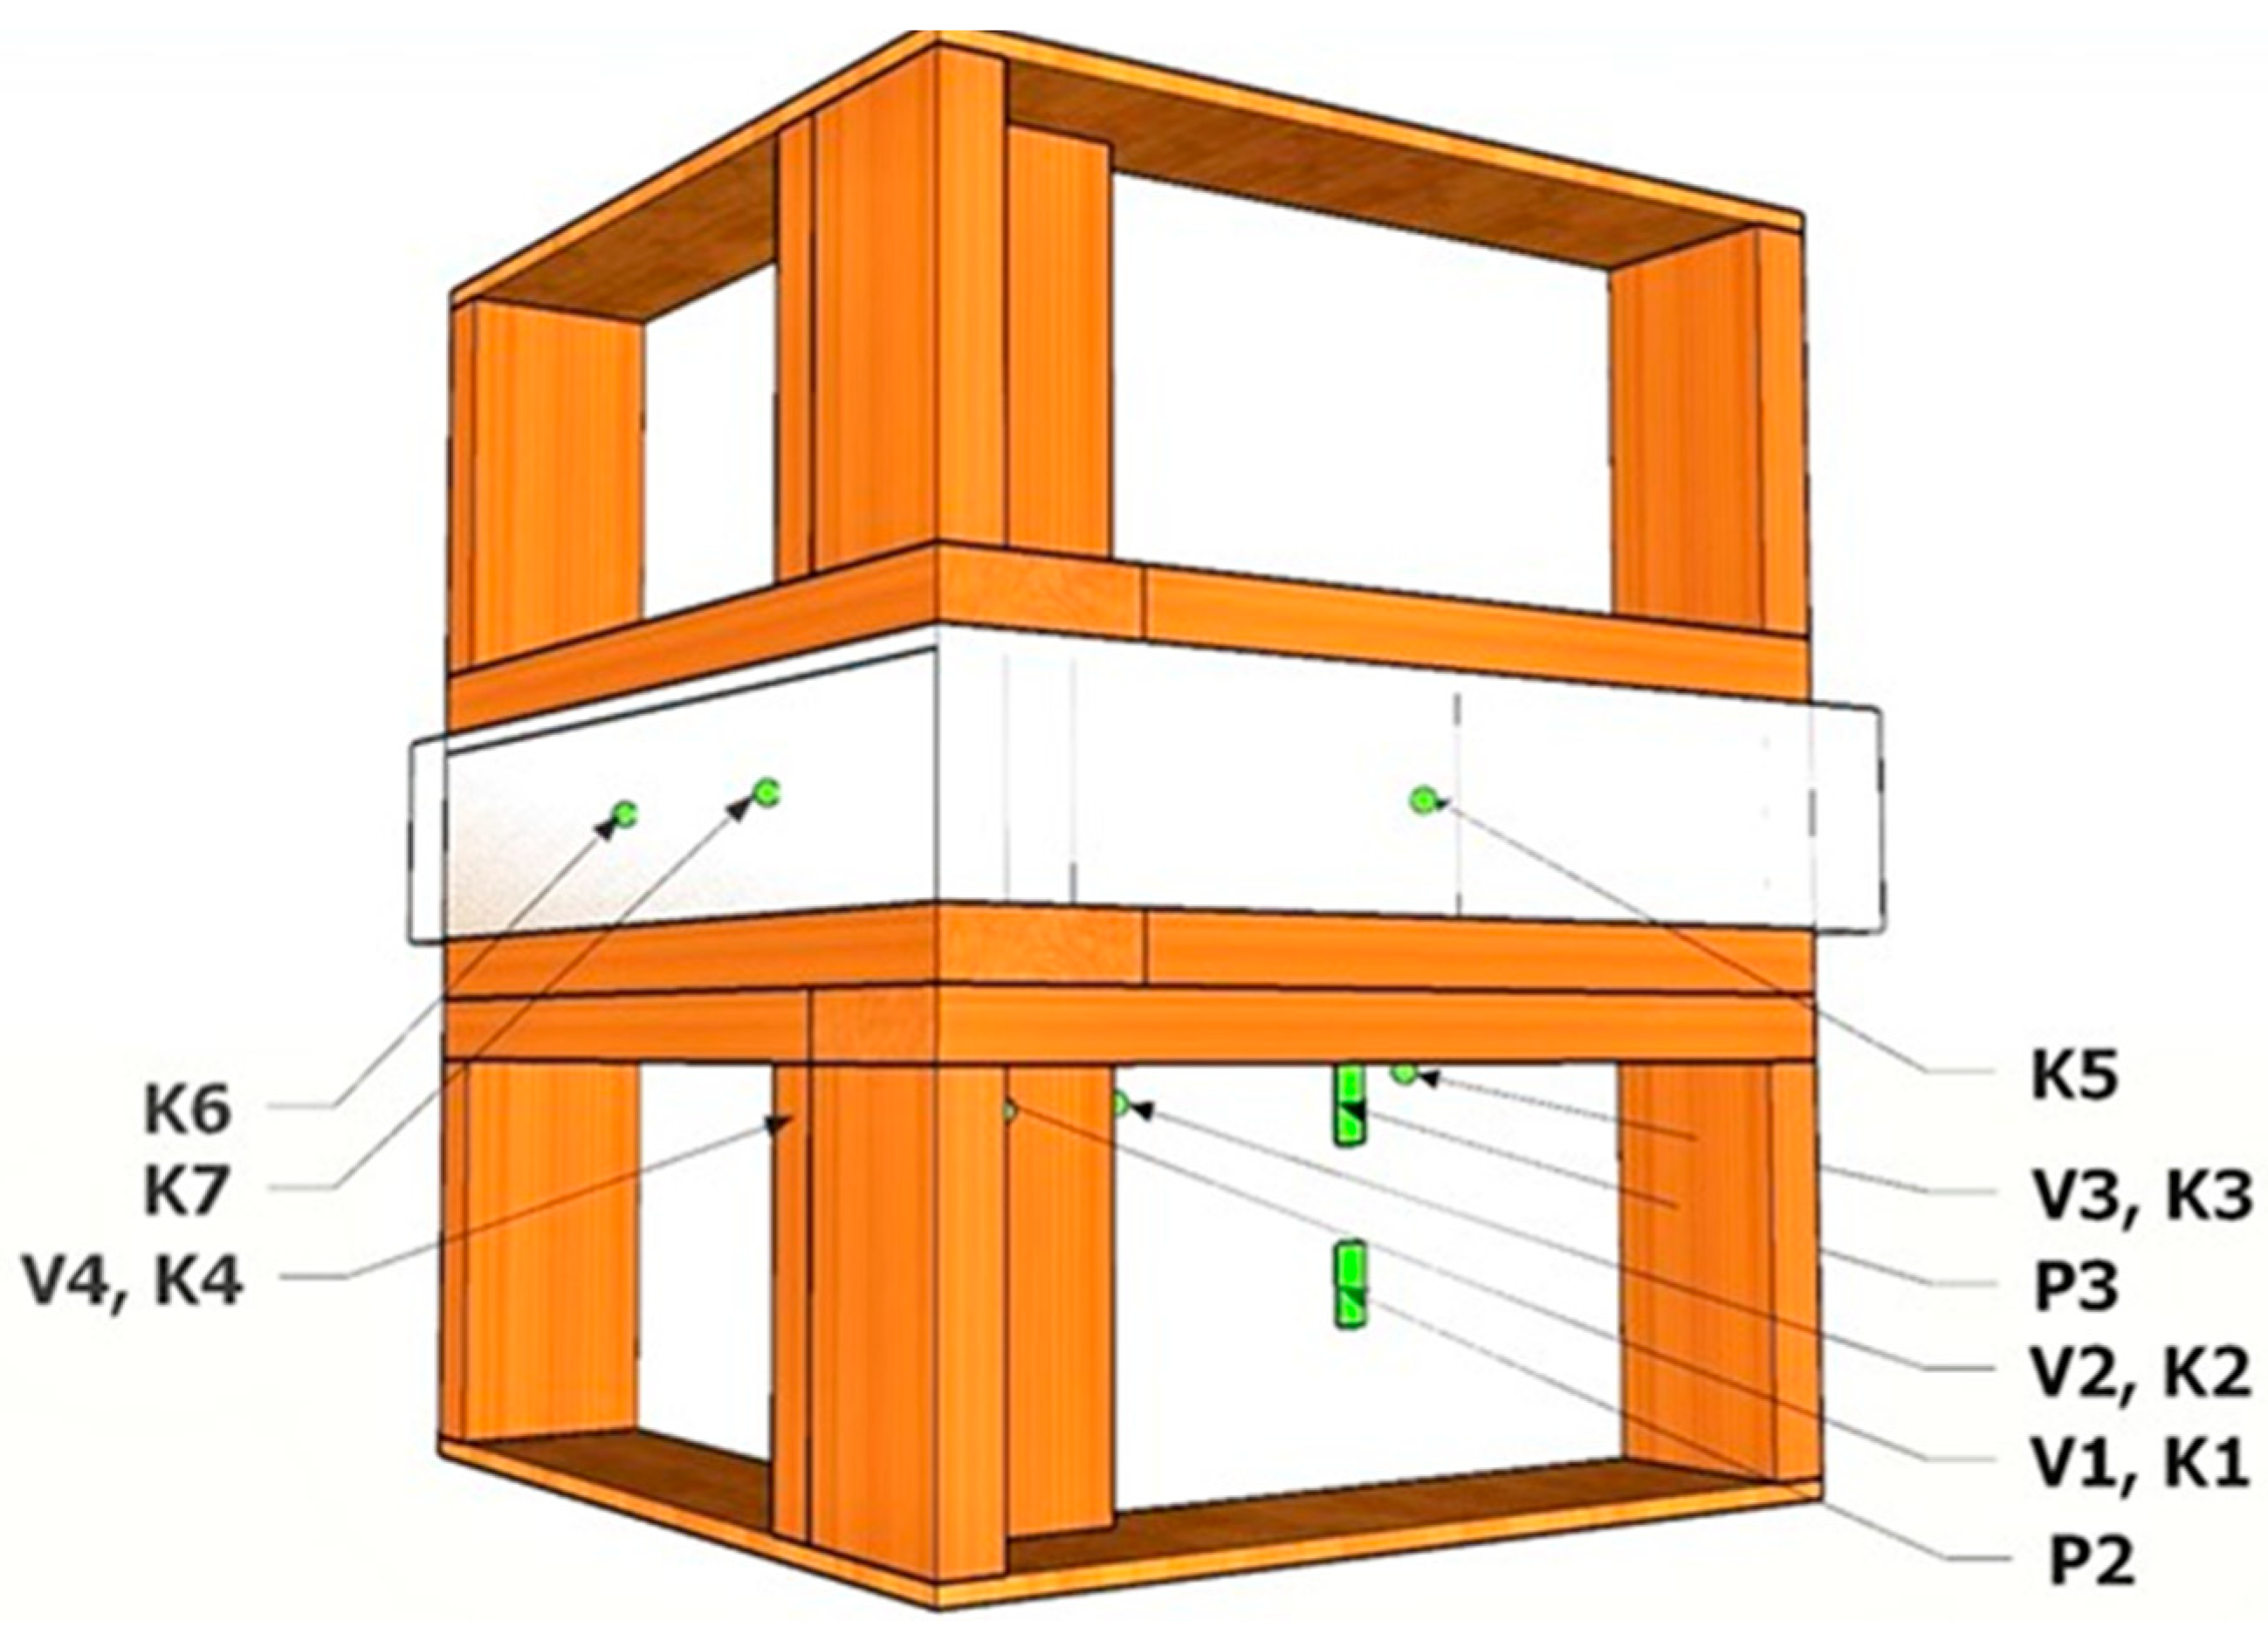
Within the sample were multiple sensors to record relative humidity and temperature (K1–K4), and the moisture of the KVH profiles (V1–V4), having a varying distance to the exterior and differing placement within the specimen (
Figure 8). Additional sensors were on the vapor barrier to measure the parameters at the ceiling structure (K5–K7). Sensors for temperature and heat flow were also taped to the vapor barrier in the bottom part (P2 and P3). Afterward, we placed the thermal insulation and façade insulation board, finishing the exterior surface with an adhesive render.
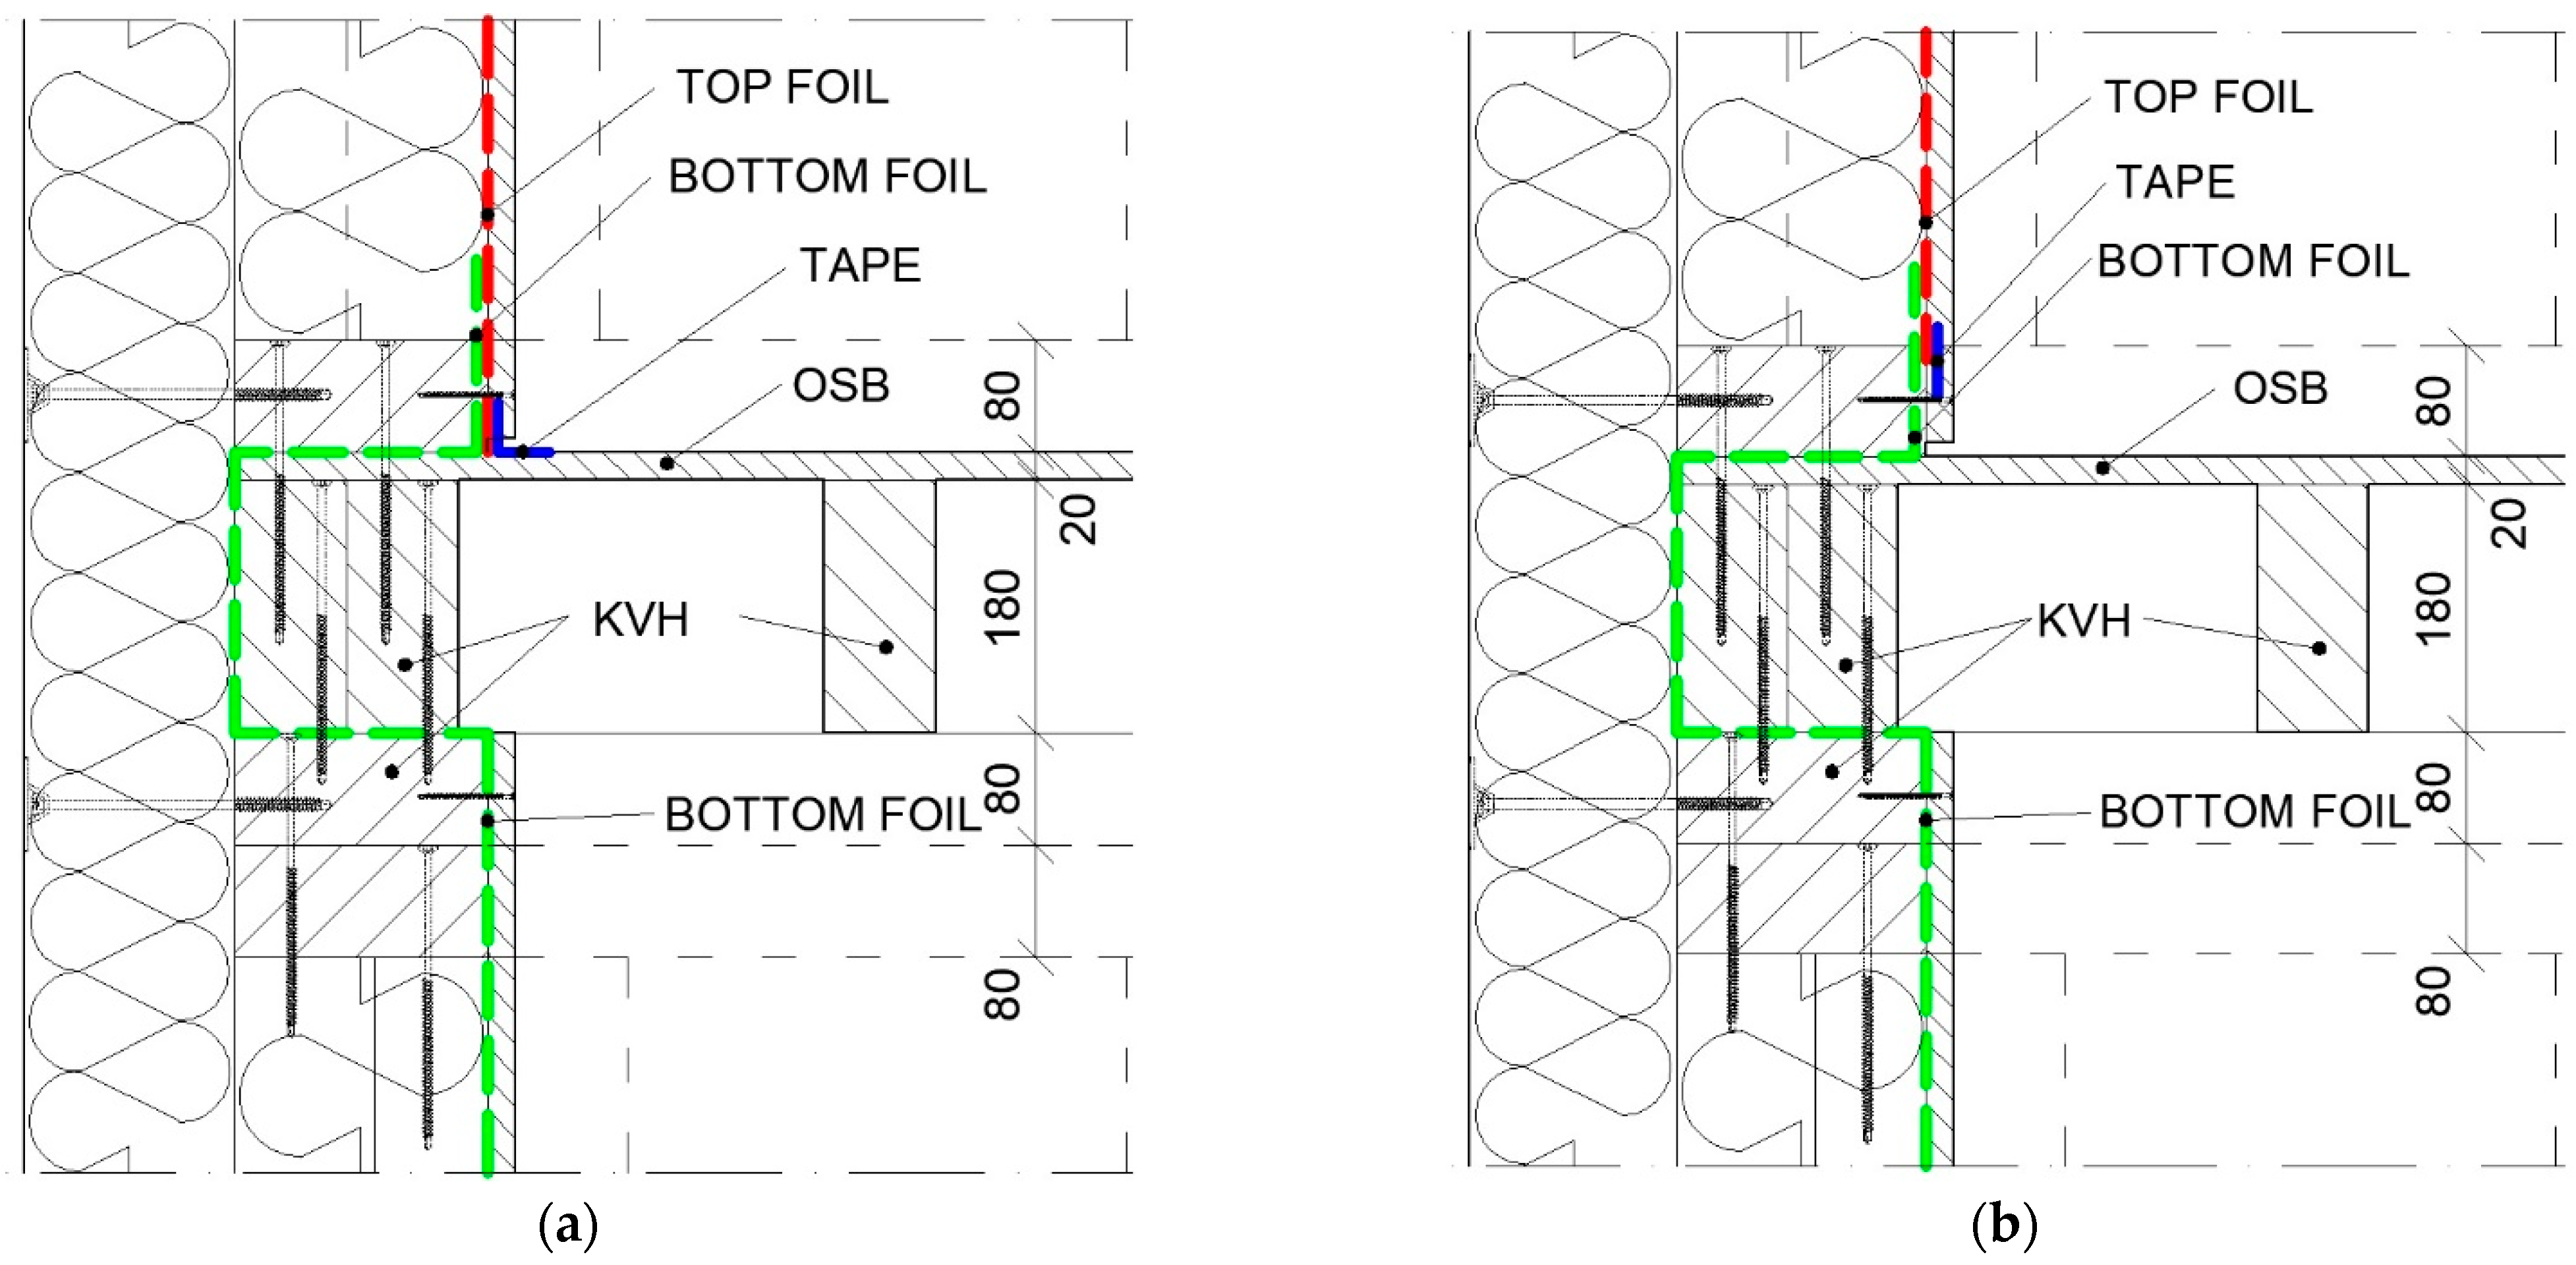
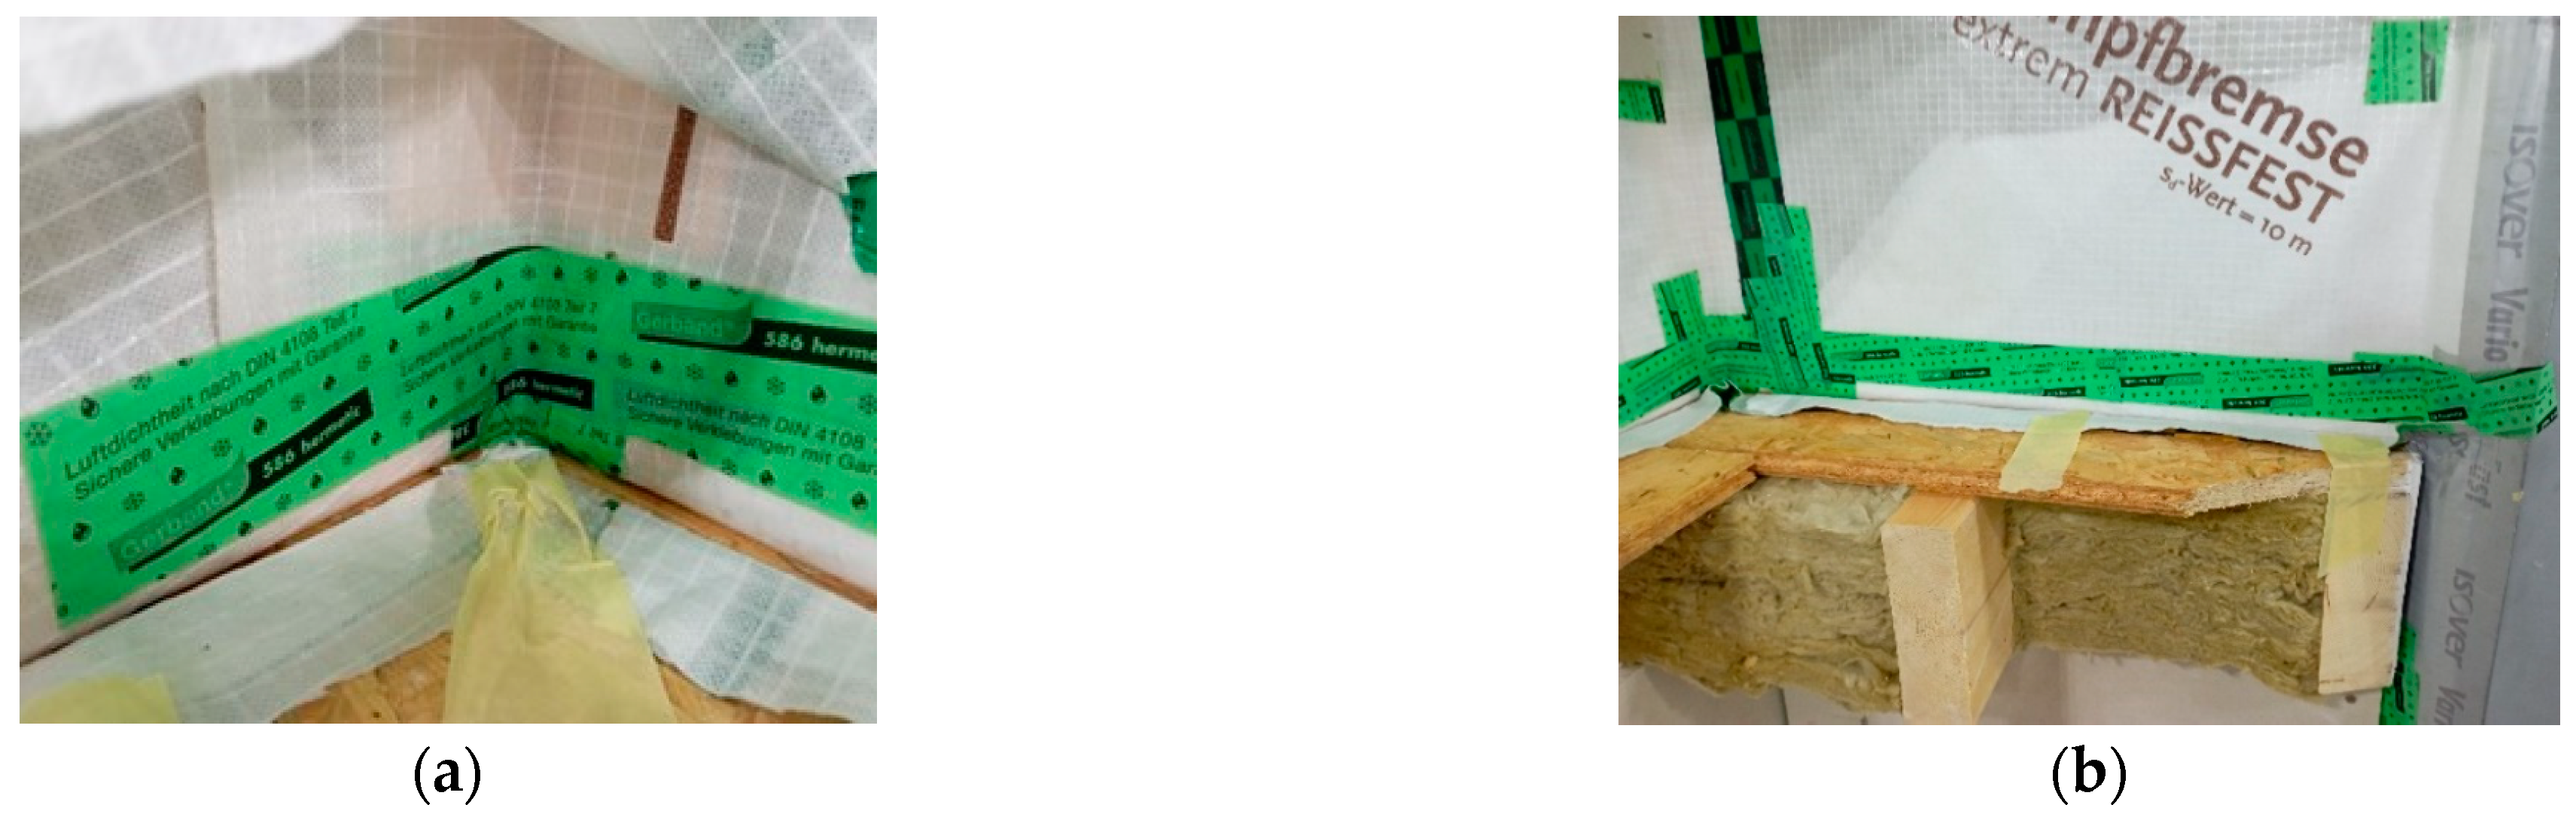
2.4. The Options for Airtight Layer Execution
To properly seal the building, the airtight layer has to be intact. When we use foils to provide the layer, the execution of connections is crucial. It can be done by either overlapping two layers and clamping them between surrounding structures or binding the overlap with tape or a double-sided adhesive. The conjunction is particularly intricate in the multi-connections—for example, in the corner with the ceiling conjunction. In many cases, we must place the foil already while building the connection of the ceiling joists. The approach to correctly connect and finish the airtight layer can vary depending on the construction system [
15].
Within this experiment, we tested two different approaches to connect the foils, namely:
- –
1st variant—the bottom foil was clamped between the OSB and the wall plate, while the upper foil was connected to the OSB by a sealing tape (
Figure 9a);
- –
2nd variant—the previous connection (1st variant) was upgraded by sealing between the top and the bottom foil (
Figure 9b).
3. Results
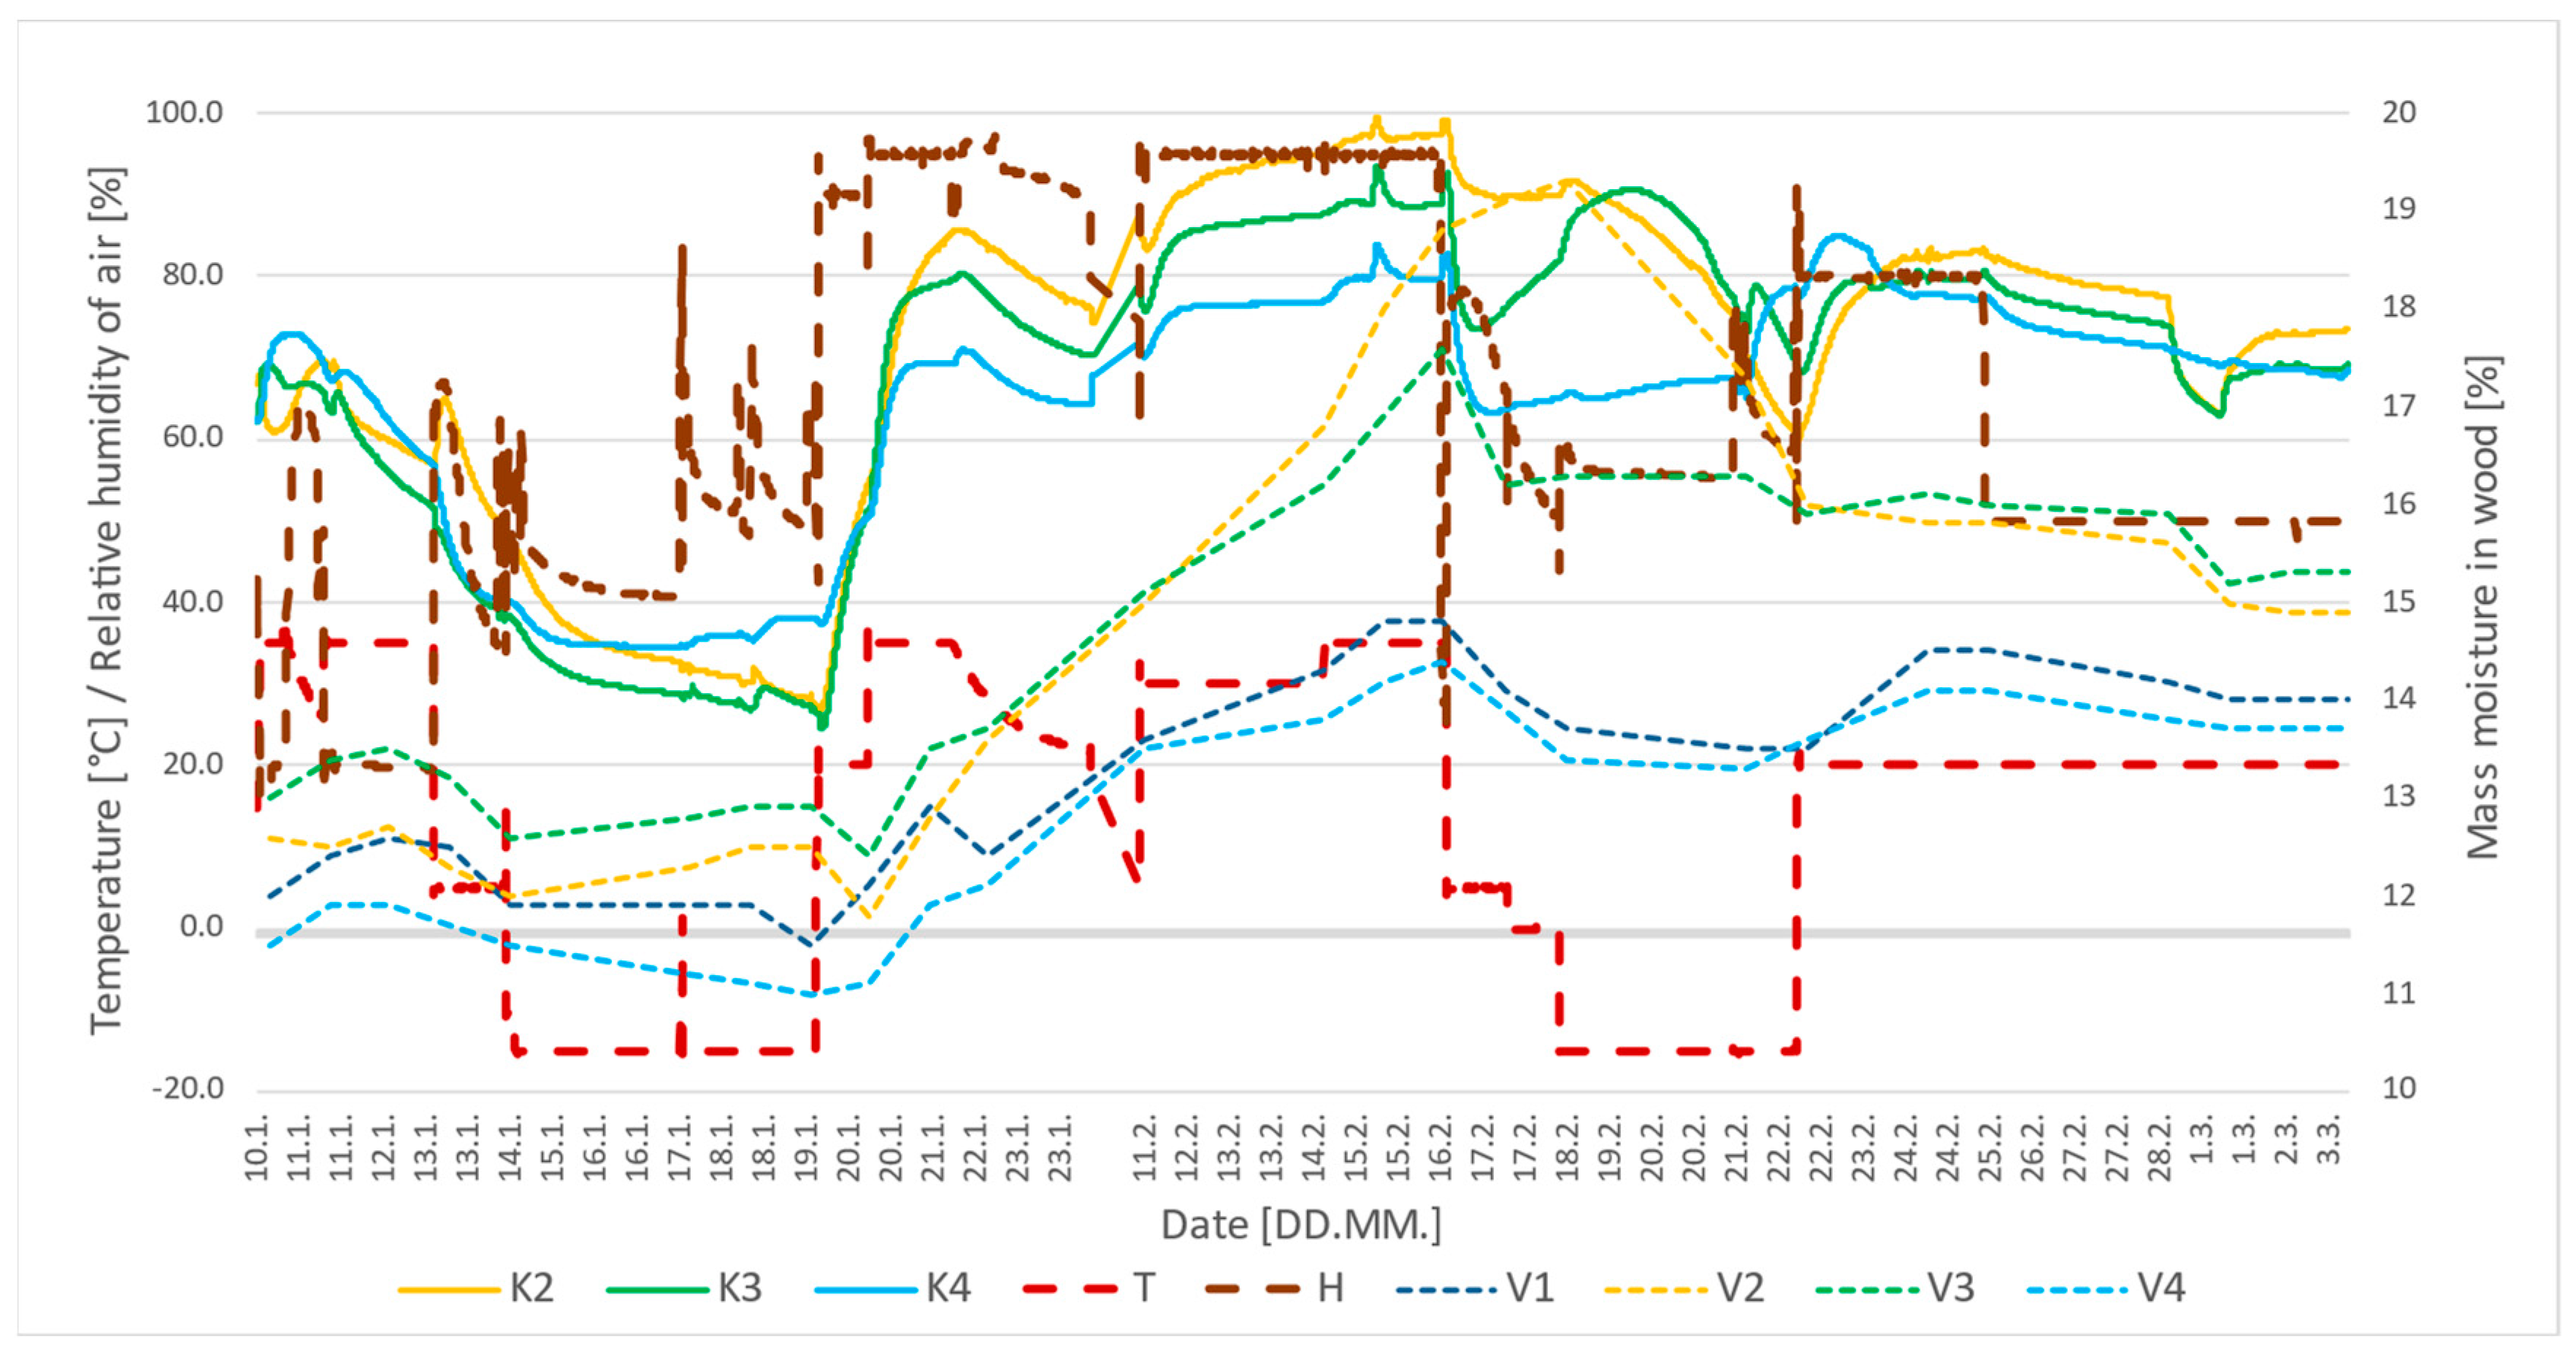
To achieve the desired response of the wooden frame, we simulated varying temperatures and relative humidity within the climatic chambers.
Figure 10 shows the development of the air temperature (T) and relative humidity (H) in the outdoor chamber, together with the air relative humidity (solid lines) and mass moisture of wood (dotted lines). However, the response from the wall came with a significant delay.
The stabilization within the wall fragment could be divided into two stages. The first took two to three days, the time necessary for the construction to adapt to a significant climate change. The second stage lasted longer than the first one, leading to general stabilization. However, an absolute equalization was not reached even after several days. Therefore, we could not reach ideal stationary conditions regarding the relative humidity.
The airtightness measurement could cause fluctuations due to the additional airflow in the specimen. The fastest to respond to the exterior conditions change was the sensor KV4, separated from the outdoor air only by wood-fiber Steico boards with a thickness of 150 mm. This sensor was also the nearest to the corner. At the same time, after stabilizing the boundary conditions, the relative humidity on this sensor was the fastest to stabilize itself.
The wood moisture inertia was even more pronounced. According to the sensor V2, the one placed farthest from the exterior surface, the delay in moisture increase after external conditions alternation was one to two days. We executed the measurements per this phenomenon, generally after a few days at the end of stable climatic conditions. Unfortunately, we could not regulate the relative humidity by negative temperatures. This concluded the preliminary testing phase.
3.1. Airtightness by Varying Climatic Conditions
After the preparations in the form of the testing phase, we initiated the airtightness measurements. The first step was to increase the temperature and relative humidity to 35 °C and 95% for 10 days to represent a period of higher precipitation and, therefore, higher outer air relative humidity. It caused a significant increase in wood moisture content, initially at 12%. Afterward, the measured moisture content was 14.4–18.8%, while 18% is a borderline for increased risk of wood deterioration [
19]. The highest value was reached on the wooden stud closest to the interior and, at the same time, closest to the vapor barrier (sensor V2).
The next step was drying at a low temperature of −15 °C and relative humidity of 55–66% for several days. The mass moisture in the KVH frame progressively decreased. The decrement continued even after the increased temperature and relative humidity in the outdoor chamber due to the temperature and humidity inertia. This phenomenon is caused by robust thermal insulation from the exterior surface.
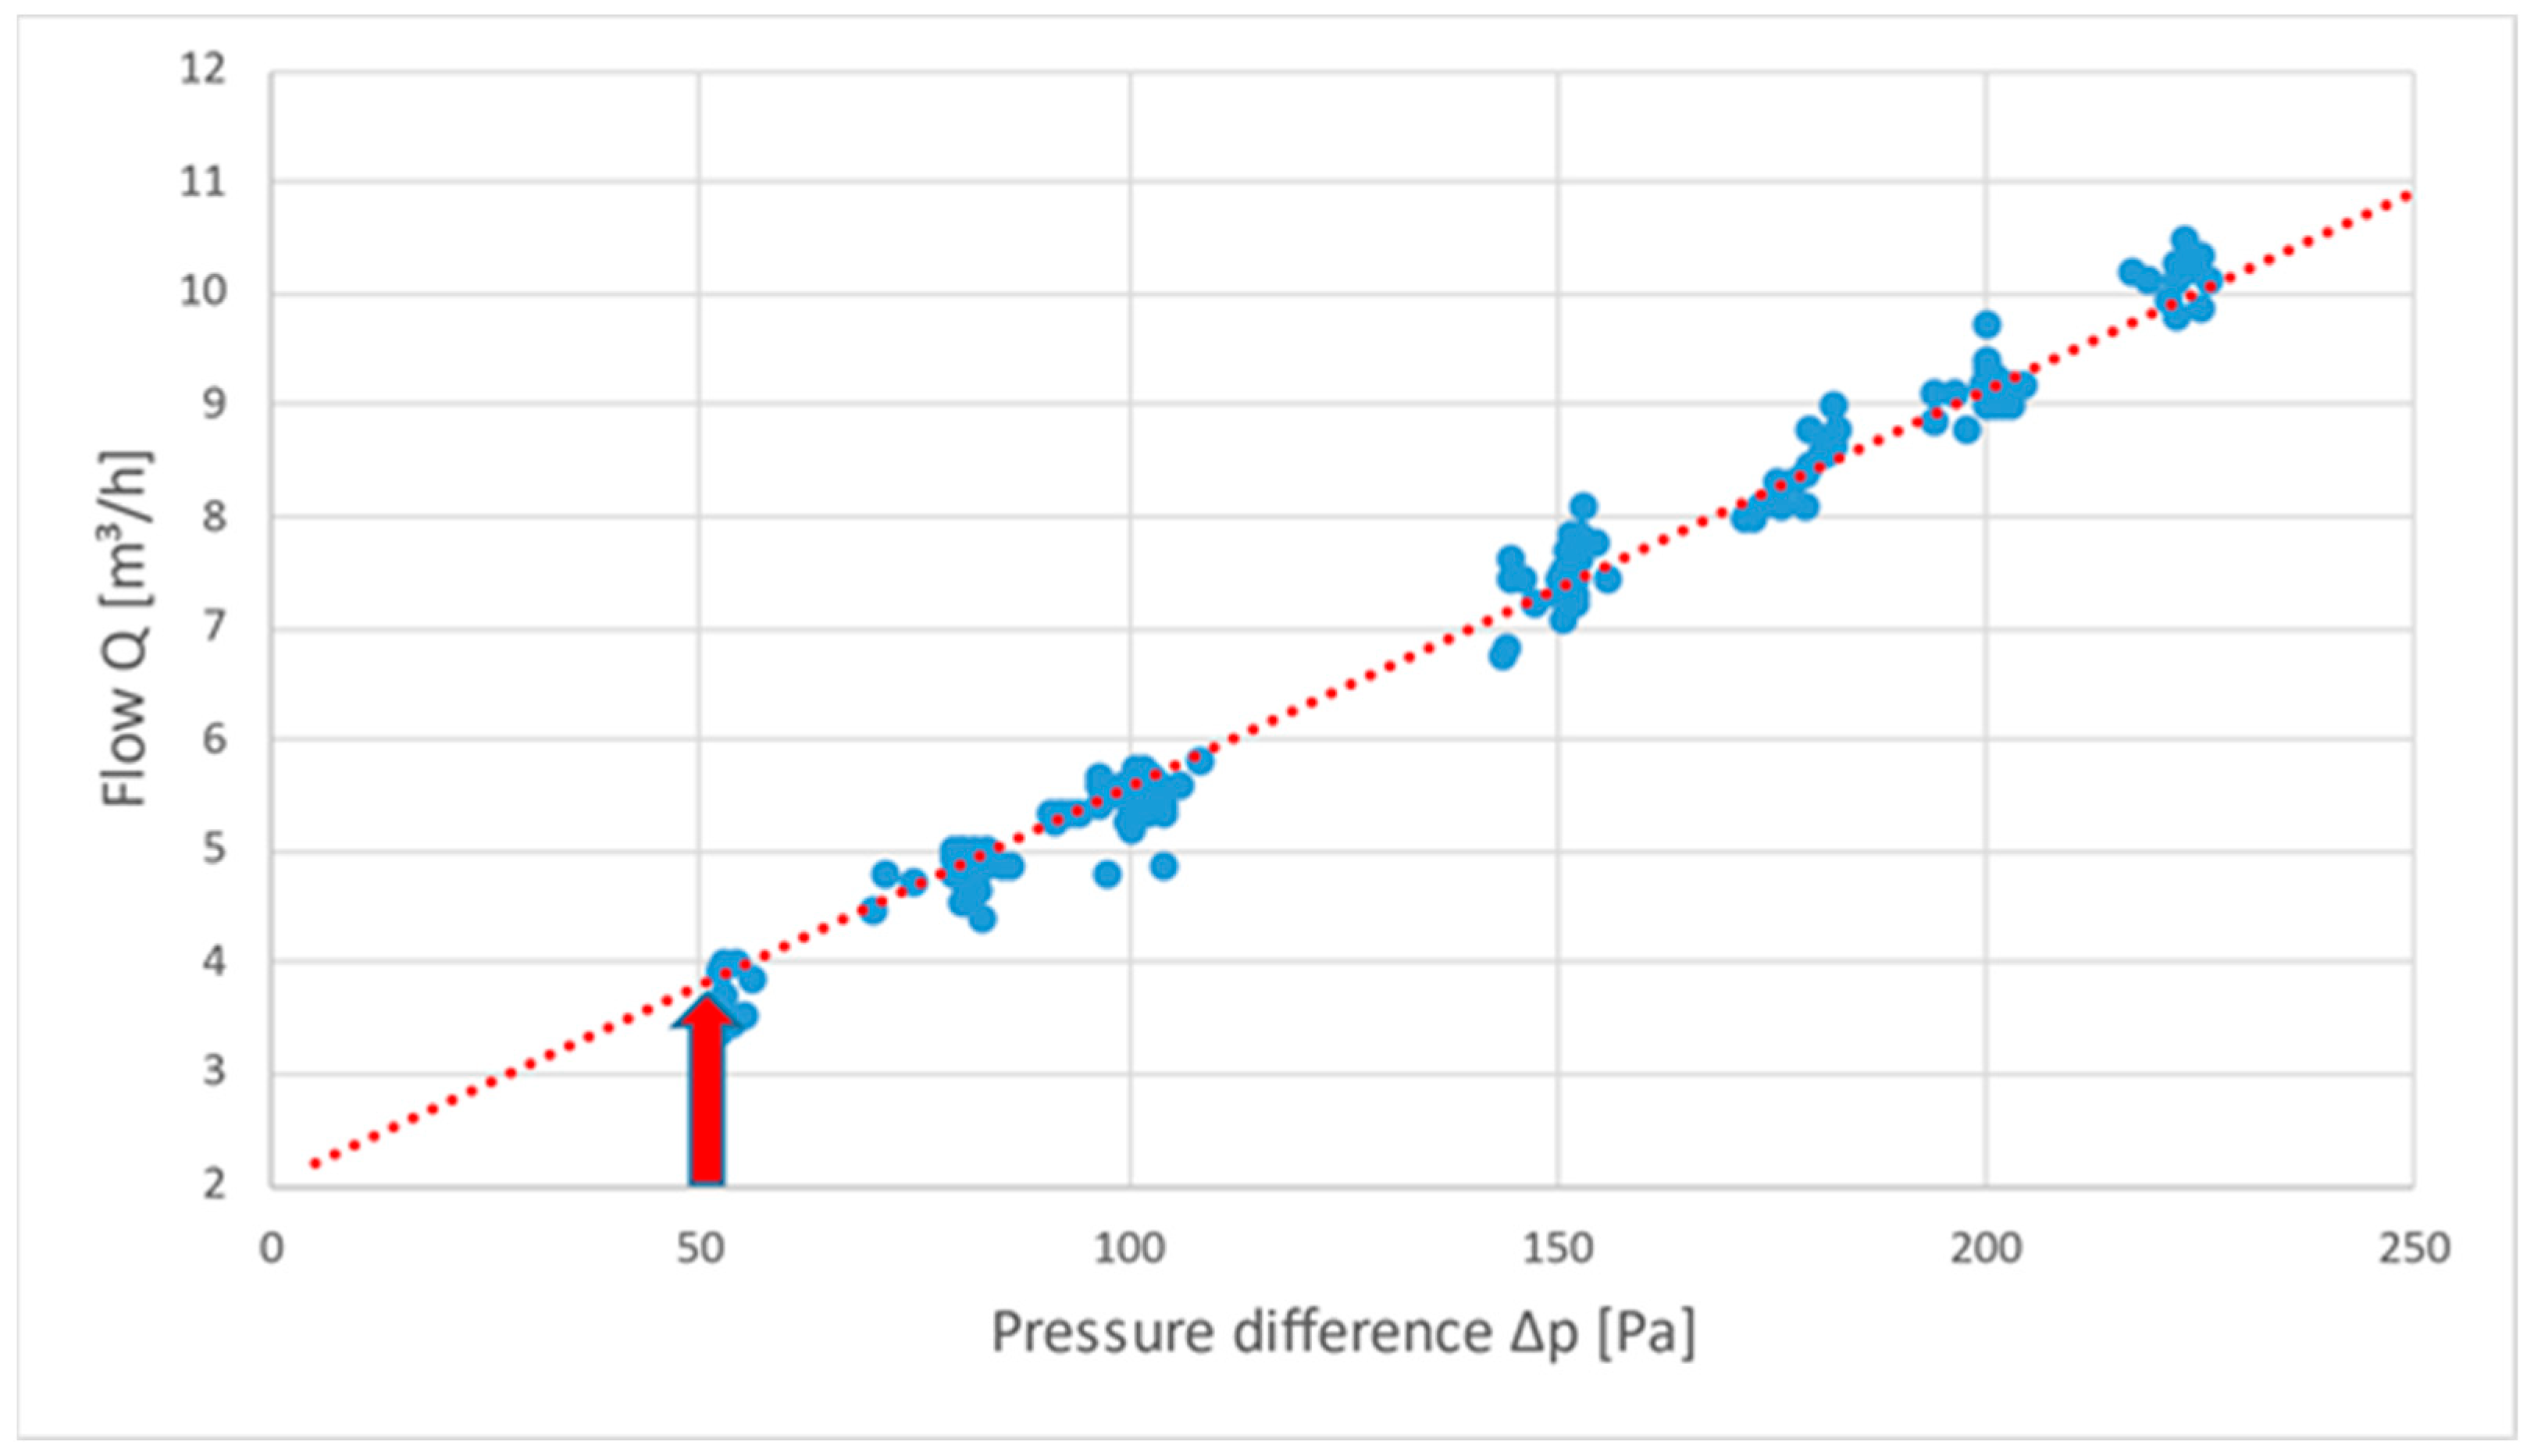
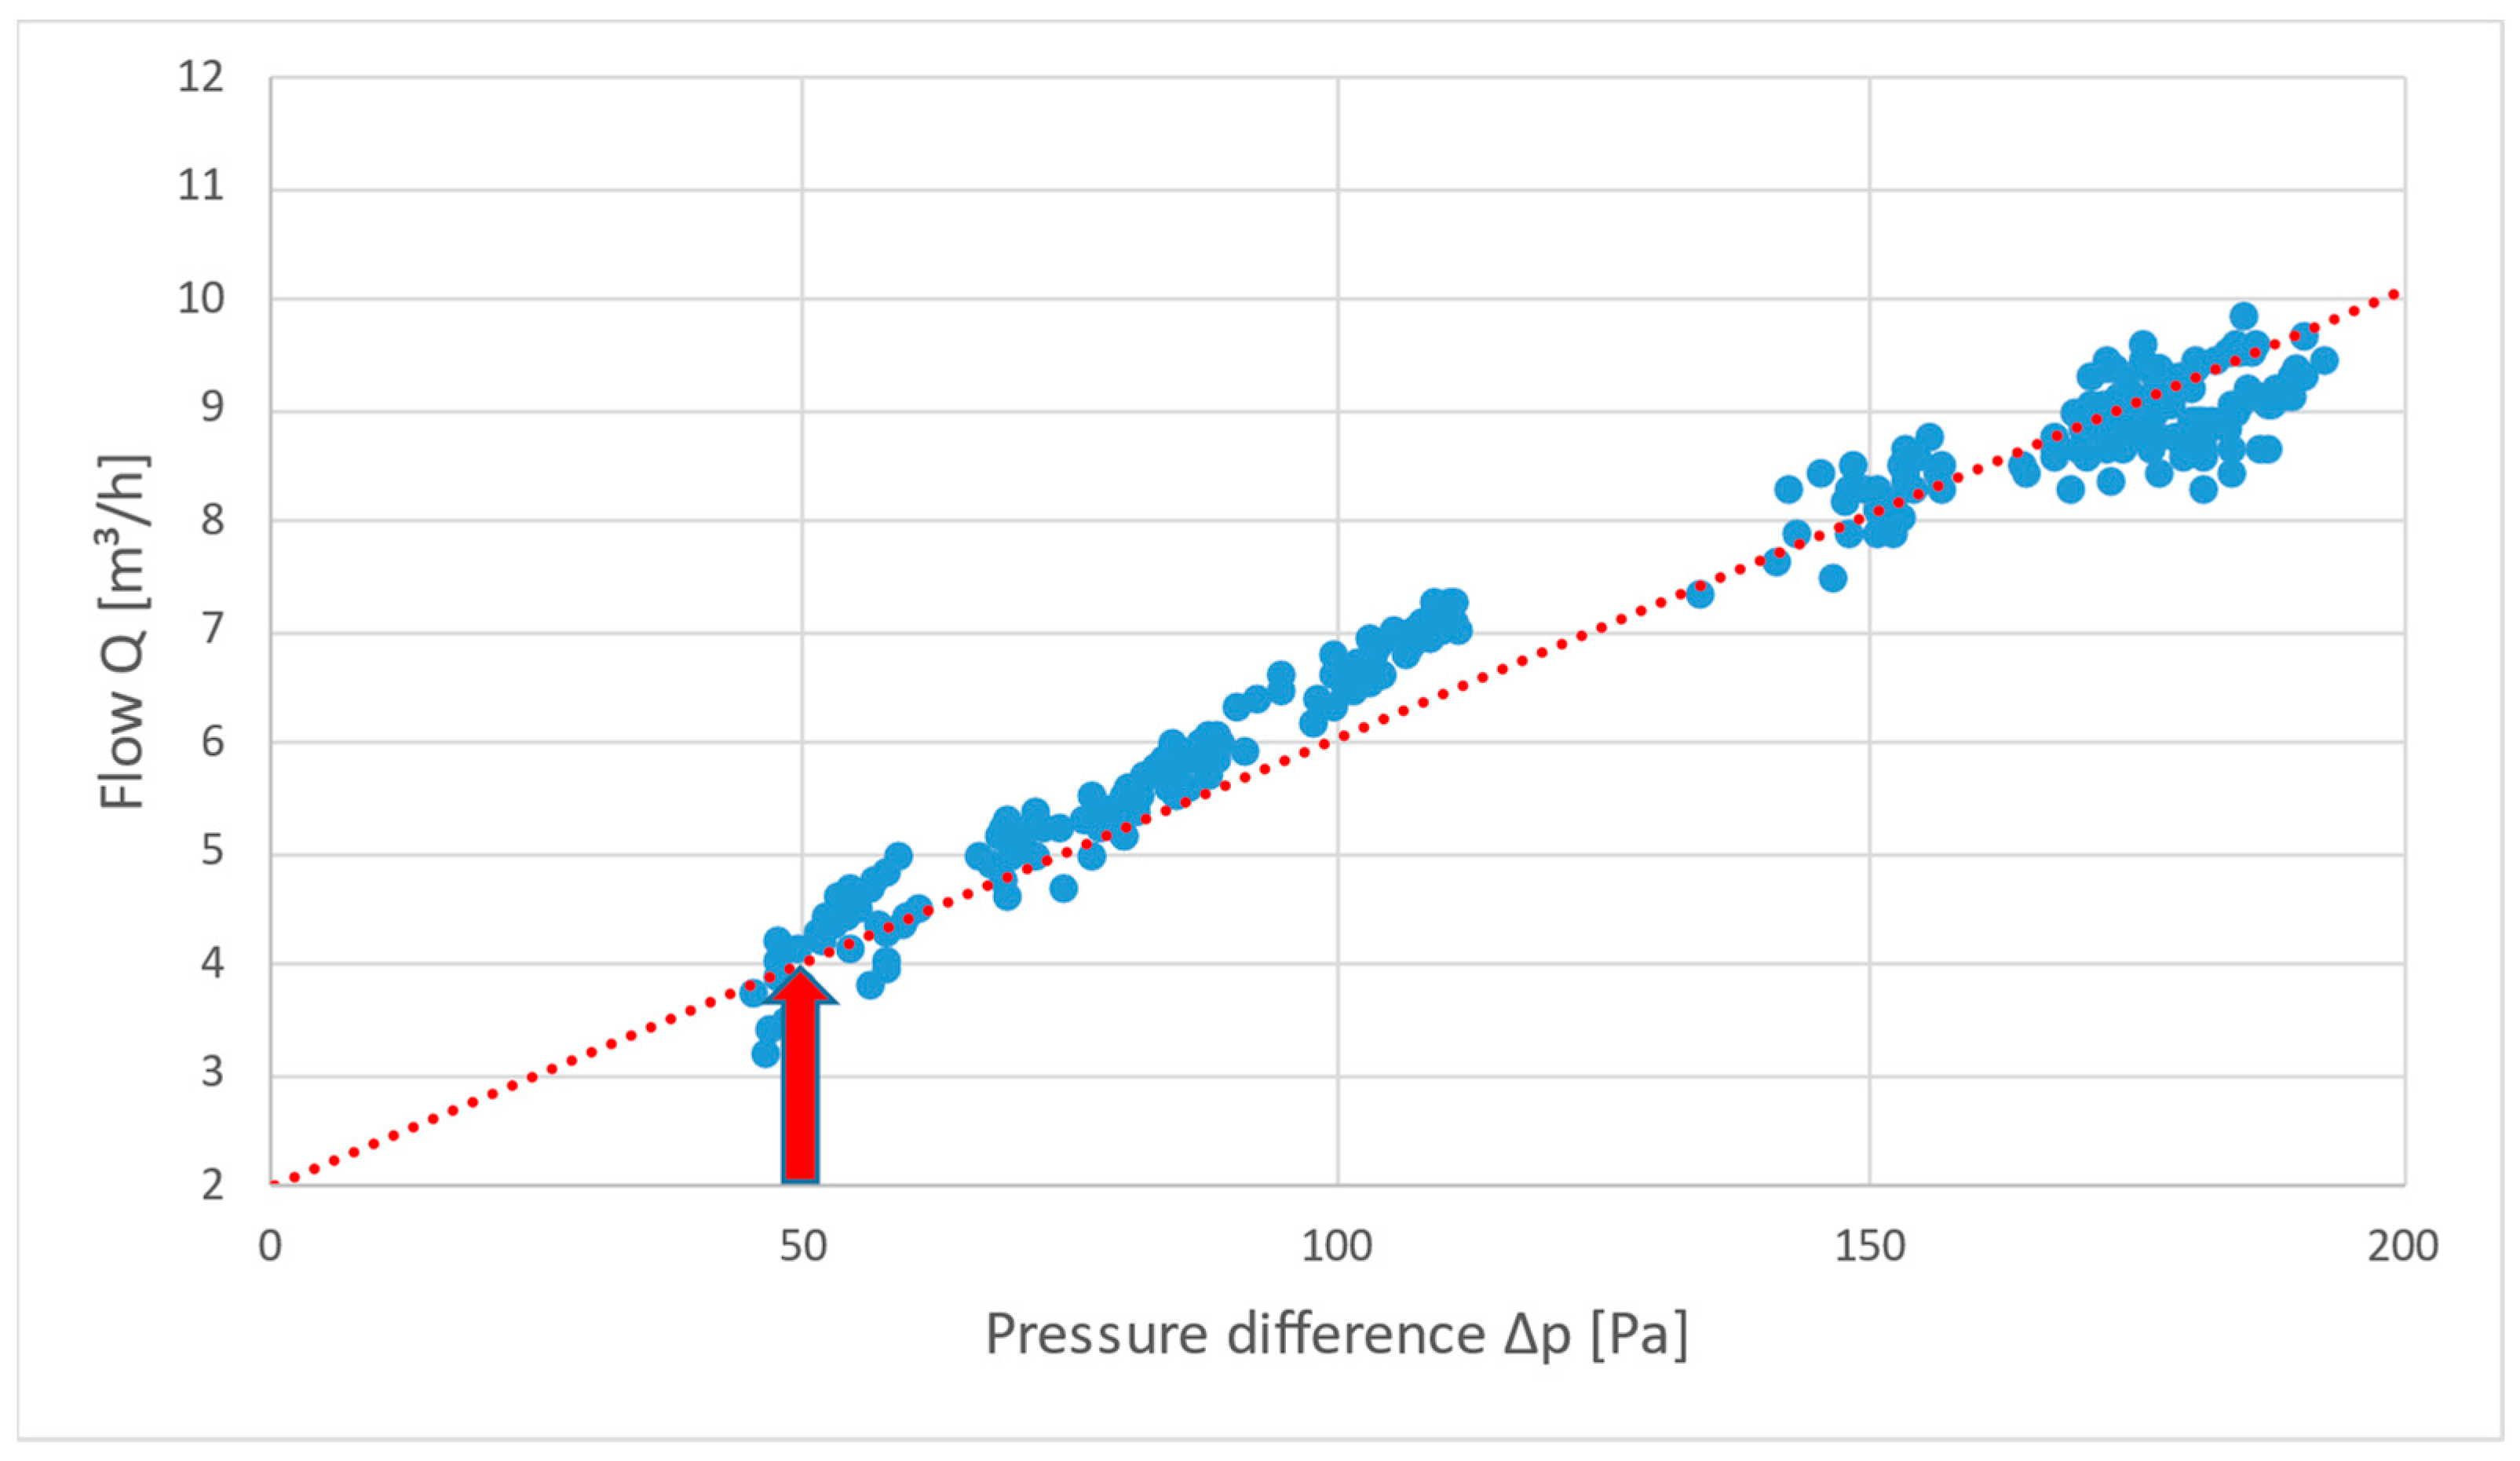
To evaluate the airtightness, we established pairs of the volumetric airflow rate values in both states—wet and dry—for each pressure difference. Afterward, they were re-calculated by linear regression and inserted into the graph—
Figure 11,
Figure 12 and
Figure 13. The red dotted line represents the regression line. The normative value for airtightness evaluation is determined by the reference air pressure of 50 Pa. The intersection of the regression line with the value of 50 Pa illustrates the value of airflow for normative evaluation.
Figure 11 shows the air permeability in the wet state measured on 16 February, while the wood moisture content was 18.8% (probe V2).
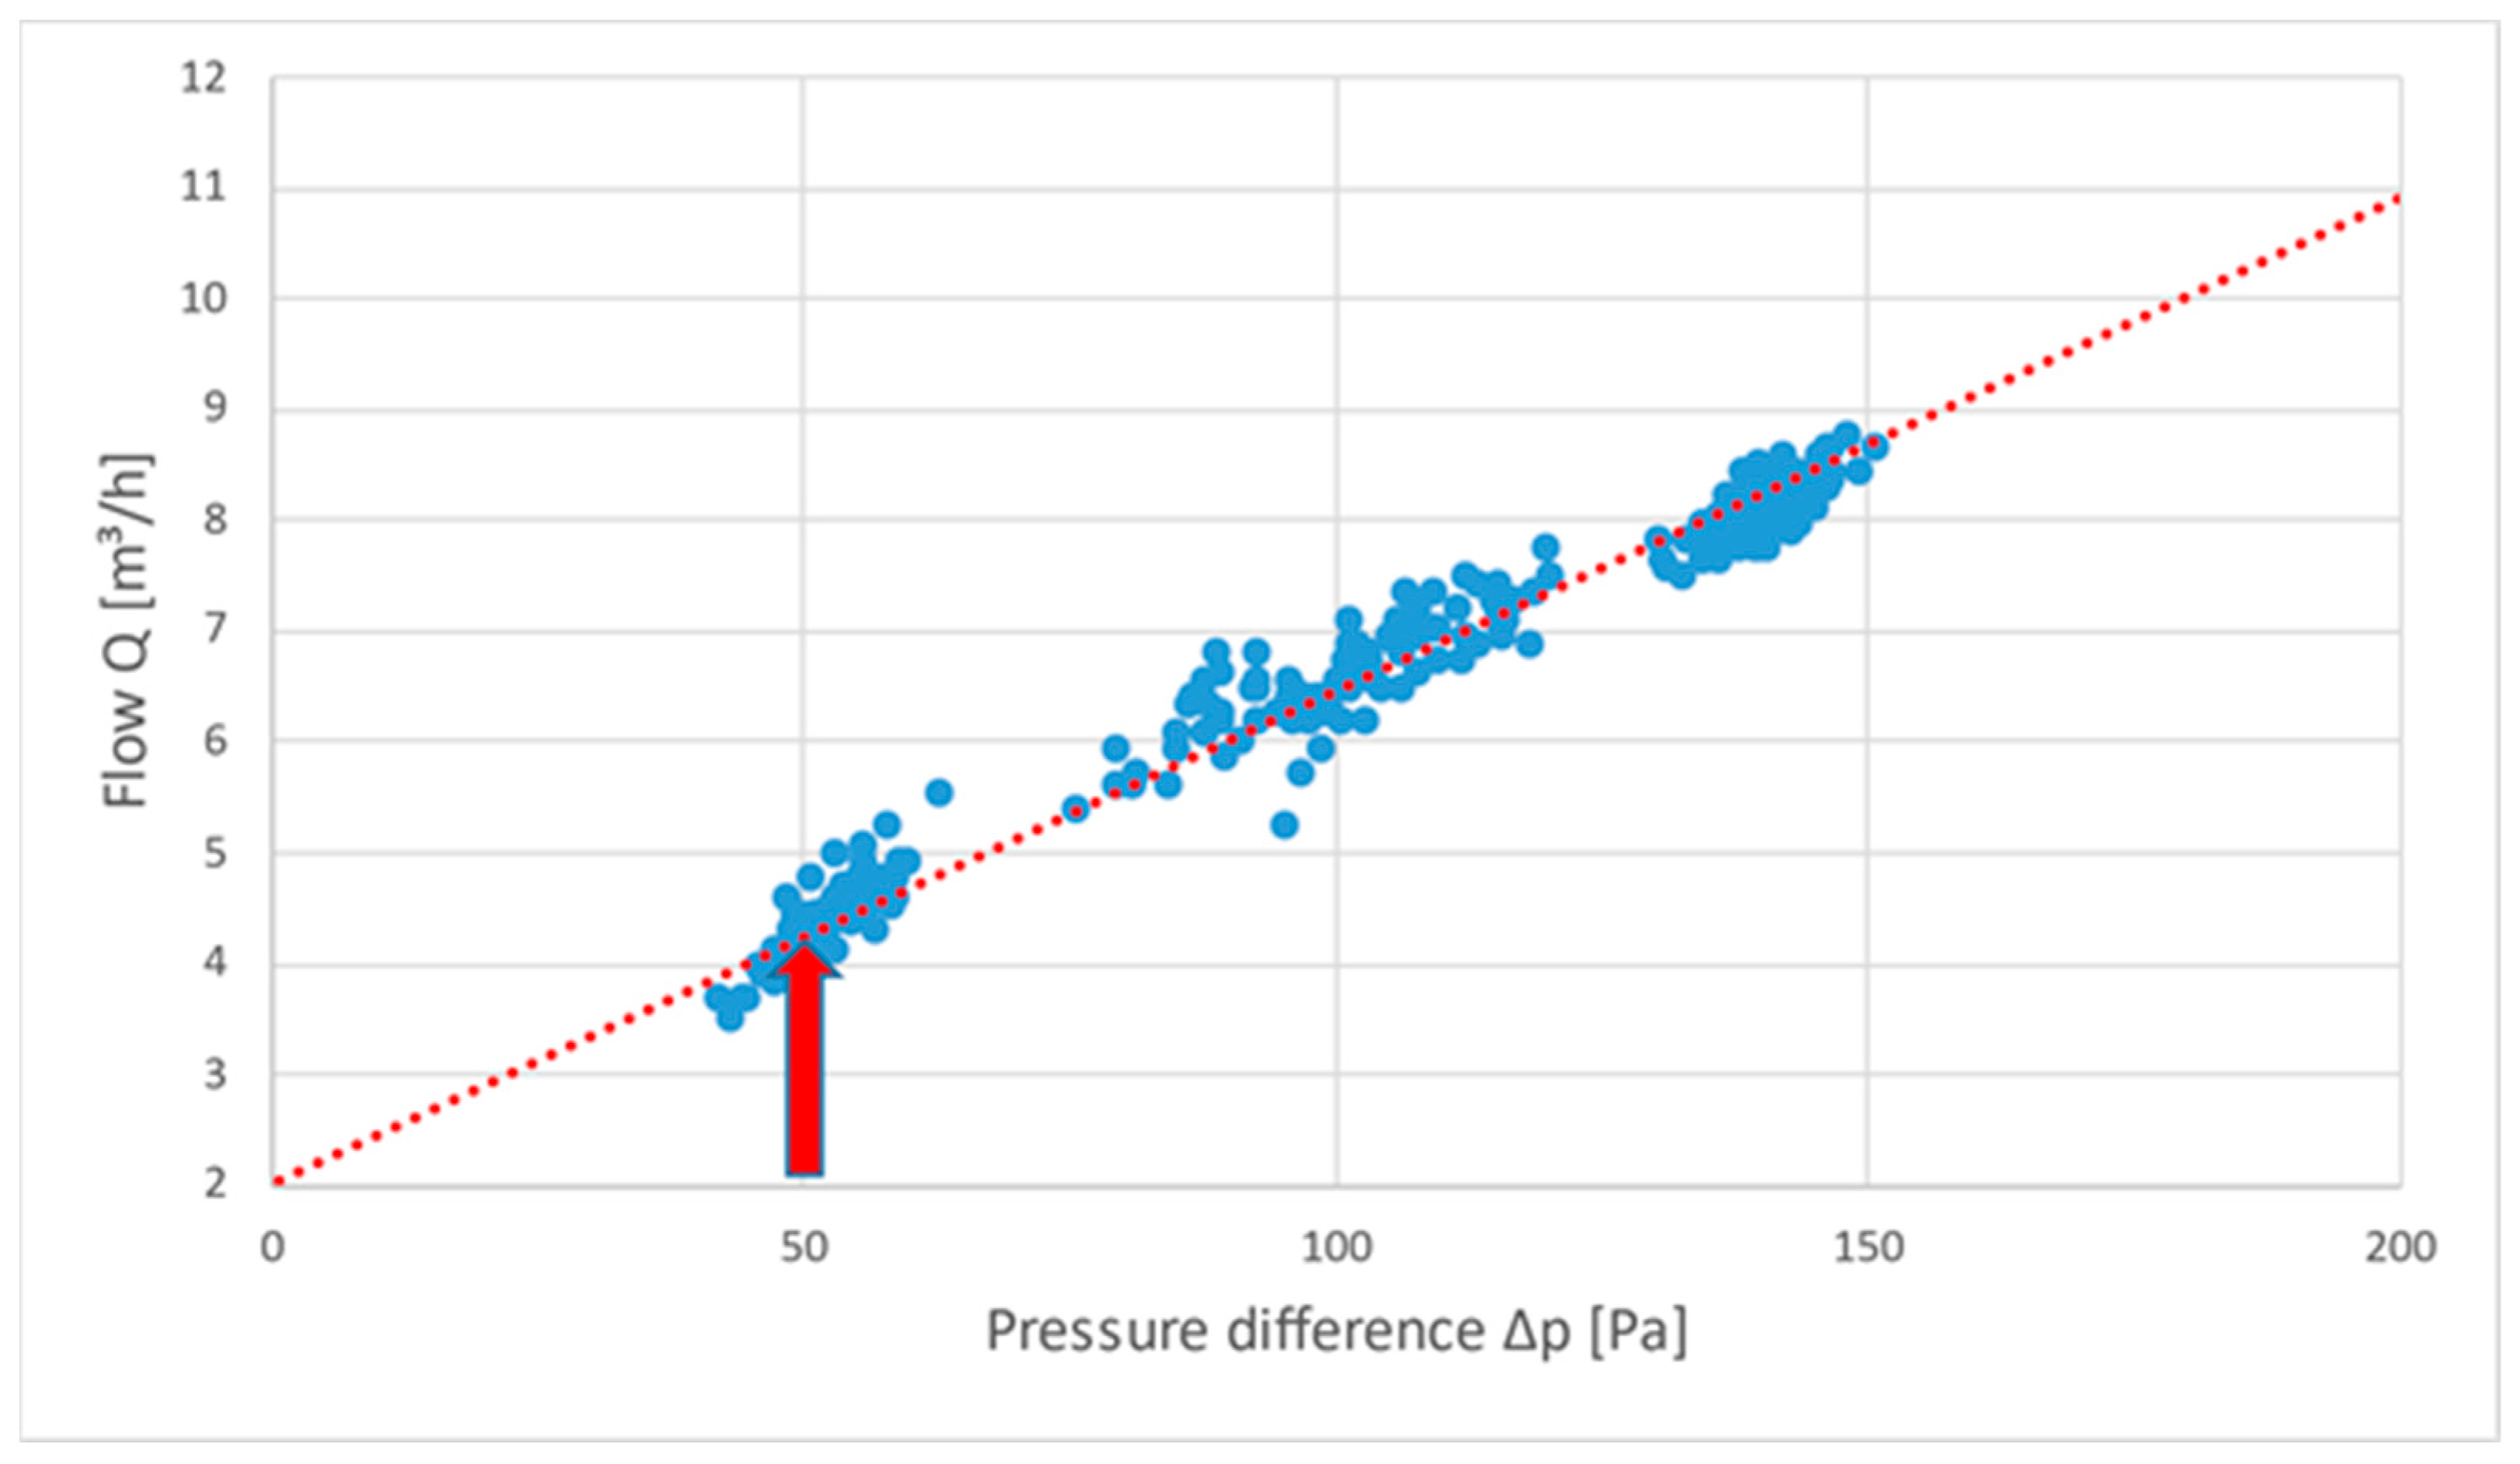
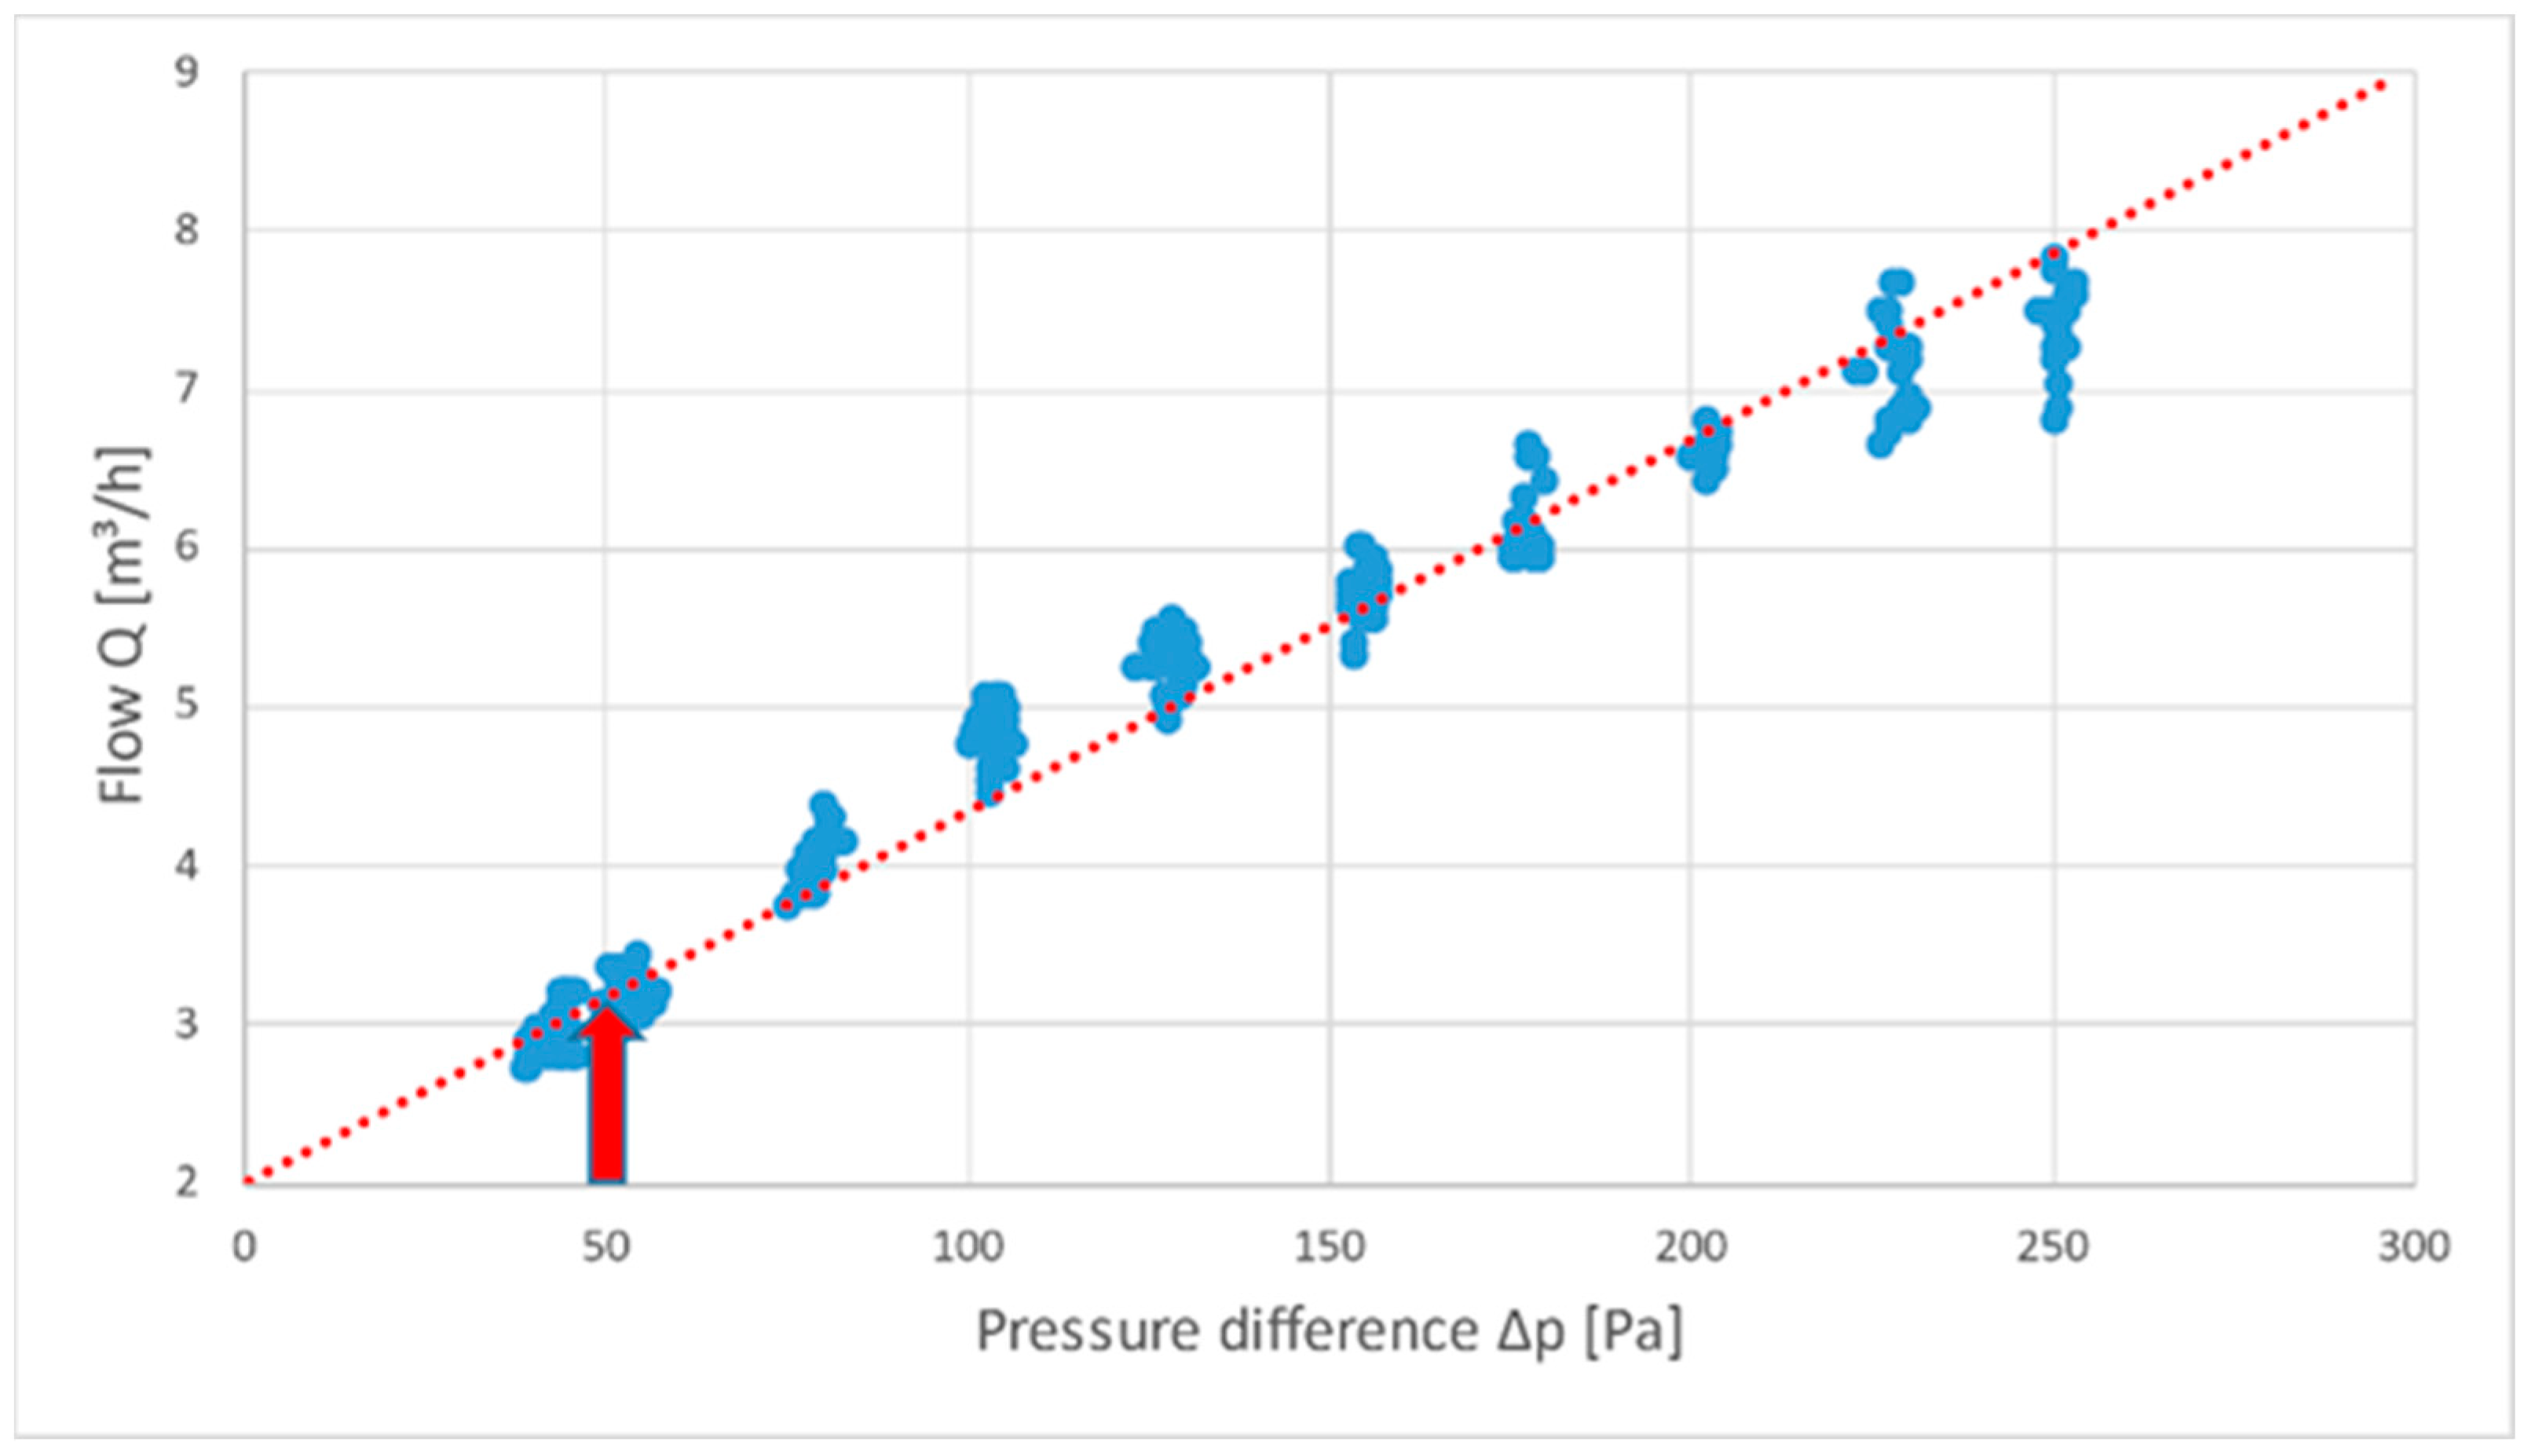
The following graphic in
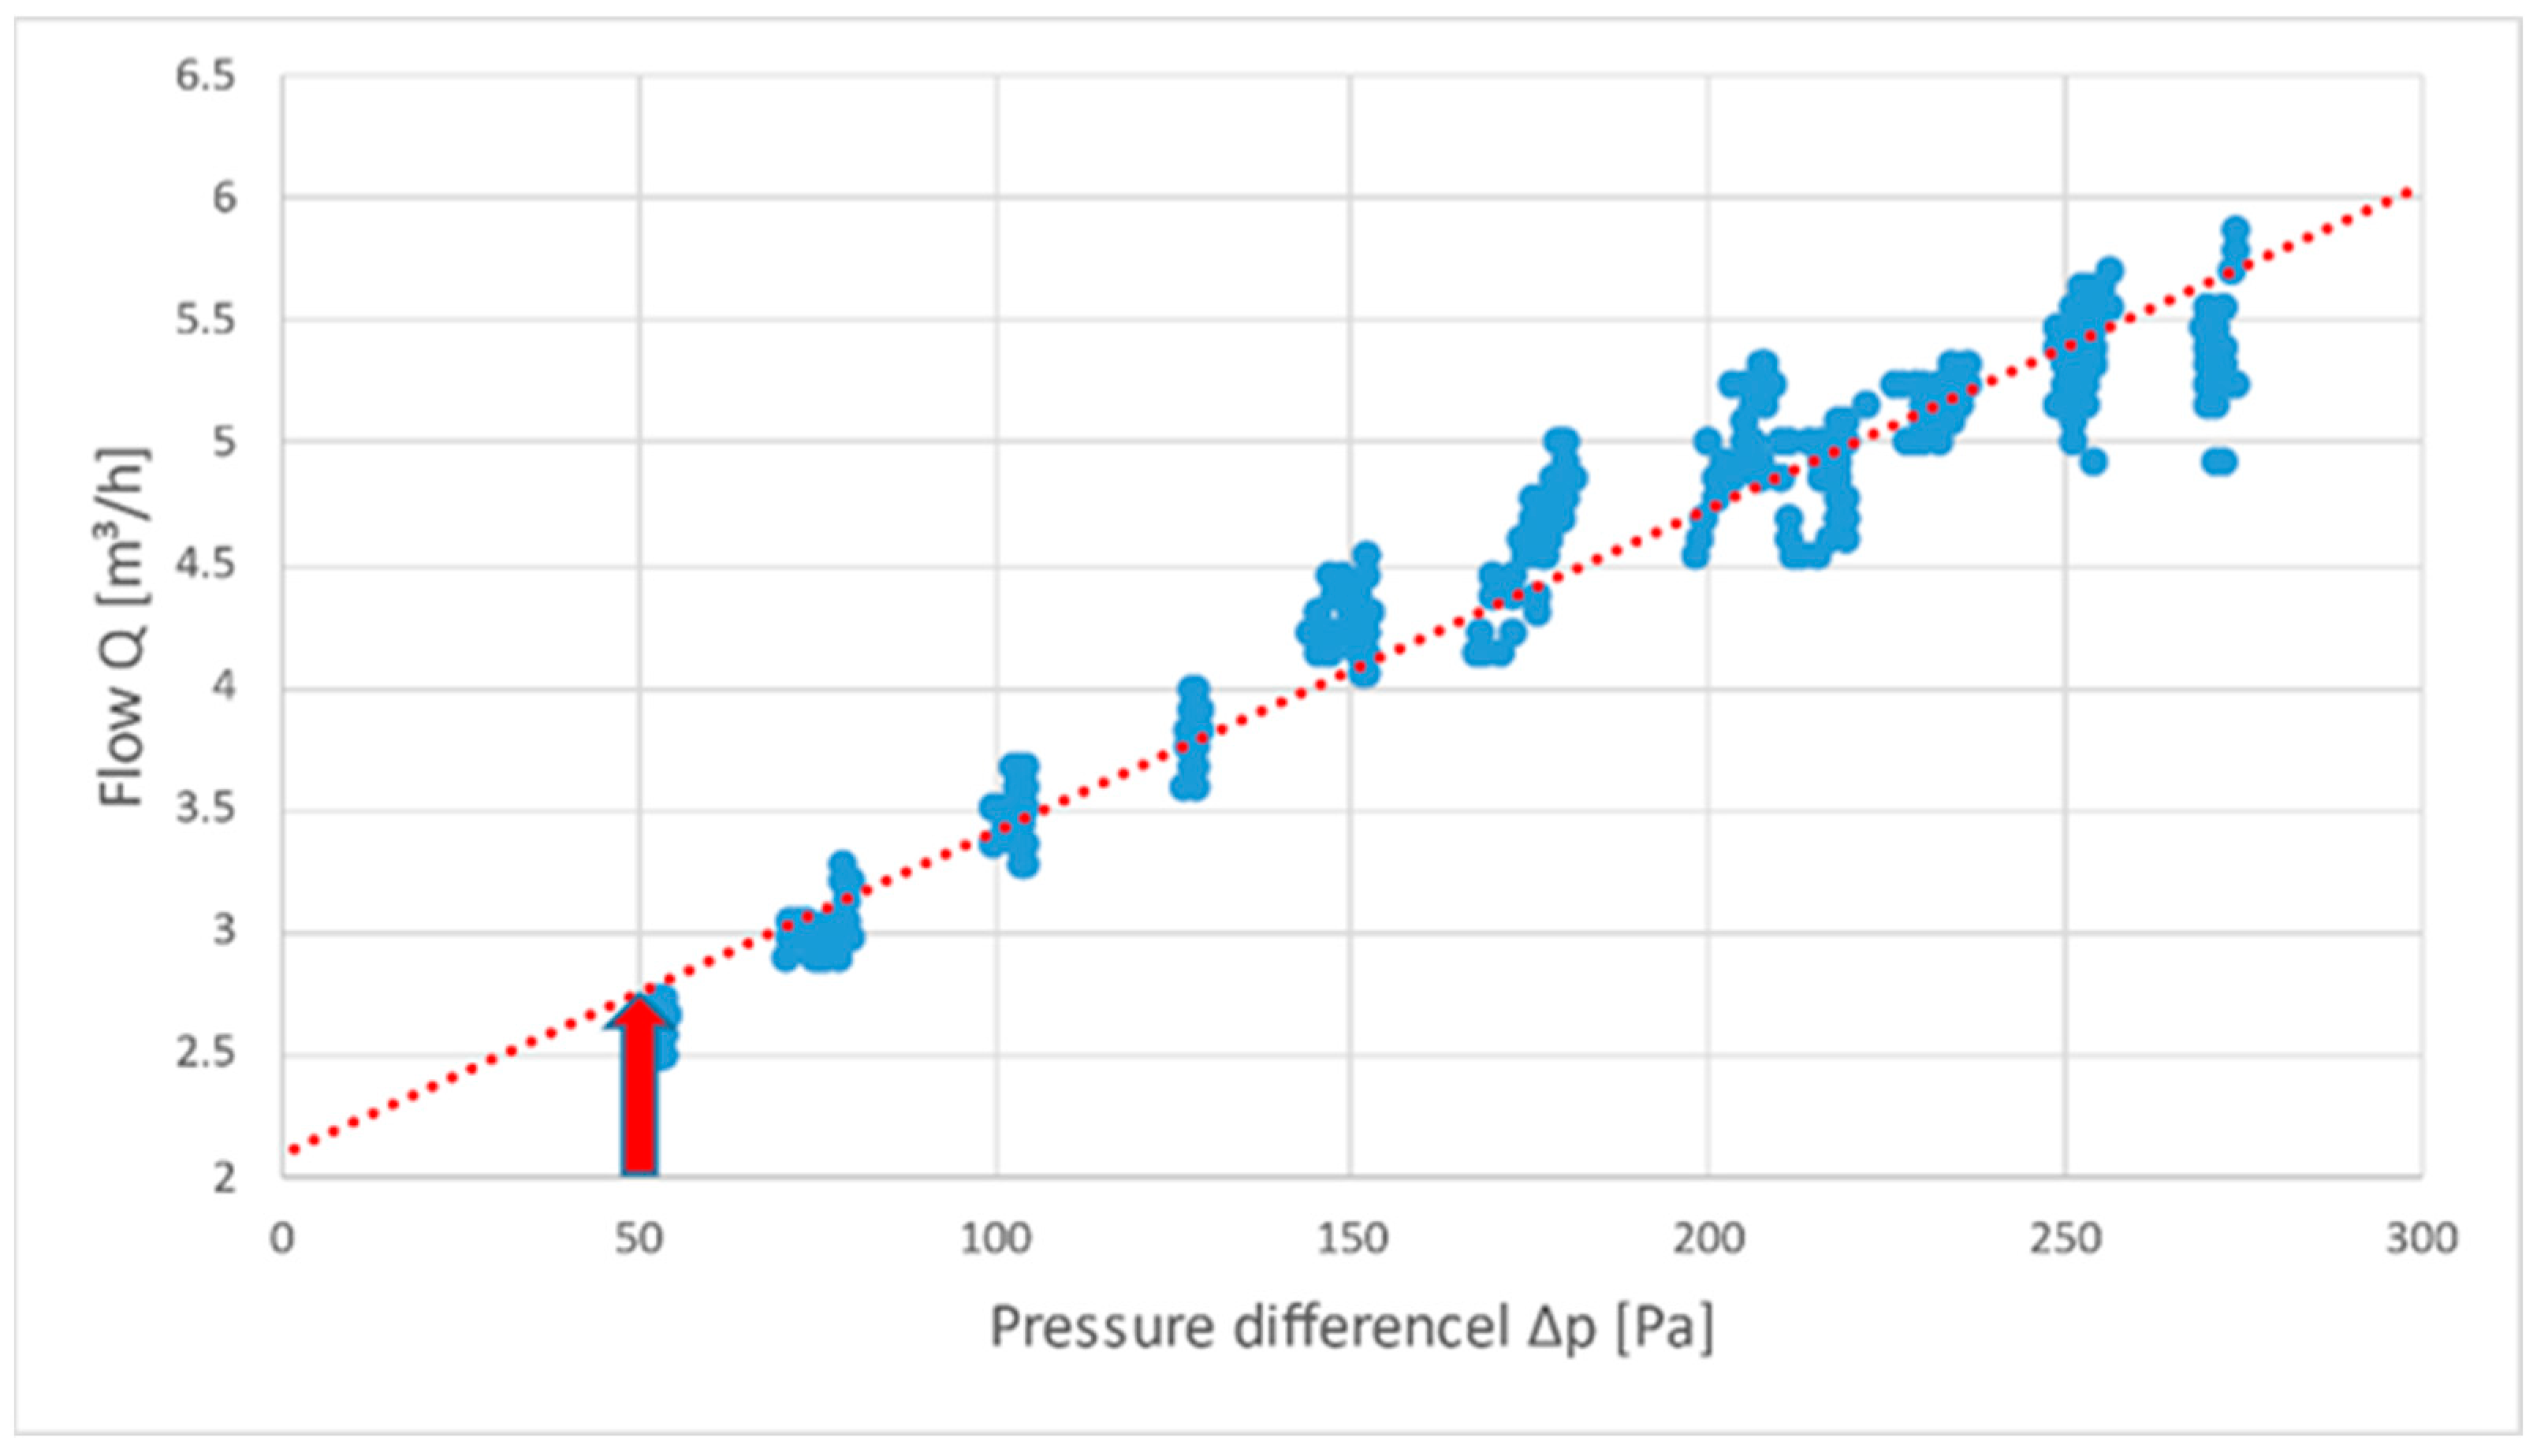
Figure 12 shows the measurements on 21 February during the dry state, where the mass moisture content was 17.3% (probe V2). Last,
Figure 13 shows the air permeability at the end of the drying process on 24 February, while the wood mass moisture content was 15.8% (probe V2).
The experiment enabled us to determine the parameters C and n from the leakage Equation (1) for each measurement and thus calculate the volumetric airflow rate Q50 for normative pressure of 50 Pa. The flow exponent n reached during the experiment values varied from 0.4417 to 0.6234. Subsequently, the volumetric airflow rate Q50 was divided by the airtight layer area, identical to the vapor foil area, leading us to the normative value of the measurements of the airtight materials q50 necessary to evaluate the influence of climatic conditions and their overall impact on the experiment.
The summary of measured parameters from the outdoor chamber (OUT CH), inner chamber (IN CH), and fragment elements is in
Table 2. The mean value of measured leakage q
50 in the wet state was 1.52 m
3/(m
2.h), while during the dry state, it was 1.80 m
3/(m
2.h), creating a decrease in airtightness of 18%. According to further measurements, this change was permanent.
3.2. Air Tightness by Varying Sealing Technique
In the next phase, we examined the impact of different manufacturing of vapor-barrier foil connections within the wall. We tested two previously described alternatives, exposed to identical boundary conditions of 20 °C and 50% Rh.
Figure 14 shows the results of the first variant as a linear regression line of the dependence between pressure difference and airflow rate in standard laboratory conditions applied to a logarithmic scale. The parameters of the leakage equation were the leakage coefficient C = 0.3961 m
3/(h. Pa
n) and the laminar flow exponent n = 0.5317.
The second variant is based on the first one, altered by additional tape between the top and bottom foil with airtight tape (
Figure 15). Similar to
Figure 14,
Figure 16 shows the airtightness of the second variant. The parameters of the leakage equation were, in this case, C = 0.3986 m
3/(h. Pa
n) and n = 0.4697.
The difference between both variants is rather significant, reaching an improvement of 21%. The measurements conducted by varying temperature and relative humidity conditions show a significant measurement error. Unfortunately, we were not able to verify the outcomes for low temperatures due to technical difficulties and, thus, complete the measuring set. However, the trend in results is still viable.
Measurement deviations are higher when varying the temperature compared to the measurements by steady temperature, differing only in relative humidity (
Table 3). That is foremost visible in the second variant at a 35 °C temperature in different relative humidity, where the deviation in q
50 is only 0.019 m
3/(m
2.h), caused by the fact that the relative humidity inertia is higher compared to the temperature inertia.
Table 3 summarizes the measurements and their outcomes.
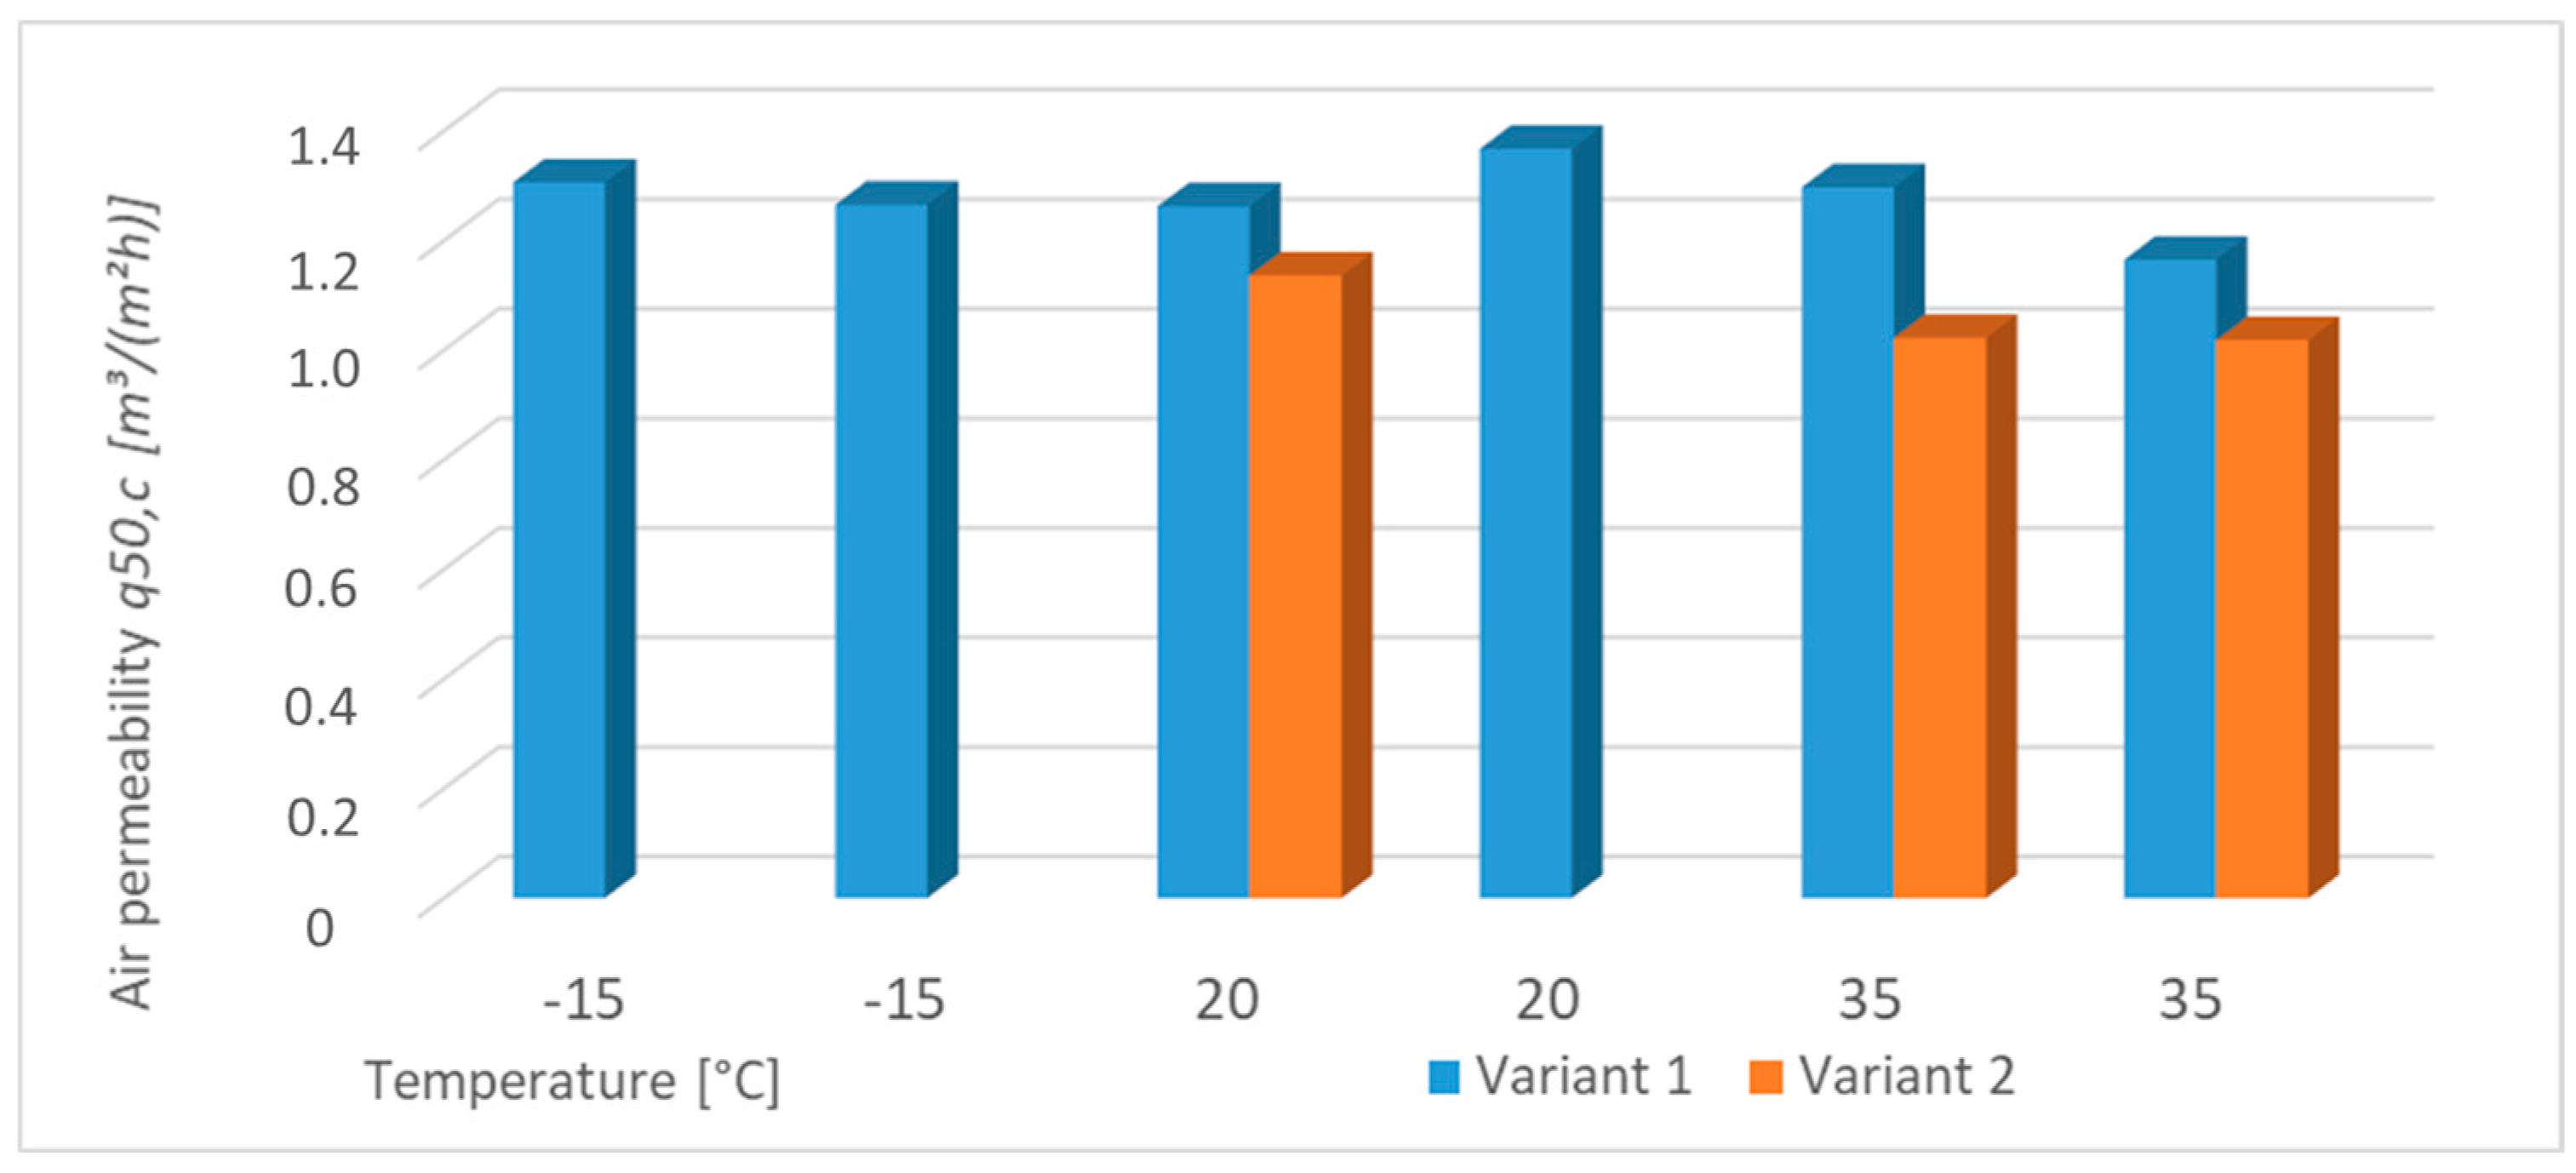
Figure 17 shows each measurement’s air permeability values, a circle standing for variant 1 and a triangle for variant 2. The red color means that the relative humidity by the measurements was higher than 50%. In contrast, the green color means an Rh lower than 50%. The blue shows reference climatic conditions—20 °C and 50% Rh. For higher clarity,
Figure 18 shows the results in histogram form, highlighting the coupled measurements for both first and second variants.
According to the air permeability results, the thorough taping and, thus, proper sealing of the airtight layer should be performed, should the design and technological approach allow it. In our case, the additional sealing led to an increase in 3D corner airtightness by 21%.
4. Discussion and Conclusions
This research focuses on a three-dimensional fragment of a timber-based lightweight corner structure under extreme climatic conditions and its final airtightness levels. This corner contained the intersection of two exterior walls with a ceiling structure with intricate connections of the airtight layer, interrupted by thermal insulation anchors. At the same time, the wooden elements—studs, beams, wall plate—had to be connected by bolting, breaking the vapor barrier. However, these connections were essential from the construction point of view. The hypothesis was that extreme conditions would, after an extended period, cause motion, disturbing the airtight layer.
We analyzed the correlation between temperature, relative humidity, and buildings’ airtightness. From the results, we can draw the following conclusions:
- –
The relative humidity of the surrounding environment has a critical impact on the airtightness of the building. By simulating extreme climatic conditions with higher relative humidity, we obtained increased mass moisture of the wooden elements from the original value of 12% to the level causing wood deterioration. A part of the wall assembly was a climate membrane near the interior surface, also serving as an airtight layer. The membrane is bound to eliminate the potential of drying towards the interior and is used as a part of a typical installation in cold climates [
31,
32,
33]. The wall was diffusely open from the exterior. From there, the structure was dried outside. The highest value of airflow through the fragment was recorded in climatic conditions that caused drying of the wood. If we compare the measurements made in conditions at the limit of wood degradation and after drying for several days naturally embedded in the structure, we can expect a difference of 18%. A study from Norway also indicates airtightness decrement in case of weather change [
21] up to one-third. The experiment investigated a selected critical fragment of the structure. Such significant differences in the measurements on a whole timber building after drying could not be demonstrated [
21,
29].
- –
We recorded significant relative humidity inertia according to the sensors’ readings—the inertia appeared after the drying process due to the climate change in climatic chambers. Moreover, one sensor read inertia even after the moisturizing process, potentially caused by the protection in the form of the outside thermal insulation boards, prolonging the time necessary for the construction to adapt to different boundary conditions.
- –
According to the STN EN 12 114 [
24], it is necessary to correct values in line with the climatic conditions. The effect of the correction was the decrement in measurement deviations between extreme and laboratory conditions. At the same time, the correction seemed to have a more significant impact on temperature. Nevertheless, even after corrections, the significant deviations indicate the insufficiency of the corrections for relevant evaluation in extreme climatic conditions.
- –
A second part of this research was optimizing the airtight layer connection. The evaluation is based on the airtight measurements comparison in two sealing approaches. We used the same fragment, only applying a supplementary layer of sealing tape to the fragment in the climatic chamber. The increase in the fragment airtightness was 21%, although burdened with a measurement error due to the large scope of measured values in different climatic conditions. However, it would be less significant in the whole building scale, reaching only 6 to 8% from the air filtration [
34].
The results of the work are mainly useful for designers and contractors of wooden buildings. Procedures in the literature often provide methods of design solutions for timber buildings but rarely address the possibilities of an air-tight layer connection, especially in technically demanding details. Such solutions should be passed on to the competent workers who make the airtight layer connections on-site because only in this way can the quality of the construction be improved and the airtightness of the buildings constructed in the future be increased.


