1. Introduction
Tensile membrane structures are an attractive option for architects, engineers, and developers due to their lightweight material, versatility, and aesthetic appeal. They are highly durable and can withstand exposure to the environment, making them ideal for public spaces or outdoor events [
1,
2,
3,
4,
5]. The versatility of these structures means they can be customized to any design and shape, providing flexibility in design. The quality design can assure a wide span and a minimum of supporting elements. These structures are able to carry large loads while maintaining a small weight compared to conventional structures made from concrete or steel of the same span. Membrane roofs have a number of advantages, including shorter construction times and lower material consumption, and thus lower energy consumption for transport. By creating lighter structures, they can also be easier to install and can provide a more aesthetically pleasing design [
6].
The tensile membrane roof needs to be supported underneath by another structure, such as masts, columns, frames, cables, or trusses. All steel elements must securely bond to the fabric material and a pre-stressing system must be used to guarantee its final shape. To make sure the membrane remains taut, preload anchoring systems are implemented. The process of determining the optimum level of prestressing and finding the optimum shape of the membrane structure is called form-finding [
7]. The structural form-finding and optimization methods are for example the force density method [
8,
9], surface stress density method [
10], dynamic relaxation method [
11], and nonlinear finite element methods [
12]. It should be noted that the RFEM form-finding module [
13], which is used in this research, uses the simple linear force density method for the preliminary form-finding of finite surface elements. The RWIND computational model was created based on the mathematical models of turbulent flows described in [
14], especially the energy-dissipation model of turbulence used in [
15].
Due to the widespread use of tensile structures, the design and analysis should be standardized. While in the USA, there is a Tensile Membrane Structures Standard [
16], and in Japan, there is an MSAJ Standard [
17]; there is no official standard in Europe on this topic. However, there is a document published in 2004 by TensiNet called European Design Guide for Tensile Surface Structures [
18], and the preparation of a Science and Policy report for the structural design of membranes was drafted in 2016 by CEN/TC 250/ WG5 “Membrane structures”, titled Prospect for European Guidance for the Structural Design of Tensile Membrane Structures [
19]. The background of this report is described in detail in [
20]. The European Guide [
18] and the Prospect for European Guidance [
19] emphasize the need for an industry-wide set of rules to determine the wind resistance strength of these structures.
The ratio of applied load to the self-weight of the tensile structure is usually many times larger than that of conventional structures. Snow and wind loads can be considered the most dangerous load on the tensile structure [
7]. Therefore, snow and wind load have a greater impact on the designed structural members and the resulting deflections than the actual self-weight of the structure. The snow load should be solved according to the standard [
21]. It is recommended in [
17] to investigate the snow load using the available data from a local meteorological office. Therefore, the first load condition analyzed was the snow load in [
22], which was considered to be probably the most critical to the membrane structure. The characteristic value of the load was determined based on the standard [
21] as 0.8 kN/m
2 for the given location and was considered as the surface load across the entire membrane, with a vertically downward direction. The snow load should be considered even in areas that are not usually subjected to snow loading, as a nominal uniformly distributed load of 0.3 kN/m
2 [
18]. The value can be reduced in the case of structures with spans over 50 m by detailed statical investigation of rain, sand/dirt, fallen leaves loading, etc. The risk of snow falling from the roof and the ponding effect shall also be considered. However, the designed structure will not be inhabited by people and people will not walk directly under it in winter, and therefore these risks were omitted, and the snow load was considered primarily to select the appropriate material (type II as described in [
22]) based on the maximum deformation resulting (150 mm) and to design the cross sections of the supporting steel structure.
Furthermore, the standard for determining wind load [
23] is focused on standardized building shapes and behavior only. European standards describe the determination of loads only on structures of selected geometric shapes. In the case of a more complex spatial solution of the object, it is necessary to approximate the object or appropriately divide it into sub-sections. However, the standard becomes an indispensable tool for determining the basic wind velocity depending on the location of the object and for calculating other wind current characteristics (terrain roughness, turbulence intensity, peak velocity pressure). Wind loading is often the critical case for lightweight structures, especially in the form of uplift. In the design process, the wind load is considered a static load defined by the multiplication of dynamic pressure and a pressure coefficient
Cp.
The wind loading of a hyperbolic paraboloid (also called hypar) tensile roofs is of great interest to many research groups around the world. The results of experiments carried out in a boundary layer wind tunnel in the case of rigid and flexible models of a tensile structure with a hypar roof were presented in the study [
24]; the authors concluded that the structural dynamics of a flexible roof is characterized by many natural frequencies that are very close to each other and have a significant participation mass ratio. Another study [
25] aimed to map the mean aerodynamics of hypar tensile roofs as a function of the surface curvature in the case of the most important wind orientations by using shape parameters (SP). The prototyping methodology for double-curved thin-shell wind tunnel models with integrated pressure sensors to facilitate experimental wind flow analysis on curved canopy structures was illustrated in [
26]. The results indicated that compared to conventional wind tunnel models, thin shell wind tunnel models produce more realistic wind pressure distributions over very thin canopy structures. The methodology can be easily adopted for various membrane or shell structures and allows the implementation of different materials, as long as the structure provides sufficient resistance to wind loads during a wind tunnel test.
In the present contribution, the numerical simulations of the wind tunnel in the software RWIND [
27] were performed to determine the pressure coefficients
Cp. The location and surroundings of the structure were classified according to the standard [
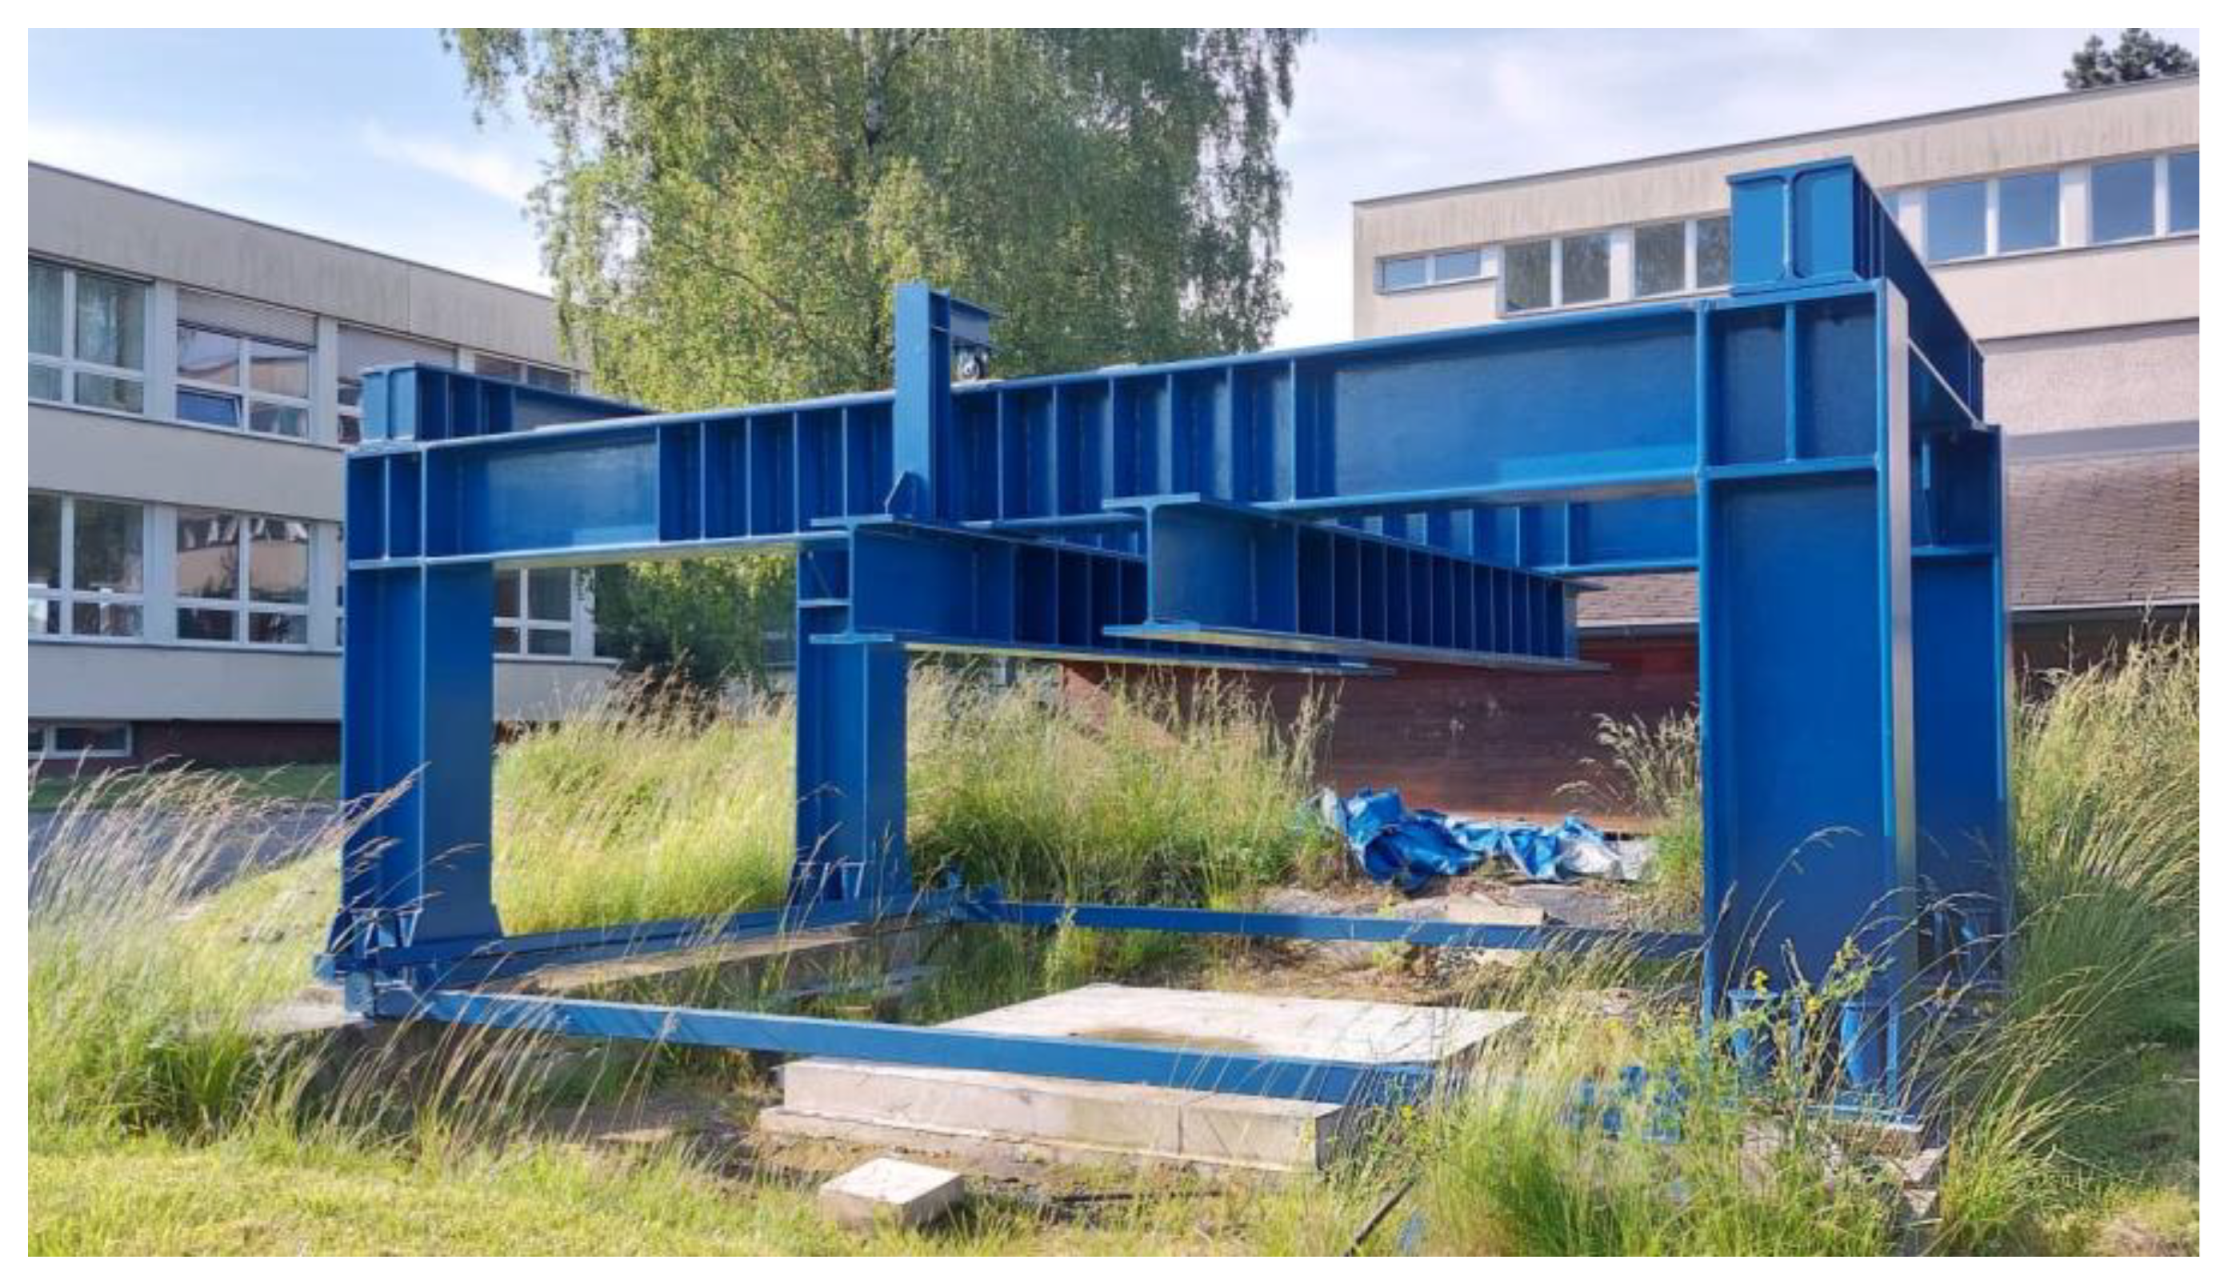
23]. The aim of this paper is to analyze the effects of wind flow in the case of a hypar tensile structure which is being designed as the roofing construction of the experimental testing device described in
Section 2. The model in RWIND was calibrated and benchmarked on the basis of the experiment performed and the Fluent modeling presented in [
25].
3. Numerical Model, Form—Finding Process
The visualizations of the membrane structure were used as input data for the numerical model in the RFEM software [
31] and its add-on module, RFEM Form—Finding [
13]. This tool allows users to calculate and optimize the shapes of members and surfaces under tension or compression using the linear force density method (FDM). Unlike the other methods, the FDM replaces the membrane with a cable mesh. However, the goal of every method is to find an equilibrium shape for the surface prestressed field [
32].
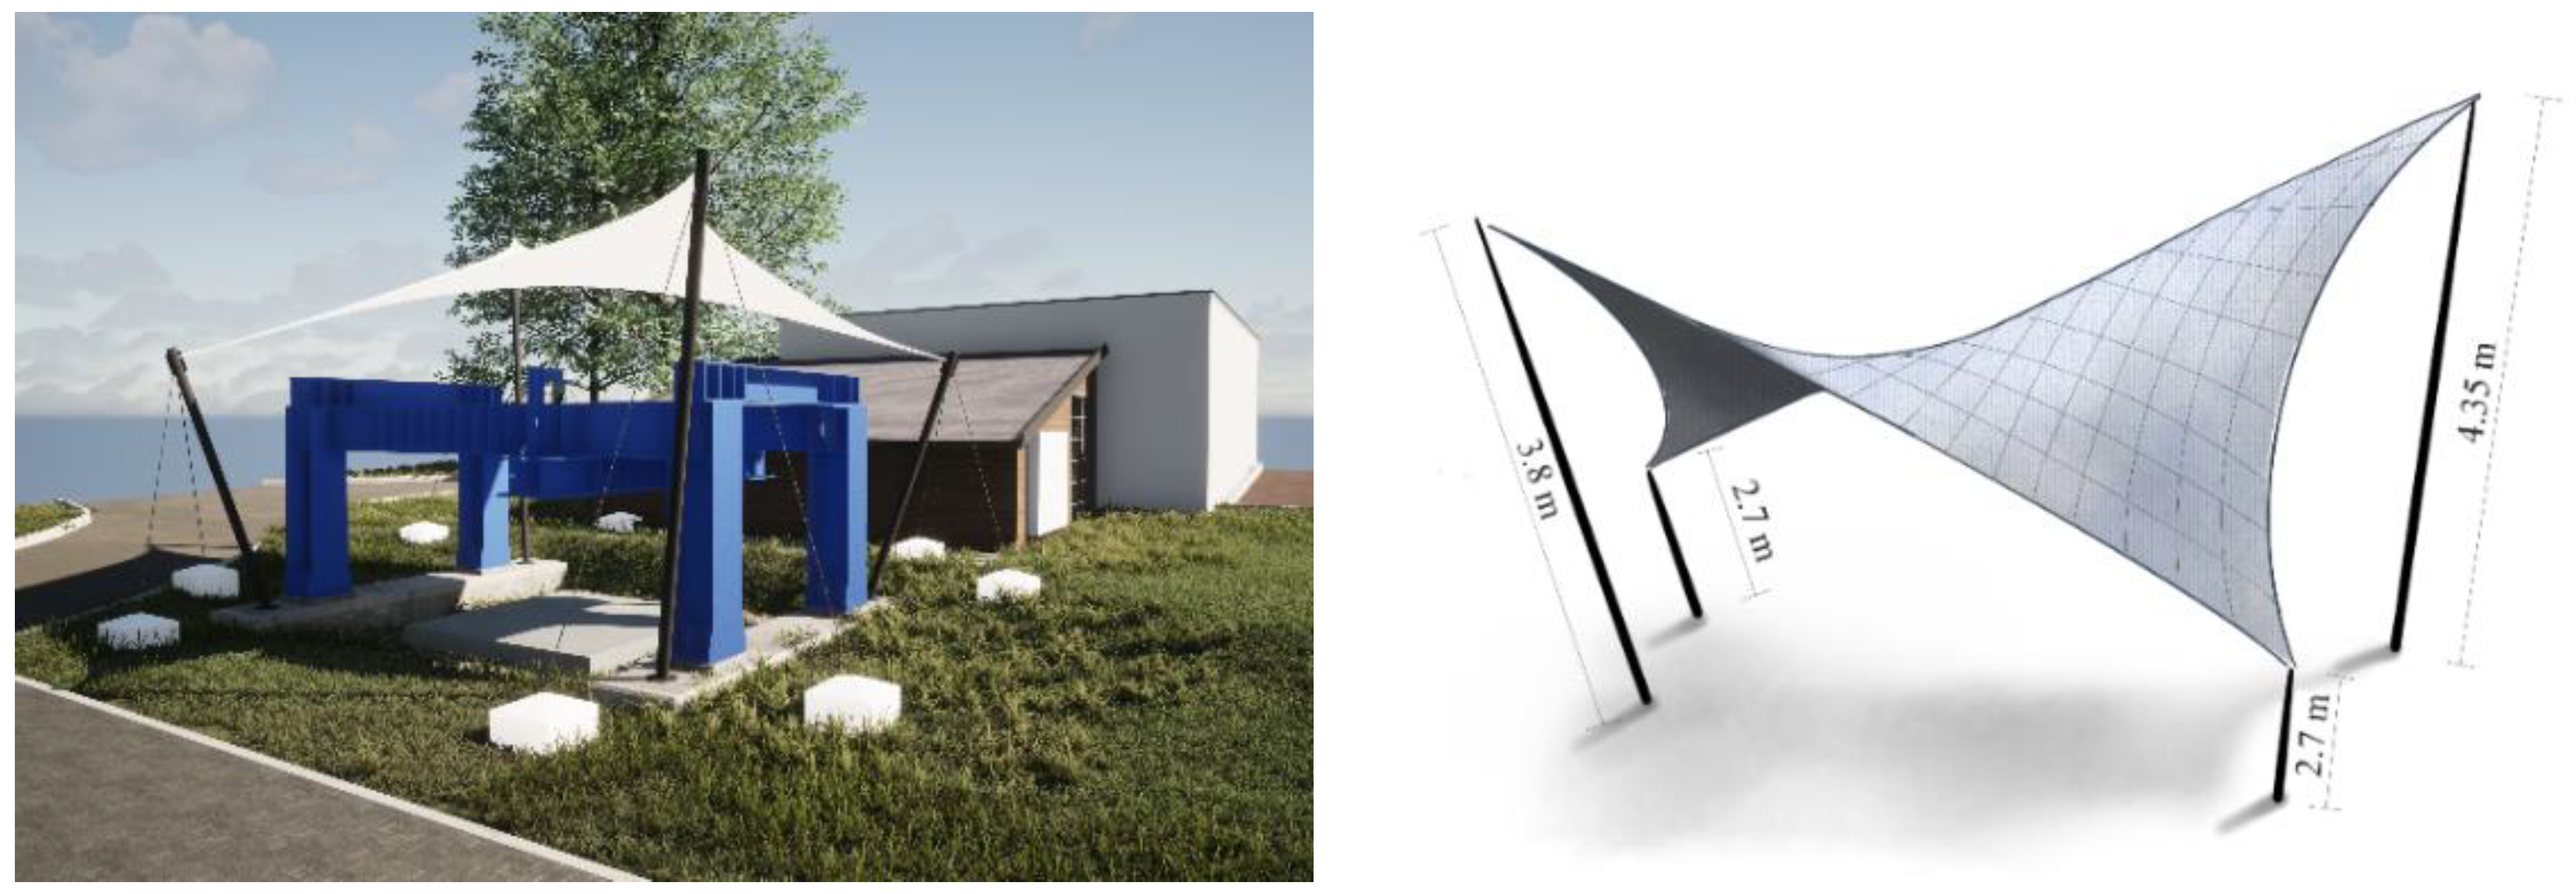
The analysis began with the formulation of a model of a tensile membrane hypar structure. To find the final shape of the structure, it was necessary to determine the boundary conditions: due to limited anchoring options, the existing foundation of the experimental facility was used to locate the columns, which are modeled as pin supports. Two prestressed rods (galvanized spiral ropes with an open structure and diameter of 12.2 mm) were inserted for pre-stressing the membrane fabric for every column. The value of preload typically ranges between 0.5–2 kN/m
2, but the value can reach up to 5 kN/m
2 for larger spans [
33]. For this type of structure and the textile material chosen (polyester fibers with a polyvinyl chloride coating (PES/PVC), type II according to [
18,
22]) the prestress value was determined as 1 kN/m
2 in both directions. The tensile modulus
E of the textile material is 708 kN/m in the warp and 774 kN/m in the weft direction, the shear modulus
G is 10,000 kN/m
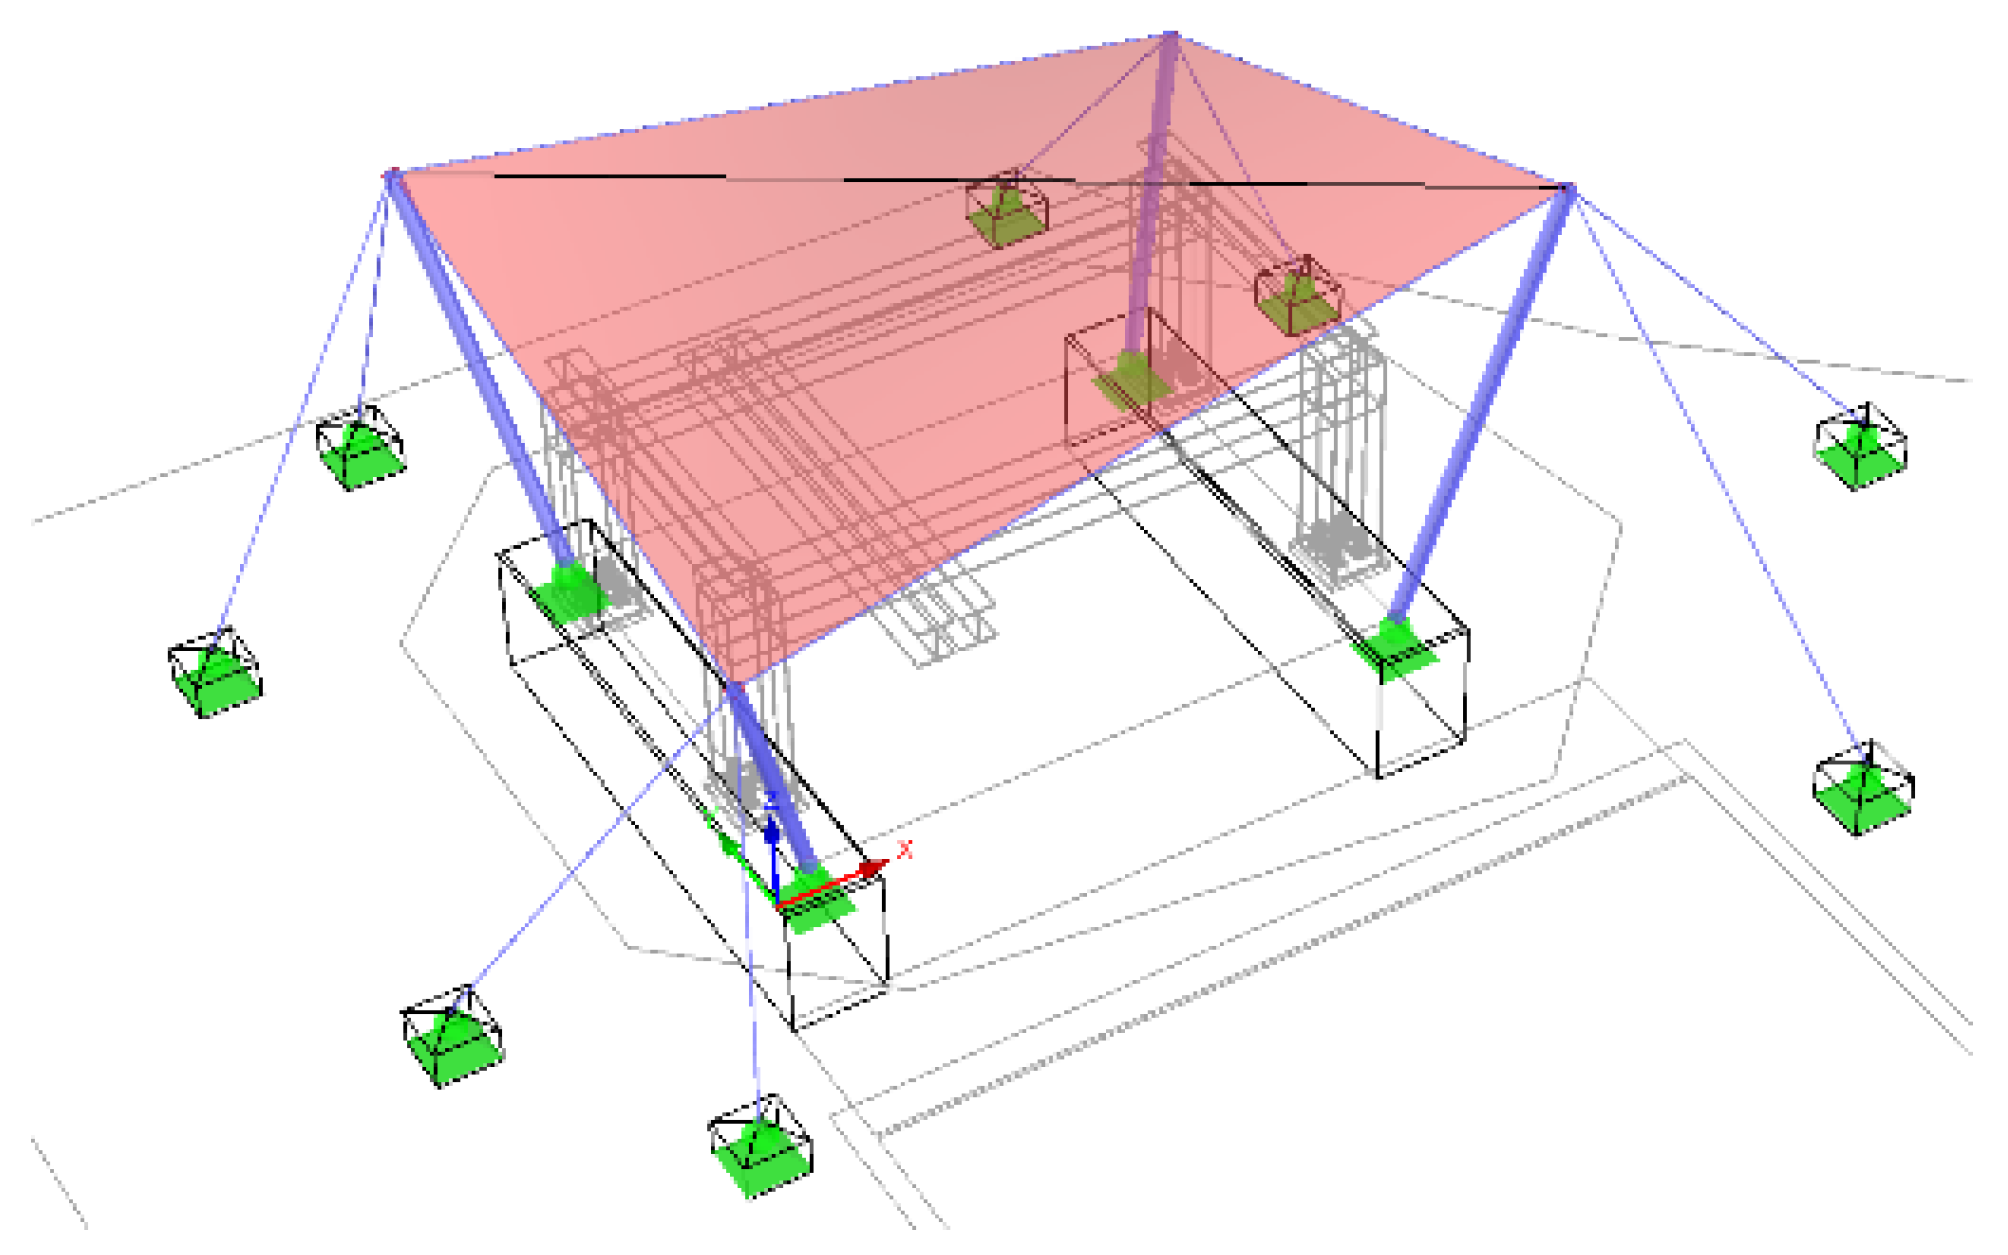
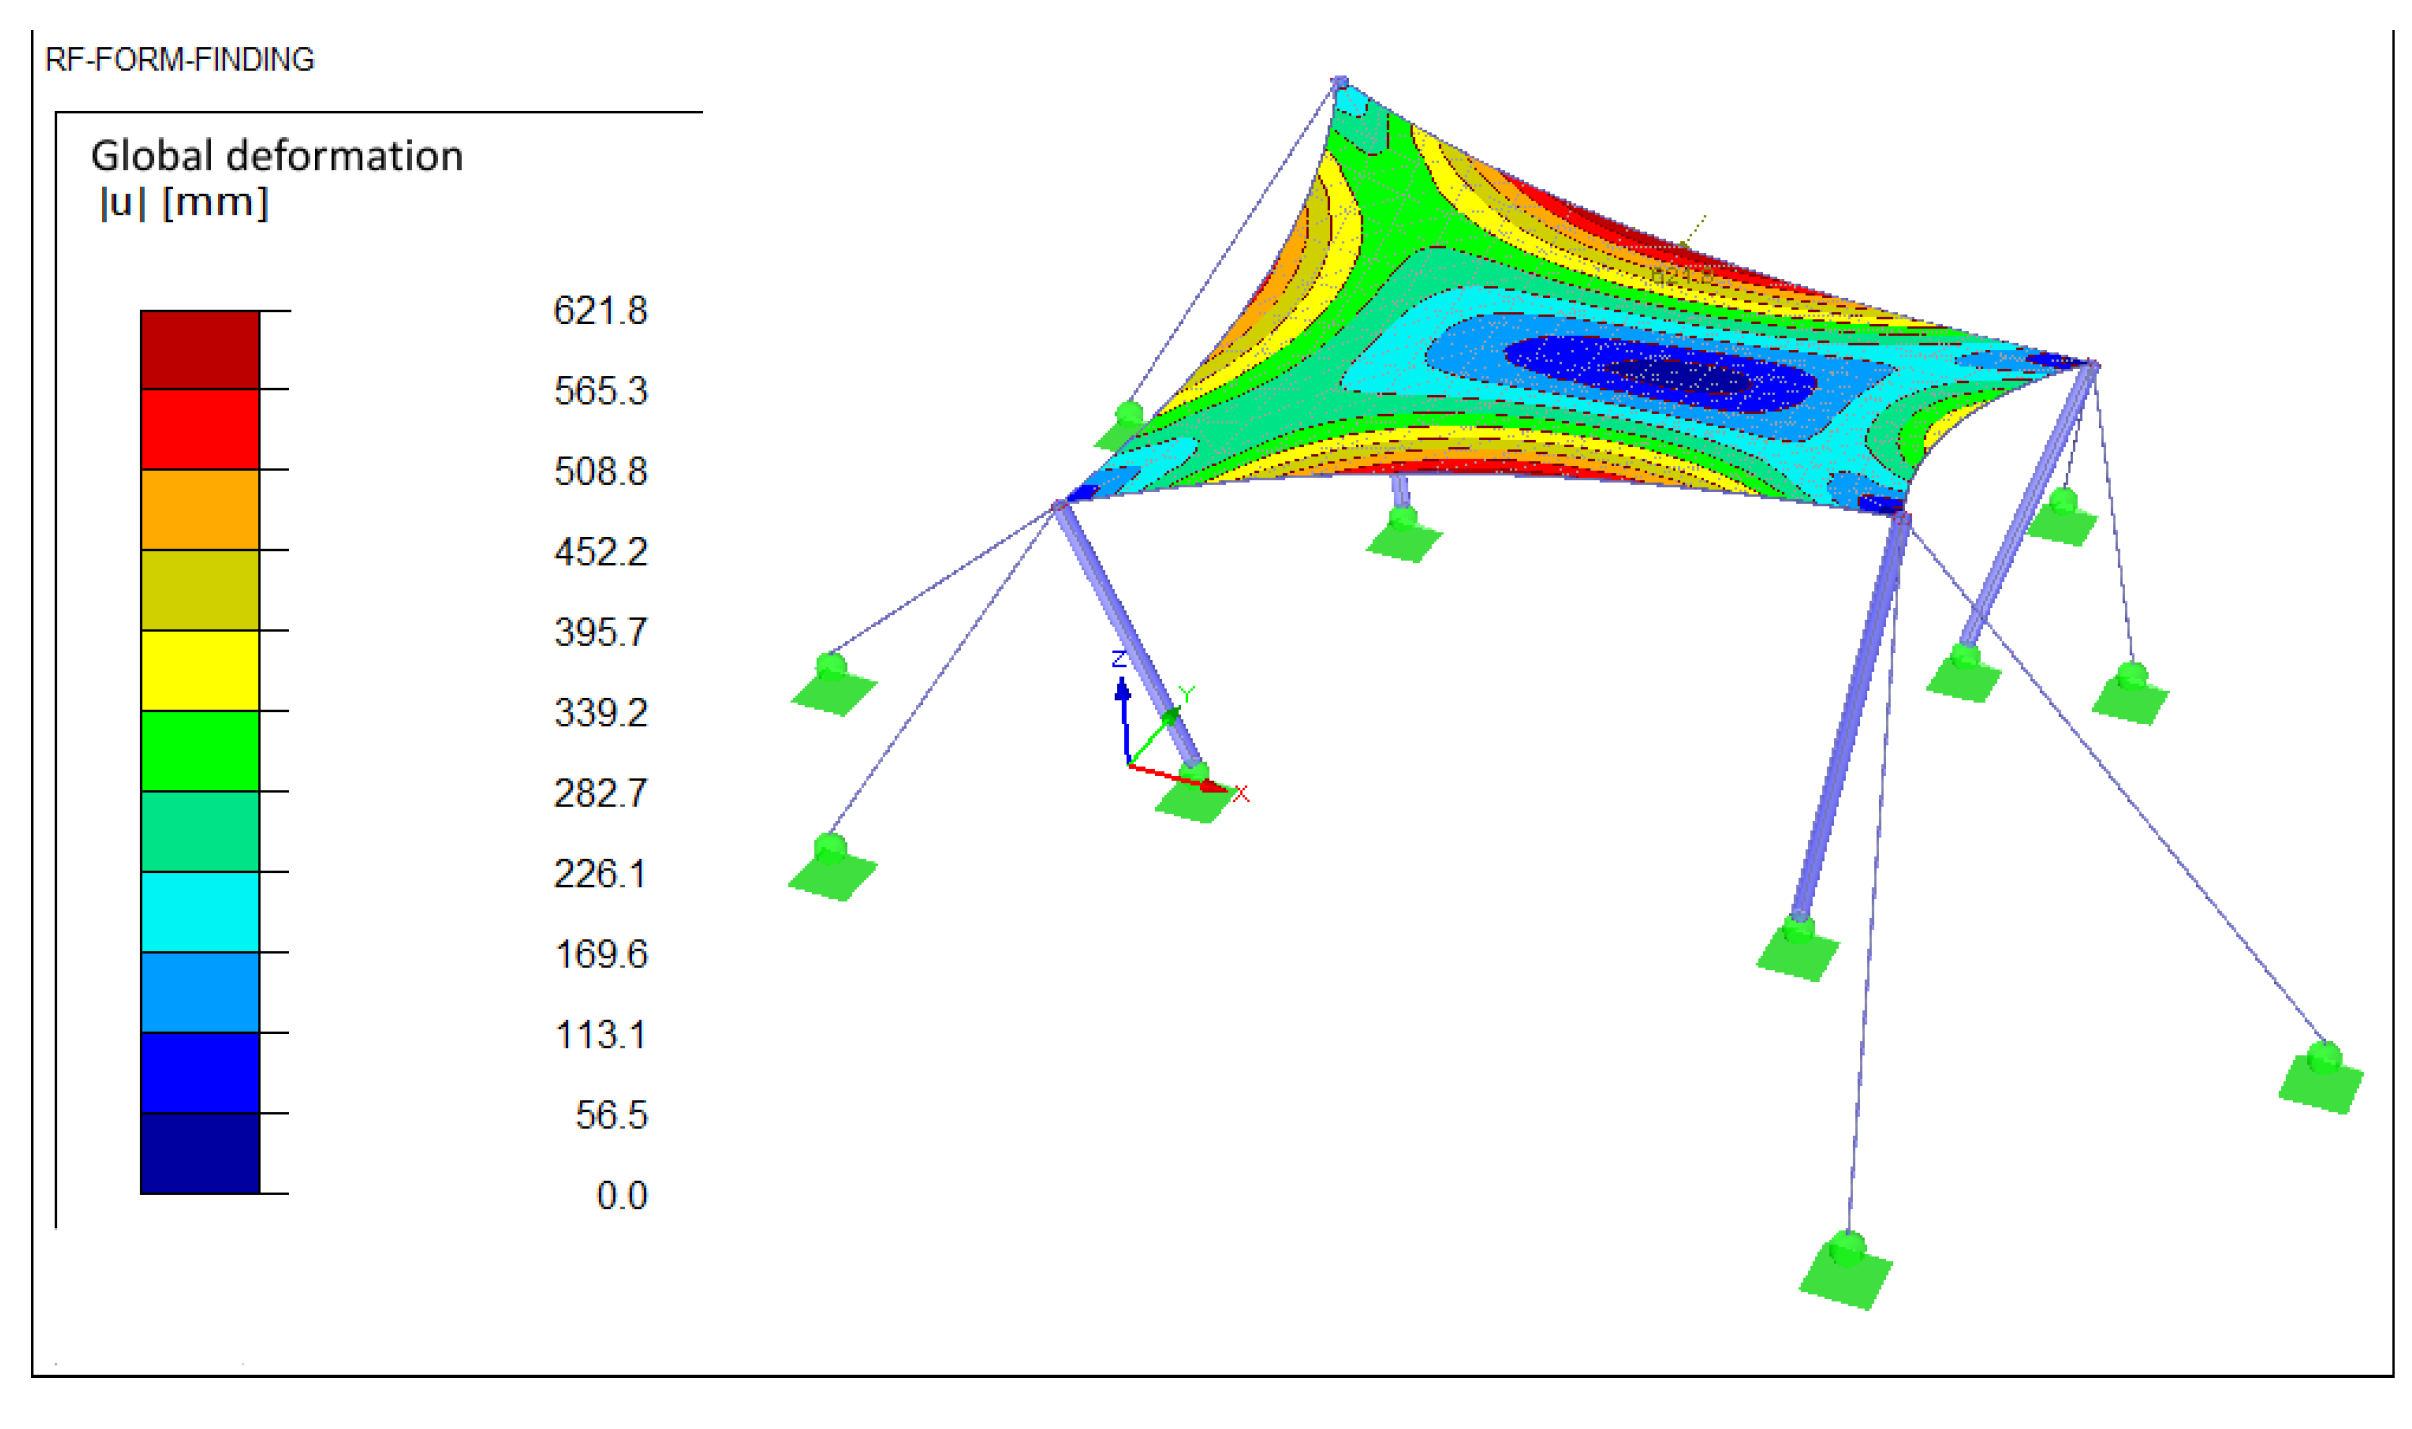
2, and the Poisson coefficient is 0.32 in the warp and 0.35 in the weft direction. The thickness of the membrane is 0.7 mm. Prestressed ropes are also inserted along the entire membrane fabric; the value of the relative slack of each rope was established at 10%. The model with the aforementioned boundary conditions can be seen in
Figure 3 and the form-found shape of the structure is given in
Figure 4. The structural analysis is then performed using the final membrane structure shape as the initial state. Each loading case is applied to the final shape of the structure.
4. Wind Load and CFD Simulation
Due to the irregular shapes of the tensile structure, the wind loads on the structures cannot usually be solved by the direct application of simple methods described in the Eurocode [
23]. The European Design Guide for Tensile Surface Structures [
18] tries to overcome these shortcomings and, in addition to general procedures, also provides pressure coefficient (
Cp) curves on selected membrane structure shapes. However, in the case of hypar roofing, it is possible to find these
Cp values only for the structure with the outer vertical roof. Therefore, in the case of the analysis of wind flow behavior in the vicinity of a hypar with an open floor plan, it is necessary to determine the effects of the flow experimentally or by means of numerical simulations.
Wind tunnel experiments allow the analysis of the effect of wind flow in laboratory conditions and provide results most similar to those obtained in the in situ situation. An example of a study of wind flow around a hypar can be found, for example, in the publication [
25]. However, these experiments are time-consuming and very expensive. The process of producing a prototype membrane for the execution of experiments [
26] is also challenging. Numerical simulations thus offer suitable possibilities for the analysis of wind flow and its influence on the membrane structure while maintaining lower costs. However, numerical simulations require a lot of computational time as well as better computer hardware.
Several types of commercial software are now available to perform computational fluid dynamics (CFD) simulations. The Dlubal RWIND [
34] software was chosen as a suitable tool also due to the use of its form-finding add-on module for defining the structure’s shape. The main reason why it was chosen is its ability to directly export the resulting load obtained by CFD simulations, to the model in the static software Dlubal RFEM [
31]. The Dlubal RWIND software program [
27] is one of the standalone programs that was developed in collaboration with Dlubal Software, PC progress, and CFD support. The numerical solver is a steady-state solver for incompressible turbulent flow that uses the SIMPLE (Semi-Implicit Method for Pressure Linked Equations) algorithm. The CFD simulation results in a pressure region in the building envelope and a three-dimensional wind velocity field [
35]. The pressure region is also used to calculate force loads. In this software, the Reynolds-averaged Navier–Stokes equations (RANS) [
36] are used to solve the nonlinear turbulent flow problem. There are two equation models that solve two separate transport equations for two independent turbulent quantities, which are related to the time scale and turbulence length. It is possible to choose between two turbulence models 𝐾-𝜔 and 𝐾-𝜀, where 𝐾 is the kinetic energy, 𝜔 is the reciprocal turbulent time scale and 𝜀 is the turbulent dissipation rate [
36].
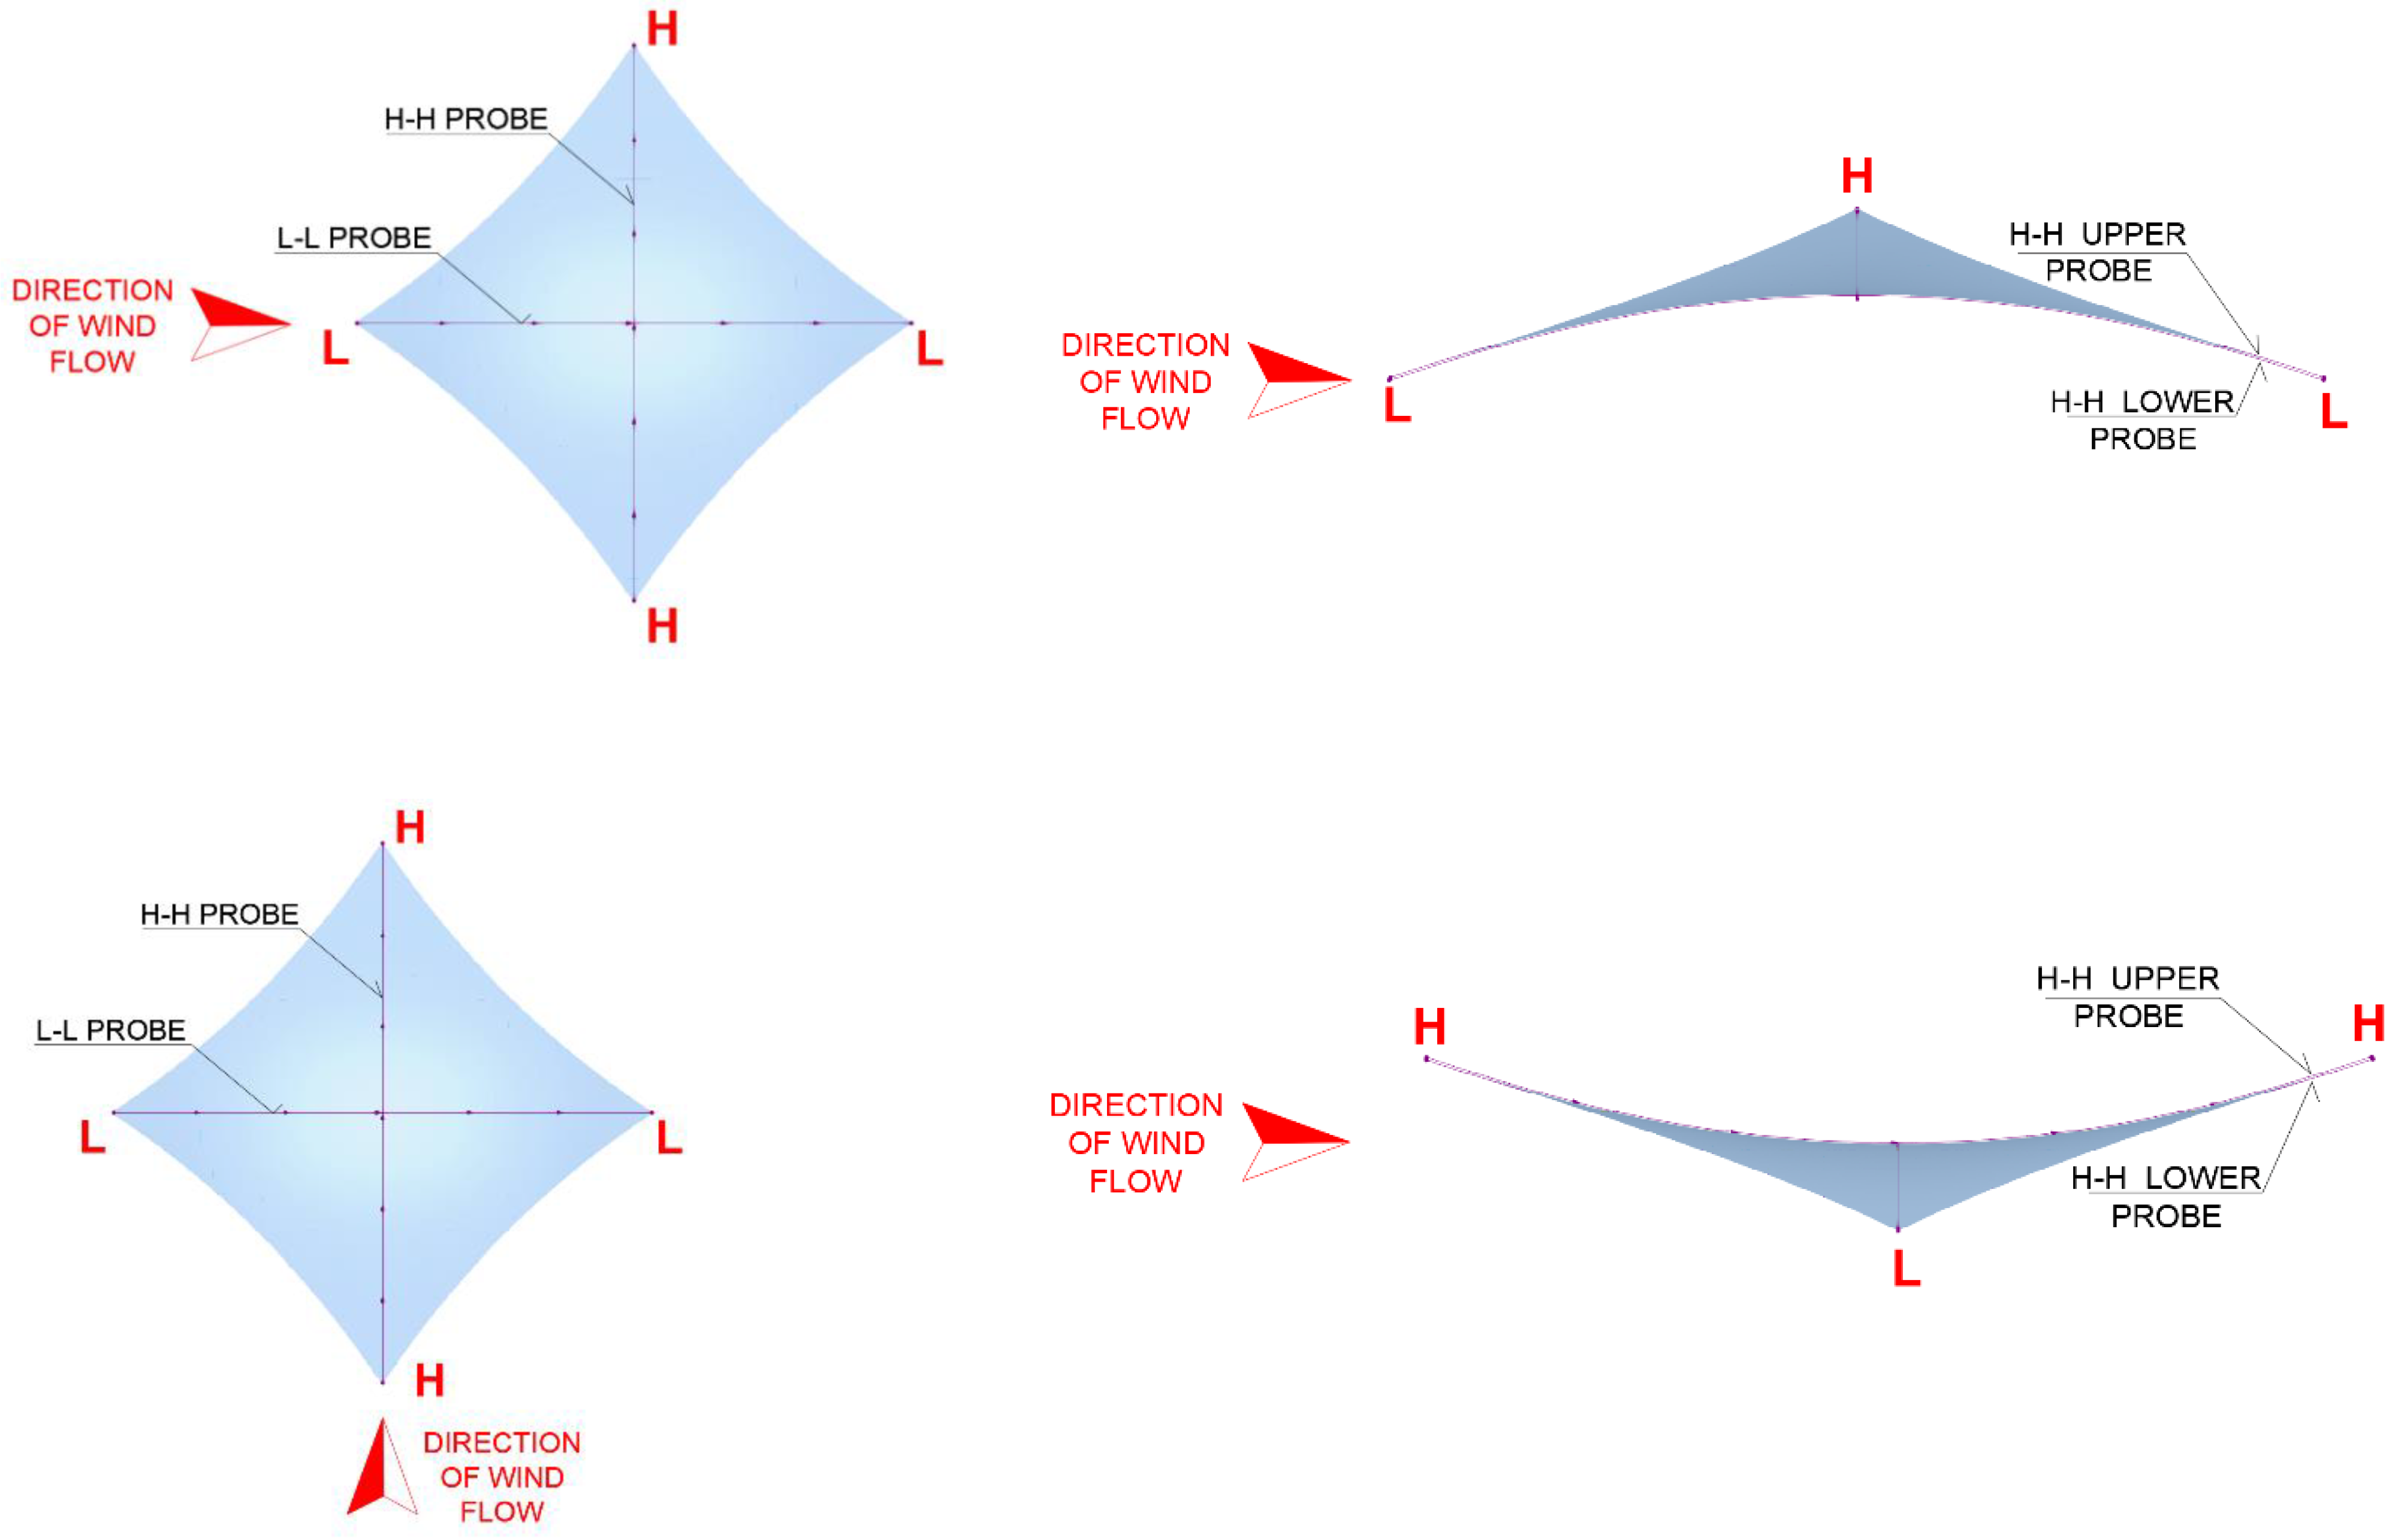
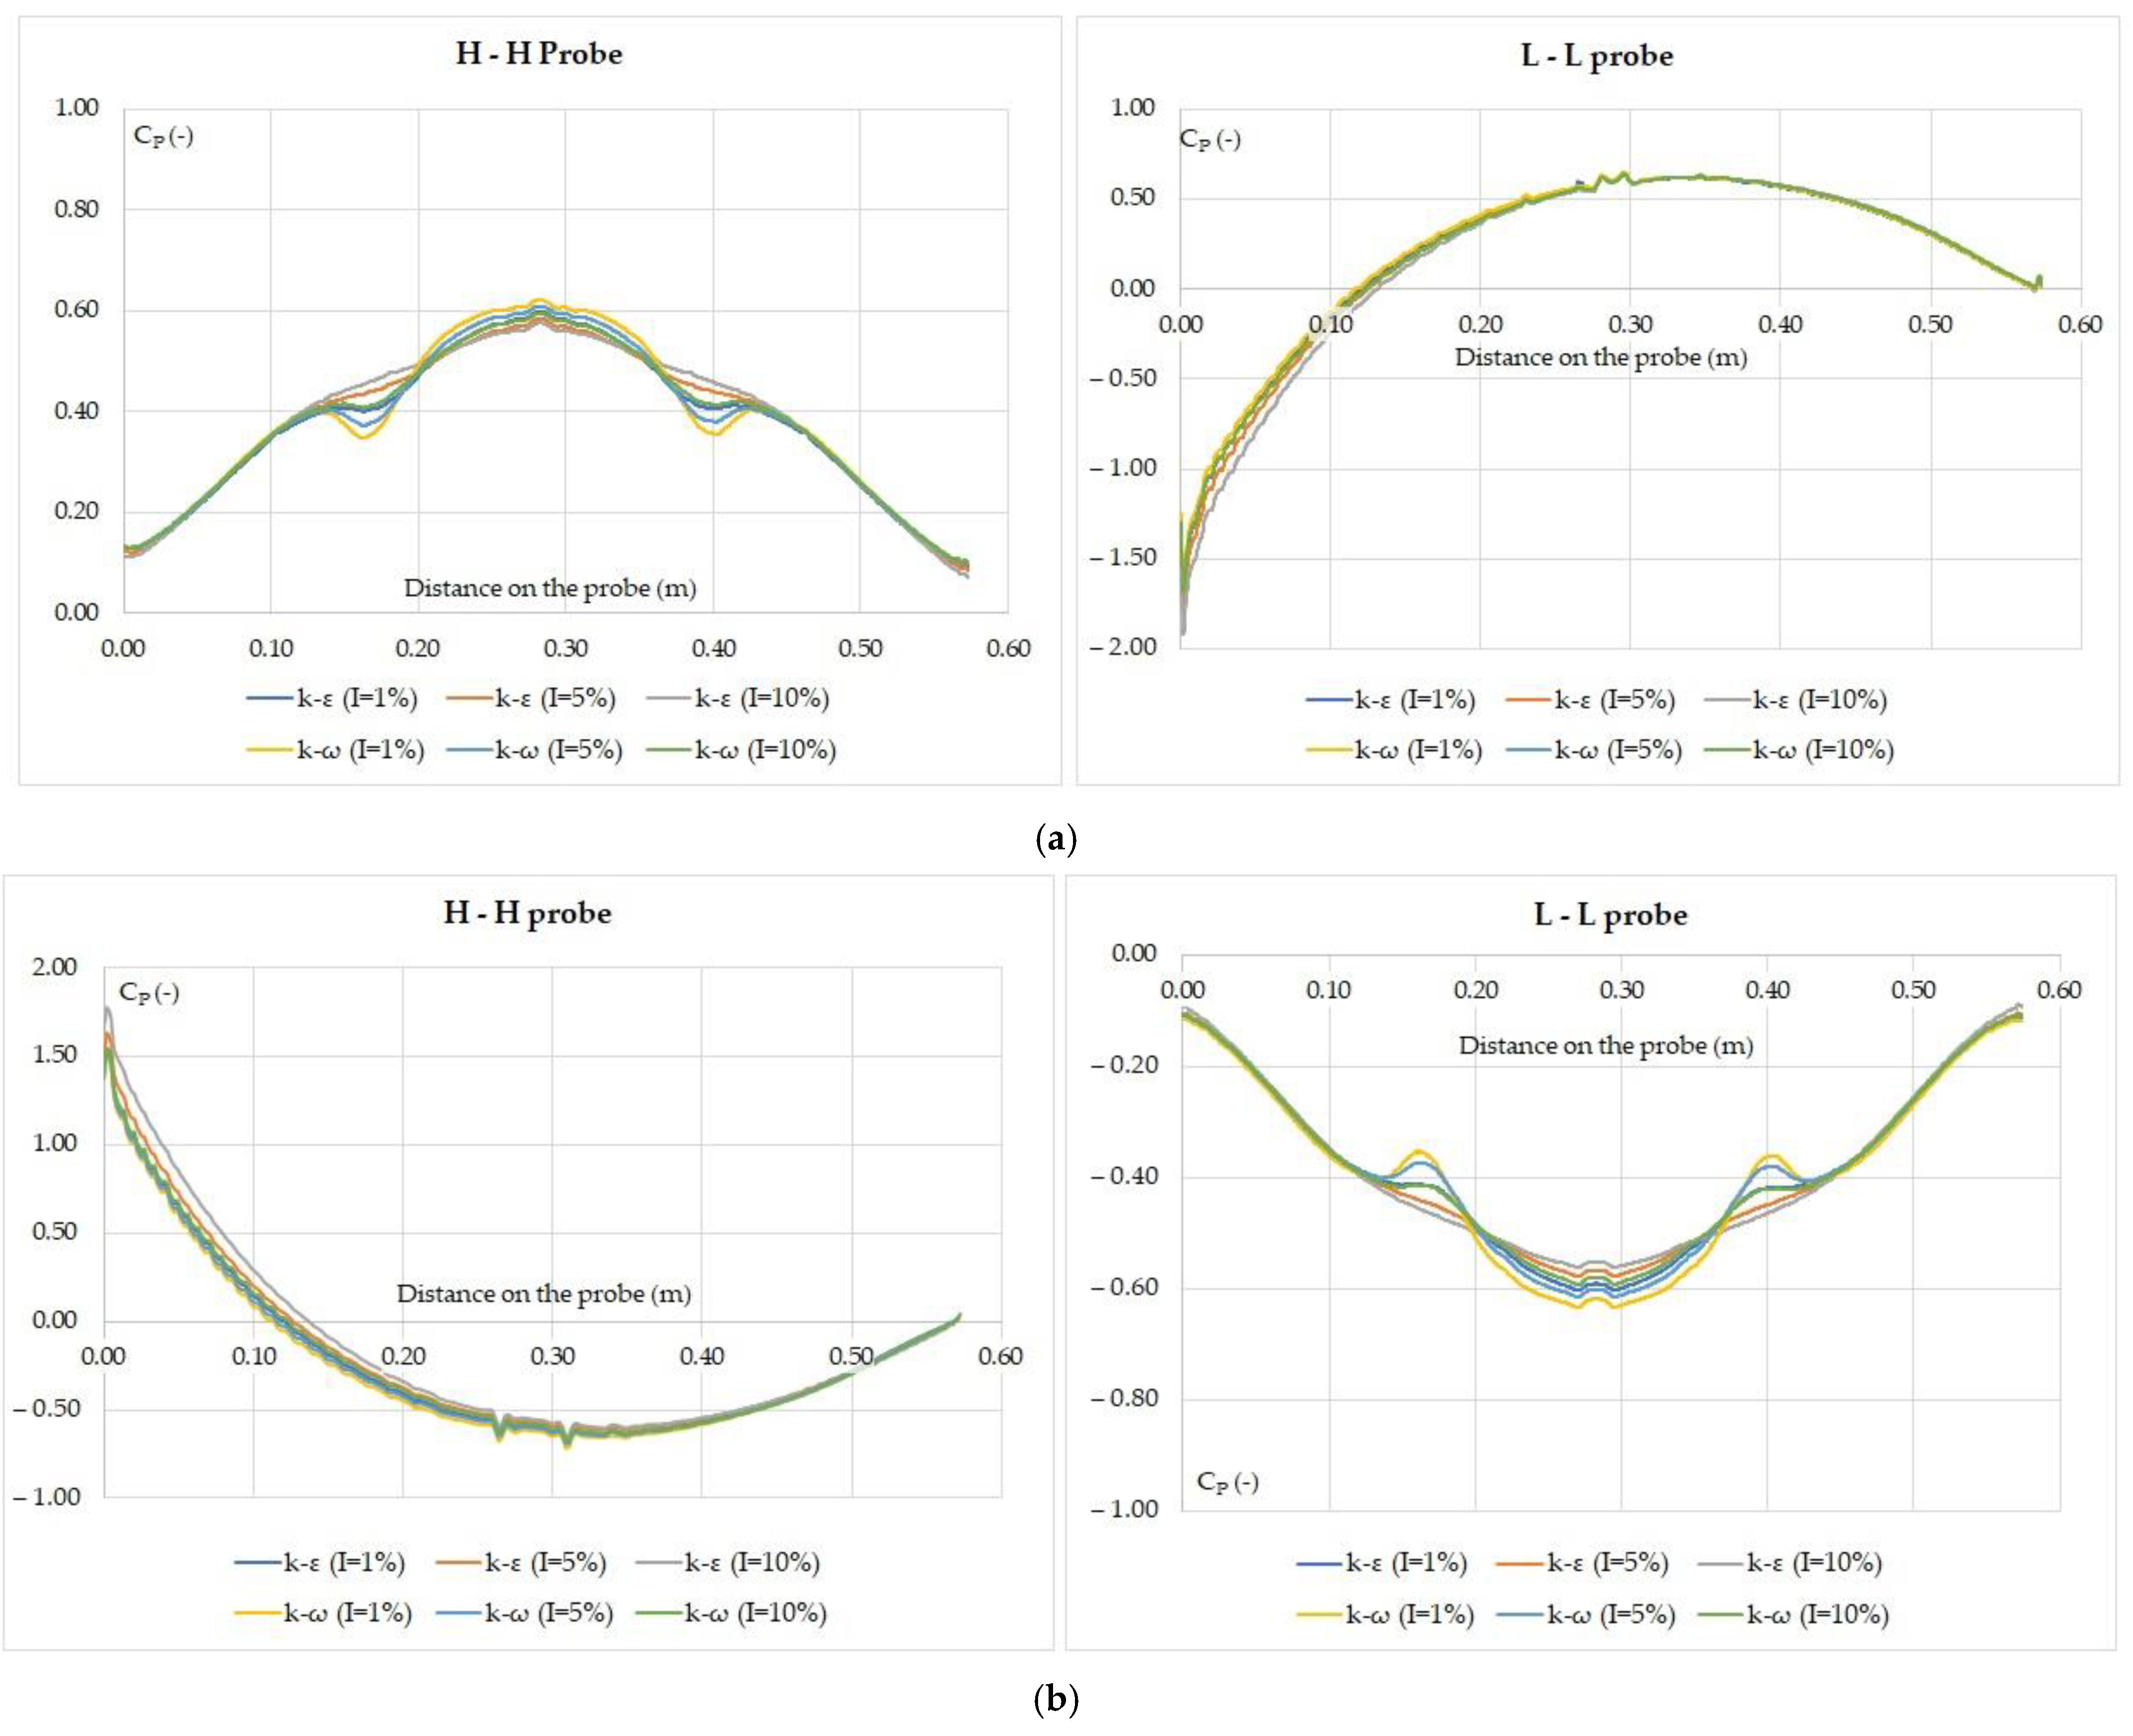
The calibration of the model in RWIND was carried out based on the results described in [
25], where the authors analyzed the results from wind tunnel experiments to calibrate and benchmark the numerical model using CFD RANS simulation with ANSYS Fluent. The same hypar structure with a floor plan dimension of 0.4 m × 0.4 m and SP 0.18 was modeled in RFEM and different turbulence models 𝐾-𝜔 and 𝐾-𝜀 were used to find the best matching results described by the graphs of mean
Cp coefficient along the planes of the hypar [
25] (see
Figure 5 and
Figure 6).
The creation of a numerical model to perform the CFD simulations was completed in RFEM software [
31]. The description of model creation is described in
Section 3. The model prepared in this way can be imported directly into RWIND [
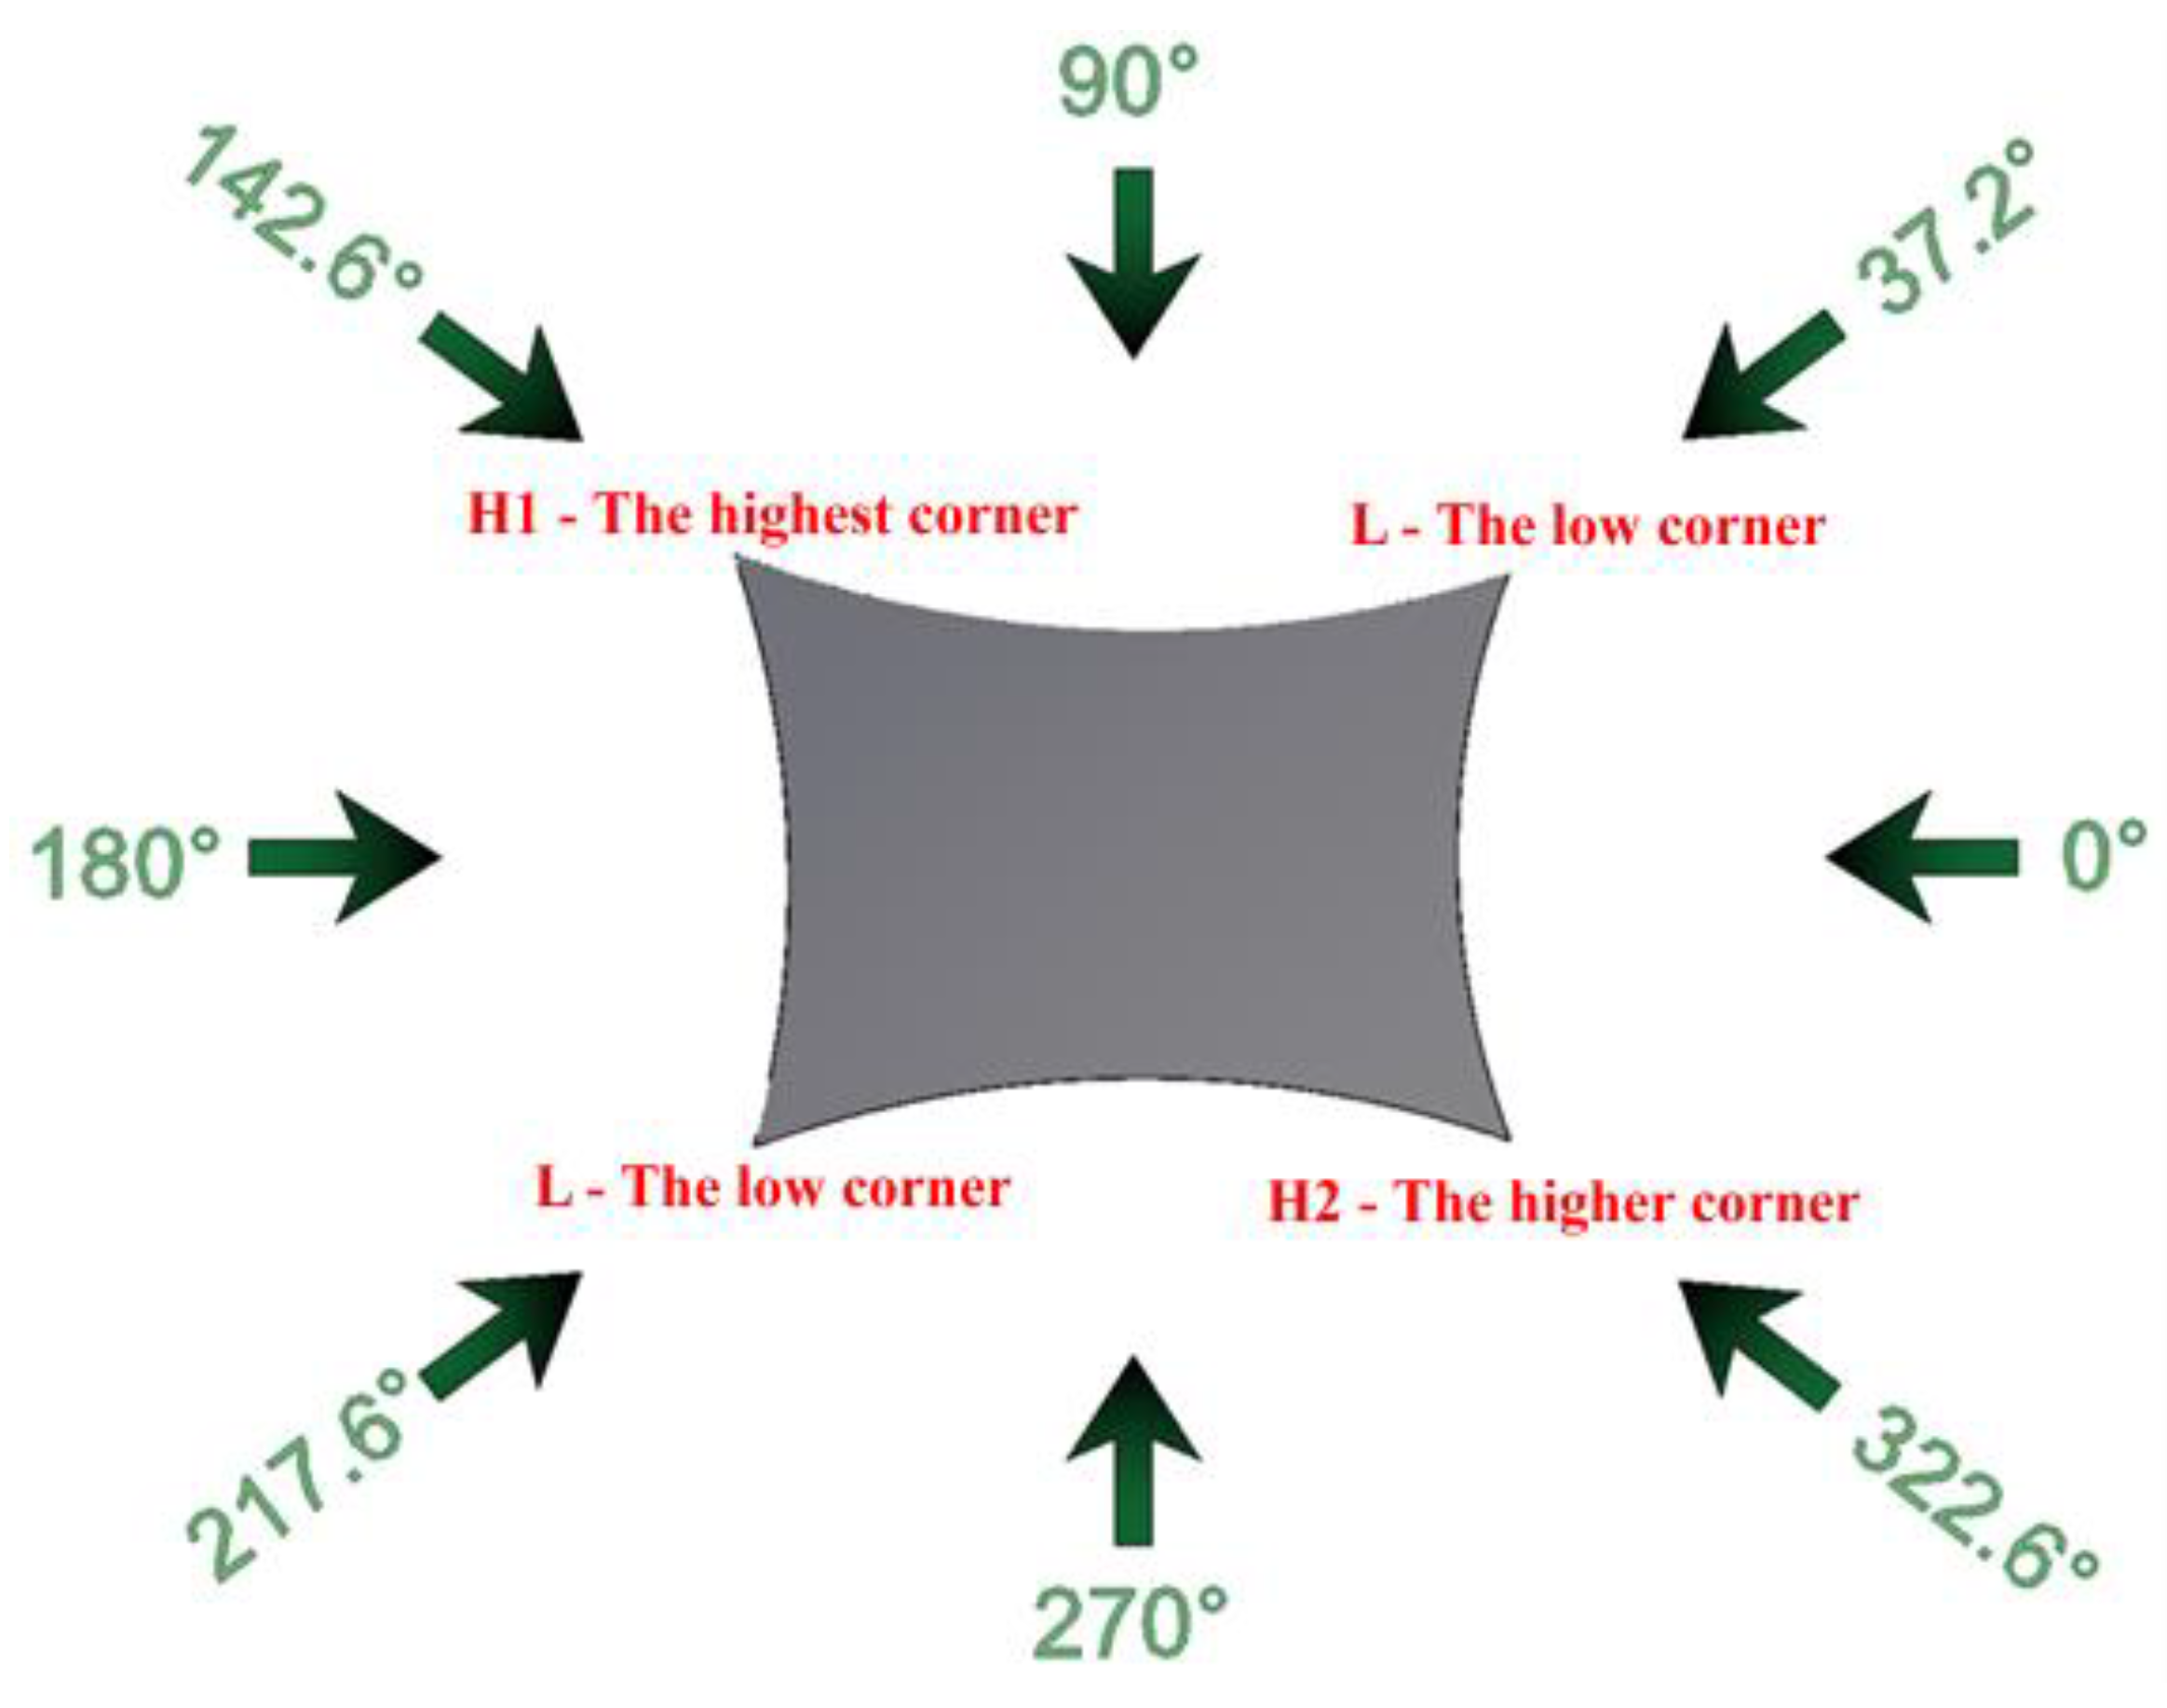
27]. Only the effect of wind flow was analyzed because it is currently not possible to import the deformed state of the structure by snow load into RWIND software. In the import phase, the model was simplified: only the surface membrane and steel columns were chosen for import, and, for simplification, the prestressing anchor ropes were omitted. The surrounding buildings were not modeled in RWIND for this initial wind flow simulation. As has already been mentioned, the advantage of performing simulations in RWIND is the direct export of the resulting effects of wind flow as load cases to RFEM. A total of eight load cases were determined for the analyzed tensile structure. Each of these load cases corresponds to one direction of wind flow. The wind flow in the direction of 0°, 37.2°, 90°, 142.6°, 180°, 217.6°, 270°, and 322.6° was considered for the simulation (see
Figure 7). The simulation settings described below were the same for every direction. These directions were chosen so that the effect of the wind on the membrane structure can be observed when the wind flow is towards the corner. The remaining directions then add information about the wind behavior on the structure when the wind is flowing perpendicular to the sides of the sail.
To perform the simulation, the software must correctly characterize the wind current. The determination is based on the European standard [
23]. It specifies constant values for kinematic viscosities of 1.5
10
−5 m
2/s and air density ρ of 1.25 kg/m
3. However, the inlet velocity
v(z), which is a function of the height above the ground, is not considered constant in the simulation. The following formula is given for its determination:
where
qp(z) is peak velocity pressure. The calculation procedure is described in detail in the standard [
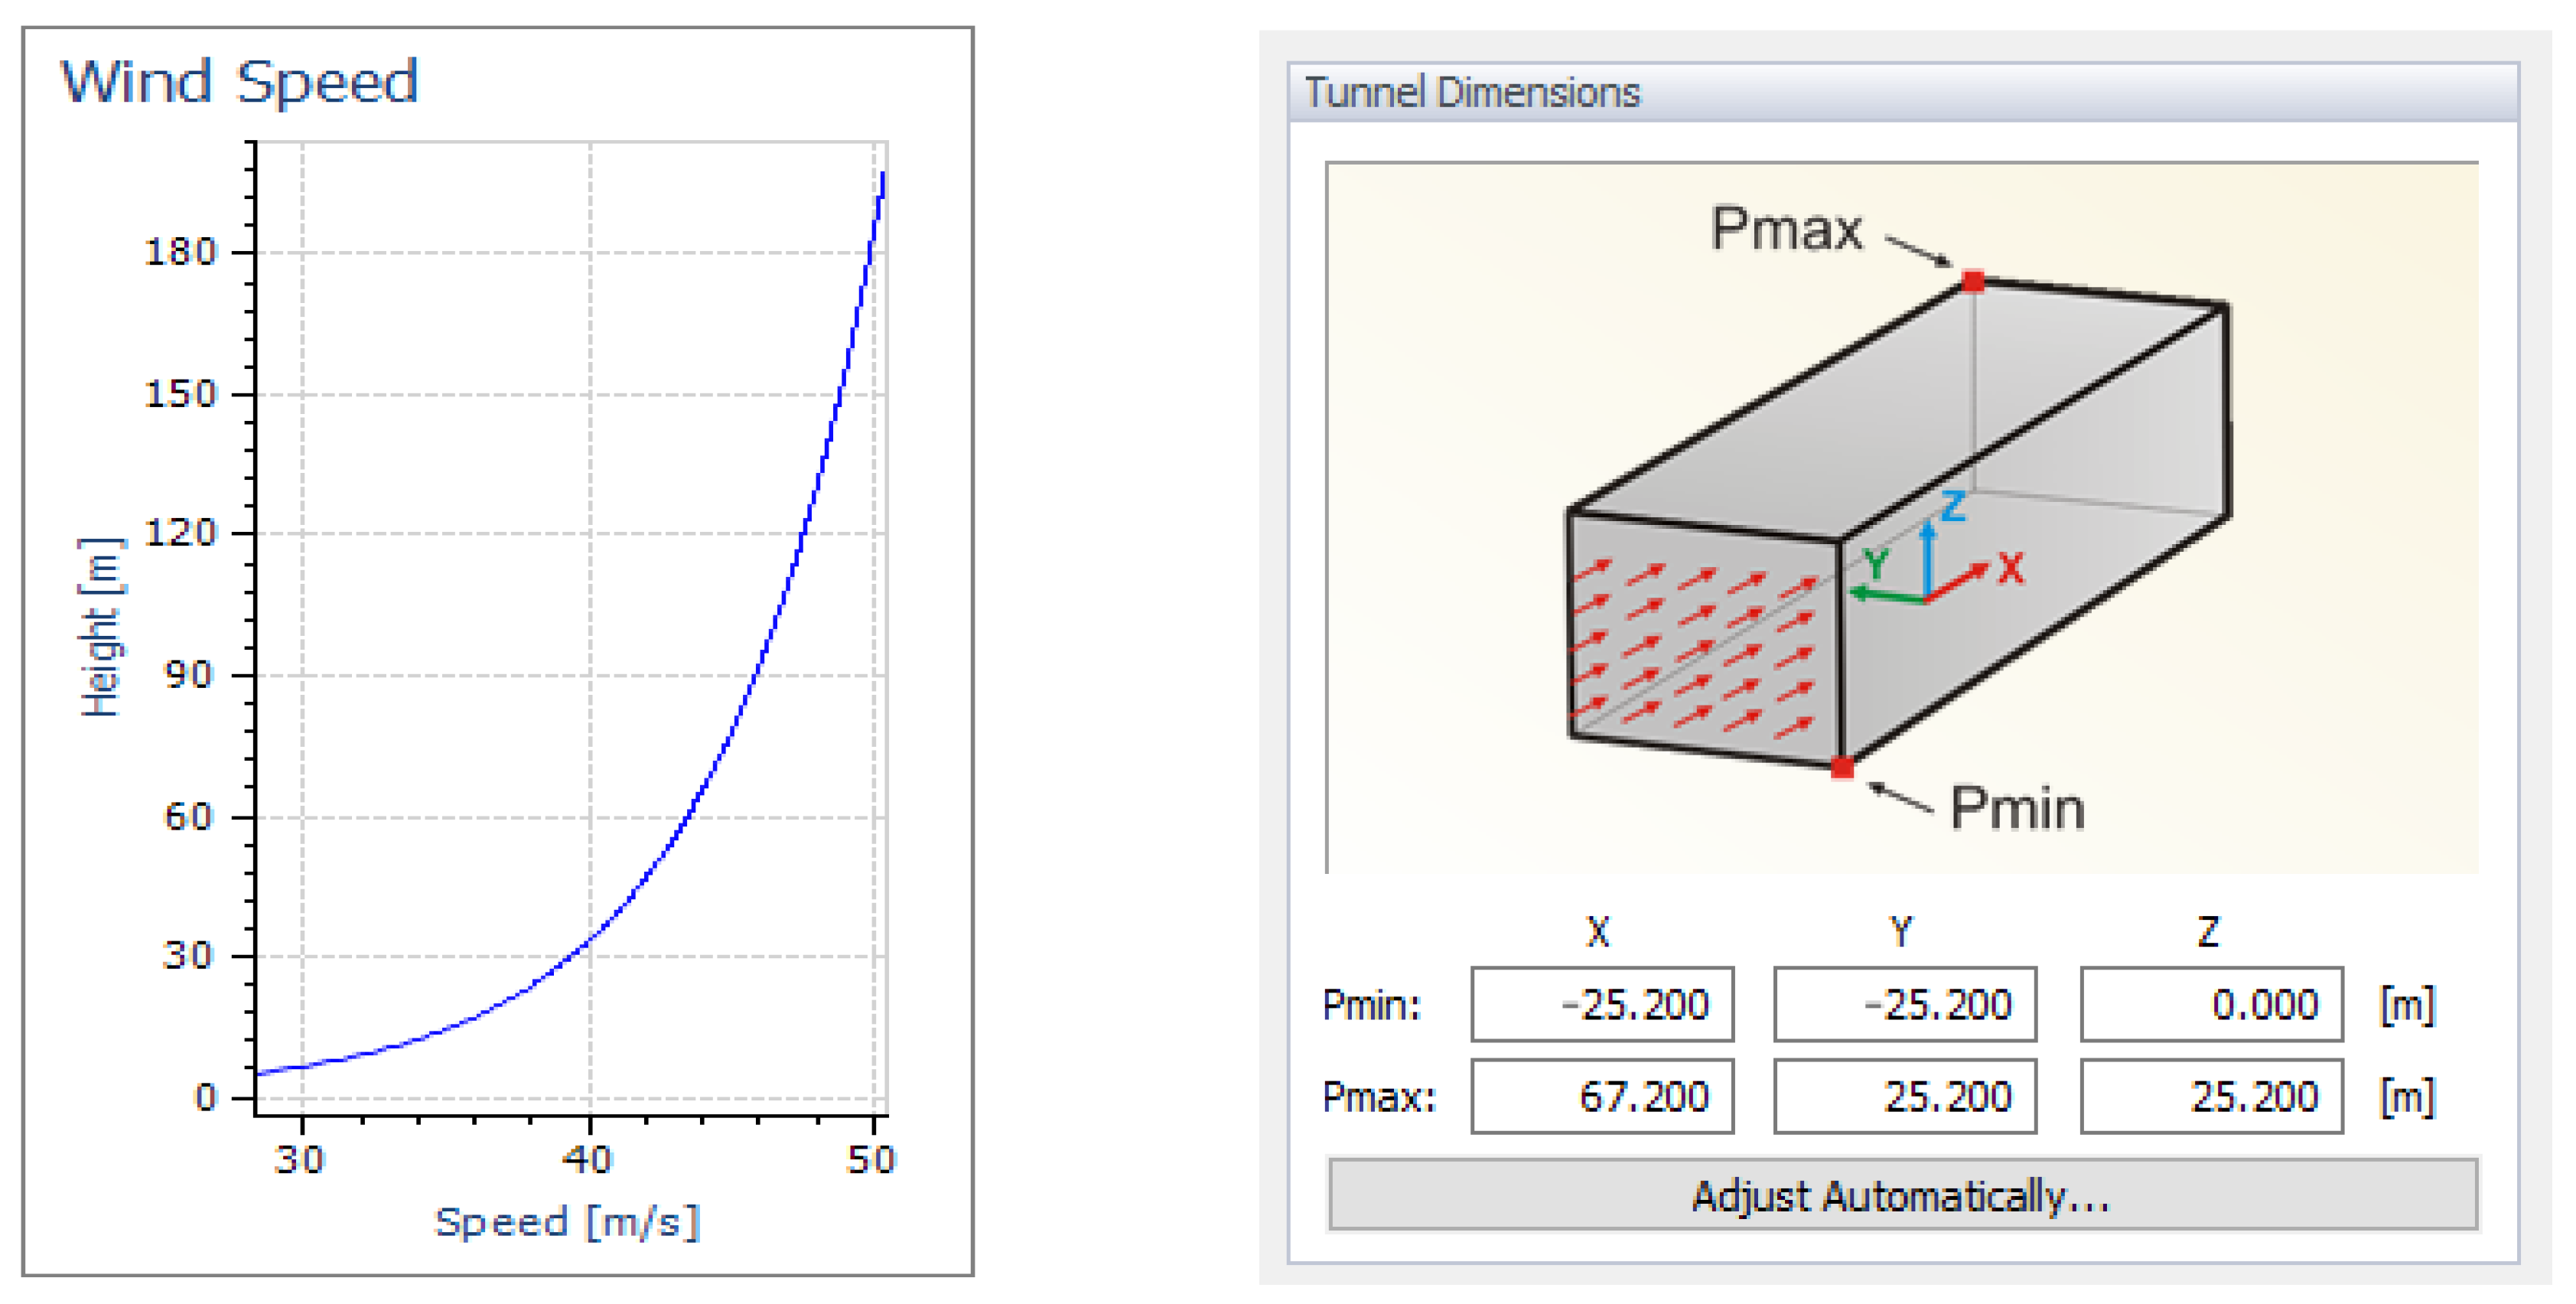
23]. The size and course of peak velocity pressure are influenced by two factors—object location to define the wind zone and basic wind velocity
vb,0, and object surroundings to define the terrain category. In this case, the construction is located in Ostrava, Czech Republic, which corresponds to wind zone II (
vb,0 = 25 m/s) and terrain category III. Based on this information, the course of the inlet velocity
v(z) was created to a height of 200 m (according to the standard [
23]), see
Figure 8. The values of the inlet velocity at each point of the structure’s grid were determined depending on the specific height of the point. Another essential part of the numerical simulation is setting the turbulence intensity parameter. Based on the numerical simulations carried out to study the effect of turbulence intensity and the choice of turbulent model, the most suitable setup was chosen as the one where the turbulence intensity
Iv = 1% and the turbulent model 𝐾-𝜀 are considered. This setup is the most consistent with the results obtained in the experimental wind tunnel tests published in [
25]. The dimensions of the generated wind tunnel were determined based on the recommendations in the article [
37].
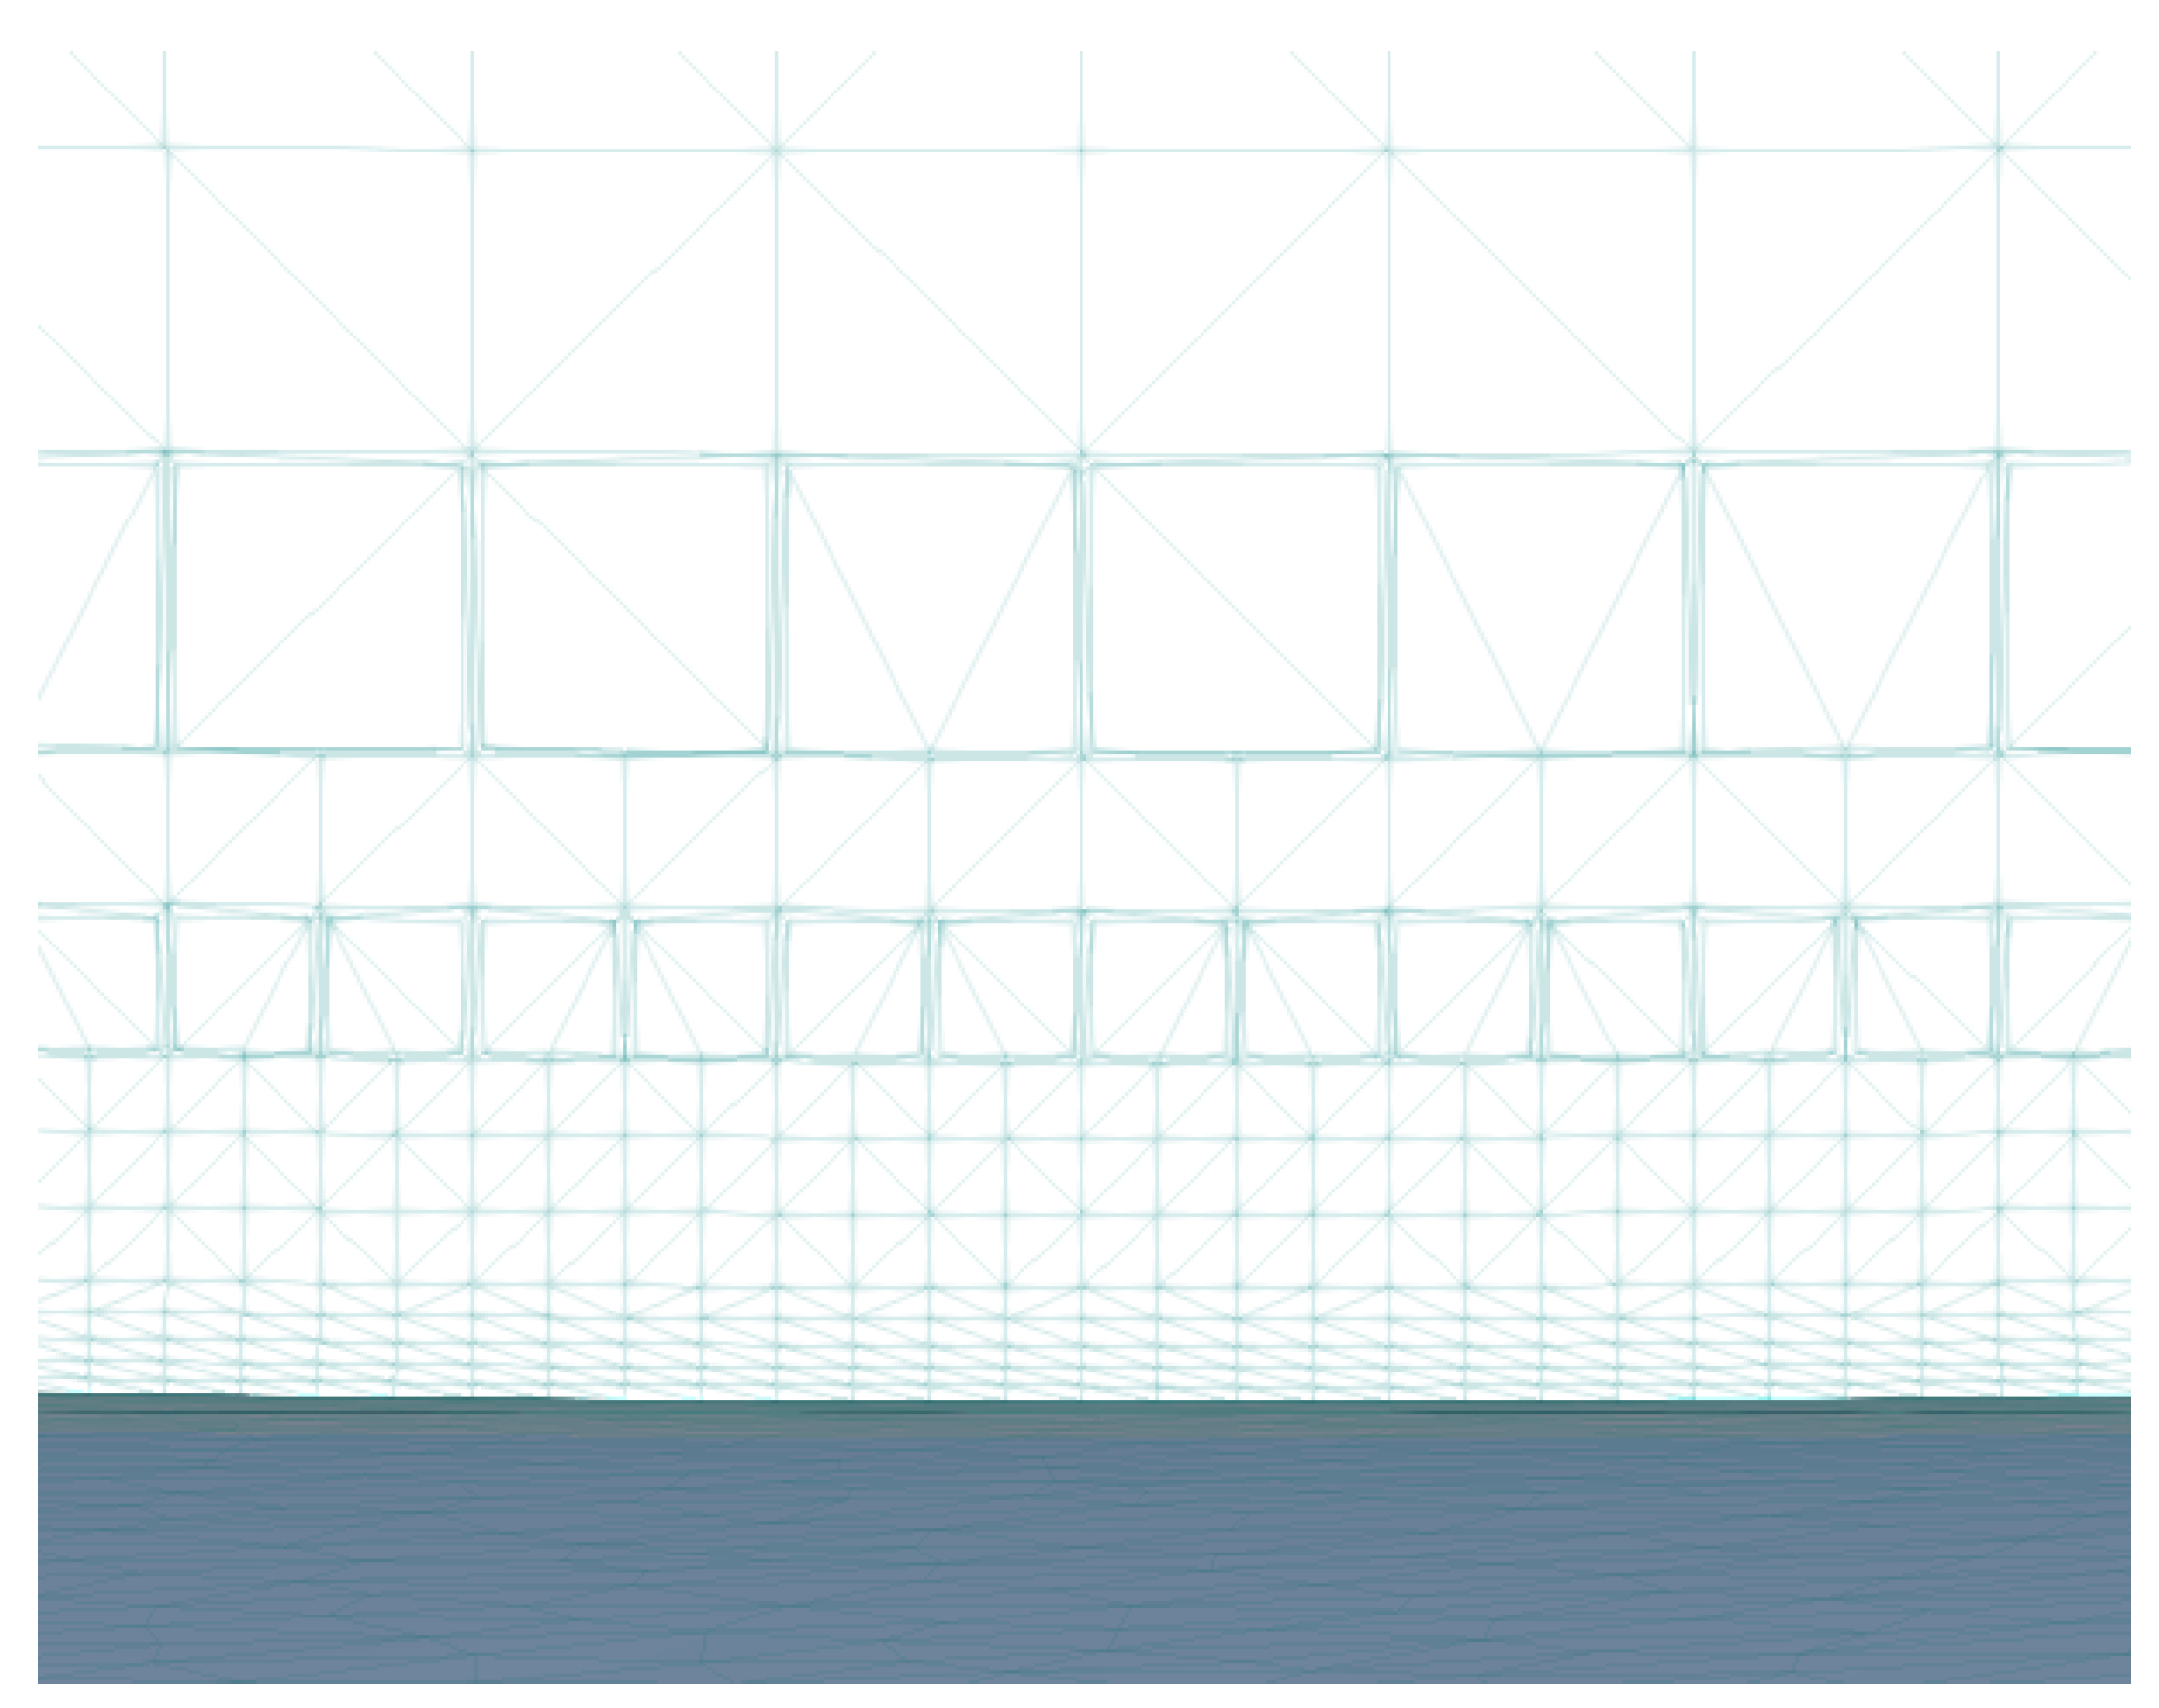
After the characterization of the wind flow, it is necessary to specify the mesh and set the solver. The RWIND software defines the boundary conditions of the model using a triangular mesh element. The creation of this mesh must be correct, as its quality directly affects the simulation. In order to create a correct mesh, the software has also the option of using a simplified model. The function of the simplified model is to remove negligible details from the original model, which could cause a worse convergence of the solver. The simplified model represents a special mesh “shrink-wrapping” of the original model [
35]. The user has the option to adjust these simplifications by using the level of detail and increasing or decreasing the density of the mesh elements in percentages. The maximum level of detail and mesh density was set to 75% for this model. Based on the settings of these parameters, the software generates a mesh. An example of the generated triangular mesh can be seen in
Figure 9, where the change in the element size depending on the distance from the model can be seen as well. There were generated approximately 6 to 15 million finite elements, the exact number of finite elements depends on the flow direction, i.e., the rotation of the model in the wind tunnel. Then, the results are recalculated to the original model by RWIND. The only available solver called openFOAM with a fixed maximum number of 6,000 iterations and a convergence criterion (P-residual) of 0.001 was used for the calculation. The automatically generated wind tunnel was adjusted to the dimensions shown in
Figure 7. The distances are related to the coordinate origin located in the center of the floor plan at the height of the column bases.
5. Results and Discussion
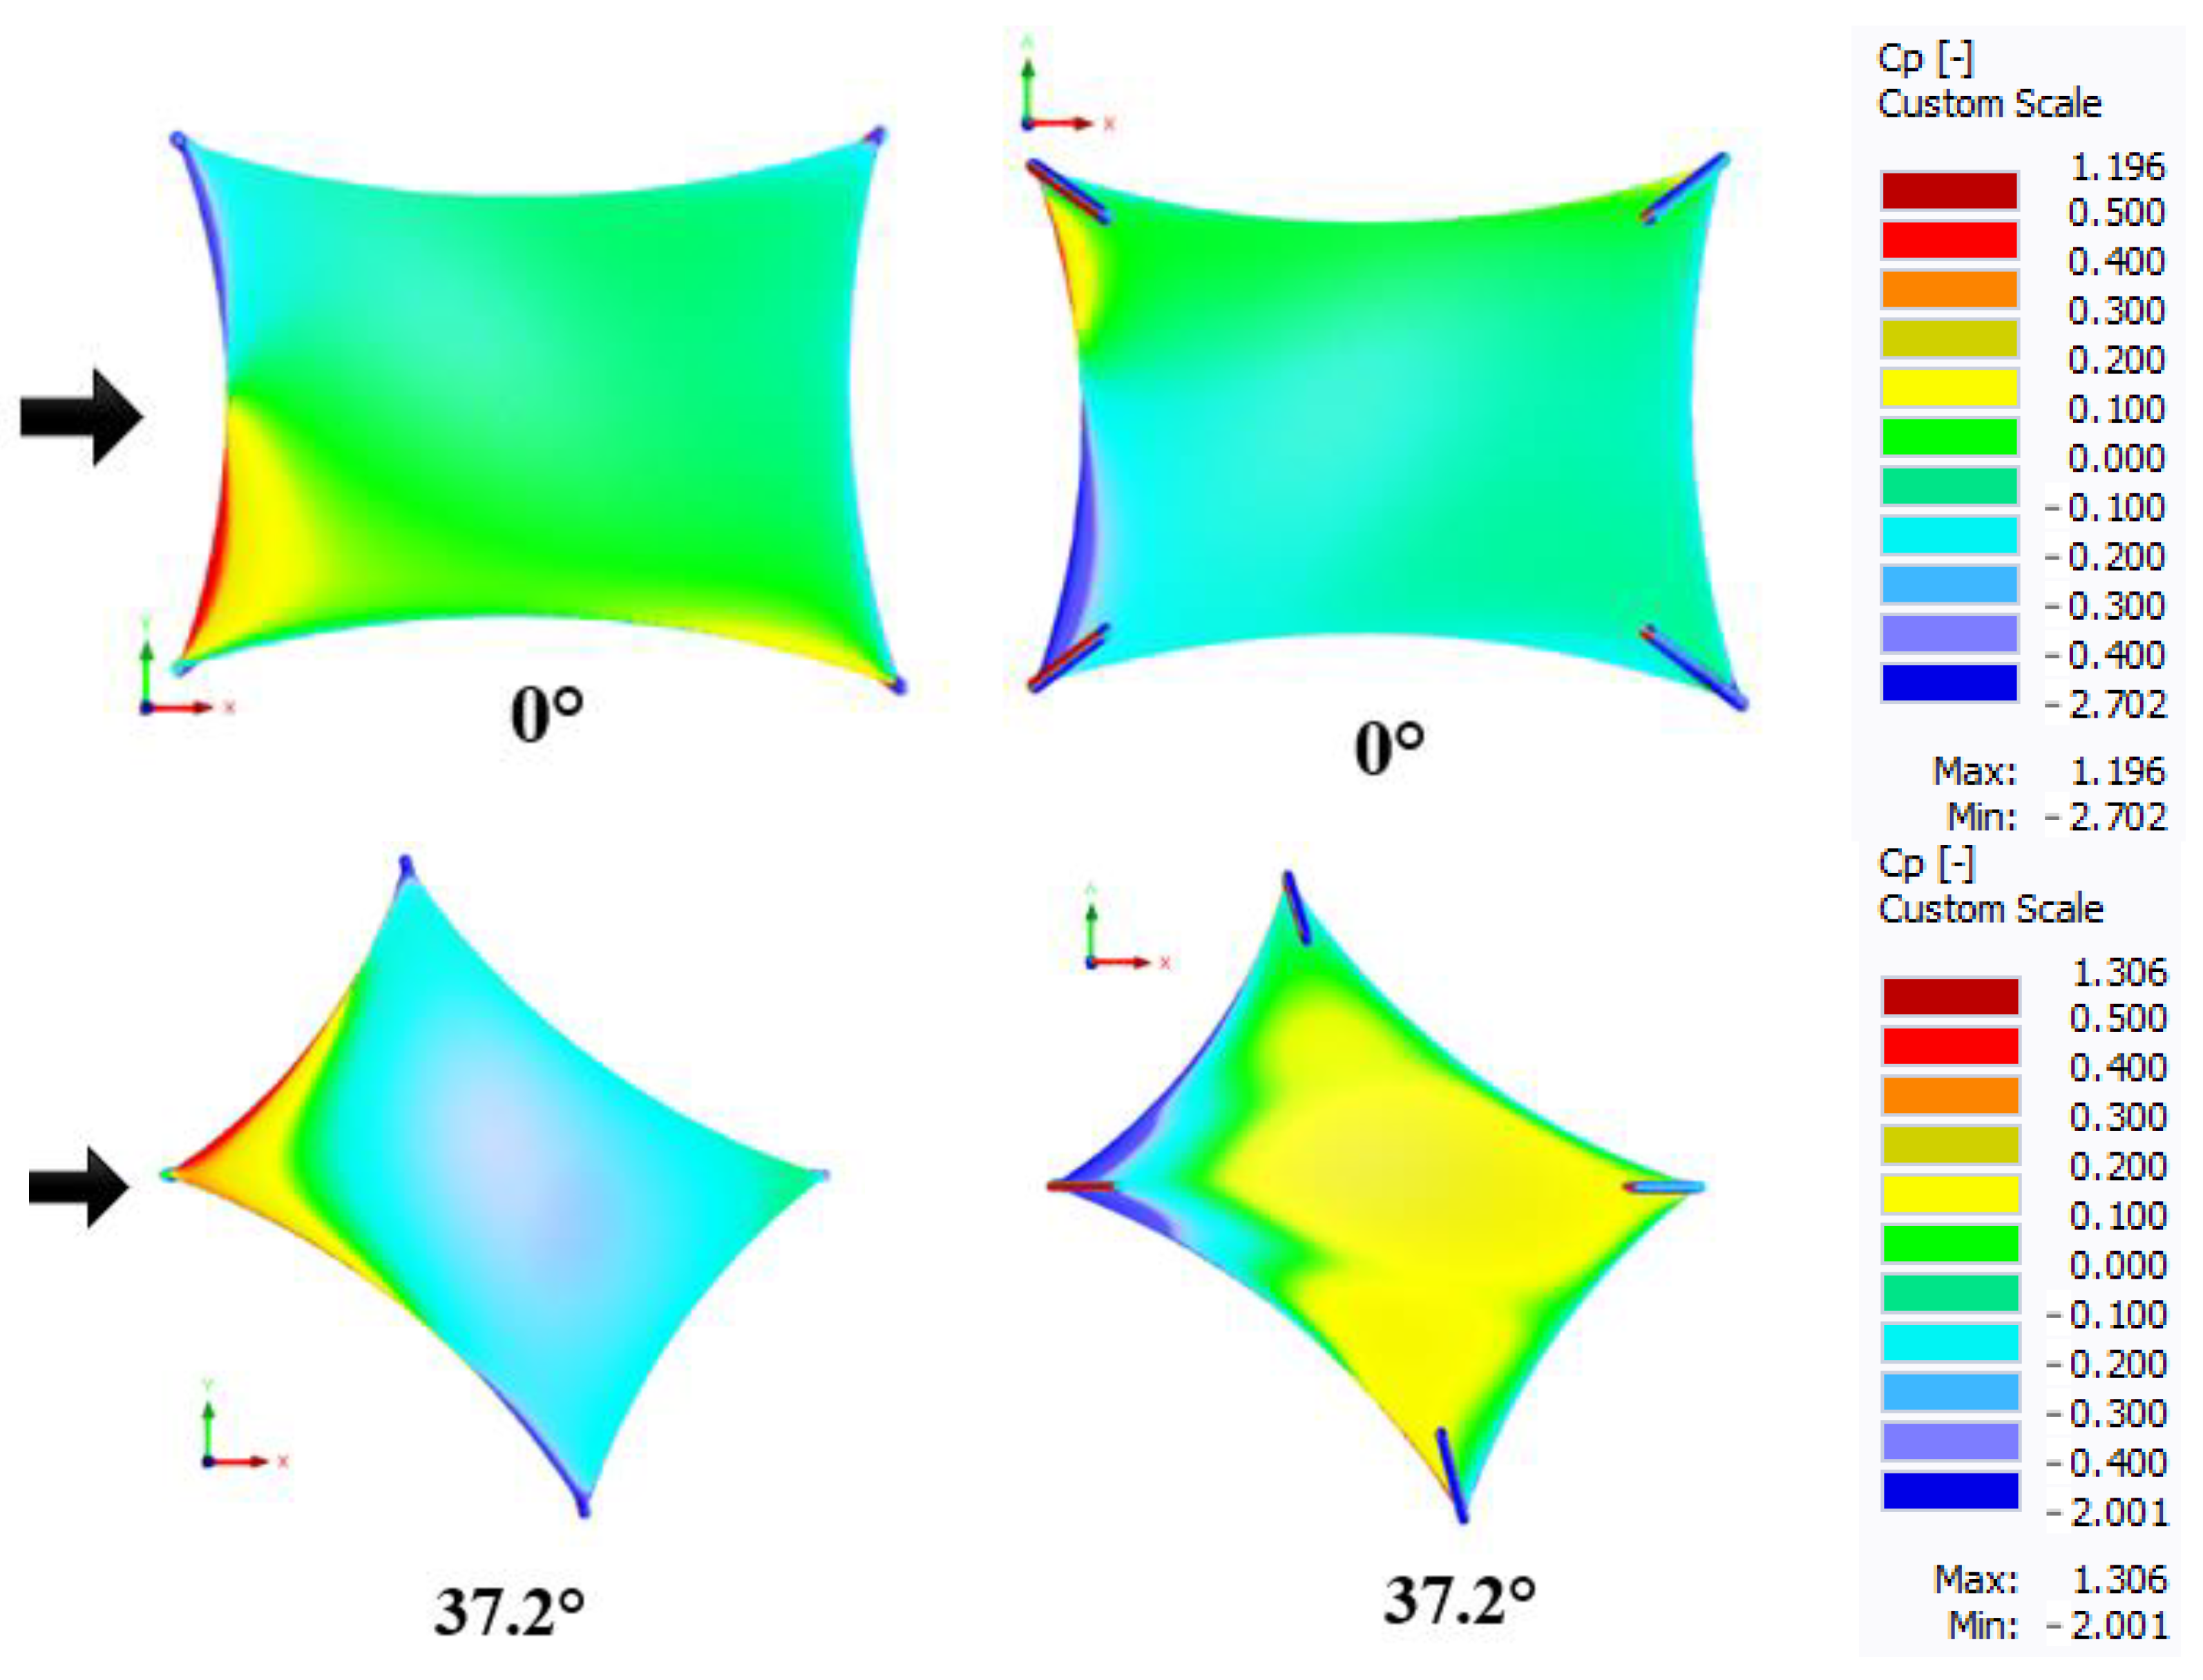
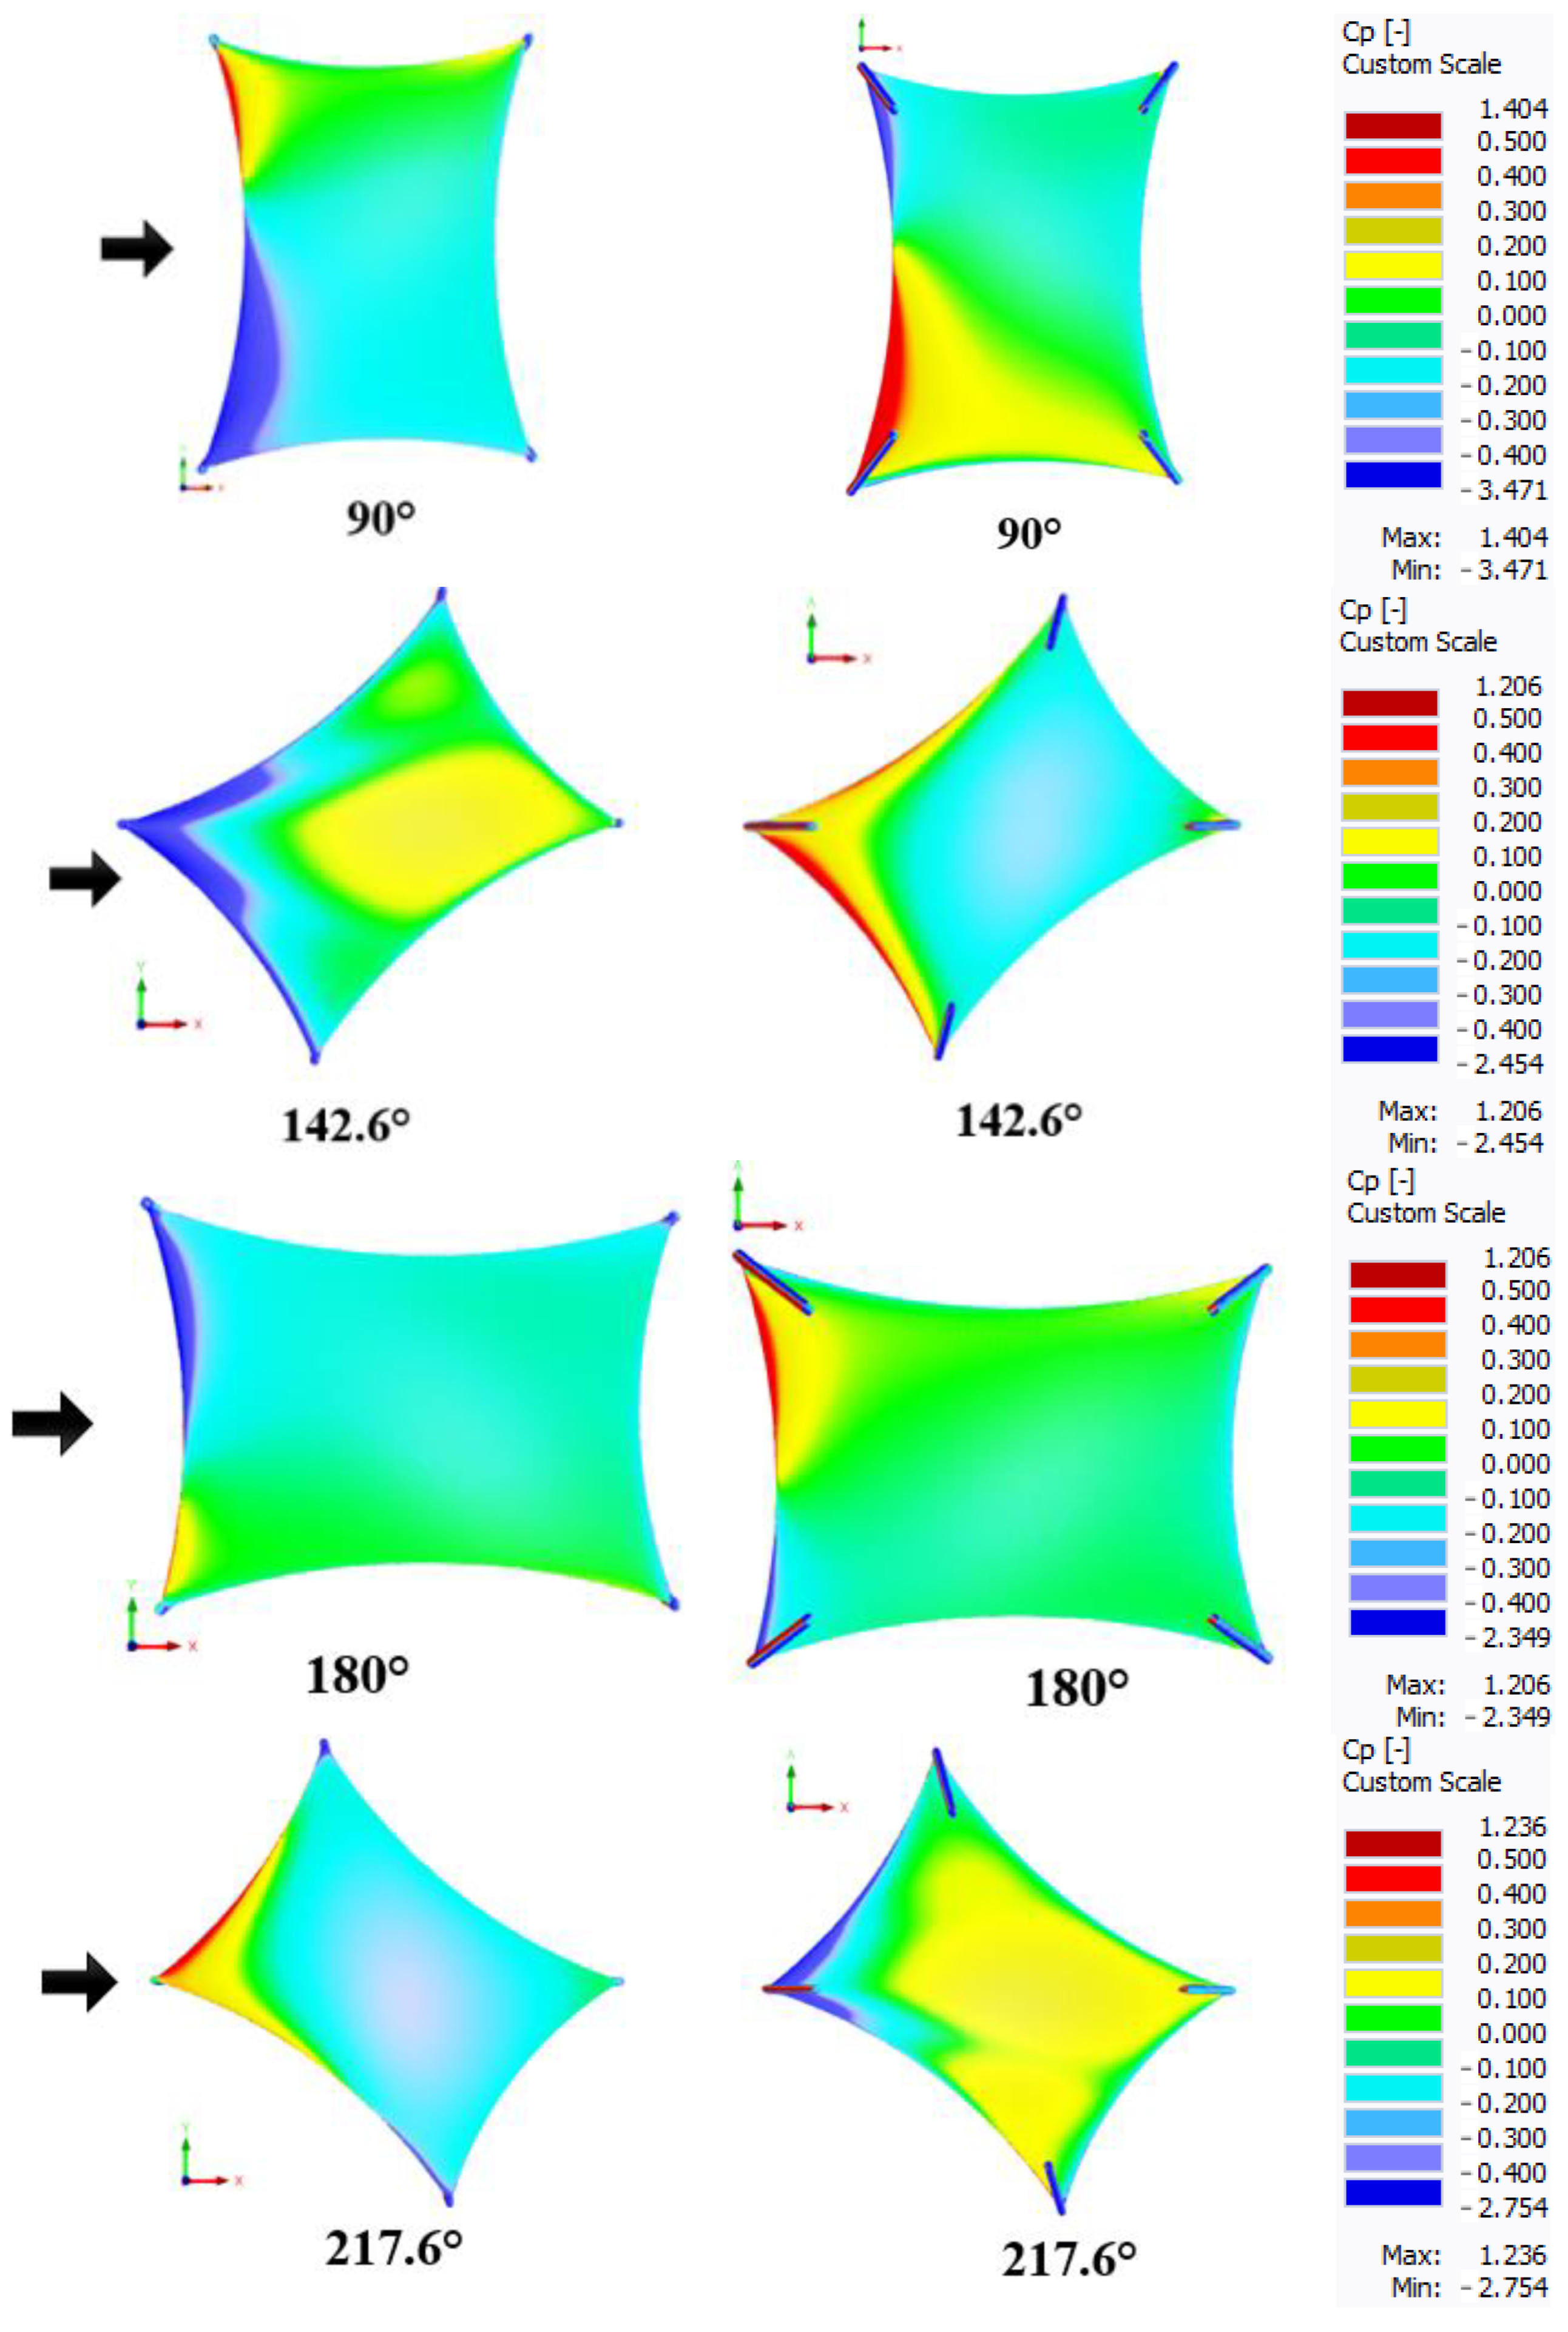
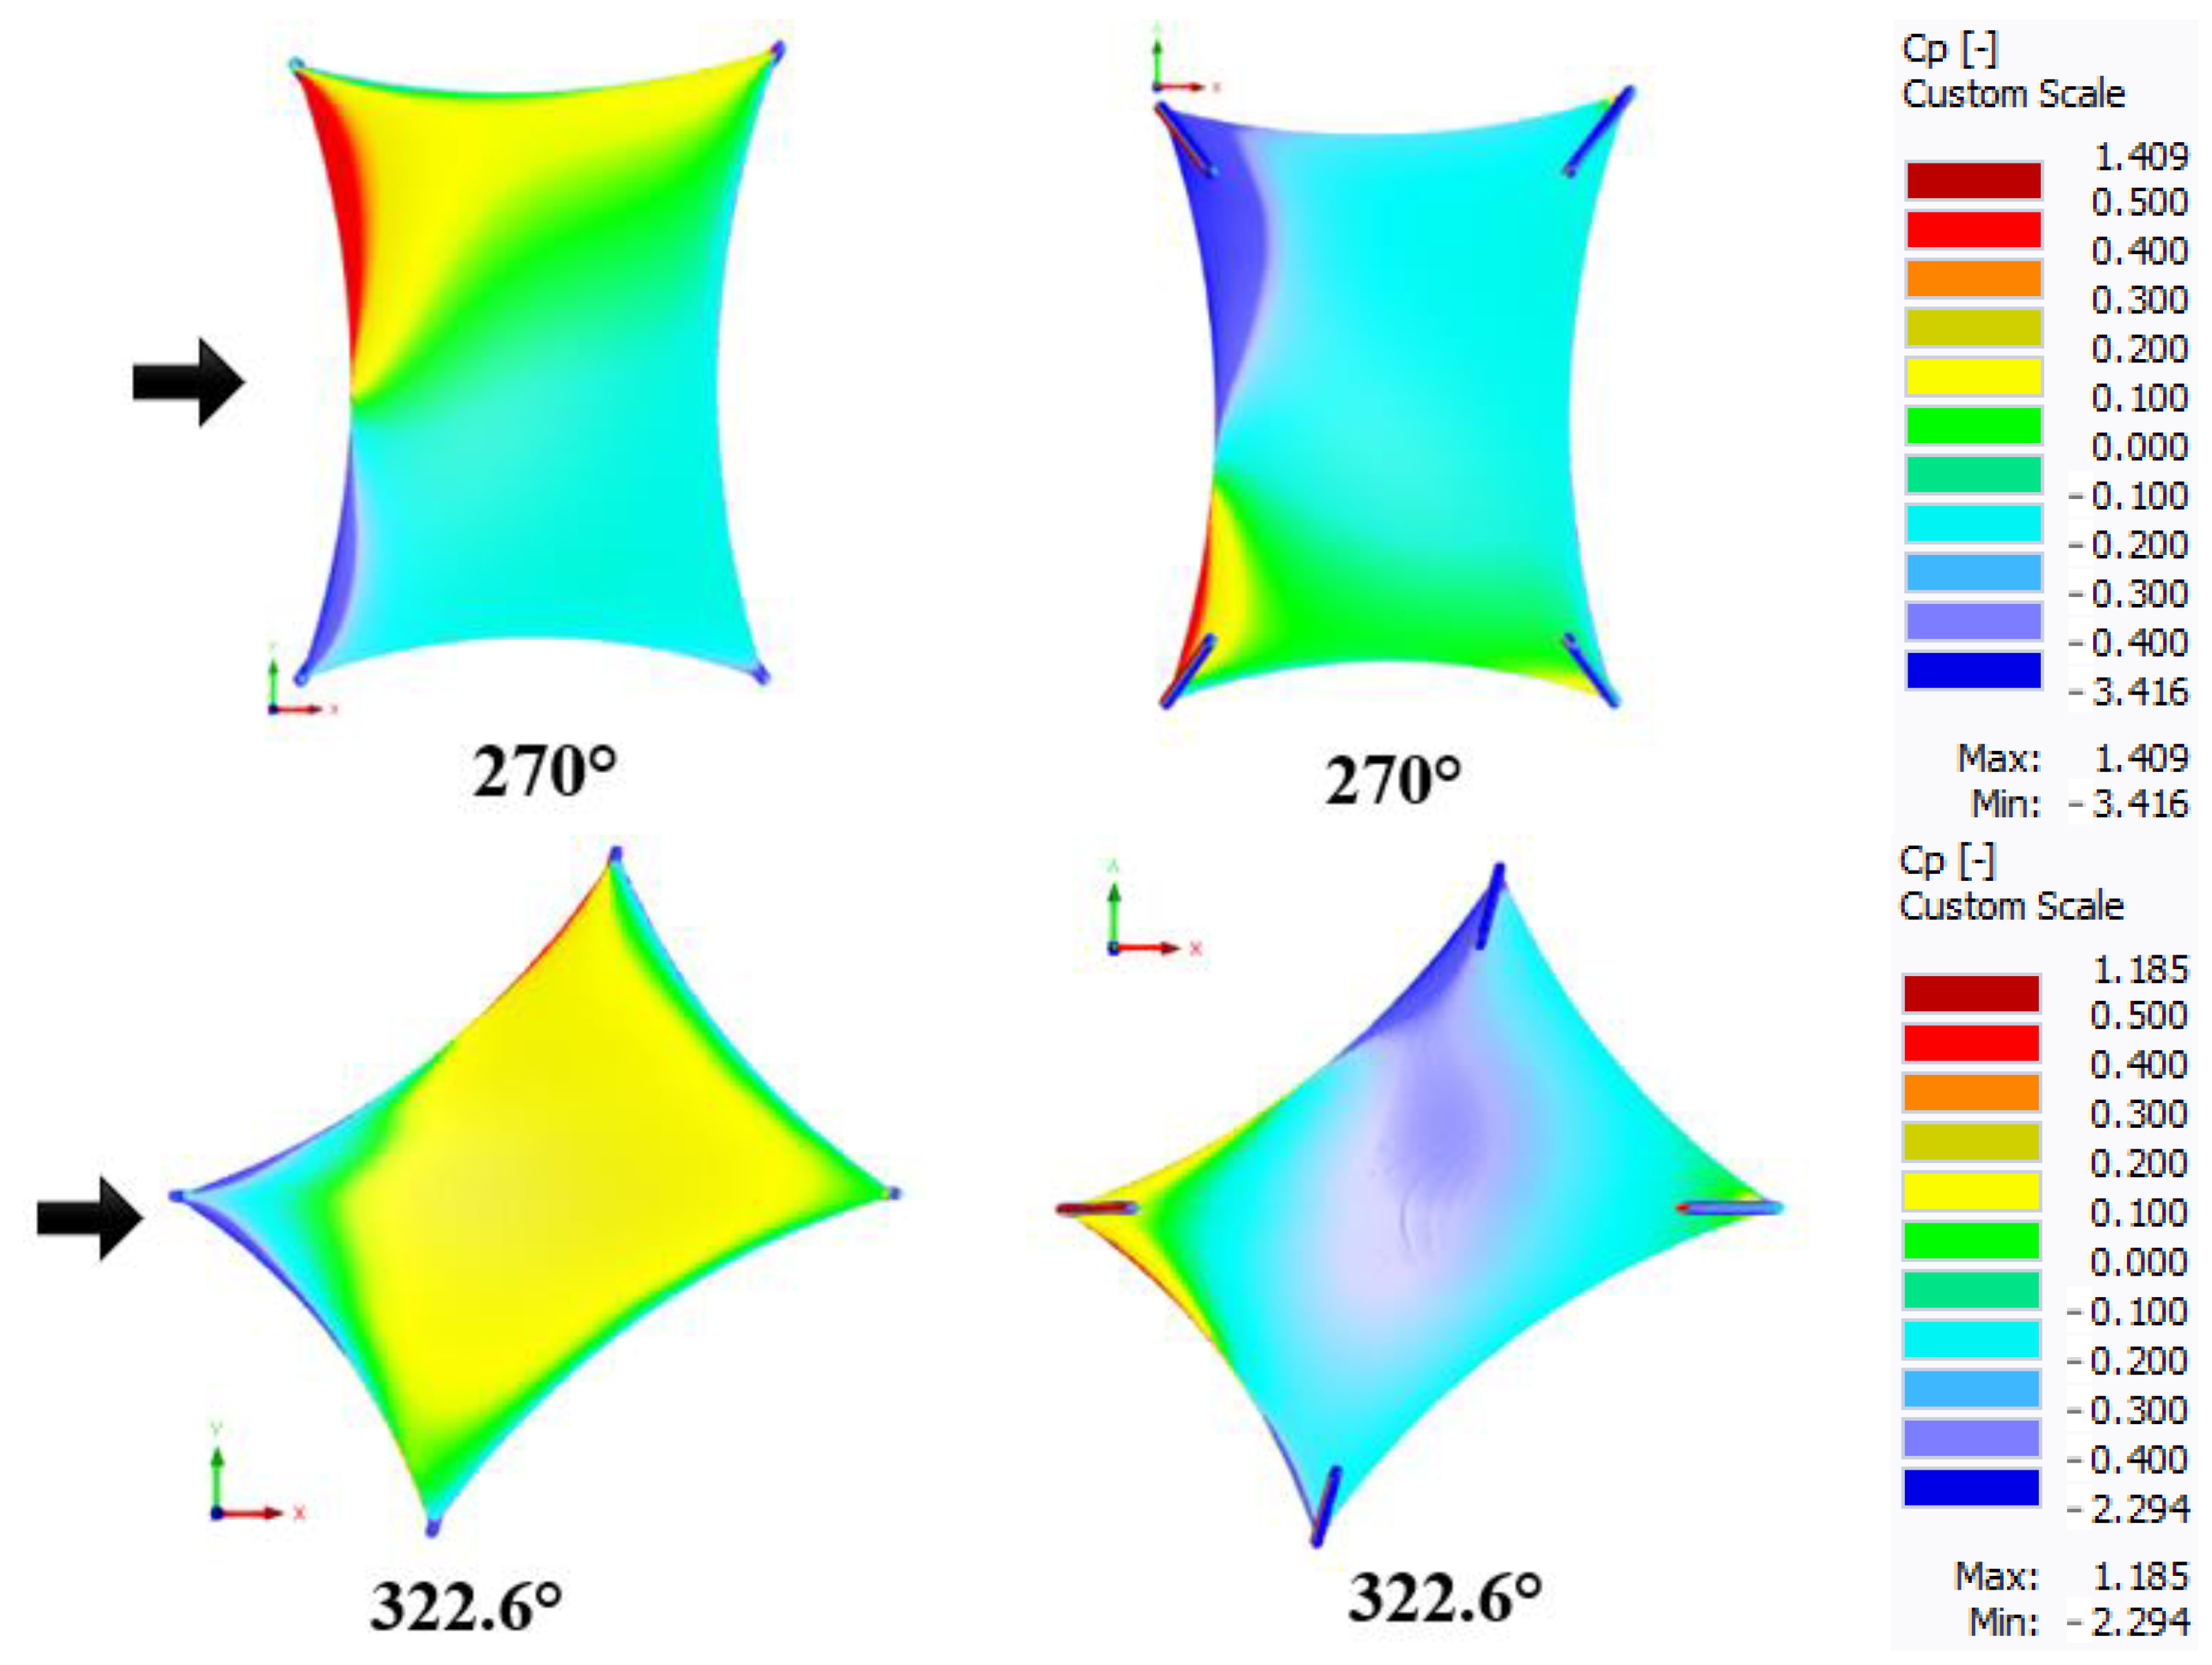
The required output of the numerical CFD simulation is the surface load on the tensile structure, which can be directly imported to the RFEM software as load cases and used for design. The results of the simulation can be displayed in the RWIND software, for example, by means of surface pressures caused by wind flow or by the pressure coefficient
Cp on the surface. The results of the
Cp coefficient for the analyzed membrane structure are shown in
Figure 10 for all solved directions of the wind. The color scale has been adjusted to make the values on the paraboloid surface easier to read. The maximum logical value of the
Cp is 1, however, locally, it is possible to observe a slightly higher value.
The other possible results of the simulation are the drag forces. These are presented on two types of models, the original and the simplified one. The difference between the original and the simplified model was briefly explained in the previous paragraph of this section. The drag force values for all analyzed directions are given in
Table 1. A positive force value means the same direction as the coordinate system. The horizontal force in the
x direction (
Fx) is positive if it is in the direction of flow; vertical force (
Fz) is positive if it is directed upwards, and the horizontal force in the
y direction (
Fy) is positive if it acts from the right to the left (view in the direction of flow). The difference between the original and simplified models is in most cases negligible, the average difference is about 5.5%. However, a difference greater than 15% can be seen in the case of the drag force sum
Fz in the direction of 0° (33.3 %) and in the case of the same type of drag force sum in the direction of 270° (17.1%).

 ,
, 


