1. Introduction
Industrialization, directly represented by human action, has generated an important environmental impact, establishing changes in the structure and normal course of natural processes [
1]. One of these changes is air pollution, which has caused health problems in the inhabitants of low-, middle- and high-income countries; air pollution is caused by gases in the atmosphere, dust, mists, odors, smoke or vapor and has harmed human, plant and animal life for several centuries [
2]. In Latin America and the Caribbean (LAC), air pollution is a major public health concern [
3]. It is estimated that air pollution in urban and rural areas caused millions of premature deaths worldwide in 2016; due to exposure to fine particles of 2.5 microns (PM
2.5), which caused cardiovascular, respiratory and carcinogenic diseases [
4].
In addition, the National Institute of Statistics and Census (INEC) in 2020, reported that one of the main causes of general mortality in the country is influenza and pneumonia with 6930 deaths, occupying the fifth place of death of children from 0 to 11, and the same cause caused 175 deaths of people aged 65 years and older [
5].
The main source of pollution in urban areas is given by motor parks [
6] and Ecuador is no exception since several studies have been conducted on air pollution in the main cities of the country, applying measures to reduce pollution and improve air quality. However, in the urban area of Cuenca, the most important source of pollutant emissions is vehicular traffic, contributing to outdoor pollution with 94.5% of carbon monoxide (CO); 71.2% of nitrogen oxides (NOx); 39.6% of volatile organic compounds other than methane (VOCs); 42.5% of fine particulate matter (PM
2.5) and up to 55.6% of particulate matter (PM
10) [
7].
In addition, pollution in the urban area is affected by other polluting factors such as the use of solvents at 29.7%; vegetation at 19.5%; sulfur dioxide (SO
2) at 60.4%; artisanal brick kilns affecting pollution with 38.5% of fine particulate matter (PM5) and 24.6% of particulate matter (PM10) [
8].
Since vehicular traffic is the primary source of pollutant emissions, it is necessary to emphasize which are the main access roads to the city of Cuenca with a daily average of 25,000 to 40,000 vehicles/day, among which the following stand out, the outer road axis composed of Circunvalación Av. and Las Américas Av.; the external road axis composed of Av. Circunvalación and Av. de Las Américas; the internal axis in the north–south direction is composed of Av. Huayna Capac and Av. Solano; and in the east–west direction: Av. España, Av. 12 de Abril and Av. Remigio Crespo. In addition, high traffic is observed on Ordoñez Lasso Avenue, which connects the western part of the city with the external road axis [
9].
People spend an average of 50% to 70% of their time in closed places such as their homes and industrial buildings [
10], representing an evident danger to the health of their inhabitants since, when the concentration of a pollutant in the outdoor air increases in buildings, its concentration also increases in the indoor air (although more slowly) and the same happens when it decreases. These pollutants present in buildings or domestic interiors are introduced by the outside air but are also caused by indoor activities, furniture, construction materials, surface coatings and air treatments [
11].
That said, global development involves the transformation of natural processes, the adaptation to changes inherent to that transformation, and the creation of elements that adjust to new social, economic, political and cultural needs [
12]. With this, effective alternatives for the mitigation of pollutants inside homes have been sought in response to air purification systems. Purifiers basically suck the air, which passes through an internal filter where its contaminating particles are retained, to finally push the clean air into the room or space where the purifier is located; according to the World Health Organization, the benefit of an air purifier system is that it helps prevent allergies caused by breathing polluted air [
13].
The authors Afshari and Iqbal [
14] presented a study on the performance of air filters in a test bench in a meeting room of the Research Institute—Copenhagen. The pressure drop across the filters and the filtration efficiency of ultrafine particles were measured. It was found that both at start-up and after 1450 h of operation, the efficiency of the filter with an ionizer was 50% and 17% higher than the efficiency of the filter without an ionizer, respectively. Similarly, Baldeli and Aliano [
15] presented a UV-C LED and continuous air sanitation system based on ionizers to be installed in a train; the system has an international patent. Its sanitation efficacy against bacteria and fungi was evaluated. It proved to be effective in the microbial destruction of aerodisperse microorganisms. The authors state that the installation of this system in public transportation would be a promising solution to guarantee a high microbiological air quality with a very low environmental impact due to its components. Similarly, Truffo and Peña [
16] presented the performance of the negative ionization solution, claiming that it is a safe and compact device, capable of improving indoor air quality by reducing fine particles suspended in the air, with superior performance to high-efficiency filtration; benefits against respiratory problems and allergies caused by dust mites, pet hair, tobacco smoke and pollen; elimination of odors by reducing VOCs in the air; and inhibition of bacteria and viruses; all this, without impairing the functional performance of fans. Likewise, Ren and Haghighat [
17] presented a study indicating that four to five ionizers are necessary to improve bacterial killing performance and even more with the combination of the ionizer with natural ventilation. The average removal efficiency improved by about 20% to 85% and decreased the average risk of infection by 23%. However, the above studies have not analyzed gas concentrations with and without the device. For the same reason, Siegel and Waring [
18] state that ion generators are enormously popular air purifiers, but several studies suggest caution in their use; more studies on ozone and ultrafine particle generation are needed. Despite this, Stephens and Gall [
19] express that the global pandemic COVID-19 has led to widespread demand for air cleaning technologies aimed at reducing the risks of airborne pathogen transmission within buildings. They, therefore, propose a way forward to reduce the current uncertainty about the performance of electronic air cleaning technologies. Among these, they denote fundamental studies that elucidate the underlying mechanisms of action of air cleaning technologies and field studies in real environments where gas and compound concentrations are monitored.
It is also important to note that purifiers near high-traffic roads can solve pollution problems where mechanical ventilation is not possible [
20]. Likewise, ionization air filters are designed to mitigate personal exposure to fine and ultrafine particles; however, the ionization process of these filters can produce ozone intentionally or unintentionally [
21], and changes in temperature and relative humidity have a minor impact on ozone generation. This can be controlled according to the wire diameter and material with a fixed voltage [
22].
According to this context and as a proposal to solve the problem, the objective of this study is the development, implementation and analysis of a prototype air purifier by ionization in buildings (considering real scenarios, natural ventilation and high-traffic roads), windows or access areas of polluted air, relating the concentrations of gas and external and internal particulate matter.
2. Literature Review
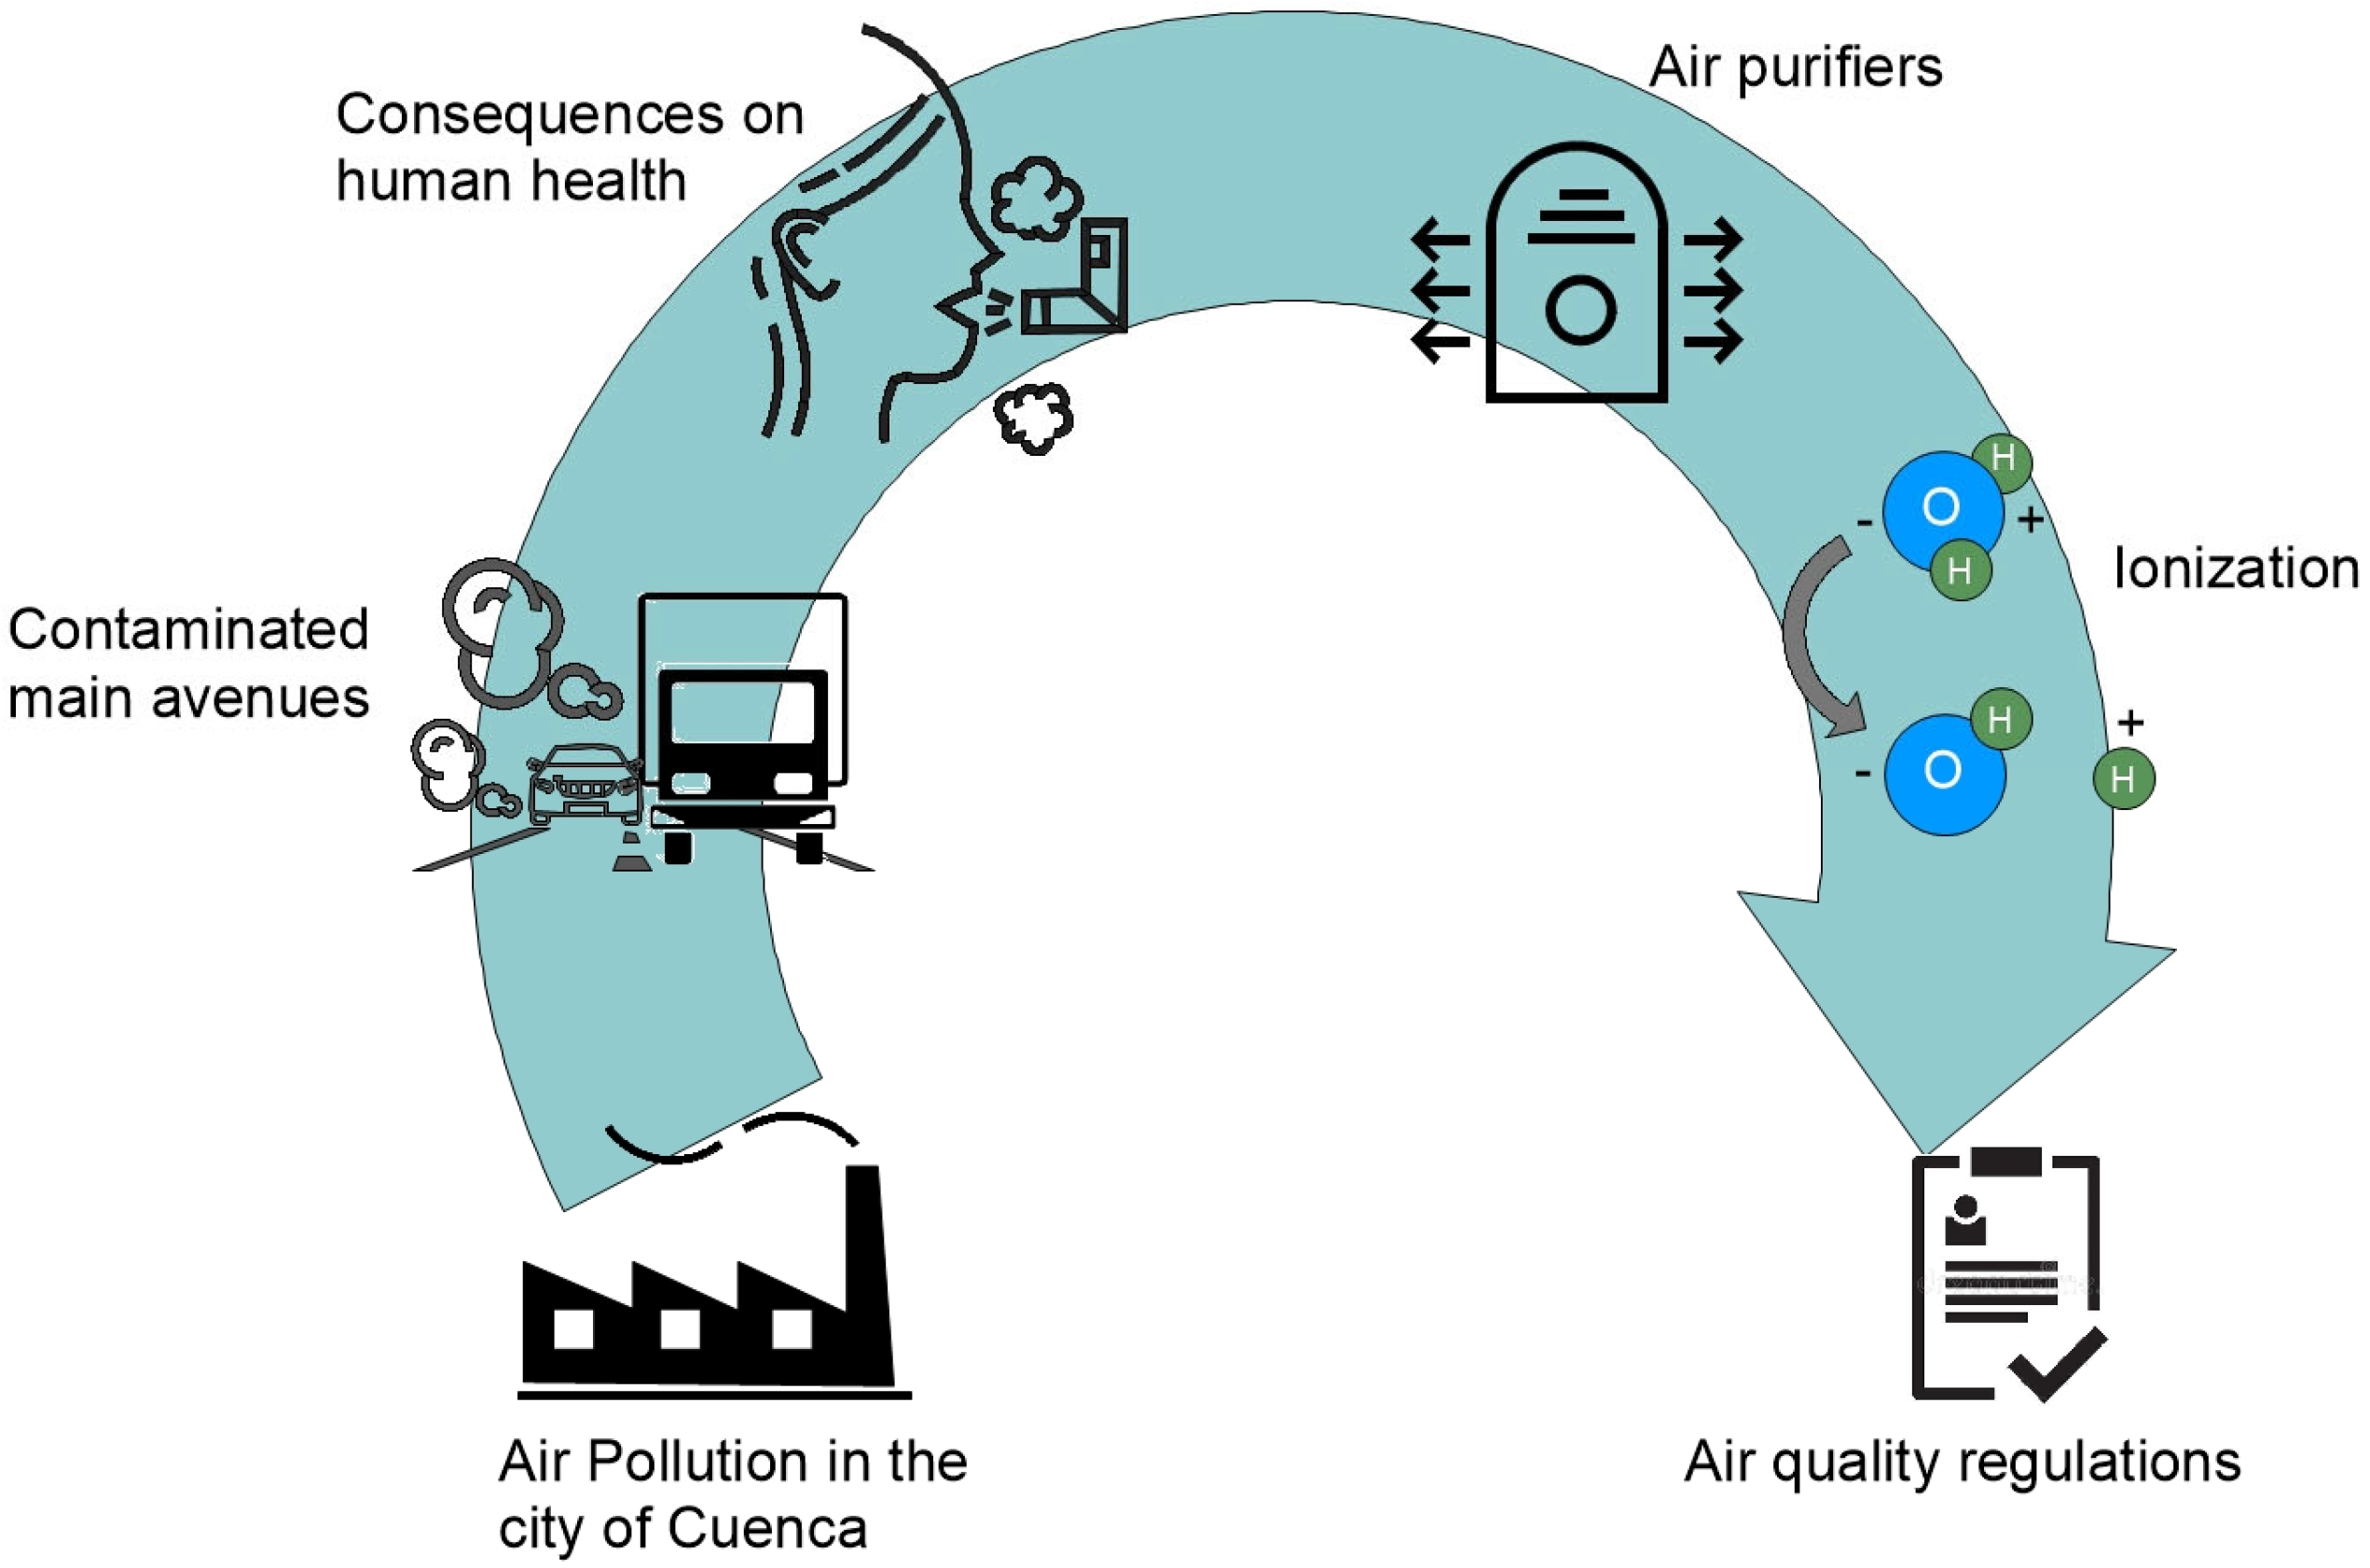
The methodology of bibliographic synthesis was applied through the technique of analysis, organization, systematization of information or critical interpretation of experiences, a summary of scientific articles related to indoor pollution in buildings, consequences on the health of its inhabitants, air purifiers, ionization process, determination of the study area and existing regulations, see
Figure 1.
2.1. Air Pollution in Cuenca
Air quality in the city of Cuenca has decreased year after year, due to pollution factors such as vehicular traffic, industries, fuel consumption and population growth [
23]. However, vehicular traffic is the most important source of emissions; according to the study by Parra and Espinoza [
24], heavy diesel vehicles are the major pollutants producing 36.9% of NOx and 63.4% of PM 2.5. In addition, gasoline vehicles cause 30.3% of NOx and 7.0% of PM on the roads, also emitting 72.8% of volatile organic compounds (VOCVDM).
Since 2008, the city of Cuenca has had an Air Quality Monitoring Network with 20 stations distributed throughout the city, which provide updated information on pollution levels of sulfur dioxide, nitrogen, sediment particles and particulate matter, see
Figure 2.
In order to analyze the data obtained on air pollution in the city of Cuenca during the year 2021, the following
Table 1 summarizes the maximum permissible concentrations of polluting components according to the Air Quality Standard (NCAA) and the World Health Organization (WHO).
In this context, the data obtained from the air quality report regarding the pollutant components obtained during the year 2021, presented by the Public Mobility, Transit and Transportation Company of Cuenca (Molina and Parra, 2021), are detailed below. It should be noted that the data presented here belong specifically to the CCA station (Carlos Arízaga Vega School), which is located within the area of this study.
Particulate matter less than 10 microns: An annual average concentration of 30.7 μg/m3 was recorded at this station, which is within the normal range of the NCAA (50 μg/m3); however, this value exceeds the WHO guideline value (15 μg/m3).
Particulate matter less than 2.5 microns: The annual average value is 8.3 μg/m3, this concentration is lower than the annual average established by the NCAA (15 μg/m3), although higher than the WHO guideline value (5 μg/m3). Likewise, this value suggests that, in the area of the aforementioned station, there is an important influence of emission sources of the coarse fraction of PM10.
Carbon monoxide (CO): The eight-hourly data present a value lower than the value established in the NCAA standard (104 μg/m3) and the WHO (10 μg/m3), indicating that CO is not a relevant problem in the air quality of Cuenca in 2021.
Dióxido de Azufre (SO2): An average of all hourly concentrations was recorded and is 3.3 µg/m3, being a lower value than the annual average established by the NCAA (60 μg/m3) and is also lower than the WHO range (50 μg/m3), indicating that S02 is not a relevant air quality problem in Cuenca in 2021.
Nitrogen Dioxide (NO2): At none of the stations, the annual average concentration established by the NCAA (40 µg/m3) and the WHO 2005 guideline value (40 µg/m3) was exceeded, indicating that NO2 is not a relevant air quality problem in 2021.
Ozone O3: No exceedances of the value established by both the NCAA (100 µg/m3) and WHO guidance (100 µg/m3) were recorded, indicating that NO2 is not a relevant air quality problem in 2021.
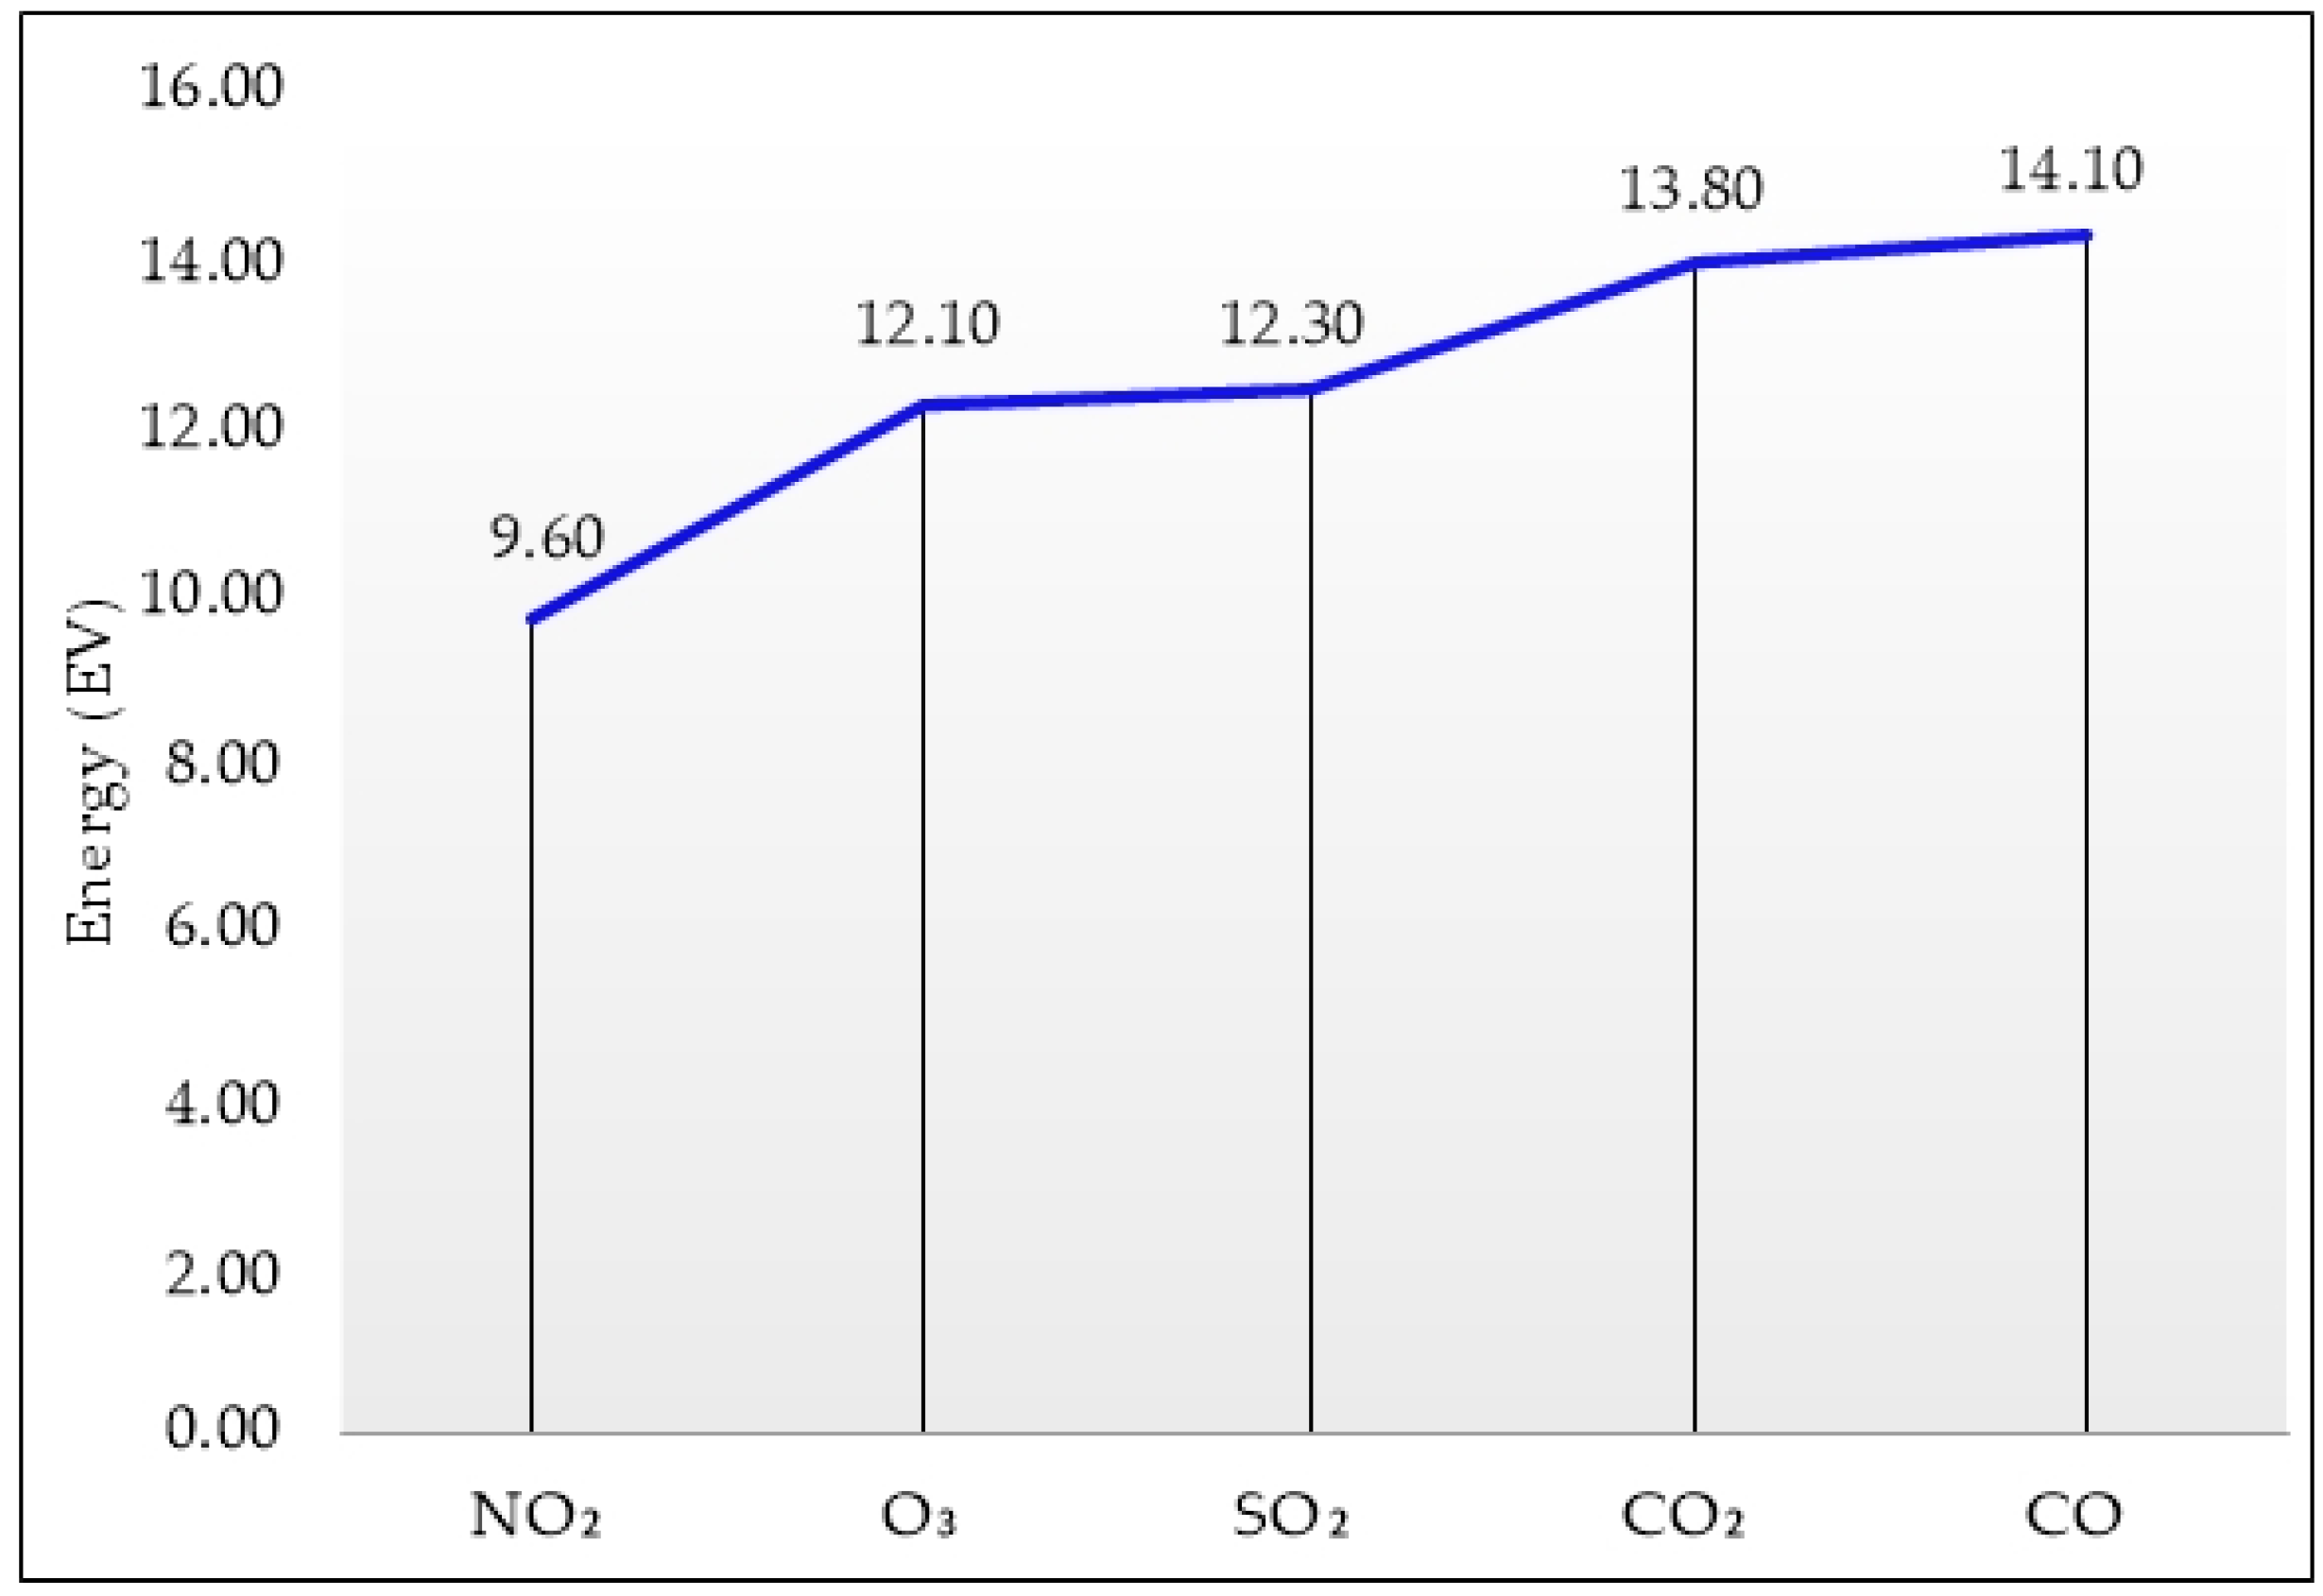
2.2. What Is Ionization Energy?
It is the energy required to supply one mole (atomic mass in grams) of isolated and unexcited atoms to separate the least strongly retained electron from each other [
25].
Gases, like solids and liquids, are composed of atoms and molecules
Figure 3, the cause of a gas being a gas depends on its atoms and molecules being far apart and moving in all directions at high speed, colliding multiple times with each other. Like a liquid, a gas has no definite shape or volume; it takes on the shape and volume of the container in which it is diffusing uniformly.
A hypothetical gas is considered ideal if it is formed by point particles, without attraction or repulsion between them and whose collisions are perfectly elastic (conservation of momentum and kinetic energy) and in which the kinetic energy is directly proportional to the temperature.
The real gases that most closely approximate the behavior of the ideal gas are monoatomic gases at low pressure and high temperature. In the case of real gases at pressures and temperatures close to normal, as well as those composed of molecules of several atoms, the behavior may vary from that of ideal gases, and it is this difference that allows their separation. Among the characteristics for separation, they use the following properties that are used for industrial and medicinal purposes:
Oxidizing and reducing characteristics.
Polarity and/or apolarity, even as a function of pressure and/or temperature variations, polarity changes.
Phase change as a function of pressure and temperature.
Molecular size.
Figure 3.
Ionization energy adapted from Manuel and Moreno, 2015.
Figure 3.
Ionization energy adapted from Manuel and Moreno, 2015.
External gases have been qualified by their potential negative effect on the health of the population, below in
Figure 4, the main source of pollutants and their effects are detailed.
2.3. Introduction to Ionizers
Basically, the ionizers are supplied with an electrically charged conductor that sends charged particles of negative ions that interact and work as magnets, which attract the particles making them heavier causing them to fall to the floor or otherwise are attracted to small plates.
Other ionizers compact the particles in small plates with electric charge and are captured by the same ionizing equipment, this is known as “electrostatic attraction between particles”, i.e., particles of different charges attract each other generating a volume in space which can make them heavier or give them a certain body to be controlled more easily [
26].
In the market there are several technologies regarding air purifiers; however, the most important is HEPA (High-Efficiency Particle Arresting). These are pleated filters containing very deep pleats with a much larger surface area than conventional pleated filters. Consequently, they remove fine and ultrafine particles more efficiently than lower-rated fibrous media air filters.
Generally, HEPA filters are equivalent to a minimum efficiency reporting value (MERV) and are the measure by which a filter removes particles passing through it, the higher the MERV rating the more particles the filter will capture [
27].
2.4. Use of Air Purifiers
In Medellin—Colombia, some scientists tested a technological process developed in Italy, known as Airbol. It is capable of purifying the air in cities. This man-made prototype purifies external air and polluting gases such as carbon monoxide, particulate matter, sulfur and nitrogen oxides, as well as viruses and bacteria; purifying approximately 22,000 m
3 of air every hour. It works by means of a plasma field simulating thunder and lightning, ionizing the air and its molecules [
28].
Molina Aravena [
29] proposes the installation of an air purifying device with remote monitoring called FACYM through remote monitoring with Labview; it has an HMI display device to observe the measured pollution variables from the equipment, as well as a GPS/GPRS module for communication. Data on purification rates were obtained, achieving a daily reduction of 480 L of environmental pollution and predicted that, with one year of operation, approximately 180,000 L of CO
2 would be purified annually [
30].
In Beijing, China, a seven-meter-high tower was created that sucks in polluting particles from outside and releases 75% cleaner air, sucking in some 30,000 m
3 of air every hour. It traps a large part of the polluting particles, including the smallest and most harmful to health; it works with positive ionization and a ventilation system at the top sucks in the air, and stores it in a chamber where the particles are loaded to stick in the tanks, then releasing the clean air underneath [
31].
In another study, Flor Cunza [
13] mentions that she designed an A1 air purifier system (BAP1700) with HEPA type filter for urban dwellings, having an optimal range per square meter of up to 80 m
2; same that helped to reduce germs, allergens and pollutants in the environment. Additionally, it was recommended to perform maintenance of the purifying equipment at intervals of 3 to 6 months depending on how much the pre-filter was observed to be contaminated.
The National Autonomous University of Mexico developed a column made with perforated discs and an air extractor, the washed air drives the smoke into the device and filters it with a porous material called zeolites, which does all the magic of absorbing pollutant gases in the air. The system does not trap 100% of the pollutants, but it is a great help in improving the quality of the enclosed environment [
32].
In Peru, the University of Engineering and Technology (UTEC) of Lima designed a fence that purifies the air in order to protect the environment. The panel is capable of purifying 200,000 m
3 of urban air per day, equivalent to 1,200 trees. The machine installed on the billboard purifies urban air in a volume of 8340 m
3. “A human being breathes about 10 m
3 air per day, i.e., it represents the breathing of 834 people per hour or 20 thousand per day” [
33].
In Spain, an air purifier attached to the outside of a bus was created, which has more than one type of filter, such as HEPA, to eliminate different types of gases and pollutants that exist in the atmosphere. This prototype respects the eco-design guidelines and its creation, use and subsequent recycling do not affect the environment in any way [
34].
3. Materials and Methods
The present research was developed based on the “evolutionary development” model. First, as detailed in
Section 2, concepts were deepened through a bibliographic review of air pollution, ionization and air purification. After that, the prototyping of the ionizing lattice was carried out, starting with the design of several sketches that allowed the generation of an architectural model of the lattice. Once the lattice was modeled, we proceeded to the selection of materials for its construction. Both the materials for the truss and the electrical and electronic materials for its energizing system were selected. Next, the site was selected for performance testing. Two air quality stations were developed, which were calibrated using the manufacturers’ catalogs and their measurements were checked by comparing their measurements with an air quality station in the city. Finally, the stations were installed in the selected location, and measurements of gas concentrations were taken inside and outside the building, where the ionizing lattice was installed. The summary of the steps followed can be seen in
Figure 5 and in each of the following subsections, an explanation of the steps followed is detailed.
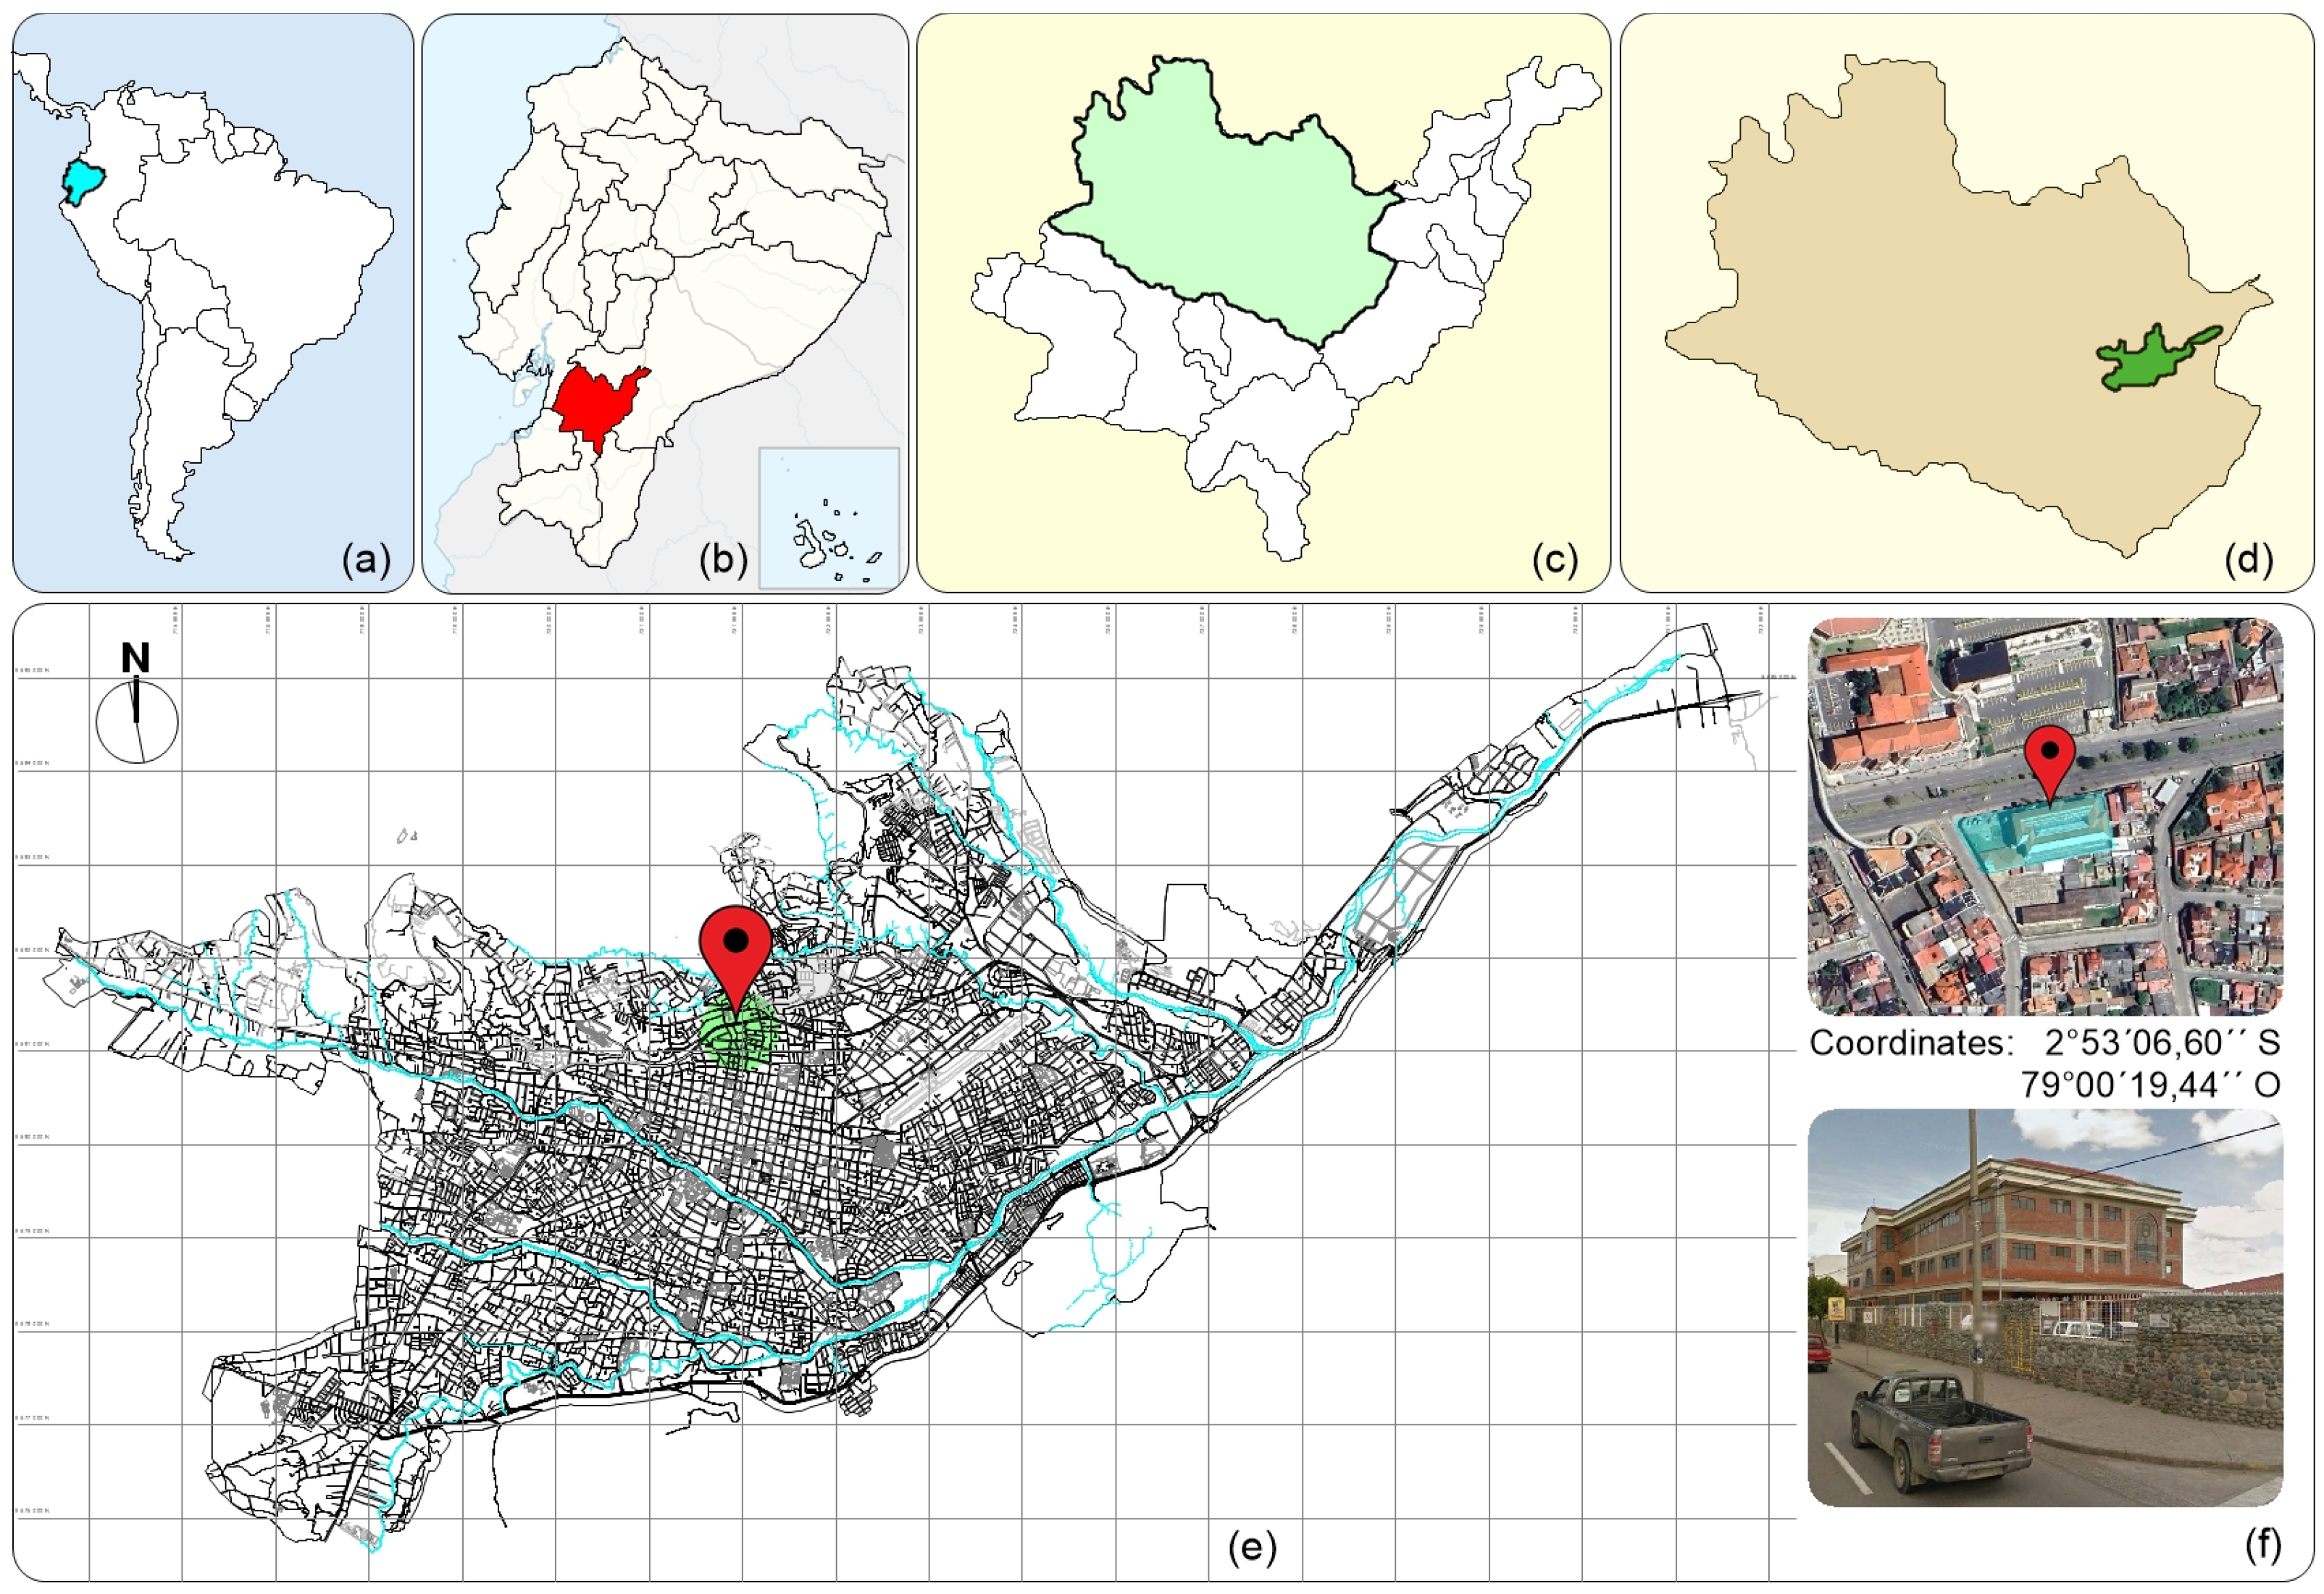
3.1. Study Area
This study was conducted in southern Ecuador in the city of Cuenca, see
Figure 6. The altitudinal variation of the urban area has an average elevation of 2550 masl; with a variable temperature between 10 °C and 21 °C, an average of 15.6 °C; an average relative humidity that ranges between 41% and 83% per year, resulting in an average of 62%, the highest percentages of humidity occur between the months of March and May; rainfall is present at two times of the year, the highest between the months of February to May with 101.13 mm/m
2, and the second between the months of October to December with 87 mm/m
2; the predominant wind direction in the city is from the northwest with a speed between 9 and 12.82 km/h; the cloudiness between the months of February to May is 7/8 eighths and decreases in the remaining months to 6/8 eighths; and finally, solar radiation in the city varies between 3.92 and 5.06 kwh/m
2, with the month of June being the one with the lowest temperature and radiation. In order to determine the specific study area, a previous analysis was conducted regarding the avenues with the most vehicular traffic within the urban area. Therefore, Av. de las Américas is a 12.5 km long road with an average of 75,000 vehicles per day.
The headquarters of the Catholic University of Cuenca, located at 2°53′06,60″ S, 79°00′19,44″ W, is located on this road artery, where two air quality stations and the prototype of an air purifying lattice by ionization were installed.
3.2. Development of the Research
In this case, the level of research used in this study is of an applicative-relational type, starting with the collection of data on pollutant gases inside and outside the building where the lattice prototype was placed. In accordance with the research, the 3 stages proposed for the development of the same and to fulfill the proposed objective are detailed below:
Stage 1: Design of the lattice prototype: This process began with the sketch of the lattice and its design, which is structured as follows:
1.1 Sketch: By means of general lines, the composition of the lattice and details for its elaboration and the location of its energizing components are analyzed. The design of the lattice was based on slats placed horizontally at an angle of 30° each, forming gaps between them. A traditional pattern was chosen in accordance with the aesthetics of the building (see
Figure 7).
1.2 Modeling: The lattice was modeled with three-dimensional objects using Vector Works software, thus allowing the analysis of the shape and function of the prototype (see
Figure 8).
1.3 Materials: The prototype is made of pine wood for its resistance to inclement weather and metal mesh, the materials are detailed in
Figure 9.
1.4 Construction: According to the procedure, two air quality stations were installed, the first one on the outside and the second one on the inside next to the air access; likewise, the air purifying lattice prototype was installed by ionization and data were collected for a period of 34 days (see
Figure 10).
1.5 Power Supply: It is achieved by means of a Flyback, which is an autotransformer of energy itself, which is capable of raising the voltage to 7 kV (high voltage). It is connected directly to the mesh installed in the lattice, and in turn to a normal 110 V outlet. The circuit diagram and its connection can be seen in
Figure 11.
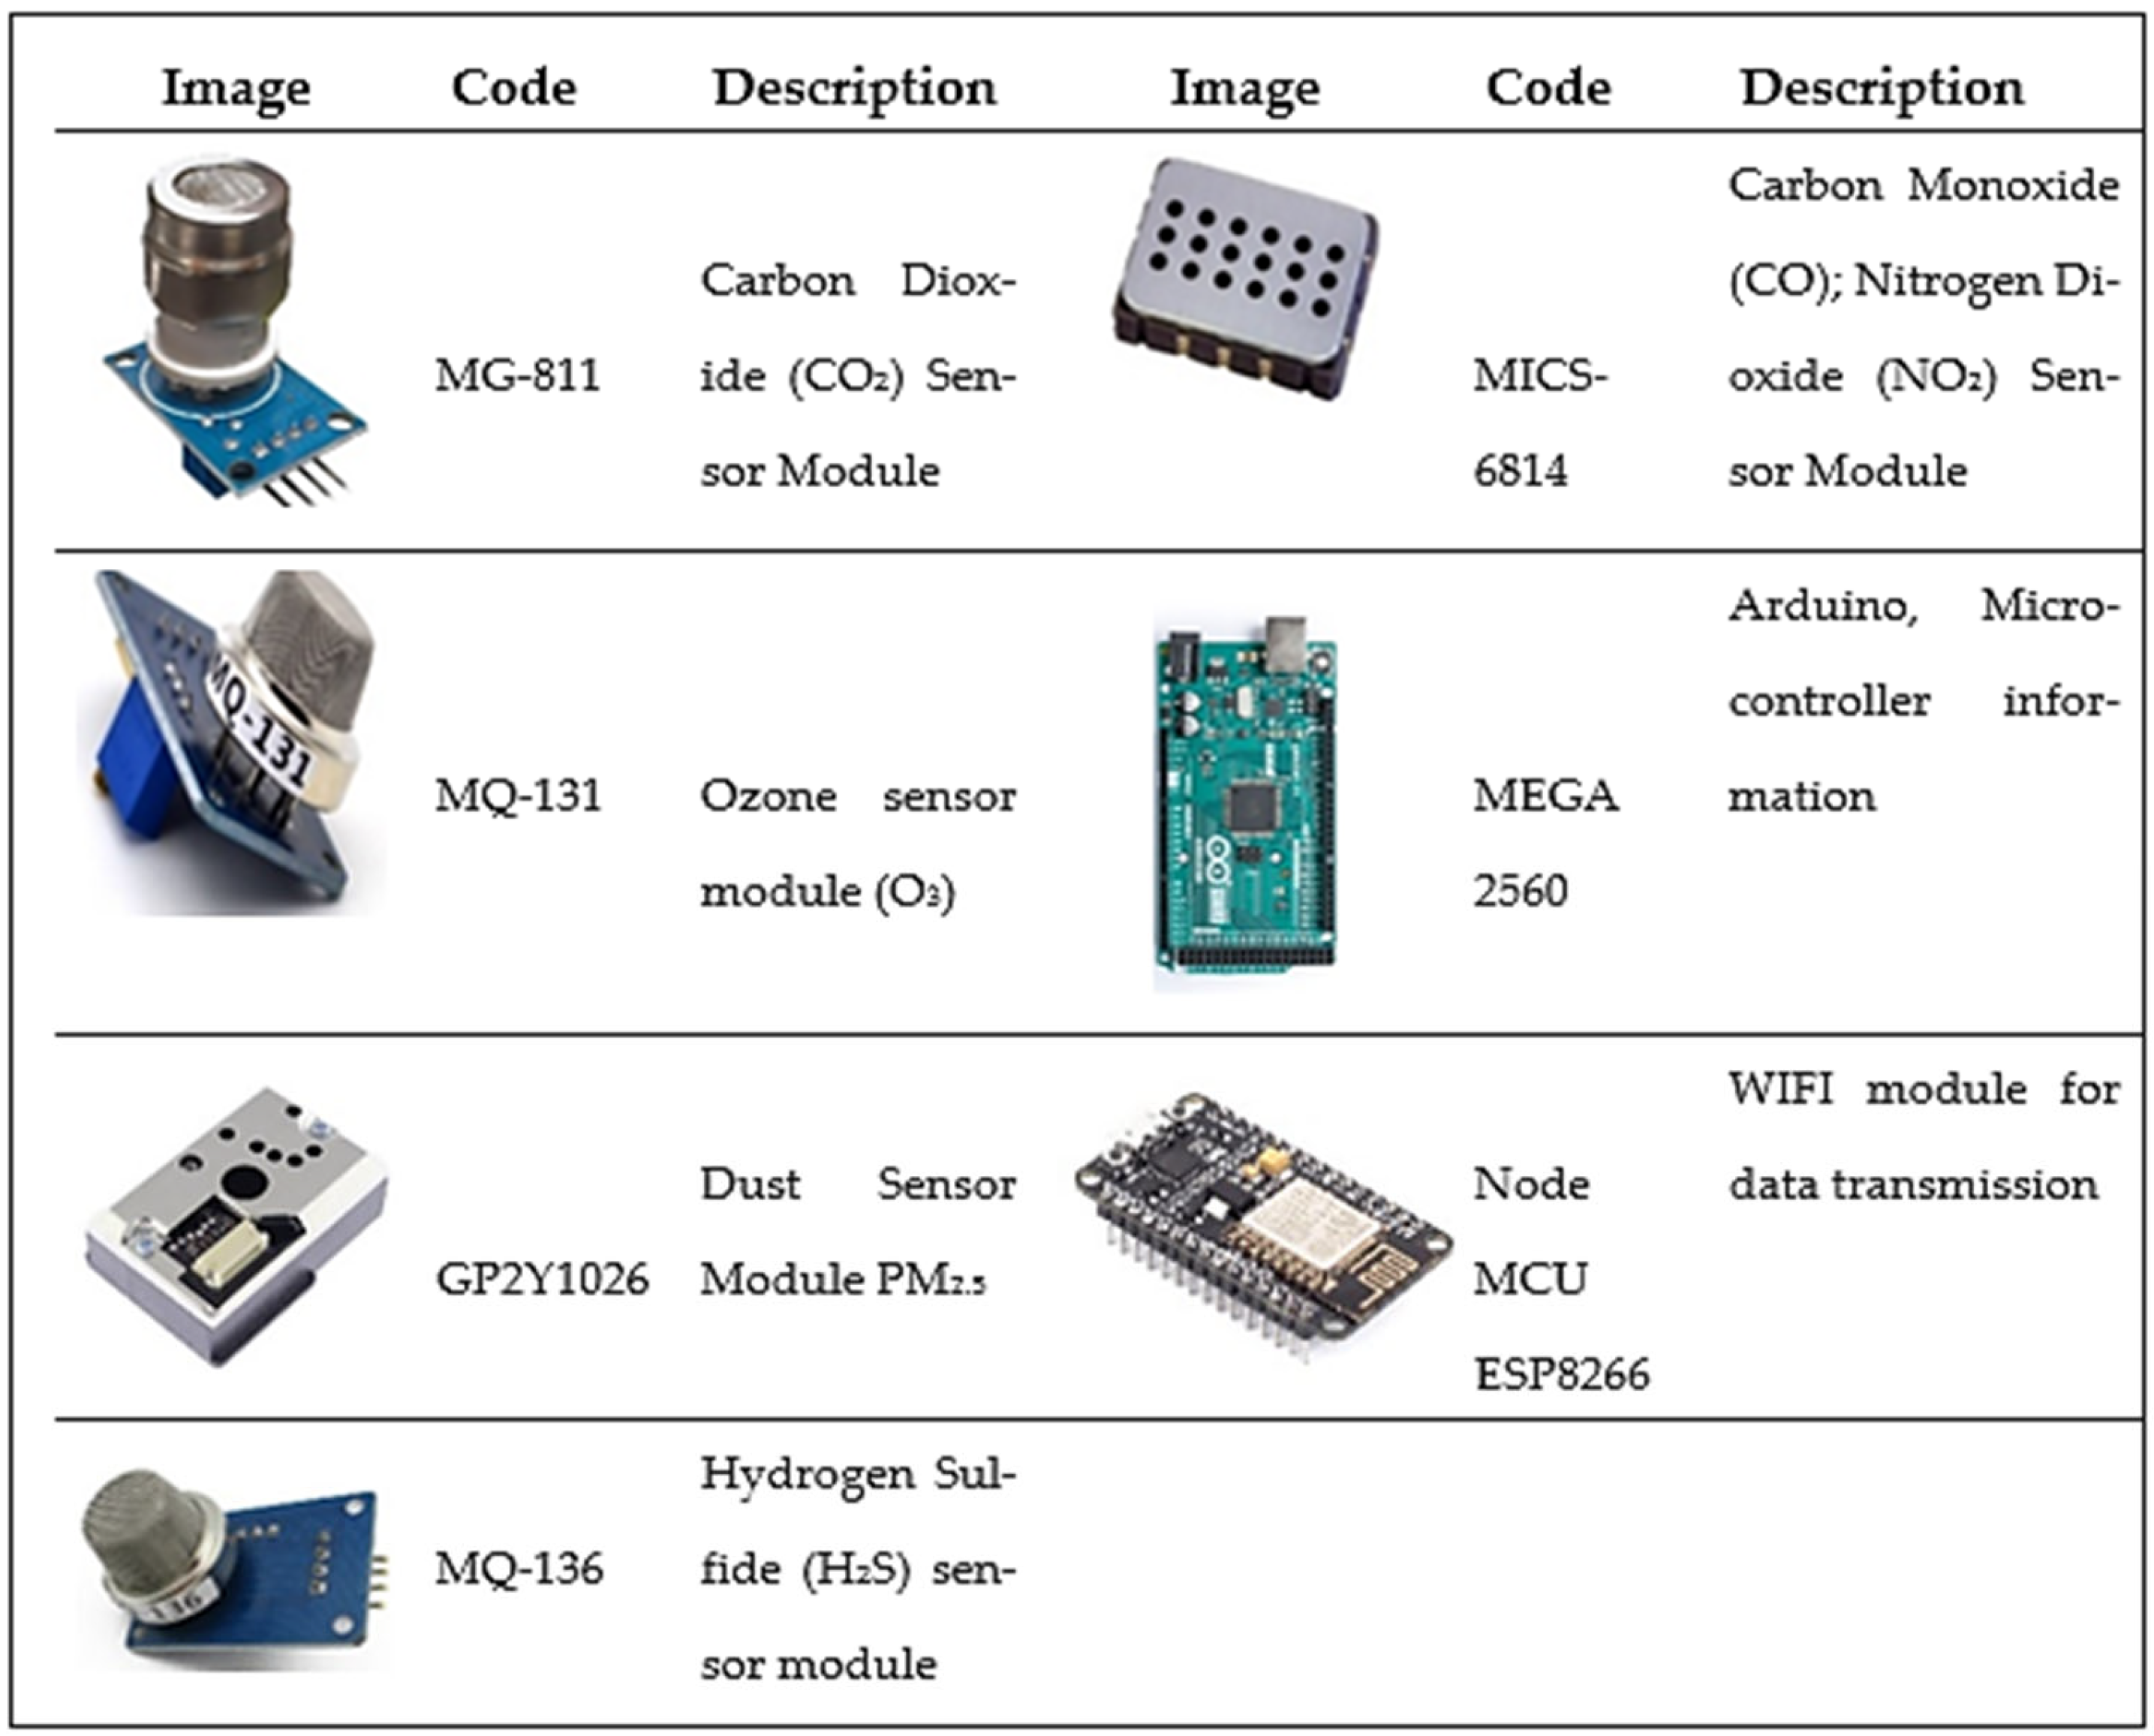
Stage 2: Data collection techniques: To analyze the results of the gas and PM samples, air quality stations made with electrochemical sensors were used, which were tested and calibrated in the laboratories of the Catholic University of Cuenca [
35]. The stations measure CO, CO
2, NO
2, H
2S, O
3, and PM every 2:30 min and deliver the values in µg/m
3. Detail of the
Figure 12.
The output signals from these sensors, both analog and digital, are processed by an Arduino microcontroller.
The MQ and MG sensor modules are composed of an electrochemical sensor that varies its resistance when in contact with gases. The calibration of these sensors was first performed by a preheating process, keeping them on for a period of 48 continuous hours. This was done so that the sensor would have greater precision at the moment of starting the detection. At the same time, the sensitivity curve of the gas to be detected and the sensitivity curve with respect to air were obtained from the manufacturer’s technical data sheet (datasheet). With the sensitivity curve data, the calibration equation was obtained. The coefficients of the equation are incorporated in the library of each sensor and in the general program of the station made in Arduino. On the other hand, the MICS-6814 sensor module is an independent gas measurement sensor, which has its own library from the manufacturer and only needs 30 min of warm-up. Similarly, the sensitivity curves were obtained from the manufacturer’s sheets, and using its library, it is calibrated by introducing the coefficients. Finally, the GP2Y1014AU0F sensor is a PM sensor with an optical detection system that detects reflected light from dust in the air; it is factory calibrated. Therefore, no calibration is required. The quality station was tested by placing it for a period of one week and comparing its values with a licensed air quality monitoring station of the city of the company EMOV, without finding variations in measurements greater than 5%.
Figure 13 shows a schematic of the experiment carried out, where the two air quality stations can be distinguished, one inside and the other outside the building and placed near the window where the purifying lattice is installed.
Stage 3: Data representation technique: The data obtained were statistically analyzed and graphically represented in box and whiskers and radar diagrams; statistical values are presented using tables, and the data were analyzed and processed with Microsoft Excel and Jamovi 2.3.5 programs. The information to be analyzed corresponds to 35 days of measurements, a total of 24,480 samples were obtained for each gas and PM2.5. A total of 24,480 samples were obtained for each gas and PM2.5. Outliers were eliminated, so the statistical analysis was performed with 24,342 samples.
Table 2 shows the results for the different types of gas (state), normal and ionized, number of samples (N), missing data (missing), mean, standard error of the mean (SE), median, mode, standard deviation (SD), maximum and minimum.
4. Results and Discussion
Table 2 shows the values obtained for the two states: normal and ionized. The quantities of gases are evaluated independently in this section with a total number of samples analyzed of 24,342, thus the average concentrations of normal CO in the external part of the building of 3.72 µg/m
3 and internal of the building with the ionizing lattice of 2.61 µg/m
3 are observed. The average CO
2 concentration in the external part of the area under study is 0.553 µg/m
3 vs. the internal ionized one of 0.53 µg/m
3. The average O
3 concentration in the external part of the building is 3.66 µg/m
3 compared to 7.98 µg/m
3 in the internal part of the building with the ionizing prototype. The PM values with respect to external averages correspond to 8.07 µg/m
3 and 3.49 µg/m
3 inside the building. The mean NO
2 concentrations correspond to a value of 6.82 µg/m
3 outside the building under study and 7.73 µg/m
3 inside the study area. The mean H
2S value is 6.82 µg/m
3 corresponding to the outside of the building and 7.73 µg/m
3 corresponding to the mean value inside the study area.
The results are organized using box-and-whisker plots relating values between the ionized versus the Normal value for each gas, as well as for particulate matter. A maximum CO concentration of 27 µg/m
3 is observed on the outside of the building and 18 µg/m
3 on the inside of the building with the ionizing lattice (see
Figure 14a). The maximum CO
2 concentration is 1.02 µg/m
3 in the external part of the building vs. 0.97 µg/m
3 in the internal part of the building (see
Figure 14b). O
3 concentrations have an external maximum value of 29.30 µg/m
3 related to an internal ionized 21.30 µg/m
3 (see
Figure 14c). The maximum external PM value corresponds to 36.44 µg/m
3 and a maximum internal value of 9.77 µg/m
3 with the ionizing lattice (see
Figure 14d). The maximum NO
2 values correspond to 16.40 µg/m
3 outside the building and 16.60 µg/m
3 inside with the ionizing lattice prototype (see
Figure 14e). H
2S and its maximum value outside the building corresponds to 20.91 µg/m
3 and 21.10 µg/m
3 maximum value inside the building with the ionizing lattice (see
Figure 14f).
In order to facilitate the analysis, a radar diagram, known as a spider, is used to present all the gases in a single analysis, showing the average and maximum values of all the gases measured inside and outside the building (see
Figure 15). In graph (a), where the average values are represented, a decrease of 57% in PM and an increase of 118% in ozone can be observed, as for NO
2 and H2S there is an increase of 13% and a reduction in CO of 30% and CO
2 of 4.15%. As in graph (b), with maximum values, there is a similar variation of the gases, but it should be noted that particulate matter has a reduction of 73% and the maximum ozone also shows a decrease of 27% in the ionized one, lower than the non-ionized one.
Discussion
The current study analyzed the functionality of an air purifying element that can be installed in buildings as an aesthetic part such as an energized lattice that works as a filter. The buildings in general have a need to ventilate their environments and reduce their pollution levels, but at the time of the air entering through their windows, based on the problem of external environmental pollution, this is detrimental.
In the present study, the relationship between gases and ionized particulate material inside and normal outside was determined. This means that the lattice retained a higher percentage of particulate matter, then carbon monoxide (CO) and a lower percentage of CO2, increasing considerably the amount of ozone and increasing in a lower proportion NO2 and H2S. In view of the reading of the results, the research hypothesis is accepted, which refers to the purification and reduction of external air entering the buildings located around polluting areas.
Regarding the result of carbon monoxide (CO) reduction, according to González and Fernández [
25], this is based on the ionization energy referring to the first ionization to the energy needed to detach the weakest electron attached to the isolated atom. Regarding the result of particulate matter (PM) reduction, according to Arciniegas César [
36], the electrostatic precipitator is considered a control technology being efficient for the collection of fine particulate matter. Likewise, regarding the decrease in CO
2 according to Chiliquinga Victor [
37] and the proposal of an electrostatic filter takes into account electrical factors such as voltage (12 kV) and maximum current (10 uA) generating electric fields embodying electromagnetic characteristics necessary for the ionization of CO
2, ensuring the reduction of 99.9% resulting in feasible ionization of CO
2. Regarding the increase in ozone by the corona effect; according to De la Barrera Alfredo [
38], he assumes that to form ozone three oxygen molecules are needed, which when bombarded by free electrons, become two free ozone molecules and when dissociated become ozone, that is, three molecules of stable oxygen, repeating the cycle if there are free electrons, reaching the conclusion of an ozone generator.
With these results and in comparison to the effectiveness of typical gas and particle purification, the use of air purifiers in patients with respiratory diseases such as asthma is beneficial for their control, according to Marina [
39]. The use of air decontamination units with HEPA filters according to evaluations reduces 79% of bacteria in the air, and 82% of PM 2.5 according to UDL [
40]. The element proposed in this research reduces 57% of PM 2.5 particulate matter, but it should be noted that only natural and not forced ventilation is used. In addition, in this research, a road with high traffic was chosen, which causes a greater amount of pollutants. For the same reason, according to [
39], electrostatic ionic air purifiers provide little benefit with respect to ozone, since they increase ozone levels. In the present study, an average increase of 118% is observed with a value of 7.98 µg/m
3. On the other hand, in comparison to the maximums that exist, the ozone measured with ionization is lower by 27.3%, this is due to the fact that the high temperatures and the increase in traffic raise the high levels of tropospheric ozone; so it can be seen that this increase in ozone is not as high as the levels in the exterior of the building. Furthermore, with reference to the guideline values in
Table 1, the permissible limit is 100 µg/m
3. The values measured with the ionizing element clearly do not exceed these values.
5. Conclusions
A new and broader perspective on air purification systems in enclosed spaces such as bedrooms, an example of this study, was achieved.
An air purification prototype was developed that makes good use of the lattice prototype and each external measurement sensor as well as the internal measurement sensors, thus offering a considerable reduction of polluting gases and particulate matter caused by environmental pollution; improving the air quality of the domestic indoor environment, and thus preventing the spread of diseases mainly in the respiratory system.
Based on the results obtained in the study, it is shown that the application of the purifying lattice in the window of the room reduced the levels of polluting gases and particulate matter expelled into the room. It is important to note that the values of these parameters are within the maximum permissible concentrations according to NCCA and WHO regulations.
As for the gases, nitrogen dioxide and hydrogen sulfide, based on the results they present a similar quantitative relationship assuming that these gases could not be ionized and that the 13% increase may be due to direct air currents because of the design and inclination of the lattice components pointing towards the gas counter.
At present, there are countless air purifiers whose health benefits are unknown. The use of constructive elements that contribute to human health is one of the innovations that should be tested in areas of environmental pollution. Ionization purifiers increase the levels of ozone that can cause malignant effects on health in high concentrations, being an important point at the time of its use. However, as detailed in this research, the ozone levels produced do not exceed the permissible values; in addition, more tropospheric ozone produced by high traffic and temperatures was observed in the exterior part of the building.
It is recommended that a new case study be conducted in a real scenario, it can be tested with the voltage increase to the mesh used as a retention filter for gases and particulate matter since the ionization energy refers to the amount of energy supplied to an atom for the removal of an electron.


