Article

Modeling and Optimizing the Effect of Palm Oil Fuel Ash on the Properties of Engineered Cementitious Composite

1
Civil and Environmental Engineering Department, Faculty of Engineering, Universiti Teknologi PETRONAS (UTP), Bandar Seri Iskandar 32610, Perak, Malaysia
2
Civil Engineering Department, Bayero University, Kano 700241, Nigeria
*
Author to whom correspondence should be addressed.
Buildings 2023, 13(3), 628; https://doi.org/10.3390/buildings13030628
Submission received: 10 November 2022 / Revised: 8 February 2023 / Accepted: 21 February 2023 / Published: 27 February 2023
(This article belongs to the Section Building Materials, and Repair & Renovation)

Abstract

:
Supplementary cementitious materials (SCMs) are strongly advised as an alternative to cement to reduce its adverse environmental effects. One such SCMs is palm oil fuel ash (POFA), a waste material generated in large quantities in Southeast Asian countries, and there is insufficient data on its use in engineered cementitious composite (ECC). This study aims to optimize the properties of ECC using POFA as a cement replacement, by using 13 mixes developed by response surface methodology (RSM) with the POFA (at 20, 30, and 40% cement replacement levels) and PVA fiber (at 1, 1.5, and 2% volume fractions) as the input factors. The compressive, tensile, and flexural strengths, and tensile capacity (CS, TS, FS, and TC) were assessed. The microstructural properties were determined using Field-Emission Scanning Electron Microscopy (FESEM) and Mercury Intrusion Porosimetry (MIP). Results indicated that while the ductility and strain capacity increased with POFA, the strengths decreased by up to 51.5%. However, a structural POFA-ECC could be made with up to 30% POFA and 1–5% PVA fiber. The RSM optimization revealed 27.68% POFA and 2% PVA fiber as the optimal levels of the input factors, with the experimental validation correlating with the predicted values at less than 10% error.

1. Introduction

Malaysia is the second largest palm oil producer in the world after Indonesia [1]. Indonesia and Malaysia produce over 85% of the world’s palm oil [2]. As a result, approximately 10 million tonnes of solid waste are produced yearly by more than 200 oil mills in Malaysia [3]. Due to the limitation of toxic palm waste disposal methods, mill owners leave the waste at their sites, which pollutes the environment [1,4]. The area becomes a pest habitat, produces a terrible odour, and fills the soil and water with toxic chemicals. Shells, fiber, wasted fruit bunches, and kernels are just a few of the waste products from the palm oil industry that are burned in power plants to create electricity and energy for boilers, producing palm oil fuel ash (POFA) as a byproduct in the process [2]. Since tropical nations are always finding new ways to boost their palm oil output, the amount of POFA is also on the rise, which results in an increased burden on the environment. Malaysia generates approximately 10 million tonnes of POFA annually [5,6]. The abundance of waste materials such as rice husk ash (RHA), POFA, fly ash (FA), ground granulated blast furnace slag (GGBS), oil palm shell (OPS), and palm oil clickers in Southeast Asian countries such as Malaysia, Thailand, and Indonesia has provided the ideal setting for researchers to investigate the possibility of turning these wastes into potential green and sustainable building materials [2]. Hence, researchers have been committed to exploring strategies to transform the enormous palm wastes into substantial resources for potential applications in industry in an effort to address the ecological challenges created by the waste [1,4,5,7].
Numerous studies have found that POFA possesses pozzolanic characteristics [5]. Hence, it can replace some cement in a concrete matrix and other cementitious composites because of its cementitious properties [5,8,9,10]. Cementitious composites’ popularity is owed to their strength, durability, and versatility, in addition to the availability of their ingredients. However, these benefits come at a severe environmental cost due to the high CO2 emissions from cement production. Cement production accounts for 7–10% of the global anthropogenic CO2 emissions, because producing 1 ton of cement leads to the emission of approximately 1 ton of CO2 into the atmosphere [5,11,12,13]. In order to minimize the amount of cement used in cementitious composites, several efforts have been made to utilize supplementary cementitious materials (SCMs), FA, silica fume, metakaolin, and slag.
Furthermore, cementitious composites are highly susceptible to cracking due to their brittle nature [14]. In order to address this problem, the engineered cementitious composite (ECC) was developed in the early 1990s [15]. This high-performance fiber-reinforced composite (HPFRC) class exhibits exceptional ductility with a strain capacity of more than 2% [16,17]. Furthermore, the ECC shows a pseudo-strain hardening behavior after the first crack, unlike ordinary and fiber-reinforced concretes [18,19,20]. This behavior is possible due to the propagation of microscopic steady-state cracks with a width of less than 100 µm [21]. The cracks are maintained at a constant width due to the polymeric fiber bridging effect, achieved by using a volume fraction of 2% or less [22,23].
Additionally, coarse aggregate is not used in ECC, and fine-grained sand (usually silica sand) is preferred to satisfy the conditions necessary for strain-hardening behavior [24, 25]. Hence, ECC uses about four times the cement content used in regular concrete due to the absence of coarse aggregate in the mix [26,27]. Therefore, for environmental sustainability and to reduce the composite toughness so that the fiber bridging effect necessary for the enhanced ductility of the ECC is achieved, FA is usually used in high volumes [28,29]. This method of utilizing POFA will make it easier to resolve environmental issues regarding its disposal and help induce strain-hardening behavior in the ECC. Therefore, lower production costs, enhanced engineering properties, and durability of ECC can be achieved by partially substituting POFA for Portland cement. In addition, POFA can improve ECCs’ ecological properties, promoting a cleaner and more sustainable environment [30].
Although many studies exist on POFA in concrete, limited studies are available on its use in ECC. According to Altwair et al. [30], ECCs’ compressive strength increased when 18% POFA replacement of cement by weight was used, whereas the strength decreased with higher replacement levels. In another study, Altwair et al. [31] investigated the effect of treated POFA and the water-binder ratio on ECCs’ alkali-silica reaction (ASR) resistance. Their results showed that POFA decreased the resistance of the composites to ASR. Furthermore, Johari et al. [32] studied the effect of POFA on the fracture and tensile properties of ECC, and the results show that POFA has positive effects on ECCs’ fracture and tensile properties, which are very promising. Another study revealed that ECC with POFA exhibited a drying shrinkage strain of 920 × 10−6 µε—1216 × 10−6 in contrast to ECC without POFA that exhibited a drying shrinkage of 597 × 10−6 µε—1910 × 10−6 µε [33].
Similarly, other studies reported that POFA-ECC demonstrates increased flexural deflection capacity, sufficient initial cracking strength, and modulus of rupture. Additionally, increasing POFA concentration decreases crack widths and promotes the development of multiple fine cracks in ECCs [34,35]. Despite the positive effects reported by the few studies available in the literature on POFA-ECC, there is a lack of information on the design of an experiment method such as the RSM, which can be used to optimize the variables and properties of the composite, and to develop models that can be used to predict the properties at various levels and combinations of the input factors (independent variables). Furthermore, the few available studies on the use of POFA in ECC employed the use of treated POFA, which requires that the material be subjected to another heating process at about 450 °C—500 °C to reduce its unburnt carbon and increase its reactivity [6,30,31,32]. However, previous studies on using POFA and other agricultural and industry-based wastes showed that it is possible to produce concrete with ground POFA without necessarily subjecting it to the treatment process [36]. Hence, investigating how untreated ground POFA affects ECCs’ performance is one of the goals of this study.
Since numerous elements impact the performance of cementitious composites, it is vital to utilize a robust tool to design a mix with the least amount of time and resources. Because of the need to tailor ECC materials to achieve the desired ductility, microcrack development, and strain hardening behavior, a suitable experimental design (DOE) technique is necessary to produce an ECC that behaves as intended in fresh and hardened stages. Using an experimental design process has the advantages of minimizing the number of experiments and trial batches and determining the optimal levels of the input variables and the response within the design space (optimization). The response surface methodology (RSM) is used in this work to attain these goals.
Response surface methodology (RSM) is a mathematical and statistical approach to the design of an experiment (DOE) in which a set of independent variables known as the input factors influence the outcome of the dependent variables known as the responses [37]. When employing RSM in the field of concrete or ECC design, there are three separate stages which include: (1) performing a series of experimental runs to gather empirical response data; (2) developing response surface models and utilizing analysis of variance (ANOVA) to assess their reliability, and (3) Optimization and experimental validation [38].
Hence, this research aims to use RSM and investigate how POFA replacement and PVA fiber volume fraction (the input factors) affect the ECCs’ mechanical properties (responses). The influence of the input variables on the responses will be assessed through mechanical (compressive strength, flexural properties, and tensile properties) tests and microstructural (Field Emission Scanning Electron Microscopy (FESEM) and Mercury Intrusion Porosimetry (MIP)) tests. Response predictive models will be developed, and multi-objective optimization will be performed accordingly.

2. Materials and Methods

2.1. Materials

Ordinary Portland cement satisfying the requirements of MS EN 197-1:2014C [39] was used in this study. POFA was sourced from a local palm oil mill in Bidor, Perak, Malaysia. The ash was dried in an oven for 24 h at 105 °C ± 5 °C before being ground using a biomass grinding machine to reduce the size. The material was milled using a Los Angeles abrasion machine with 20 steel balls rotating at 500 rpm to decrease the particle size further and increase its reactivity. The milled material was then sieved through 75 µm, which was used for the ECC production. The reactivity of raw materials such as POFA is determined by their physical, chemical, and mineralogical properties [9]. The oxide composition of the OPC and POFA, determined using x-ray fluorescence (XRF), is presented in Table 1. The total silicon oxide, aluminum oxide, and iron oxide contents, and loss on ignition for the POFA are within the acceptable limits for class N pozzolan specified by ASTM C618 [40]. As can be observed, the POFA has a high loss on ignition (LOI) value because it was not subjected to further heat treatment to reduce the unburned carbon. The intention is to assess the feasibility of employing a relatively high LOI POFA in the production of ECC, to minimize the difficulty of further treatment involved in the production of treated POFA (TPOFA), as used in previous studies [30,31].
Furthermore, as shown in Figure 1, X-ray diffraction (XRD) analysis was used to identify the mineral phase composition of the POFA, such as the crystalline and amorphous phases. The percentage of material made up of an amorphous phase was 56.55%, of which 41.67 was amorphous SiO2. This shows that the POFA has a significant amount of amorphous phase and is suitable as pozzolanic material for cement replacement [30]. Silica sand with an average grain size of 110 µm was used as the fine aggregate. The grading curves for the silica sand and POFA are shown in Figure 2. PVA fiber with a length, diameter, tensile strength, and Young’s modulus of 12 mm, 40 m, 1560 Mpa, and 41 Gpa, respectively, were used. The used fibers were industrially coated with an oil of 0.8% by weight to prevent excessive chemical bonding with the cement matrix that causes fiber rupture [14,41,42]. The oil coating significantly reduces frictional stress and interface fracture energy while enhancing tensile ductility [42]. Sika®Vicocrete® high range water reducing admixture (HRWRA) was used as the superplasticizer. The HRWRA is an aqueous solution of modified polycarboxylates with less than 0.1% chloride ion content and a PH of 3–5%.

2.2. RSM Variables and Mix Proportions

The independent variables being the input factors in this research were the POFA replacement of cement at 20, 30, and 40% by weight and the PVA fiber volume fractions at 1, 1.5, and 2%. Using the RSM’s central composite design (CCD), 13 mixes were developed with varying combinations of the input factors and five repetitions of the central points. This is because the CCD configuration produces five repetitions of the mix containing the combinations of the median values of the range of variables, which in this case are 30% and 1.5% for POFA and PVA fiber, respectively. CCD is a design option that works well with sequential experimentation and provides sufficient data for testing the lack of fit when there is not an exceptionally high number of design points [43].
Other materials used in the production of the POFA-ECC, such as the fine aggregate/binder and water/binder, were kept constant at 0.36 and 0.25, respectively, for all mixes based on the proportions of ECC-M45, which is the standard ECC mix used as reference material in most ECC research [21,44,45]. Table 2 shows the RSM-generated mixtures and the quantities of materials used to develop the test samples for each mix.

2.3. Mixing and Sample Preparation

The cement, POFA, and silica sand were mixed dry for 2 min in a pan-type concrete mixer, following a systematic order for obtaining a homogeneous ECC mix. While the mixer was still running, water combined with the HRWRA was gradually added to the mix. The mixing continued for two to three minutes to ensure a homogeneous mixture. Finally, the PVA fiber was gradually added to the mixture to guarantee proper dispersion and avoid fiber balling. Three more minutes of mixing followed until the mixture seemed uniform and consistent, as shown in Figure 3a. The freshly prepared mixture was cast into molds that had been lightly oiled, where it was left for 24 h until it gained sufficient strength and then demolded, as shown in Figure 3b. The samples were cured in water at 20 °C for 28 days.

2.4. Testing

2.4.1. Compressive Strength Test

The compressive strength test was performed on 50 mm cube samples 28 days after casting. The test was performed based on the requirements of ASTM C109 [46] using a 3000 kN capacity universal testing machine (UTM). The load was applied gradually on the sample at a 3 mm/minute loading rate until failure. Three cube samples were tested from each mixture, and the average value is reported as the compressive strength.

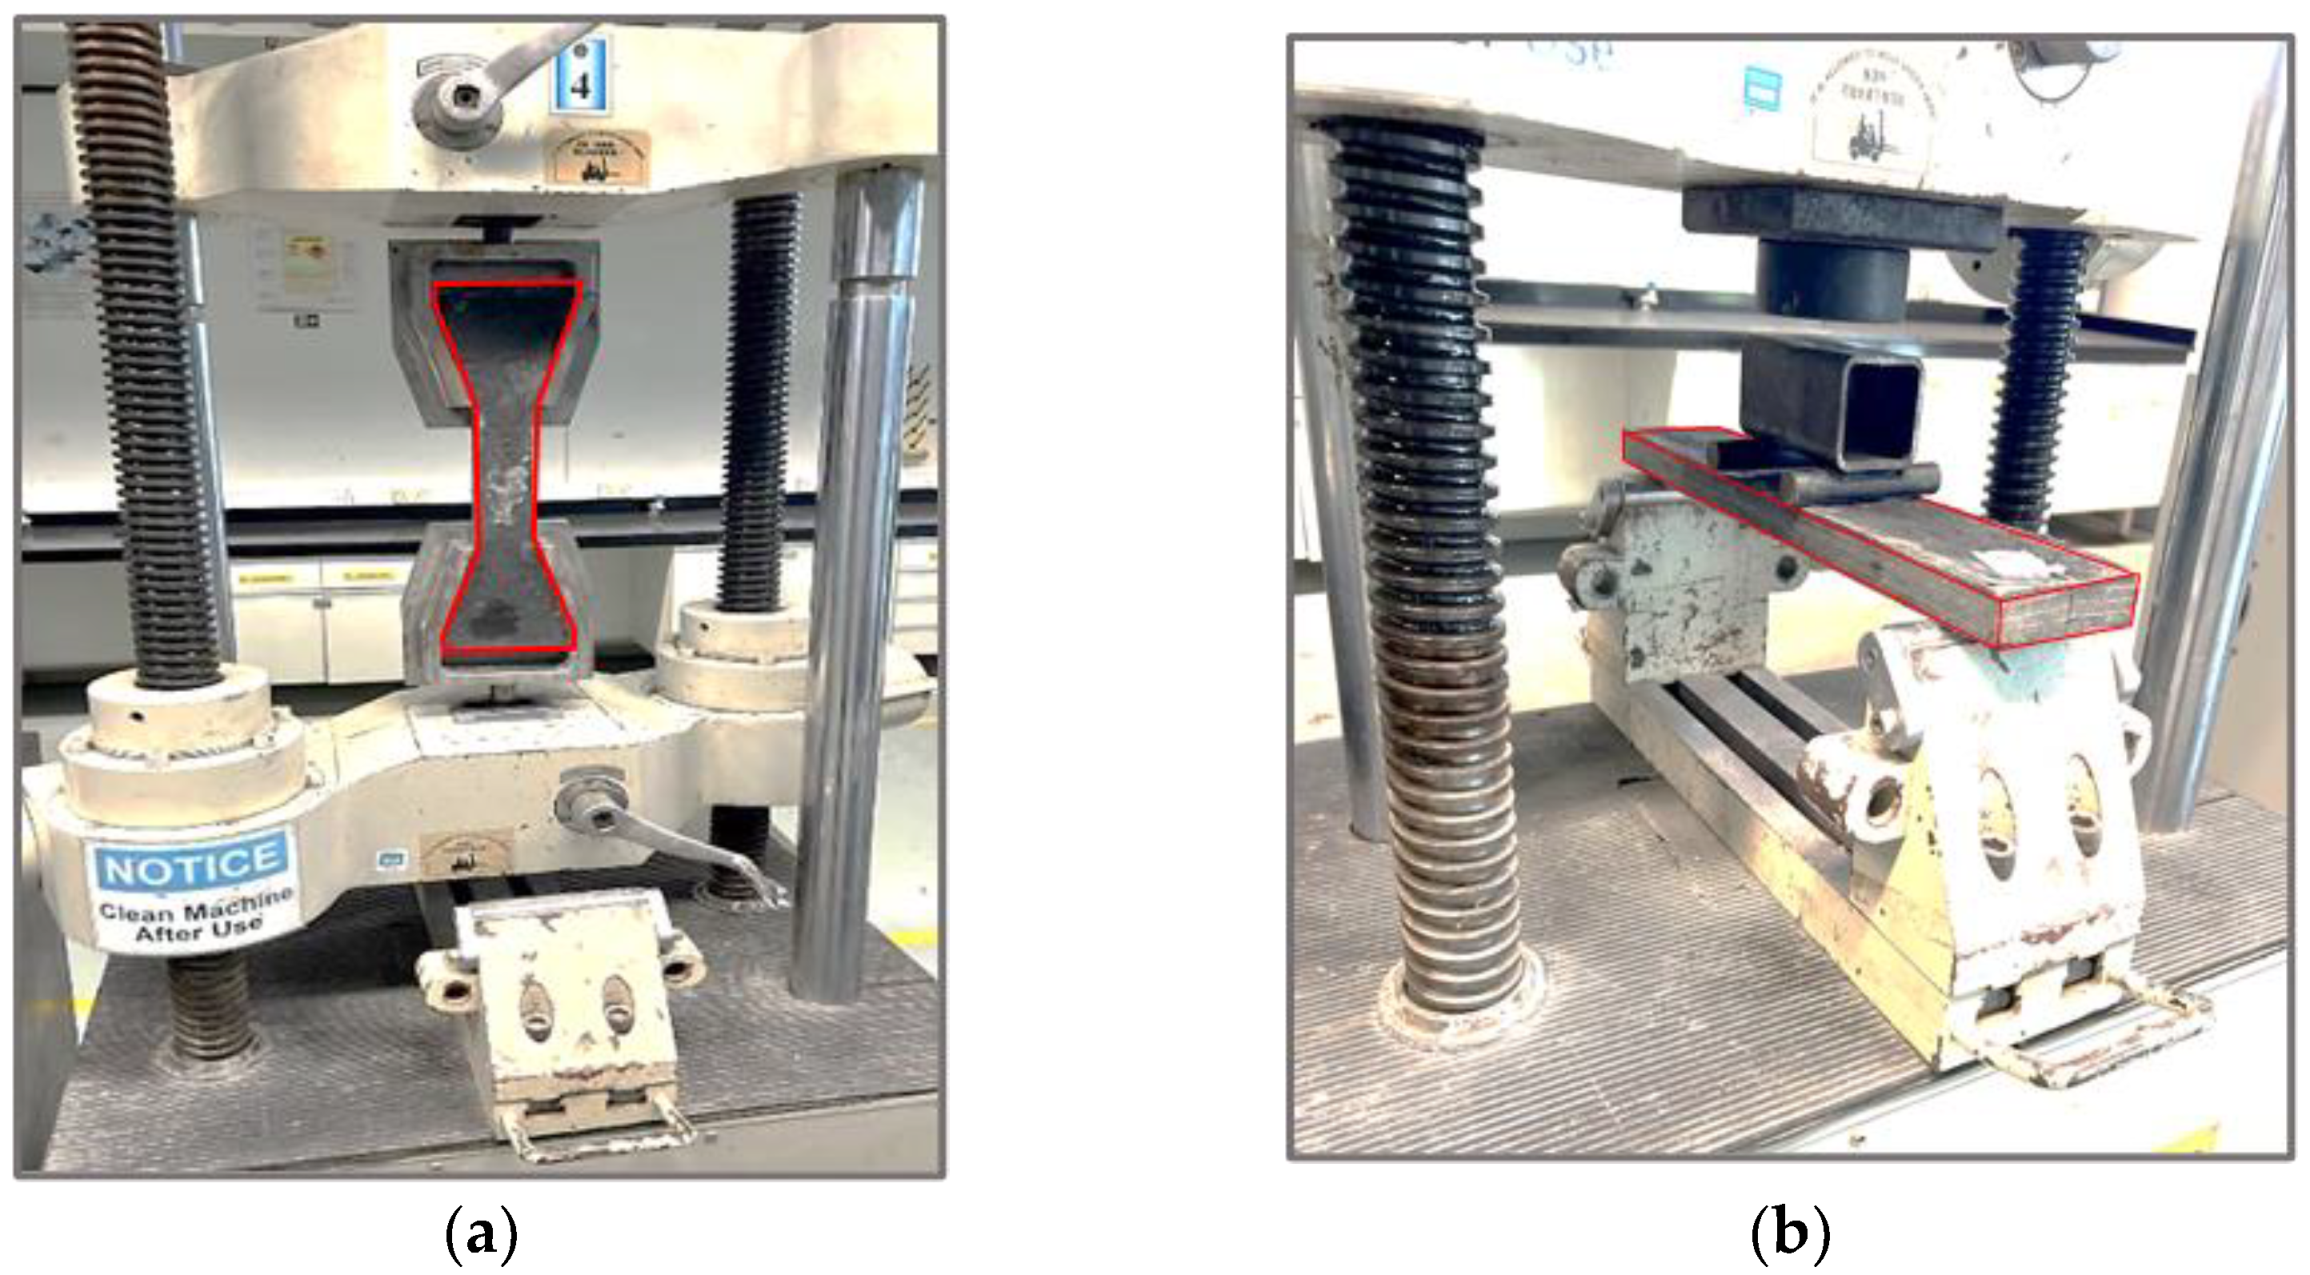
2.4.2. Direct Tensile Test

The tensile test on POFA-ECC samples was carried out by applying uniaxial tensile stress following a standard procedure established by the Japan Society of Civil Engineers (JSCE) [47]. A 420 × 120 × 30 mm dog-bone test specimen was set up between the grips of the 200 kN UTM, as shown in Figure 4a, and was subjected to a uniaxial tensile load at a displacement rate of 0.15 mm/s until failure. The computer displayed the raw data, including the time, displacement, and load. The initial cracking strength, ultimate strength, and tensile strain capacity were then calculated. For each mix, three samples were tested, and the average of the tensile properties was reported.

2.4.3. Flexural Properties Test

The test was performed on 500 × 100 × 25 mm beam samples using a UTM, as shown in Figure 4b. The POFA-ECC prisms were subjected to a four-point flexural strength test using a closed-loop controlled testing system at a loading rate of 0.003 mm/s. A computerized data recording system was part of the equipment that was used for the universal testing system. This allowed for recording both the applied force and the mid-span deflection. In addition, the flexural deflection of the specimen was measured using a linear variable displacement transducer (LVDT), which was incorporated into the testing apparatus. The flexural deflection capacity of POFA-ECC prismatic specimens is determined by using the deformation value at the peak flexural stress of the flexural stress deformation curves.

2.4.4. Microstructural Properties Tests

To obtain insight into the effect of POFA on the microstructure of ECC, field emission scanning electron microscope (FESEM) and mercury intrusion porosimetry (MIP) tests were conducted on some selected samples. The FESEM was conducted based on the provisions of ASTM 1723–10 using a Supra 55VP microscope manufactured by Zeiss, Germany, having a magnification capacity of 900,000X. Slices of around 10 mm were cut from the center of 50 mm cube samples after 28 days of curing. The specimens were coated using a gold sputter before imaging to increase picture clarity. The microscope’s field of view was 2.2 mm by 1.7 mm for each cross-section, equivalent to 1392 by 1040 pixels.
Mercury Intrusion porosimetry (MIP) is a reliable method for evaluating the porosity, pore size distribution, and pore volume in various solid and powdered materials. The test was performed following ASTM D 4284-03 [48] guidelines. Using a Thermofisher scientific porosimeter connected to a computer data collecting system, the tests were carried out on thinly cut samples of about 10 mm. The equipment was run in continuous mode at a 130° contact angle. The pressure was injected between 0 and 414 MPa, which could measure pores between 3 nm and 90 µm in size. The test was performed on three replicate samples from each of the selected mixes.

2.5. Environmental Impact Evaluation of the Use of POFA

The CO2 emissions and energy consumption of each material in the POFA-ECC specimens were calculated using Equation (1) to determine the specimens’ environmental impact. The Equation was used in previous studies [49,50].
CO 2   emissions   and   energy   consumption = i = 1 n k i   ×   w i
where ki and wi represent the CO2 emissions and energy consumption per 1 kg of each ingredient and the weight of each ingredient in kg, respectively.
Table 3 shows each material’s CO2 emissions and energy consumption per kg. The input data for 1 kg of raw material used to calculate CO2 emission and energy consumption levels were sourced from the literature [45,49,51,52]. Since the raw materials used in this study were locally sourced, the statistics on CO2 emissions and energy consumption associated with raw material transportation were disregarded. Additionally, this study’s environmental evaluation considers only the material process. Other environmental assessments were not considered, such as those for mixing, curing, casting, and service life.

3. Results and Discussion

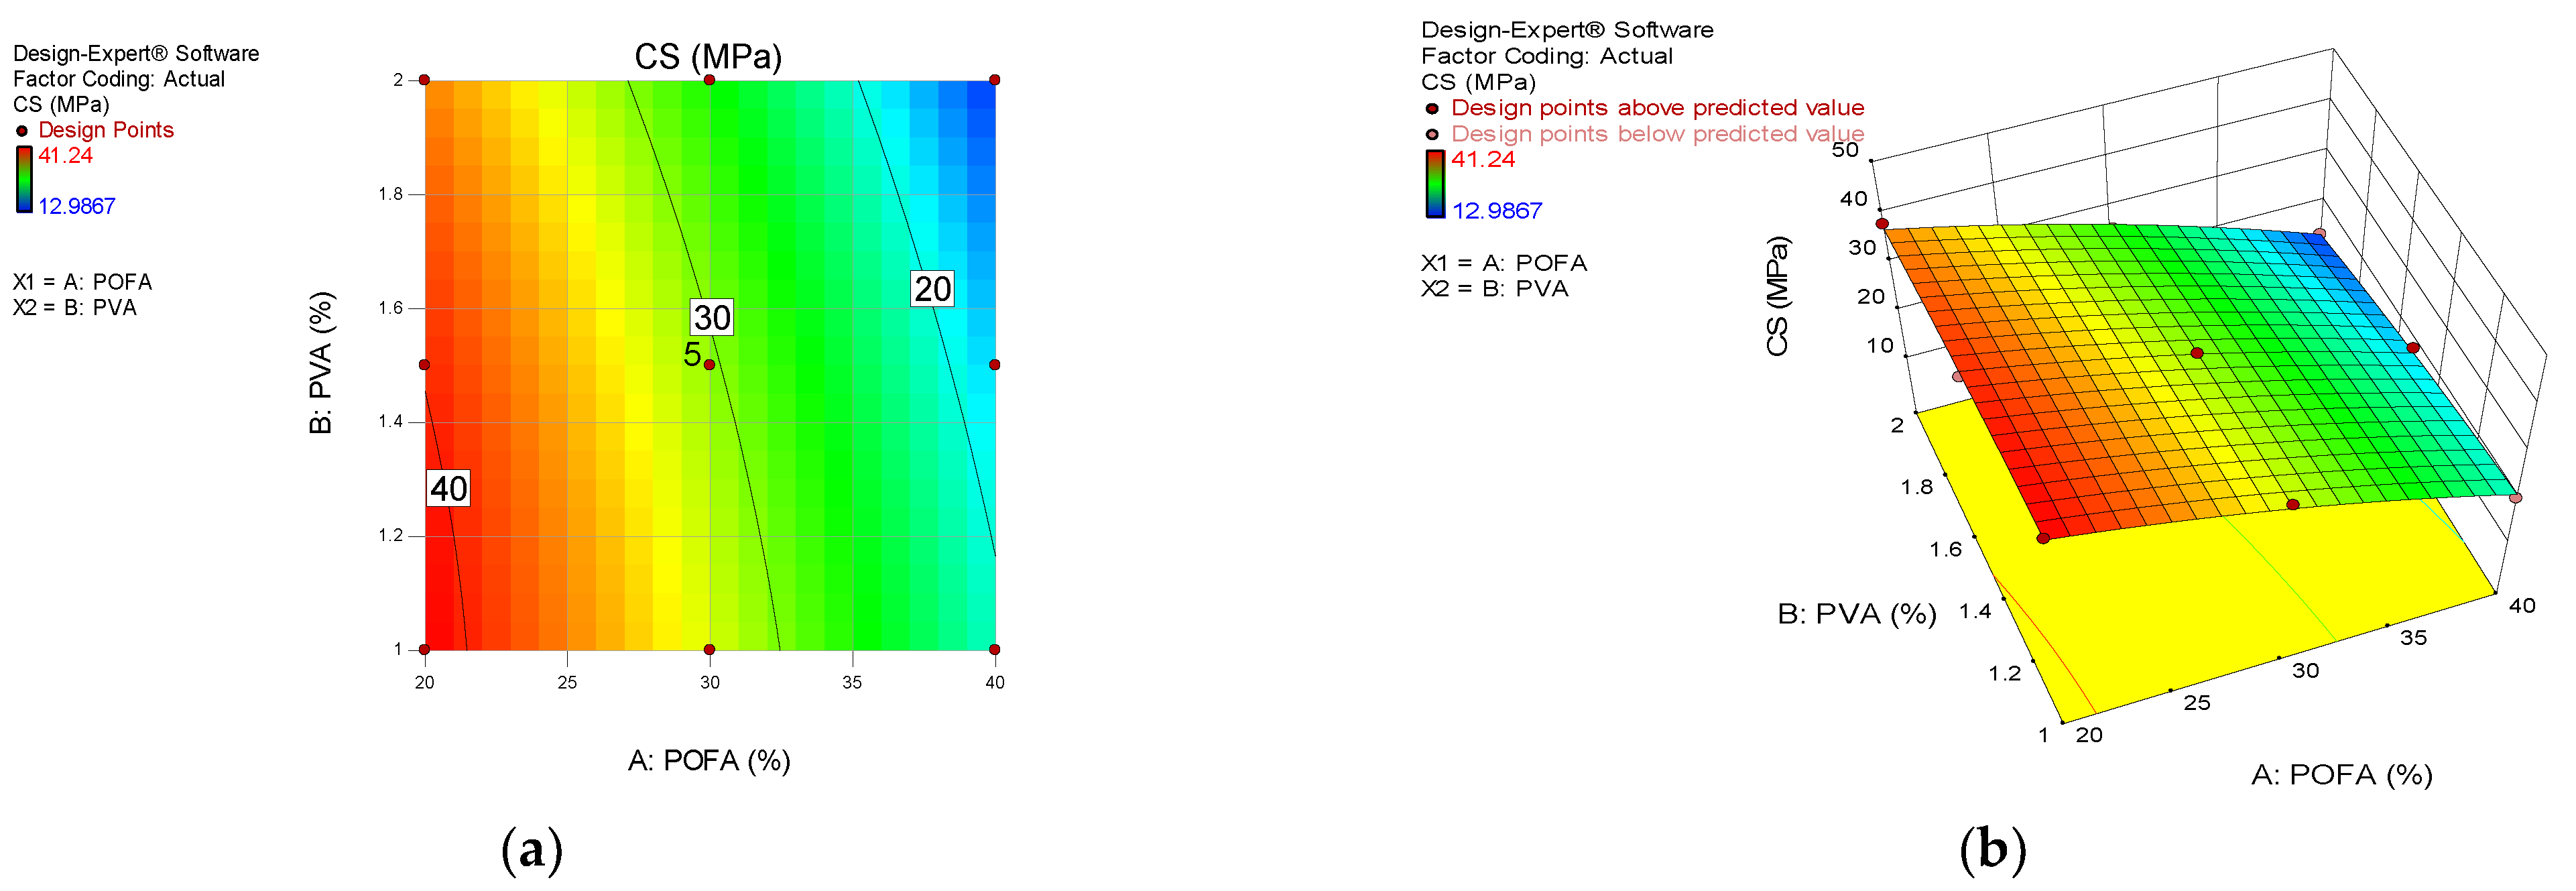
3.1. Compressive Strength of POFA-ECC

The compressive strength results of the POFA-ECC mixes are shown in Figure 5. The results are presented in groups of three mixes containing the same POFA replacement (20–30%) with different PVA fiber contents (1, 1.5, and 2%). The results of nine mixes are presented because the five repetitive mixes of the central points were represented with their average value. The performance of POFA is affected by its chemical composition and fineness because the high carbon content, large particle size, and high LOI reduce its reactivity [5]. To avoid this, previous researchers subjected the POFA to various treatments in order to reduce the particle size, unburnt carbon, and the LOI. However, the POFA was only subjected to grinding in this research, as explained in Section 2.1. The heat treatment was not used in this case to examine how the strength of ECC was affected by the high LOI-POFA. The result ranges from 13.0 MPa (at 40% POFA and 2% PVA fiber) to 41.2 MPa (at 20% POFA and 1% PVA). At 20% POFA and 1% PVA fiber, the compressive strength is similar to the standard ECC-M45 at 28 days, produced by Choo et al. [54].
However, despite the high LOI of the POFA, it is possible to produce an ECC with appreciable compressive strength. The results show a general decrease in compressive strength with the POFA and PVA fiber. The strength is reduced by 19.17 and 51.5% between mix 1 (1% PVA, 20% POFA) and mixes 4 and 11 (1% PVA at 30 and 40% POFA), respectively. A similar loss in strength was observed across all mixes having a similar PVA content at different POFA replacements. This is consistent with previous studies on the use of POFA in cementitious composites [5,6,7,30,31]. The loss in strength with an increase in the POFA replacement is attributed to the following reasons. Firstly, due to the dilution effect, which occurs when ashes are added to cement, there is a reduction in the alite (C3S) amount by lowering the proportion of Portland clinker in the mixture [55,56]. The dilution effect causes a reduction in calcium-silicate-hydrate formation (C-S-H) and a reduction in the pozzolanic reaction [57]. POFA is a pozzolanic material that needs the calcium hydroxide (CH) from the cement hydration before reacting to form C-S-H responsible for strength. Hence, due to this slow reactivity, most of the POFA remains unreactive, especially in the early days when the primary hydration reaction was not completed to yield enough CH for the secondary hydration [5]. Furthermore, due to the dilution effect, as the POFA increased, the amount of cement decreased, leading to a decrease in the amount of CH needed for the pozzolanic reaction [30,32]. A higher POFA replacement resulted in a less workable mix, which reduced compaction and increased the amount of trapped air in the mixture, which raised the composite’s porosity [5].
At all POFA replacement levels, a slight decrease in strength was observed with an increase in the PVA fiber. Previous studies have reported an increase in the porosity of cement composites with the increase in PVA fiber due to the special oil-treated fiber surface trapping air bubbles during mixing [42]. Hence, as the fiber volume fraction increased, more air bubbles got trapped, which later became microvoids within the hardened composite, reducing the strength. Furthermore, with an increased volume fraction, there is an increased tendency for fiber balling, which ultimately affects the uniform fiber distribution and causes a drop in strength due to the poor bonding and lack of proper transfer of stress at the interfacial transition zone (ITZ) of the clumped fibers [18,58].
Despite the decrease in compressive strength with an increase in POFA, the authors produced a POFA-ECC mix with a strength of more than 20 MPa using up to 30% POFA at all PVA fiber volume fractions. The strength values at 20% and 30% POFA are similar to those obtained by Altwair et al. [30] at 28 days and have the same water binder ratio of 0.36 using a treated POFA.

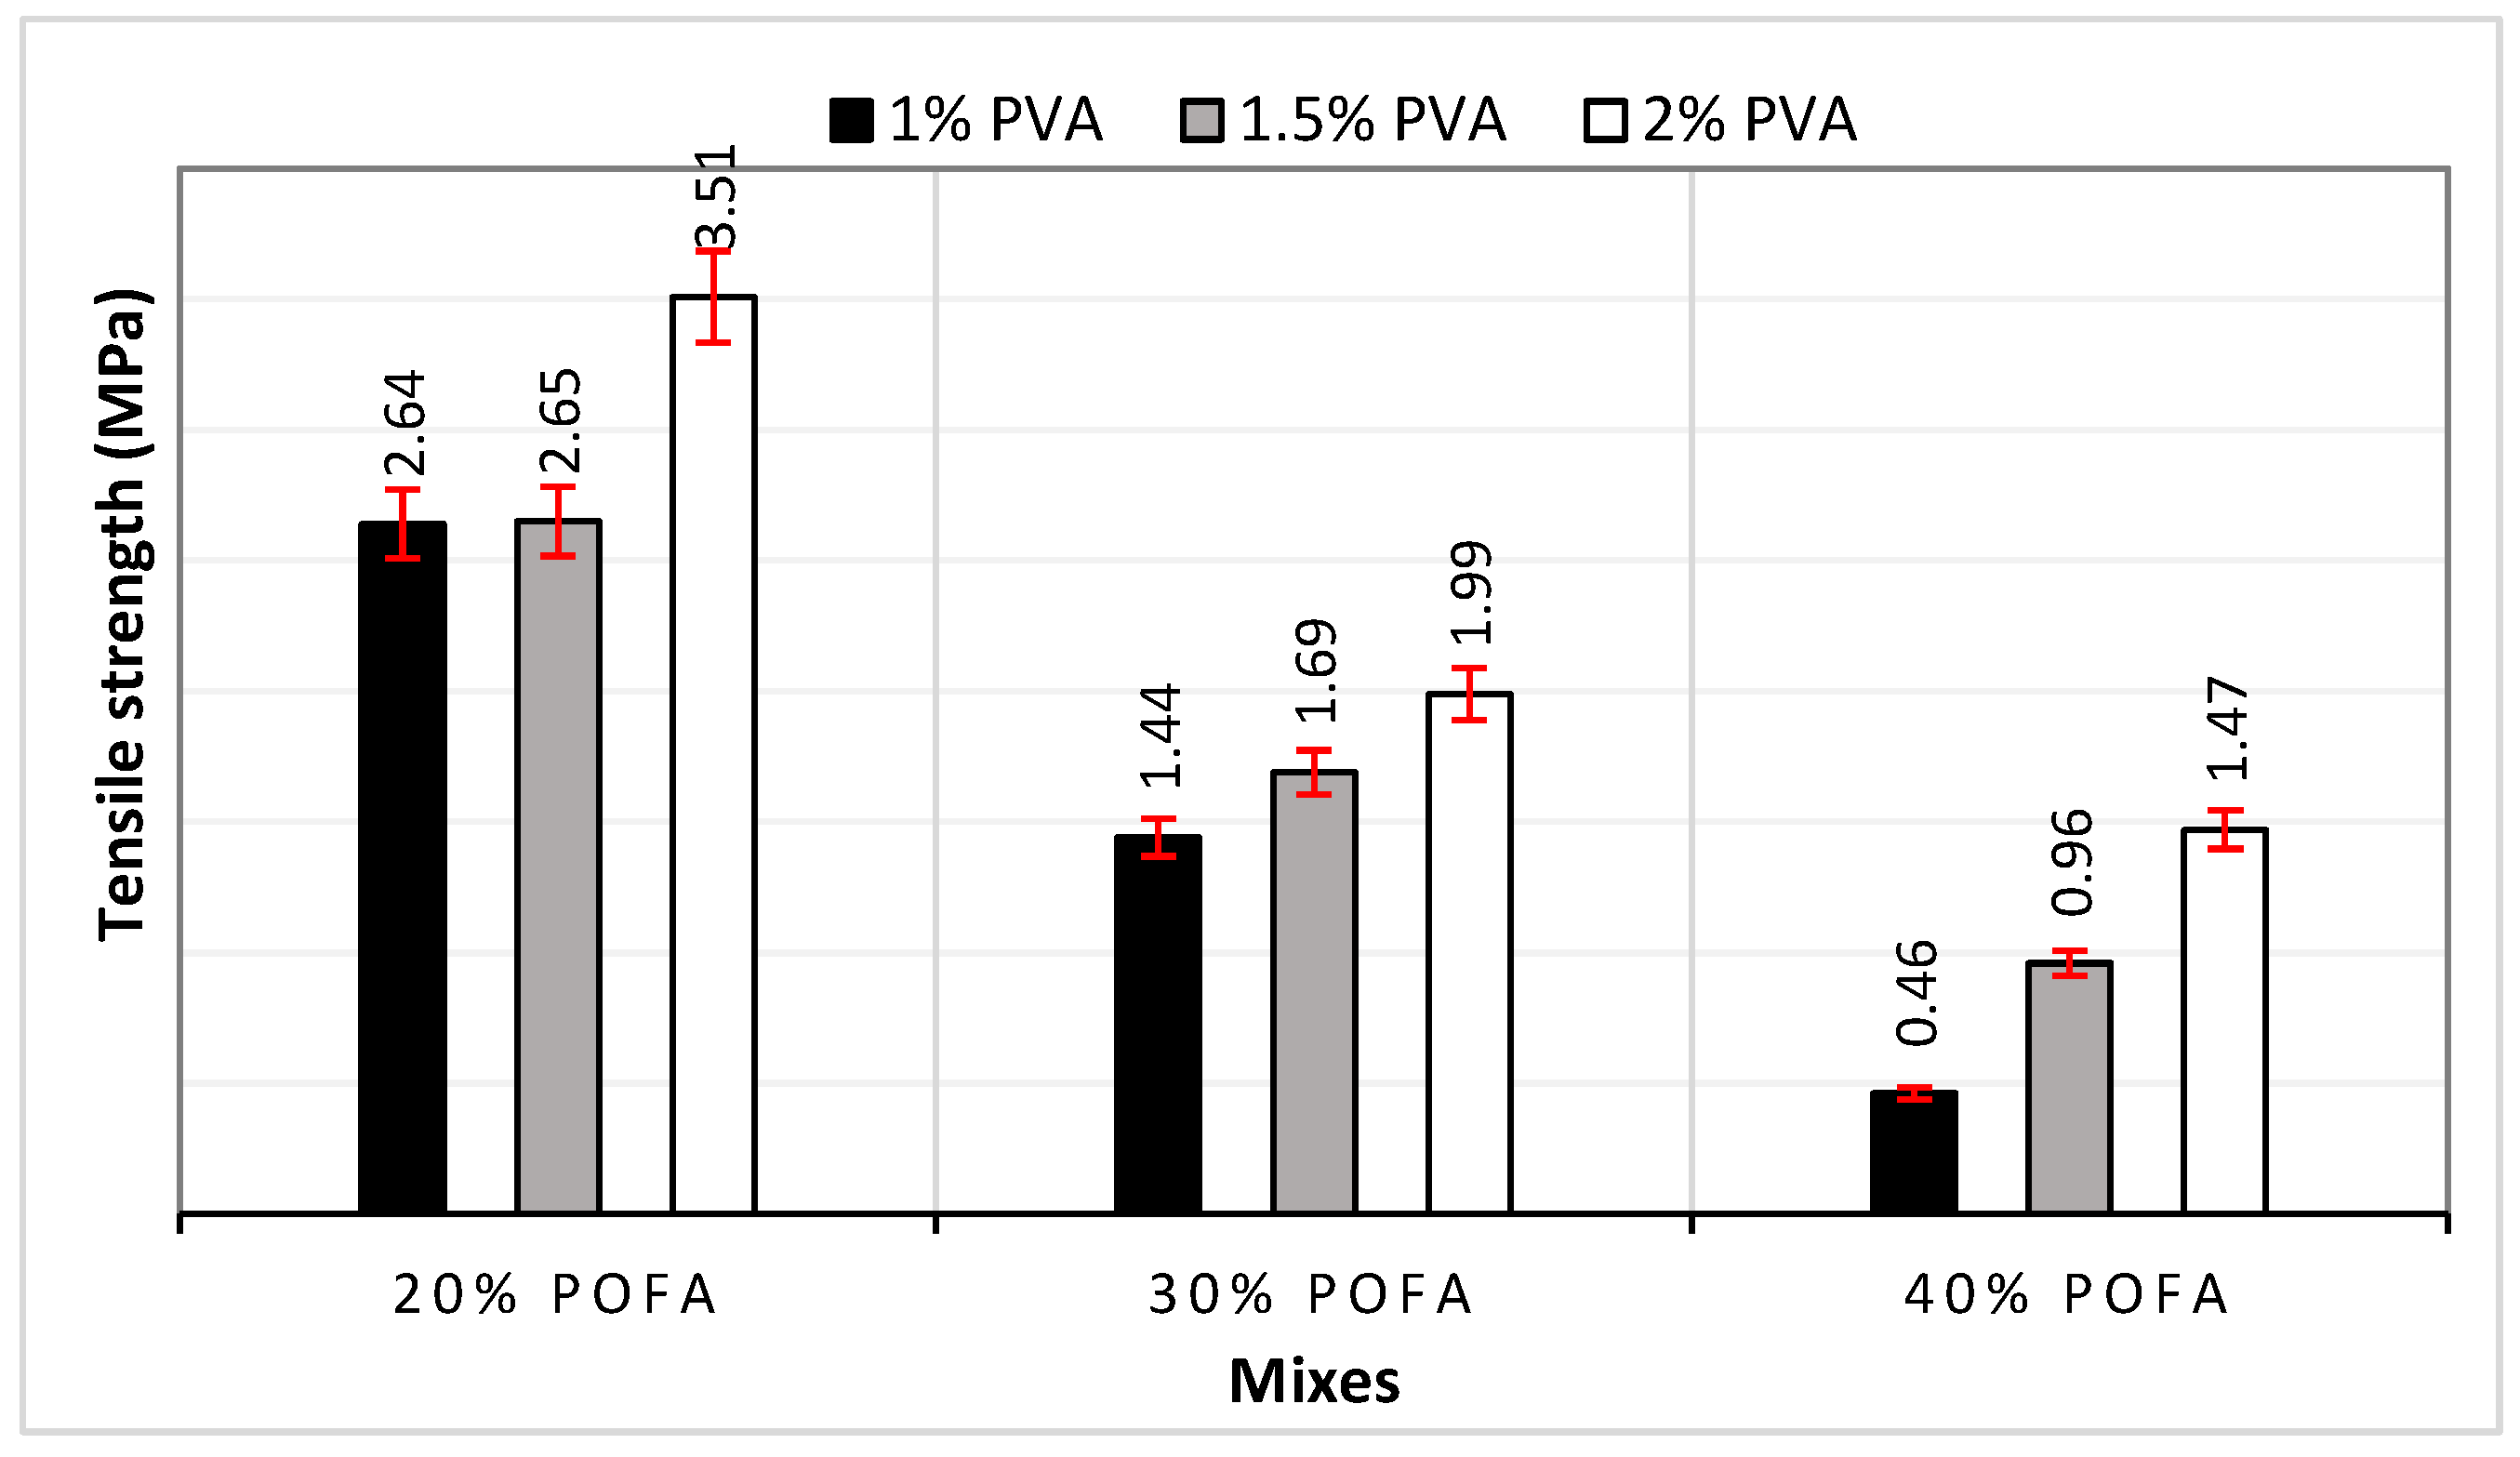
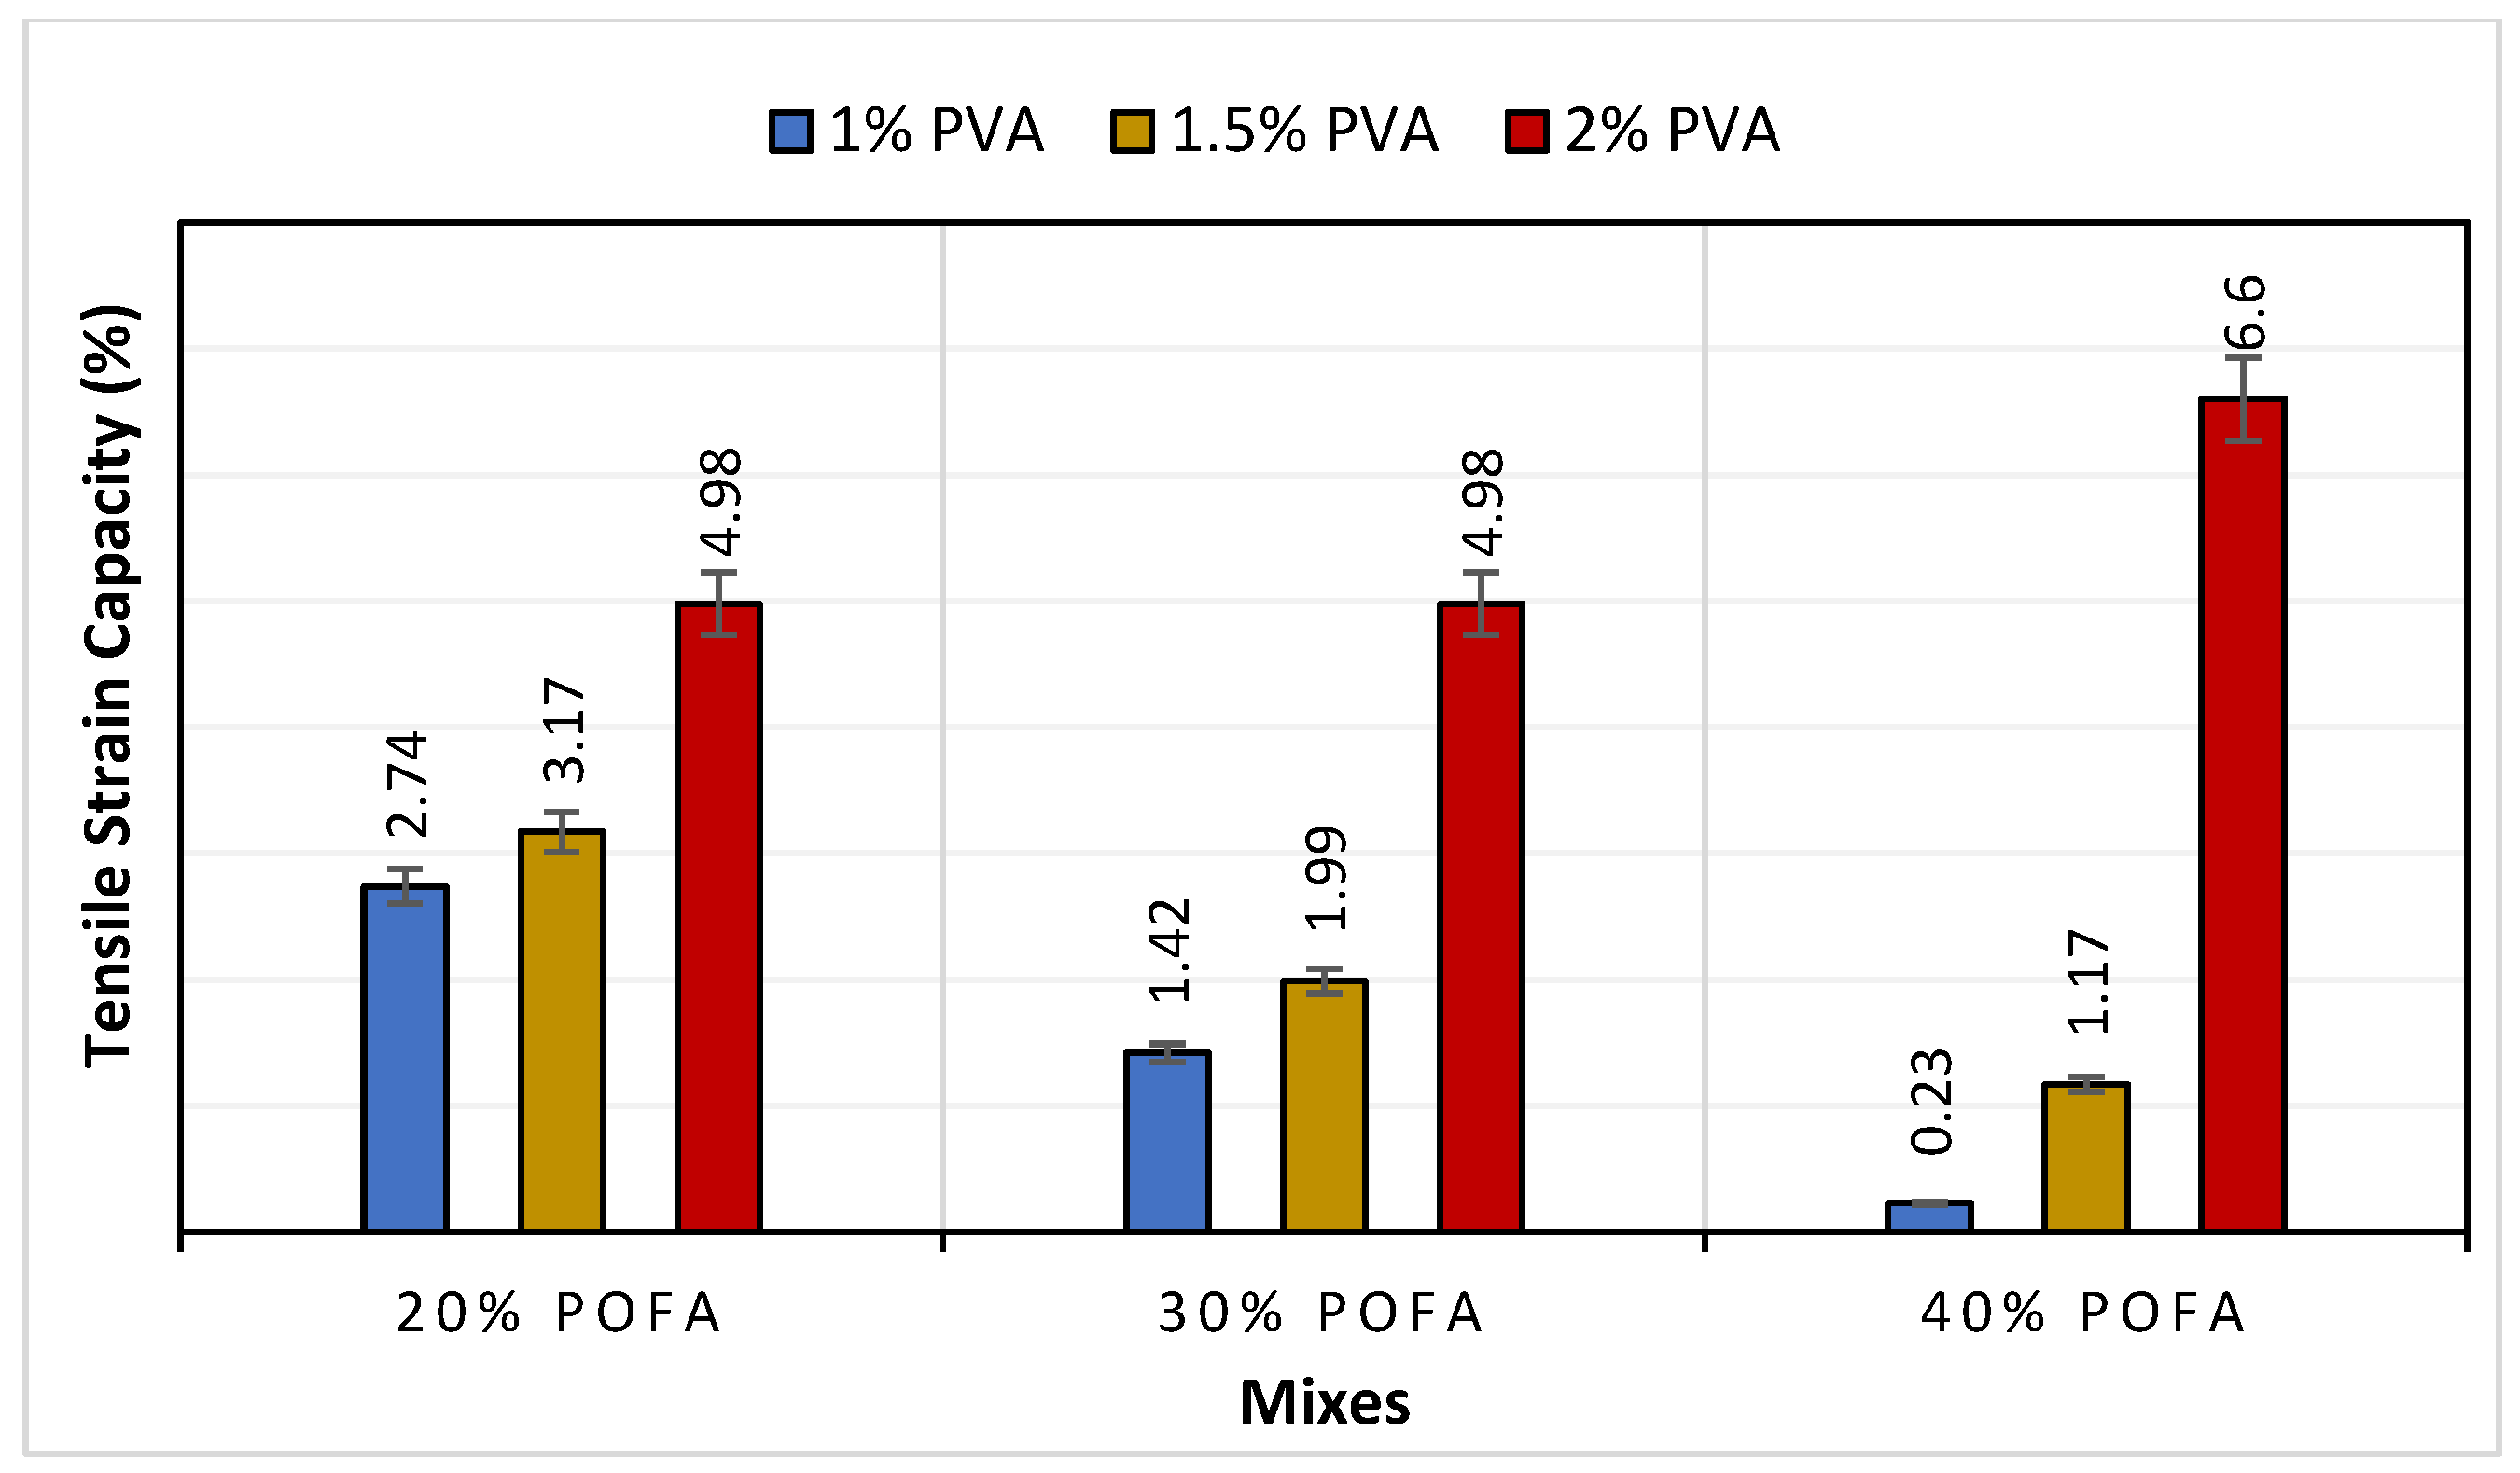
3.2. Tensile Properties of POFA-ECC

The tensile properties of ECC assessed through the uniaxial tensile test include mainly the tensile strength, which is the maximum stress (ultimate stress) the sample can sustain before failure, and the tensile capacity, which is the strain corresponding to the ultimate stress. Others include the first (initial)-cracking strength (the stress that initiates the first crack on the test sample) and the number and width of cracks [17]. These properties are determined through the stress–strain curves. The tensile strength of the POFA-ECC mixes is shown in Figure 6. The tensile strength values range between 0.46 and 3.51 MPa. Similar to the effect on the compressive strength, the tensile and first-cracking strengths drastically decreased with an increase in the POFA replacement. A decrease of 82.5% in the tensile strength was observed between M1 and M11, with 1% PVA fiber and 20 and 40% POFA replacements, respectively. This reduction in the tensile strength with POFA is attributed to similar reasons mentioned above for the compressive strength. The increase in POFA reduced the composite fracture strength because most of it remained unreactive and acted only as a filler [32].
On the other hand, in contrast to the effect on compressive strength, the tensile strength increased with an increase in the fiber volume. Across all mixes with the same POFA content, those with a higher fiber content showed a significantly higher tensile strength. The PVA fiber bridging effect causes this phenomenon. The stress is transferred to the fibers bonded to the matrix as the crack develops, enabling the composite to withstand more stress.
As shown in Figure 7, the strain capacity of the mixes having 1 and 1.5% PVA decreases with increasing POFA. This is due to the toughness-reducing effect of the POFA, especially at low PVA volume fractions [59]. The samples cracked and failed easily because of the low matrix strength caused by the excess unreacted POFA particles and the lack of adequate fibers to bridge the cracks and transfer the stress. This explains why there is a noticeable increase in the strain capacity with increasing fiber content among samples having the same POFA content. However, as the PVA fiber increased to 2%, the mixes’ strain capacity increased with POFA, especially from 30 to 40%. Therefore, as the POFA and PVA were raised to 40% and 2%, respectively, the ductility of the POFA-ECC improved more noticeably. However, with the strain capacity of the mixes at 1.3–6.6%, most of the mixes exhibited a high ductility typical of ECC.
Due to the high ductility of the mixes, they all displayed the typical strain-hardening behavior, as shown in Figure 7. This is shown by how the samples sustained more load beyond the first-cracking stress of the composite. The strain-hardening behavior of ECC is due to the development of steady-state microcracks. The ECC is designed such that the matrix, the fiber, and their interface (ITZ) all participate in the microcrack propagation. This behavior is attributed to the PVA fiber bridging effect and the POFA’s matrix toughness-lowering effect [60]. This was made possible by the cracks being bridged by PVA fibers evenly distributed throughout the composite, preventing them from becoming Griffith-type cracks, which could have caused strain softening similar to that of ordinary fiber-reinforced concrete under load [60].
Another critical parameter is the first-cracking strength which is the stress value that corresponds to the curve’s initial stress drop [19]. There is a close relationship between the first-cracking strength and the matrix fracture toughness. Hence, as can be observed in Figure 8, M1 (20% POFA, 1% PVA) has the highest first-cracking strength of around 1.2 MPa, which is associated with the higher matrix fracture toughness (as can be seen from its high compressive strength), which means it needs a relatively higher external force/energy to initiate a crack [19]. For the multiple saturated cracks to propagate, the crack tip toughness should not exceed the complementary energy (energy required to initiate a crack in the composite) [19,61,62]. In this case, the previously mentioned condition is not satisfied, leading to higher energy requirements due to the composite’s relatively higher crack tip toughness. In contrast, M4 (30% POFA, 1% PVA) has the lowest first-cracking strength, attributed to the higher POFA content, which affected the workability of the mix in the fresh state, leading to poor dispersion of the fibers and poor compaction. These led to a higher porosity of the microstructure and low first-cracking strength and tensile capacity of the mix [63].

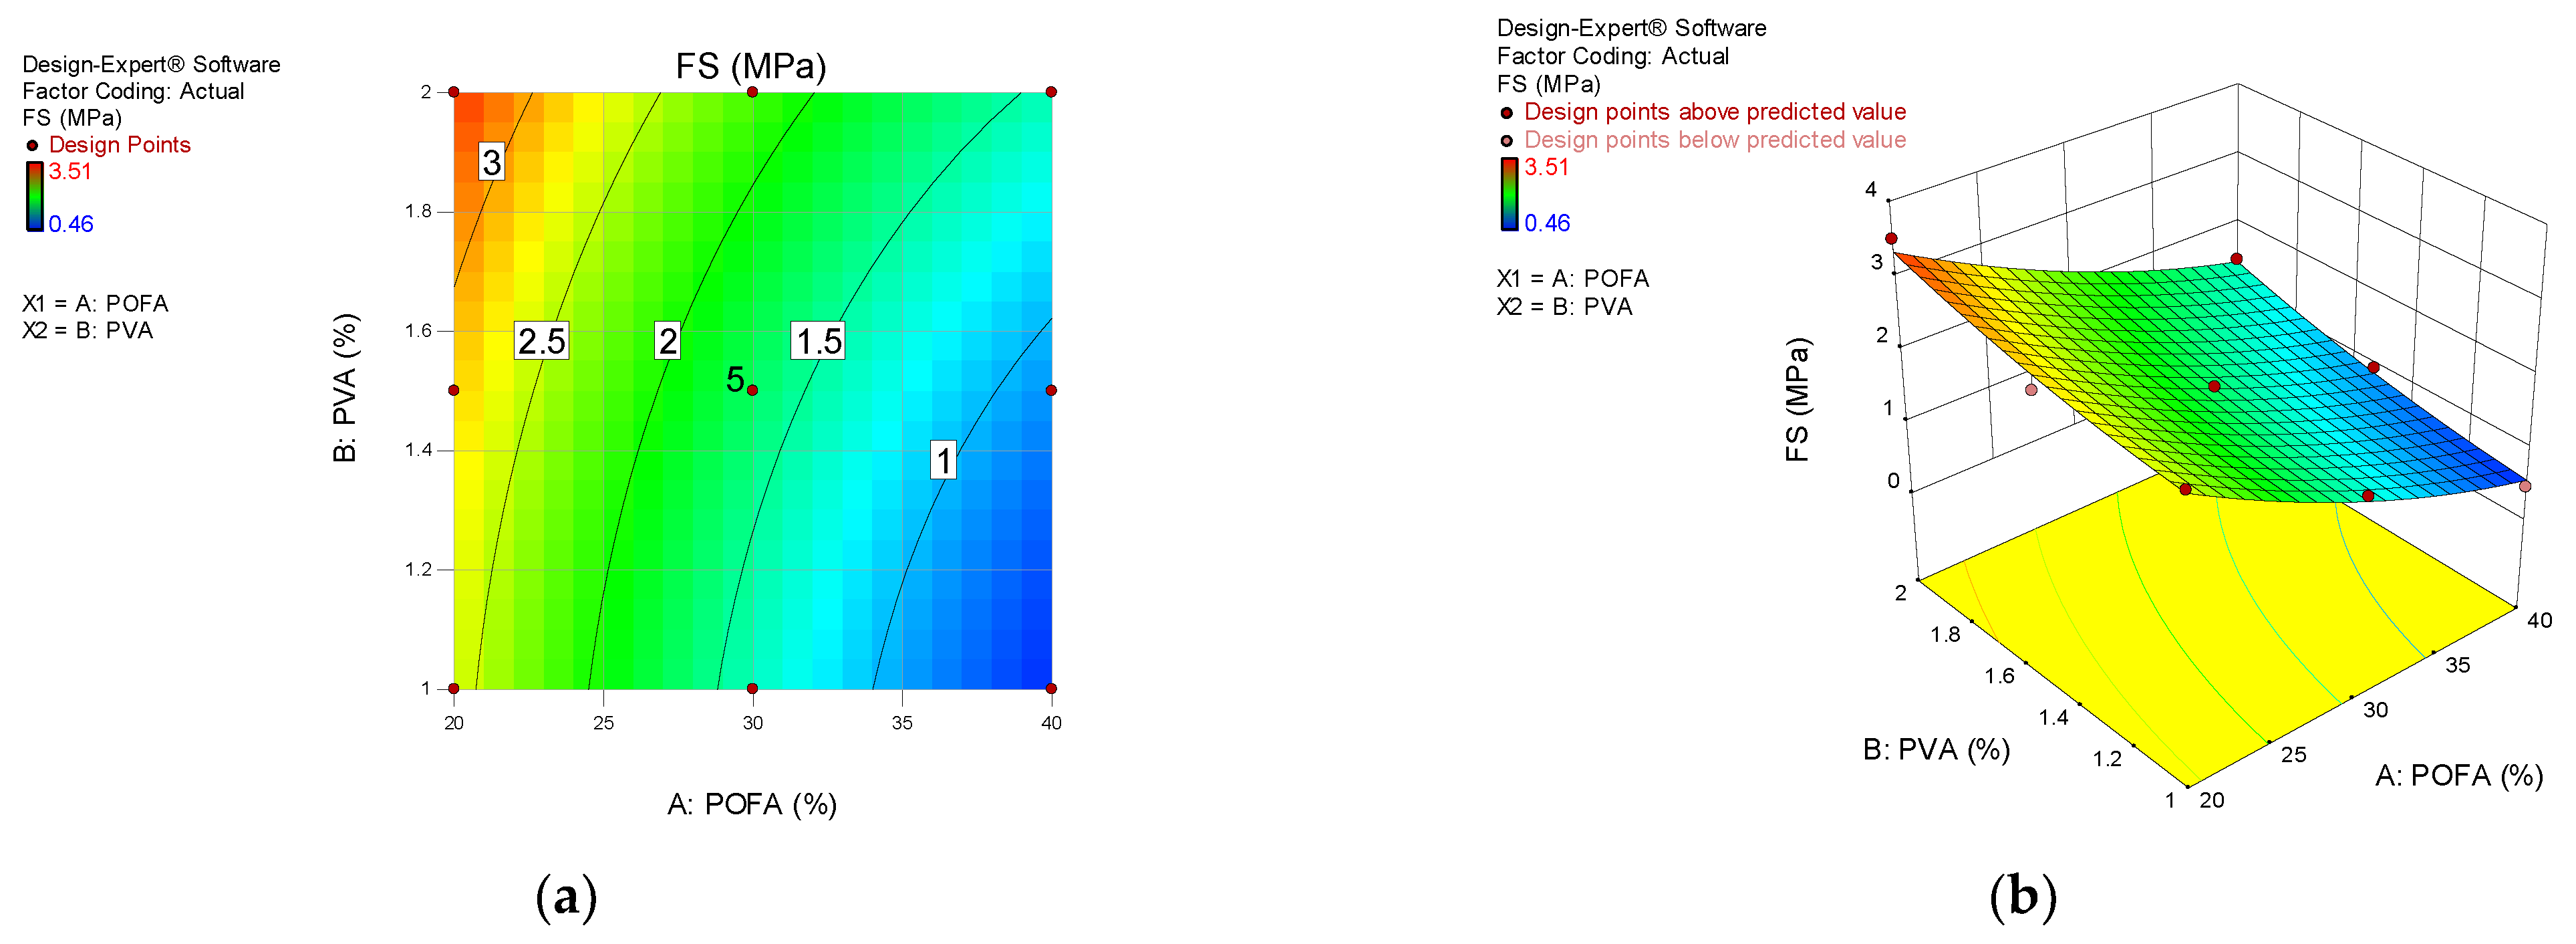
3.3. Flexural Behavior of POFA-ECC

The flexural strength result is shown in Figure 9. The strength is also known as the modulus of rupture of the material and is defined as the greatest stress the sample can sustain before failing. In this case, the strength values ranged from 3.07 MPa to 7.29 MPa. These values are within the range of flexural strength values of some ECC mixes discussed in the literature [17,18,64,65]. The flexural strength slightly decreased when the POFA increased from 20% to 30%, and the decrease was more significant at 40% POFA. As shown in Figure 10, the first-cracking strength followed a similar trend to the flexural strength of the mixes. Due to the increase in POFA and the corresponding decrease in cement content in the mixture, the primary hydration was insufficient to provide a significant amount of strength, especially at the 28 days of curing considered. As a result, the increase in POFA replacement reduced the composite’s flexural strength [30,60]. The loss of flexural strength was more significant when the POFA increased from 30 to 40% than from 20 to 30%. This shows that the flexural strength of the mix at 30% POFA is similar to that at 20%. Additionally, with the increase in the PVA fiber, there was an increase in the first-cracking and flexural strengths of the mixes, especially at the 1.5% and 2% additions. As explained earlier, the presence of fibers enhances the fiber bridging effect and the redistribution of stress across the microcracks, translating to enhancement in the strength of the composite. Similarly, the fiber bridging effect confines the matrix microstructure, enhancing energy absorption and toughness of the composite, as demonstrated in the increase in strengths with the PVA [66].
As mentioned in the case of the tensile properties, the mixes displayed the strain hardening behavior as shown in the load-deflection curves in Figure 11. For the strain hardening behavior to occur, the fiber bridging stress must be greater than the matrix fracture toughness [65]. The POFA matrix toughness-lowering effect achieves this condition because most of it remained unreactive in the matrix, serving as a filler; and due to the porous nature of the POFA particles, they served as micro defects within the composite, causing the easy initiation of the saturated microcracks.
On the other hand, the deflection of the samples significantly increased with an increase in the PVA fiber, as shown in Figure 11. The fiber bridging effect enhanced the samples’ energy absorption, leading to an increase in the mid-span deflection values, as can be observed for M3 (20% POFA, 2% PVA) and M10 (30% POFA, 2% PVA). The use of oil-coated PVA fiber reduced the excessive bonding between the fiber and the matrix that would otherwise occur, leading to fiber rupture under load, which would cause the widening of the crack and eventually strain-softening behavior [14,67]. However, in this case, there was an adequate bonding to allow the propagation of controlled saturated microcracks necessary for the strain-hardening behavior in all the samples. Furthermore, to reduce the matrix fracture toughness (Jb), one of the conditions necessary for the strain hardening behavior, the use of high-volume fly ash is recommended; in this case, the POFA is used in its place [14]. It has been proven that adding inert fillers to ECC would break the uniformity of the matrix, making it easier to generate microcracks [14]. High mid-span deflection values were achieved for M3 and M10 due to the increased energy absorption caused by the high PVA fiber content (2%).

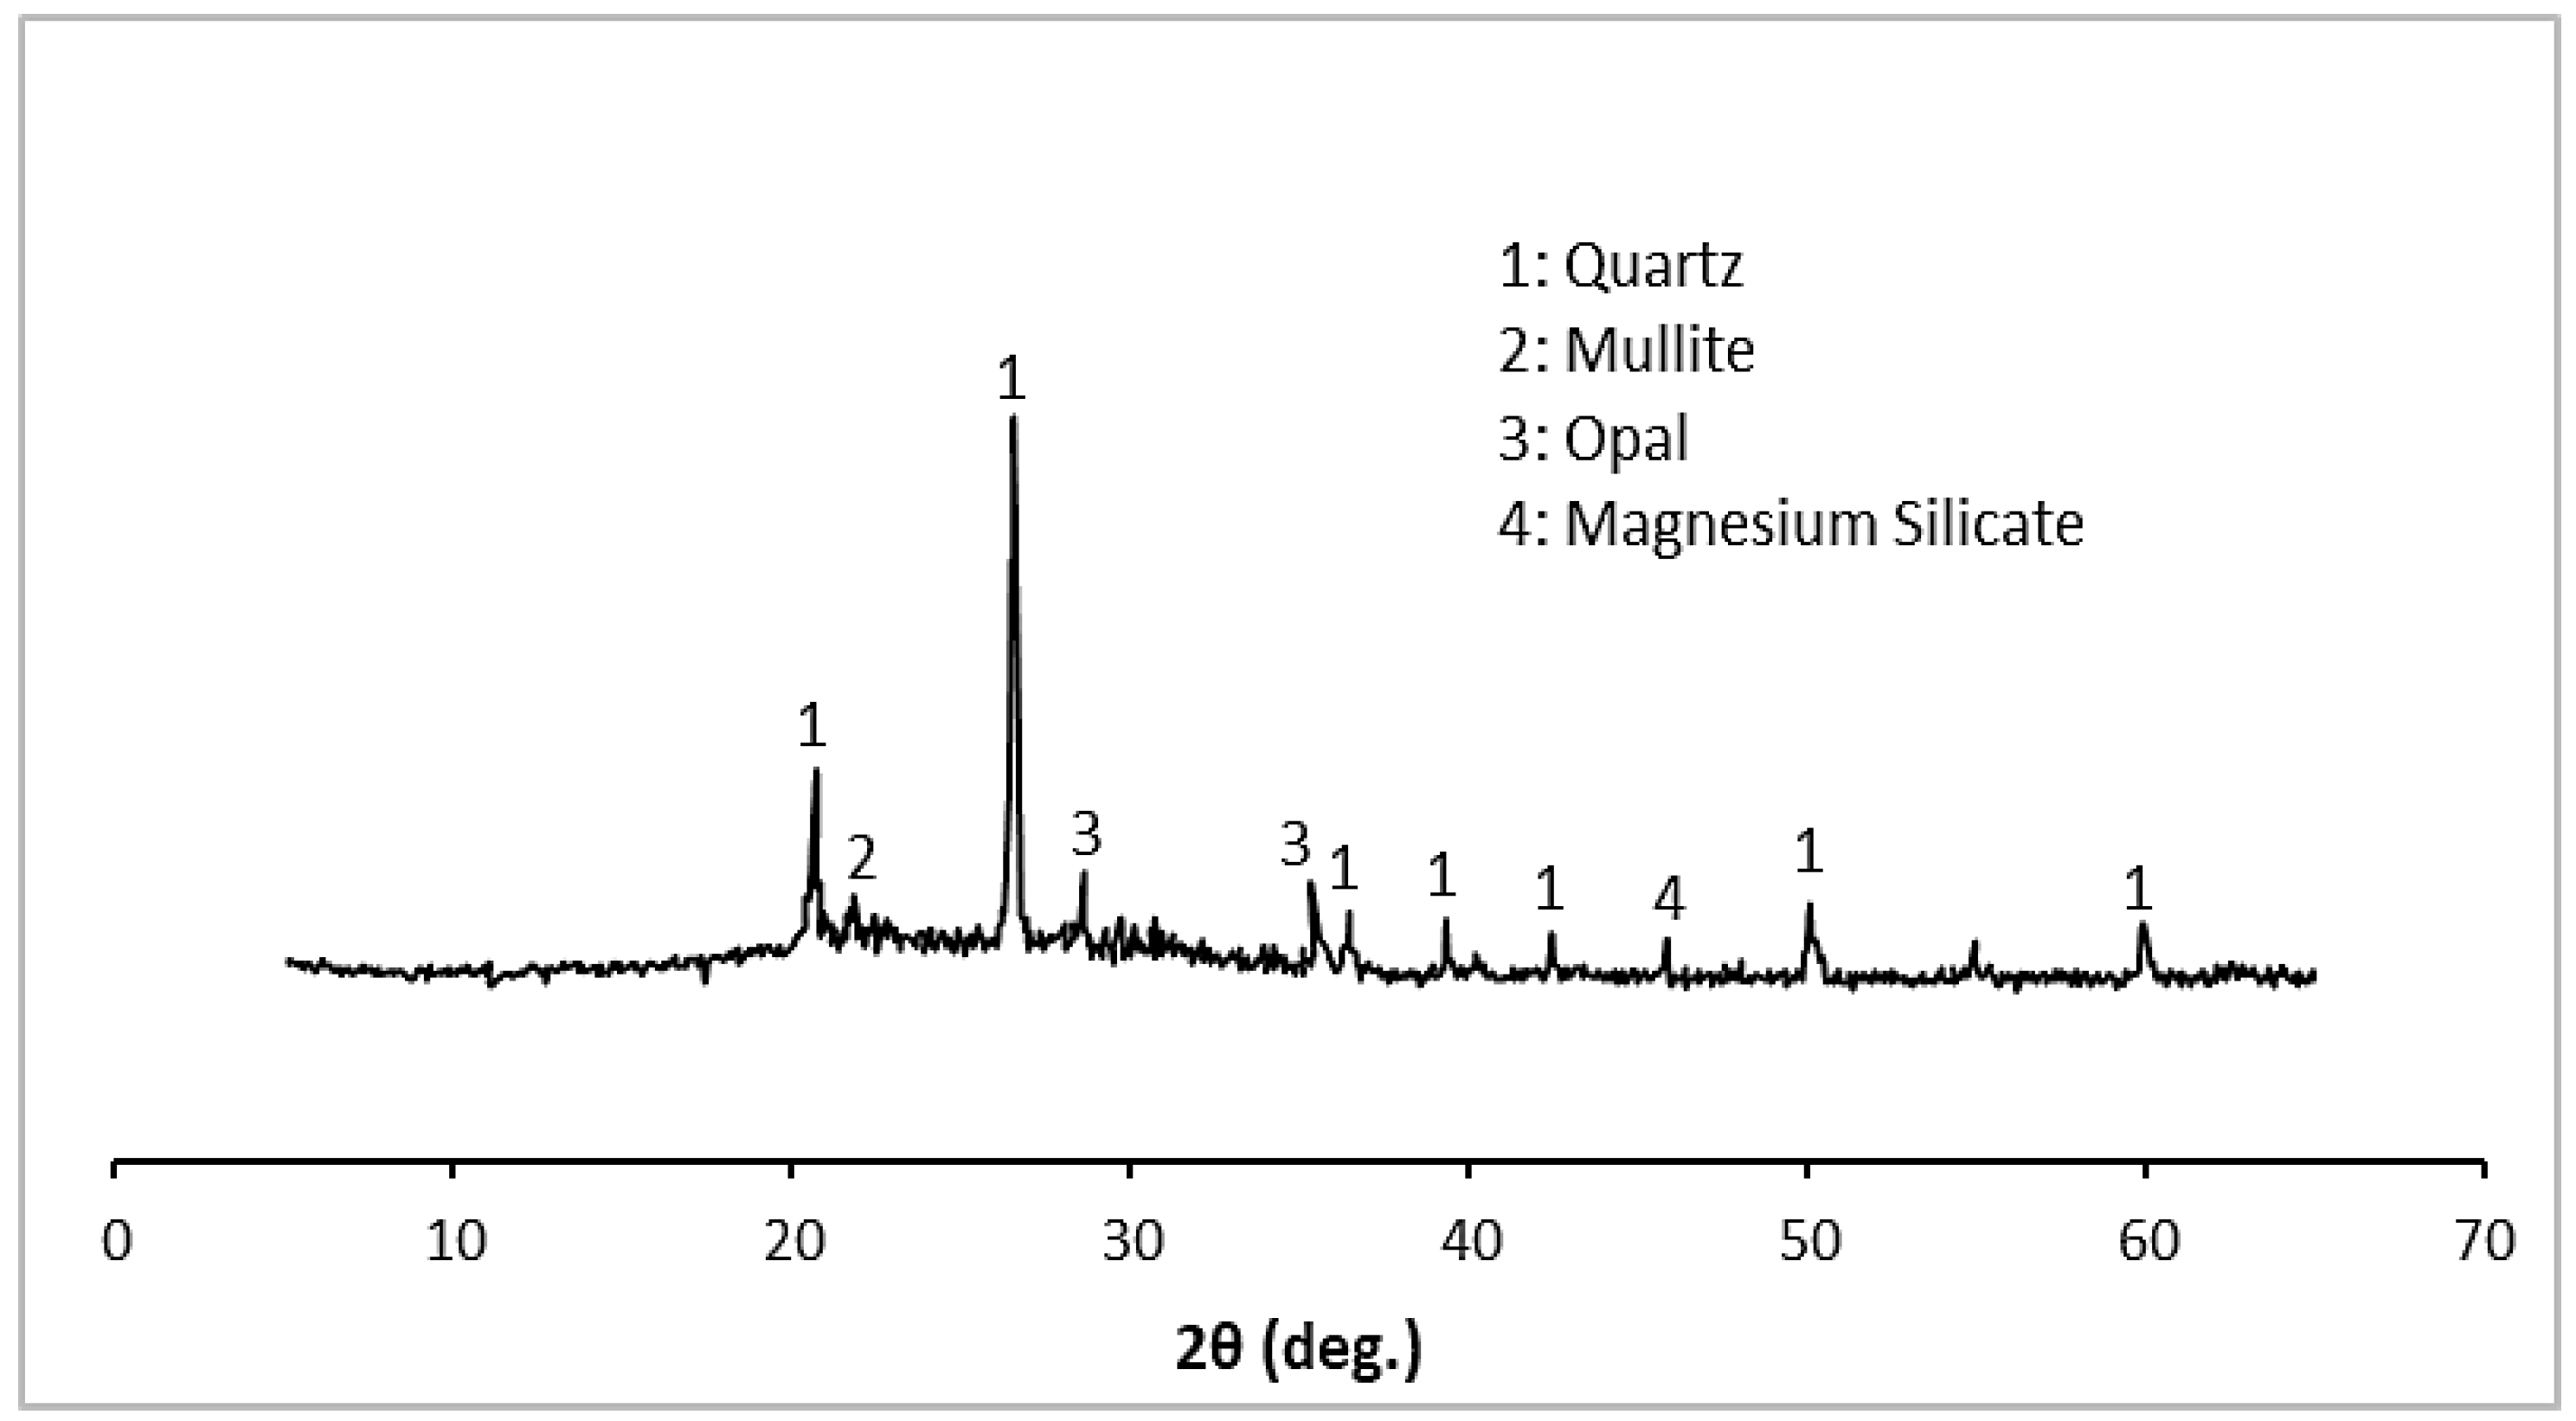
3.4. Microstructural Properties of POFA-ECC

To obtain more insight into the microstructural properties of the POFA-ECC, Field Emission Scanning Electron Microscopy (FESEM) was performed on some selected mixes. The FESEM micrographs show the presence of more unreacted POFA in mixes with higher POFA replacements, which is due to the slow pozzolanic reaction and the dilution effects, as explained earlier. Furthermore, due to the porous nature of the POFA particles, as shown in Figure 12a, at higher POFA contents, most of it remained unreactive in the composite, as shown in Figure 12b, causing a reduction in the toughness and strength of the composites. This is contrary to mixes having lower POFA content, as shown in Figure 12c. Similarly, a micrograph of mixes with higher PVA fiber contents shows how the fibers could tangle together to cause a reduction in the compressive strength due to poor bonding with the paste, as indicated in Figure 12d.

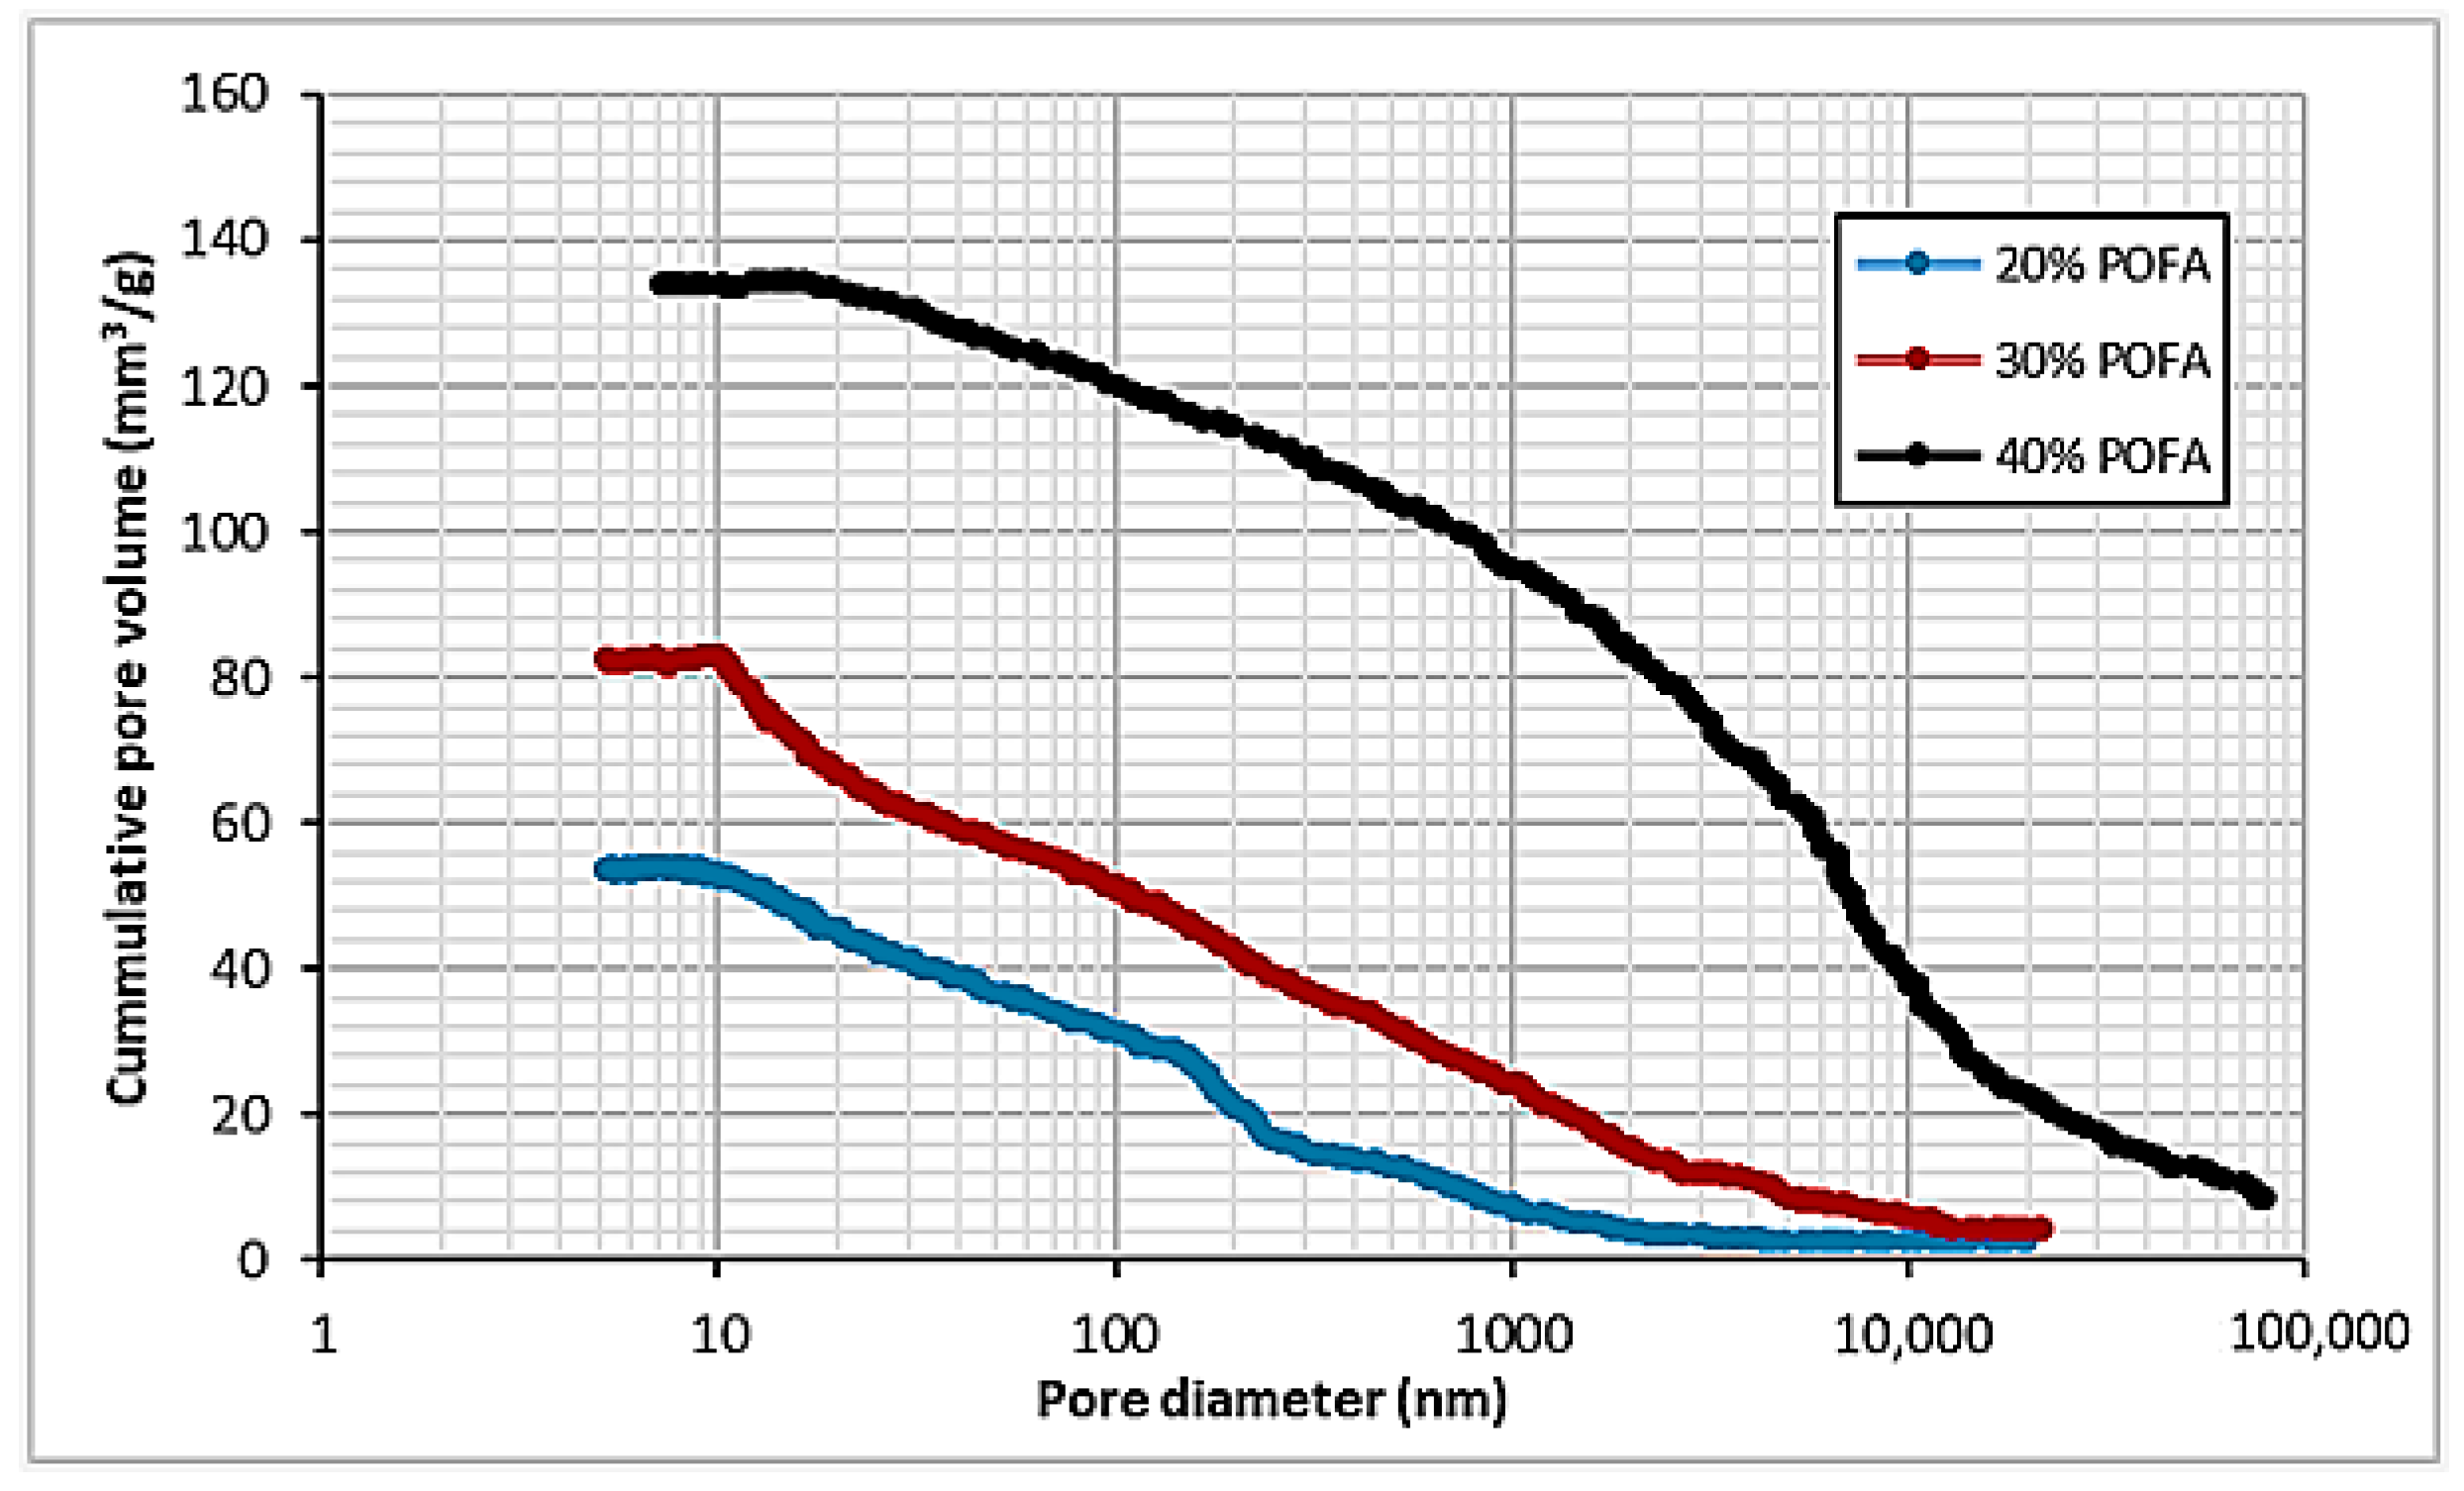
3.5. Mercury Intrusion Porosimetry (MIP)

The MIP results, as displayed in Table 4 and Figure 13 demonstrate that the total pore volume rises as POFA increases. The highest pore volume is 133.23 mm3/g in the mix containing the highest percentage of POFA (40%). In contrast, the mix with a low percentage (20%) of POFA has the lowest total pore volume of 41.36 mm3/g. Similarly, there was an increase in the pore volume with an increase in the PVA addition. This is in line with earlier research that demonstrated increased porosity when fibers were added to the mixture. This was attributed to the fibers’ hydrophobicity, which caused air to be trapped on their surface during mixing and their propensity to clump together, which caused improper compaction of the mix, trapping air in the process [18,68]. High porosity is associated with loose microstructure leading to reduced mechanical strengths of cementitious composites. Hence, the pore distribution is crucial as it affects the strength of the microstructure. As pointed out by Zhou et al. [69], pores larger than 100 nm have a detrimental effect on the strength development of concrete. This principle also applies to POFA-ECC. From the cumulative pore volume of some selected samples shown in Figure 13, it can be observed that the sample with the 40% POFA has the highest pore volume greater than 100 nm. This is consistent with the earlier discussions of how the slow reaction and porous nature of POFA caused the mechanical strengths of the POFA-ECC to decline with an increase in POFA.

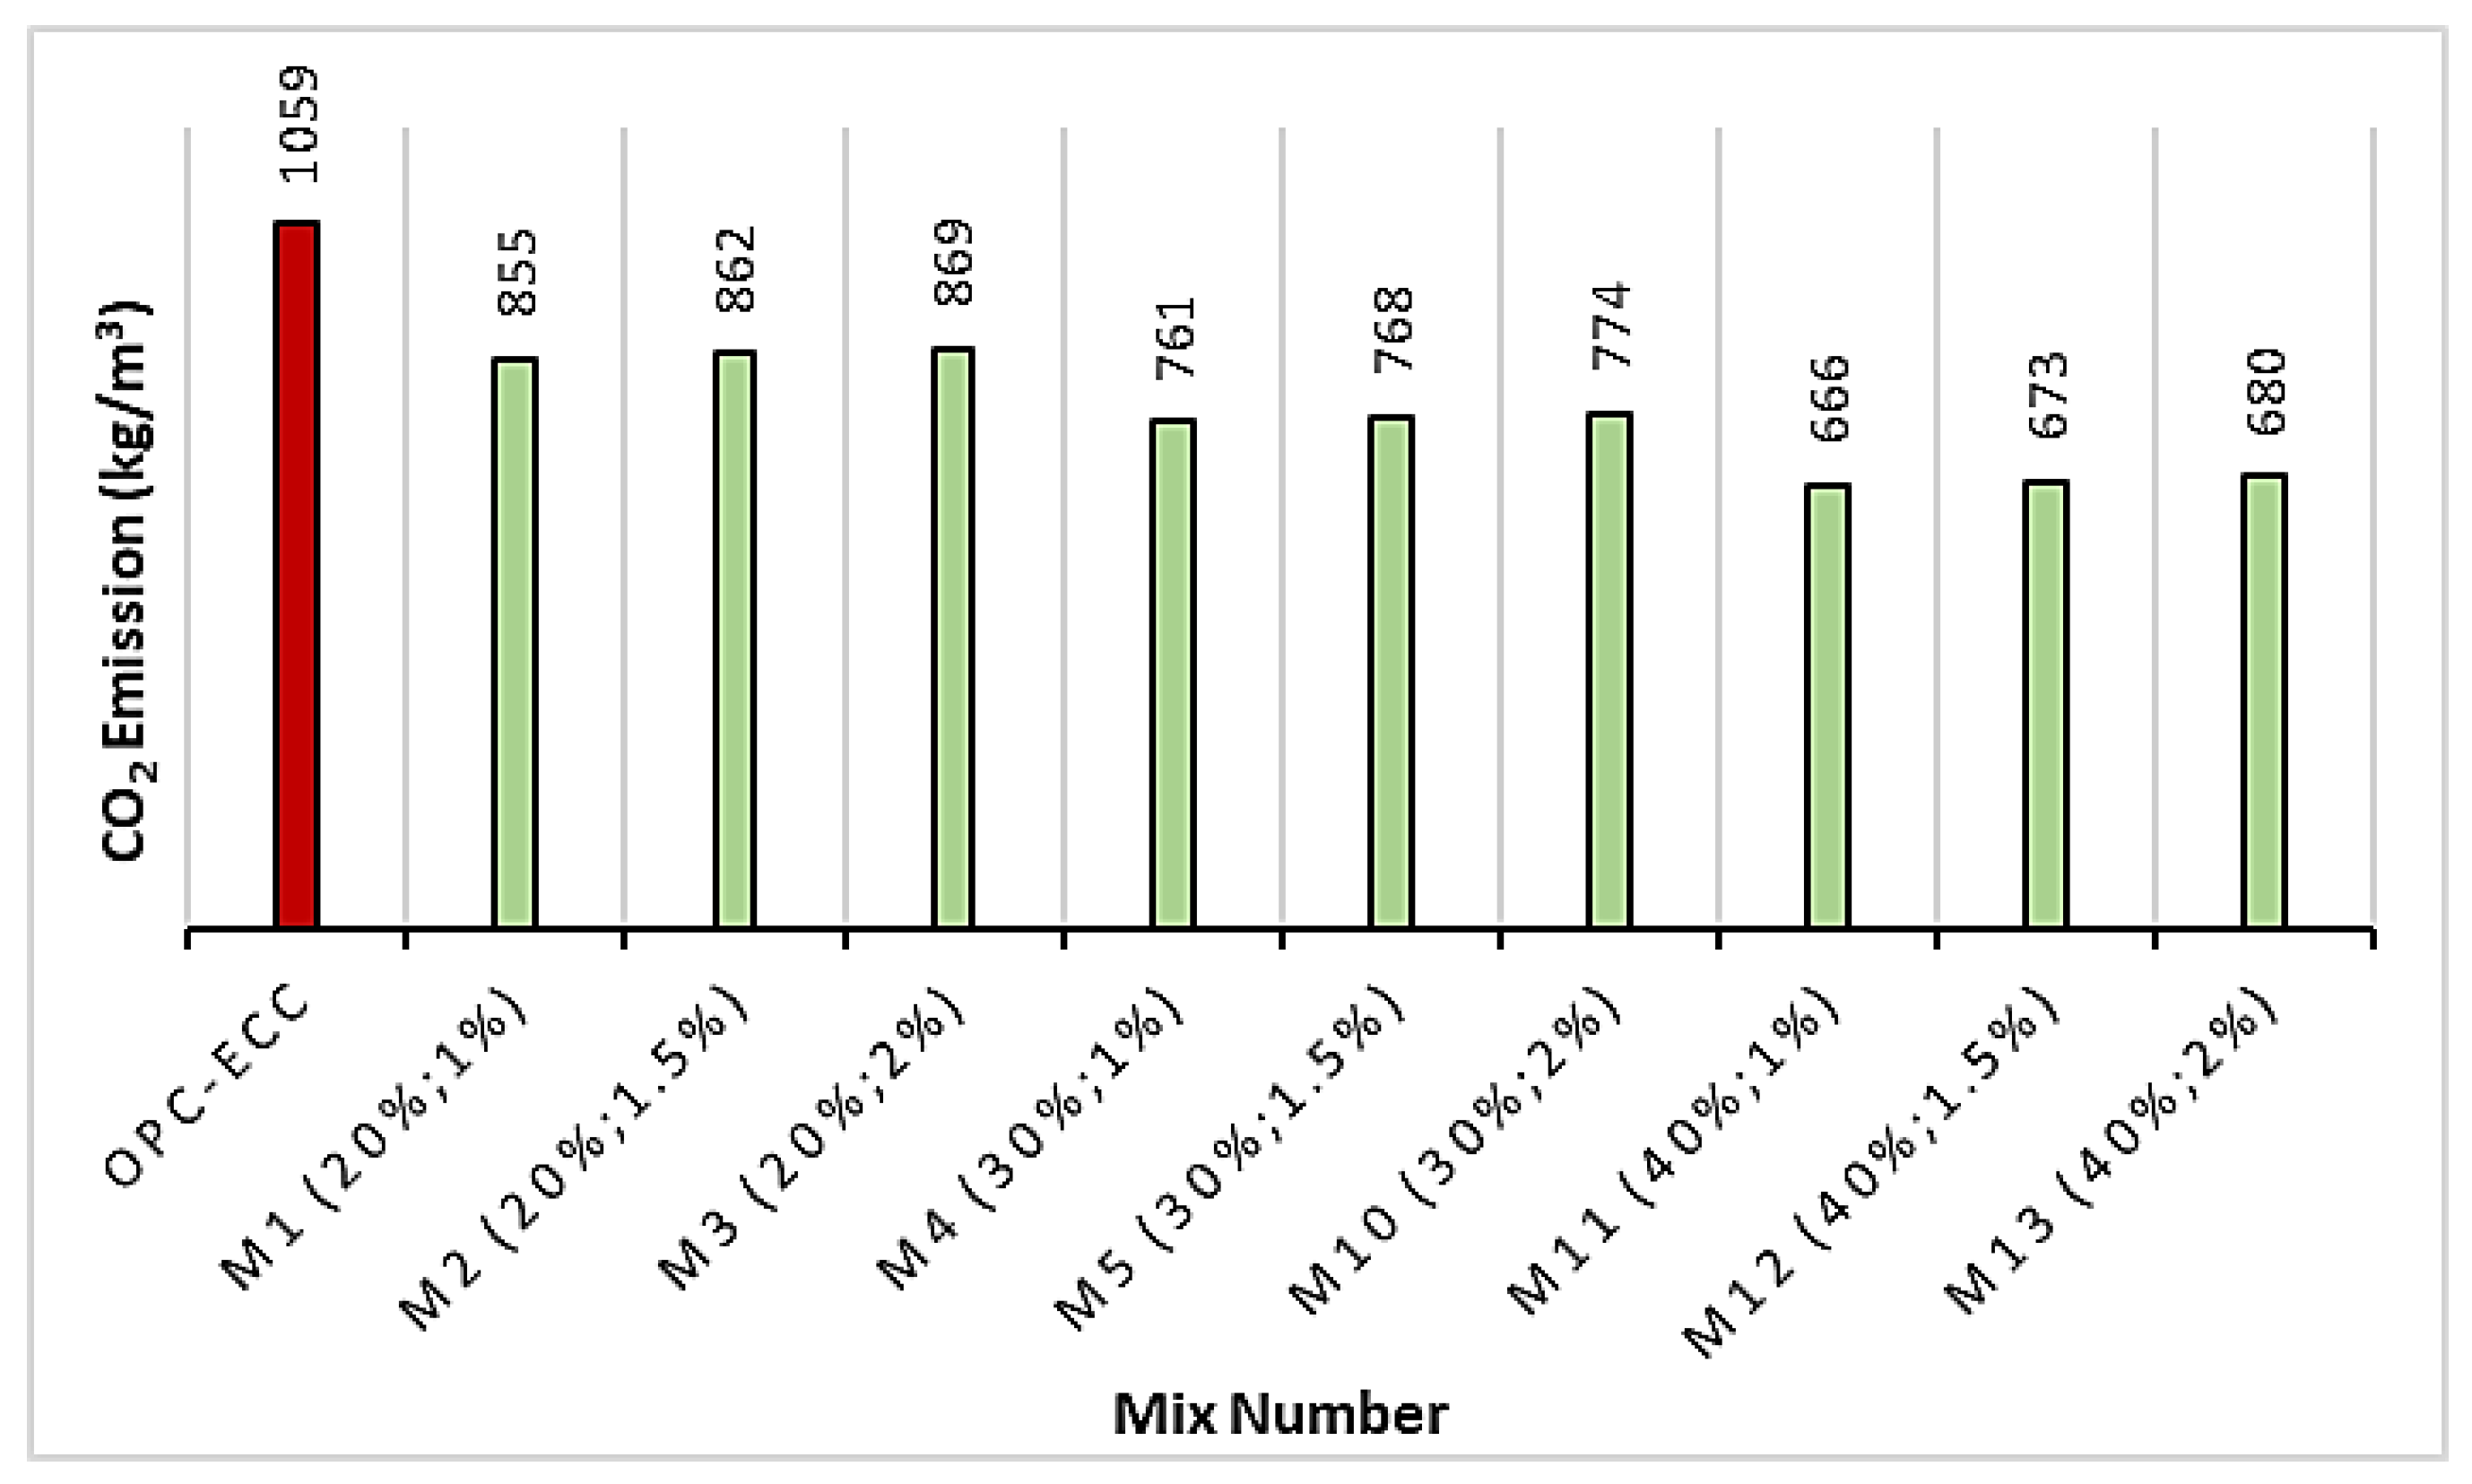
3.6. Environmental Assessment

The impact of using POFA as a replacement for cement was assessed by calculating the CO2 emission and energy consumption values associated with the development of each of the POFA-ECC mixes. These results were compared with the CO2 emission and energy consumption values for a control ECC that contained 100% cement, 0%-POFA (OPC-ECC). The values were calculated using the CO2 emissions and energy consumption values per 1 kg of each material, as presented in Table 3.
Figure 14 shows that the CO2 emission varied from 666 to 869 kg/m3 for all the POFA-ECC mixes, a reduction of 18% to 37% over the OPC-ECCs’ CO2 emission value of 1059 kg/m3. The CO2 emission decrease with an increase in the POFA replacement. On the other hand, due to the high embodied carbon of PVA fiber, the CO2 emission increased with an increase in the PVA fiber addition in the mix. Hence, The mixture with the highest POFA content and lowest PVA fiber (M11: 40% POFA, 1% PVA) has the lowest CO2 emission value of 666, which is a 37% reduction in the emission compared to the OPC-ECC.
Similarly, the energy consumption associated with the development of each mix is shown in Figure 15. With an increase in the POFA replacement of cement, the embodied energy of the mixes dropped, similar to the trends seen with CO2 emission levels. 40% POFA with 1% PVA fiber (M11) resulted in a 39% reduction in energy consumption. In addition, mixtures with a high PVA percentage consumed the most energy compared to mixes with a similar POFA content.
Hence, it is evident that the use of POFA helps significantly reduce the negative environmental impact associated with the use of cement. This result is consistent with the findings of previous works on the use of POFA as cement replacement in concrete [53,70]. It will also be worthwhile to investigate the use of fibers sourced from other kinds of agricultural waste, such as coconut fiber, and the POFA to further reduce the negative environmental impact associated with using PVA fiber.

4. Response Surface Models and Optimization

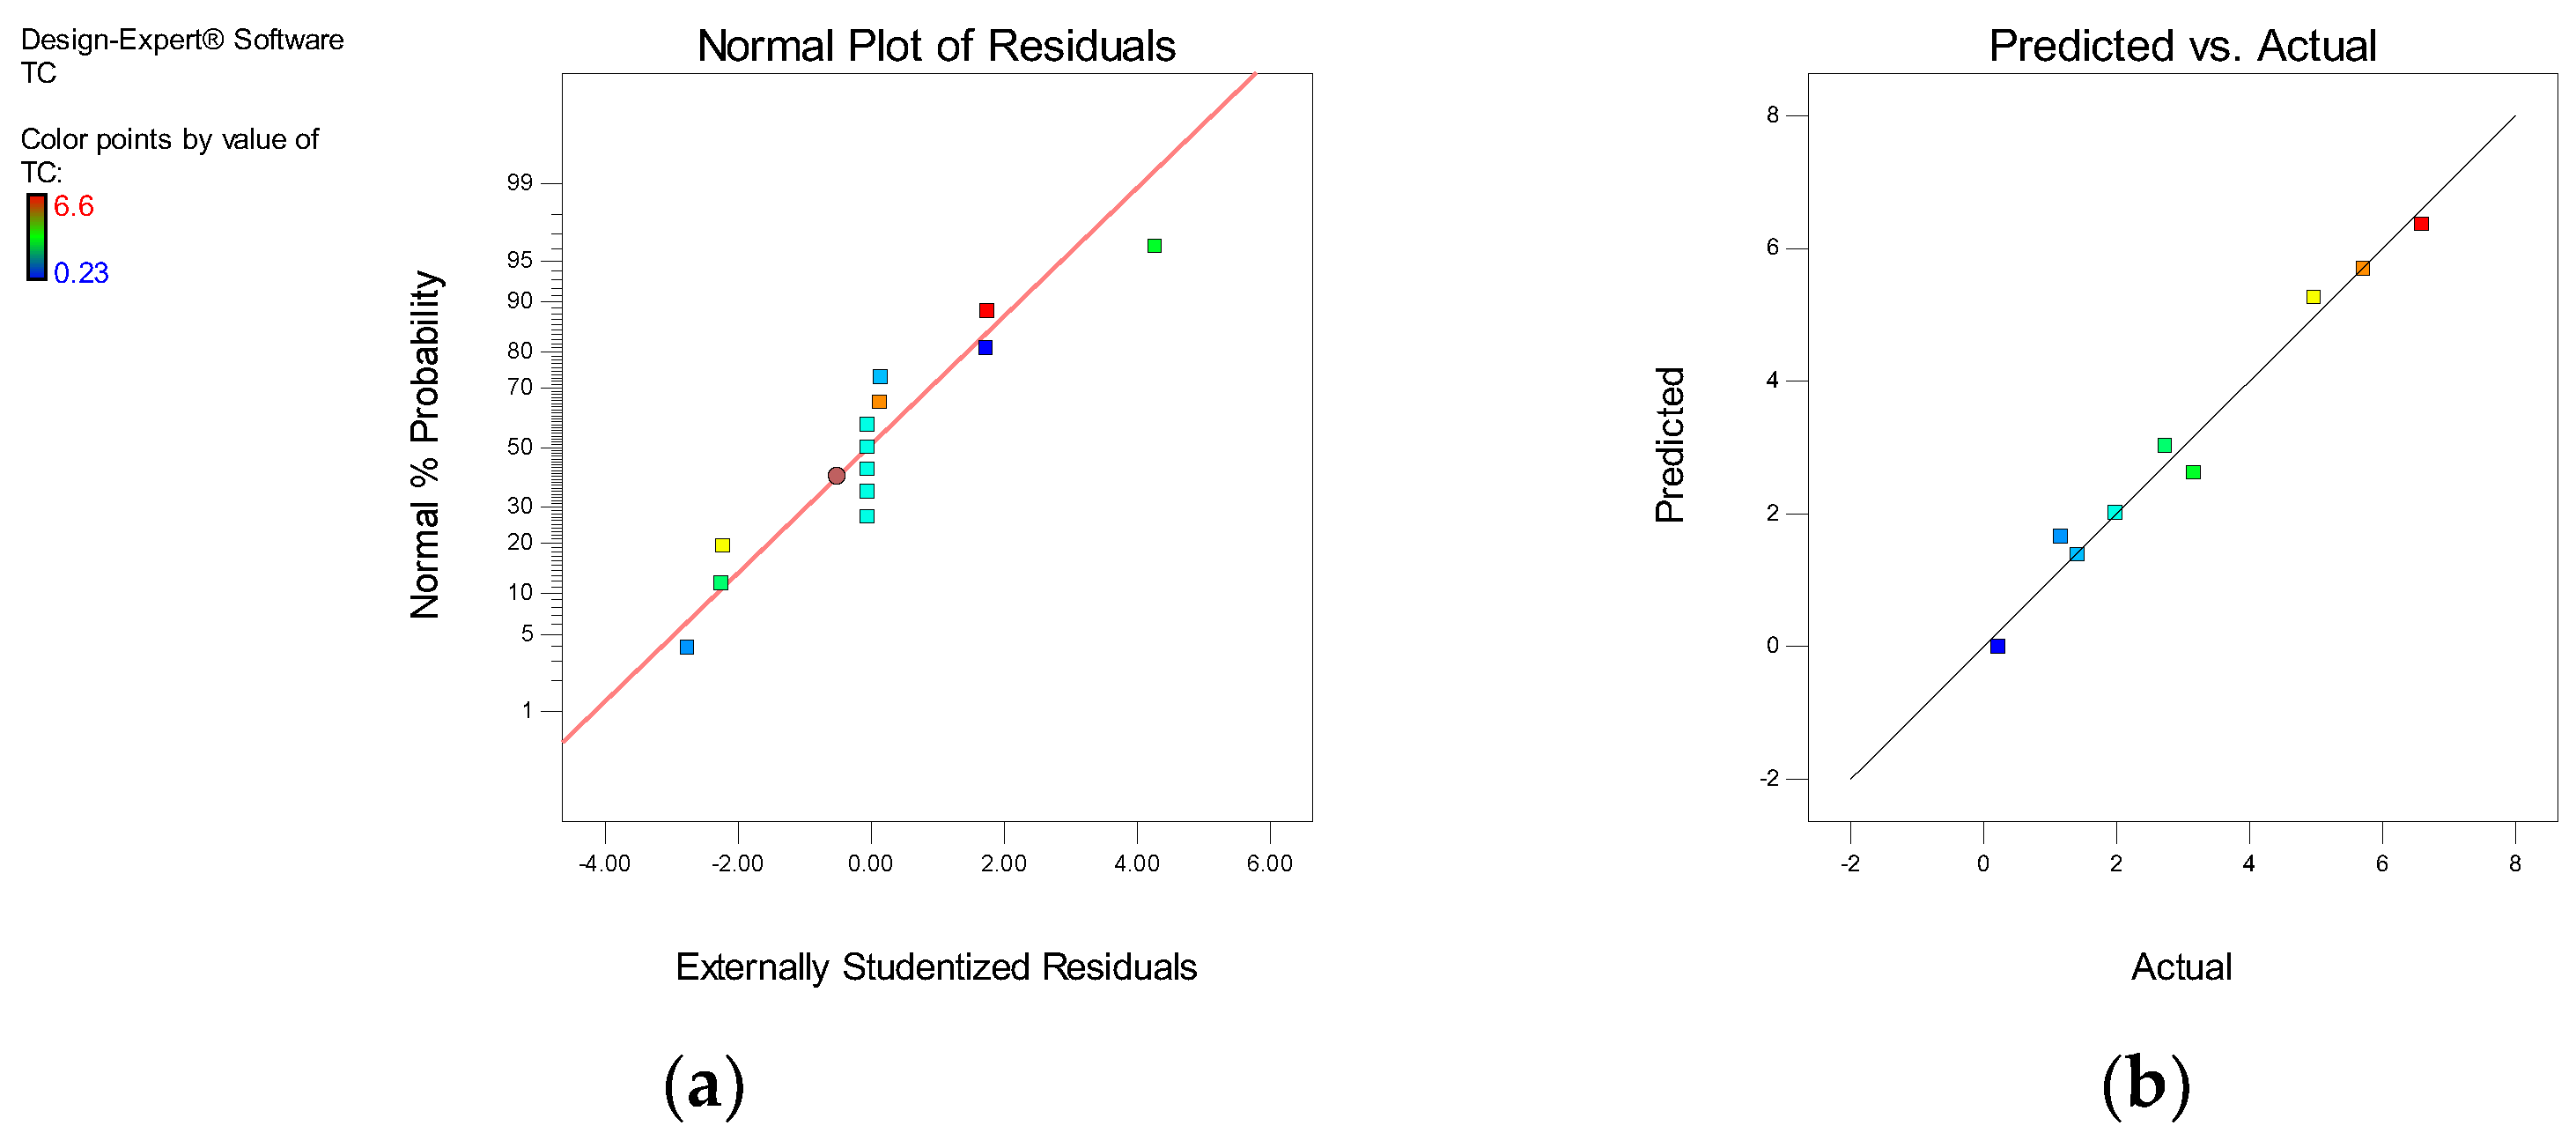
4.1. Model Development and ANOVA

The aim of employing the RSM in designing an experiment (DOE) from the onset is to develop predictive response models and perform optimization. The response models can take the form of linear or higher-order polynomials, as shown in the generalized formats in Equations (2) and (3). In this particular instance, the quadratic models were thought to be more appropriate for all four responses (compressive, tensile, and flexural strengths, as well as tensile capacity), and they are stated in coded terms in Equations (4)–(7). Equations formulated in terms of coded factors may be used to predict responses to varying degrees of each variable. By default, a value of +1 is used to indicate high levels of a factor, while a value of −1 is used to represent low levels. The relative significance of the variables may be determined by using the coded equation and comparing the factor coefficients. The input factors (POFA and PVA fibers) are represented by letters A and B.
y = β 0 + β 1 x 2 + β 2 x 2 + β n x n + ϵ
y = β β 0 + i = 1 k β i x i + i = 1 k β i i x i 2 + j = 2 k i = 1 j = 1 β i j x i x j + ε  
where y is the response of interest; i and j are the linear and quadratic coefficients, respectively; k is the number of factors that have been examined and optimized; and ε denotes the random error.
CS = +30.4 − 11.04 × A − 2.951 × B − 0.953 × AB − 1.620 × A2 − 0.780 × B2
TS = +1.66 − 0.98 × A + 0.40 × B + 0.035 × AB + 0.21 × A2 + 0.12 × B2
FS = +5.71 − 0.96 × A + 1.24 × B − 0.21 × AB − 0.93 × A2 + 0.11 × B2
TC = +2.01 − 0.48 × A + 2.15 × B + 1.03 × AB + 0.13 × A2
where CS, FS, and TS are the compressive, flexural, and tensile strength, respectively.
The ANOVA was performed at a significance level of 95%, and a model or model term is considered significant if its associated probability is lower than 5%. In this regard, it can be said that all models were significant since the probabilities associated with each are lower than 0.05, as shown in Table 5. When broken down into separate model terms, the compressive strength model reveals three terms with statistically significant associations: A, B, and A2. In a way somewhat dissimilar to the previous example, the terms A, B, and A2 constitute the significant model terms for the tensile strength model. For flexural strength and tensile strain capacity models, the terms A, B, AB, and A2 are considered significant model variables.
The coefficient of determination (R2) is an important metric to evaluate a model’s quality, and it ranges from 0 to 1 (or expressed as a percentage), indicating how well the model fits the actual data. The fit is better when the values are higher and vice versa. Table 6 contains the values for R2 as well as the other parameters used for model validation. The models have a high R2 value, with compressive, tensile, flexural, and tensile strain capacity models having values of 99%, 98%, 99%, and 98%, respectively. In addition, the “Adeq. Precision” measurement may be used to determine the signal-to-noise ratio, and it is preferable to have a ratio greater than four. The result reveals that the Adeq. Precision values for the compressive, tensile, flexural, and tensile strain capacity models are 46.166, 29.532, 38.757, and 27.476 for each model, respectively. These results suggest that the models are accurate and may be used for response prediction with a level of precision that is satisfactory.
The “Normal versus Residual” plot and the “Actual versus Predicted plot,” presented in Figure 16, Figure 17, Figure 18 and Figure 19, respectively, for the four models, are two powerful diagnostic tools utilized to evaluate the quality and sufficiency of the developed response models. The linearity of the data points along the fit line in every graph may be used to demonstrate the models’ quality. It can be deduced from data points on the normal plots of residuals that the error terms are normally distributed, which is the desired outcome. If 95% of the points lie between −2 and +2, which is the case for all the developed models, the residuals are normally distributed. The line of fit for the normality plot of the FS model is pushed to the right due to a possible error in the FS result for the mix with 20% POFA and 2% PVA, which the point represents. However, most of the points lie between the desired range of the externally studentized residuals as desired.
Other vital tools used to assess the interaction between the variables are the model graphs, which include the 2D contour and the 3D response-surface diagrams. As shown in Figure 20, Figure 21, Figure 22 and Figure 23, these plots are color-coded to show the influence of the interaction of the input factors on the responses. Red regions represent areas with high response intensity, while blue regions represent low response magnitudes. The intermediate response values are represented by the yellow and green regions. For example, Figure 20a,b depict the 2D contour and 3D response diagrams for compressive strength. The figures reveal a significant increase in compressive strength with decreasing amounts of POFA and PVA fibers. This is due to POFA’s porosity, low pozzolanic reactivity, especially in the early days, and the PVA fiber balling tendency at higher volume fractions.
Similarly, Figure 21a,b show the model graphs for the tensile strength. As can be observed, the plots reveal a high intensity of tensile strength at high concentrations of PVA Fibers with 20–30% POFA. With an increase in PVA fiber, the tensile strength of materials containing less than 30% POFA was enhanced. Hence, these plots give, at a glance, the trend of the responses owing to the interaction of the input factors.

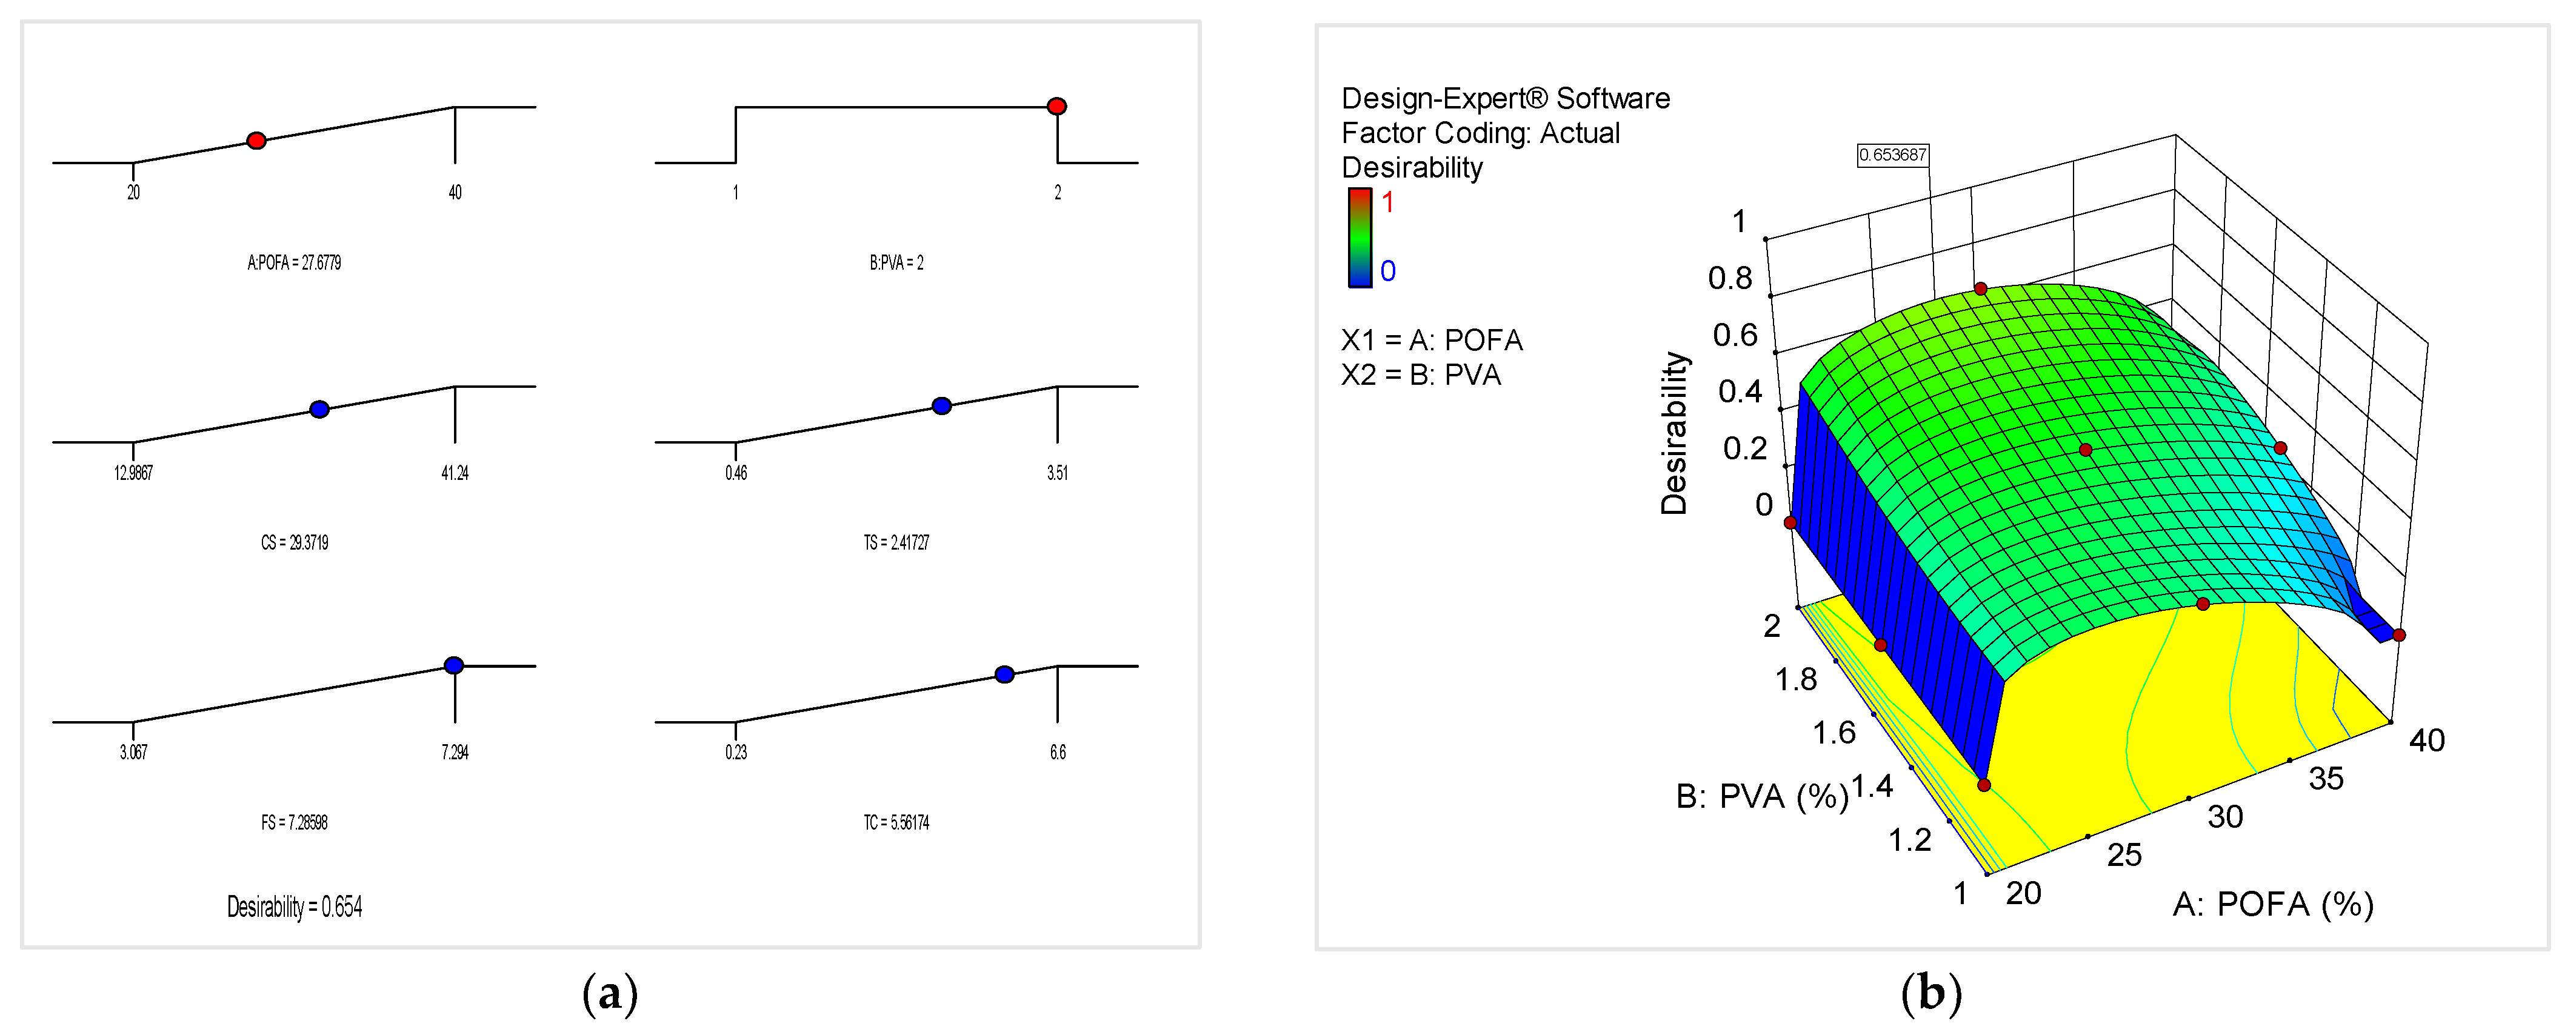
4.2. Multi-Objective Optimization

An effort at optimizing the system is made to discover what values of the independent variables should be used to attain the highest possible level of the response of interest. Attaining the objective function may be completed by creating objectives for the variables (input factors and responses) that have various criteria and degrees of relevance. When evaluating the optimization, the desirability value, which ranges from 0 to 1, is used. The closer the value is to one, the more favourable the result [28].
Table 7 presents the optimization targets and objective functions used in this research. The optimization goal for the POFA was to “maximize” its usage, being a waste material. The target for the PVA fiber was selected to fall within the range of values employed in the experiment. The system was set to maximize all the responses.
After running the optimization, the results showed that the optimum values of 27.11 MPa, 2.41 MPa, 7.28 MPa, and 5.56% could be obtained for the CS, TS, FS, and TC, respectively, at an optimal level of 27.68% and 2% for POFA and PVA fibers, respectively. The optimization was performed at a desirability value of 65%, which is considered high considering the complexity required to achieve the multi-objective criteria. The optimization solution is presented in the form of ramps in Figure 24a, and the 3D response surface diagram of the desirability is presented in Figure 24b.

4.3. Experimental Validation

The final stage in the RSM analysis is the experimental validation performed by casting test samples using the optimum proportions of the variables obtained from the multi-objective optimization. The samples were tested for responses after 28 days; the results are shown in Table 8, along with the predicted optimal results. Equation (8) was used to determine an experimental error in order to compare the two results. The results are displayed in Table 8. The experimental error values for all the responses are below 10%, which shows the accuracy of the optimization and developed response models.
δ = R E R P R P × 100 %
where δ is the experimental error, RE is the experimental result, and RP is the predicted result.

5. Conclusions

The present research concluded that, when combined with the appropriate ratio of PVA fiber combinations, grounded untreated POFA can produce an ECC with mechanical strengths suitable for structural applications. However, the use should be restricted to 30% at all levels of fiber additions to avoid significantly degrading the mechanical performance of the composite. Additionally, the addition of POFA and PVA fibers significantly increased the porosity of the POFA-ECC, which had an inverse relationship with the mechanical strengths but significantly increased the ductility and deformation of the composites, leading to the formation of saturated microcracks that are responsible for the strain-hardening behavior. Furthermore, the use of POFA is proven to reduce the embodied carbon and energy of the ECC, especially at a low PVA fiber content. The generated response surface models, which were tested using analysis of variance and found to be strong with R2 values ranging from 98 to 99%, could predict the mechanical characteristics of the POFA-ECC with a high degree of accuracy. Using 27.68% and 2% as the optimal values of the POFA replacement of cement and PVA fiber additions, respectively, a multi-objective optimization revealed that a POFA-ECC with acceptable mechanical characteristics could be produced, demonstrating the efficiency of RSM as an experimental design method. Additionally, the authors will utilize the RSM for modeling and optimizing the impact of POFA on ECCs’ long-term and durability properties, which have not yet been sufficiently studied.

Author Contributions

Conceptualization, B.S.M.; methodology, W.C.H.; validation, I.A.; formal analysis, I.A. and W.C.H.; investigation, W.C.H. and I.A.; resources, B.S.M.; writing—original draft preparation, I.A. and W.C.H.; writing—review and editing, I.A. and B.S.M.; supervision, B.S.M.; project administration, B.S.M. and M.S.L.; funding acquisition, B.S.M. and M.S.L. All authors have read and agreed to the published version of the manuscript.

Funding

This research is funded by University Teknologi PETRONAS Malaysia under the Yayasan UTP (YUTP) grant with numbers: 015LC0-391 and 015LC0-461.

Data Availability Statement

All the data is presented in this article.

Conflicts of Interest

The authors declare no conflict of interest.

References

  1. Umar, H.; Sulaiman, S.; Said, M.M.; Gungor, A.; Shahbaz, M.; Inayat, M.; Inayat, M.; Ahmad, R. Assessing the implementation levels of oil palm waste conversion methods in Malaysia and the challenges of commercialisation: Towards sustainable energy production. Biomass Bioenergy 2021, 151, 106179. [Google Scholar] [CrossRef]
  2. Bashar, I.I.; Alengaram, U.J.; Jumaat, M.Z.; Islam, A. The Effect of Variation of Molarity of Alkali Activator and Fine Aggregate Content on the Compressive Strength of the Fly Ash: Palm Oil Fuel Ash Based Geopolymer Mortar. Adv. Mater. Sci. Eng. 2014, 2014, 245473. [Google Scholar] [CrossRef] [Green Version]
  3. Abdullah, N.; Sulaiman, F. The oil palm wastes in Malaysia. In Biomass Now-Sustainable Growth and Use; Matovic, M.D., Ed.; Intech: Rijeka, Crotia, 2013; pp. 75–93. Available online: http://bitly.ws/zkN5 (accessed on 7 January 2023).
  4. Altwair, N.M.; Kabir, S.; Brameshuber, W. Palm oil fuel ash (POFA): An environmentally-friendly sup-plemental cementitious material for concrete production. In Proceedings of the International Conference on Material Science and 64th RILEM Annual Week, Aachen, Germany, 6–10 September 2010; pp. 234–247. [Google Scholar]
  5. Amran, M.; Lee, Y.H.; Fediuk, R.; Murali, G.; Mosaberpanah, M.A.; Ozbakkaloglu, T.; Lee, Y.Y.; Vatin, N.; Klyuev, S.; Karelia, M. Palm Oil Fuel Ash-Based Eco-Friendly Concrete Composite: A Critical Review of the Long-Term Properties. Materials 2021, 14, 7074. [Google Scholar] [CrossRef] [PubMed]
  6. Aldahdooh, M.; Bunnori, N.M.; Johari, M.M. Influence of palm oil fuel ash on ultimate flexural and uniaxial tensile strength of green ultra-high performance fiber reinforced cementitious composites. Mater. Des. 2014, 54, 694–701. [Google Scholar] [CrossRef]
  7. Salami, B.A.; Johari, M.A.M.; Ahmad, Z.A.; Maslehuddin, M. Durability performance of Palm Oil Fuel Ash-based Engineered Alkaline-activated Cementitious Composite (POFA-EACC) mortar in sulfate environment. Constr. Build. Mater. 2017, 131, 229–244. [Google Scholar] [CrossRef]
  8. Qaidi, S.M.; Atrushi, D.S.; Mohammed, A.S.; Ahmed, H.U.; Faraj, R.H.; Emad, W.; Tayeh, B.A.; Najm, H.M. Ultra-high-performance geopolymer concrete: A review. Constr. Build. Mater. 2022, 346, 128495. [Google Scholar] [CrossRef]
  9. Qaidi, S.M.; Mohammed, A.S.; Ahmed, H.U.; Faraj, R.H.; Emad, W.; Tayeh, B.A.; Althoey, F.; Zaid, O.; Sor, N.H. Rubberized geopolymer composites: A comprehensive review. Ceram. Int. 2022, 48, 24234–24259. [Google Scholar] [CrossRef]
  10. Gupta, S.; Kashani, A.; Mahmood, A.H. Carbon sequestration in engineered lightweight foamed mortar—Effect on rheology, mechanical and durability properties. Constr. Build. Mater. 2022, 322, 126383. [Google Scholar] [CrossRef]
  11. Matsimbe, J.; Dinka, M.; Olukanni, D.; Musonda, I. Geopolymer: A Systematic Review of Methodologies. Materials 2022, 15, 6852. [Google Scholar] [CrossRef]
  12. Xu, S.; Yuan, P.; Liu, J.; Pan, Z.; Liu, Z.; Su, Y.; Li, J.; Wu, C. Development and preliminary mix design of ultra-high-performance concrete based on geopolymer. Constr. Build. Mater. 2021, 308, 125110. [Google Scholar] [CrossRef]
  13. Kathirvel, P.; Sreekumaran, S. Sustainable development of ultra high performance concrete using geopolymer technology. J. Build. Eng. 2021, 39, 102267. [Google Scholar] [CrossRef]
  14. Zhang, Z.; Zhang, Q. Matrix tailoring of Engineered Cementitious Composites (ECC) with non-oil-coated, low tensile strength PVA fiber. Constr. Build. Mater. 2018, 161, 420–431. [Google Scholar] [CrossRef]
  15. Li, V.C. On Engineered Cementitious Composites (ECC): Areview of the Material and its applications. J. Adv. Concr. Technol. 2003, 1, 215–230. [Google Scholar] [CrossRef] [Green Version]
  16. Loganathan, R.; Mohammed, B. Properties of Rubberized Engineered Cementitious Composites Containing Nano-Silica. Materials 2021, 14, 3765. [Google Scholar] [CrossRef] [PubMed]
  17. Abdulkadir, I.; Mohammed, B.S.; Liew, M.; Wahab, M. Modelling and optimization of the mechanical properties of engineered cementitious composite containing crumb rubber pretreated with graphene oxide using response surface methodology. Constr. Build. Mater. 2021, 310, 125259. [Google Scholar] [CrossRef]
  18. Abdulkadir, I.; Mohammed, B.S.; Liew, M.; Wahab, M. Modelling and multi-objective optimization of the fresh and mechanical properties of self-compacting high volume fly ash ECC (HVFA-ECC) using response surface methodology (RSM). Case Stud. Constr. Mater. 2021, 14, e00525. [Google Scholar] [CrossRef]
  19. Zhang, Z.; Yuvaraj, A.; Di, J.; Qian, S. Matrix design of light weight, high strength, high ductility ECC. Constr. Build. Mater. 2019, 210, 188–197. [Google Scholar] [CrossRef]
  20. Wang, Y.; Zhang, Z.; Yu, J.; Xiao, J.; Xu, Q. Using Green Supplementary Materials to Achieve More Ductile ECC. Materials 2019, 12, 858. [Google Scholar] [CrossRef] [Green Version]
  21. Abdulkadir, I.; Mohammed, B.S.; Ali, M.O.A.; Liew, M.S. Effects of Graphene Oxide and Crumb Rubber on the Fresh Properties of Self-Compacting Engineered Cementitious Composite Using Response Surface Methodology. Materials 2022, 15, 2519. [Google Scholar] [CrossRef]
  22. Lye, H.L.; Mohammed, B.S.; Liew, M.; Wahab, M.; Al-Fakih, A. Bond behaviour of CFRP-strengthened ECC using Response Surface Methodology (RSM). Case Stud. Constr. Mater. 2020, 12, e00327. [Google Scholar] [CrossRef]
  23. Mohammed, B.S.; Khed, V.C.; Liew, M.S. Optimization of hybrid fibres in engineered cementitious composites. Constr. Build. Mater. 2018, 190, 24–37. [Google Scholar] [CrossRef]
  24. Sabapathy, L.; Mohammed, B.S.; Al-Fakih, A.; A Wahab, M.M.; Liew, M.S.; Amran, Y.H.M. Acid and Sulphate Attacks on a Rubberized Engineered Cementitious Composite Containing Graphene Oxide. Materials 2020, 13, 3125. [Google Scholar] [CrossRef] [PubMed]
  25. Mohammed, B.S.; Yen, L.Y.; Haruna, S.; Huat, M.L.S.; Abdulkadir, I.; Al-Fakih, A.; Liew, M.S.; Zawawi, N.A.W.A. Effect of Elevated Temperature on the Compressive Strength and Durability Properties of Crumb Rubber Engineered Cementitious Composite. Materials 2020, 13, 3516. [Google Scholar] [CrossRef] [PubMed]
  26. Wang, S.; Li, V.C. Engineered Cementitious Composites with High-Volume Fly Ash. ACI Mater. J. 2007, 104, 233–268. [Google Scholar]
  27. Zahid, M. Development and Mix Design Optimization of Fly Ash Based High Strength Engineered Geopolymer Composite; Universiti Teknologi PETRONAS: Seri Iskandar, Malaysia, 2019. [Google Scholar]
  28. Abdulkadir, I.; Mohammed, B.S. RSM Study and Analysis on the 6 months Compressive Strength Development and Shrinkage Behavior of High Volume Fly Ash ECC (HVFA-ECC). Int. J. Adv. Res. Eng. Technol. 2020, 11, 965–980. Available online: https://ssrn.com/abstract=3711364 (accessed on 13 September 2022).
  29. Turk, K.; Nehdi, M.L. Coupled effects of limestone powder and high-volume fly ash on mechanical properties of ECC. Constr. Build. Mater. 2018, 164, 185–192. [Google Scholar] [CrossRef]
  30. Altwair, N.M.; Johari, M.A.M.; Hashim, S.F.S. Influence of treated palm oil fuel ash on compressive properties and chloride resistance of engineered cementitious composites. Mater. Struct. 2014, 47, 667–682. [Google Scholar] [CrossRef]
  31. Altwair, N.M.; Ganaw, A. Effect of water-binder ratio and Treated Palm Oil Ash (TPOFA) on Alkali-Silica Reaction Resistance of Engineered Cementitious Composites (ECC). In Proceedings of the 2nd International Conference on Science & Technology, Kuala Lumpur, Malaysia, 17 June 2014. [Google Scholar]
  32. Johari, M.A.M.; Altwair, N.M.; Hashim, S.F.S. Fracture and tensile characteristics of engineered cementitious composites containing POFA. Adv. Cem. Res. 2013, 25, 189–199. [Google Scholar] [CrossRef]
  33. Altwair, N.M.; Johari, M.M.; Hashim, S.F.S. Shrinkage Characteristics of Green Engineered Cementitious Composites with Varying Palm Oil Fuel Ash Contents and Water-Binder Ratios. Adv. Mater. Res. 2013, 626, 245–249. [Google Scholar] [CrossRef]
  34. Altwair, N.M.; Johari, M.M.; Hashim, S.S. Flexural performance of green engineered cementitious composites containing high volume of palm oil fuel ash. Constr. Build. Mater. 2012, 37, 518–525. [Google Scholar] [CrossRef]
  35. Altwair, N. A novel design for green engineered cementitious composite (green-ecc) concrete using palm oil fuel ash (POFA) for sustainable development. In Proceedings of the 17th Annual International Sustainable Development Research Conference, New York, NY, USA, 8–10 May 2011. [Google Scholar]
  36. Chindaprasirt, P.; Rukzon, S.; Sirivivatnanon, V. Resistance to chloride penetration of blended Portland cement mortar containing palm oil fuel ash, rice husk ash and fly ash. Constr. Build. Mater. 2008, 22, 932–938. [Google Scholar] [CrossRef]
  37. Myers, R.H.; Montgomery, D.C.; Anderson-Cook, C.M. Response Surface Methodology; Balding, D.J., Ed.; John Wiley & Sons: Hoboken, NJ, USA, 2016; p. 855. [Google Scholar]
  38. Ghafari, E.; Costa, H.; Júlio, E. RSM-based model to predict the performance of self-compacting UHPC reinforced with hybrid steel micro-fibers. Constr. Build. Mater. 2014, 66, 375–383. [Google Scholar] [CrossRef]
  39. MS EN 197-1:2014; Cement—Part 1: Composition, Specifications and Conformity Criteria for Common Cements. Department of Standards Malaysia: Selangor, Malaysia, 2014.
  40. ASTM C618-17a; Standard Specification for Coal Fly Ash and Raw or Calcined Natural Pozzolan for Use in Concrete. ASTM International: West Conshohocken, PA, USA, 2017.
  41. Yu, J.; Chen, Y.; Leung, C.K. Micromechanical modeling of crack-bridging relations of hybrid-fiber Strain-Hardening Cementitious Composites considering interaction between different fibers. Constr. Build. Mater. 2018, 182, 629–636. [Google Scholar] [CrossRef]
  42. Wang, J.; Dai, Q.; Si, R.; Guo, S. Investigation of properties and performances of Polyvinyl Alcohol (PVA) fiber-reinforced rubber concrete. Constr. Build. Mater. 2018, 193, 631–642. [Google Scholar] [CrossRef]
  43. Shahrul, S.; Mohammed, B.S.; Wahab, M.M.A.; Liew, M.S. Mechanical Properties of Crumb Rubber Mortar Containing Nano-Silica Using Response Surface Methodology. Materials 2021, 14, 5496. [Google Scholar] [CrossRef]
  44. Shanmugasundaram, N.; Praveenkumar, S. Influence of supplementary cementitious materials, curing conditions and mixing ratios on fresh and mechanical properties of engineered cementitious composites—A review. Constr. Build. Mater. 2021, 309, 125038. [Google Scholar] [CrossRef]
  45. Zhu, H.; Zhang, D.; Wang, T.; Wu, H.; Li, V.C. Mechanical and self-healing behavior of low carbon engineered cementitious composites reinforced with PP-fibers. Constr. Build. Mater. 2020, 259, 119805. [Google Scholar] [CrossRef]
  46. ASTM C 109/C 109M—02; Standard Test Method for Compressive Strength of Hydraulic Cement Mortars. ASTM International: West Conshohocken, PA, USA, 2002.
  47. Hiroshi Yokota, K.R.; Sakata, N. JSCE, Recommendations for Design and Contruction of High Performance Fibre Reinforced Cement Composites with Multiple Fine Cracks. In High Performance Fiber Reinforced Cement Composites; Springer: Tokyo, Japan, 2007. [Google Scholar]
  48. ASTM D 4284—03; Standard Test Method for Determining Pore Volume Distribution of Catalysts by Mercury Intrusion Porosimetry. ASTM International: West Conshohocken, PA, USA, 2003.
  49. Huynh, T.-P.; Ho, L.S.; Van Ho, Q. Experimental investigation on the performance of concrete incorporating fine dune sand and ground granulated blast-furnace slag. Constr. Build. Mater. 2022, 347, 128512. [Google Scholar] [CrossRef]
  50. Ho, L.S.; Huynh, T.-P. Recycled waste medical glass as a fine aggregate replacement in low environmental impact concrete: Effects on long-term strength and durability performance. J. Clean. Prod. 2022, 368, 133144. [Google Scholar] [CrossRef]
  51. Zhang, D.; Yu, J.; Wu, H.; Jaworska, B.; Ellis, B.R.; Li, V.C. Discontinuous micro-fibers as intrinsic reinforcement for ductile Engineered Cementitious Composites (ECC). Compos. Part B Eng. 2020, 184, 107741. [Google Scholar] [CrossRef]
  52. Zheng, H. (Ed.) Concrete for sustainability. In Proceedings of the SCCT Annual Concrete Seminars Standing Committee on Concrete Technology (SCCT), Hong Kong, China, 27 February 2009. [Google Scholar]
  53. Alnahhal, M.F.; Alengaram, U.J.; Jumaat, M.Z.; Abutaha, F.; Alqedra, M.A.; Nayaka, R.R. Assessment on engineering properties and CO2 emissions of recycled aggregate concrete incorporating waste products as supplements to Portland cement. J. Clean. Prod. 2018, 203, 822–835. [Google Scholar] [CrossRef]
  54. Choo, J.; Mohammed, B.S.; Chen, P.-S.; Abdulkadir, I.; Yan, X. Modeling and Optimizing the Effect of 3D Printed Origami Bubble Aggregate on the Mechanical and Deformation Properties of Rubberized ECC. Buildings 2022, 12, 2201. [Google Scholar] [CrossRef]
  55. Tkaczewska, E. Mechanical Properties of Cement Mortar Containing Fine-Grained Fraction of Fly Ashes. Open J. Civ. Eng. 2013, 3, 33216. [Google Scholar] [CrossRef] [Green Version]
  56. Tangchirapat, W.; Saeting, T.; Jaturapitakkul, C.; Kiattikomol, K.; Siripanichgorn, A. Use of waste ash from palm oil industry in concrete. Waste Manag. 2007, 27, 81–88. [Google Scholar] [CrossRef]
  57. Rajak, M.A.A.; Majid, Z.A.; Ismail, M. The Effects of Nanosized-Palm Oil Fuel Ash on Early Age Hydration of Hardened Cement Paste: The Microstructure Studies. J. Adv. Res. Fluid Mech. Therm. Sci. 2021, 82, 87–95. [Google Scholar] [CrossRef]
  58. Lin, J.-X.; Song, Y.; Xie, Z.-H.; Guo, Y.-C.; Yuan, B.; Zeng, J.-J.; Wei, X. Static and dynamic mechanical behavior of engineered cementitious composites with PP and PVA fibers. J. Build. Eng. 2020, 29, 101097. [Google Scholar] [CrossRef]
  59. Altwair, N.M.; Johari, M.M.; Hashim, S.F.S.; Zeyad, A. Mechanical Properties of Engineered Cementitious Composite with Palm Oil Fuel Ash as a Supplementary Binder. Adv. Mater. Res. 2013, 626, 121–125. [Google Scholar] [CrossRef]
  60. Abdulkadir, I. Development of High-Performance Engineered Cementitious Composite with Enhanced Resistance to Elevated Temperatures Using Crumb Rubber and Graphene Oxide. Ph.D. Thesis, Civil and Environmental Engineering Department, Universiti Teknologi PETRONAS, Seri Iskandar, Malaysia, 2022. [Google Scholar]
  61. Li, V.C. Engineered cementitious composites (ECC) material, structural, and durability performance. In Concrete Construction Engineering Handbook; Edward, G.N., Ed.; Taylor and Francis: Boca Raton, FL, USA, 2008. [Google Scholar]
  62. Kamal, A.; Kunieda, M.; Ueda, N.; Nakamura, H. Evaluation of crack opening performance of a repair material with strain hardening behavior. Cem. Concr. Compos. 2008, 30, 863–871. [Google Scholar] [CrossRef]
  63. Saffuan, W.A.; Muthusamy, K.; Salleh, N.A.M.; Nordin, N. Properties of concrete containing ground palm oil fuel ash as fine aggregate replacement. IOP Conf. Ser. Mater. Sci. Eng. 2017, 264, 012008. [Google Scholar] [CrossRef]
  64. Kamal, M.; Khan, S.W.; Shahzada, K.; Alam, M. Experimental investigation of the mechanical properties of Engineered Ce-mentitious Composites (ECC). Int. J. Adv. Struct. Geotech. Eng. 2016, 5, 40–45. [Google Scholar]
  65. Lu, C.; Lu, Z.; Li, Z.; Leung, C.K. Effect of graphene oxide on the mechanical behavior of strain hardening cementitious composites. Constr. Build. Mater. 2016, 120, 457–464. [Google Scholar] [CrossRef]
  66. Khed, V.C.M.; Bashar, S.M.; Liew, M.S.; Alaloul, W.S.; Adamu, M. Hybrid Fiber Rubberized ECC Optimization for Modulus of Elasticity. Int. J. Civ. Eng. Technol. 2018, 9, 918–928. [Google Scholar]
  67. Şahmaran, M.; Özbay, E.; Yücel, H.E.; Lachemi, M.; Li, V.C. Effect of Fly Ash and PVA Fiber on Microstructural Damage and Residual Properties of Engineered Cementitious Composites Exposed to High Temperatures. J. Mater. Civ. Eng. 2011, 23, 1735–1745. [Google Scholar] [CrossRef]
  68. Ding, C.; Guo, L.; Chen, B. An optimum polyvinyl alcohol fiber length for reinforced high ductility cementitious composites based on theoretical and experimental analyses. Constr. Build. Mater. 2020, 259, 119824. [Google Scholar] [CrossRef]
  69. Zhou, Y.; Zheng, S.; Huang, X.; Xi, B.; Huang, Z.; Guo, M. Performance enhancement of green high-ductility engineered cementitious composites by nano-silica incorporation. Constr. Build. Mater. 2021, 281, 122618. [Google Scholar] [CrossRef]
  70. Jhatial, A.A.; Goh, W.I.; Mastoi, A.K.; Rahman, A.F.; Kamaruddin, S. Thermo-mechanical properties and sustainability analysis of newly developed eco-friendly structural foamed concrete by reusing palm oil fuel ash and eggshell powder as supplementary cementitious materials. Environ. Sci. Pollut. Res. 2021, 28, 38947–38968. [Google Scholar] [CrossRef] [PubMed]
Figure 1. XRD diffractogram of POFA.
Buildings 13 00628 g001
Figure 2. Particle size distribution for silica sand and POFA.
Buildings 13 00628 g002
Figure 3. (a) Freshly mixed POFA-ECC. (b) POFA-ECC test samples before curing.
Buildings 13 00628 g003
Figure 4. (a) Uniaxial tensile test and (b) Four-point flexural test on POFA-ECC samples.
Buildings 13 00628 g004
Figure 5. Compressive strength of POFA-ECC.
Buildings 13 00628 g005
Figure 6. Tensile strength of POFA-ECC mixes.
Buildings 13 00628 g006
Figure 7. Tensile strain capacity of POFA-ECC mixes.
Buildings 13 00628 g007
Figure 8. Stress–strain curves for POFA-ECC mixes.
Buildings 13 00628 g008
Figure 9. Flexural strength of POFA ECC mixes.
Buildings 13 00628 g009
Figure 10. First-cracking strength of POFA mixes.
Buildings 13 00628 g010
Figure 11. Load-deflection curves for POFA-ECC mixes.
Buildings 13 00628 g011
Figure 12. FESEM micrographs (a) section through POFA particle (b) Unreacted POFA in Mix 13 (40% POFA and 2% PVA) (c) Mix 1 (20% POFA and 1% PVA Fibers) showing relatively lower unreactive POFA (d) Mix 10 (30% POFA and 2% PVA Fibers) showing clumped fibers.
Buildings 13 00628 g012
Figure 13. Pore Distribution of ECC containing 20%, 30%, and 40% POFA.
Buildings 13 00628 g013
Figure 14. CO2 emission values of POFA-ECC mixes.
Buildings 13 00628 g014
Figure 15. Energy consumption of POFA-ECC mixes.
Buildings 13 00628 g015
Figure 16. (a) Normal Plot for the Residual and (b) Predicted Versus Actual Plot for the CS model.
Buildings 13 00628 g016
Figure 17. (a) Normal Plot for the Residual and (b) Predicted Versus Actual Plot for the TS model.
Buildings 13 00628 g017
Figure 18. (a) Normal Plot for the Residual and (b) Predicted Versus Actual Plot for the FS model.
Buildings 13 00628 g018
Figure 19. (a) Normal Plot for the Residual and (b) Predicted Versus Actual Plot for the TSC model.
Buildings 13 00628 g019
Figure 20. (a) 2D Contour Plot and (b) 3D Response Surface Diagram for Compressive Strength.
Buildings 13 00628 g020
Figure 21. (a) 2D Contour Plot and (b) 3D Response Surface Diagram for Tensile Strength.
Buildings 13 00628 g021
Figure 22. (a) 2D Contour Plot and (b) 3D Response Surface Diagram for Flexural Strength.
Buildings 13 00628 g022
Figure 23. (a) 2D Contour Plot and (b) 3D Response Surface Diagram for Tensile Strain Capacity.
Buildings 13 00628 g023
Figure 24. (a) Optimization solution ramps (b) 3D response surface plot for the optimization desirability.
Buildings 13 00628 g024
Table 1. Oxide composition of OPC and POFA.
Chemical CompositionOPC (%)POFA (%)
SiO221.2863.21
K2O1.687.73
Fe2O33.366.78
CO64.645.82
Al2O35.603.52
MgO 2.062.11
Loss on ignition (LOI)0.649.0
Specific gravity3.152.5
(SiO2 + Al2O3 + Fe2O3) 73.51
Table 2. Mix Proportions.
RunInput Factors (%)Quantities of Ingredients (kg/m3)
POFAPVAPVAPOFA Cement Sand Water
12018158630286196
2201.512158630286196
320216158630286196
43018237551286196
5301.512237551286196
6301.512237551286196
7301.512237551286196
8301.512237551286196
9301.512237551286196
1030216237551286196
114018315472286196
12401.512315472286196
1340216315472286196
Table 3. CO2 emissions and energy consumption per 1 kg of raw material.
MaterialCO2 Emission (kg)Energy Consumption (MJ/kg)
Cement a,b1.311.8
POFAc0.1006190.63
PVA fiber d1.71101
Sand a,b0.0240.34
water a,b0.000130.017
SP a,b0.611.7
a: [49], b: [50], c: [53], d: [51].
Table 4. Critical pore parameters of POFA-ECC.
MixturesAverage Pore Diameter (nm)Total Surface Area (m2/g)Total Pore Volume (mm3/g)Apparent Density (g/cm3)Accessible Porosity (%)
M1 (20% POFA, 1% PVA Fibers)14.466.64653.312.209410.54
M3 (20% POFA, 2% PVA Fibers)9.386.81941.360.07100.29
M5 (30% POFA, 1.5% PVA Fibers)16.345.54482.120.0000−0.59
M10 (30% POFA, 2% PVA Fibers)12.935.77165.682.219512.72
M13 (40% POFA, 2% PVA Fibers)16.394.305133.232.313323.56
Table 5. Result of ANOVA.
ResponseSourceSum of SquaresdfMean SquareF-Valuep-Value > FSignificant
CS (MPa)Model801.375160.27201.22<0.0001Yes
A-POFA731.951731.95918.96<0.0001Yes
B-PVA52.23152.2365.58<0.0001Yes
AB3.6313.634.560.0702No
A27.2517.259.100.0195Yes
B21.6811.682.110.1897No
Residual5.5870.80
Lack of Fit5.5831.86
Pure Error0.00040.000
Cor Total806.9412
TS (MPa)Model7.0551.4173.46<0.0001Yes
A-POFA5.8215.82303.20<0.0001Yes
B-PVA0.9810.9851.260.0002Yes
AB4.900 × 10−314.900 × 10−30.260.6289No
A20.1210.126.150.0422Yes
B20.03810.0381.960.2042No
Residual0.1370.019
Lack of Fit0.1330.045
Pure Error0.00040.000
Cor Total7.1912
FS (MPa)Model17.5153.50125.55<0.0001Yes
A-POFA5.5215.52198.05<0.0001Yes
B-PVA9.2119.21330.33<0.0001Yes
AB0.1710.176.250.0410Yes
A22.4012.4086.20<0.0001Yes
B20.03410.0341.220.3059No
Residual0.2070.028
Lack of Fit0.2030.065
Pure Error0.00040.000
Cor Total17.7012
TSC (%)Model41.4858.3071.27<0.0001Yes
A-POFA1.3911.3911.960.0106Yes
B-PVA27.78127.78238.66<0.0001Yes
AB4.2614.2636.640.0005Yes
A20.04410.0440.370.5597No
B26.4316.4355.240.0001Yes
Residual0.8170.12
Lack of Fit0.8130.27
Pure Error0.00040.000
Cor Total42.2912
Table 6. Model validation parameters.
Model Validation ParametersCS (MPa)TS (MPa)FS (MPa)TSC (%)
Std. Dev.0.890.140.170.34
Mean29.301.815.342.77
CV %3.057.643.1312.33
PRESS56.471.281.508.27
-2 Log Likelihood25.89−22.54−17.690.88
R20.99310.98130.98900.9807
Adj. R20.98820.96790.98110.9670
Pred. R20.93000.82120.91520.8046
Adeq. Precision46.16629.53238.75727.476
BIC41.28−7.15−2.3016.27
AICc51.893.468.3126.88
Table 7. Optimization criteria and solutions.
FactorsInput FactorsResponses (Output Factors)
POFA (%)PVA Fibers (%)CS (MPa)TS (MPa)FS (MPa)TC (MPa)
ValueMinimum20112.990.463.0670.23
Maximum40241.243.517.2946.6
GoalMaximizeIn rangeMaximizeMaximizeMaximizeMaximize
Optimization Result27.68229.372.417.285.56
Desirability0.65 (65%)
Table 8. Experimental validation.
ResponseExperimental Result (RE)Predicted Result (RP)Percentage Error (δ) (%)
CS (MPa)32.1229.379.3
TS (MPa)2.202.418.7
FS (MPa)6.887.285.5
TC (%)6.015.568.1
Disclaimer/Publisher’s Note: The statements, opinions and data contained in all publications are solely those of the individual author(s) and contributor(s) and not of MDPI and/or the editor(s). MDPI and/or the editor(s) disclaim responsibility for any injury to people or property resulting from any ideas, methods, instructions or products referred to in the content.

