1. Introduction
Governments in various countries implemented lockdown or social distancing policies to prevent the spread of the COVID-19 pandemic, leading to significant changes in various industries. From a business owner’s perspective, lockdown or social distancing policies introduced the need for unexpected, novel operating patterns. In particular, the retail industry was subject to business restrictions, such as reducing the operating hours of offline stores and limiting the number of customers per unit space. In South Korea, COVID-19 was first reported in January 2020, and a social distancing policy was implemented in March of the same year. Strict social distancing was believed to prevent the spread of COVID-19; however, it shrunk business activities and changed the business model [
1]. The spread of COVID-19 also affected consumer psychology, and was well reflected in the consumer composite sentiment index (CCSI), which reflects consumers’ willingness to purchase. According to the index in South Korea, consumer willingness to purchase during the pandemic was even lower than that during the 2008 economic crisis [
2].
Fear of COVID-19 infection decreased the CCSI in the offline market, leading to unexpected and unpredictable shrinking of retail activities and sales [
2,
3]. Consequently, inventory management was challenging owing to the mismatch between actual and predicted demand. That mismatch resulted in excess inventory, which led to company losses. Accurately predicting demand is crucial for a successful business [
4,
5,
6,
7], but despite the importance of estimating the inventory properly, social distancing during the COVID-19 pandemic hindered researchers and sales managers from obtaining accurate time-series sales data.
The retail industry is shifting toward online platforms [
8]. Online platforms have a strong advantage in that they do not require a physical space to experience or display the items or services. In the context of this trend and the COVID-19 pandemic, studies from the retail field mostly focus on online retail platforms [
9]. This situation might be interpreted to indicate that the retail industry will shift to online-only; however, offline retail importantly offers brand, spatial, product and service experiences that online retail businesses cannot [
10]. Furthermore, Roberts [
11] described how consumers’ offline retail mall visits are still required for services tailored to individual preferences.
This study analyzed and forecasted offline retail sales during and after the COVID-19 pandemic period. A shopping mall in Seoul, South Korea, was selected as the retail sales data source. The majority of the shops in this center faced no closure after the COVID-19 outbreak. A total of 94 retail shops are located in the shopping center, which can be classified into the following five retail categories: fashion, food and beverage (f&b), entertainment, cosmetics and sport. Among those retail shops, 55 were selected for analysis as those were the ones that faced no closure during the COVID-19 pandemic. South Korea did not implement a lockdown policy; instead, it implemented a strict social distancing policy, with particular strict restrictions on in-store eating. The f&b and entertainment retail categories can be classified as associated with eating out more so than the others. Accordingly, and based on existing research, the following research hypotheses were drawn up: (1) the f&b and entertainment retail categories were more greatly impacted by social distancing than the other retail categories; and (2) the f&b and entertainment retail categories had not yet been able to overcome the impact of the COVID-19 (at the time of this investigation, in 2022).
To analyze offline retail sales patterns during the COVID-19 pandemic, this study adapted autoregressive integrated moving average (ARIMA) and exponential smoothing (ETS) models. These are the most traditional and basic linear models for forecasting economic data, such as retail sales or stock. Unfortunately, forecasting models still have limitations in that they cannot be applied to evaluate the forecasted values compared to the actual values. To overcome this limitation, an evaluation method is required to determine the most suitable forecasting model. The mean absolute percentage error (MAPE) is one of the most popular methods used for evaluating forecasting models. MAPE discerns the error percentage, where a lower number indicates a more accurate model. In this study, the most suitable forecasting models were selected using MAPE, and 2022 future sales values were forecasted. In this way, we could estimate the annual sales patterns based on the retail category.
Section 2 presents a review of retail, pandemic and sales-forecasting studies. The research methodology of this study, comprising forecasting models, ARIMA, ETS and model evaluation, is described in
Section 3.
Section 4 presents the results of this study, and
Section 5 provides concluding remarks.
2. Literature Reviews
2.1. Offline Retail and the COVID-19 Pandemic
Retail is defined as the behavior that occurs in the final step of consumers deciding which product to buy. This occurs based on consumers’ thoughts and is termed consumer behavior, which is difficult to clearly measure or define [
12,
13], though many researchers have tried to explain consumer behavior and identify its influencing factors [
14,
15]. Consumer behavior is largely dictated by personal, social and cultural factors [
16,
17]. Among these, social factors are the most unpredictable and difficult to control [
18]. Among them are the weather and pandemic diseases. With the former, the temperature [
18,
19] and fine dust concentrations [
20] affect consumers’ likelihood of visiting stores and buying retail products. Pandemics can also be considered an important social factor affecting consumer behavior. The severe acute respiratory syndrome (SARS) outbreak in China in November 2002 affected South Korea, with 8465 confirmed cases and 801 deaths. At the time, all industries experienced economic losses in South Korea [
21] and Hong Kong [
22]. Seven years after the SARS outbreak, the novel wine-origin influenza A outbreak in South Korea in April 2009 caused further economic loss, especially in tourism [
21,
23]. The most recent pandemic was Middle East respiratory syndrome (MERS) in June 2015, which led to an estimated 63.7 billion won loss of output, 34.2 billion won loss of value added and 14.9 billion won loss of income [
24].
The COVID-19 outbreak began in December 2019 and arrived in South Korea in January 2020. Shin [
25] described how COVID-19 caused a loss of sales, with that loss correlated with the previous scale of sales. The COVID-19 pandemic lowered consumers’ appetite to make purchases in person [
3], which meant that retail sales at large shopping malls, duty-free shops and urban retail quarters were greatly impacted. This was reflected in the CCSI [
2], which was 70.8 in South Korea in April 2020, lower than that during the 2008 economic crisis (77.9). A social distancing policy was implemented to prevent the spread of COVID-19 [
26,
27], which, along with the fear of contagion, led people to stay indoors, triggering a reduction in offline retail sales [
28,
29,
30].
2.2. Sales Forecasting
Retail is a part of logistics management, and as with all logistics management, uncertainty of demand presents an important challenge [
31]. Sales forecasting is the most efficient method to overcome demand uncertainty in the retail industry [
4,
5,
6]. It can enable managers to effectively control the product inventory, which prevents losses due to a lack of or excess product inventory [
32]. Retail sales data, which are considered time-series data, have different characteristics from the data normally used for general regression analysis, which makes future data difficult to predict accurately. To achieve higher accuracy, sales forecasting using past sales data patterns to forecast future sales [
33] can be conducted through various statistical methods. ARIMA and ETS are the most representative forecasting analysis models [
34]. They are widely used in the retail industry for the restaurant [
35,
36,
37], fashion [
34] and entertainment [
38,
39] retail categories, to analyze and forecast retail sales. This study aimed to forecast shopping mall retail sales during the COVID-19 pandemic using the ARIMA and ETS forecasting models.
3. Materials and Methodology
3.1. Time-Series Analysis
Time-series data have a continuous time feature [
40]. That can take one of a variety of forms, such as a trend, seasonality or cycle. These forms make time-series data high-dimensional and nonstationary, and accordingly, difficult to analyze using normal mathematical formulas [
40]. Reducing the dimensions of time-series data, without omitting important information, is thus important for analysis. Through reduction to low-dimensionality, stationary data [
41], the ARIMA and ETS models are the most popular and representative models to analyze time-series data [
33,
37,
42,
43,
44,
45].
3.1.1. Autoregressive Integrated Moving Average (ARIMA)
Box and Jenkins [
43] first introduced the ARIMA model. In this model, the number of differencing transformations required to make the time series stationary is added to the autoregressive moving average (ARMA) model, which combines the autoregressive (AR) and moving average (MA) models [
4,
46]. The ARIMA model can thus be applied to analyze nonstationary raw data. The first step in using the ARIMA model is to check whether the time series is stationary or nonstationary [
44]. The autocorrelation function (ACF) is a representative method for checking the stationarity of the time-series data. It is used to measure the linear relationship between the lagged values of time-series data [
41]. The autocorrelation value (
) measures the linear relationship between time-series data at time
(
) and time
(
), written as
where
is the total number of time-series data, and
is their value. When
is close to 1, the time-series data show a highly linear relationship between
and
. Conversely, if
decreases smoothly as the lag increases, the time-series data show a limited (or no) relationship between
and
.
The most representative phenomenon behind time-series data with a strong relationship is that they are nonstationary. Nonstationary time-series data have properties that depend on the time at which the data were observed. This occurs when time-series data exhibit a trend or seasonality. Before analyzing nonstationary time-series data, it is necessary to reduce the data’s high dimensionality, such as trends or seasonality. Differencing is the most representative method to do so [
41]. The form of differencing is as follows:
where
is the backward shift operator,
is the cycle of time-series data and
is the number of differences.
If the model is stationary (both with and without differencing), the ARIMA model can be used to analyze the time-series data. The model is written as
, and follows the form
where
is white noise at observed time ,
and
.
If there is a need to analyze seasonal features at the same time, the seasonal ARIMA model can be written as
. The seasonal ARIMA model has the following form:
where
, and
.
The ARIMA model can analyze time-series data over time sequence and forecast future values using the pattern determined by the model.
The ACF and PACF are helpful in selecting the order of the ARIMA model [
46]. As shown in
Table 1, both ACF and PACF are helpful for finding
and
, and ACF is also helpful for defining the number of
.
3.1.2. Exponential Smoothing
ETS is an analytical method that effectively reflects recent influences by reflecting stronger weights as it approaches the present time [
46]. The naïve ETS model is used when there is no trend or seasonality in time-series data. However, since most time-series data exhibit real-world trends or seasonality, time-series analysis methods and the ETS model must consider those [
41]. Winters [
47] analyzed time-series data with trends and seasonality using ETS via the Holt–Winters ETS (HW ETS) method. HW ETS is separated based on the pattern of seasonality into HW additive ETS and HW multiplicative ETS. When the cyclic amplitude of the data maintains a stable scale, HW additive ETS is the more suitable model of analysis, whereas when the cyclic amplitude of the data increases over time, HW multiplicative ETS is more suitable.
3.1.3. Model Evaluation
A forecasting model can only set expectations based on previous data. This means that the accuracy of the forecast cannot be ensured [
48]. The error between the actual data and forecasted data is usually used to determine the validity of the results of the forecasting model. The MAPE and root mean square error are mostly used to evaluate a forecasting model’s accuracy.
The MAPE is normally used to assess the accuracy of a forecasting model by percentage [
46,
49]. However, if there is a zero value in the observation data, the MAPE cannot be calculated. The MAPE produces a percentage value of comparativeness with other models. The MAPE form is
where
is the total number of datasets,
is the actual value at time
and
is the forecasted value at time
.
3.2. Data Collection
The data for this study were collected from a shopping mall in Seoul, South Korea. The majority of the stores in this shopping mall faced no closure during the COVID-19 pandemic. The data collection period was set to 4 years, 2 years either side of the COVID-19 outbreak in 2020. This shopping center has 94 tenant shops that can be divided into the following five categories: fashion, f&b, entertainment, cosmetics and sport. The retail categories had 30, 43, 8, 8 and 5 retail shops, respectively; however, for this study, only 55 retail shops’ data were used, the ones that did not face closure during the data collection period.
3.3. Forecasting Model Determination
Each data category had different properties. To determine the most suitable ARIMA model for each category, we analyzed the ACF of each category’s sales time-series data, as listed in
Table 2. It was confirmed that the time-series data for the f&b and entertainment retail categories showed nonstationarity as the ACF decreased smoothly. To remove nonstationarity and ensure stationarity, differencing was performed on the f&b and entertainment retail categories’ sales data. Subsequently, as described in
Section 3.1.1, ARIMA models suitable for each category were derived through ACF and PACF, as listed in
Table 3.
The ACF and PACF of the cosmetics retail category both cut off after lags 1 and 12; therefore, the model was selected as the most suitable forecasting model for the cosmetics retail category.
The ACF of the sports retail category cuts off after lags 3 and 13, and the PACF cuts off after lags 2 and 12. was thus the most suitable forecasting model for analyzing the sport retail category.
To select the most suitable ETS model for each retail category, a trend and seasonality analysis was performed.
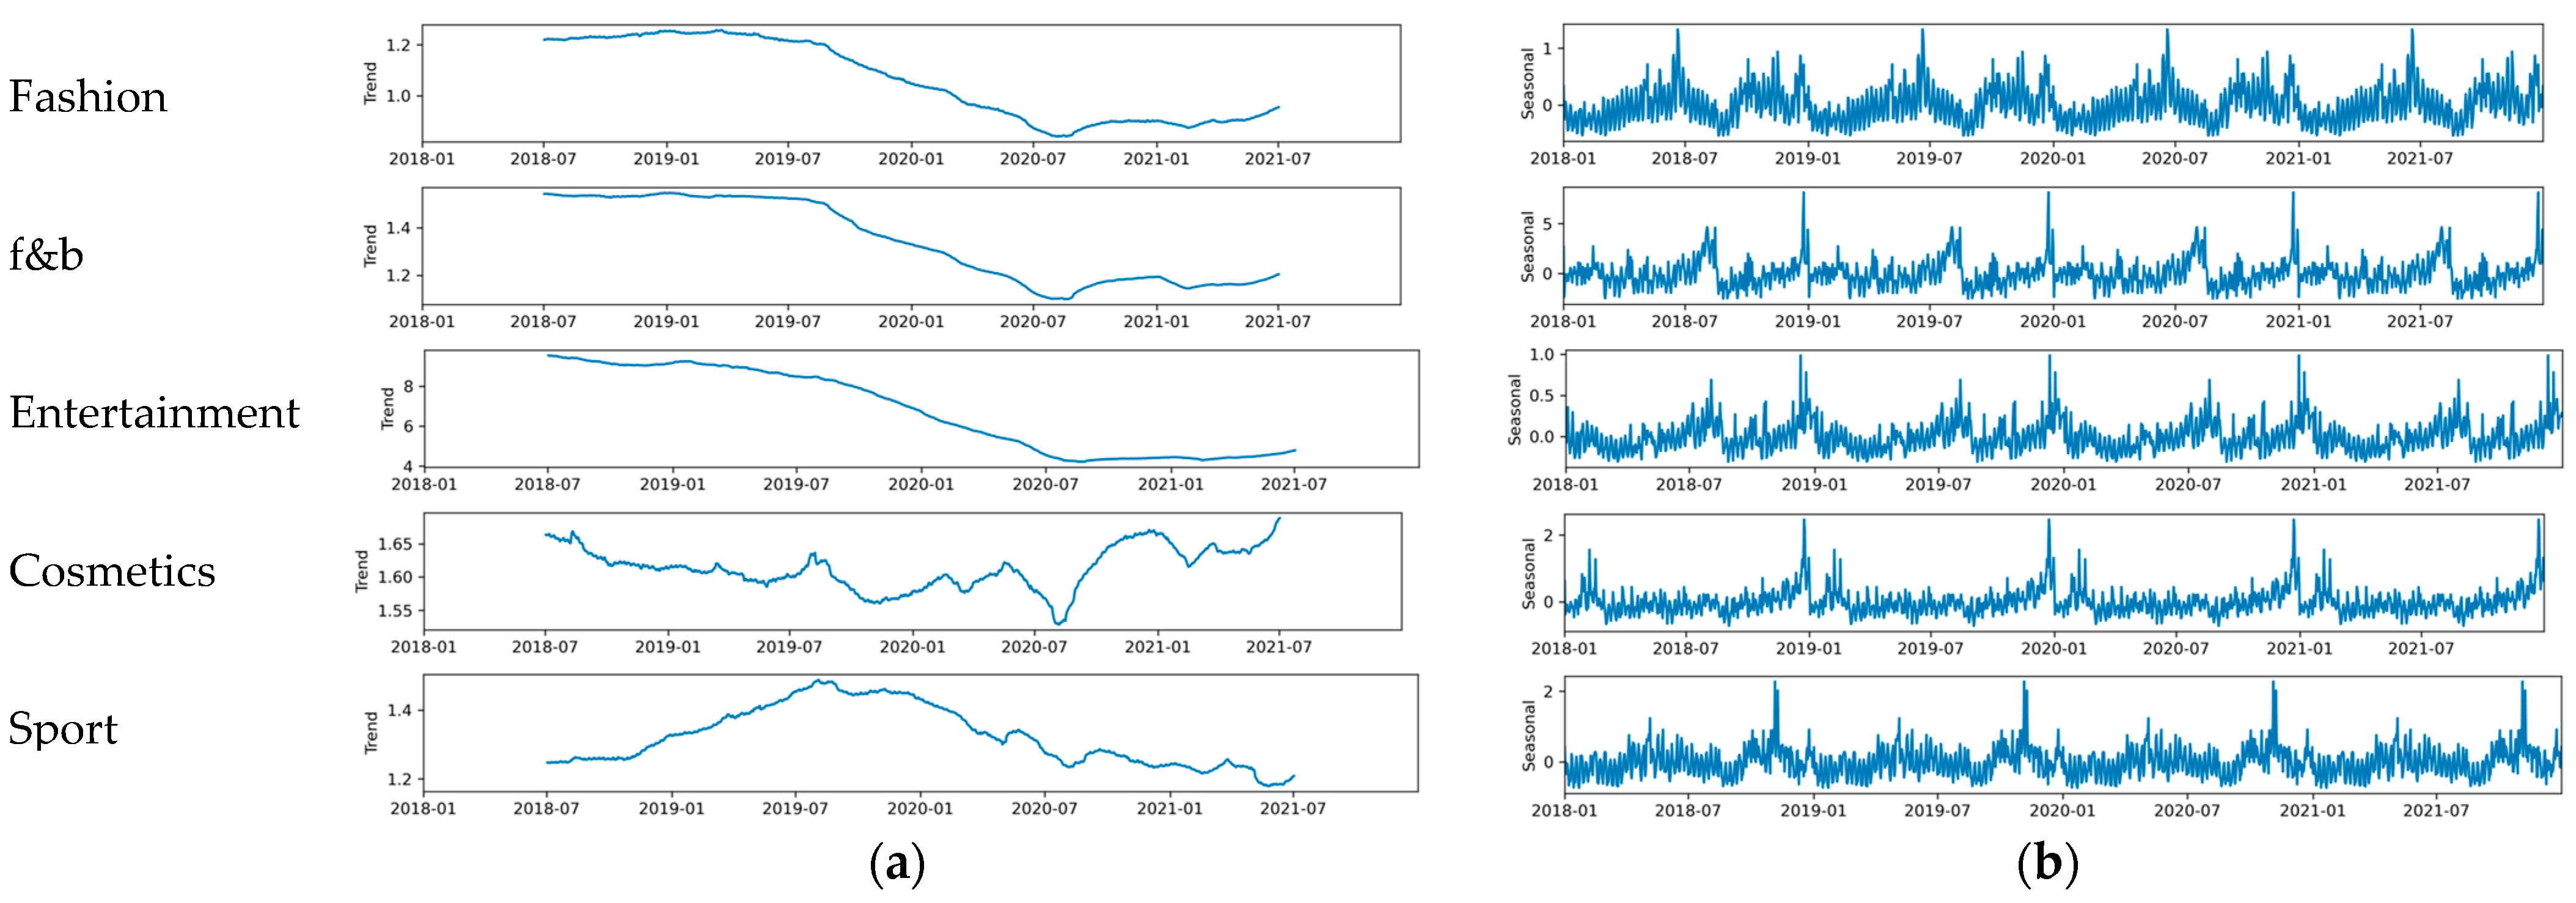
Figure 1. Shows the trends and seasonality of retail categories. All retail categories have strong seasonality with similar amplitudes. Cosmetic and sport retail categories’ sales show no significant trend. Fashion and f&b retail categories can also be considered non-trend and decreasing trends. Finally, the entertainment retail category shows a decreasing trend.
Therefore, both naïve seasonal ETS and HW additive ETS models were selected for the fashion and f&b retail categories, the HW additive ETS model for the entertainment retail category and the naïve seasonal ETS model for the cosmetics and sport retail categories.
Table 4 presents the forecasting models used for each retail category.
4. Results
4.1. Descriptive Analysis
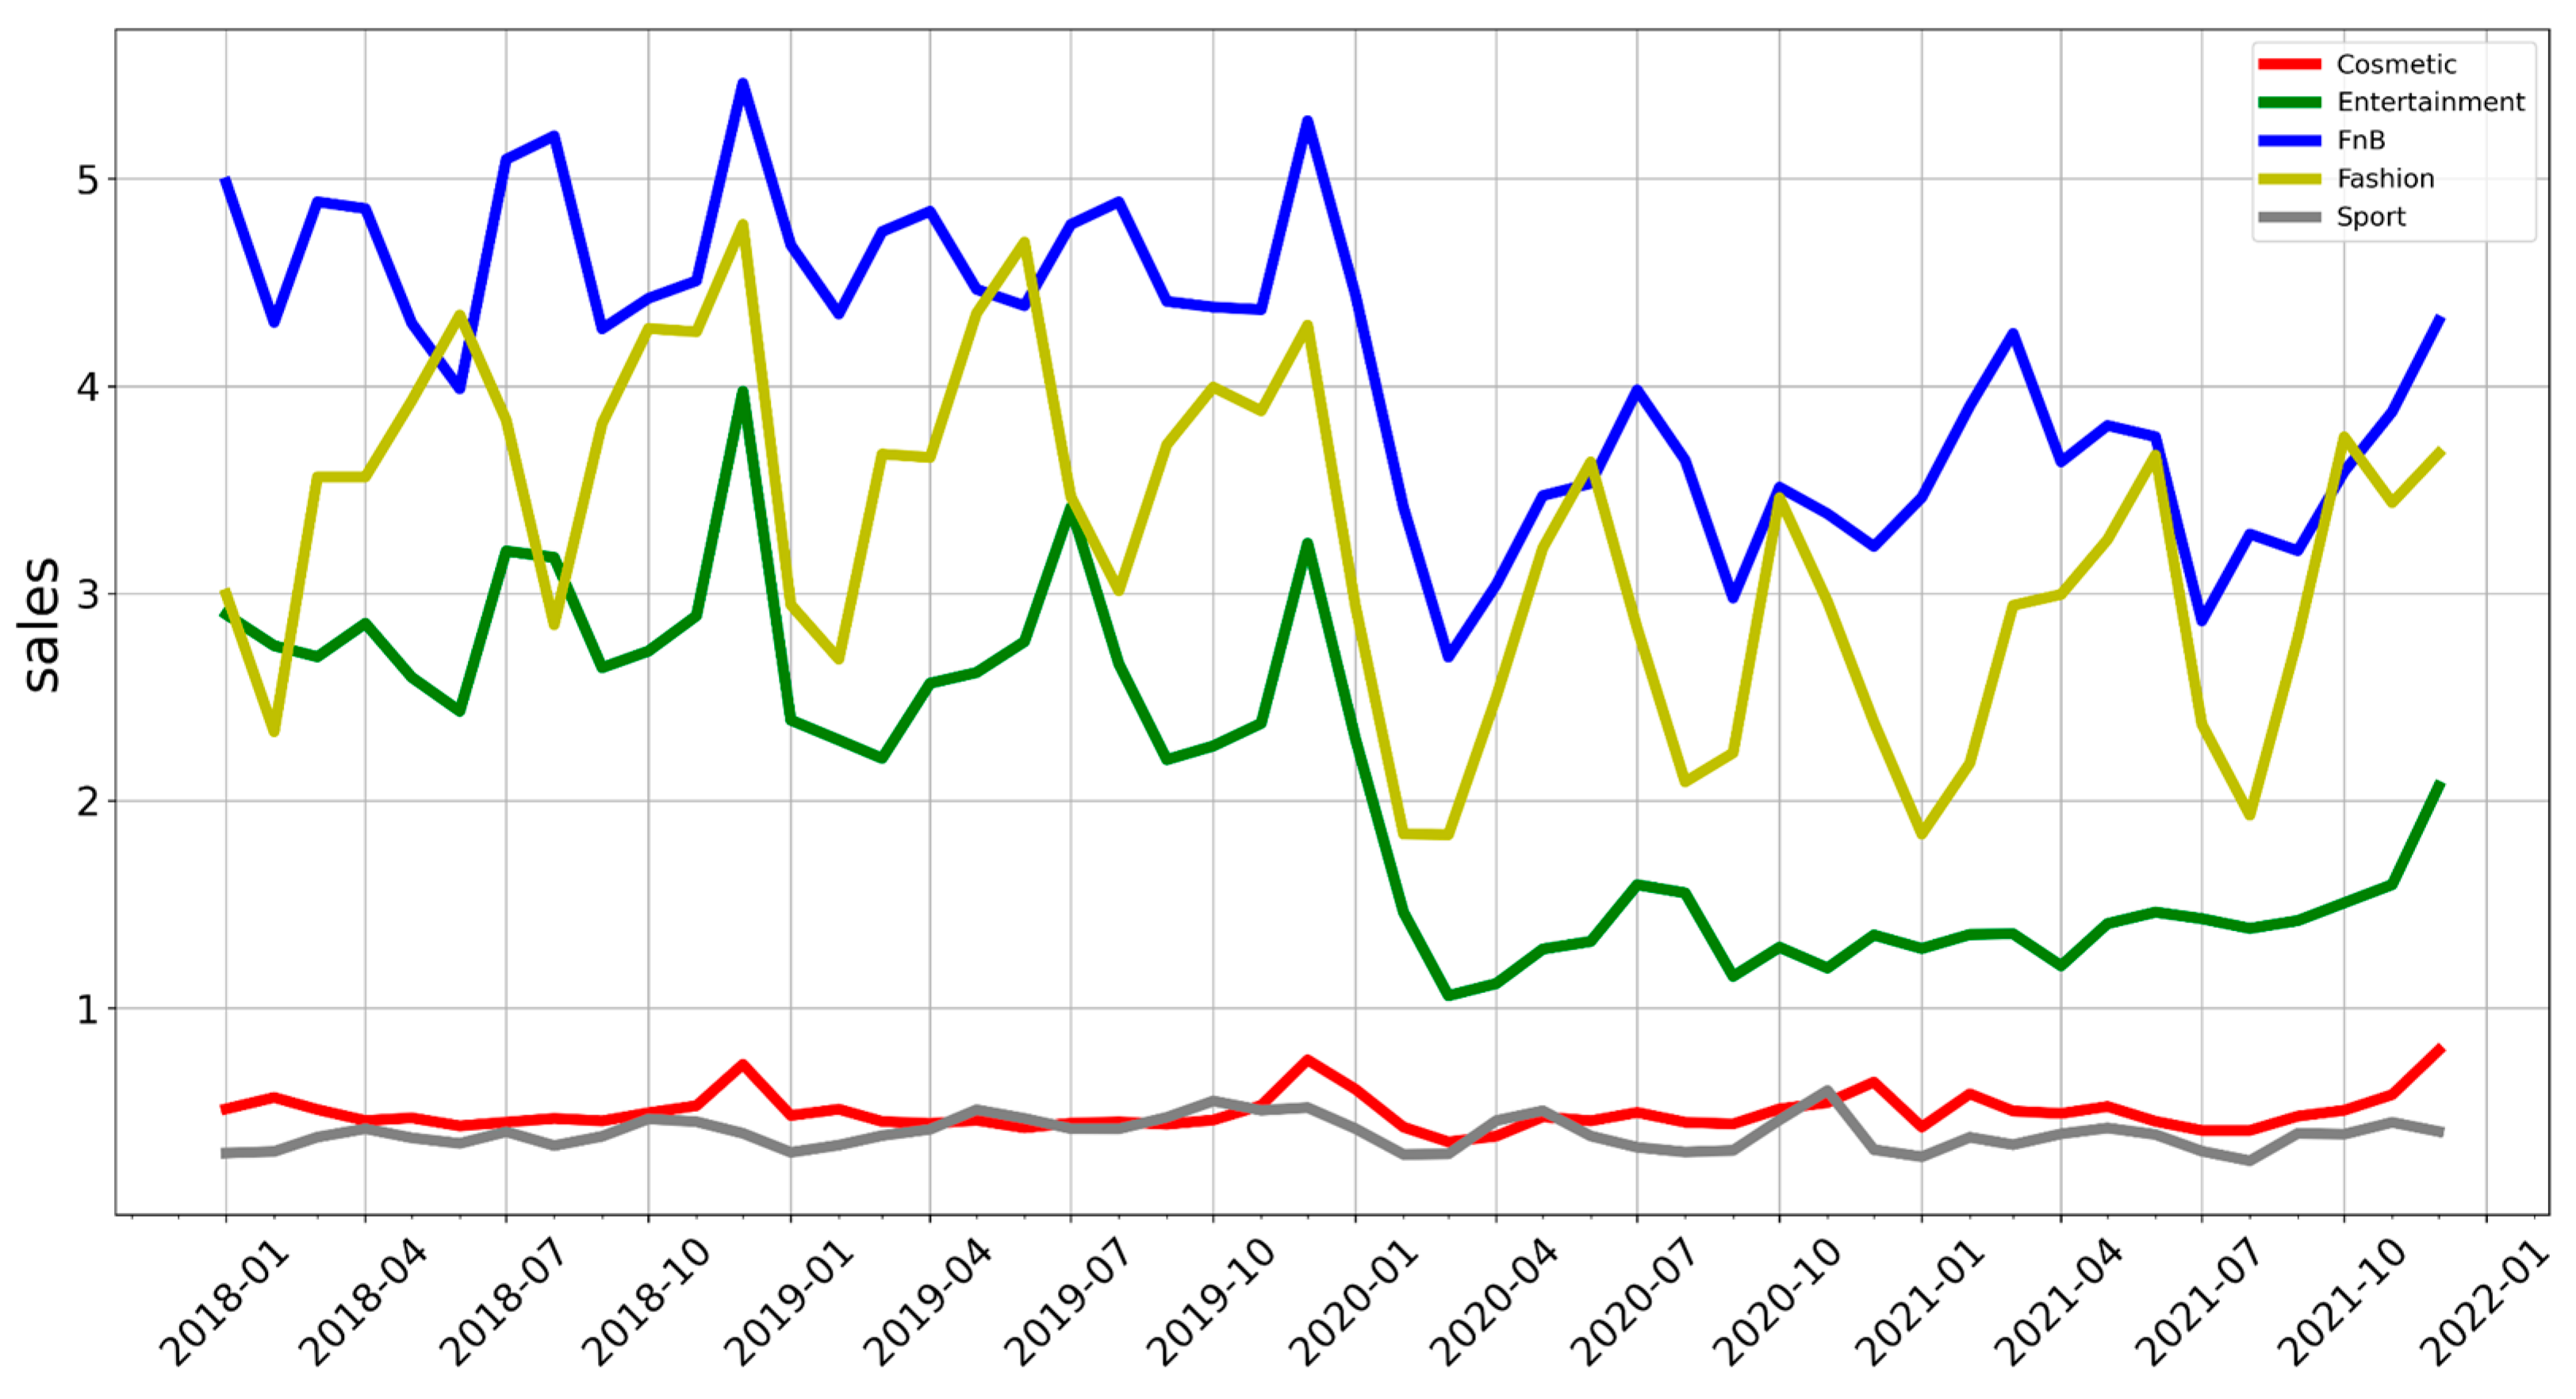
As shown in
Figure 2, the descriptive analysis of sales data showed that, in March 2020, there was an impact on sales data for each retail category due to the outbreak of the COVID-19 pandemic. In particular, the fashion, f&b and entertainment categories’ retail sales were impacted, whereas cosmetics and sport were not significantly affected by COVID-19. Since the fashion, f&b and entertainment retail categories made up a high proportion of the total sales, changes in these categories had a crucial impact on the whole shopping mall.
The trend in retail sales can also be observed through the results of our descriptive analysis. Retail sales in the fashion, f&b and entertainment categories were hugely impacted on retail sales and did not recover until December 2021. In contrast, the cosmetics and sport retail categories were not significantly impacted, maintaining stable retail sales until December 2021.
4.2. Evaluation of ARIMA and ETS Forecasting Models
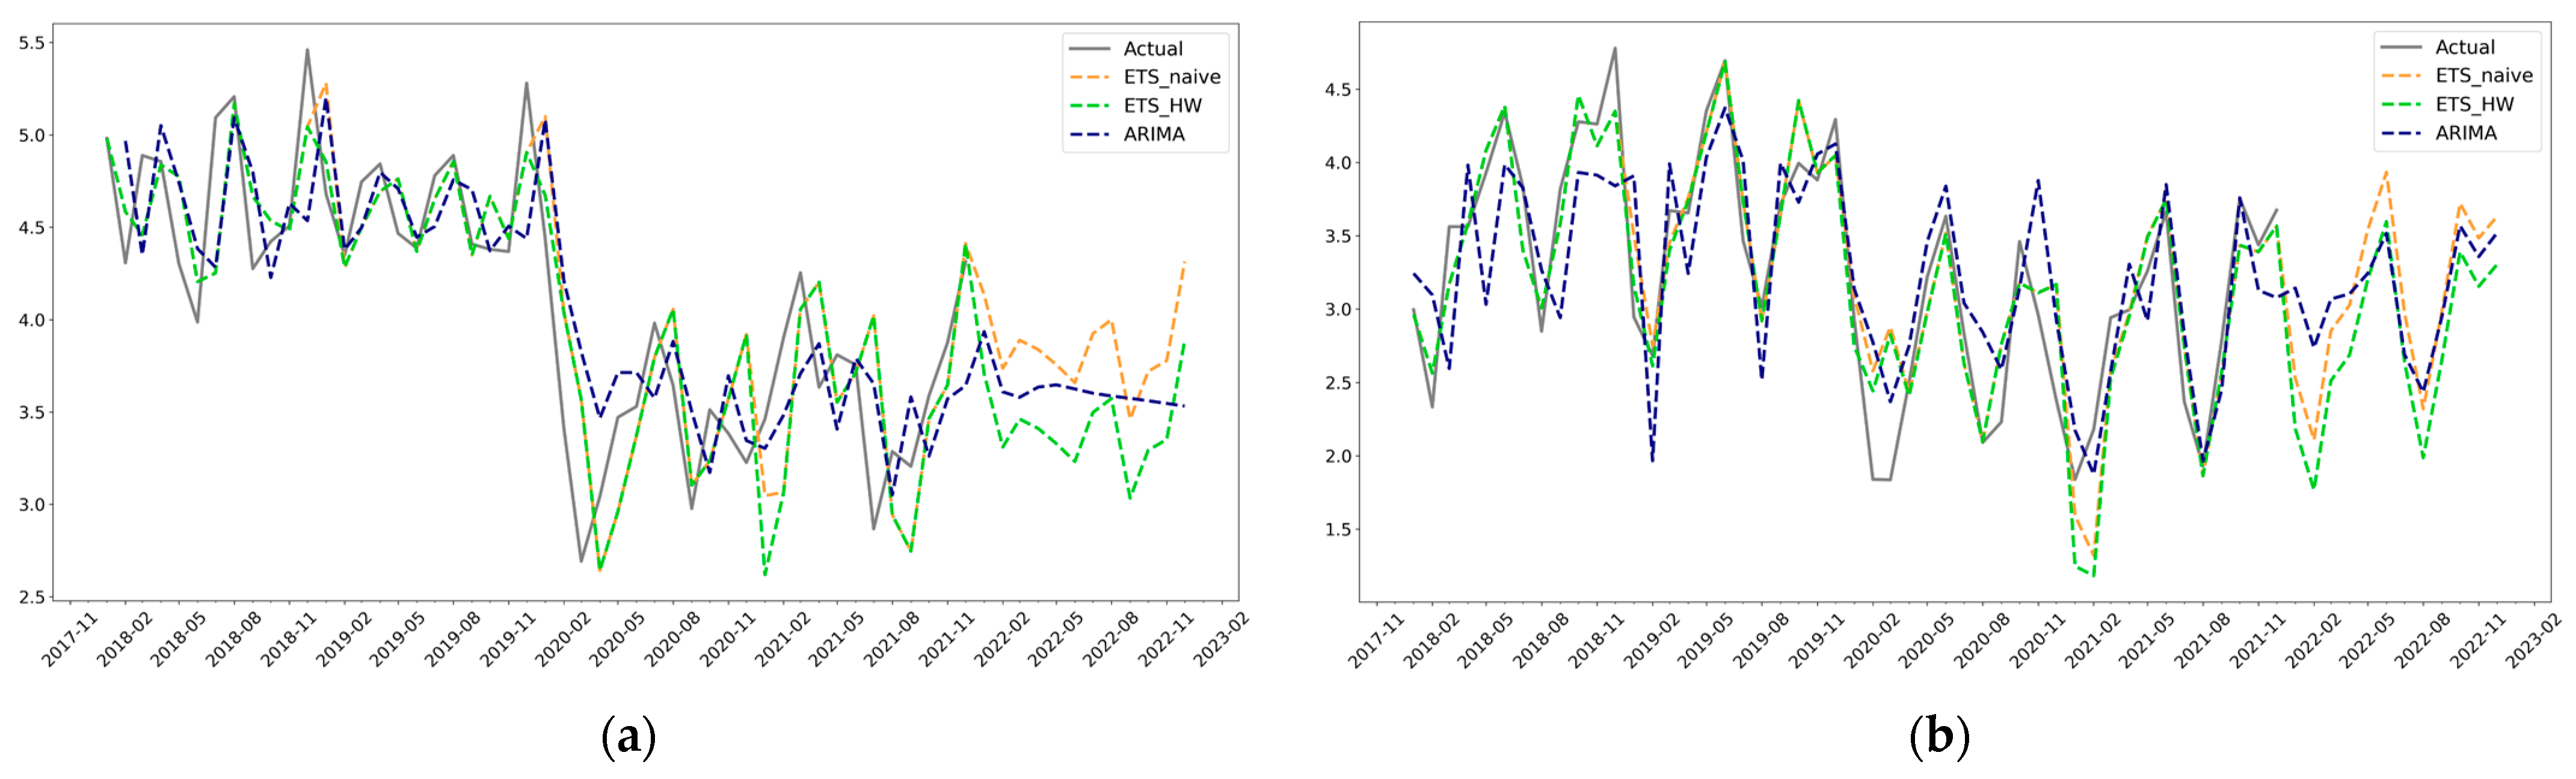
Figure 3 shows the sales in each retail category as the actual observed value (grey), naïve seasonal ETS forecasted value (yellow), HW additive ETS forecasted value (green) and ARIMA forecasted value (blue). Comparing forecasted values with actual values shows the accuracy of the forecasting model. The MAPE was used to find the most accurate forecasting model, as outlined in
Table 5.
Regarding the fashion category’s retail sales, the Ljung–Box Q test of the naïve seasonal ETS model was significant, with a p-value of <0.05, and the naïve seasonal ETS model and HW additive ETS model were rejected due to doubts about their suitability. The p-value of the ARIMA model was 0.049, which was less than 0.05; however, the p-value was around the probability of significance. Therefore, was selected to forecast the fashion category’s retail sales.
For the f&b category, the ARIMA and ETS models underwent the Ljung–Box Q test, and the HW additive ETS model was rejected because its suitability was doubted. The MAPE value of the naïve seasonal ETS model was 8.548, which was lower than that of ARIMA (9.621). The naïve seasonal ETS model was thus selected as the forecasting model for the f&b category’s retail sales.
The entertainment category’s forecasting model evaluation results showed that both models’ Ljung–Box Q test results were significant. The MAPE value of the HW additive model was 11.764, which was less than the 13.445 of the model.
As for the cosmetics and sport categories’ retail sales, the Ljung–Box Q test of the naïve seasonal ETS model had a significance of <0.05; therefore, this model was rejected because of doubts about its suitability. and were selected to forecast the cosmetics and sport categories’ retail sales, respectively.
4.3. Retail Sales Forecasting in 2022
Using the forecasting model determined in
Section 4.2, 2022 retail sales were forecasted for each retail category and
Figure 4 shows annual sales of each retail category.
Annual sales graphs—2018 (red) and 2019 (orange) sales graphs are pre-COVID-19, 2020 (gray) is when COVID-19 occurred and 2021 (sky blue) and 2022 are projected sales (light blue) after the COVID-19 outbreak—provide an overview of the impact of the COVID-19 pandemic and the degree of recovery.
It was confirmed that fashion sales were notably impacted, based on the graph from 2020, and would show a recovery trend over time, implying that, in 2022, they would have recovered to a level similar to that before the COVID-19 outbreak.
The f&b sales were also impacted by the COVID-19 outbreak and recovered over time. However, it was confirmed that there would be difficulty in recovering the sales to the level before the outbreak. This is assumed to be because f&b stores were directly affected by social distancing policies, such as limiting the number of people in a store.
Furthermore, entertainment sales were hit hard by the COVID-19 outbreak, with sales falling over time. This seems to reflect the impact on movie theaters, which account for a large proportion of the entertainment category. Postponement or cancellation of the release of many movies due to COVID-19 are held up as causes of the harm to the sales category.
Cosmetics and sport sales showed similar characteristics to one another. In both, the COVID-19 outbreak’s impact was not significant, and sales showed a stable pattern each year. Similar sales were forecasted to be recorded by 2022 to those pre-COVID-19.
5. Discussion
This study contributes a comprehensive analysis of the sales performance of brick-and-mortar retail stores that remained operational despite the COVID-19 pandemic. The lockdown and social distancing policies imposed globally challenged the collection of sales data for offline retail sales, hindering the analysis of their sales performance during the COVID-19 pandemic. Hence, this study serves as foundational research for further studies in the business and retail fields, providing critical insights and explanations.
The impact of various factors, including the weather, weekends, events, promotions and economic conditions, on retail sales has been researched in the past. In particular, it has been noted that the fashion retail category is marked by a significant difference between the summer and winter seasons due to the changing retail prices of products. In addition, sales in the entertainment industry are highly related to the release of blockbuster movies. Sales across retail categories during the COVID-19 pandemic varied not only based on the number of confirmed cases or social distancing policy level but also according to factors such as the high interest in personal hygiene and growth in demand for at-home substitutions for normal purchases, for instance, with premade products such as meal kits. Retail industry research should consider those important trends, and to support such research, in this study, we conducted descriptive research that enabled us to contribute basic foundational knowledge. The findings of this study can serve as a basic guide for offline retail research in the future.
This study is limited in how its findings can be generalized to the whole offline retail sector since it only focused only on retail categories most associated with eating out. In addition, the retail industry encompasses various types of stores, such as department stores, duty-free, shopping malls, boutiques and the high street, each with distinct characteristics, customers and strategies. Additionally, the factors affecting consumer behavior are diverse, including the weather, promotions, sales and holidays, and comprehensive understanding of these factors is required.
This study found that the COVID-19 pandemic impacted retail categories differently, even within the same shopping mall, thus requiring varying retail management strategies. However, this study focused only on linear regressive analysis methods that cannot consider nonlinear patterns. Using nonlinear methodologies, such as machine learning neural networks or long short-term memory, offers an advanced methodology to analyze complex patterns in time series [
37,
50]. In future research, applying machine learning will be beneficial to analyze offline retail sales during the pandemic.
Similarly, the MAPE was used as a predictive model evaluation method, but methods using root mean square error (RMSE) and mean absolute error (MAE) can offer a more comprehensive analysis. Further research is needed to determine the best approach to utilizing these methods.
6. Conclusions
The negative impact of the COVID-19 pandemic on offline retail sales is evident; however, the enforcement of lockdown and social distancing policies around the world limited the data that were captured to support analyses of offline retail sales. This study analyzed offline retail sales data from before and during the COVID-19 pandemic and applied those to forecast the sales in 2022 by retail category.
Our results showed that entertainment and f&b categories, which were directly affected by social distancing, such as a maximum capacity in-store, seats blocked out and business hour restrictions, were impacted by COVID-19, and sales in these retail categories did not easily recover. Any further outbreaks of COVID-19, and resulting social distancing policy enforcement, will continue to most impact the entertainment and f&b retail categories. The fashion category mostly recovered from the impact of COVID-19 and was expected to reach the same sales levels in 2022 as before the COVID-19 outbreak, even if COVID-19 and social distancing policies continued. The cosmetics and sport retail categories were not notably impacted by the COVID-19 pandemic, except for the month of the outbreak. Based on these results, it can be noted that even in the same shopping mall, each retail category faced different types and degrees of impact by the COVID-19 pandemic. Each category came to be impacted by different aspects of consumer behavior theory, which need to be studied [
51]. Accordingly, each retail category was required to adopt a specific strategy to manage and overcome the pandemic’s impact, with a particular challenge presented in retail categories associated with eating out, which needed the greatest support to overcome the COVID-19 pandemic impact.
Nowadays, offline shops are no longer simply physical spaces for purchasing goods, but have become environments that cater to the needs and desires of potential customers. To effectively engage with customers, offline shops are designed to satisfy two key requirements: (1) matching consumer needs and desires and tailoring the buying experience to individual preferences, and (2) affectively eliciting specific emotions in the consumer through their experience. This study highlights that the impact of COVID-19 varied by retail category, even within the same building. This can be linked to consumer behavior in each retail category and impulse or panic buying due to the pandemic. Panic buying, driven by anxiety and fear [
52,
53,
54], such as during natural disasters, pandemics or long strikes [
54,
55,
56], should be considered in future studies. Furthermore, the different impacts between retail categories emphasize the importance of developing targeted strategies to overcome the impact of a pandemic, particularly for categories that rely on consumers eating out. Overall, this study confirms that the COVID-19 pandemic had varying effects on different types of offline retail stores, meaning post-pandemic sales forecasts differed by retail category. A key implication of these findings for researchers is that it is crucial to establish a nuanced research strategy for the offline retail field.
Author Contributions
Conceptualization, H.-J.K. and J.-b.I.; methodology, H.-J.K.; software, J.-b.I.; validation, J.-H.K. and J.-b.I.; formal analysis, J.-H.K.; investigation, H.-J.K.; resources, H.-J.K.; data curation, J.-b.I.; writing—original draft preparation, H.-J.K.; writing—review and editing, J.-H.K.; visualization, J.-b.I.; supervision, J.-H.K.; project administration, J.-b.I. All authors have read and agreed to the published version of the manuscript.
Funding
This research received no external funding.
Informed Consent Statement
Not applicable.
Data Availability Statement
Not applicable.
Conflicts of Interest
The authors declare no conflict of interest.
References
- Mann, C.L. Real and financial lenses to assess the economic consequences of COVID-19. Econ. Time COVID-19 2020, 81, 85. [Google Scholar]
- Bank of KOREA. Consumer Trend Survey Result. 2020. Available online: https://www.bok.or.kr/portal/bbs/P0000559/view.do?nttId=10060414&menuNo=200690&searchWrd=%EC%86%8C%EB%B9%84%EC%9E%90%EB%8F%99%ED%96%A5&searchCnd=1&sdate=&edate=&pageIndex=3 (accessed on 25 September 2020).
- Park, H.S.; Pan, J.H.; Jeong, H.C.; Kim, S.J. The impact of the COVID-19 crisis on the Seoul economy and the countermeasures for small business and tourism. Policy Rep. 2020, 297, 1–32. [Google Scholar]
- Chu, C.W.; Zhang, G.P. A comparative study of linear and nonlinear models for aggregate retail sales forecasting. Int. J. Prod. Econ. 2003, 86, 217–231. [Google Scholar] [CrossRef]
- Ramos, P.; Santos, N.; Rebelo, R. Performance of state space and ARIMA models for consumer retail sales forecasting. Robot. Comput.-Integr. Manuf. 2015, 34, 151–163. [Google Scholar] [CrossRef] [Green Version]
- Mounika, S.; Sahithi, Y.; Grishmi, D.; Sindhu, M.; Ganesh, P. Walmart Gross Sales Forecasting Using Machine Learning. J. Adv. Res. Technol. Manag. Sci. 2021, 3, 22–27. [Google Scholar]
- Tian, X.; Wang, H.; Erjiang, E. Forecasting intermittent demand for inventory management by retailers: A new approach. J. Retail. Consum. Serv. 2021, 62, 102662. [Google Scholar] [CrossRef]
- Mattarocci, G.; Roberti, S. Real Estate and the Effects of the COVID-19 Pandemic in Europe. A New World Post COVID-19 2020, 177, 177–190. [Google Scholar]
- Szász, L.; Bálint, C.; Csíki, O.; Nagy, B.Z.; Rácz, B.G.; Csala, D.; Harris, L.C. The impact of COVID-19 on the evolution of online retail: The pandemic as a window of opportunity. J. Retail. Consum. Serv. 2022, 69, 103089. [Google Scholar] [CrossRef]
- Yoon, S.J.; Park, H.K. The methods of experience design in retail spaces focused on large scaled shopping complexes. J. Integr. Des. Res. 2012, 11, 123–134. [Google Scholar]
- Roberts, D. Enjoy the fantasy of a “v” while you can. Edpacs 2020, 62, 1–8. [Google Scholar] [CrossRef]
- Hall, C.M.; Fieger, P.; Prayag, G.; Dyason, D. Panic buying and consumption displacement during COVID-19: Evidence from New Zealand. Economies 2021, 9, 46. [Google Scholar] [CrossRef]
- Veselovská, L.; Závadský, J.; Bartková, L. Consumer behaviour changes during times of the COVID-19 pandemic: An empirical study on Slovak consumers. Econ. Manag. 2021, 24, 136–152. [Google Scholar] [CrossRef]
- Kotler, P. Reconceptualizing marketing: An interview with Philip Kotler. Eur. Manag. J. 1994, 12, 353–361. [Google Scholar] [CrossRef]
- Marsden, D. Deconstructing consumer behaviour: Theory and practice. J. Consum. Behav. Int. Res. Rev. 2001, 1, 9–21. [Google Scholar] [CrossRef]
- Soriano, M.Y.; Foxall, G.R.; Pearson, G.J. Emotion and environment: A test of the behavioural perspective model in a Latin American context. J. Consum. Behav. Int. Res. Rev. 2002, 2, 138–154. [Google Scholar] [CrossRef]
- Huggins, K.A.; White, D.W.; Holloway, B.B.; Hansen, J.D. Customer gratitude in relationship marketing strategies: A cross-cultural e-tailing perspective. J. Consum. Mark. 2020, 37, 445–455. [Google Scholar] [CrossRef]
- Han, S.L.; Moon, J. Impact of environmental changes on offline distribution channel sales. J. Channel Retail. 2020, 25, 31–51. [Google Scholar] [CrossRef]
- Badorf, F.; Hoberg, K. The impact of daily weather on retail sales: An empirical study in brick-and-mortar stores. J. Retail. Consum. Serv. 2020, 52, 101921. [Google Scholar] [CrossRef]
- Ruan, W.; Kang, S.; Song, H. Applying protection motivation theory to understand international tourists’ behavioural intentions under the threat of air pollution: A case of Beijing, China. Curr. Issues Tour. 2020, 23, 2027–2041. [Google Scholar] [CrossRef]
- Kim, S.J. The impact of epidemic on the tourism industry. J. Hosp. Tour. Stud. 2016, 18, 21–37. [Google Scholar]
- Wong, S.Y.; Lim, W.W.C.; Que, T.L.; Au, D.M.Y. Reflection on SARS precautions in a severe intellectual disabilities hospital in Hong Kong. J. Intellect. Disabil. Res. 2005, 49, 379–384. [Google Scholar] [CrossRef]
- Jeon, B.Y. Infectious disease trend and prospect. Korean Tour. Policy 2009, 38, 34–41. [Google Scholar]
- Moon, J.; Han, S.L. Analysis of the influence of MERS epidemic on retailing industry of Seoul city. J. Channel Retail. 2016, 21, 129–152. [Google Scholar] [CrossRef]
- Shin, H.J. COVID-19 Impact on Regional Economic Activities: Focusing on Regional Industrial Structure Differences. J. Ind. Econ. Trade 2020, 4, 43–74. [Google Scholar]
- Pathak, G.; Warpade, S. Impact of lockdown due to COVID-19 on consumer behaviour while selecting retailer for essential goods. Zeichen 2020, 6, 282–289. [Google Scholar]
- Frago, L. Impact of COVID-19 pandemic on retail structure in barcelona: From tourism-phobia to the desertification of city center. Sustainability 2021, 13, 8215. [Google Scholar] [CrossRef]
- Bhatti, A.; Akram, H.; Basit, H.M.; Khan, A.U.; Raza, S.M.; Naqvi, M.B. E-commerce trends during COVID-19 Pandemic. Int. J. Future Gener. Commun. Netw. 2020, 13, 1449–1452. [Google Scholar]
- Pang, W.; Ko, J.; Kim, S.J.; Ko, E. Impact of COVID-19 pandemic upon fashion consumer behavior: Focus on mass and luxury products. Asia Pac. J. Mark. Logist. 2022, 34, 2149–2164. [Google Scholar] [CrossRef]
- Shin, C.H.; Cho, H.J. Time-series Analysis on the Impact of COVID-19 on Online Shopping Purchase. Electron. Trade Inst. 2012, 20, 97–109. [Google Scholar]
- Fiorito, S.S.; May, E.G.; Straughn, K. Quick response in retailing: Components and implementation. Int. J. Retail Distrib. Manag. 1995, 23, 12–21. [Google Scholar] [CrossRef] [Green Version]
- Zhao, X.; Xie, J.; Lau, R.S.M. Improving the supply chain performance: Use of forecasting models versus early order commitments. Int. J. Prod. Res. 2001, 39, 3923–3939. [Google Scholar] [CrossRef]
- Krishna, A.; Akhilesh, V.; Aich, A.; Hegde, C. Sales-forecasting of retail stores using machine learning techniques. In Proceedings of the 2018 3rd International Conference on Computational Systems and Information Technology for Sustainable Solutions (CSITSS), Bengaluru, India, 20–22 December 2018. [Google Scholar]
- Liu, N.; Ren, S.; Choi, T.M.; Hui, C.L.; Ng, S.F. Sales forecasting for fashion retailing service industry: A review. Math. Probl. Eng. 2013, 2013, 738675. [Google Scholar] [CrossRef] [Green Version]
- Kim, S.C.; Choi, S.K. Forecasting demand for food & beverage by using univariate time series models: With a focus on hotel H in Seoul. Culin. Sci. Hosp. Res. 1999, 5, 87–101. [Google Scholar]
- Yim, E.S. A forecasting restaurant sales: Exponential smoothing models and ARIMA model. J. Korean Acad. Soc. Hosp. Adm. 2007, 16, 139–154. [Google Scholar]
- Pavlyshenko, B.M. Machine-learning models for sales time series forecasting. Data 2019, 4, 15. [Google Scholar] [CrossRef] [Green Version]
- Kang, S.Y.; Kim, K.B.; Park, S.M. The Pttern of Method for Demand Forecasting Entertainment Industry: Focused on Tourism Industry. J. Korea Entertain. Ind. Assoc. 2017, 11, 1–13. [Google Scholar]
- Tovmasyan, G. Forecasting the number of incoming tourists using ARIMA model: Case study from Armenia. Mark. Manag. Innov. 2021, 3, 139–148. [Google Scholar] [CrossRef]
- Längkvist, M.; Karlsson, L.; Loutfi, A. A review of unsupervised feature learning and deep learning for time-series modeling. Pattern Recognit. Lett. 2014, 42, 11–24. [Google Scholar] [CrossRef] [Green Version]
- Hyndman, R.J.; Athanasopoulos, G. Forecasting: Principles and Practice; OTexts: Melbourne, Australia, 2018. [Google Scholar]
- Shi, J.; Guo, J.; Zheng, S. Evaluation of hybrid forecasting approaches for wind speed and power generation time series. Renew. Sustain. Energy Rev. 2012, 16, 3471–3480. [Google Scholar] [CrossRef]
- Box, G.E.; Jenkins, G.M.; Reinsel, G.C.; Ljung, G.M. Time Series Analysis: Forecasting and Control; John Wiley & Sons: Hoboken, NJ, USA, 2015. [Google Scholar]
- Siami-Namini, S.; Namin, A.S. Forecasting economics and financial time series: ARIMA vs. LSTM. arXiv 2018, arXiv:1803.06386. [Google Scholar]
- Ma, S.; Fildes, R. Retail sales forecasting with meta-learning. Eur. J. Oper. Res. 2021, 288, 111–128. [Google Scholar] [CrossRef]
- Jain, G.; Mallick, B. A Study of Time Series Models ARIMA and ETS. Available at SSRN 2898968. 2017. Available online: https://www.mecs-press.org/ijmecs/ijmecs-v9-n4/IJMECS-V9-N4-7.pdf (accessed on 30 June 2017).
- Winters, P.R. Forecasting sales by exponentially weighted moving averages. Manag. Sci. 1960, 6, 324–342. [Google Scholar] [CrossRef]
- Permatasari, C.I.; Sutopo, W.; Hisjam, M. Sales forecasting newspaper with ARIMA: A case study. In AIP Conference Proceedings; AIP Publishing LLC: Melville, NY, USA, 2018. [Google Scholar]
- Fildes, R.; Ma, S.; Kolassa, S. Retail forecasting: Research and practice. Int. J. Forecast. 2022, 38, 1283–1318. [Google Scholar] [CrossRef] [Green Version]
- Siami-Namini, S.; Tavakoli, N.; Namin, A.S. A comparison of ARIMA and LSTM in forecasting time series. In Proceedings of the 2018 17th IEEE International Conference on Machine Learning and Applications (ICMLA), Orlando, FL, USA, 17–20 December 2018; IEEE: Piscataway, NJ, USA, 2018. [Google Scholar]
- Eger, L.; Komárková, L.; Egerová, D.; Mičík, M. The effect of COVID-19 on consumer shopping behaviour: Generational cohort perspective. J. Retail. Consum. Serv. 2021, 61, 102542. [Google Scholar] [CrossRef]
- Shou, B.; Xiong, H.; Shen, X. Consumer panic buying and quota policy under supply disruptions. Manuf. Serv. Oper. Manag 2013, 6, 1–9. [Google Scholar]
- Tsao, Y.C.; Raj, P.V.R.P.; Yu, V. Product substitution in different weights and brands considering customer segmentation and panic buying behavior. Ind. Mark. Manag. 2019, 77, 209–220. [Google Scholar] [CrossRef]
- Islam, T.; Pitafi, A.H.; Arya, V.; Wang, Y.; Akhtar, N.; Mubarik, S.; Xiaobei, L. Panic buying in the COVID-19 pandemic: A multi-country examination. J. Retail. Consum. Serv. 2021, 59, 102357. [Google Scholar] [CrossRef]
- Wu, Y.; Xin, L.; Li, D.; Yu, J.; Guo, J. How does scarcity promotion lead to impulse purchase in the online market? A field experiment. Inf. Manag. 2021, 58, 103283. [Google Scholar] [CrossRef]
- Badgaiyan, A.J.; Verma, A. Does urge to buy impulsively differ from impulsive buying behaviour? Assessing the impact of situational factors. J. Retail. Consum. Serv. 2015, 22, 145–157. [Google Scholar] [CrossRef]
| Disclaimer/Publisher’s Note: The statements, opinions and data contained in all publications are solely those of the individual author(s) and contributor(s) and not of MDPI and/or the editor(s). MDPI and/or the editor(s) disclaim responsibility for any injury to people or property resulting from any ideas, methods, instructions or products referred to in the content. |
© 2023 by the authors. Licensee MDPI, Basel, Switzerland. This article is an open access article distributed under the terms and conditions of the Creative Commons Attribution (CC BY) license (https://creativecommons.org/licenses/by/4.0/).


