Article

Seismic Fragility Assessment of Inner Peripheries of Italy through Digital Crowd-Sourcing Technologies

1
Department of Biosciences and Territory, University of Molise, Via F. De Sanctis 1, 86100 Campobasso, Italy
2
Department of Structures for Engineering and Architecture, University of Naples Federico II, Via Claudio 21, 80125 Naples, Italy
3
Institute for Construction Technologies, National Research Council of Italy, Secondary Branch of L’Aquila, 67100 L’Aquila, Italy
*
Author to whom correspondence should be addressed.
Buildings 2023, 13(2), 562; https://doi.org/10.3390/buildings13020562
Submission received: 19 January 2023 / Revised: 13 February 2023 / Accepted: 16 February 2023 / Published: 18 February 2023
(This article belongs to the Section Building Structures)

Abstract

:
The structural and seismic fragility assessment of minor historical centers of the Inner Peripheries of Italy is a key phase of the preservation process of the historical and cultural features of a portion of the Italian building stock, whose reuse is crucial for the reversal of shrinking trends and the stimulation of population growth. In this framework, the opportunities offered by digital crowd-sourcing technologies with respect to performing probabilistic structural safety assessment at a large scale are investigated herein. The objective of this research was to exploit data and information available on the web such that the key building features of an area of interest are collected through virtual inspections, historical databases, maps, urban plans, etc. Thus, homogeneous clusters of buildings identified in the area of interest are catalogued and associated with specific building classes (chosen among those available in the literature), and the buildings’ levels of seismic fragility are determined through the development of fragility curves. The research outcomes show that the proposed approach provides a satisfactory initial screening of the seismic fragility level of an area, thus allowing for the identification of priority zones that require further investigations or structural interventions to mitigate seismic risk.

1. Introduction

Italy is a country that is composed of numerous Inner Peripheries; these cover almost 60% of the national territory, encompassing about 23% of its total population and more than 4000 municipalities [1]. Inner Peripheries (or Areas) are defined as localities that are not geographically remote yet may constitute ‘peripheries’ in terms of their relationship with global economic circuits and interaction [2]. Such zones, which preserve the typical architectonical archetypes of the Italian building stock and cultural heritage, are often characterized by high vulnerability due to their inhomogeneous building features, integration between buildings erected in different ages, and composition of different materials and geometries [3,4,5].
They represent zones of particular importance for the cultural and economic growth of the entire Italian nation and must be protected and preserved against natural hazards by implementing strategic risk mitigation plans. Furthermore, many minor centers are distributed along the Apennines, where complex geological and morphological settings exist in combination with severe seismic hazards [6].
In this framework, large-scale seismic structural safety assessment represents one of the key tasks to be carried out to define a ‘level-zero’ of risk mitigation strategies with which to render Inner Areas resilient to natural hazards [7] and develop sustainable paths for the reuse of the existing buildings for the reversal of the shrinking of social and economic trends and the stimulation of population growth. Technology can be one of the key players in the analysis of the current conditions of minor centers both in the field of large-scale structural safety assessment and in the field of the monitoring and surveillance of the condition of contemporary and historical structures [8]. Regarding structural seismic assessment, different methodologies designed for the estimation of the seismic fragility of urban areas have been developed in the last decades based on empirical, mechanical, expert judgement-based, or hybrid approaches [9]. As a final goal, each method encompasses the definition of fragility curves, which provides the probability of the exceedance of a Damage State (DS) or Limit State (LS) threshold of a building stock for a given ground motion intensity at the site in question [10].
Basically, each method requires data collection regarding the structural and typological features of existing buildings. Buildings’ features are detected through direct in-field inspections/observations or by the post-processing seismic damage data of buildings gathered by teams of experts in the aftermath of earthquakes that are available on databases, for instance, https://www.cartis.plinivs.it or https://www.egeos.eucentre.it (both accessed on 19 January 2023), which provide Italian data. Due to the great number of buildings involved, it can be time consuming and expensive to examine a building’s characteristics with in-field inspections in the case of rapid, large-scale seismic assessment [11].
On the other hand, the digital transition and the introduction of smart working due to the COVID-19 pandemic have changed the conception of work in many fields [12]. The use of smart devices (computers, tablets, mobile phones, web networks, and apps) has facilitated the digitalization of work, thus placing workstations inside homes. In this framework, digital crowd-sourcing technologies present attractive potential for identifying the structural and typological characteristics of buildings with the objective of large-scale seismic fragility assessment, thus relegating traditional in situ inspections or data post-processing [13,14].
In 2011, Ricci et al. [15] proposed a combined approach consisting of in-field and remote-sensing surveys to the detect building features of highly urbanized areas. Similarly, an integrated approach based on multi-source imaging (remote sensing combined with ground-based omnidirectional imaging) to estimate building inventory in urban areas was presented by Wieland et al. in 2012 [16].
Web-mapping approaches used to identify building features at large scales have started regaining importance in the last few years. Marra and Fabbrocino [17] investigated and demonstrated the effectiveness of using web-based tools and platforms for the surveillance of cultural heritage. Kassem et al. [18] developed a rapid visual screening method through a web-based application to detect building features with the aim of estimating the expected damage probability due to earthquakes in urban areas in Malaysia.
Ruggieri et al. [14] proposed a methodology with which to define the seismic vulnerability of existing buildings by using mechanical models developed through the information automatically extracted from simple photos of buildings. Alternatively, Columbro et al. [11] assessed the opportunities offered by web-based mapping platforms for identifying the building features of the city of Leiria (Portugal), concluding that web-mapping approaches can represent an efficient and cost-effective complement to traditional in-field inspections. Furthermore, other works that estimate seismic vulnerability (and in many cases, exposure, too) based on a crowd-sourcing approach are available in the literature [19,20].
The paper is divided as follows. Section 2 describes the main aspects of the research and its significance and originality in the field. Section 3 illustrates the methodological path followed to perform the analyses; for the sake of completeness, to make the paper self-consistent and prevent the consideration of too many external sources, some basic aspects concerning the seismic fragility formulation are reported along with the description of the way the web-mapping platforms are used. Section 4 introduces the two test areas used to test and validate the methodology; it also includes explanatory references to info-graphical material available on the web and the results of the probabilistic seismic assessment analysis. Finally, Section 5 reports some concluding remarks along with some remarks on possible future developments and improvements of the process.

2. Research Significance
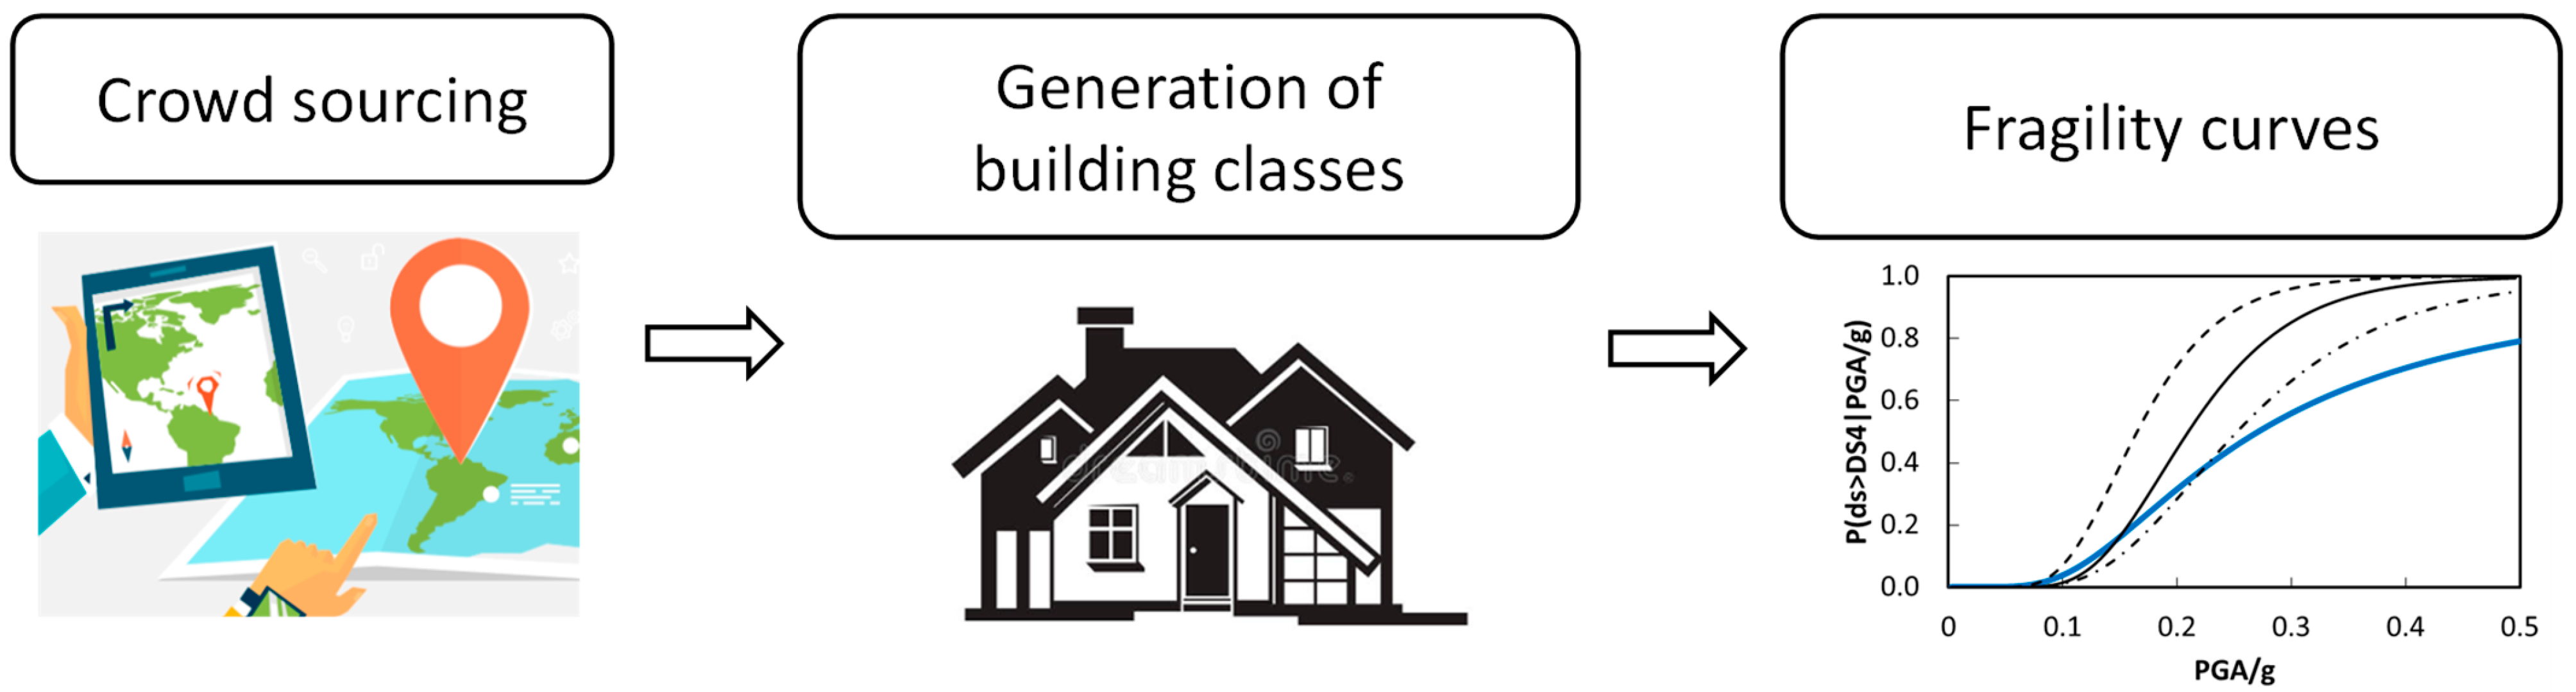
This paper is focused on the potentialities offered by digital crowd-sourcing technologies for the surveillance and structural characterization of building features in the framework of the probabilistic seismic structural safety assessment of minor historical centers of the Inner Peripheries of Italy. In such a context, one of the novel aspects of the work consists in the procedure used for the development of ‘urban’ fragility curves exploiting the opportunities and tools offered by modern web-mapping platforms as well as social media according to the crowd-sensing paradigm. Particularly, attention is paid to the way urban fragility curves, i.e., a single curve that estimates the seismic fragility level of an entire urban sector selected in an urbanized area, can be generated without a time-consuming and expensive field survey. Conversely, web-mapping platforms can supply a virtual survey of a building’s features so that the computation of the probability of the exceedance of a given Limit State can be used to perform an initial screening of the seismic fragility of urbanized areas. The obtained results represent the baseline from which to guide and prioritize further and more detailed analysis or to support the implementation of seismic risk plans in the area of interest.
It is well known that knowledge of the built environment is only one of the relevant aspects in the context of a comprehensive seismic assessment of large, urbanized areas; among others, soil amplification effects due to geotechnical conditions and soil liquefaction associated with the nature of the soil and the depth of the water table play a role in the definition of large-scale safety conditions [21,22]. However, herein, geological and geotechnical aspects are not considered in order to separately explore and detail the opportunities offered by digital platforms with respect to supporting the technical community in managing structural risk. Future developments, including those already designed and in progress, exhibit the high potential of the application of crowd-sourcing technologies to an integrated and comprehensive approach to the seismic vulnerability analysis of urban areas, including critical and industrial facilities [13].
This paper is also significant in the context of enhancing the resilience of urban areas. In fact, the research outcomes provide valid support for the planning of mitigating actions against earthquakes; this is of paramount importance to maintaining the continuity of an urban system, along with its inhabitants, through all shocks and stresses, thereby preventing the commonplace depopulation of the Inner Areas of Italy. Moreover, by identifying the most vulnerable areas, interventional strategies can be implemented.
Herein, the performance of web-mapping platforms and digital crowd-sourcing technologies towards the development of large-scale seismic fragility analyses has been assessed and validated with respect to two different small centers: the historical centers of Scilla (Calabria region, southern Italy) and Bargagli (Liguria region, northern Italy). The first center is located in a high-earthquake-intensity area overlooking the strait of Messina and is classified as a belt municipality (Type C) in the Calabria Region according to the ‘Strategy for the Inner Areas’ [23]; the second one is located in a low-earthquake-intensity zone, in the Valli Antola and Tigullio Inner Area, Liguria Region, which is a few kilometers away from Genova [24].

3. Methodology

This section outlines the operational process for determining the probabilistic structural seismic safety of small historical centers. The operational process is characterized by the following steps: (i) identification of the structural-typological features of the buildings through digital crowd-sourcing technologies (using sources and tools available on web); (ii) definition of a building inventory, associating the detected buildings with specific building classes representative of the National building stock available in the literature; and (iii) computation of the seismic structural safety level of an area through probabilistic fragility models.
In Figure 1, a schematic flow chart of the methodology is reported. In a general sense, it exploits the potential of remote sensing to generate clusters of structural-typological classes representative of the building stock present in the area of interest. Thereafter, through mathematical fragility models, which were selected from among those available in the literature, the probabilistic structural safety level of the entire area is defined.

3.1. Identification of Building Features through Digital Crowd Sourcing

Crowd sourcing is a methodological approach ingrained in two mainstream disciplines of economy and management, but in the last decades, it has also involved other fields such as information systems management, organizational theory, and design; marketing; and strategy [25]. Basically, it represents a working model that exploits the knowledge of a multitude of people to develop a project. In this paper, the same working model has been used to assess seismic fragility of urban areas, wherein the practical expertise from the research and data is derived by merging all the information available on and derivable from the web.
Many tools available online can be conveniently used to map the building stock clustered in urban areas and identify their structural-typological features. Typically, Google apps, historical cartographies, urban plans, census data, or databanks related to historical earthquakes and construction ages of the building are used. In Table 1, some easy-to-use web tools are reported alongside indications of derivable data. Constituting a significant advantage, datasets derived through classic in situ inspections can be conveniently obtained by browsing online with Google Maps (https://www.google.it/maps, accessed on 19 January 2023) or Google Earth (https://www.google.com/intl/it/earth, accessed on 19 January 2023), which allows for the generation of virtual tours at street level.
These tools enable the mapping of the areas under study, the definition of the number of buildings, the identification of the construction technology (i.e., masonry, reinforced concrete/RC, timber, steel, or other), the number of floors, and the presence of structural interventions (for instance, steel ties visible on the façades of masonry buildings). Moreover, the type of materials and masonry textures can be also recognized with good level of approximation. It is worth noting that the parameters detectable trough web, and that were just listed, are the same as those used within the methods based on observational in situ inspections or required in post-earthquake inspections to assess the usability level of damaged buildings [26].
Other web tools can be additionally used to support web mapping (Table 1). For instance, in Italy, the Military Geographic Institute (IGM-www.igmi.org, accessed on 19 January 2023)—which is the State mapping agency—made printed and digital cartographies of Italy (at different scales), aerial photos, and historical cartographies available online. Thus, the information obtained with Google apps can be compared and crossed-referenced with those obtained from cartographies to reconstruct the historical urban evolution of the area of interest and identify the age of construction of buildings. In the authors’ opinion, the age of construction is a key parameter with which to identify the structural-typological features of buildings, and it is strictly related to the age of codes’ introduction.
In Italy, after 1908 (i.e., from Messina and Reggio Calabria’s earthquake onwards), specific building codes for zones hit by earthquakes were introduced. They contained specific seismic provisions and details for repairing existing buildings and for constructing new ones: obviously, such provisions modified, over time, the structural-typological features of the buildings and their structural behavior [25]. In this sense, the databank of the Italian National Institute of Statistics (ISTAT-www.istat.it, accessed on 19 January 2023) not only provides ages of construction of the buildings, but also information related to, e.g., type of materials or number of stories (Table 1).
The web portal of the National Institute of Geophysics and Volcanology (INGV-www.ingv.it, accessed on 19 January 2023) represents another important tool. It provides the ground-shaking maps of the entirety of Italy, thus enabling the reconstruction of, in chronological order, the history of earthquakes and their intensity. This facilitates the categorization of the ages in which both new building codes and new structural-typological features for buildings have been potentially introduced.
Furthermore, other information on building characteristics and urban evolution of an area can be derived by consulting the Urban Plans of the Municipality under study (often available online)—such as the Recovery Plans, which collect information on building features, material properties, number of floors, etc.—or via cadastral maps.
Conversely, through the National Geoportal (www.pcn.minambiente.it, accessed on 19 January 2023), the geological conformation of the areas can also be derived by providing additional information to define seismic fragility.

3.2. Generation of Building Classes

The definition of the building inventory is a key aspect of the development of rapid large-scale seismic fragility assessments. Building characteristics of an urban area must be preliminarily identified and, subsequently, clustered into building classes (predefined or defined ex novo). In the literature, some structural-typological classifications are available and can be conveniently used in the context of the proposed methodology to group the buildings, as long as they are representative of the buildings of the area.
With regard to the Italian building stock in particular, some classifications of the existing buildings are summarized in Table 2; these classifications indicate the number of typological classes related to masonry and RC buildings and whether typological fragility curves are provided. Basically, these classifications take into account the common parameters regarding structural typology, types of materials, age of construction, number of floors, and presence of structural interventions and irregularities.
Table 2 shows that the number of building classes are different for each classification; this aspect is of particular importance because a small number of typological classes are by far preferred with respect to developing fast methods oriented towards providing an initial screening of the seismic fragility level of an area. On the contrary, building classifications including a higher number of building classes are more effective for developing fragility analyses with a greater level of detail.
One of the first approaches devoted to subdividing the existing Italian building stock into typological classes was presented by Di Pasquale et al. [27]. They proposed three basic vulnerability classes (indicated with A, B, and C) as a function of vertical and horizontal load-bearing structures and age of construction, including both masonry and RC buildings. In particular, the classes A and B include masonry buildings only, while the class C is divided into C1 and C2, wherein the first concerns masonry buildings and the second concerns RC ones. For these classes, fragility curves (and damage probability matrices) have been developed, which adopt binomial probability mass distributions.
In 2006, Lagomarsino and Giovinazzi [28] proposed fragility curves for building classes defined within the Risk-EU project [29], including 7 classes of masonry buildings and 6 RC ones. Typological fragility curves have been developed through the so-called macroseismic method. Rota et al. 2008 [30] enlarged the buildings provided by the Risk-EU project by post-processing damage data regarding 1500 damaged buildings collected in the areas affected by the most severe Italian earthquakes.
Sixteen classes of masonry buildings and four for RC were defined, and empirical typological fragility curves for relevant classes were calculated, which accounted for different damage states. Alternatively, three vulnerability classes for existing masonry buildings and one for RC, accounting for vertical structure types, were proposed by Zuccaro and Cacace in 2015 [31], without developing fragility curves.
In 2019, Del Gaudio et al. defined twenty typological classes concerning masonry buildings—defined as a function of vertical and horizontal load-bearing structures mainly—based on outcomes of post-earthquake damage surveys following the 2009 L’Aquila earthquakes [32]. For these classes, fragility curves (referring to different damage states) have been elaborated using a lognormal cumulative density function distribution. Recently, Donà et al. (2020) [33] divided the Italian unreinforced masonry (URM) building stock into ten macro-typologies, defined by ages of construction and number of stories, based on information gathered at national level by means of Italian ISTAT database.
Conversely, Sandoli et al. [34] and Sandoli and Calderoni [35] proposed a structural-typological classification of Italian building stock for URM and RC buildings, respectively. This classification, which is the result of an expert-judgement/observational approach that combines the experience of the authors regarding the structural behavior of existing buildings with observed damage and seismic behavior in post-earthquake inspections, includes a reduced number of building classes: five classes for URM buildings and four classes for RC buildings. For each typological class, fragility curves corresponding to a single damage state (e.g., Life Safety Limit State, herein denoted as Ultimate Limit State (ULS) have also been defined based on a mechanical approach.
Table 2. Typological classifications of existing buildings in Italy.
ScholarsNumber of ClassesFragility
Curves
MasonryRC
Risk EU-project [29]76no
Di Pasquale et al. [27]31
Lagomarsino and Giovinazzi [28]76
Rota et al. [30]164
Zuccaro and Cacace [31]31no
Sandoli and Calderoni [35]-4
Del Gaudio et al. [32]20-
Donà et al. [33]10-
Sandoli et al. [34]5-

3.3. Generation of Fragility Curves

The outcome of the proposed method consists of assessing the probabilistic structural safety level of an urban area through fragility curves. In this paper, urban fragility curves have been adopted in place of typological fragility curves [5,7]. The latter can represent the fragility of single building classes, while, at urban scale, a unique urban fragility curve mean—representative of the seismic fragility of an entire area, accounting for all the building classes included within—appears to be more effective. In other terms, the urban fragility curve is the result of a weighted average determined from among the fragility curves of the individual typologies identified in the area.
In mathematical terms, a fragility curve is described by a Cumulative Density Function (CDF) representing the probability of exceedance of a given Damage State (DS) or Limit State (LS) threshold for a given Intensity Measure (IM) parameter representing ground motion. The CDF is obtained by integrating the Probability Density Function (PDF):
C D F i m = P l s > L S | I M = 0 i m ¯ P D F   d i m
where i m ¯ represents an intensity measure threshold of the ground motion relative to the selected IM. Typically, IM is quantified through peak ground or spectral parameters (in terms of acceleration, velocity, and displacement) or macroseismic intensity measures [10].
In large-scale seismic fragility methods, the PDF is typically evaluated through a binomial or lognormal distribution of the IM and the Peak Ground Acceleration (PGA) is commonly assumed as IM. PGA, in particular, is evaluated at the bed rock (as a fraction of the gravity acceleration, g), and the PDF is distributed with a lognormal function, as follows:
P D F i m = 1 i m β ¯ 2 π e x p 1 2 ln i m μ ¯ β ¯ 2
where μ ¯ and β ¯ represent the median and the standard deviation of the distribution of the IM corresponding to the entire urban area, respectively. Then, μ ¯ and β ¯ are obtained as follows: (a) μ ¯ is calculated as average value among the values of μ corresponding to a single building class identified in the area of interest (provided by one of the building classifications available in the literature); (b) β ¯ = σ , where σ represents the total variance calculated with the theorem of the total variance. It should be noted that the weighted values of μ ¯ and β ¯ allow for the acquirement of urban fragility curves as an alternative to typological curves.

4. Implementation and Validation of the Probabilistic Seismic Assessment Procedure

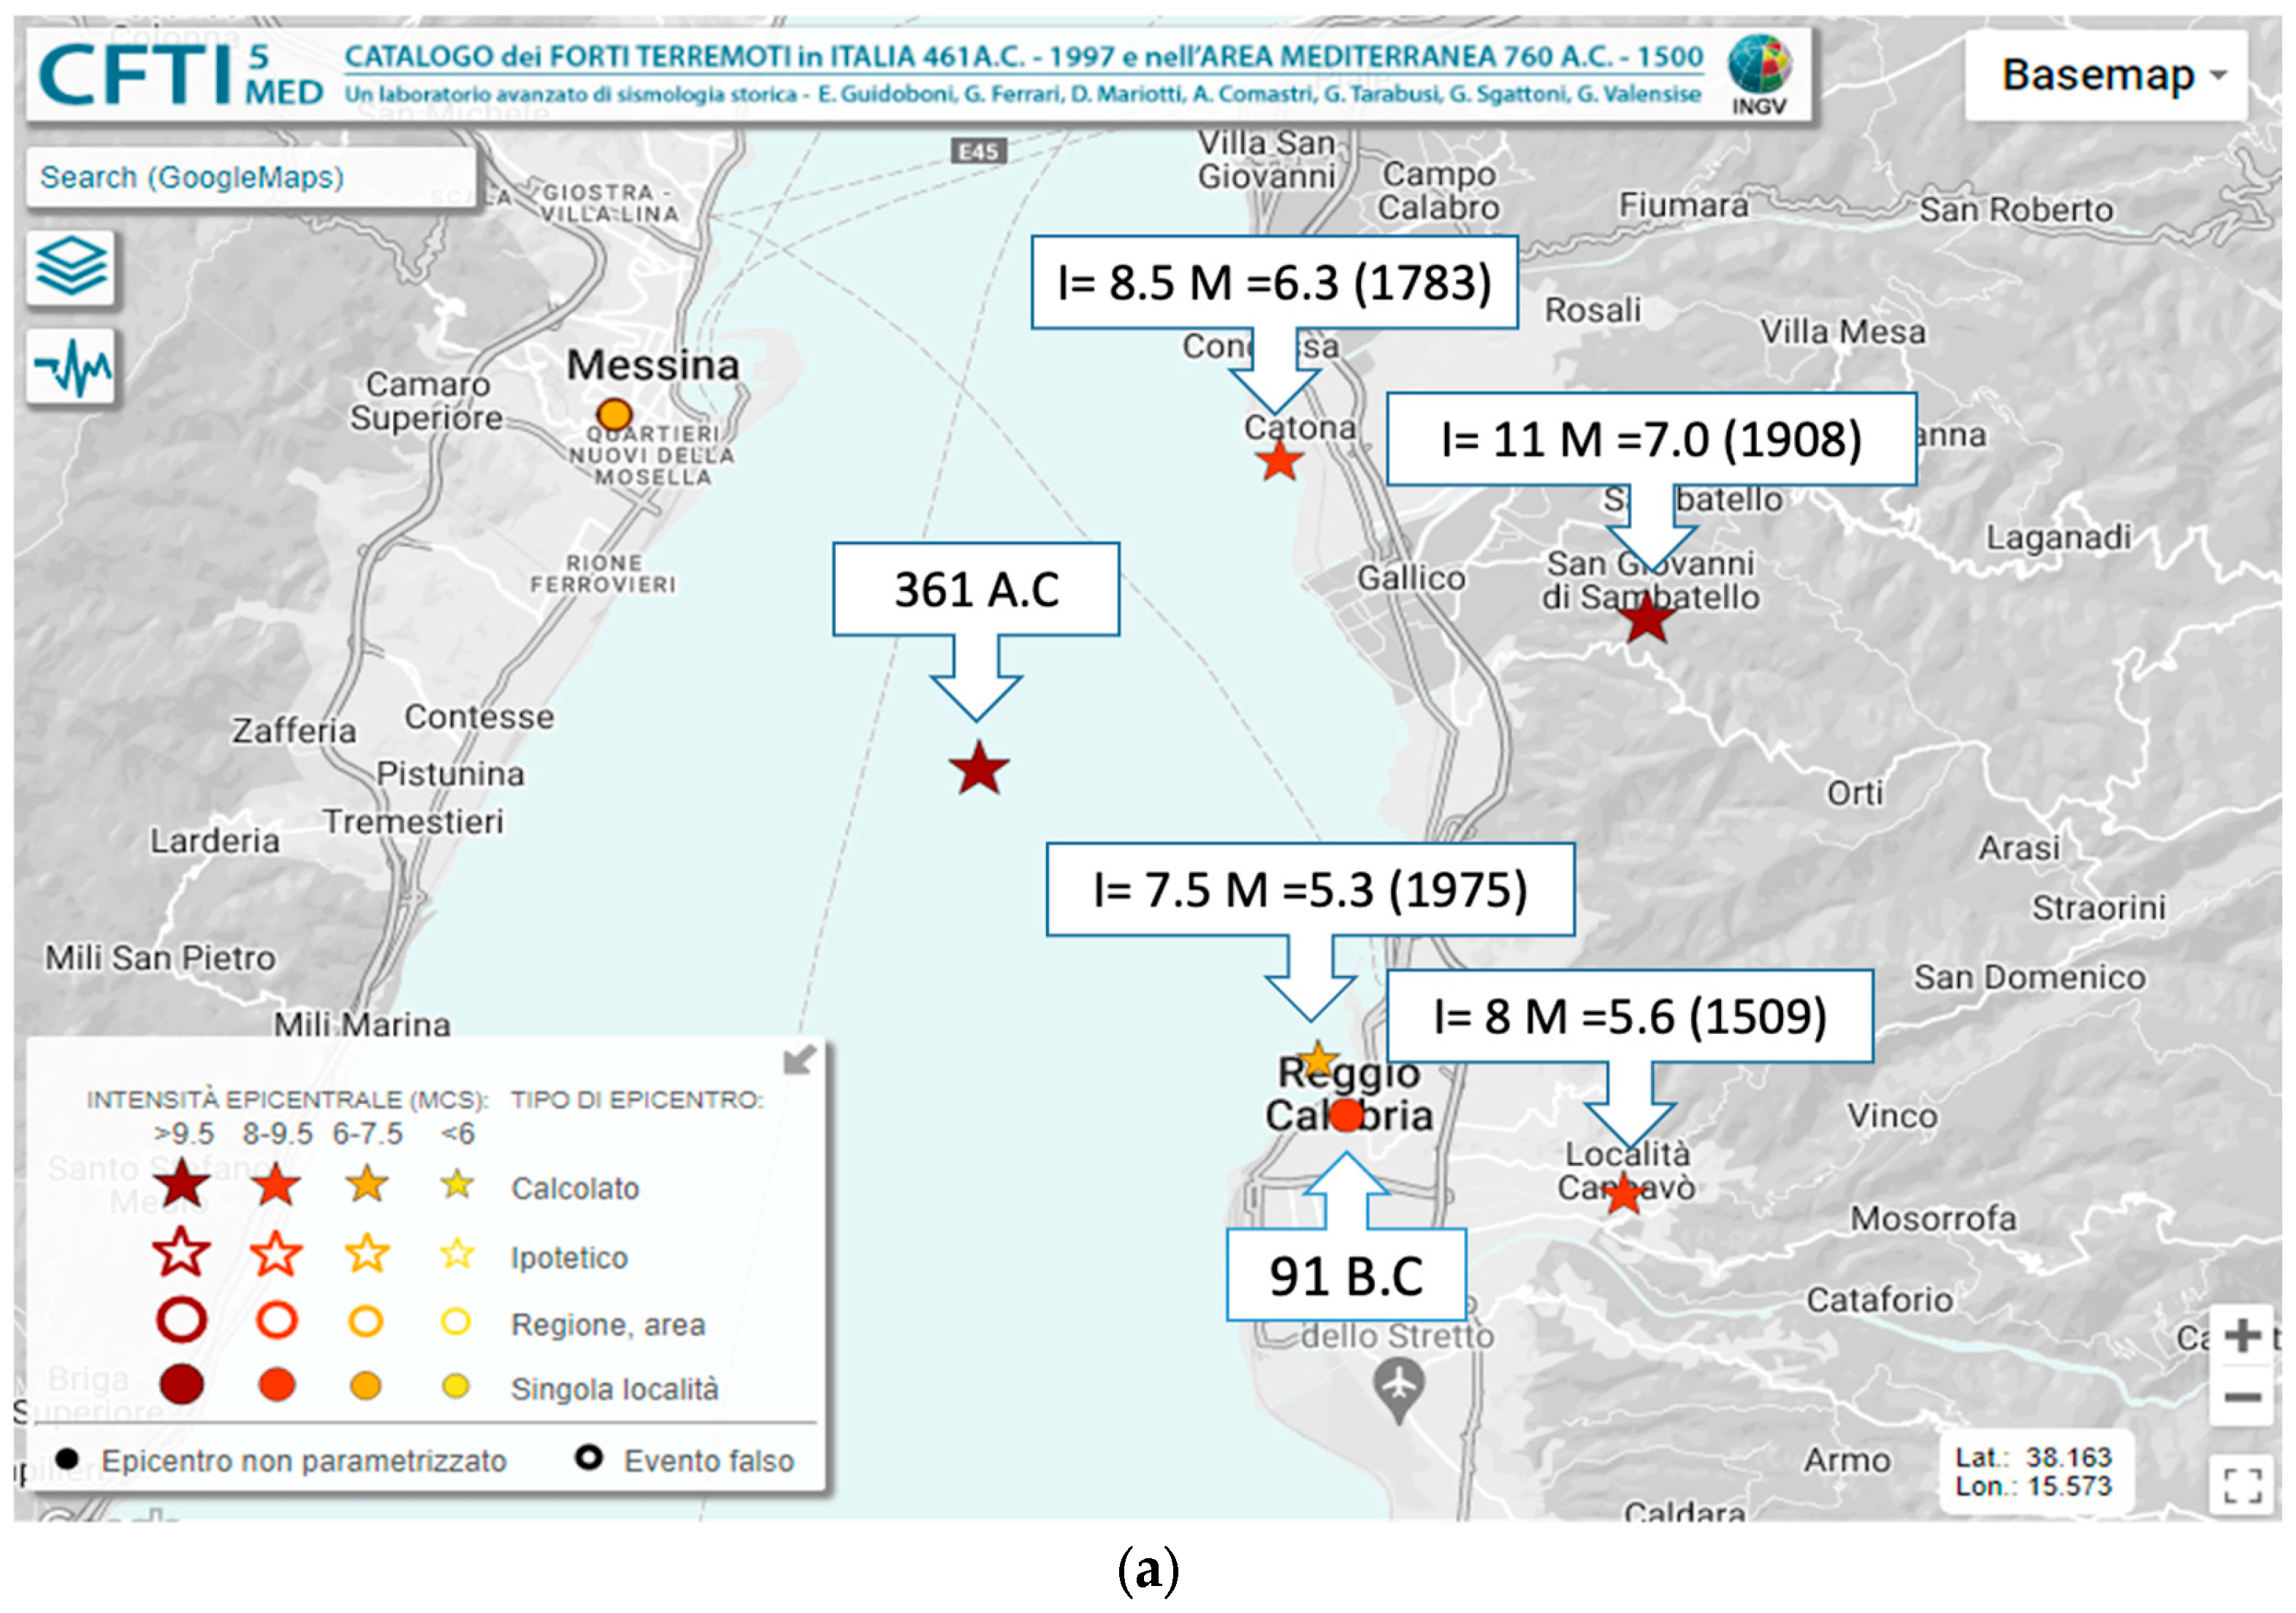
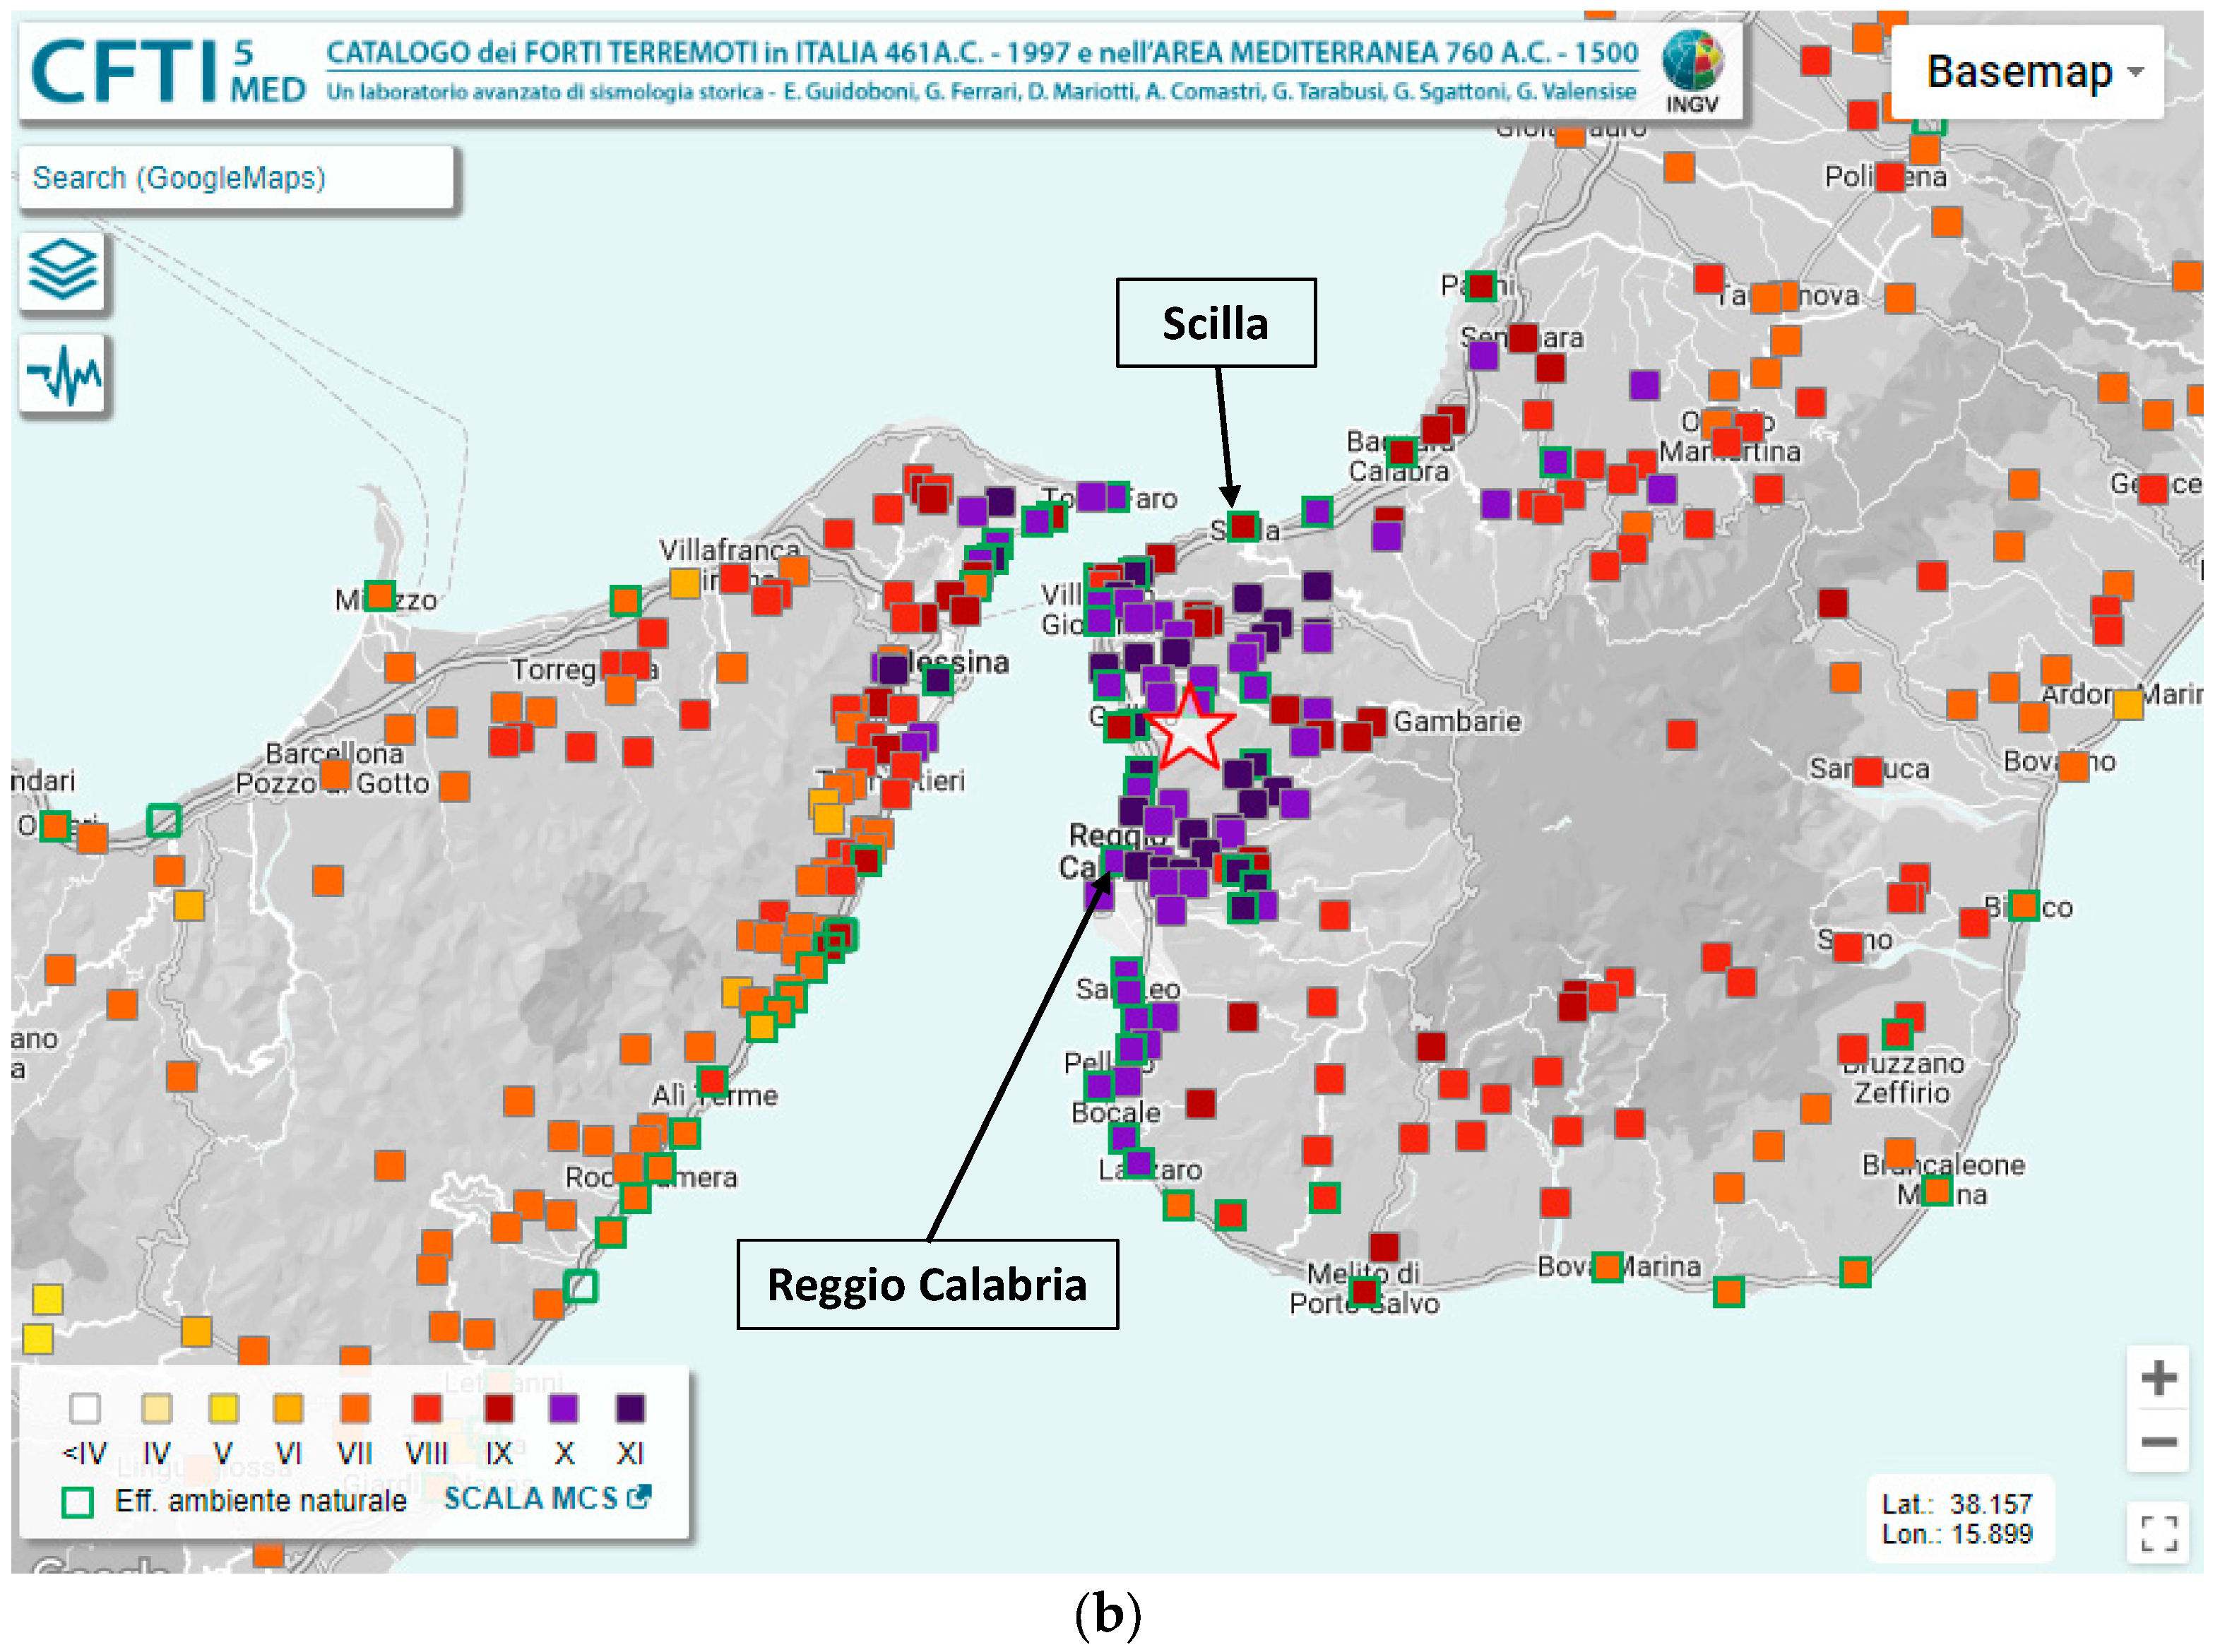
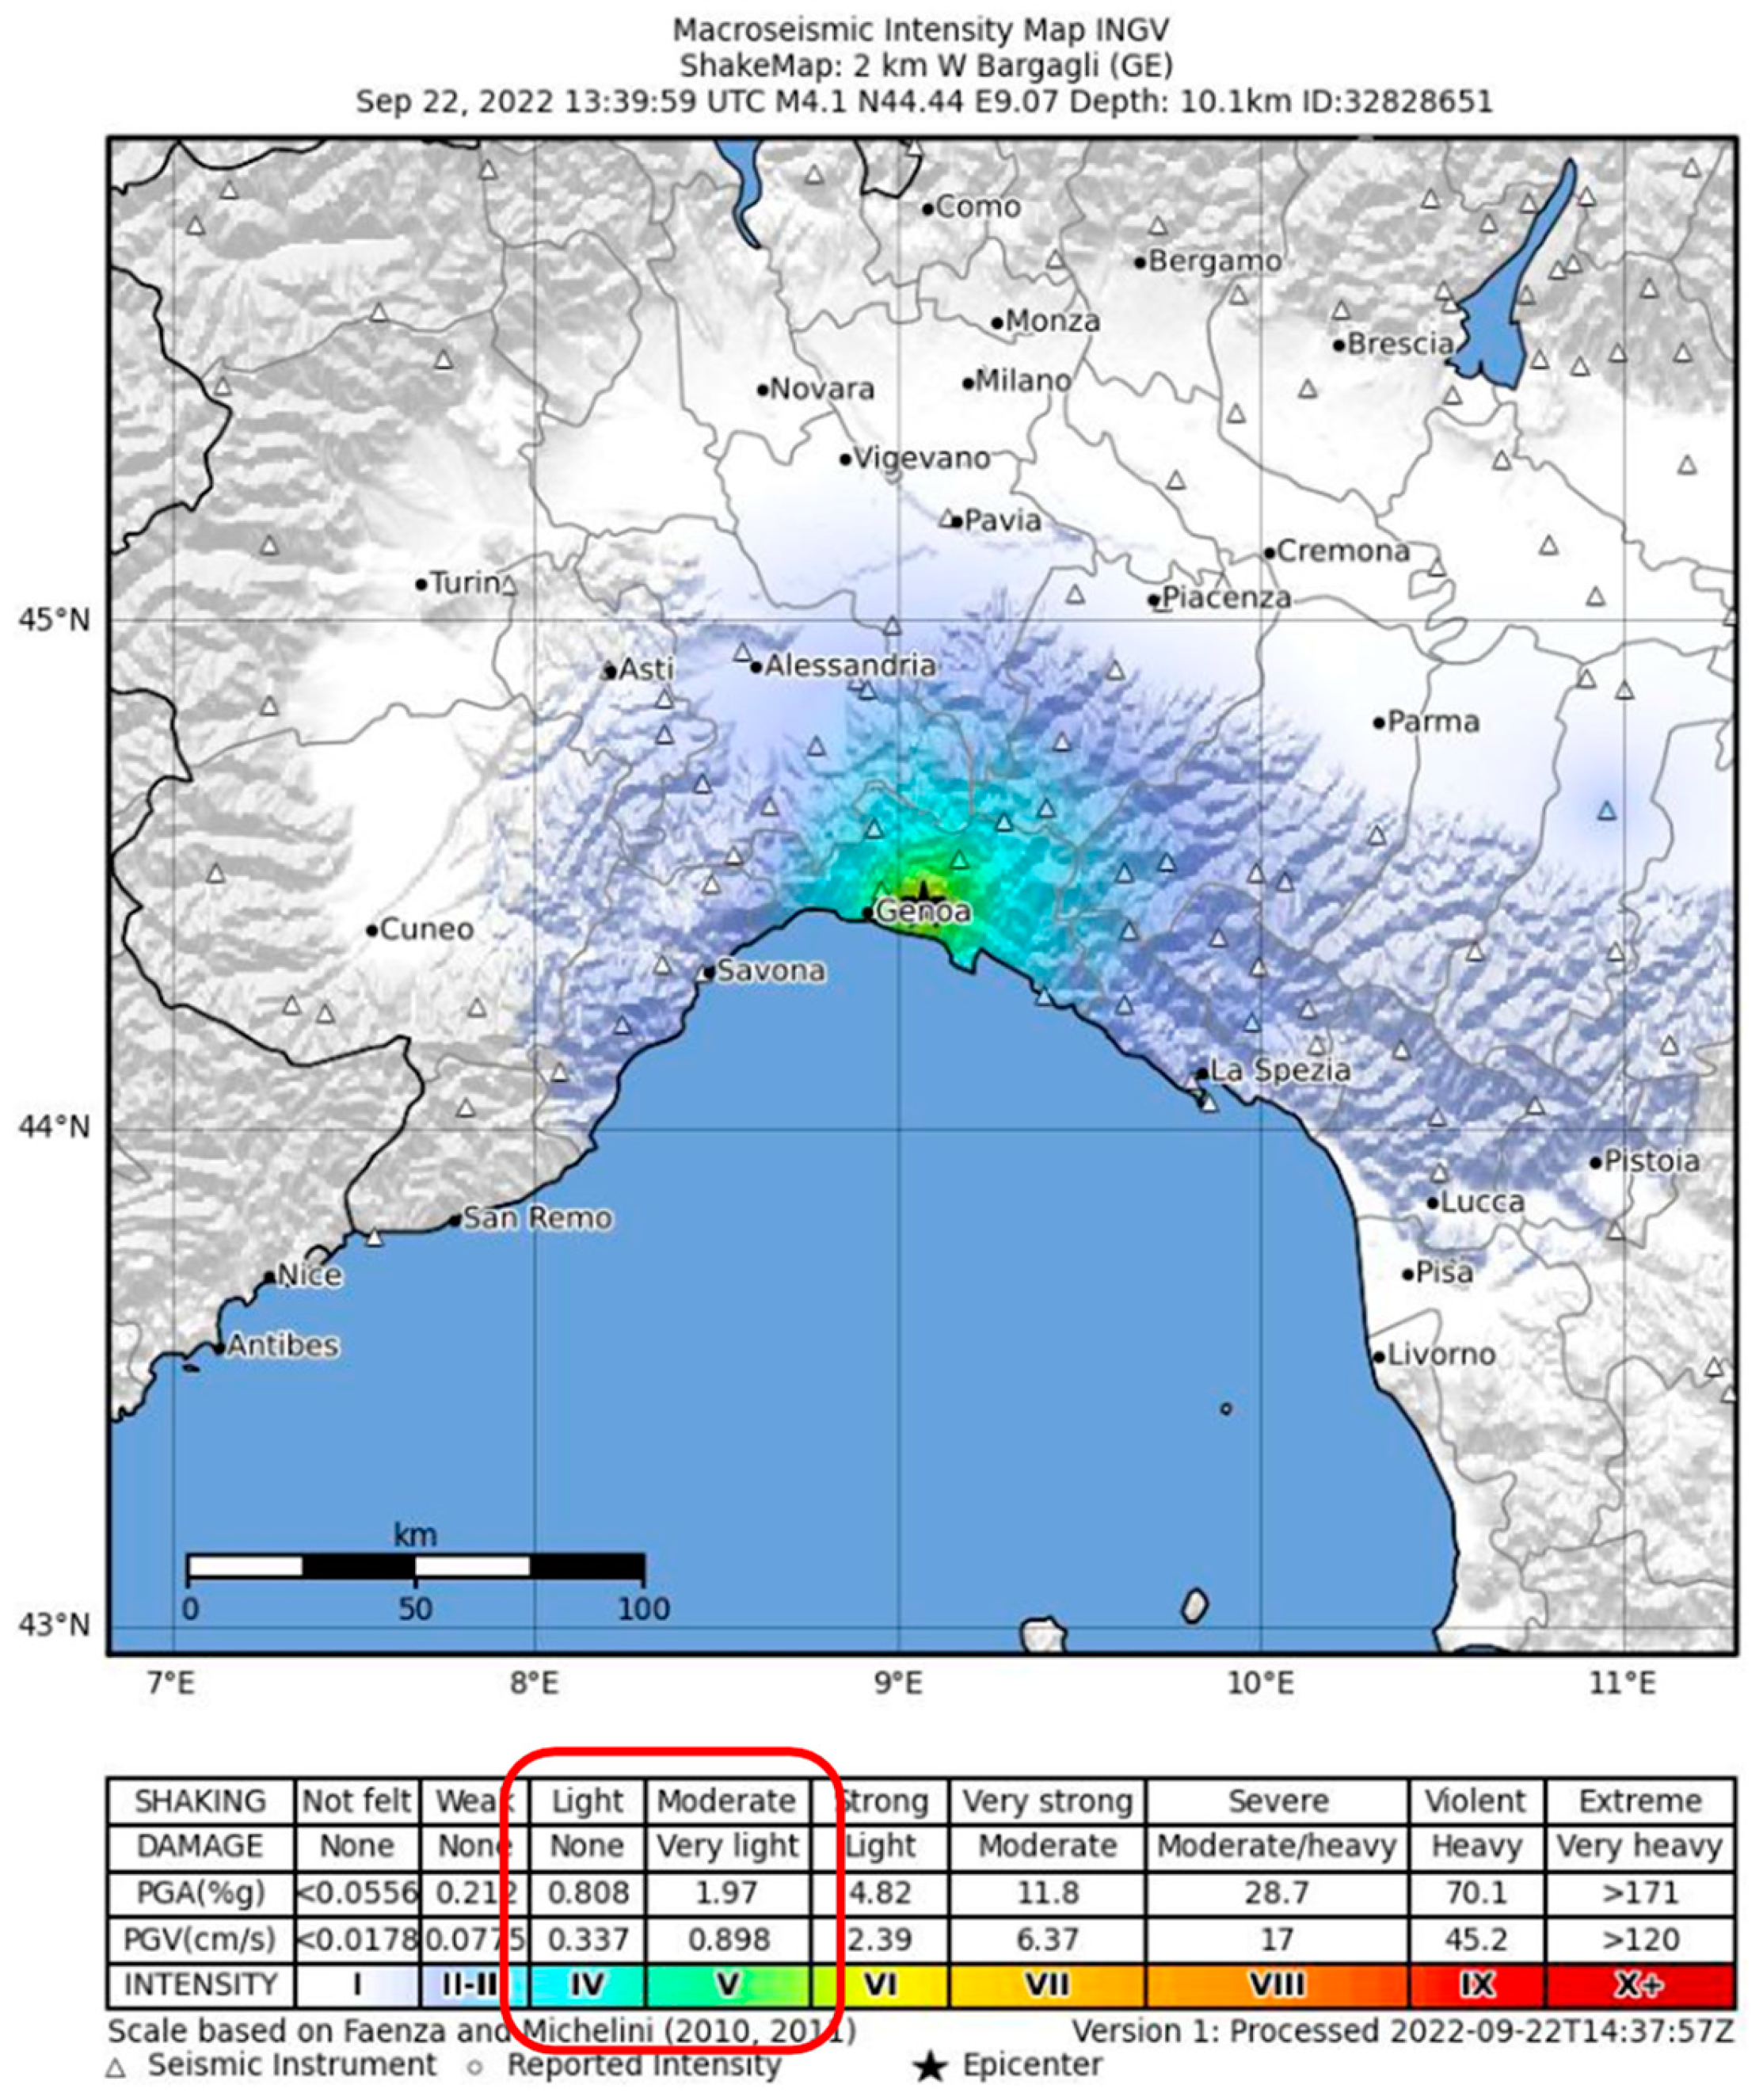
4.1. Case Studies Description

With the aim of validating the effectiveness of the digital crowd-sourcing approach for supporting structural safety evaluations at large scales, two different case studies have been analyzed:
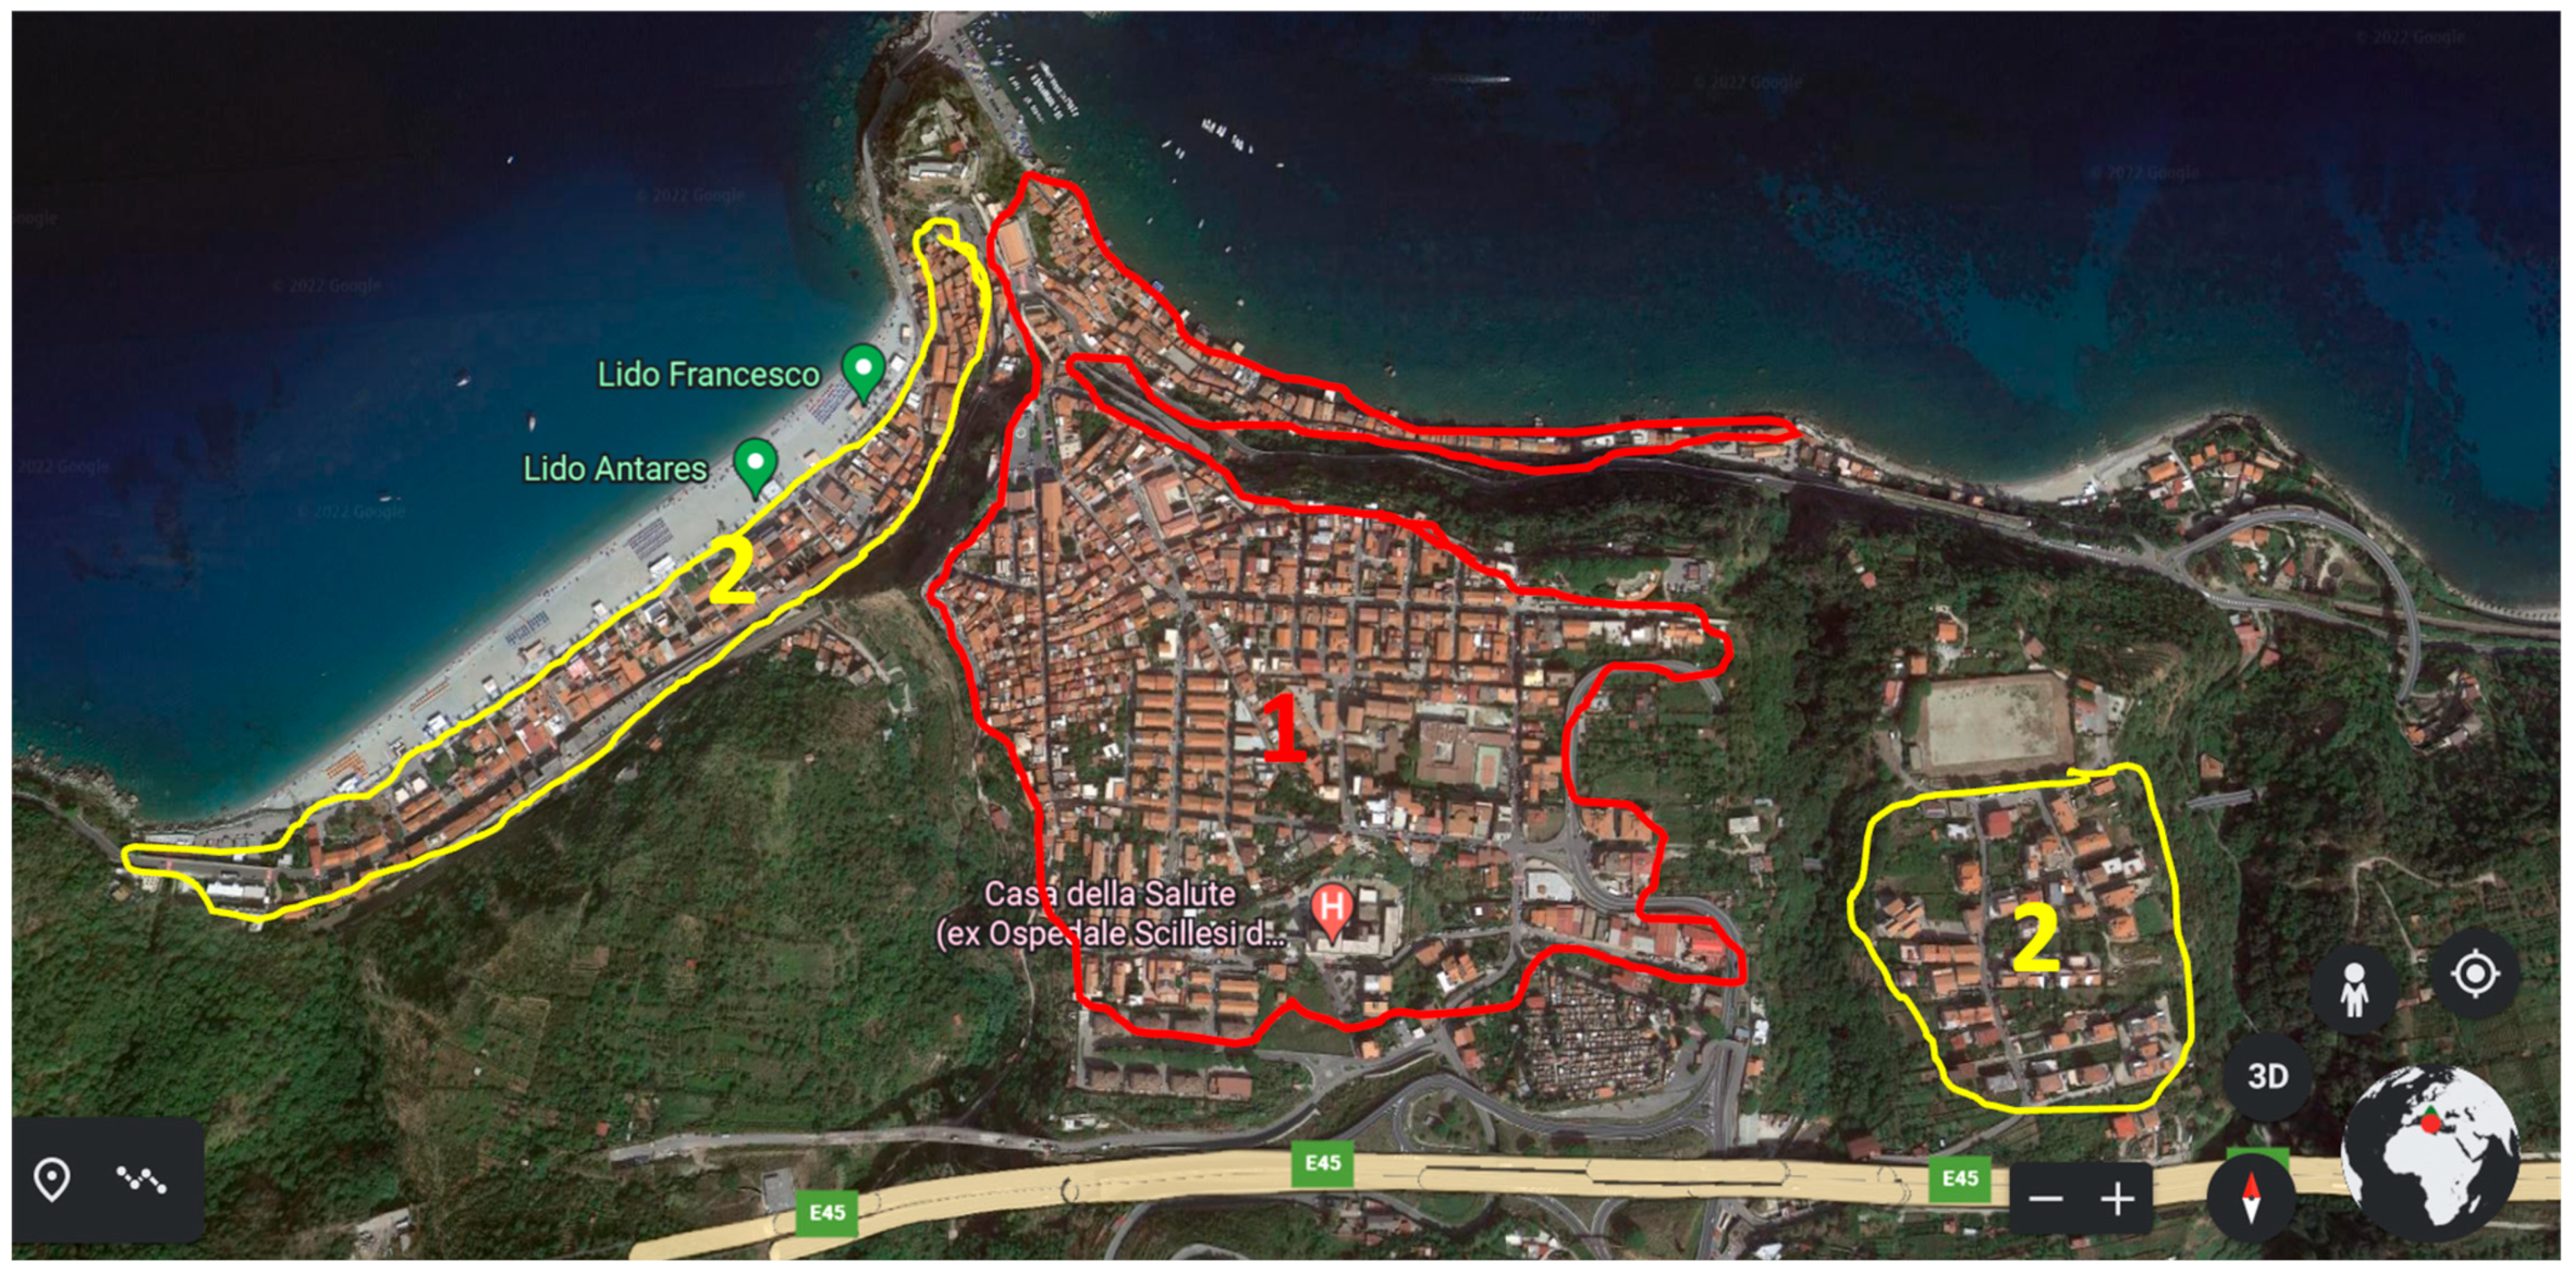
  • Scilla (Calabria Region, southern Italy);
  • Bargagli (Liguria Region, northern Italy).
These are two representative Italian minor centers due to their geographical position and relationship with the coast and are expected to be illustrative in the context of the research due to the significant scatter in terms of seismic hazard recognized in the area. Indeed, Scilla is located in the Calabria Region, in the area of the historical Messina earthquake (1908), which classified as a category one of seismic zone (i.e., the maximum value) in 1927 [36]; conversely, Bargagli is located in an area exposed to a moderate-to-low seismic risk, classified as category three according to the National seismic regulations in 2003 [37].
The following section reports the main features of the buildings belonging to the selected urban areas, which were surveyed and remotely assessed by means of visual web-mapping tools. A database of the processed buildings has been collected and a rational clustering of the different structures has been carried out in order to identify a set of classes compliant with the features considered in the selected fragility formulation. Then, as performed in other applications based on field survey procedures, digital data have been reviewed to quantify the weight of each class in the selected area and to move from the class fragility curve to the ‘urban’ one associated with the urban sector of interest.

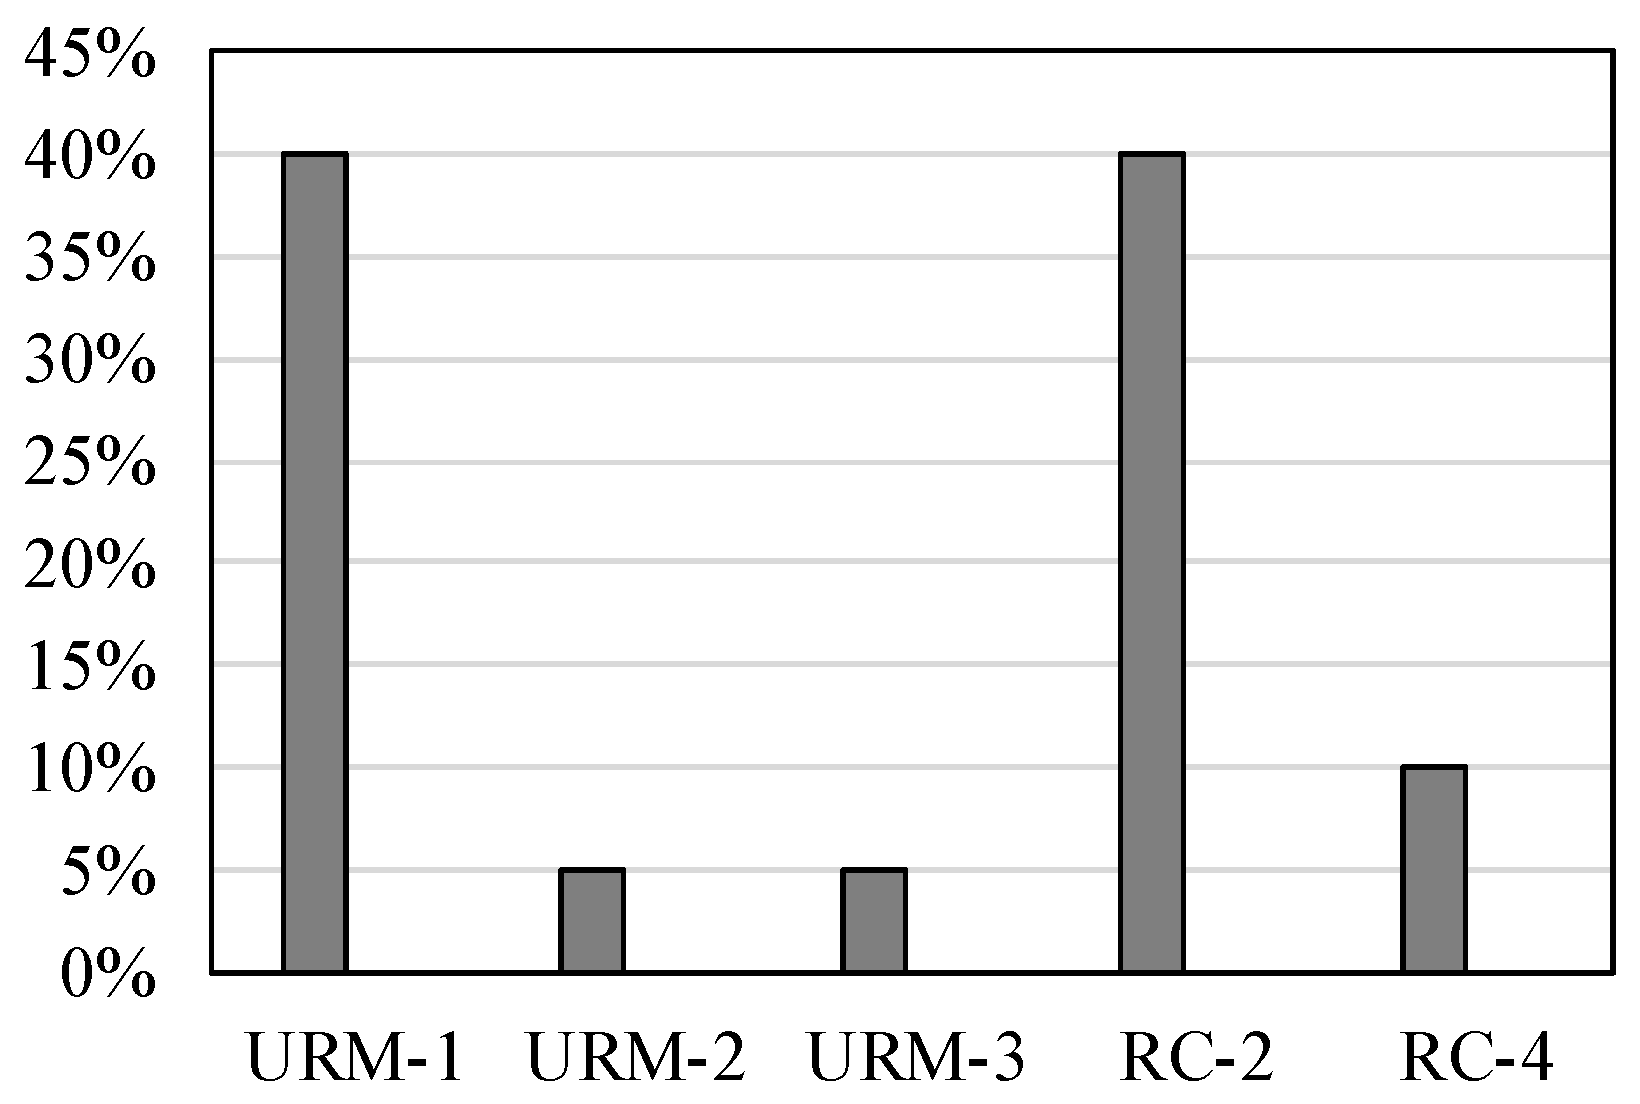
4.2. Structural-Typological Classes of Reference

The structural-typological building classes provided in [34] for URM and in [35] for RC buildings have been used in this work. As mentioned above, analogously to the assessment procedures based on in situ surveys, a number of reference building classes are required, and the corresponding set of relevant parameters must be collected [11]. A careful analysis of the background literature (see Table 2) shows that the fragility formulations reported in [34,35] offer a balance between the need for detailed knowledge of the structures and global information on them. Therefore, the above-mentioned fragility functions have been considered herein without any loss of generality; moreover, as an extended review of the performance of existing fragility formulations, such a consideration is out of the scope of this work in the context of digital crowd-based survey application.
The dominant behaviors characterizing the building classes detected for the abovementioned case studies (and discussed in the following Section) are briefly described in Table 3, alongside indications of the corresponding typological fragility curves. Further details concerning the values of median μ and standard deviation β for each typological class are available in the referenced papers. These fragility curves are corresponded to a single damage state, DS4, which corresponds to the realization of the ULS by the structure, which is assumed as the Engineering Demand Parameter herein.
The curves have been obtained via the two-parameter lognormal cumulative density function (CDF) post-processing results of conventional numerical analyses performed on building prototypes. It is worth noting that the curves refer to rigid soil (soil-type A according to International [38] and National [39] codes), which is outside the scope of the current phase of research concerning geological and geotechnical aspects. This is not a relevant limitation of the results, since, as mentioned above, only the feasibility and the efficacy of a virtual survey with respect to determining the seismic vulnerability of buildings are assessed herein.

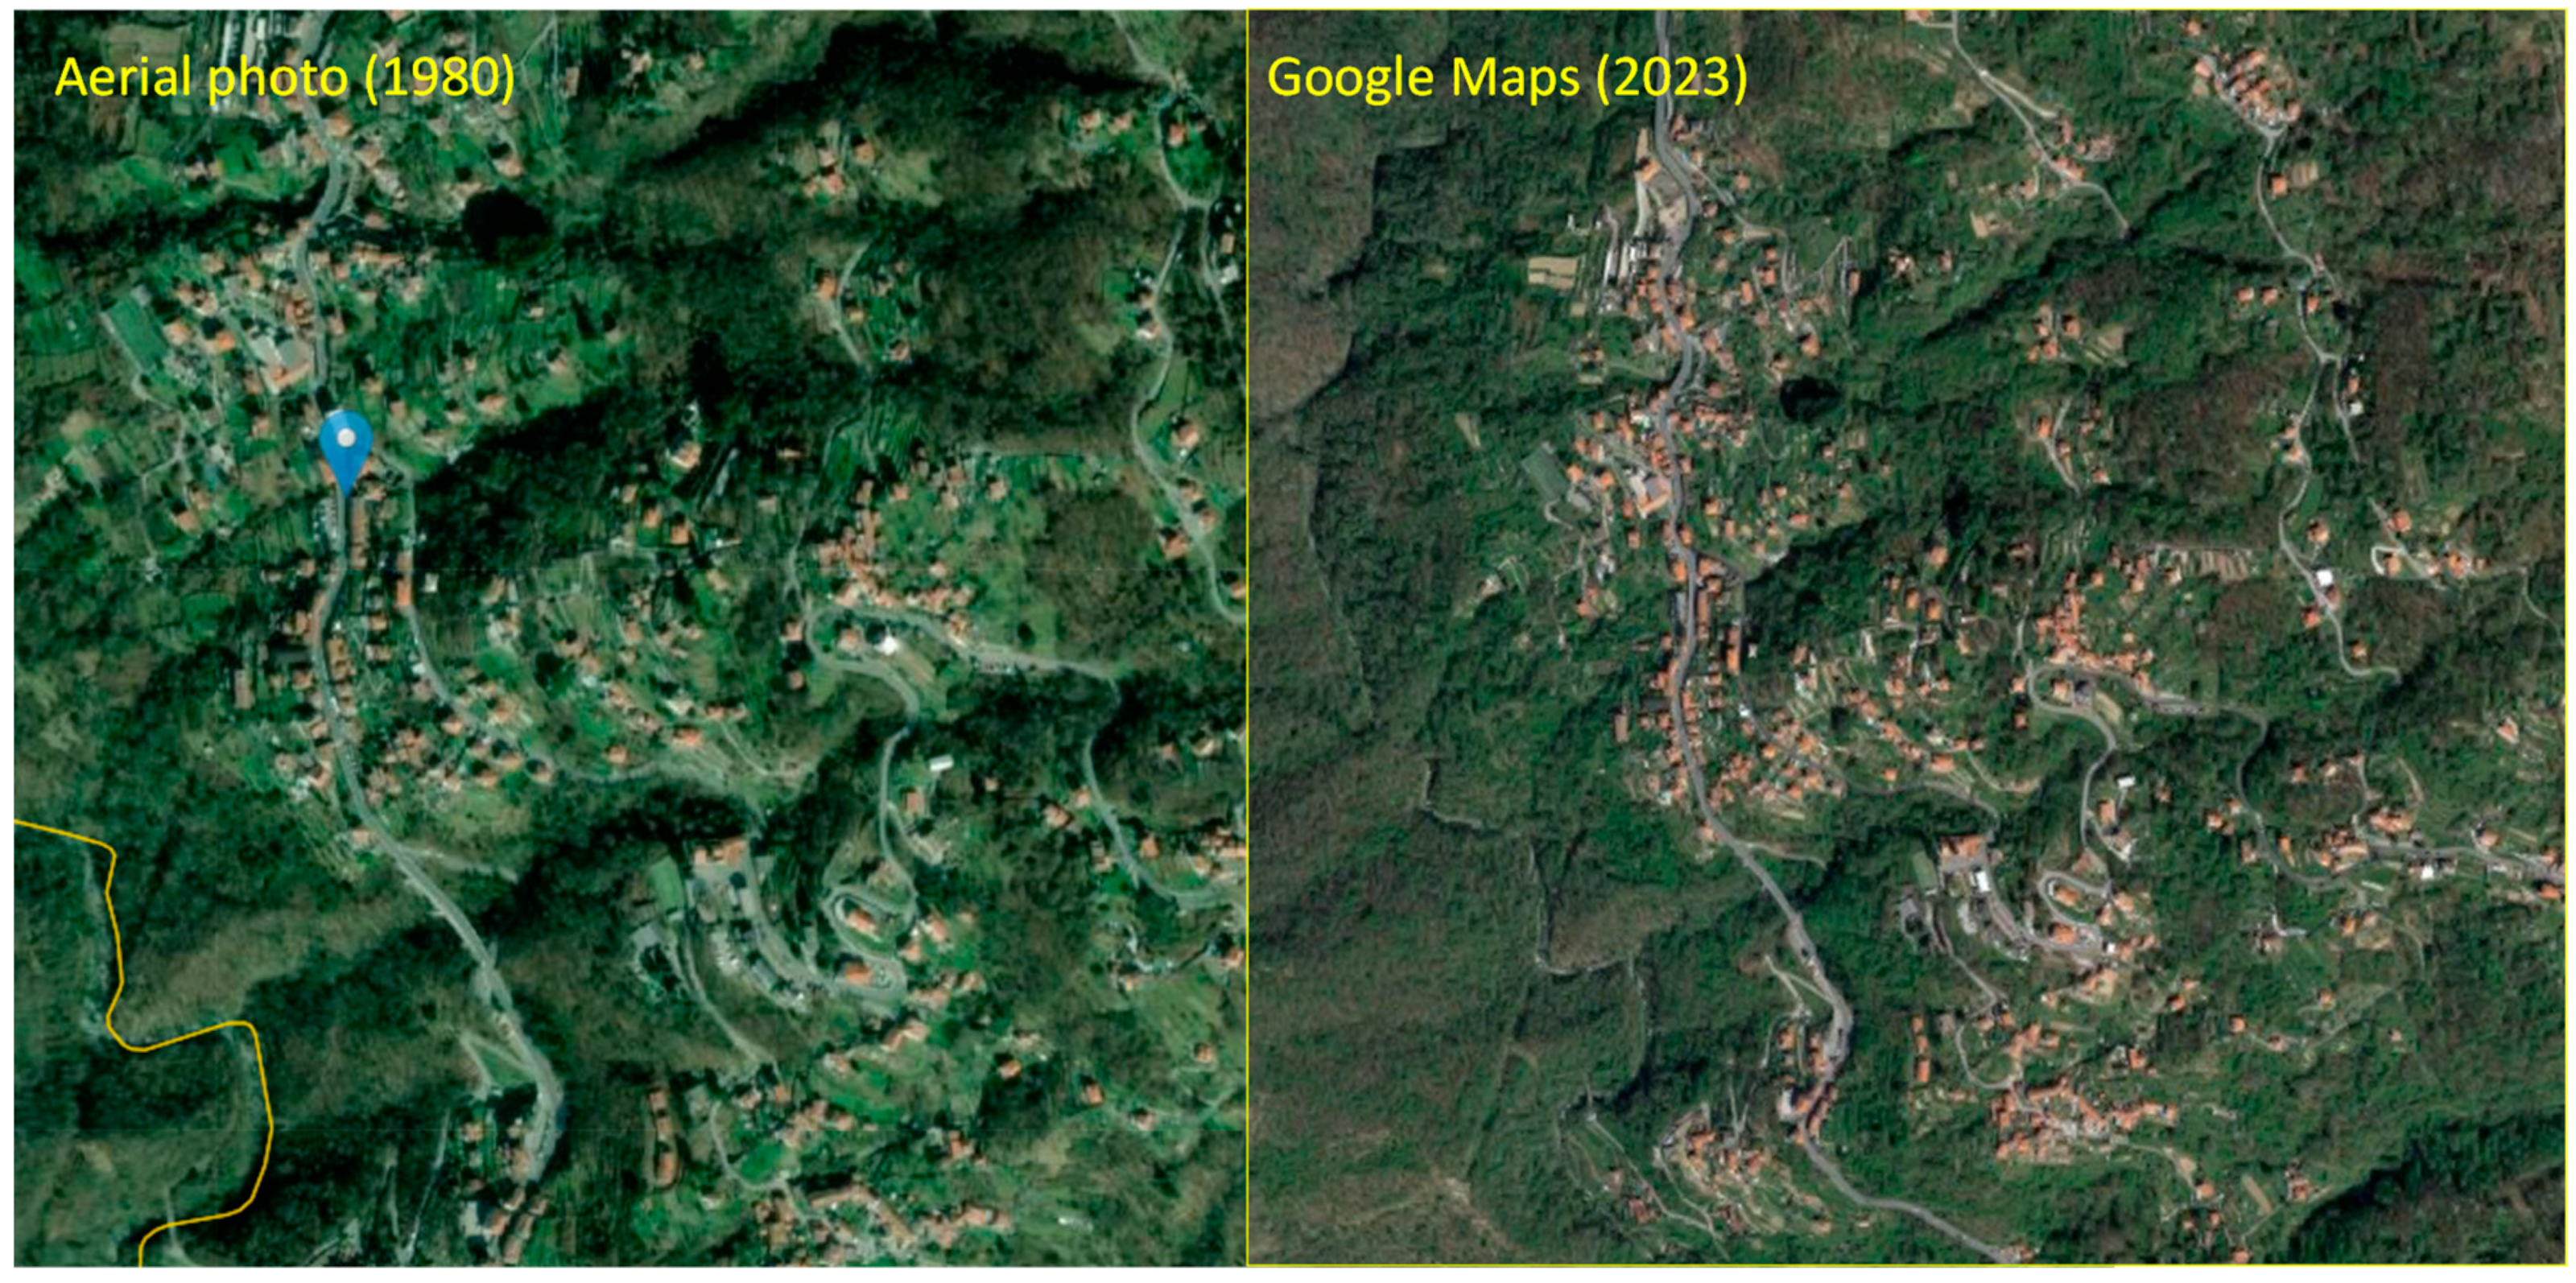
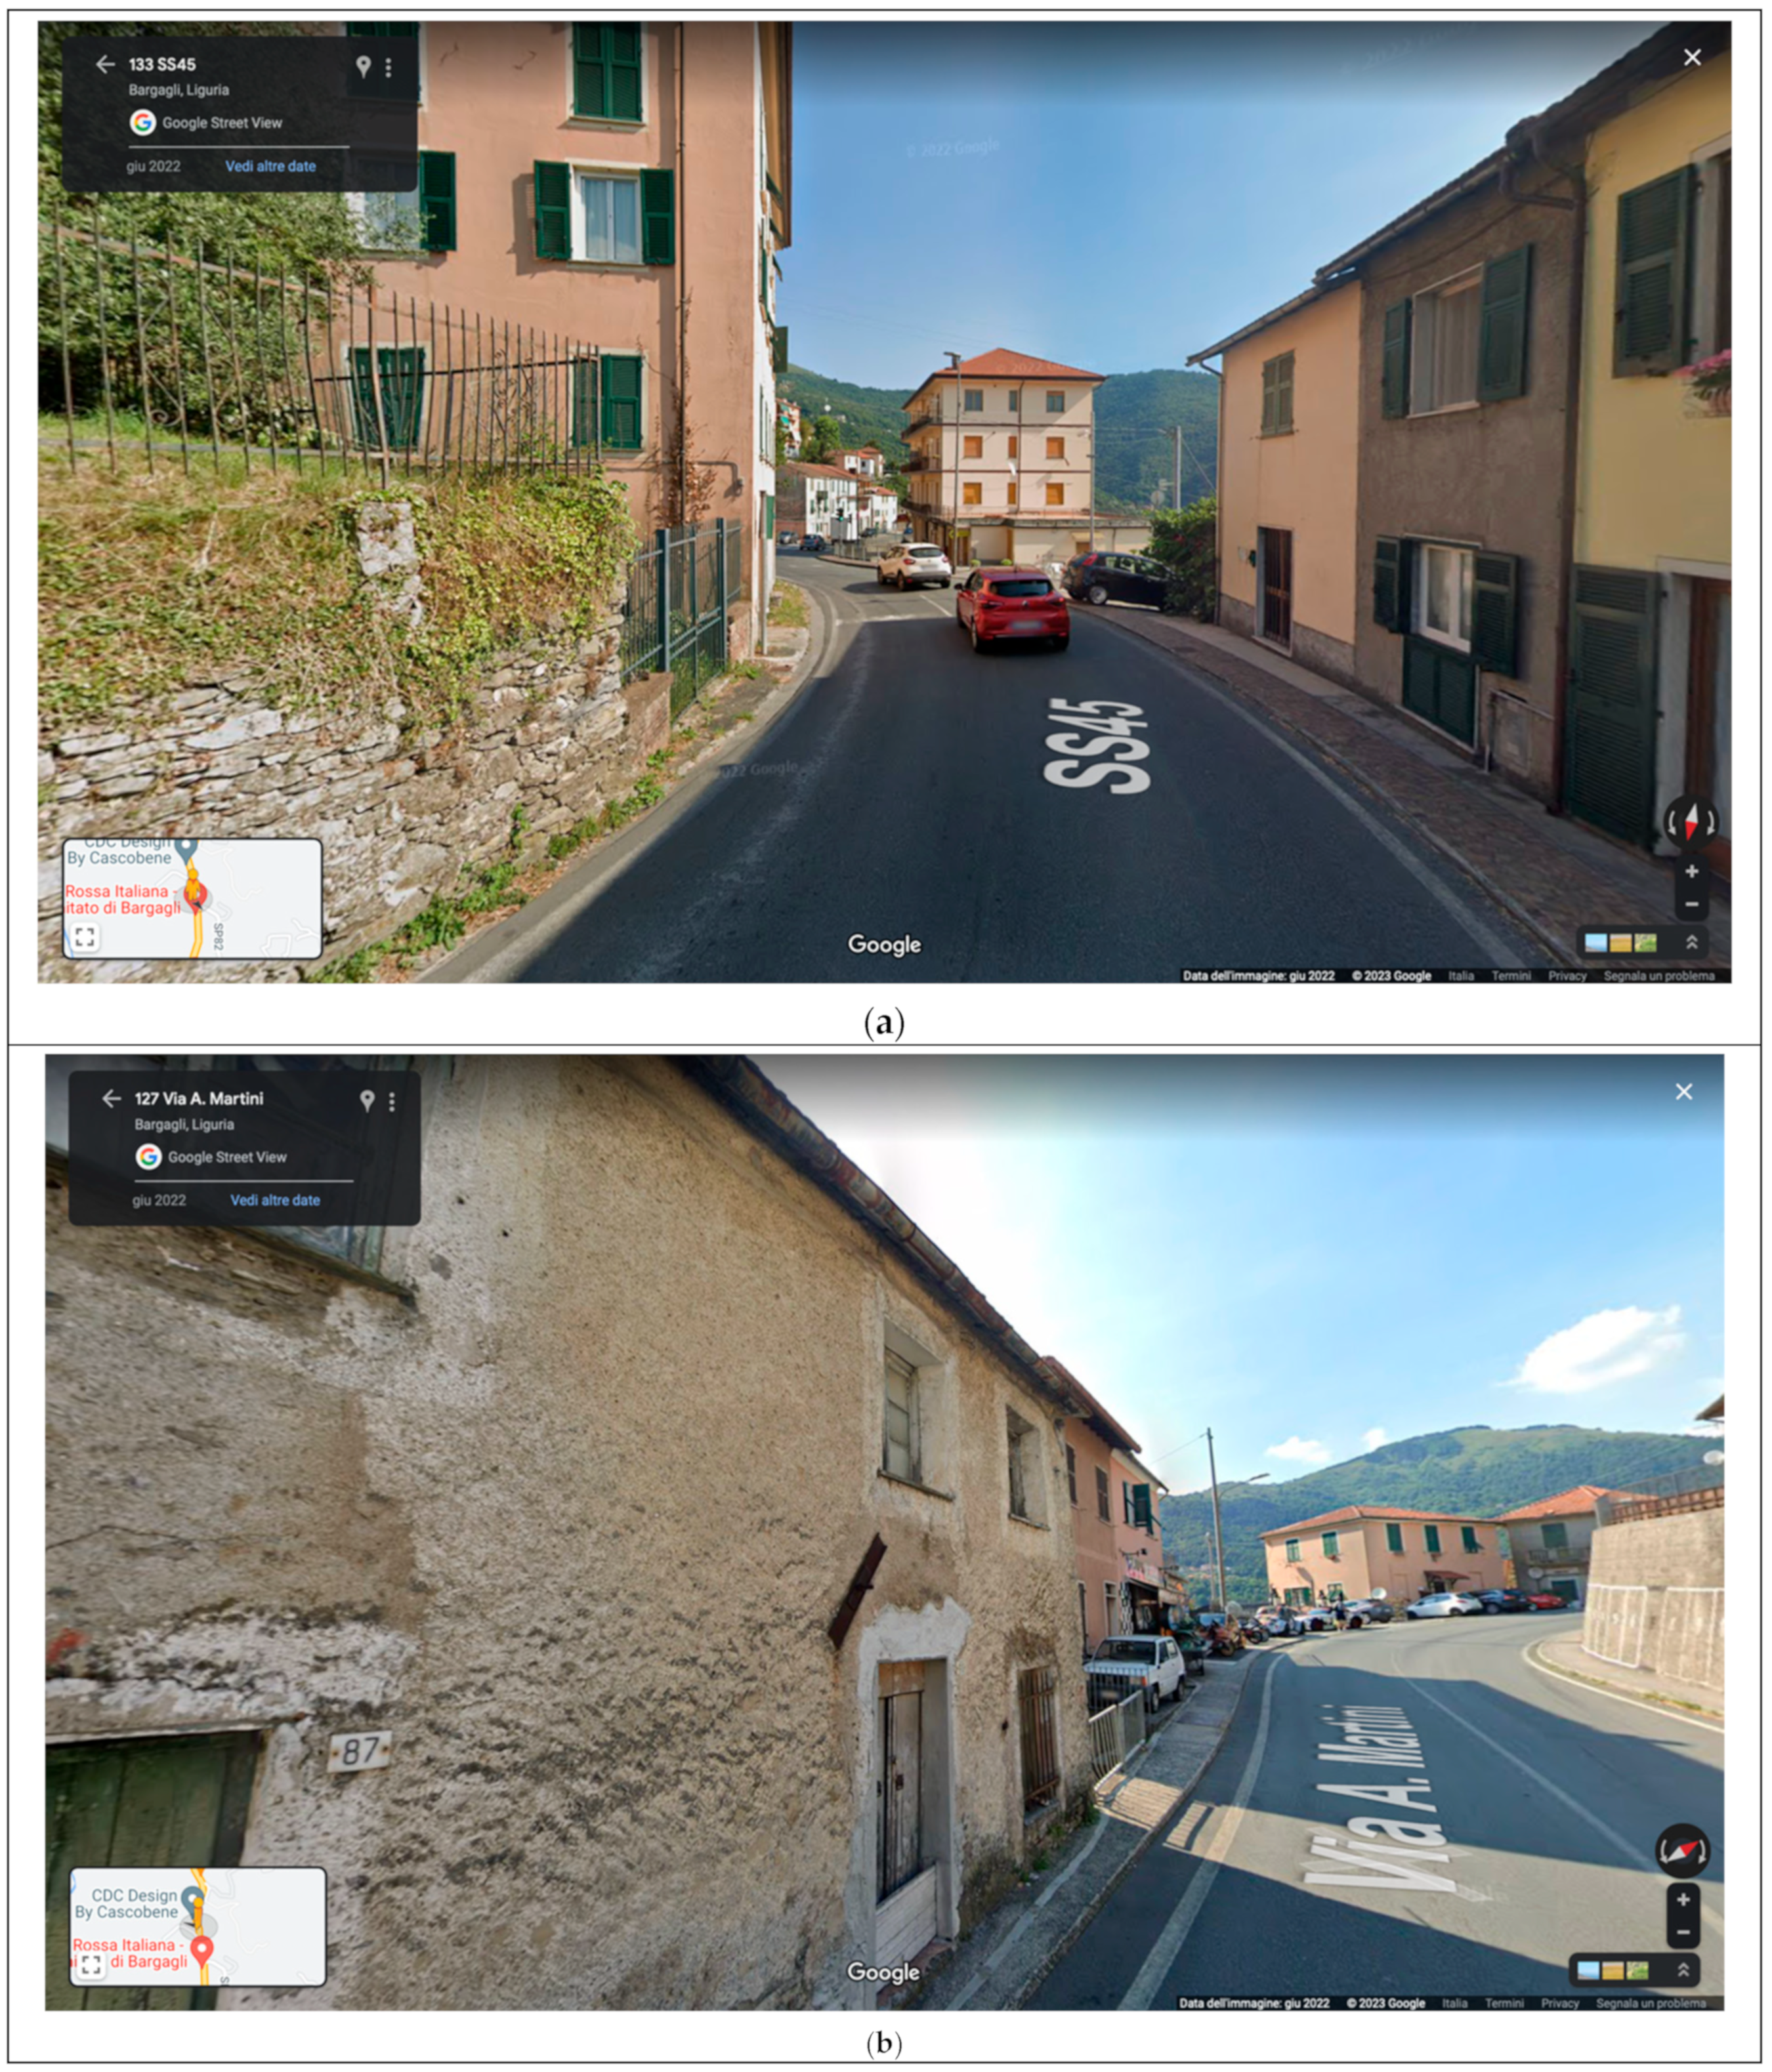
4.3. Building Inventory Based on Web-Mapping and Remote-Sensing Platforms
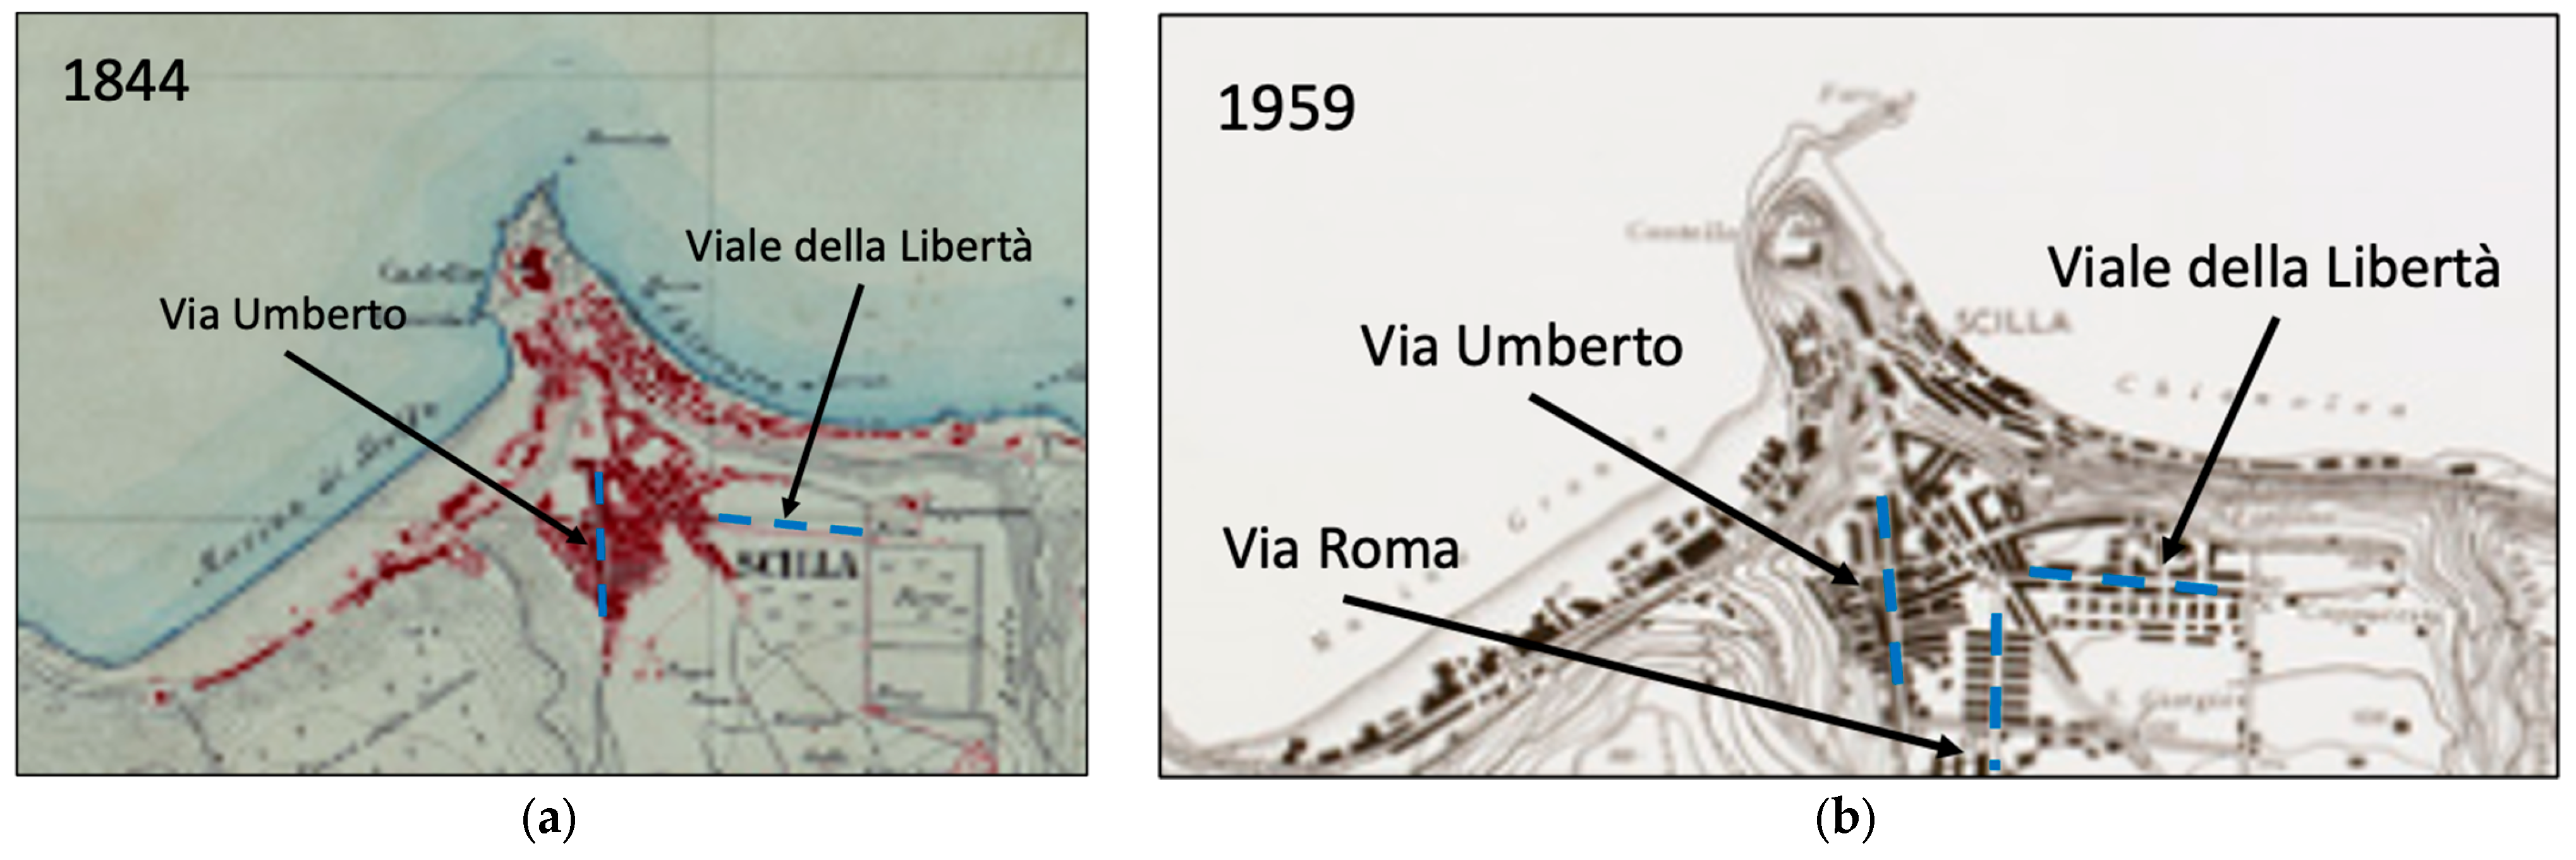
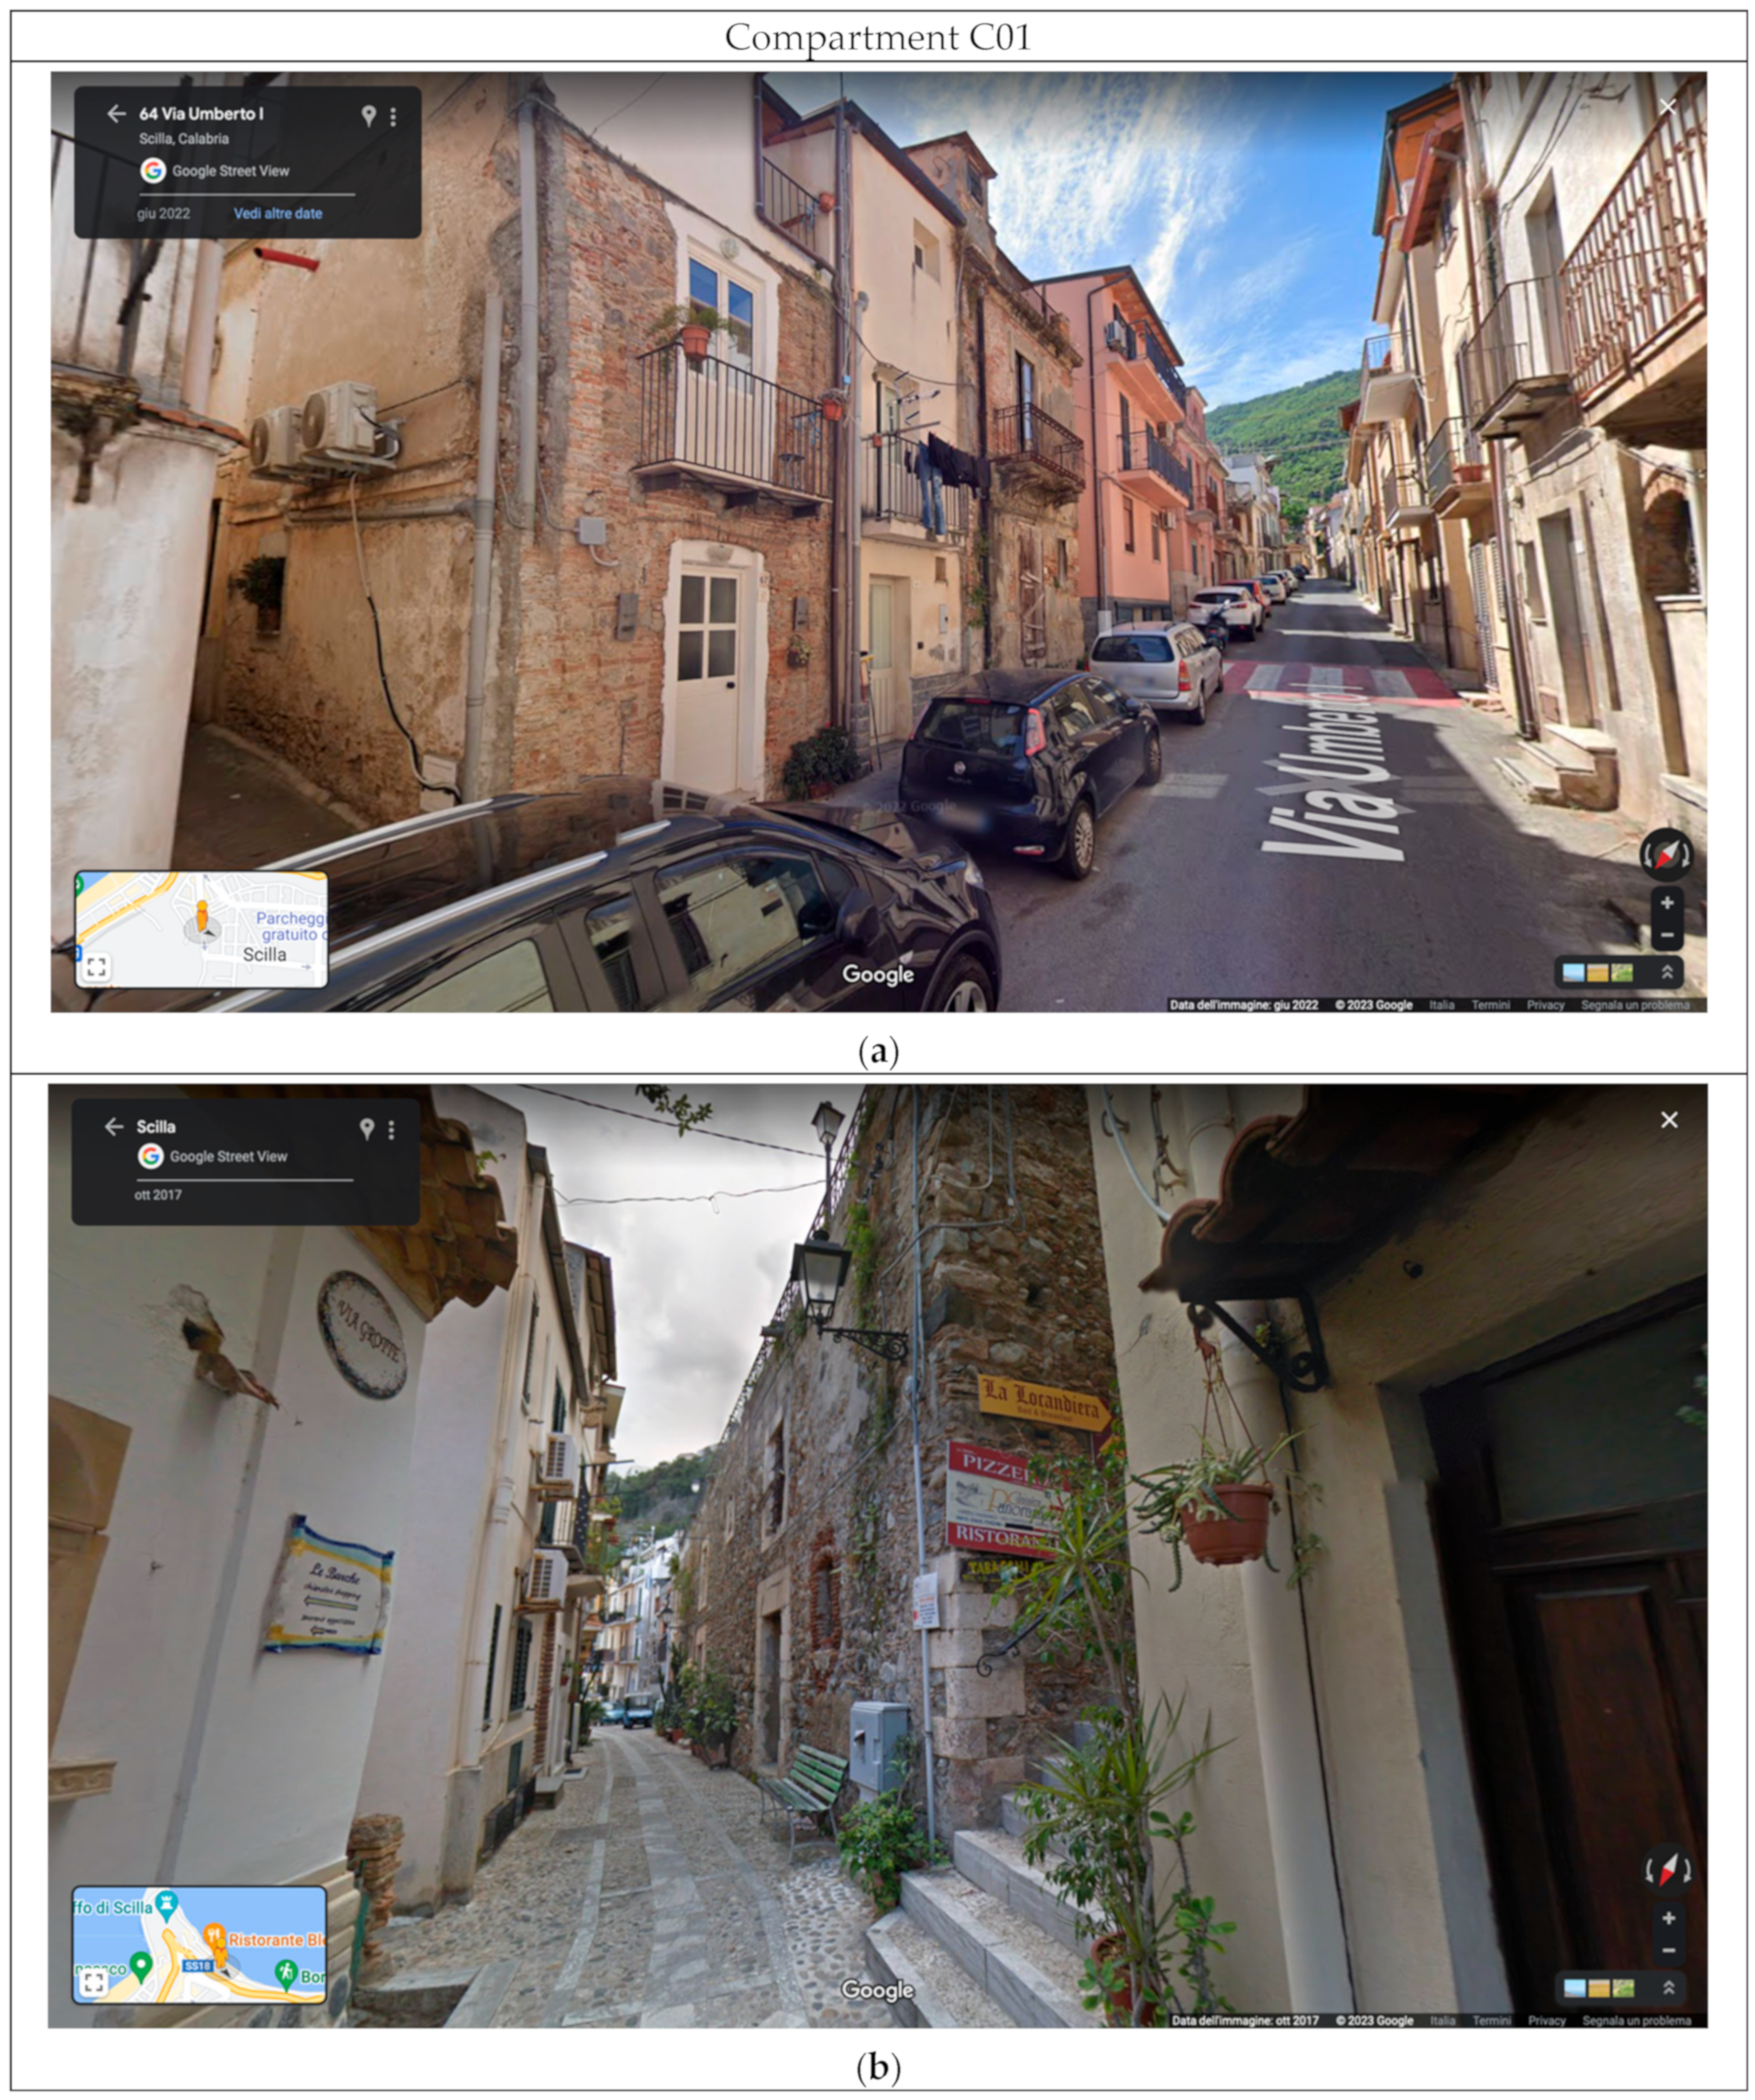
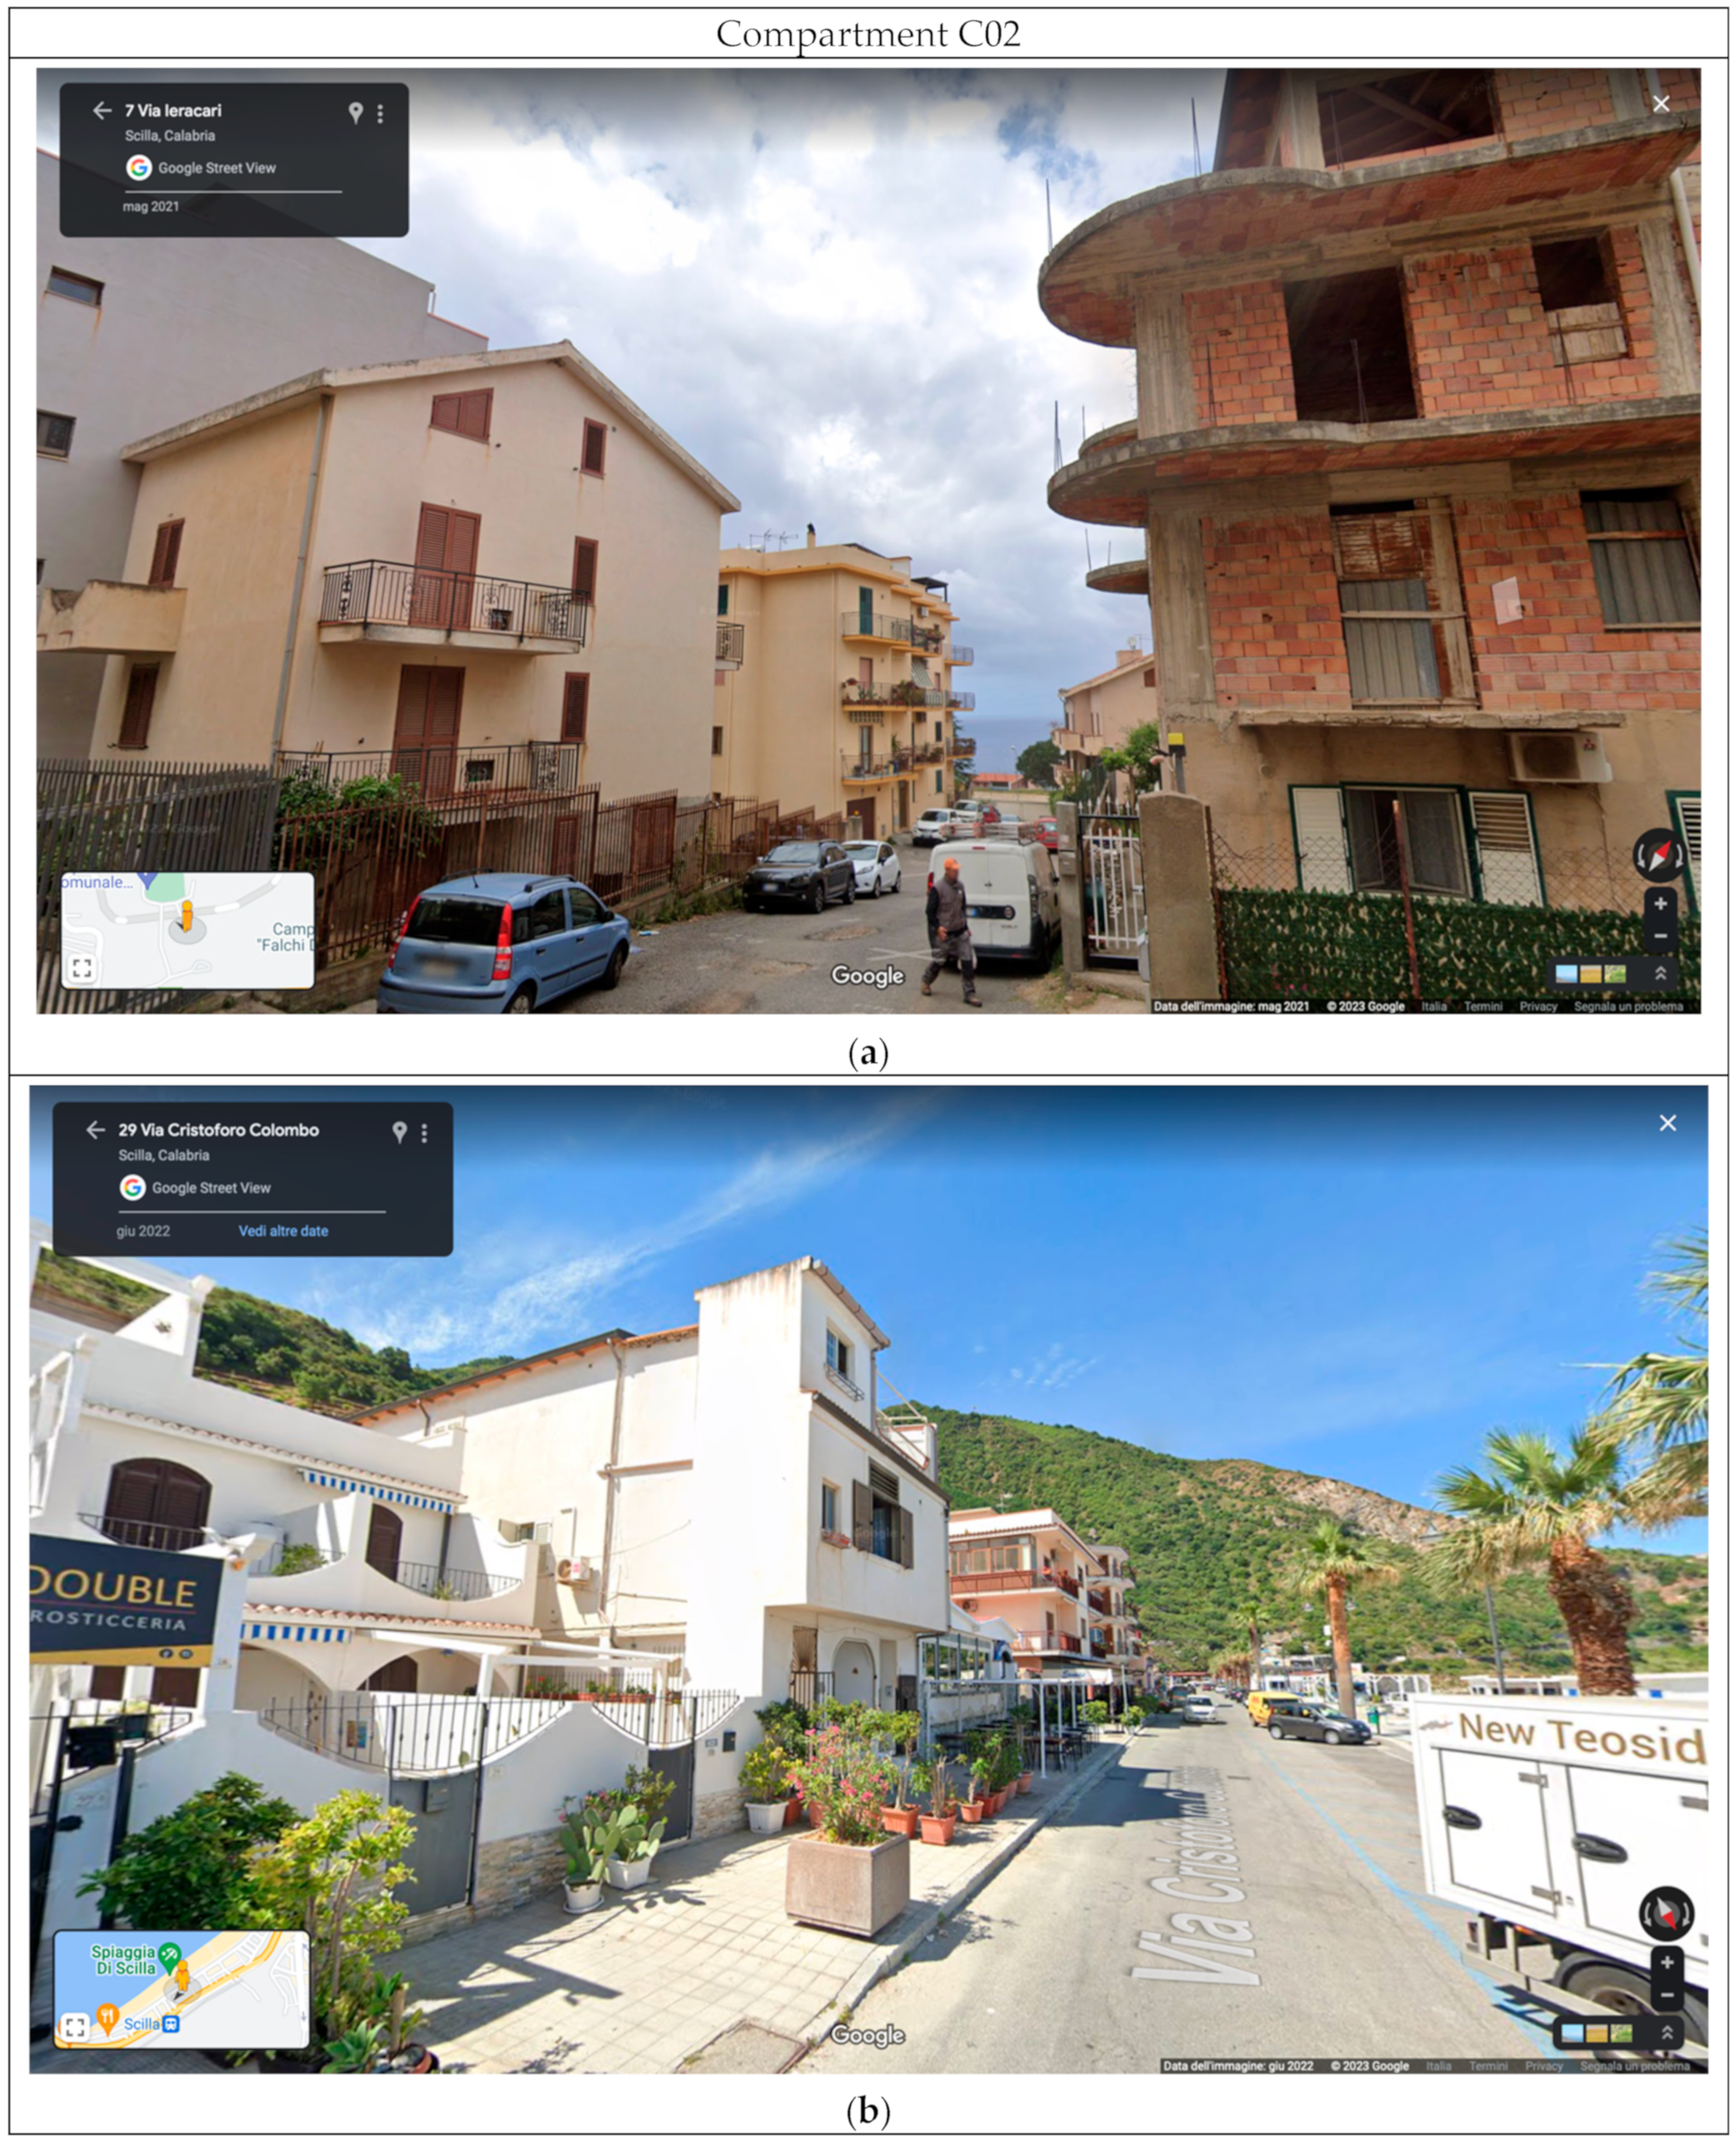
4.3.1. Scilla

Scilla is a small, coastal city center with about 4000 inhabitants located in the province of Reggio Calabria beside the Tyrrhenian Sea. The area of Reggio Calabria is a seismically active zone that has been plagued by high-intensity earthquakes over the centuries, which are often devastating in terms of monetary and human losses.
The maps in Figure 2, which were made available by the Italian Catalogue of Strong Earthquakes (ICSE), indicate the epicenters of the most severe earthquakes that occurred in the province of Reggio Calabria. The ICSE is a databank provided by the INGV that contains shaking maps of historical Italian earthquakes that have occurred since 416 B.C. in Italy and since 760 B.C. in the whole Mediterranean area.
Figure 2a depicts the degree of ground shaking relative to the Mw = 7.10 1908 Messina and Reggio Calabria earthquake, representing one of the most severe seismic events to hit Italy in the last century. This earthquake was catalogued as an extreme/violent earthquake according to the Mercalli-Cancani-Sieberg (MCS) scale and was characterized by a macroseismic intensity of IMCS = 10~11 at the epicenter. Due to the attenuation of the ground motion, an intensity IMCS = 9.0 has been estimated for the municipality of Scilla. In the epicentral area of Reggio Calabria, almost 80% of the buildings were highly damaged or collapsed because they were composed of poorly detailed masonry designed without seismic provisions.
The building features in Scilla have been identified using a web-based crowd-sourcing approach. Through the IGM website, historical maps of Scilla were extracted and analyzed in chronological order. Two of these maps, corresponding to the years 1884 and 1959, are represented in Figure 3a,b, respectively; these historical maps enabled the reconstruction of the urban evolution of Scilla over the years, for which new expansion areas, new construction, the number of buildings, etc., could be identified. In detail, the map in Figure 3b represents an interesting view of the urban development of Scilla as a consequence of the post-1908 reconstruction process.
In Figure 4, a Google Maps view of Scilla in 2023, with the indication of the perimeter of two urban compartments identified as reference areas in order to elaborate the seismic fragility analyses, is reported. The compartment C01 represents the old historical core of Scilla composed of two/three-floor URM buildings. The compartment C02 includes part of the old historic core again—consisting of historical URM buildings—and part of the expansion area developed during the 1908 post-earthquake reconstruction period, including both ‘modern’ masonry (i.e., URM-3) and RC buildings (RC-4). Note that the term ‘modern’ does not refer to the architectonical features of the buildings, but indicates buildings conforming to seismic provisions.
In Figure 5 and Figure 6, photos of the building types derived via a Google Maps-based virtual street tour of Scilla are represented, corresponding to the Compartments C01 and C02, respectively. Web mapping allowed for (i) the identification of the main structural and typological features and vulnerability elements of the buildings in the two urban compartments and (ii) the definition of the percentage of buildings belonging to one of the building classes defined in Table 3. Note that in Figure 5 and Figure 6, the links connecting directly with Google Maps have been included, providing a complete vision of the building features.
In Figure 7, a histogram indicating the percentages of existing masonry and RC buildings subdivided into typological classes (given in Table 3) and detected through web mapping in Scilla is provided. This database of buildings has been established via a virtual survey and by computing the size of the building pool in each compartment through web applications (in particular, Google Map and Google Earth). Subsequently, by observing the building features, each building has been associated with a specific typological class chosen from among those reported in Table 3.
With regard to masonry buildings, about 10% have been estimated to belong to class URM-1. This reduced percentage can be reasonably attributed to the effects of the 1908 earthquake. In 1909, Royal Decree n. 193 was introduced [40], which was only valid for the zones hit by the earthquake; this was considered the first seismic code introduced in Italy. The Royal Decree envisaged the introduction of tie rods to prevent out-of-plane failure mechanisms of the façade walls, both for retrofitting existing buildings or to build new buildings, thus giving rise to a change of the structural typology of the building stock (from URM-1 to URM-2/3). Moreover, this code provided the early and simplified design parameters used to compute and thus quantify in static terms the horizontal forces applied on each floor depending on its conventional mass. About 5% of buildings have been assigned to class URM-2 and 40% in class URM-3 (‘modern’ masonry buildings erected after 1937).
The date 1937 represents the year of the institution of the first Italian seismic code valid at the national level; for new constructions, it required the presence of in-plane rigid diaphragms (e.g., RC floors with an upper RC slab) that were well connected to perimetral RC curbs, the presence of lintels above the openings, and effective transversal wall-to-wall connections. The dominant presence of the URM-3 building class is probably imputable to the long reconstruction process, which lasted until the 1930s.

4.3.2. Bargagli

Bargagli is a small Italian center located in the district of Genova with about 1000 inhabitants. This zone is characterized by very low seismicity; in fact, according to the ICSE, only one earthquake, which was of a low-intensity, has been verified in this zone, which occurred in 1536.
On 22 September 2022, a medium-low intensity earthquake of ML = 4.0, with an epicenter exclusively in Bargagli, hit this area. In Figure 8 the shaking map of this seismic event provided by INGV is depicted; the MCS intensity for the epicentral zone ranges between grade IMCS = 4–5, to which correspond maximum PGAs ranging between 0.008 g and 0.0197 g (see the red circle in Figure 8). It is interesting to note that null or at least very light damage to buildings was expected according to MCS macroseismic scale. This prediction was reflected in Bargagli in the aftermath of the 22 September eathquake, because no damage to buildings in the epicentral area and in the surrounding zones was observed.
In Figure 9, a map of Bargagli dating back to 1980 and taken from Geoportale (http://www.pcn.minambiente.it, accessed on 19 January 2023) is compared with the current one extracted from Google Maps. It is easy to recognize that, from 1980 until today, no significant expansion areas encroached on the Municipality of Bargagli; thus, a single urban compartment coinciding with the whole territory has been defined to perform seismic fragility analyses.
Through web mapping, the building features of Bargagli have been surveyed and the building classes recognized according to [34,35]. In Figure 10, typical buildings of Bargagli obtained through a virtual street tour conducted with Google Maps and Google Earth are represented. Conversely, in Figure 11, a histogram representing the percentages of building classes is reported. With regard to masonry buildings, the typological classes URM-1, URM-2, and URM-3 have been surveyed. Most of them are URM-1 buildings, i.e., ancient masonry buildings prone to out-of-plane failure mechanisms of the façade walls, whose presence is due to very low, frequent earthquakes in this area (which have not caused damage to buildings; thus, no retrofitting interventions or demolition and reconstruction of buildings were needed). It is worth noting that web-mapping tools enable the detection and characterization of traditional strengthening interventions by inspecting the building façades; indeed, the (steel) anchoring plates of the horizontal ties or similar devices sued to prevent out-of-plane failure mechanisms of the walls can be clearly identified. In the present case, only a reduced number of buildings exhibited such devices. As a result, the presence of building class URM-2 has been estimated to correspond to about 5%. Similarly, RC curbs have been observed in a few cases, allowing for the estimation of the presence of modern masonry buildings at 5% (i.e., URM-3). Regarding RC buildings, they have been estimated to comprise 40% of the two/three-floor RC buildings built in the period from 1960–1980 (RC-2), while 10% of RC buildings were designed according to seismic codes (RC-4).

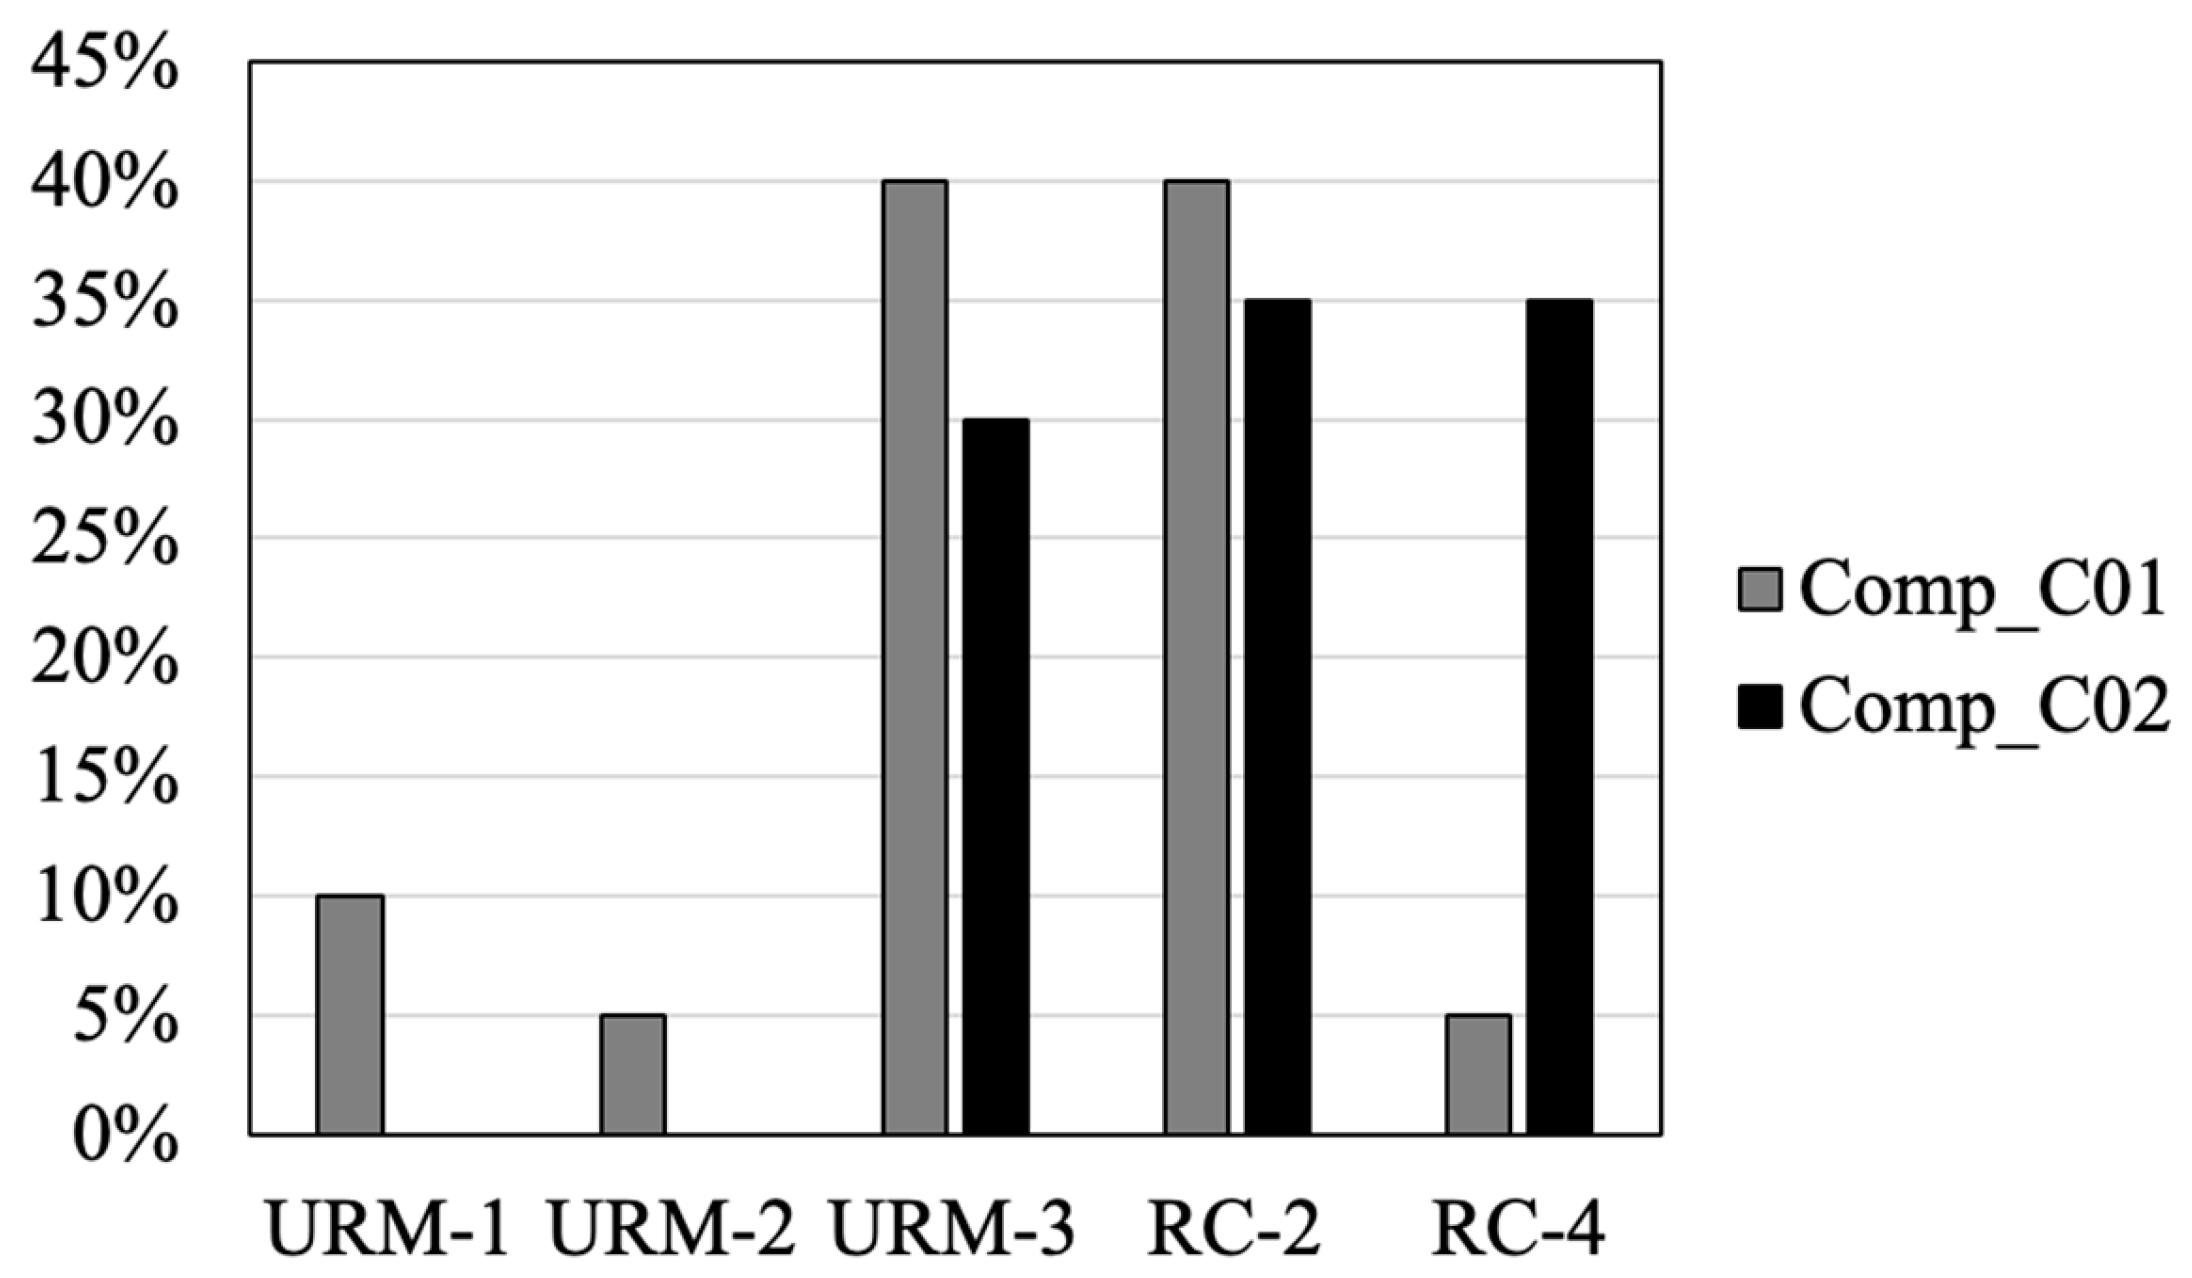
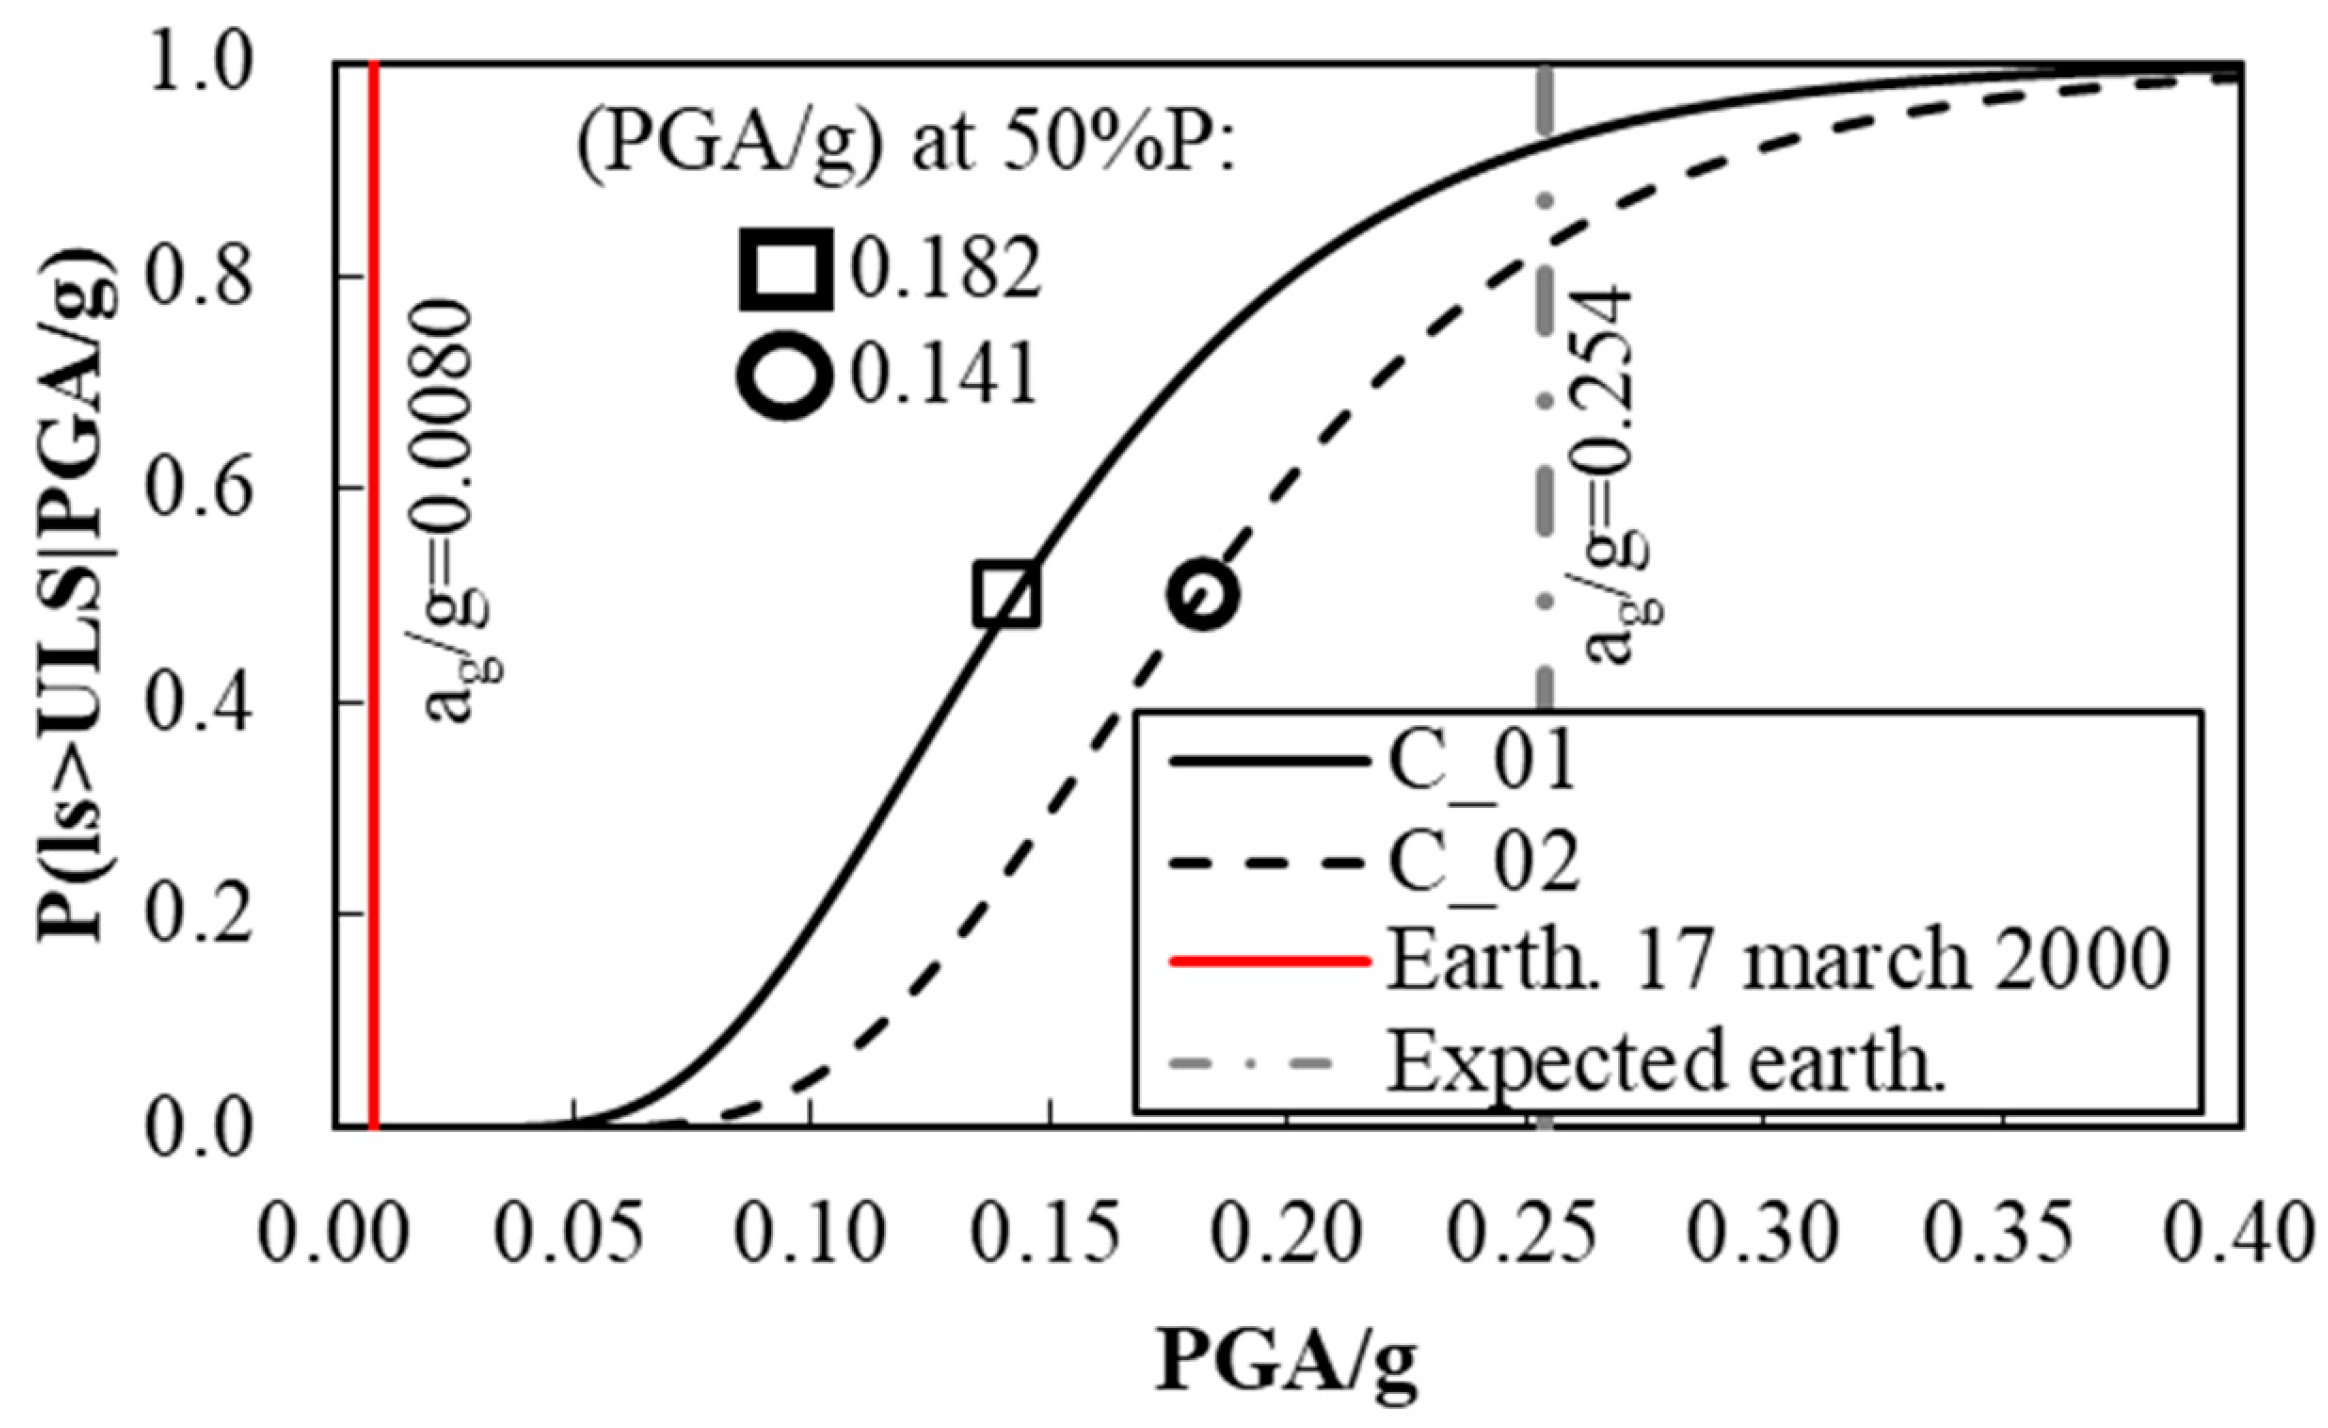
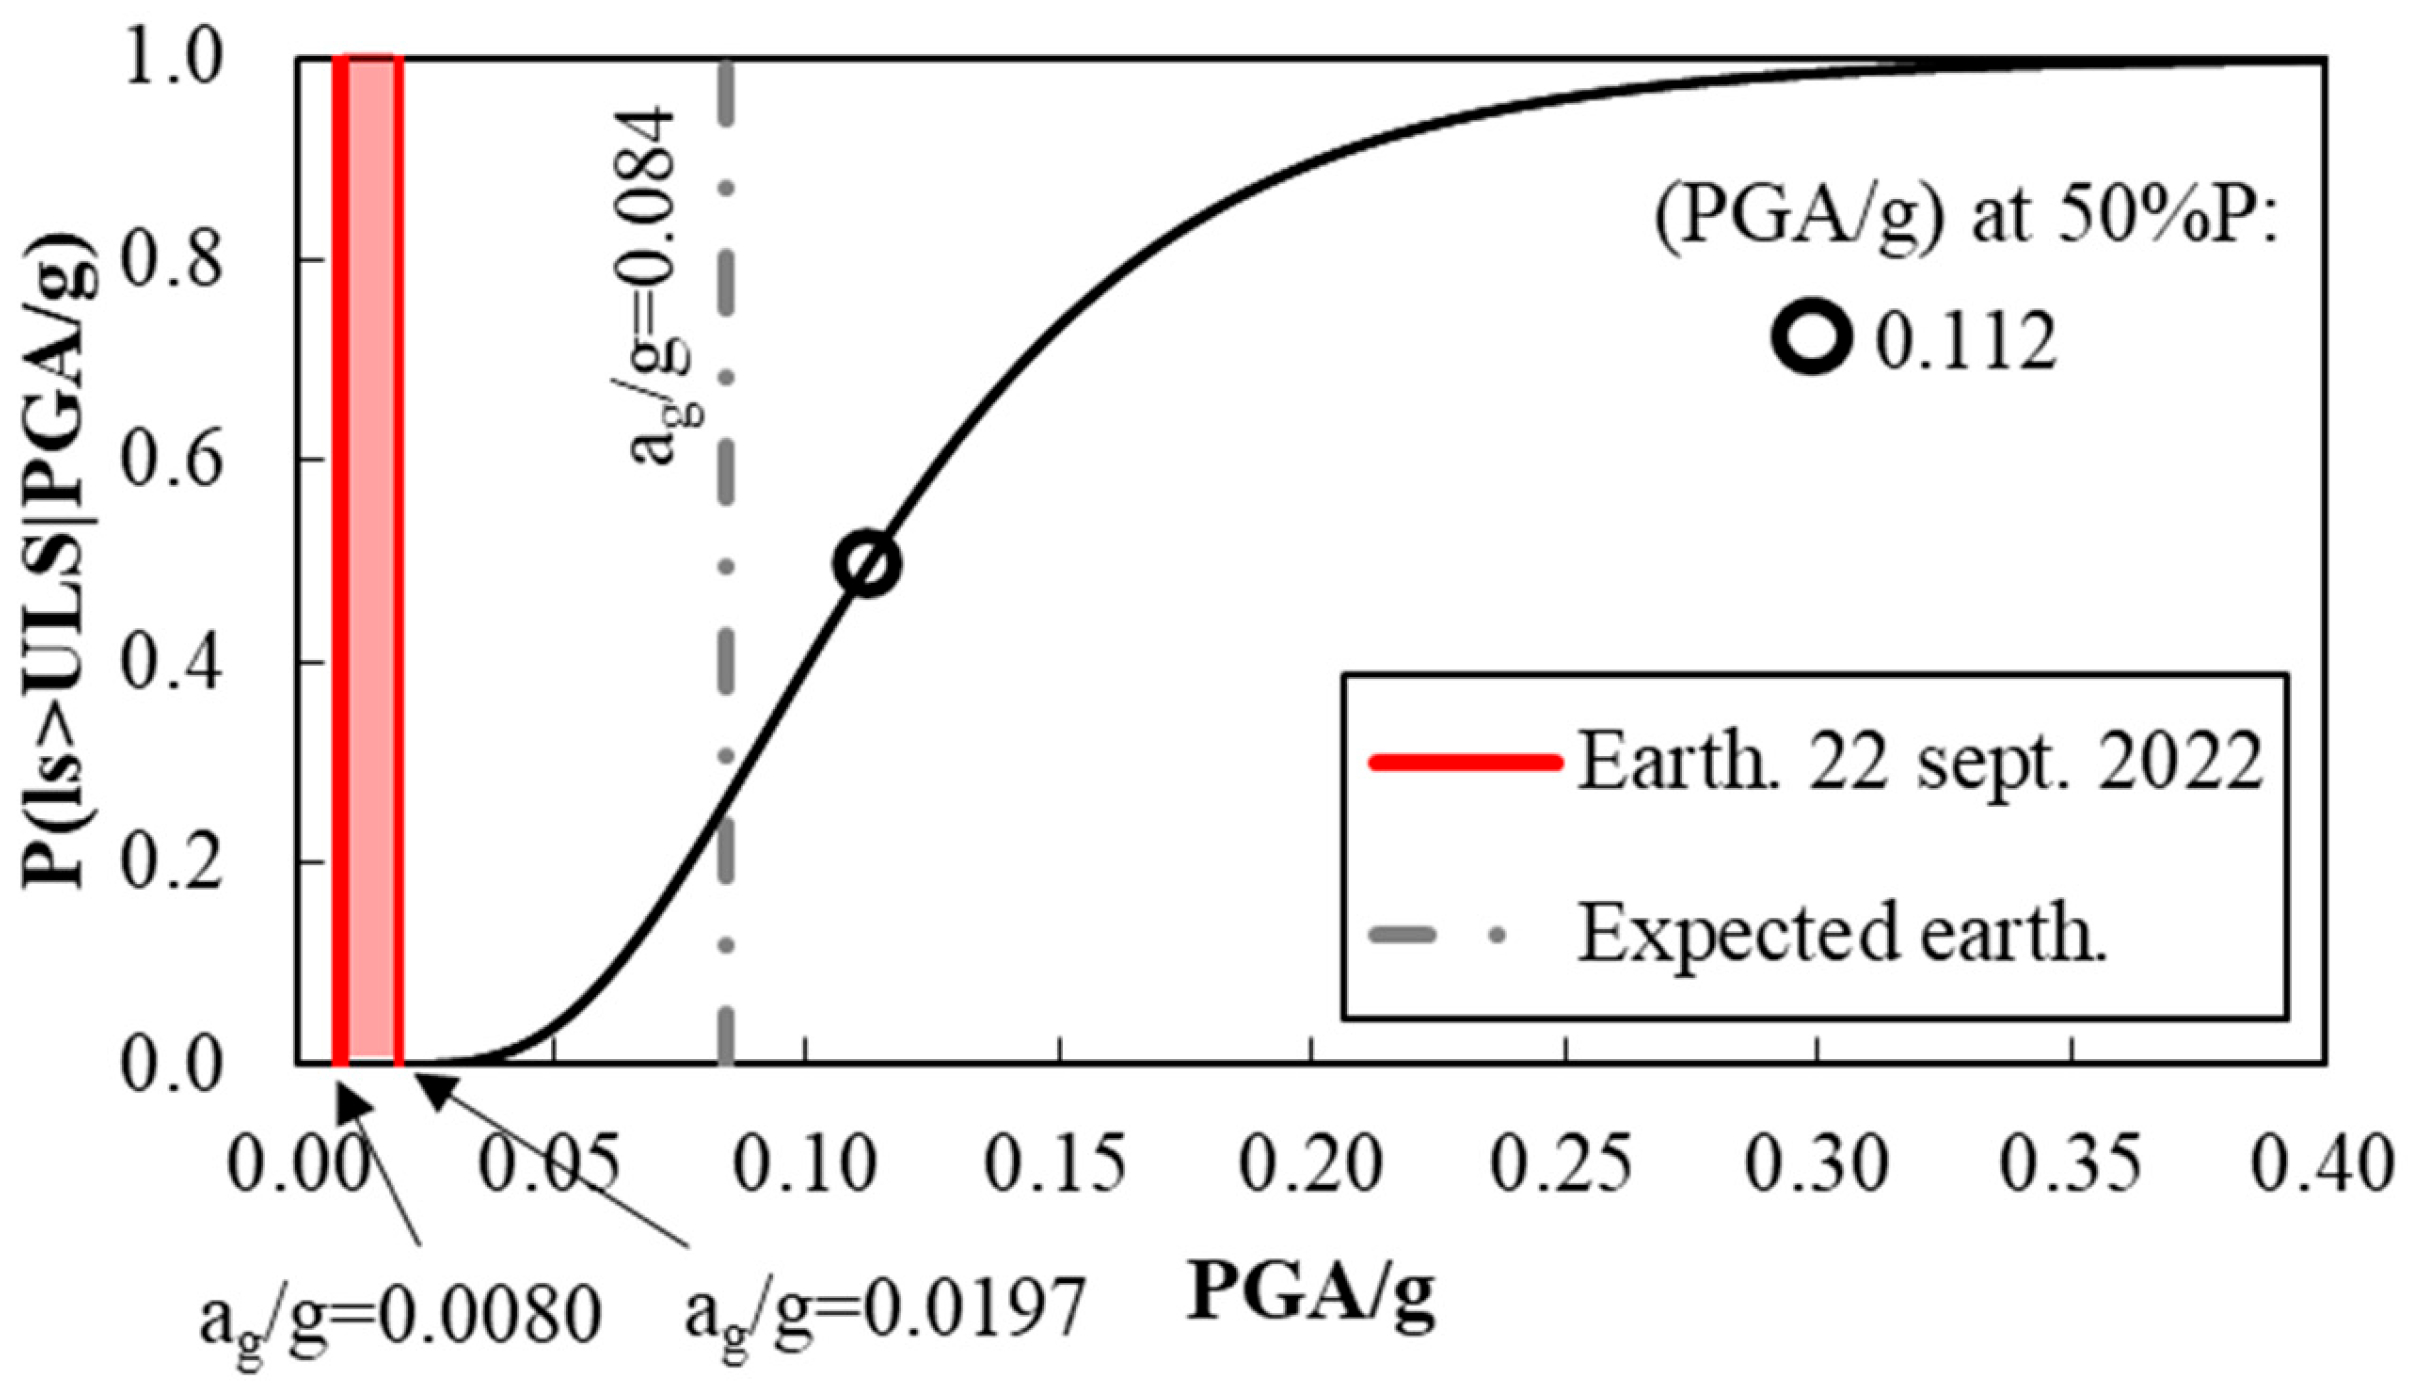
4.4. Fragility Curves and Discussion of the Results

This section reports the results of the probabilistic structural safety assessment for the two considered case studies. The urban fragility curves obtained through Equation (1) for Scilla and Bargagli are represented in Figure 12 and Figure 13, respectively. In the figures, the mean values of PGA/g bearable by each urban compartment at ULS (i.e., at 50% of probability of exceedance) are reported, which can be considered as the seismic capacity of the compartment that can be compared with the seismic demand, wherein the latter is determined by the expected value of peak ground acceleration (ag) provided by the Italian Building Code [39] at ULS at the site. By means of vertical lines, the conventional values of ag provided by the Italian Building Code, namely, 0.254 g for Scilla and 0.084 g for Bargagli, are indicated. In addition, in the case of Bargagli, the interval of ag/g estimated on the 22 September 2022 earthquake is represented.
The fragility curves show that (in absolute terms) the overall seismic capacity of Scilla corresponding to a 50% probability of exceedance is higher than that of Bargagli. On the other hand, the higher seismic hazard provided by the Codes make Scilla more vulnerable to earthquakes than Bargagli. In other words, with respect to a conventional expected earthquake, about 20% of the buildings of Scilla are estimated to be unable to trigger the ULS condition, while, in the case of Bargagli, this value reaches 80%.
Herein, the fragility curve of Bargagli has been used as a form of method validation. In fact, the urban fragility curve of Figure 13 shows a negligible probability of exceedance of the structural performance at ULS of the building classes in the seismic intensity ag range between 0.0080–0.0197 g recorded during the 22 September 2022 earthquake; this reflects the actual damage scenario observed in the aftermath of the earthquake, where damage to buildings conforming to the achievement of the ULS was not found (www.liguriaoggi.it, accessed on 19 January 2023). With regard to Scilla, the higher macroseismic intensity recorded in Scilla in the last 20 years is IMCS = 4.0 (which corresponds to an ag/g equal to about 0.008) was due to a seismic event with an epicenter off the coast of Reggio Calabria dating from 17 March 2000. In this case, no seismic damage to buildings was recorded, as predicted from the urban fragility curve reported in Figure 12.
Nevertheless, assessing the effectiveness of the fragility model is beyond the scope of the present paper, which is focused on the effectiveness of the use of web-based crowd-sourcing technology to support procedures for probabilistic safety assessment of minor historical centers of the Inner Peripheries of Italy. The research outcomes have proved that web-mapping approaches are valuable and rapid methods for recognizing buildings’ features that provide accurate analytical data in the framework of fragility assessment at large scales. These approaches constitute good tools for providing an initial screening of the fragility level of an area and, subsequently, identifying priority areas that require further investigations. Furthermore, the great availability of web tools allowed for the achievement of satisfactory results concerning the recognition of the building features and their clustering in structural-typological classes. The procedure provided a good degree of matching between the effectiveness of the results, speed, and time consumption.

5. Conclusions

Easy-to-use and rapid tools for quick, large-scale seismic fragility assessment are of paramount importance for countries such as Italy that are characterized by seismically vulnerable small historical centers that preserve the historical/architectonical features of the National building stock. In this framework, methods based on the use of digital technologies commonly available to users and focused on the concept of crowd sourcing represent valuable options for those who are involved in the development of an initial screening of the seismic fragility of urbanized areas.
In this regard, a digital crowd-sourcing approach with which to support the seismic fragility assessment of small historical centers has been presented in this paper. The method exploits the advantages related to web-mapping (conducted via remote sensing) to identify the building features of an area of interest. Building characteristics are obtained by analyzing and cross-referencing information derived by tools and apps freely available on the web. Once the building features are recognized, they are clustered in homogeneous structural-typological classes according to the building classifications available in the literature and structural safety levels at the urban scale assessed through fragility curves.
The proposed method has been validated with reference to two different minor centers: Scilla (southern Italy) and Bargagli (northern Italy). The research outcomes showed that, with respect to more refined methodologies, a digital crowd-based approach allows one to easily: (i) define a ‘level-zero’ of the seismic fragility of urban areas through remote sensing, and with a good level of detail, thus avoiding expensive and time-consuming in-field inspections; (ii) identify (more efficiently than other methods) seismically vulnerable areas that need further investigation through detailed approaches or priority interventions. The datasets collected through the proposed methodology will allow authorities to implement basic urban plans or maps to define risk mitigation strategies. This aspect is of particular importance in the framework of enhancing the resilience of urbanized areas because it may reduce the downtime of an urban system, as in the case of earthquakes hitting the area, thus mitigating the effects of depopulation, which is unfortunately common in Inner Areas of Italy.
Future developments can look towards the integration of geological and geotechnical aspects in the structural assessment of buildings and of the surrounding areas and the automation of some phases of the survey to further accelerate the population of these classes of buildings, even integrating novel techniques based on artificial intelligence.

Author Contributions

Conceptualization, A.S. and G.F.; methodology, A.S. and G.F.; software, A.S.; validation, A.S., G.F. and G.P.L.; formal analysis, A.S.; investigation, A.S.; data curation, A.S.; writing—original draft preparation, A.S., G.F. and A.P.; writing—review and editing, A.S.; visualization, G.F. and G.P.L.; supervision, G.F. and A.P. All authors have read and agreed to the published version of the manuscript.

Funding

This research received no external funding.

Data Availability Statement

The raw/processed data used in the present research work are part of an ongoing research project.

Conflicts of Interest

The authors declare no conflict of interest.

References

  1. De Toni, A.; Vizzarri, M.; Di Febbraro, M.; Laserre, B.; Noguera, J.; Di Martino, P. Aligning inner peripheries with rural development in Italy: Territorial evidence to support policy contextualization. Land Use Policy 2021, 100, 104899. [Google Scholar] [CrossRef]
  2. Copus, A.; Mantino, F.; Noguera, J. Inner Peripheries: An Oxymoron or a Real Challenge for Territorial Cohesion? Ital. J. Plan. Pract. 2017, 7, 24–49. [Google Scholar]
  3. Brando, G.; De Matteis, G.; Spacone, E. Predictive model for the seismic vulnerability assessment of small historic centres: Application to the inner Abruzzi Region in Italy. Eng. Struct. 2017, 153, 81–96. [Google Scholar] [CrossRef]
  4. Maio, R.; Vicente, R.; Formisano, A.; Varum, H. Seismic vulnerability of building aggregates through hybrid and indirect assessment techniques. Bull. Earthq. Eng. 2015, 13, 2995–3014. [Google Scholar] [CrossRef] [Green Version]
  5. Sandoli, A.; Calderoni, B.; Lingola, G.P.; Prota, A. Seismic vulnerability assessment of minor Italian urban centres: Development of urban fragility curves. Bull. Earthq. Eng. 2022, 20, 5017–5046. [Google Scholar] [CrossRef]
  6. Fabbrocino, G.; Trizio, I. The villages and the historical buildings of the central Apennines. In Central Italy Rebirth Project. New Development Paths for the Central Apennines Affected by the Pescara Earthquake; Sargolini, M., Pierantoni, I., Polci, V., Stimilli, F., Eds.; CARSA: Pescara, Italy, 2022; ISBN 978-88-501-0411-6. (In Italian) [Google Scholar]
  7. Sandoli, A.; Pacella, G.; Calderoni, B.; Brandonisio, G.; Lignola, G.P.; Prota, A. Predictive hybrid fragility models for urban scale seismic assessment: A case study in Basilicata Region (Italy). Bull. Earthq. Eng. 2023, 21, 1047–1077. [Google Scholar] [CrossRef]
  8. Marra, A.; Sabino, A.; Bartolomucci, C.; Trizio, I.; Mannella, A.; Fabbrocino, G. On a Rational and Interdisciplinary Framework for the Safety and Conservation of Historical Centres in Abruzzo Region. Int. J. Arch. Her. 2019, 15, 608–626. [Google Scholar] [CrossRef]
  9. Kassem, M.M.; Nazri, F.M.; Farsanf, E.N. The seismic vulnerability assessment methodologies: A state-of-the-art review. Ain Shams Eng. J. 2020, 11, 849–864. [Google Scholar] [CrossRef]
  10. Pitilakis, K.; Crowley, H.; Kaynia, A.M. SYNER-G: Typology definition and fragility functions for physical elements at seismic risk. Geotech. Geol. Earthq. Eng. 2014, 27, 1–28. [Google Scholar] [CrossRef]
  11. Columbro, C.; Eudave, R.R.; Ferreira, T.M.; Lourenço, P.B.; Fabbrocino, G. On the use of web mapping platforms to support the seismic vulnerability assessment of old urban area. Remote Sens. 2022, 14, 1424. [Google Scholar] [CrossRef]
  12. Marino, L.; Capone, V. Samrt working and well-being before and during the COVID-19 pandemic; a scoping review. Eur. J. Investing. Health Psychol. Educ. 2021, 11, 1516–1536. [Google Scholar]
  13. Marra, A.; Fabbrocino, G.; Fabbrocino, S. Conservation and enhancement of the Pietrabbondante archaeological site between history, geology and emerging crowd-based digital technologies. Heritage 2022, 5, 1504–1528. [Google Scholar] [CrossRef]
  14. Ruggieri, S.; Calò, M.; Cardellicchio, A.; Uva, G. Analytical-mechanical based framework for seismic overall fragility analysis of existing RC buildings in town compartments. Bull. Earthq. Eng. 2022, 20, 8179–8216. [Google Scholar] [CrossRef]
  15. Ricci, P.; Verderame, G.M.; Manfredi, G.; Pollino, M.; Borfecchia, F.; De Cecco, L.; James, V. Seismic vulnerability assessment using field survey and remote sensing techniques. In Computational Science and Its Applications—ICCSA 2011; Springer: Berlin/Heidelberg, Germany, 2011; pp. 109–124. [Google Scholar] [CrossRef] [Green Version]
  16. Wieland, M.; Pittore, M.; Parolai, S.; Zschau, J.; Moldobekov, B.; Begaliev, U. Esitmating building inventory for rapid seismic vulnerability assessment: Towards an integrated approach based on multi-source imaging. Soil Dyn. Earthq. Eng. 2012, 36, 70–83. [Google Scholar] [CrossRef]
  17. Marra, A.; Fabbrocino, G. Open-access web mapping as a virtual survey tool for cultural heritage: An application to the Armenian religious architecture documented by Paolo Cuneo. Disegnarecon 2020, 13. [Google Scholar] [CrossRef]
  18. Kassem, M.M.; Beddu, S.; Ooi, J.H.; Tan, C.G.; El-Maissi, A.M.; Nazri, F.M. Assessment of the seismic vulnerability using rapid visual screening method through web-based application for Malaysia. Buildings 2021, 11, 485. [Google Scholar] [CrossRef]
  19. Qi, W.; Su, G.; Sun, L.; Yang, F.; Wu, Y. “Internet +” approach to mapping exposure and seismic vulnerability of buildings in a context of rapid socioeconomic growth: A case study in Tangshan, China. Nat. Haz. 2017, 86, S107–S139. [Google Scholar] [CrossRef] [Green Version]
  20. Leggieri, V.; Mastrodonato, G.; Uva, G. GIS multisource data for the seismic vulnerability assessment of buildings at the urban scale. Buildings 2022, 12, 523. [Google Scholar] [CrossRef]
  21. Santucci de Magistris, F.; Lanzano, G.; Forte, G.; Fabbrocino, G. A database for PGA threshold in liquefaction occurrence. Soil Dyn. Earthq. Eng. 2013, 54, 17–19. [Google Scholar] [CrossRef]
  22. Lanzano, G.; Santucci de Magistris, F.; Salzano, E.; Fabbrocino, G. Vulnerability of industrial components to soil liquefaction. Chem. Eng. Trans. 2014, 36, 421–426. [Google Scholar] [CrossRef]
  23. Calabria Region Website. Available online: https://www.regione.calabria.it/website/portalmedia/decreti/2021-02/DGR_2018_215_Allegato.pdf (accessed on 19 January 2023).
  24. Liguria Region Website. Available online: https://www.regione.liguria.it/homepage-fondi-europei/cosa-cerchi/strategia-nazionale-aree-interne/area-interna-valli-antola-tigullio.html (accessed on 19 January 2023).
  25. Ghezzi, A.; Gabelloni, D.; Martini, A.; Natalicchio, A. Crowdsourcing: A review and suggestions for future research. Int. J. Manag. Rev. 2018, 20, 343–363. [Google Scholar] [CrossRef]
  26. Baggio, C.; Bernardini, A.; Colozza, R.; Corazza, L.; Della Bella, M.; Di Pasquale, G.; Dolce, M.; Goretti, A.; Martinelli, A.; Orsini, G.; et al. Field manual for post-earthquake damage and safety assessment and short-term countermeasures (AeDES). European Commission Joint Research Centre. Institute for the Protection and Security of the Citizen, Luxemburg. 2007. Available online: https://www.eeri.org/ (accessed on 19 January 2023).
  27. Di Pasquale, G.; Orsini, G.; Romeo, R.W. New developments in seismic risk assessment in Italy. Bull. Earthq. Eng. 2005, 3, 101–128. [Google Scholar] [CrossRef]
  28. Lagomarsino, S.; Giovinazzi, S. Macroseismic and mechanical models for the vulnerability and damage assessment of current building. Bull. Earthq. Eng. 2006, 4, 415–443. [Google Scholar] [CrossRef]
  29. Milutinovic, Z.V.; Trendafiloski, G.S. An Advanced Approach to Earthquake Risk Scenarios with Applications to Different European Towns. Projet Europen Risk-UE; European Commission: Brussels, Belgium, 2004. [Google Scholar]
  30. Rota, M.; Penna, A.; Strobbia, C.L. Processing Italian damage data to derive typological fragility curves. Soil Dyn. Earthq. Eng. 2008, 28, 933–947. [Google Scholar] [CrossRef]
  31. Zuccaro, G.; Cacace, F. Seismic vulnerability assessment based on typological characteristics. The first level procedure “SAVE”. Soil Dyn. Earthq. Eng. 2015, 69, 262–269. [Google Scholar] [CrossRef]
  32. Del Gaudio, C.; De Martino, G.; Di Ludovico, M.; Manfredi, G.; Prota, A.; Ricci, P.; Verderame, G.M. Empirical fragility curves for masonry buildings after the 2009 L’Aquila, Italy, earthquake. Bull. Earthq. Eng. 2019, 17, 6301–6330. [Google Scholar] [CrossRef]
  33. Donà, M.; Carpanese, P.; Follador, V.; Sbrogiò, L.; da Porto, F. Mechanics-based fragility curves for Italian residential URM buildings. Bull. Earthq. Eng. 2020, 19, 3099–3127. [Google Scholar] [CrossRef]
  34. Sandoli, A.; Lignola, G.P.; Calderoni, B.; Prota, A. Fragility curves for Italian URM buildings based on a hybrid method. Bull. Earthq. Eng. 2021, 19, 4979–5013. [Google Scholar] [CrossRef]
  35. Sandoli, A.; Calderoni, B. Assessment of the seismic vulnerability at territorial scale: A new structural-typological classification of existing buildings and definition of fragility curves. In Proceedings of the 10th International Masonry Conference, Milan, Italy, 9–10 July 2018; pp. 153–168. [Google Scholar]
  36. RD 1927, Royal Decree n.431-13/03/Technical and Hygienic Rules for Buildings in the Zones Hit by Earthquakes. Italian Government. 8 April 1927. Available online: http://www.staticaesismica.it/normative/RDL_13_03_1927_n431.pdf (accessed on 19 January 2023). (In Italian).
  37. Presidency of the Council of Ministers; Civil Protection Department. OPCM n.3472/First Rules for General Seismic Classification Criteria of the National Territory and Technical Rules for Constructions in Seismic Areas. Available online: https://rischi.protezionecivile.gov.it/ (accessed on 19 January 2023). (In Italian)
  38. EN 1998-1; Eurocode 8: Design of Structures for Earthquake Resistance, Part 1: General Rules, Seismic Actions and Rules for Buildings. CEN: Brussels, Belgium, 2003.
  39. Ministry of Transportation and Infrastructures. Italian Building Code (DM. 17/01/2008) Technical Code for Constructions. Available online: https://www.gazzettaufficiale.it/eli/gu/2018/02/20/42/so/8/sg/pdf (accessed on 19 January 2023).
  40. RD 1909, Royal Decree n. Technical and Hygienic Rules for Repairs, Reconstructions and New Constructions of Private and Public Buildings in the Zones Affected by 28th December 1908 Earthquakes, and in Precedent Ones. Italian Government. 22 April 1909. Available online: https://legislazionetecnica.it/ (accessed on 19 January 2023). (In Italian).
Figure 1. Flow chart of the methodology.
Buildings 13 00562 g001
Figure 2. (a) Chronology of earthquakes in Reggio Calabria region; (b) shake map concerning MCS macorseismic intensity scale of 1908 Messina and Reggio earthquake (source: ICSE by INGV).
Buildings 13 00562 g002aBuildings 13 00562 g002b
Figure 3. Historical maps made available by the Italian Geographic Military Institute (IGM). (a) Historical map of scilla dating back 1884. (b) Historical map of Scilla dating back 1959.
Buildings 13 00562 g003
Figure 4. Google Maps view of Scilla subdivided into urban compartments.
Buildings 13 00562 g004
Figure 5. Digital survey of the buildings of Compartment C01 of Scilla via Google Maps. (a) https://goo.gl/maps/XMb6JVtWkUS7M8Ws5 (accessed on 19 January 2023), (b) https://goo.gl/maps/bcgFxVDfVDPyewaV9 (accessed on 19 January 2023).
Buildings 13 00562 g005
Figure 6. Digital survey of the buildings of the Compartment C02 of Scilla via Google Maps. (a) https://goo.gl/maps/veM4mLysdkrhefFR9 (accessed on 19 January 2023), (b) https://goo.gl/maps/Vy6QZzRQ13nAPRpp7 (accessed on 19 January 2023).
Buildings 13 00562 g006
Figure 7. Distribution of the building classes surveyed in Scilla for the compartments C01 and C02.
Buildings 13 00562 g007
Figure 8. Shaking map of the 22 September 2022 earthquake that occurred in Bargagli (source: INGV).
Buildings 13 00562 g008
Figure 9. Comparison between the aerial photo from Geoportale (1980) and Google Maps view (2023).
Buildings 13 00562 g009
Figure 10. Digital survey of the buildings of Bargagli obtained through Google Maps. (a) https://goo.gl/maps/hbfVrNWjekPzviue9 (accessed on 19 January 2023), (b) https://goo.gl/maps/uX2jsMcKdLUr3vuD7 (accessed on 19 January 2023).
Buildings 13 00562 g010
Figure 11. Percentage of building classes detected in Bargagli.
Buildings 13 00562 g011
Figure 12. Urban fragility curves for the compartments C01 and C02 of Scilla.
Buildings 13 00562 g012
Figure 13. Urban fragility curves for Bargagli.
Buildings 13 00562 g013
Table 1. Web tools for remote building survey and characterization.
ToolFree Online Information *
(Po)(Nb)(Nf)(Mt)(In)(Ue)(Ce)
Google Maps
IGM 1
Google Earth
ISTAT 3
INGV 2
Urban Plans
Cadastal map
Geoportale
* Information type: (Po) Position in the urban context; (Nb) Number of buildings; (Nf) Number of floors; (Mt) Material type; (In) Interventions; (Ue) Urban evolution; (Ce) Construction age; 1 IGM = Military Geographic Institute, 2 INGV = National Institute of Geophysics and Volcanology, 3 ISTAT = National Institute of Statistics
Table 3. Description of building classes used in this paper and typological fragility curves [34,35].
Building
Class
DescriptionTypological Fragility Curves
URM-1Buildings with masonry walls without seismic devices devoted to preventing out-of-plane mechanisms of façade walls. Contain in-plane deformable floors (masonry vaults or wooden/iron beams).Buildings 13 00562 i001
URM-2Buildings with structural features equivalent to those of class URM-1 but contain strengthened masonry walls to prevent out-of-plane failure mechanisms of the façades.
URM-3Buildings with masonry walls interrupted by RC ring beams (connected to the floors) at each level and presence of effective lintels. Contain in-plane rigid (or semi-rigid) floors.
RC-2Gravity-load-designed buildings with one-way frames made with deep or flat beams and small-sized columns. Contain semi-rigid floors, heavy or light infills, and staircases with knee beams.Buildings 13 00562 i002
RC-4Buildings designed considering the effect of horizontal seismic actions, provided or not with seismic details depending on prescriptions of the codes. Contain in-plane rigid floors, light infills, and staircases with or without knee beams.
Disclaimer/Publisher’s Note: The statements, opinions and data contained in all publications are solely those of the individual author(s) and contributor(s) and not of MDPI and/or the editor(s). MDPI and/or the editor(s) disclaim responsibility for any injury to people or property resulting from any ideas, methods, instructions or products referred to in the content.

