Article

Interfacial Effect on Quantitative Concrete Stress Monitoring via Embedded PZT Sensors Based on EMI Technique

1
School of Architecture and Civil Engineering, Xi’an University of Science and Technology, Xi’an 710054, China
2
CCCC First Highway Consultants Co., Ltd., Xi’an 710068, China
*
Author to whom correspondence should be addressed.
Buildings 2023, 13(2), 560; https://doi.org/10.3390/buildings13020560
Submission received: 21 January 2023 / Revised: 13 February 2023 / Accepted: 15 February 2023 / Published: 17 February 2023

Abstract

:
Sensing performance is crucial for real-world applications of the embedded piezoelectric lead zirconate titanate (PZT) sensors in concrete structures. Based on the electromechanical impedances (EMIs) obtained numerically and experimentally from the embedded PZT sensors, effects of installation orientation and interfacial roughness were investigated on their sensitivity and reliability for quantitative concrete stress monitoring. The numerical results suggest a better sensitivity in the embedded 90° PZT sensors, with planar normal perpendicular to the loading direction, where the conductance amplitude variation is 6.5 times of that of the 0° PZT sensors, with normal parallel to load direction. Further, the improved reliability of the PZT sensors with rough interfaces is observed experimentally, which makes them robust for concrete stress monitoring over a wider sensing range from 0 to 20 MPa. Based on the static analyses, it is noted that the sensing performance of the embedded sensor is significantly affected by the interfacial stiffness degradation induced by the enhanced strain surrounding the sensor. These findings suggest that delaying the interfacial stiffness degradation, i.e., with proper installation orientation and interfacial treatment, could improve the sensing performance of the embedded sensors for quantitative concrete stress monitoring.

1. Introduction

Structural health monitoring is crucial for existing infrastructures against catastrophic structural damages. For the non-destructive evaluation of concrete structures, PZT-based sensors are widely used for their good sensitivity and practicality [1,2,3,4]. The direct and converse piezoelectric properties in a PZT patch render it an actuator for producing high-frequency vibration, as well as a sensor for measuring the impedance signals. When a PZT sensor was surface bonded to or embedded into a host structure, the electromechanical coupling correlates the changes in structural properties with the changes in electrical impedance signals measured from the PZT sensor by an impedance analyzer. Thus, the changes in structural effective parameters such as mass, stiffness, and damping of the host structure can be detected by analyzing the measured electromechanical impedance (EMI) signals [5,6].
To date, this EMI technique has been widely used for structural health monitoring in concrete structures. Many researchers have utilized PZT-based sensors for strength gain monitoring in fresh concrete and damage identification in concrete structures [7,8,9,10,11]. Based on the EMI technique, both the surface-bonded and embedded PZT-based sensors have been validated experimentally for strength gain monitoring quantitatively in concrete [12,13,14,15,16,17,18,19,20]. Additionally, the PZT-based smart probe was proposed to predict the dynamic elastic modulus of cementitious materials theoretically [21] and validated for monitoring the strength and freeze/thaw process in soil experimentally [22]. Furthermore, changes in the damage states of a concrete beam during repair have been captured qualitatively by the changes in the EMI signatures measured by the surface-bonded PZT sensors [23].
In real-world applications, the PZT sensors were usually installed in concrete structures serviced under harsh environments. To protect against unexpected failures due to environmental threats, sensors were often packed with coating layers and embedded into host structures. The installation configuration will inevitably result in two issues with the sensitivity of the embedded PZT patches. The first issue is the indirect electromechanical coupling, due to the insertion of the sensor–concrete interfacial layers, which brings additional uncertainties to the measured EMI signals. The other is the localization of the premature damages across the interfaces, induced by environmental loading, that may significantly affect the overall structural impedance prediction via the measured EMI signals. Particularly for structures under severe loading, local damages may occur near the interfaces before the overall structural yielding occurs. The damaged interfaces will bring some noise to the impedance signals measured from the embedded sensors, thus impairing their ability for quantitative concrete stress monitoring and damage evaluation.
For stress monitoring in concrete structures, voltage changes in the PZT sensors have been used to reflect the stress changes qualitatively [24,25,26,27,28,29]. However, these techniques were not qualified for quantitative concrete stress monitoring due to their low accuracy. Based on the EMI technique, compressive stresses in concrete have been estimated by the resonance shifts of the measured conductance signatures at a precision level of ~5 MPa [3,30]. Furthermore, statistical metrics such as root mean square deviation (RMSD) and correlation coefficient (CC) have been utilized to indicate the changes in the conductance signatures that are closely related to the compressive stresses in concrete [18,31,32,33,34,35,36]. Additionally, machine learning algorithms have been incorporated into the EMI technique for quantitative stress monitoring and structural damage detection [20]. With the advances of these approaches in recent years, the accuracy of stress monitoring has been improved remarkably. Zhao et al. [36] observed a nonlinear relationship between the damage volume ratio (DVR) and the RMSD index of the EMI signatures based on numerical and experimental investigations, and they found that the numerically obtained DVR grows linearly before the compressive stresses reaching 0.31 fc (the compressive strength). Pan and Guan [37] established a linear relationship between the stress and the RMSD of the measured conductances in concrete under low stresses below 0.3 fc using the embedded PZT sensors. However, quantitative stress monitoring via PZT sensors is still a challenge in concrete structures. Particularly for the embedded sensor, although the importance of the interfacial effect between the sensor and concrete is known, how to utilize the effect to achieve better sensing performance is still unclear.
This work aims to study the interfacial effects on the sensing performance of the embedded PZT sensors for concrete stress monitoring. By using the EMI technique, the sensitivity and reliability of the PZT sensors were investigated numerically and experimentally at different installation orientations and interfacial roughnesses. The mechanism underlying the interfacial effects was discussed for the improvement in the sensitivity and reliability of the embedded sensors. The results of the current study validated that the installation orientation relative to the loading direction played a dominant role in determining the sensing performance of the PZT sensors. This work suggests a practical method, via interfacial enhancement, to improve the reliability and sensitivity of the embedded sensors.

2. Experiments and Numerical Simulations

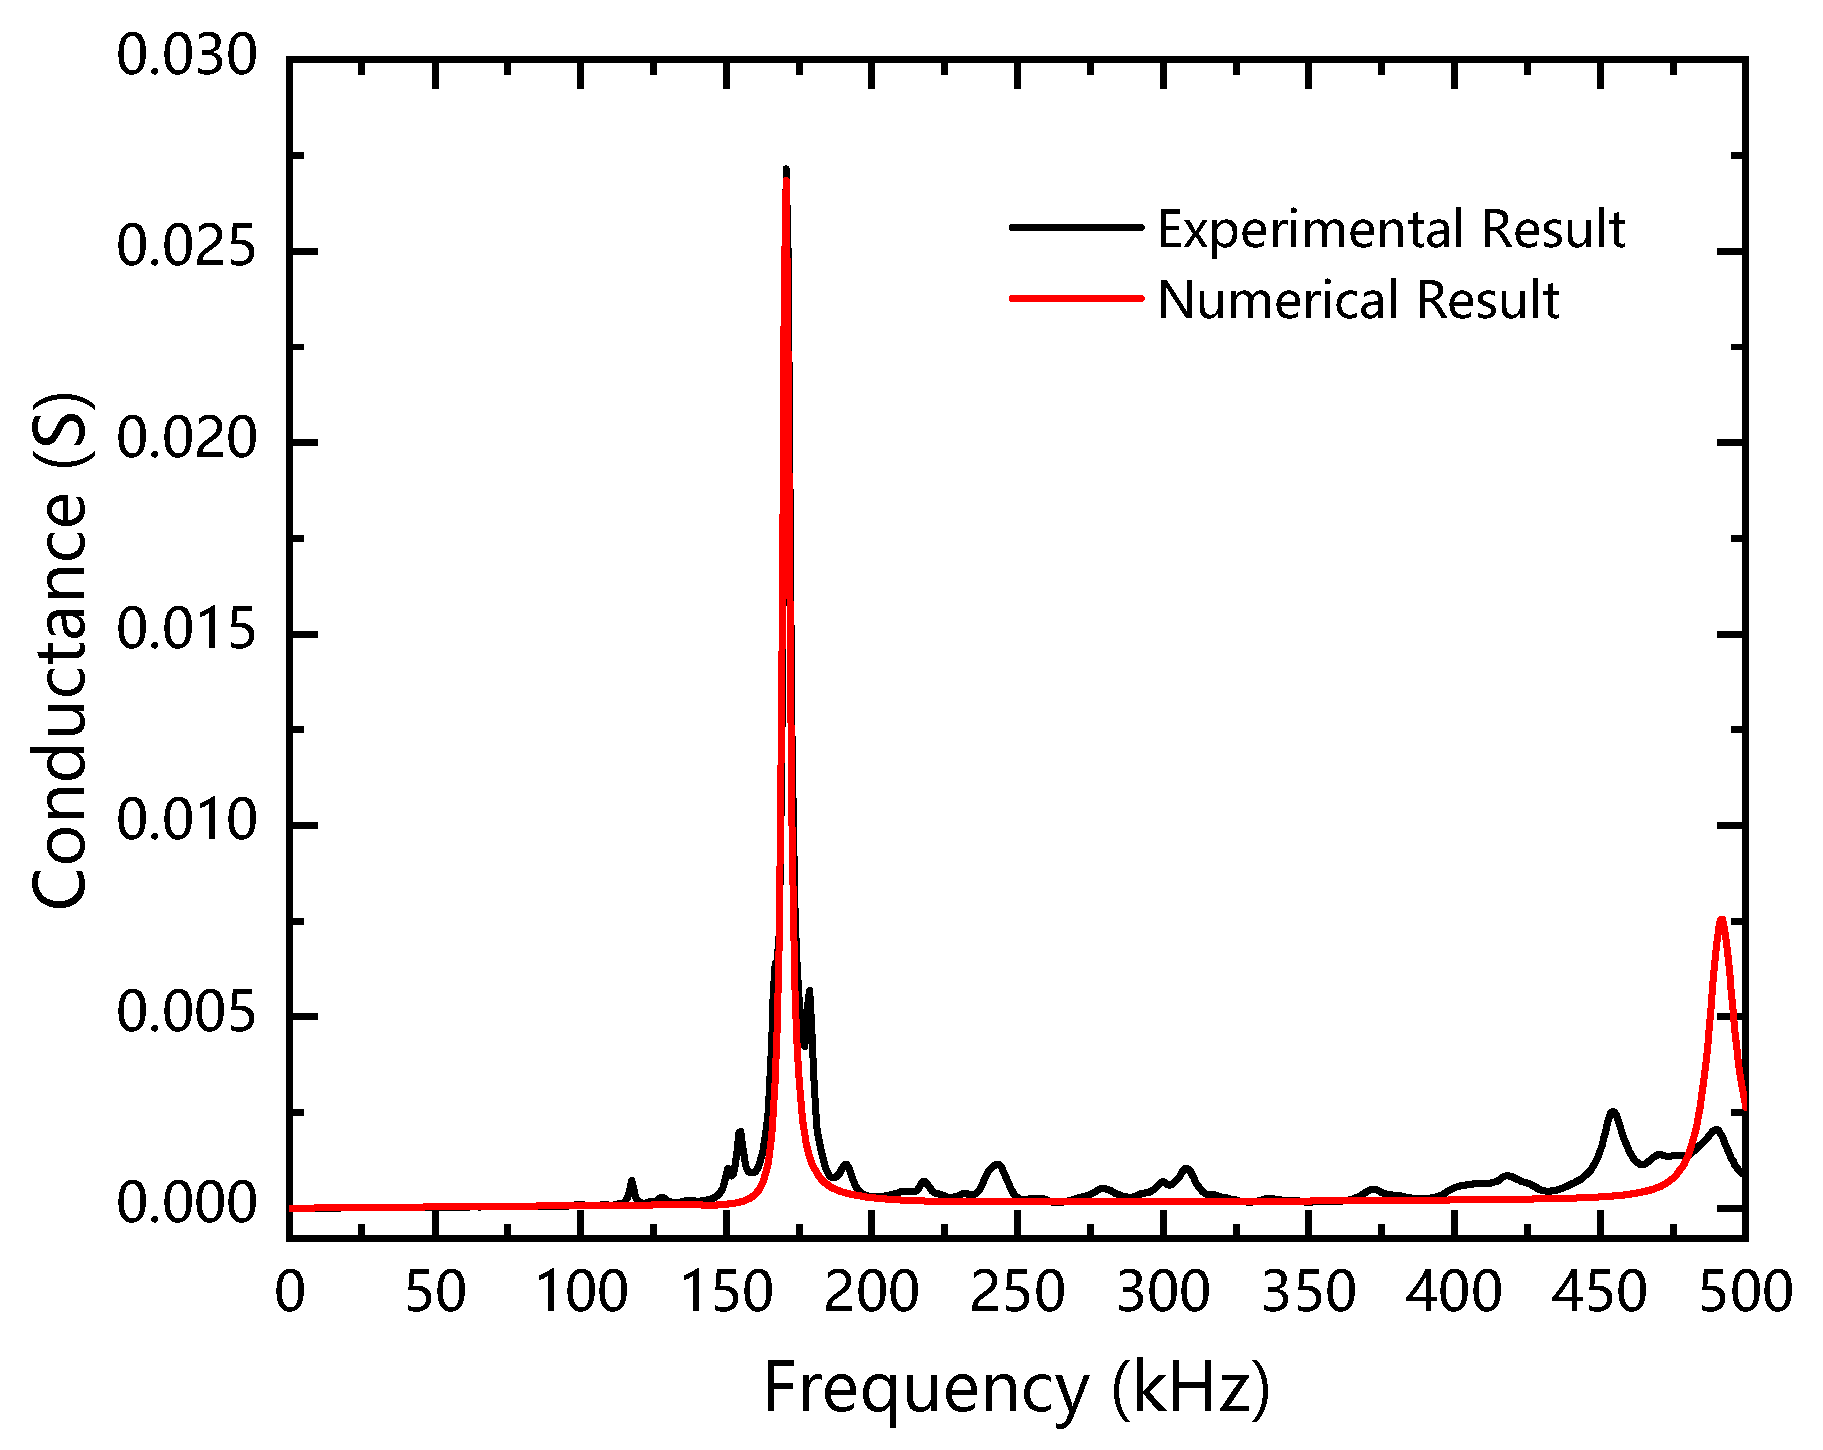
2.1. Theoretical Model of the Piezoelectric Impedance

According to the theory proposed by Liang et al. [6] for a one-dimension ideal model, the electrical admittance measured by the PZT sensor coupled with the host structure can be calculated by the following:
Y ω = i ω l A w A h A ε ¯ 33 σ d 31 2 Y ¯ 33 E + Z A ω d 31 2 Y ¯ 33 E Z S ω + Z A ω tan k l A k l A
where i is the imaginary unit, ω is the angular excitation frequency, Z A ω and Z S ω are the mechanical impedances of the PZT sensor and the host structure, respectively.
Z A ω = Y ¯ 33 E w A h A ω l A i k l A tan k l A
Z S ω = σ ¯ A P i ω x ¯
where l A , w A , and h A are the length, width, and thickness of the PZT patch, respectively; ε ¯ 33 σ = ε 33 σ 1 - δ i is the complex dielectric constant of PZT; δ is the dielectric loss factor; Y ¯ 33 E = Y 33 E 1 + η i is the complex elastic modulus of PZT; η is the mechanical loss factor; d 31 is the piezoelectric strain coefficient; k is the vibration factor; σ ¯ is the magnitude of the periodic stress applied on the host structure from PZT surfaces; A P is the surface area of PZT; x ¯ is the magnitude of the lateral displacement of PZT.
However, for the model with an embedded PZT sensor, the interfacial interaction between the PZT sensor and the host structure should be considered. To take the contribution from the sensor–concrete interfaces into account, the electrical admittance measured by the PZT sensor can be modified as follows [38]:
Y ω = i ω l A w A h A ε ¯ 33 σ d 31 2 Y ¯ 33 E + Z A ω d 31 2 Y ¯ 33 E ξ Z S ω + Z A ω tan k l A k l A
where ξ is the modification coefficient of the structural mechanical impedance that considers the interfaces an additional part of the host structure. According to the measured EMI signatures obtained by Equation (4), the mechanical impedance of the host structure can be predicted more accurately if the contribution of the interfaces can be significantly reduced.

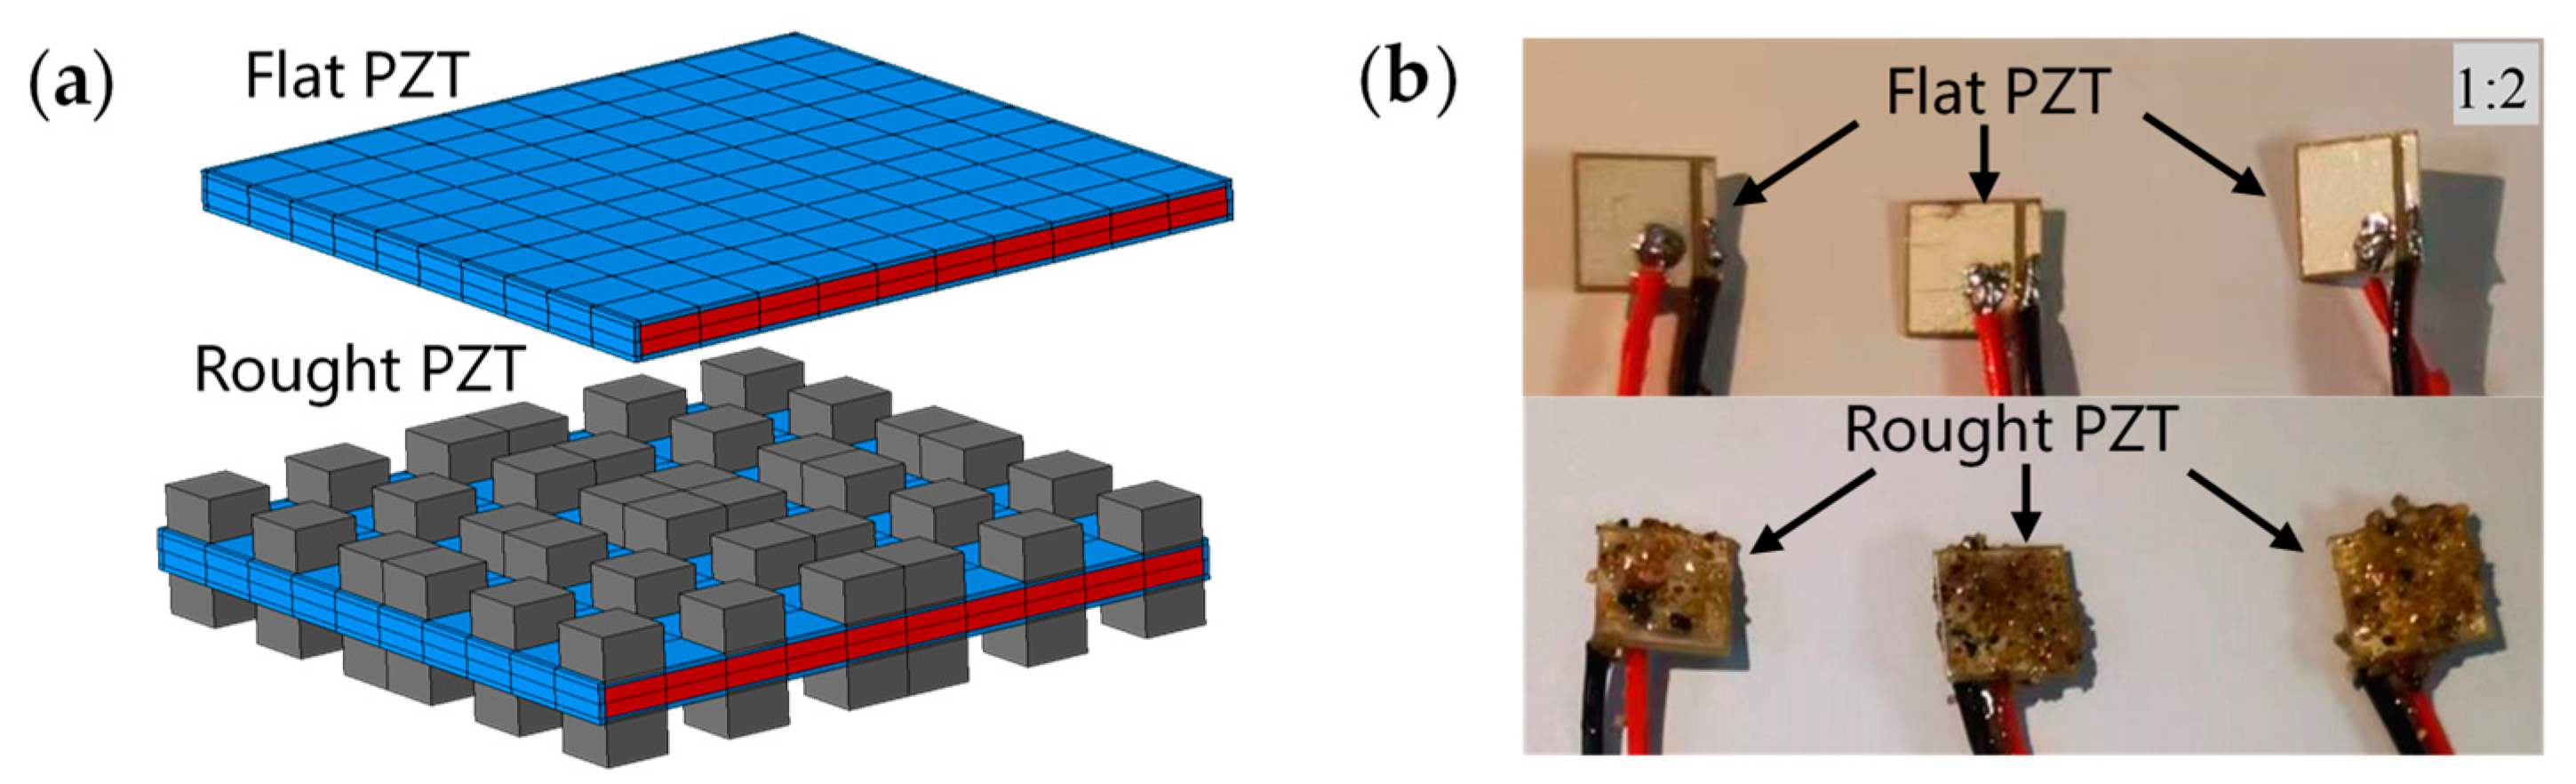
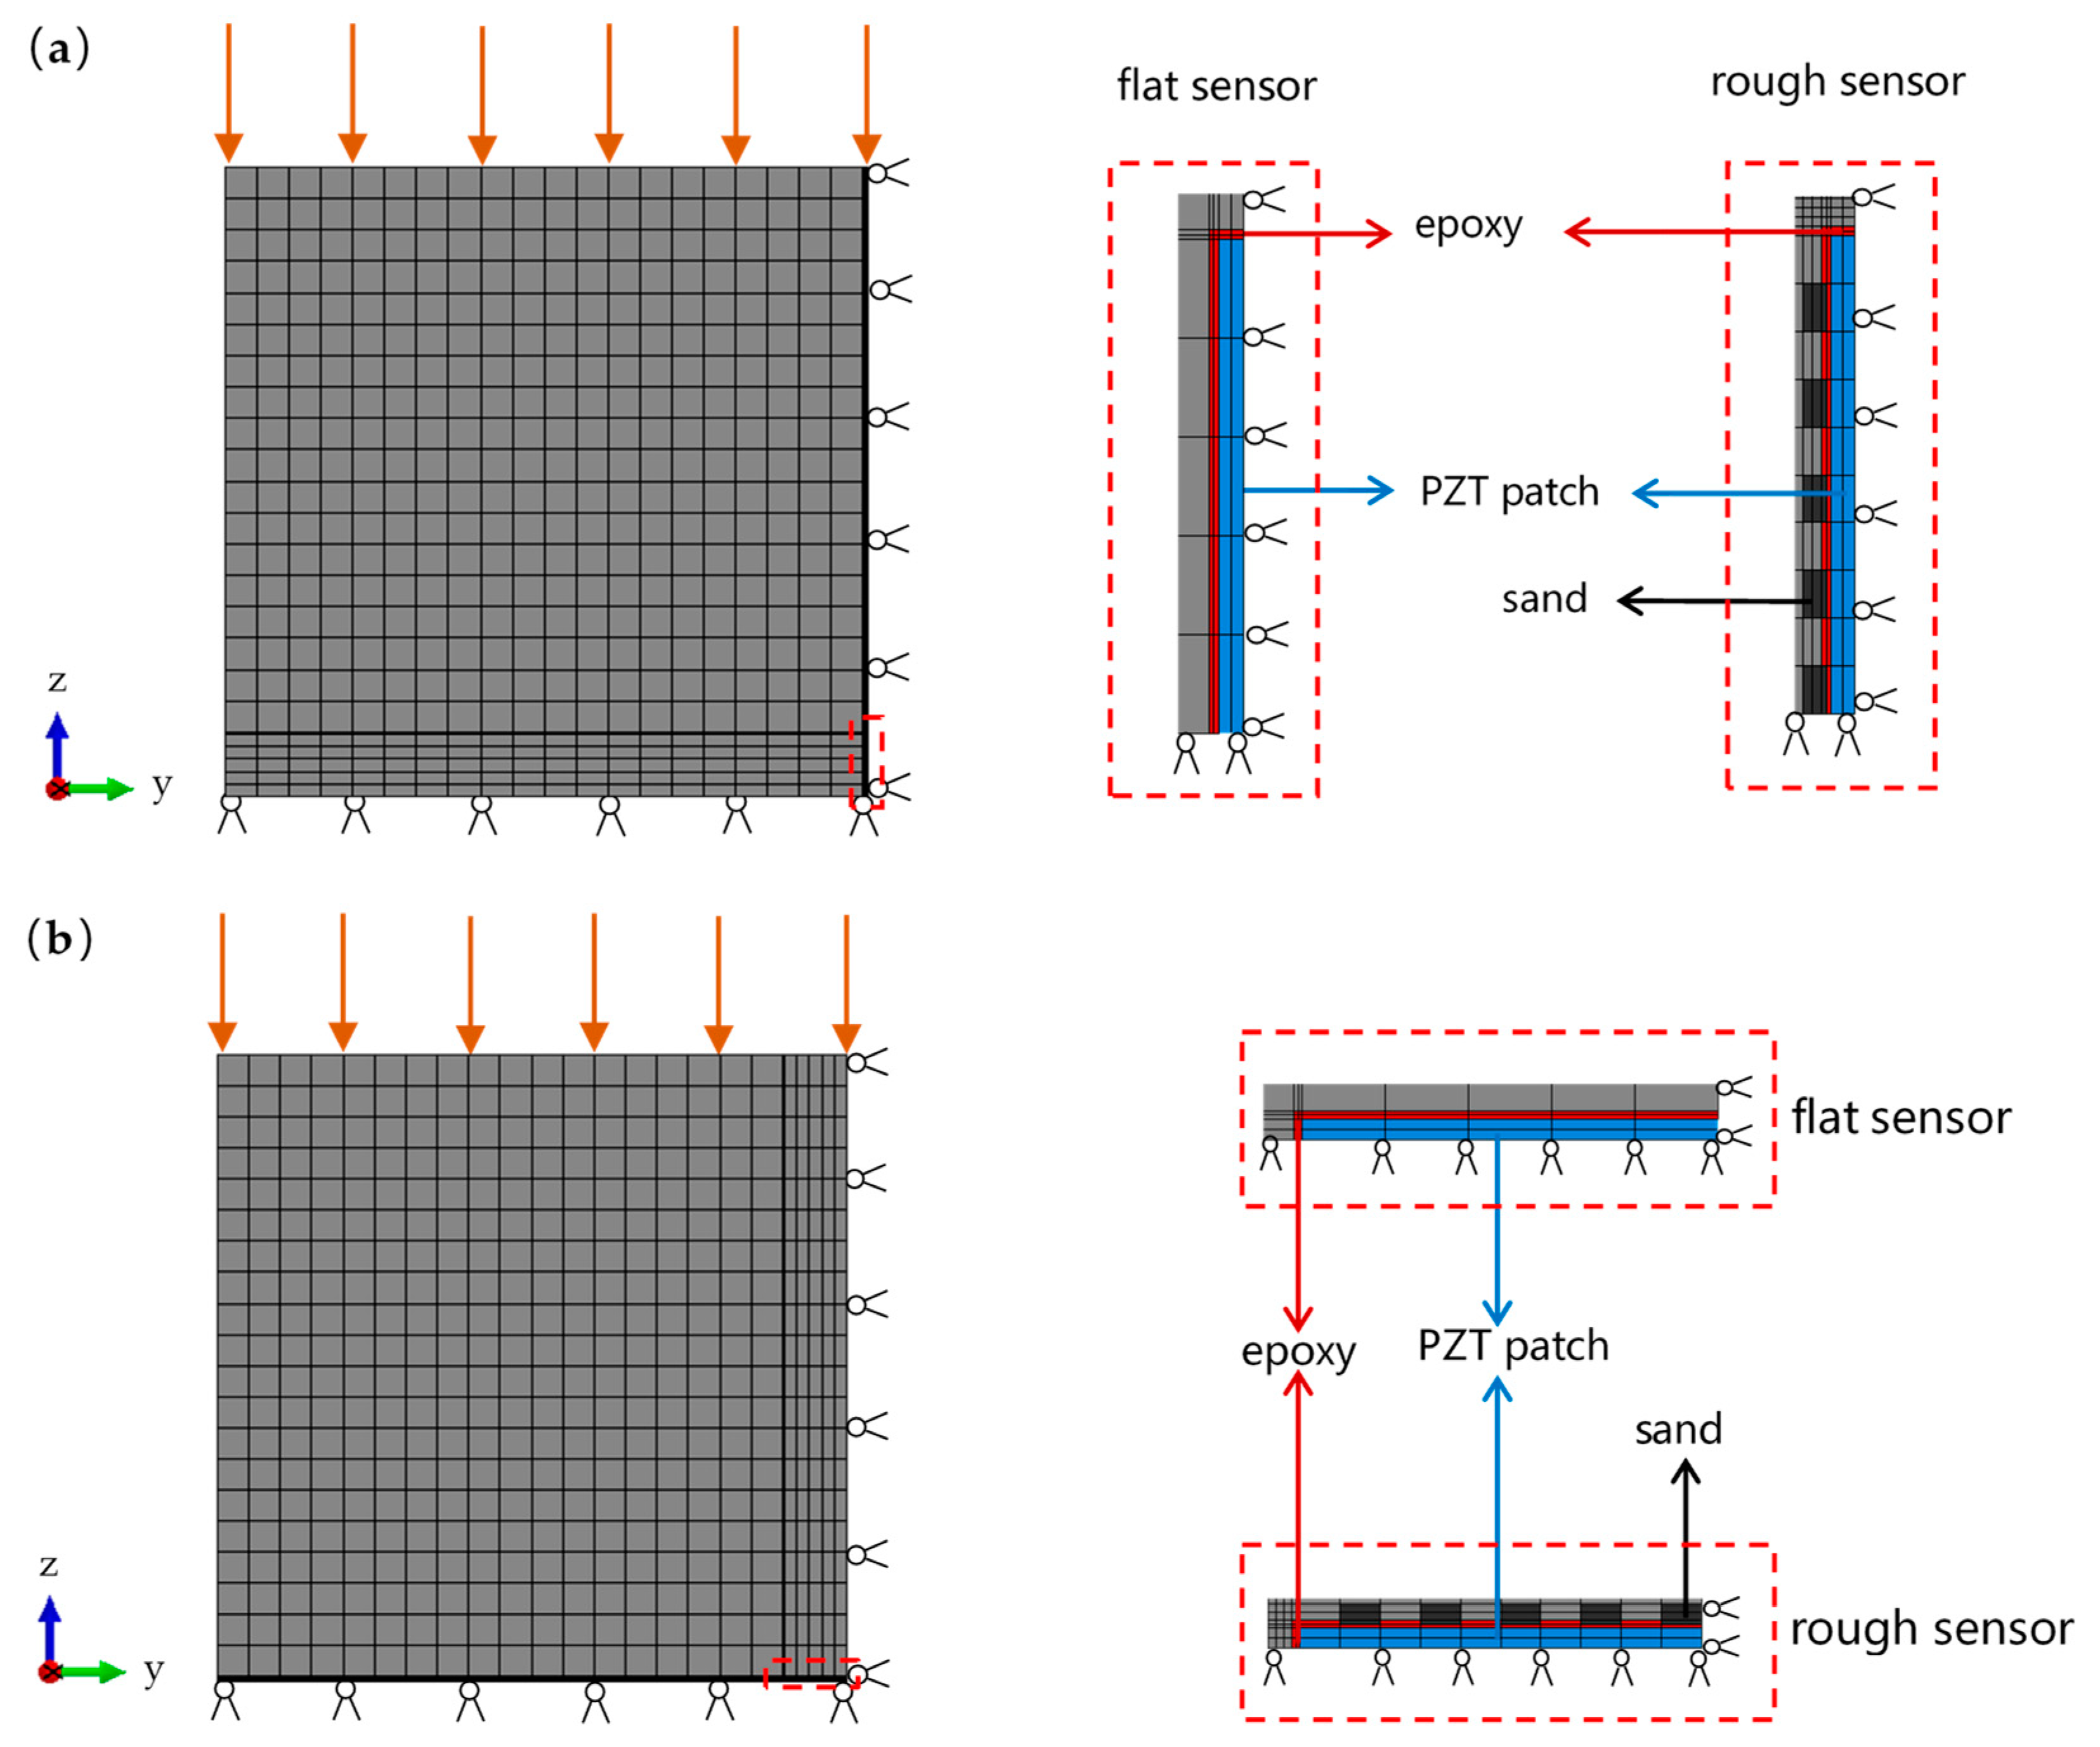
2.2. Numerical Models for PZT Sensors

The electromechanical behaviors of the PZT sensors and concrete cubes were simulated by using the finite element (FE) program ABAQUS [32,39,40]. In the FE models of typical PZT sensors, as shown in Figure 1a, PZT patches (colored in red) were encased with thin epoxy layers with a thickness of 0.1 mm (colored in blue). The dimensions of each PZT sensor were 10 mm × 10 mm × 0.5 mm. In the 3-D model, the PZT patch was modeled using the 8-node linear piezoelectric brick element (C3D8E) with a typical mesh size of 1 mm. With an identical mesh size, the epoxy layer was modeled using the reduced 8-node linear brick element (C3D8R).
In this study, all PZT patches were first packed with epoxy for waterproofing, and then polished or sprinkled with fine sand to create flat or rough surfaces before the complete hardening of epoxy packing layers. In this way, two types of sensors were fabricated with either flat or rough interfaces. With distinct interfacial roughness, the bonding effect between the sensor and concrete can be easily considered in experiments. Figure 1b shows the PZT sensors fabricated with flat and rough surfaces. In the rough PZT sensor, the sand with a particle size of 1 mm were half embedded into the epoxy layer during curing. Both the PZT patch and the epoxy are assumed to be isotropic in FE models with physical properties listed in Table 1.
To perform electromechanical analysis, a sine alternate excitation with voltage 1 V was applied to the PZT sensor along the thickness direction. Lateral displacements ( x ¯ ) of the PZT patch and periodic stresses acting on the host structure were recorded simultaneously over the sweeping frequencies and then input into Equation (3) to obtain a conductance signature. As acknowledged, the conductance is more stable than the susceptance which is sensitive to ambient temperature [41]. Thus, to reduce the temperature-induced uncertainties, only conductance signatures were utilized during electromechanical analyses throughout this work.
To verify the feasibility of the FE model, typical electrical conductance signatures were simulated and compared with that measured from the PZT sensor experimentally. Figure 2 shows the conductance signatures of a free PZT sensor obtained from both experiments and simulations. It was observed that both signatures agreed with each other satisfactorily. Compared with the numerical signature, the experimental one shows many more small peaks apart from the predominant one, reflecting the uncertainties induced by fabrication errors. Over the interested frequency range, the predominant resonance obtained numerically coincided with the experimental counterparts. This verifies the feasibility of the numerical model for capturing the electromechanical properties of the PZT sensor.

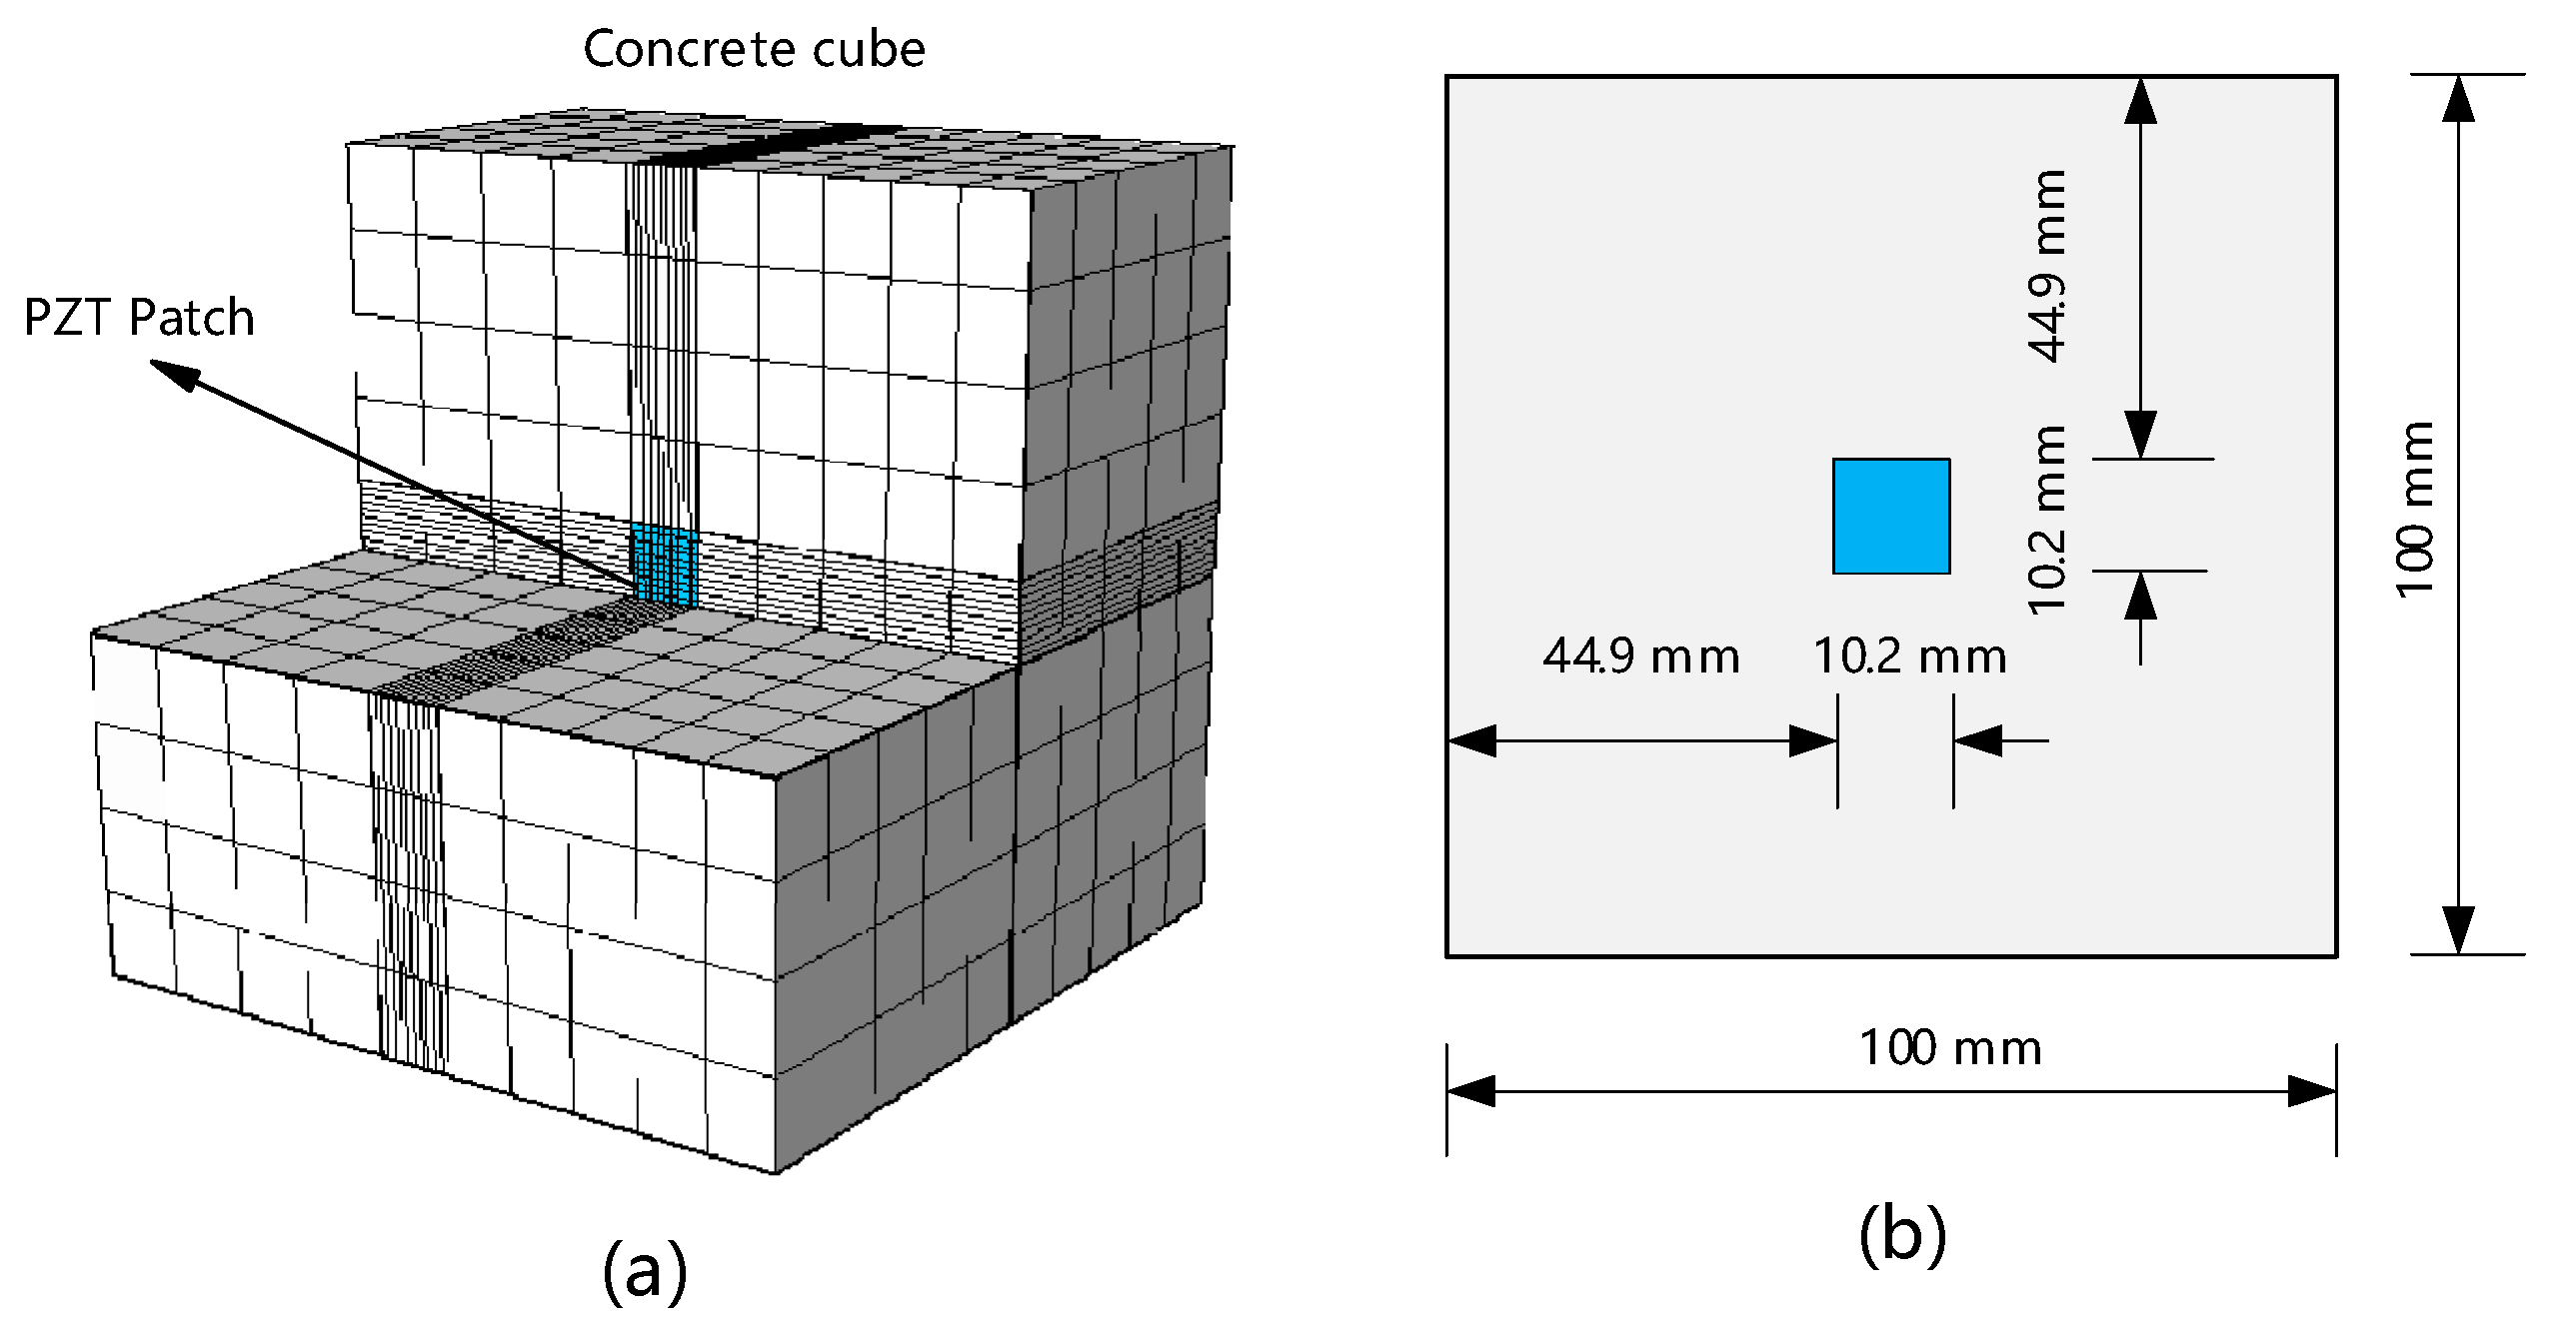
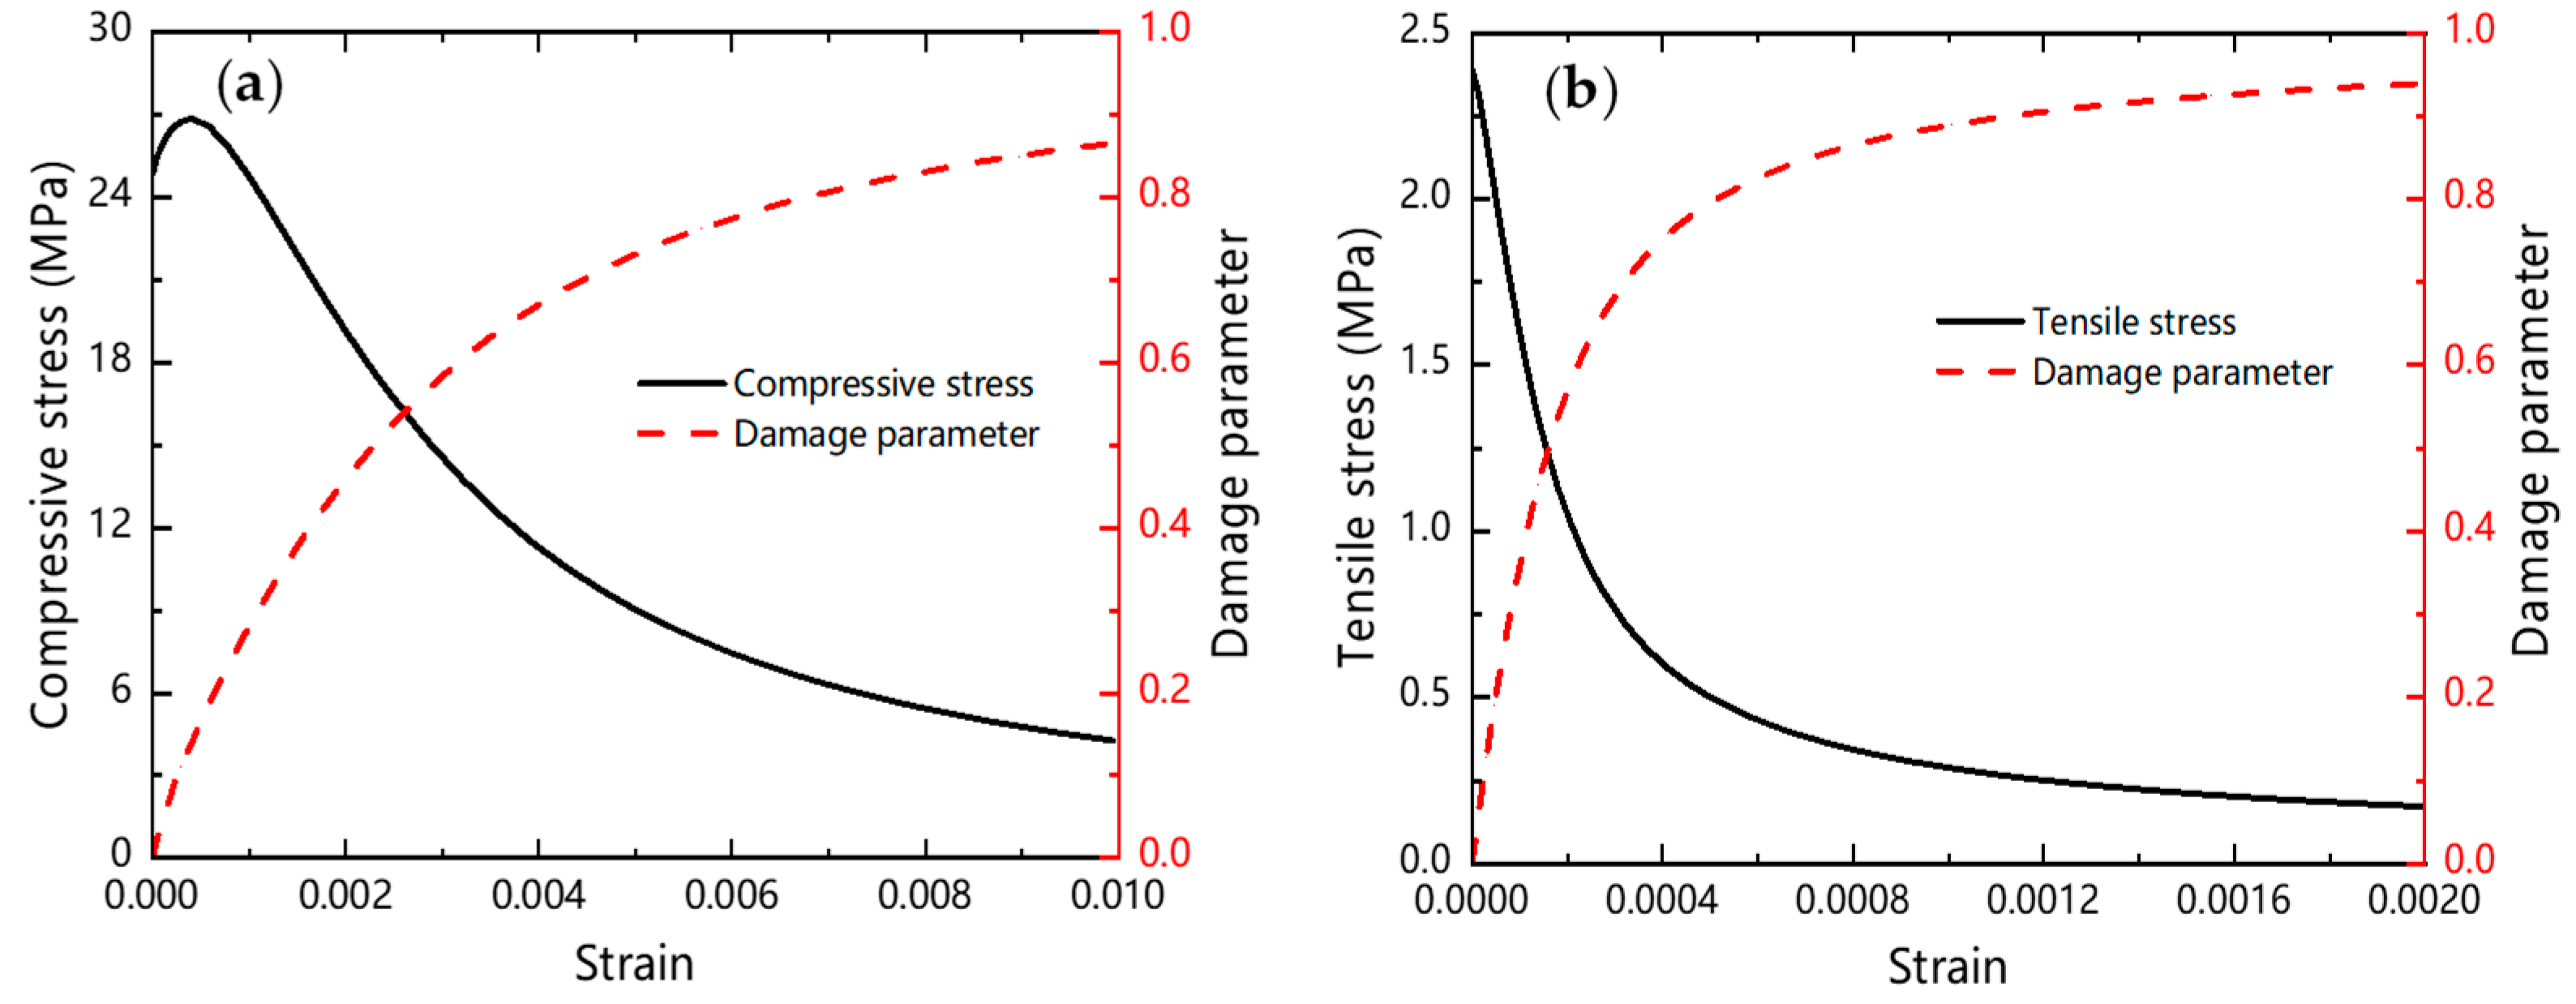
2.3. Numerical Models for Concrete Cubes

The typical model of concrete is a 3-D cube with a dimension of 100 mm embedded with a PZT sensor at the center, as shown in Figure 3a. Figure 3b presents the detailed dimensions of the model. In this model, the C3D8R elements are built for concrete surrounding the PZT sensor with a typical mesh size of 1 mm and for other concrete with a mesh size of 10 mm. To save computational cost, the concrete elements are directly tied with the epoxy layer during the electromechanical analyses. While in the static analyses, an additional contact interaction, instead of tie interaction, is introduced between the epoxy layers and their surrounding concrete. The contact interaction is set to be hard along the normal direction and frictional along the tangential direction with a friction coefficient of 0.5.
To verify the mechanical behavior of the FE model, static analyses were conducted numerically on concrete cubes under uniaxial compression. With the bottom surface fixed to the ground, a compressive displacement was applied to the cube’s top surface at a very slow velocity. The concrete damaged plasticity (CDP) model, proposed by Lublinear et al. (1989) [42] and developed by Lee et al. (1998) [43], was usually adopted for the static analysis of concrete when plastic deformation and stiffness degradation were considered. Herein, the CDP constitutive model was utilized to describe the damage behavior of concrete beyond yielding.
In this study, the damage parameters (dc and dt) were introduced to describe the inelastic behavior of concrete. It was suggested by Chinese code (GB 50010-2010) that the stress–strain relationships of concrete under uniaxial compression and tension can be expressed as follows:
σ c = 1 d c E o ε c
σ t = 1 d t E o ε t
where dc and dt are the damage evaluation parameters of concrete under uniaxial compression and tension, respectively; Eo is the elastic modulus; ε c and ε t denote the engineering strain under compression and tension, respectively. From Equations (5) and (6), the nominal stresses and plastic damage parameters versus the engineering strain of a typical concrete cube under compression and tension can be obtained, as shown in Figure 4a,b, respectively.
Based on the aforementioned CDP model, the compressive stress of the concrete cube under loading can be calculated. As shown in Figure 5, the compressive stress increases linearly with the compressive displacement below 0.07 mm. As the displacement increases beyond 0.07 mm, the slope of the stress-displacement curve starts decreasing and the peak point, 31.5 MPa, is reached at the displacement of 0.175 mm. After the peak point, the compressive stress decreases monotonously until the cube is crushed at the ultimate displacement of 0.35 mm. This numerically obtained curve is found to be consistent with the experimentally measured results [44].

2.4. Experimental Setup and Specimens

All specimens were fabricated following the mix proportions of the C40 concrete suggested by Chinese specifications, as listed in Table 2. Fly ashes with a certain dosage were added as admixtures for achieving better workability of concrete paste. To reduce uncertainties during the fabrication, crushed stones with sizes ranging from 5 mm to 20 mm are used as coarse aggregates, and all specimens were cured in the same controlled environment (temperature = 25 °C, moisture = 95%) and tested following the same loading procedure. In each specimen, a fabricated PZT sensor was positioned in the cube center with a specific installation angle, 90°or 0°, between the normal direction of the PZT and the loading direction. For each installation orientation, three specimens were cast to take the fabrication uncertainties into account.
After preparation, uniaxial compressive loadings were applied on test cubes by using a servo-hydraulic machine (YAS-5000) with the repeated 12 loading steps. For each step, the compressive force was increased progressively at a rate of 2.5 kN/s for 5 s and then held constant for another 60 s. The conductance signatures of the embedded PZT sensors were recorded using an impedance analyzer (TH-2839) every 25 kN. Under the small loadings, the test cubes deformed elastically. Table 3 lists the mechanical properties of the concrete specimens. According to the Chinese code for the design of concrete structures (GB 50010-2010), the cube compressive strength of C40 concrete (fcu,k) is 40 MPa. The standard cylinder compressive strength (fck) and tensile strength (ftk) for the tested C40 concrete can thus be calculated to be 26.75 MPa and 2.41 MPa, respectively.
As the compressive loadings increased beyond 150 kN, minor cracks nucleated from lateral surfaces, propagated dramatically under the ultimate loading of ~390 kN (with nominal stress at ~39.0 MPa) until the specimen was eventually crushed. Figure 6a illustrates the simulated damage parameters (SDEGs) of the test cube at the failure point. The damage behaviors obtained numerically are consistent with the failure behaviors (spalling and crushing) in experiments, as shown in Figure 6b. This verifies the ability of the FE model to capture the inelastic mechanical behaviors of the test cubes under compressive loading.

3. Results and Discussion

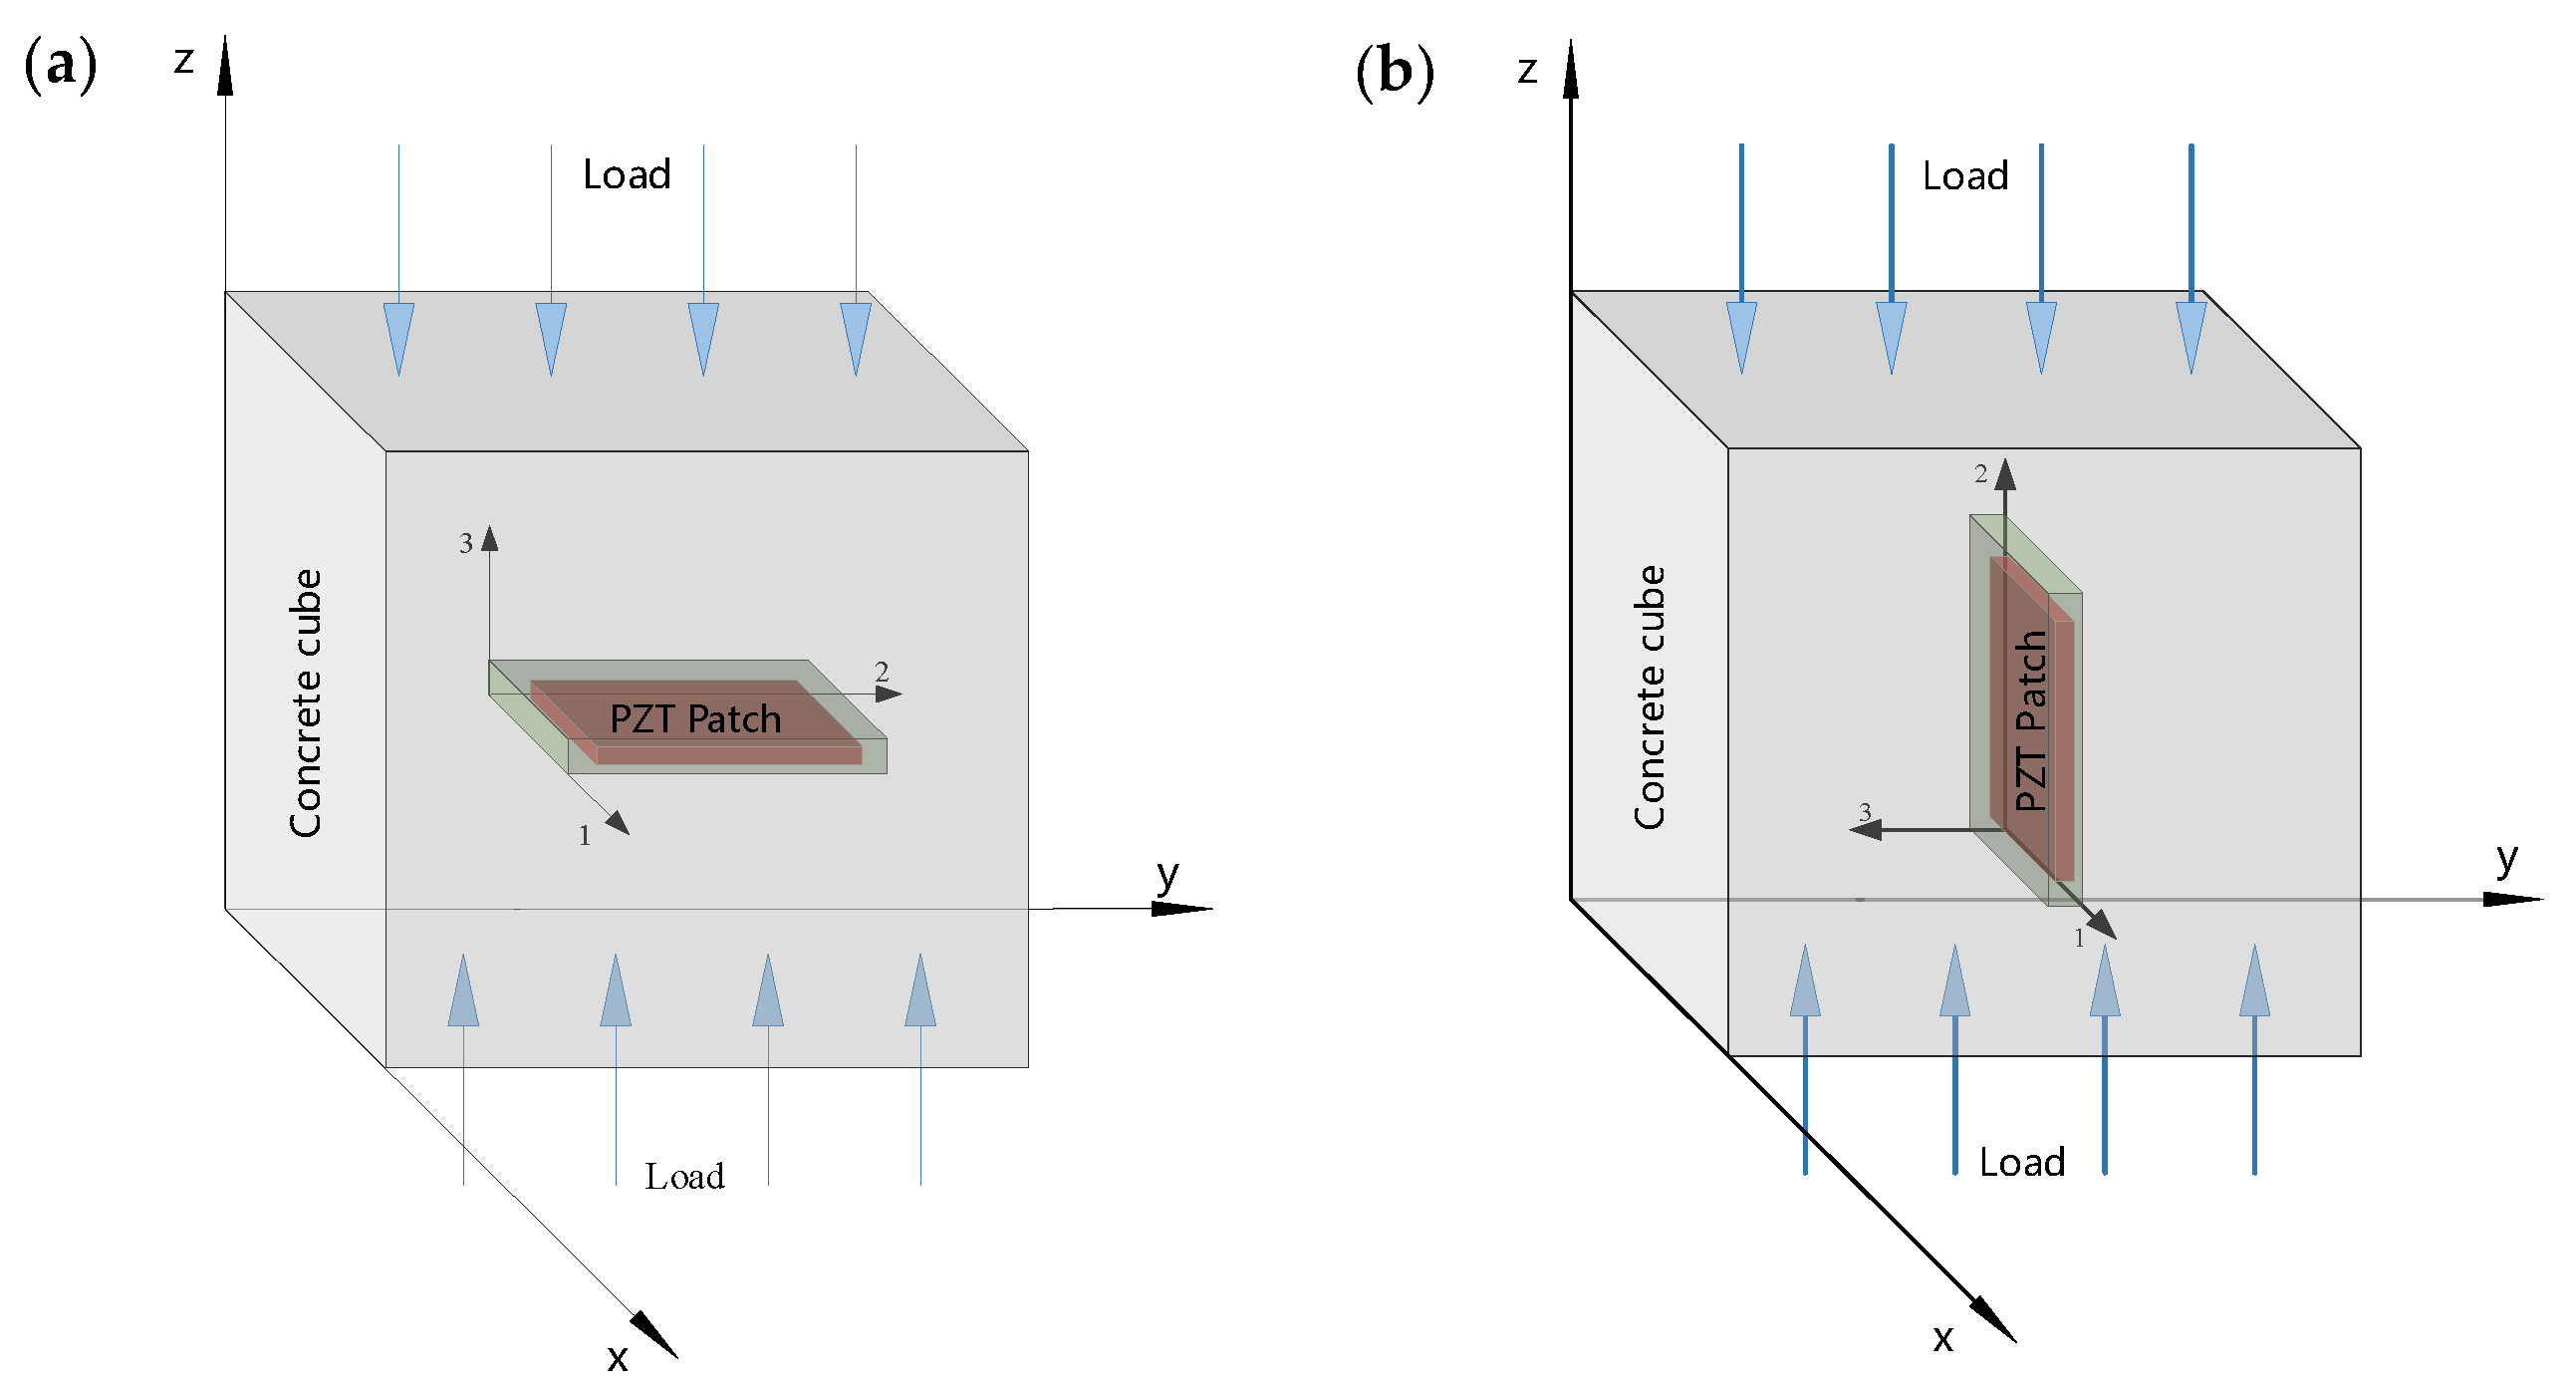
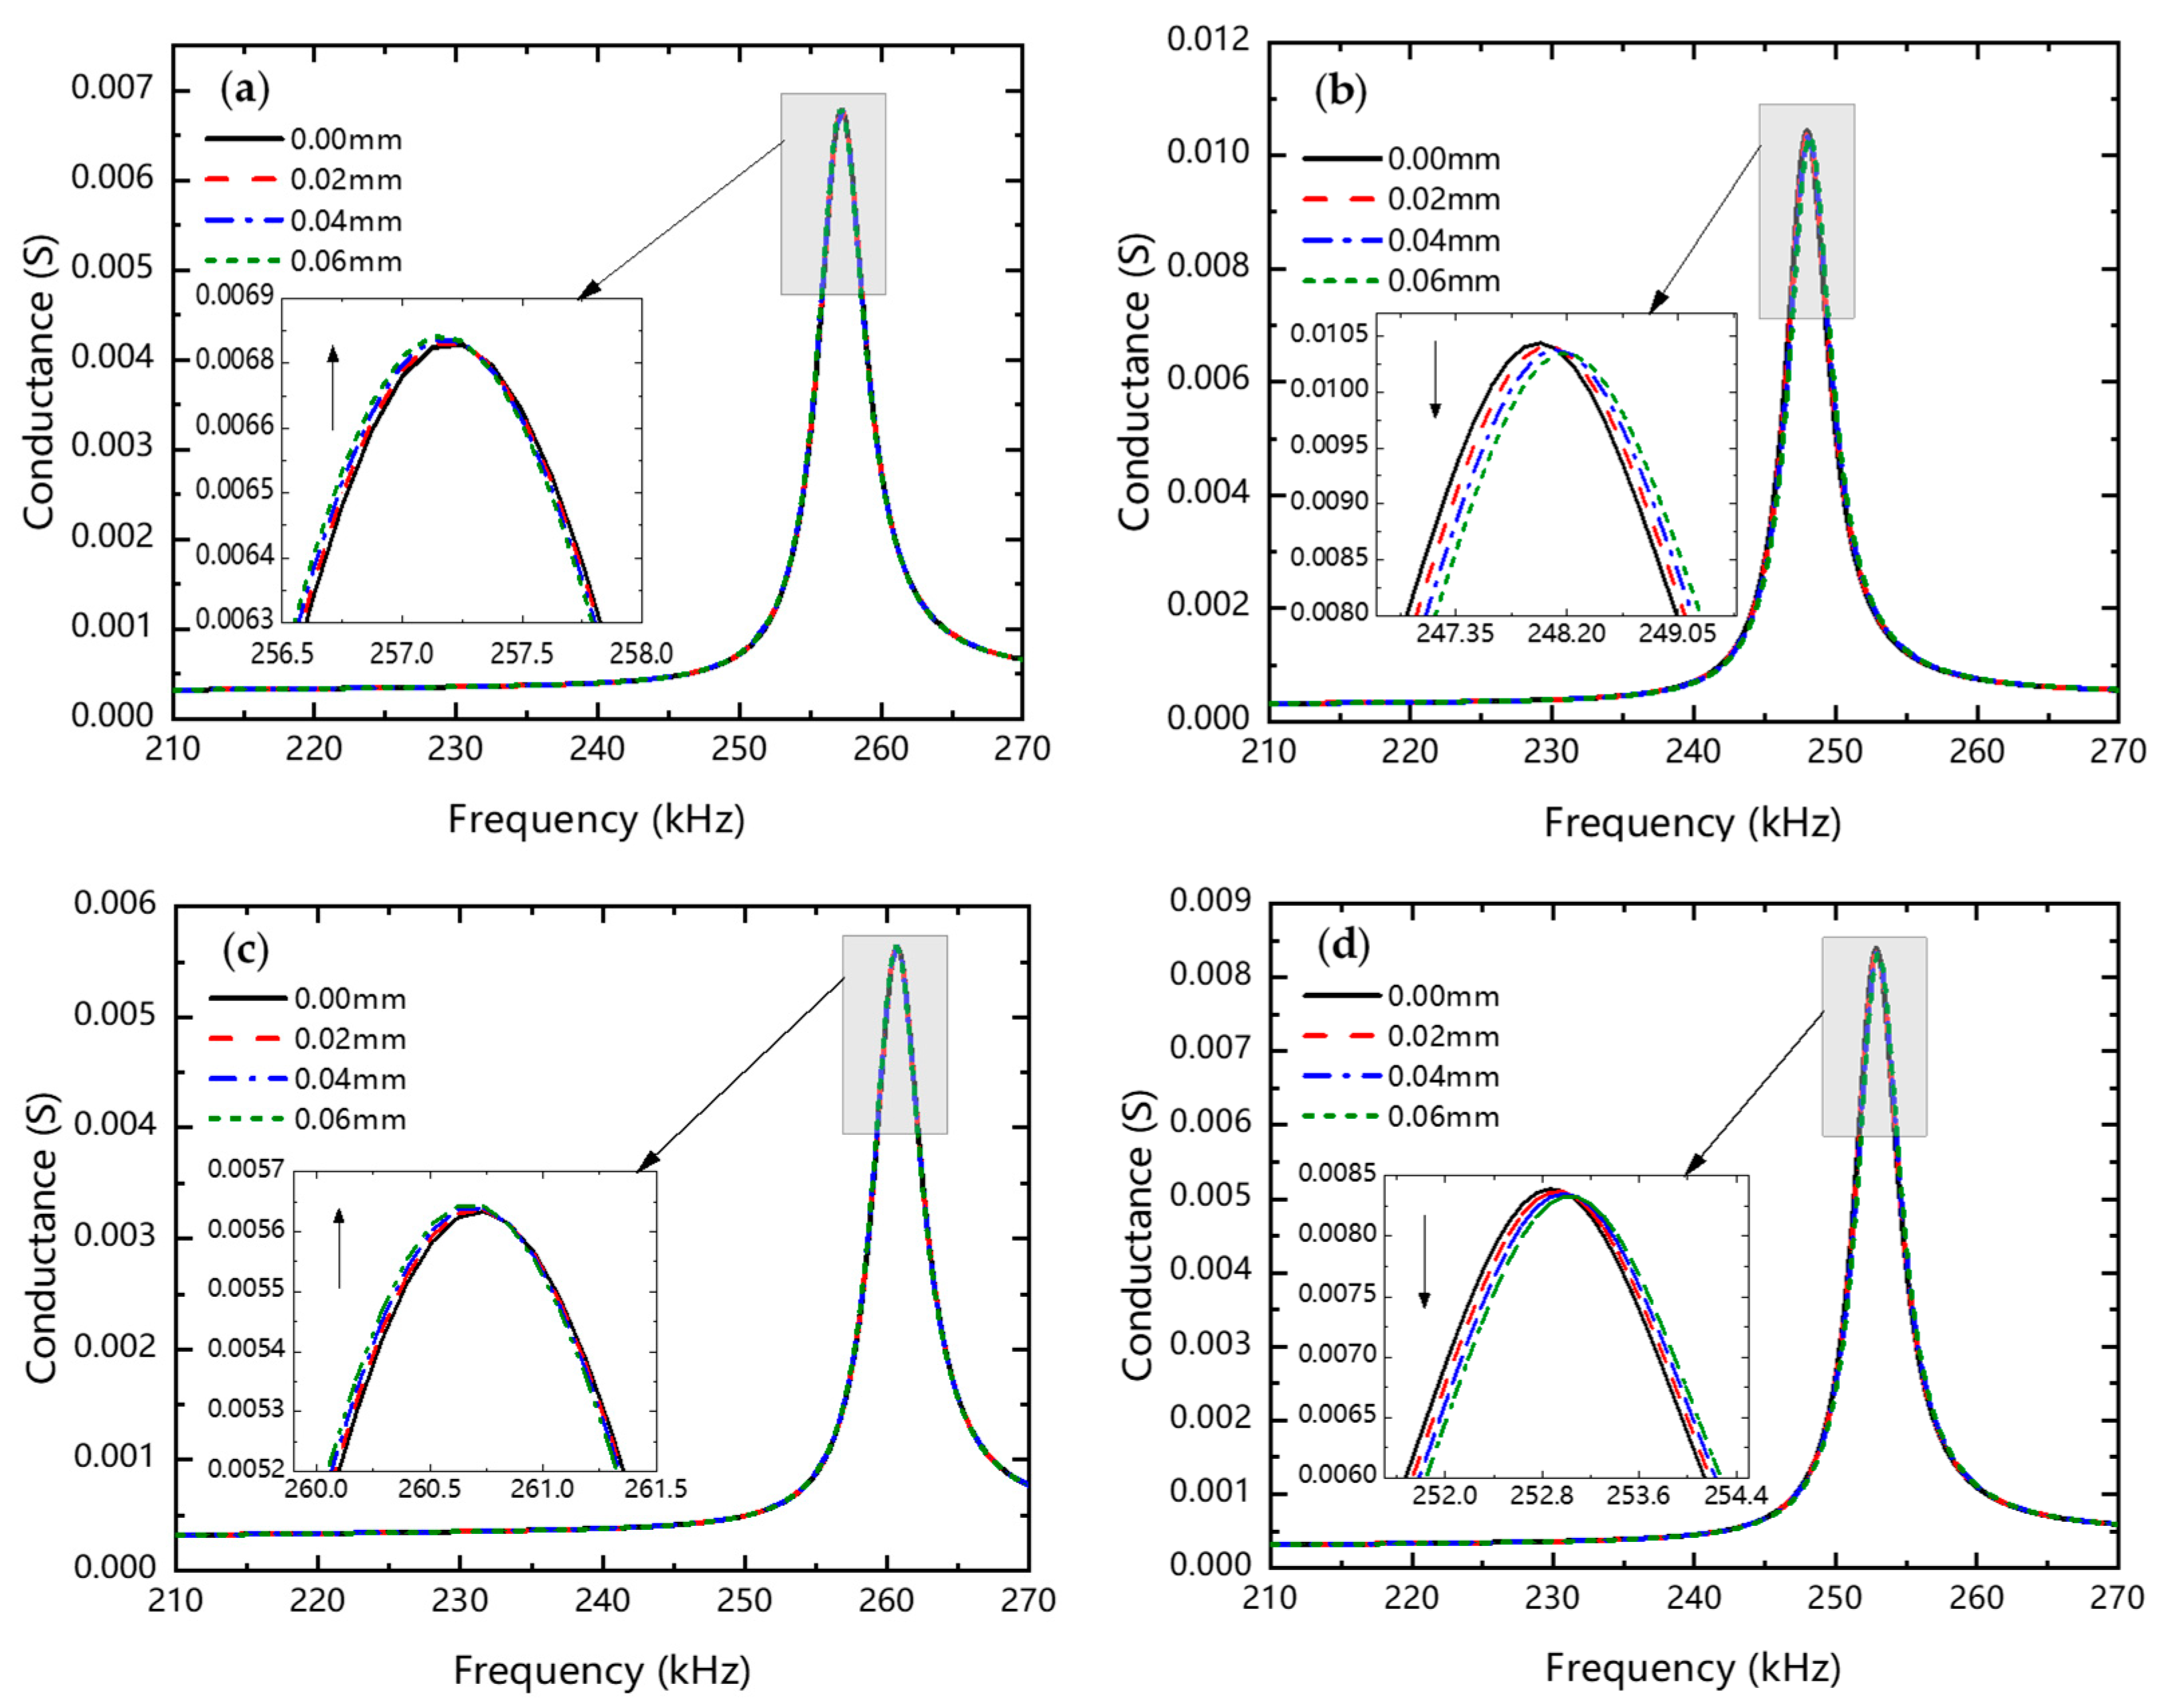
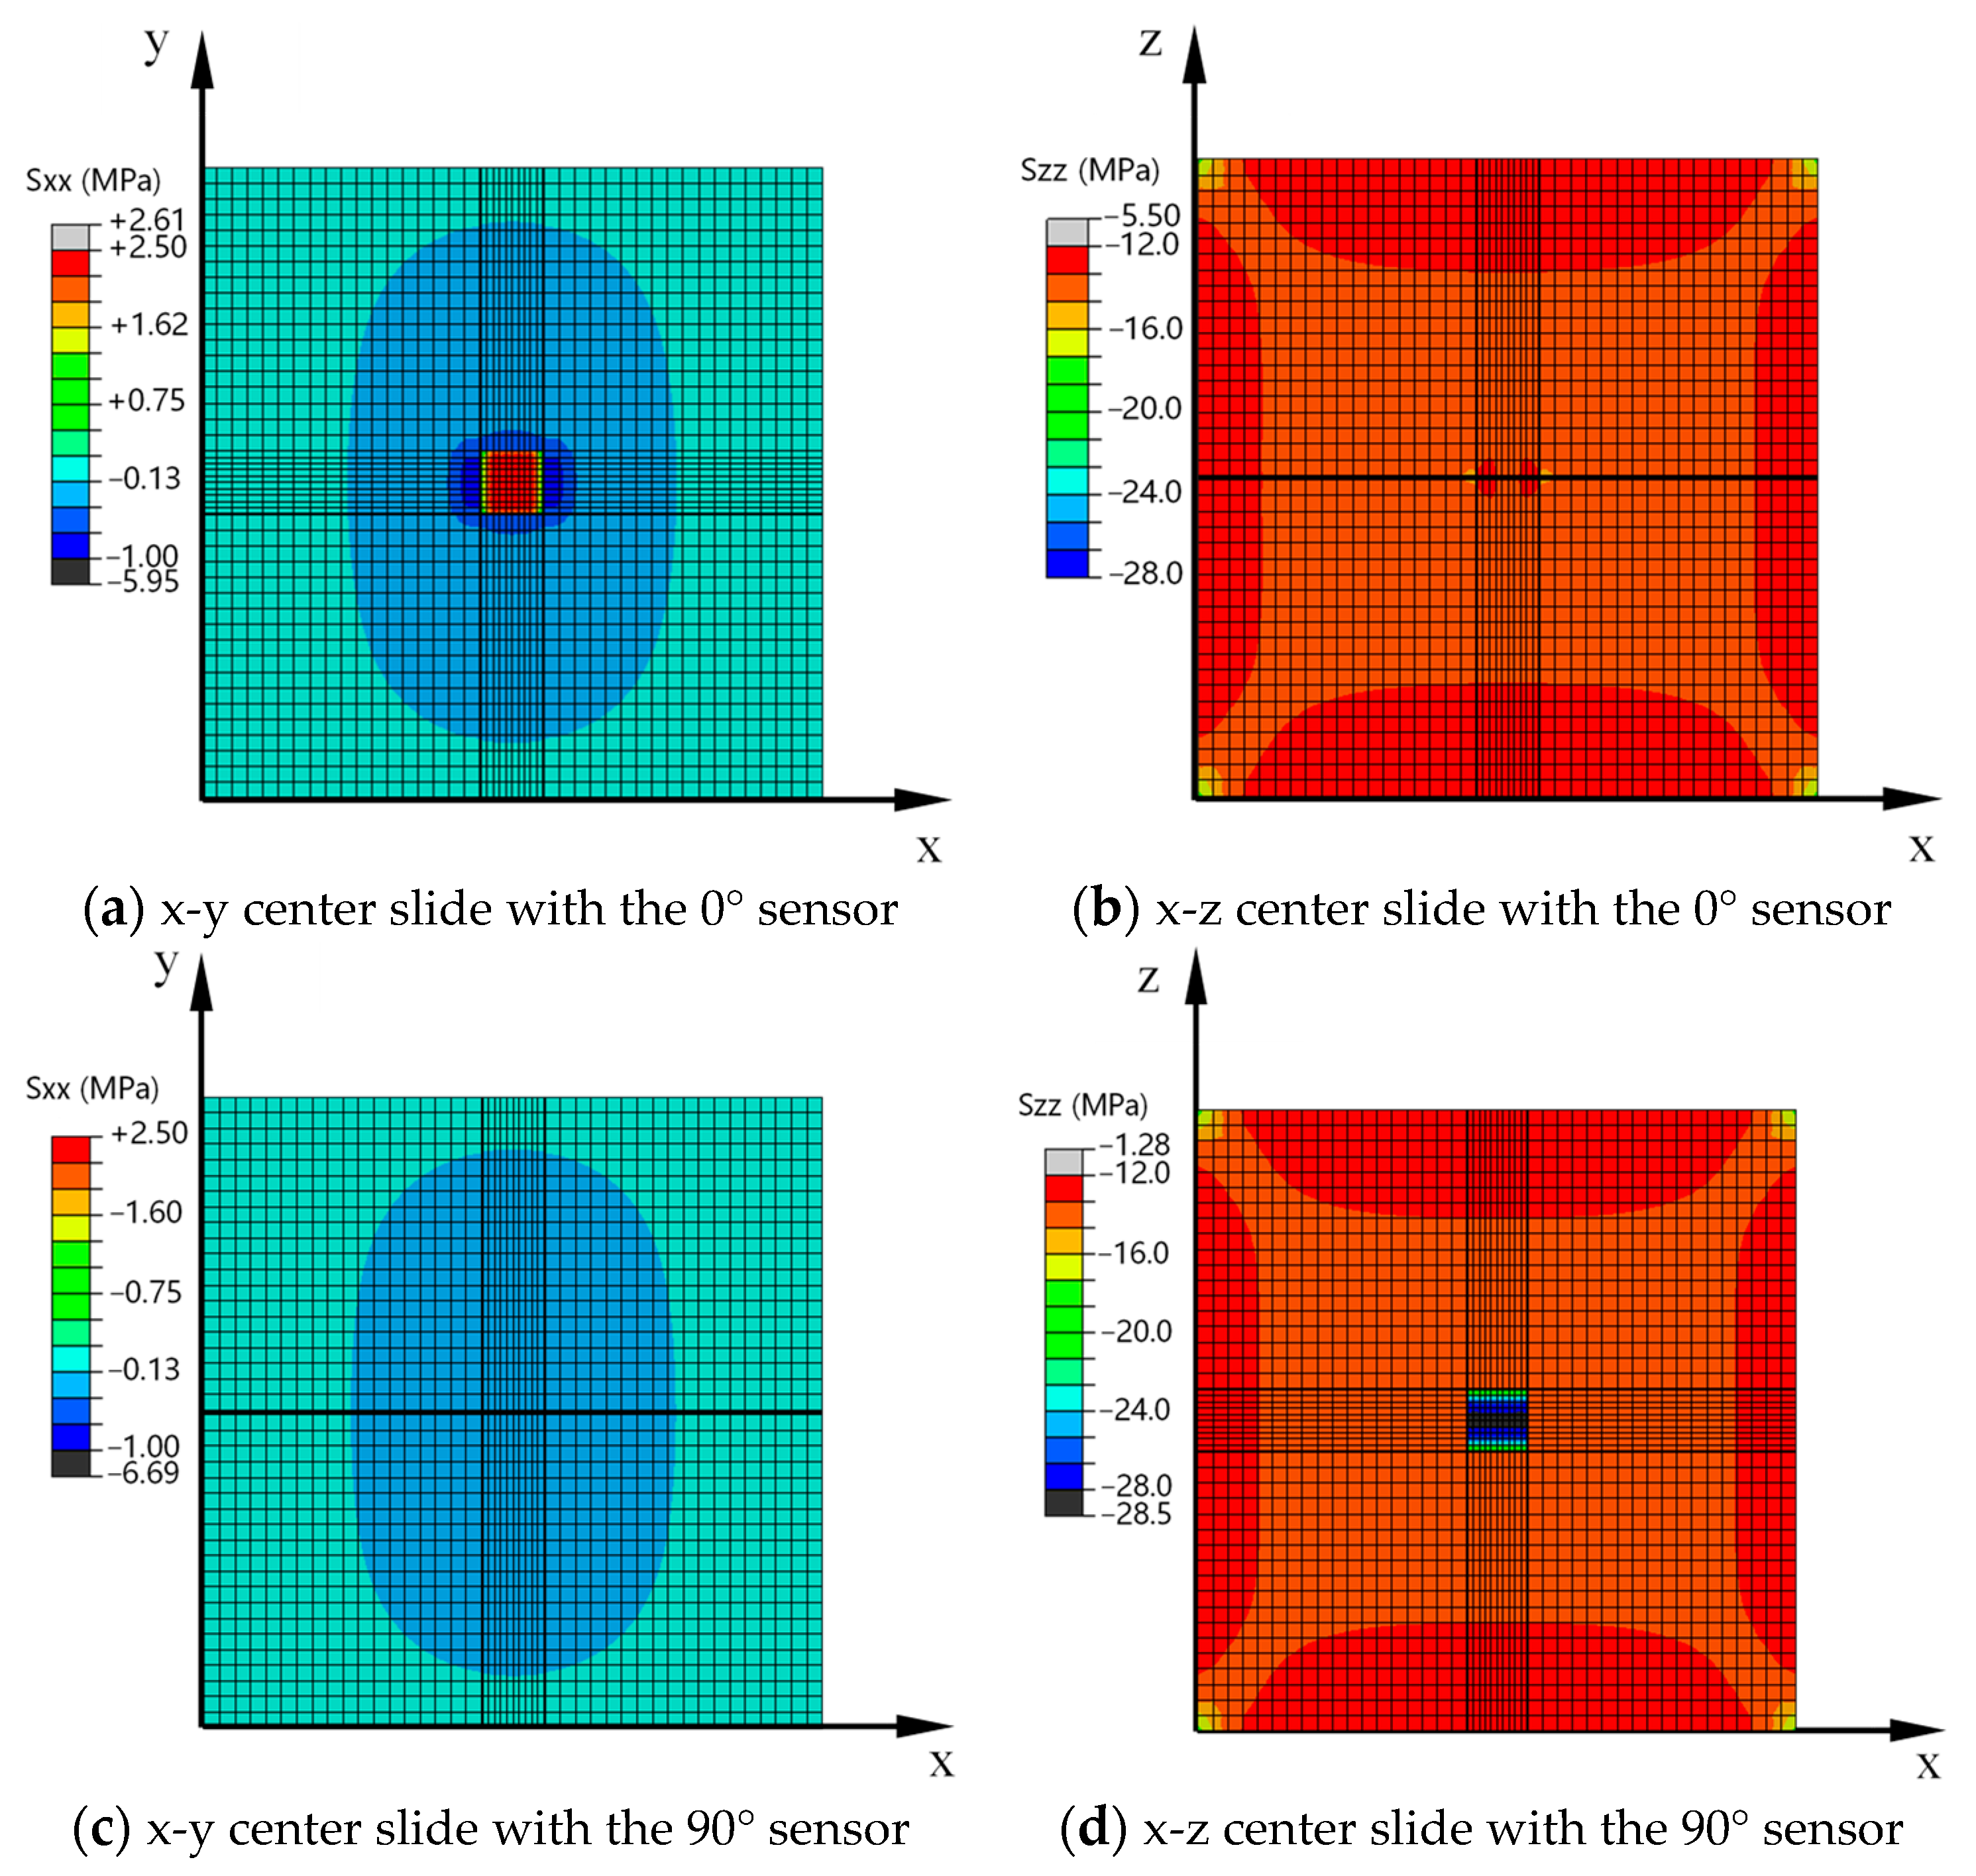
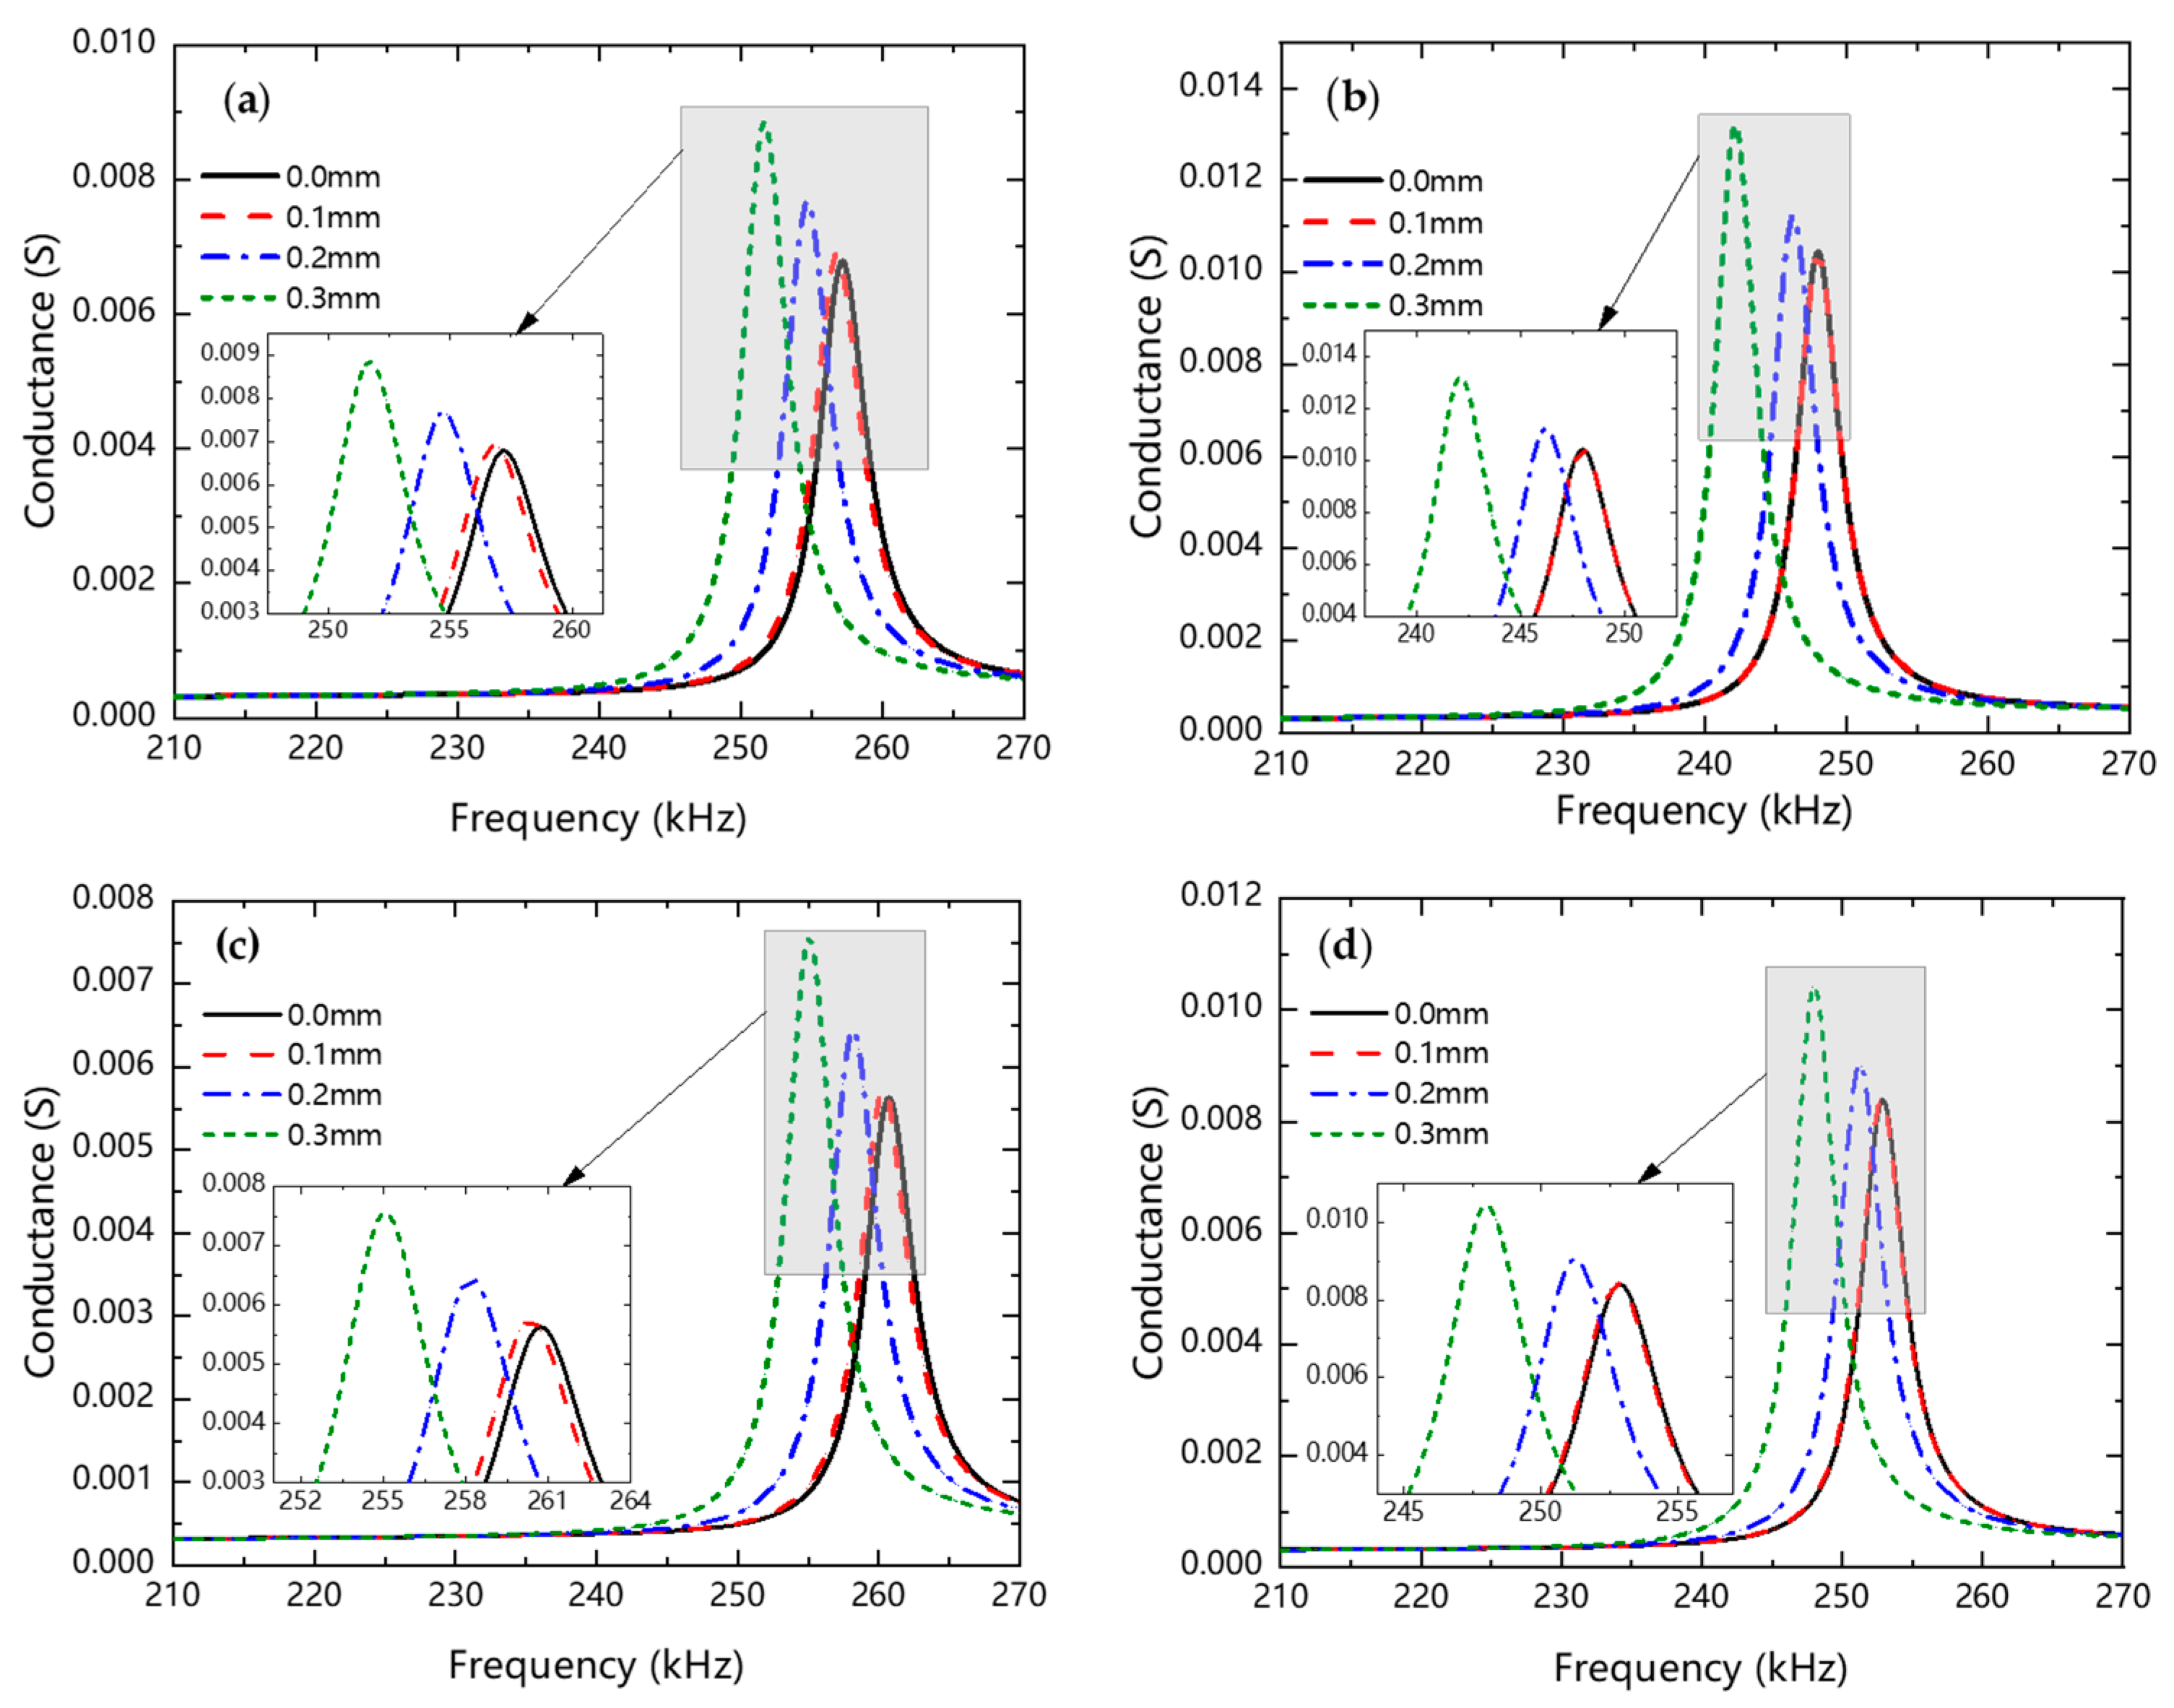
3.1. Effect of Installation Orientation on the Sensitivity of Embedded Sensors

In this work, the electromechanical coupling of the PZT sensor was transversely isotropic along the thickness (the ‘3’ direction in Voigt notation), implying that the d31 equals the d32. By applying the alternate voltages across the thickness, the planar extension vibration will be actuated along the other two directions with identical amplitude. Simultaneously, the vibration along the PZT thickness direction will also be actuated if the piezoelectric strain coefficient d33 is not zero [45,46]. Considering that the d31 is much larger than the d33, the planar vibration dominates, and thus the installation configuration may remarkably affect the stress sensitivity of the PZT sensors [47,48]. According to the relative angles between the loading direction (the z-z direction in Cartesian coordinates) and normal of the PZT vibration plane (the ‘3-3’ direction), two typical positions of the PZT patches were considered herein, i.e., 0° and 90°, as illustrated in Figure 7a,b, respectively.
Figure 8a,b shows the conductance signatures numerically obtained from specimens embedded with the 0° and 90° flat PZT sensors, respectively. For comparison, Figure 8c,d shows the signatures from specimens with the 0° and 90° rough PZT sensors, respectively. As the compressive displacement increases from 0 to 0.06 mm, all specimens deform elastically. During the elastic deformation, only a single conductance peak is observed in each signature over the narrow frequency range from 220 kHz to 270 kHz, and the frequency shift of the conductance peaks can be negligible. However, it can be noted that the conductance peak amplitude for the 0° PZT sensor increases with loading, while the peak for the 90° PZT sensor decreases with loading. The opposite changing trends due to installation orientation can be attributed to Poisson’s effect on concrete. With Poisson’s ratio of 0.2 in concrete, the compressive strain in concrete cubes along the z-z loading direction is relatively larger than that of the extension strains along the x-x and y-y directions.
For cubes with 0° PZT sensors, the PZT extension plan coincides with the x-y center slide. As shown in Figure 9a, the compressive stresses on PZT edges are around 1.0 MPa, which are much less than that (~13.5 MPa) normal to the PZT extension plan, as shown in Figure 9b. The small stresses on the edges in the x-y center slide will not limit the extension vibration of the PZT patch effectively, leading to the increasing conductance peak with loading displacement, as illustrated in Figure 8a.
Whereas for the cube with a 90° PZT sensor, the compressive stresses on the top and bottom PZT edges in the x-z center slide are around 20 MPa, as shown in Figure 9d, which are much larger than that (~0.5 MPa) on the left and right PZT edges in the x-y center slide, as shown in Figure 9c. The large compressive stresses on the top and bottom edges can limit the planar vibration of the PZT patch along the loading direction, and thereby decrease the conductance peak with loading displacement, as shown in Figure 8b. It is also noted that the decrement of conductance peaks in the 90° PZT case is about 6.5 fold that of the increment of conductance peaks in the 0° PZT case. This means that the sensitivity of the 90° sensor is preferred for concrete stress monitoring in specimens under elastic deformation.
Figure 10a,b shows the typical conductance signatures numerically obtained from specimens embedded with the 0° and 90° flat PZT sensors, respectively. For comparison, Figure 10c,d shows the signatures from specimens with the 0° and 90° rough PZT sensors, respectively. For all specimens, similar upward and leftward peak shifts can be observed in conductance signatures as their loading displacements increase from 0.1 mm to 0.3 mm. For each specimen under the inelastic deformation, peak frequencies shift leftward at around 5 kHz, and conductance amplitudes increase around 0.002 s. This indicates that the sensitivity of the PZT sensors is almost independent of the installation orientation for concrete damage assessment. This insensitivity of the embedded PZT sensor to the installation orientation can be explained by the damage parameters of surrounding concrete around the PZT sensors.
Figure 11 shows the SDEG contours of the x-y and x-z center slides of concrete cubes under the inelastic deformation of 0.2 mm along the z direction. For both the 0° and 90° PZT sensors, even regardless of the interfacial roughness, similar SDEG distributions are observed in the corresponding x-y and x-z center slides. This further confirms the insensitivity of the PZT sensor to the installation orientation, demonstrated by the nearly identical conductance peak shifts observed in Figure 10.

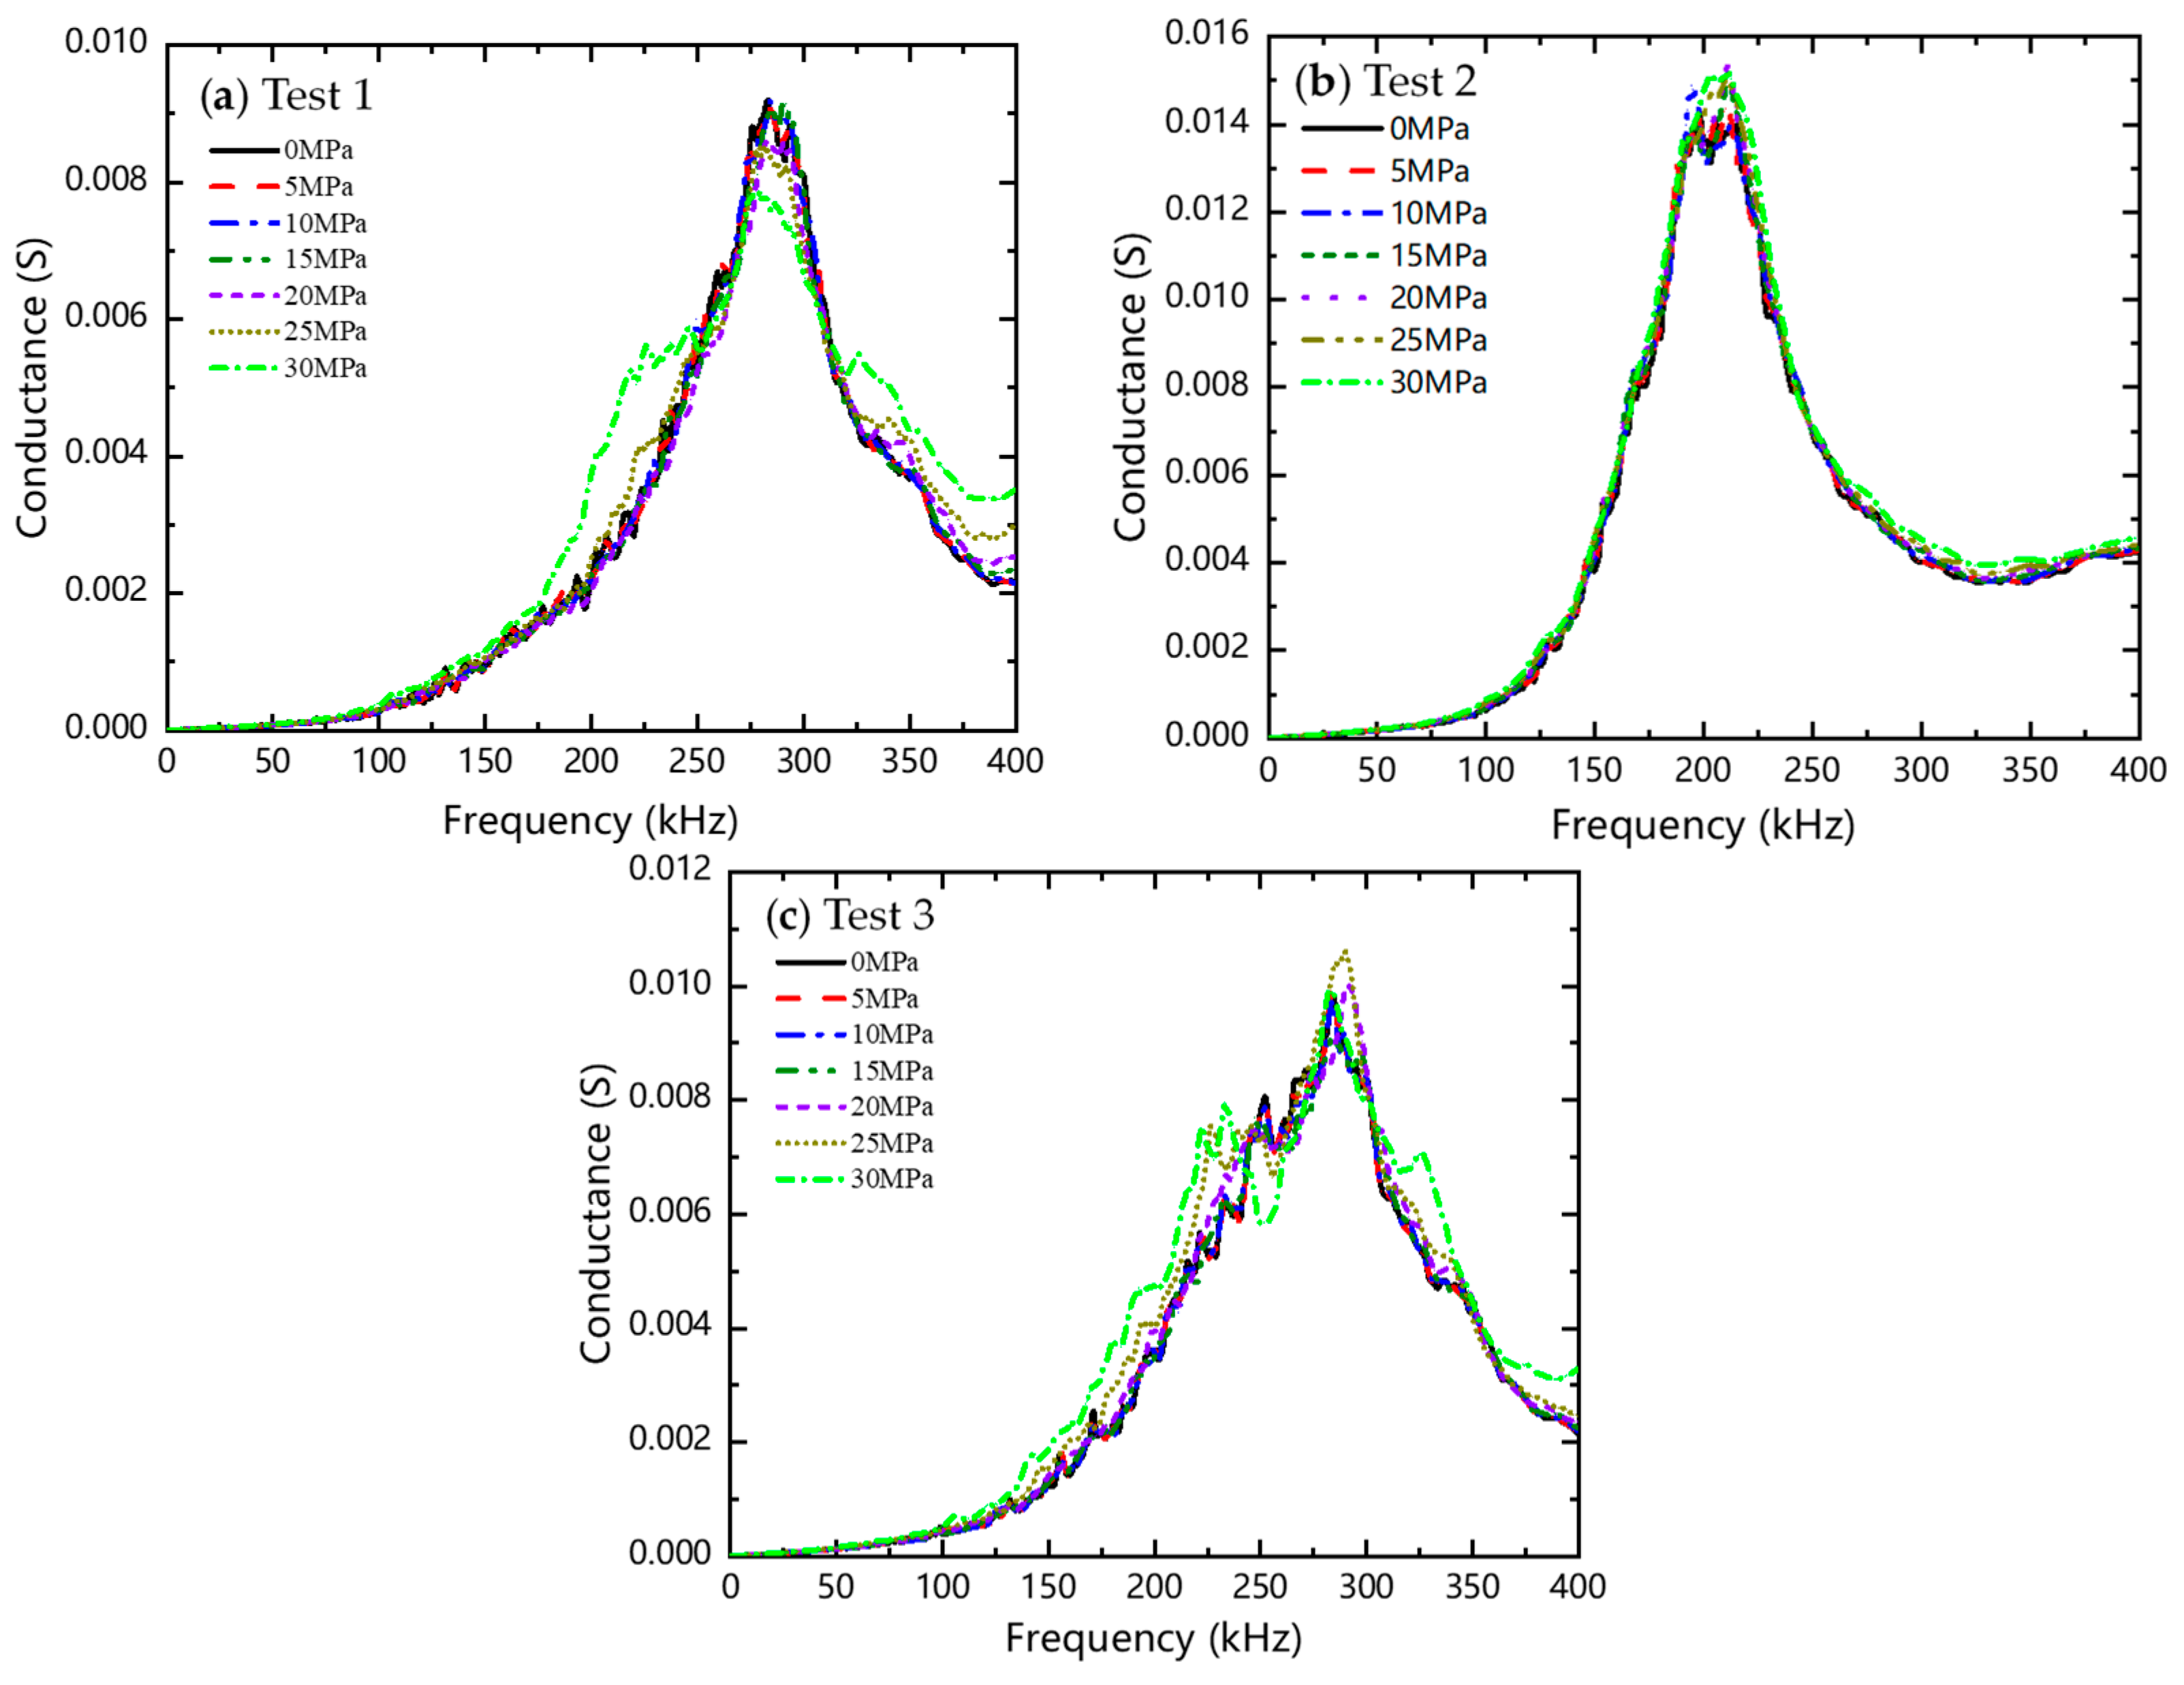
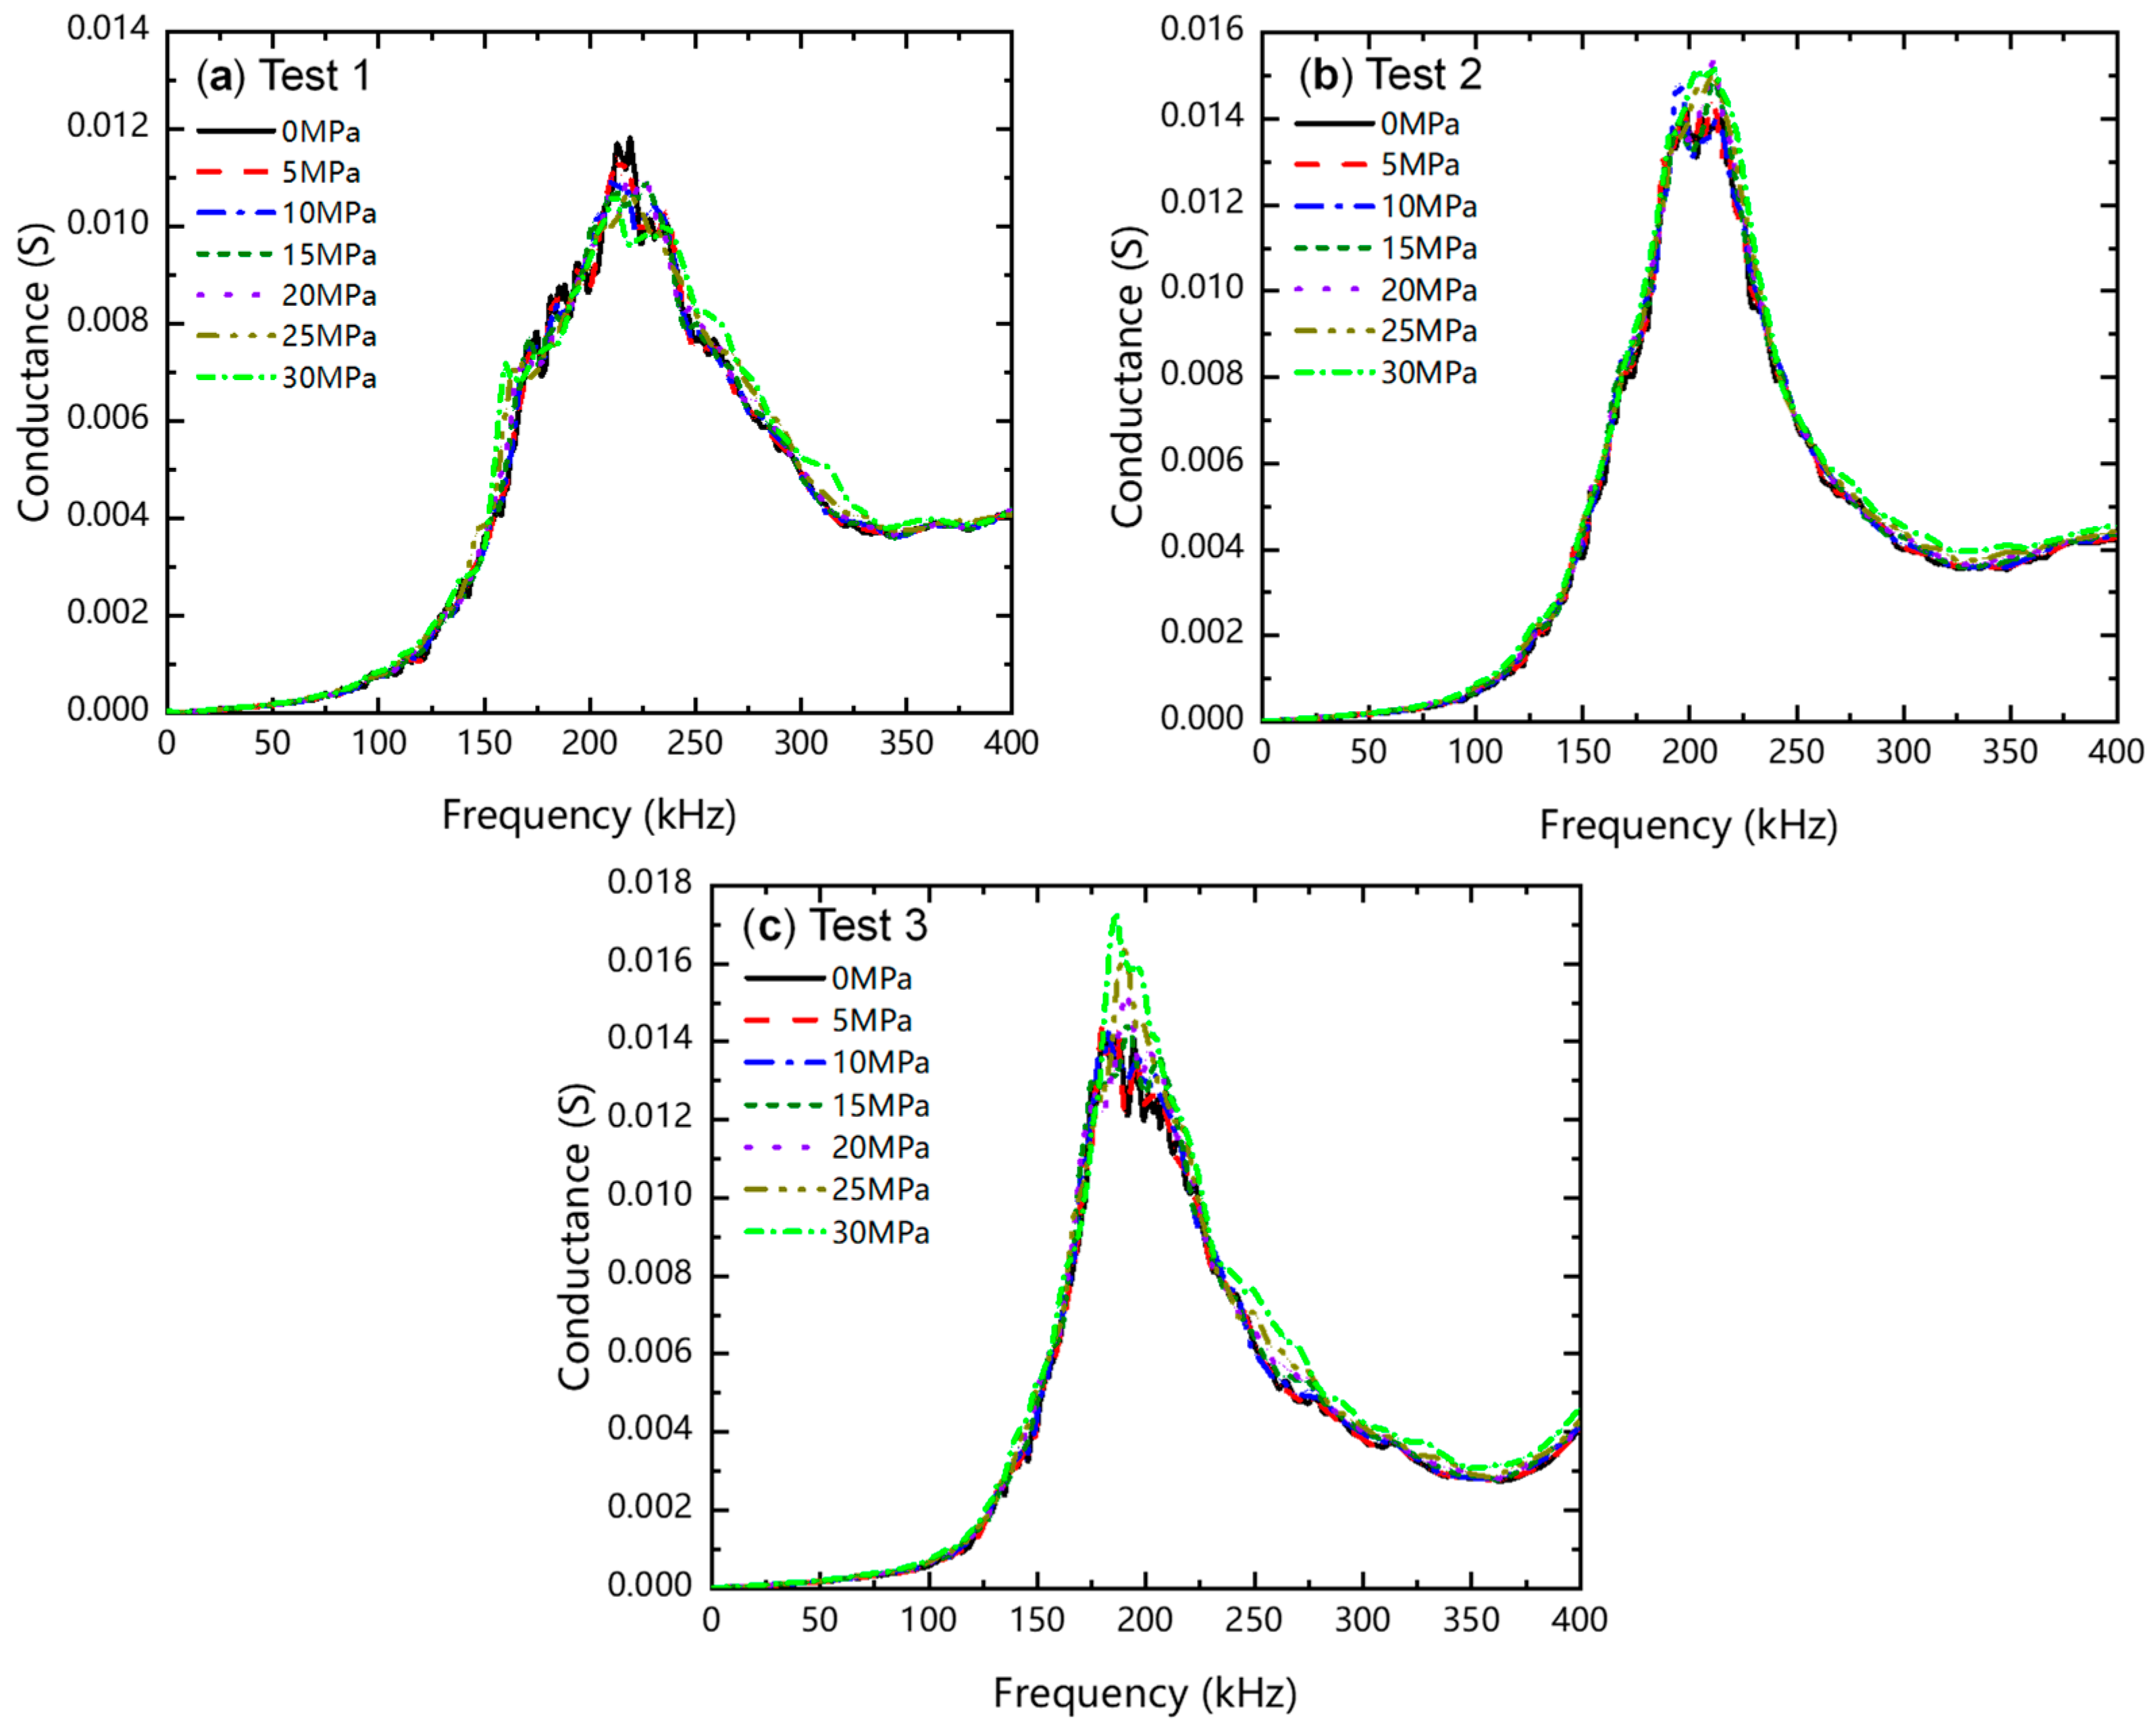
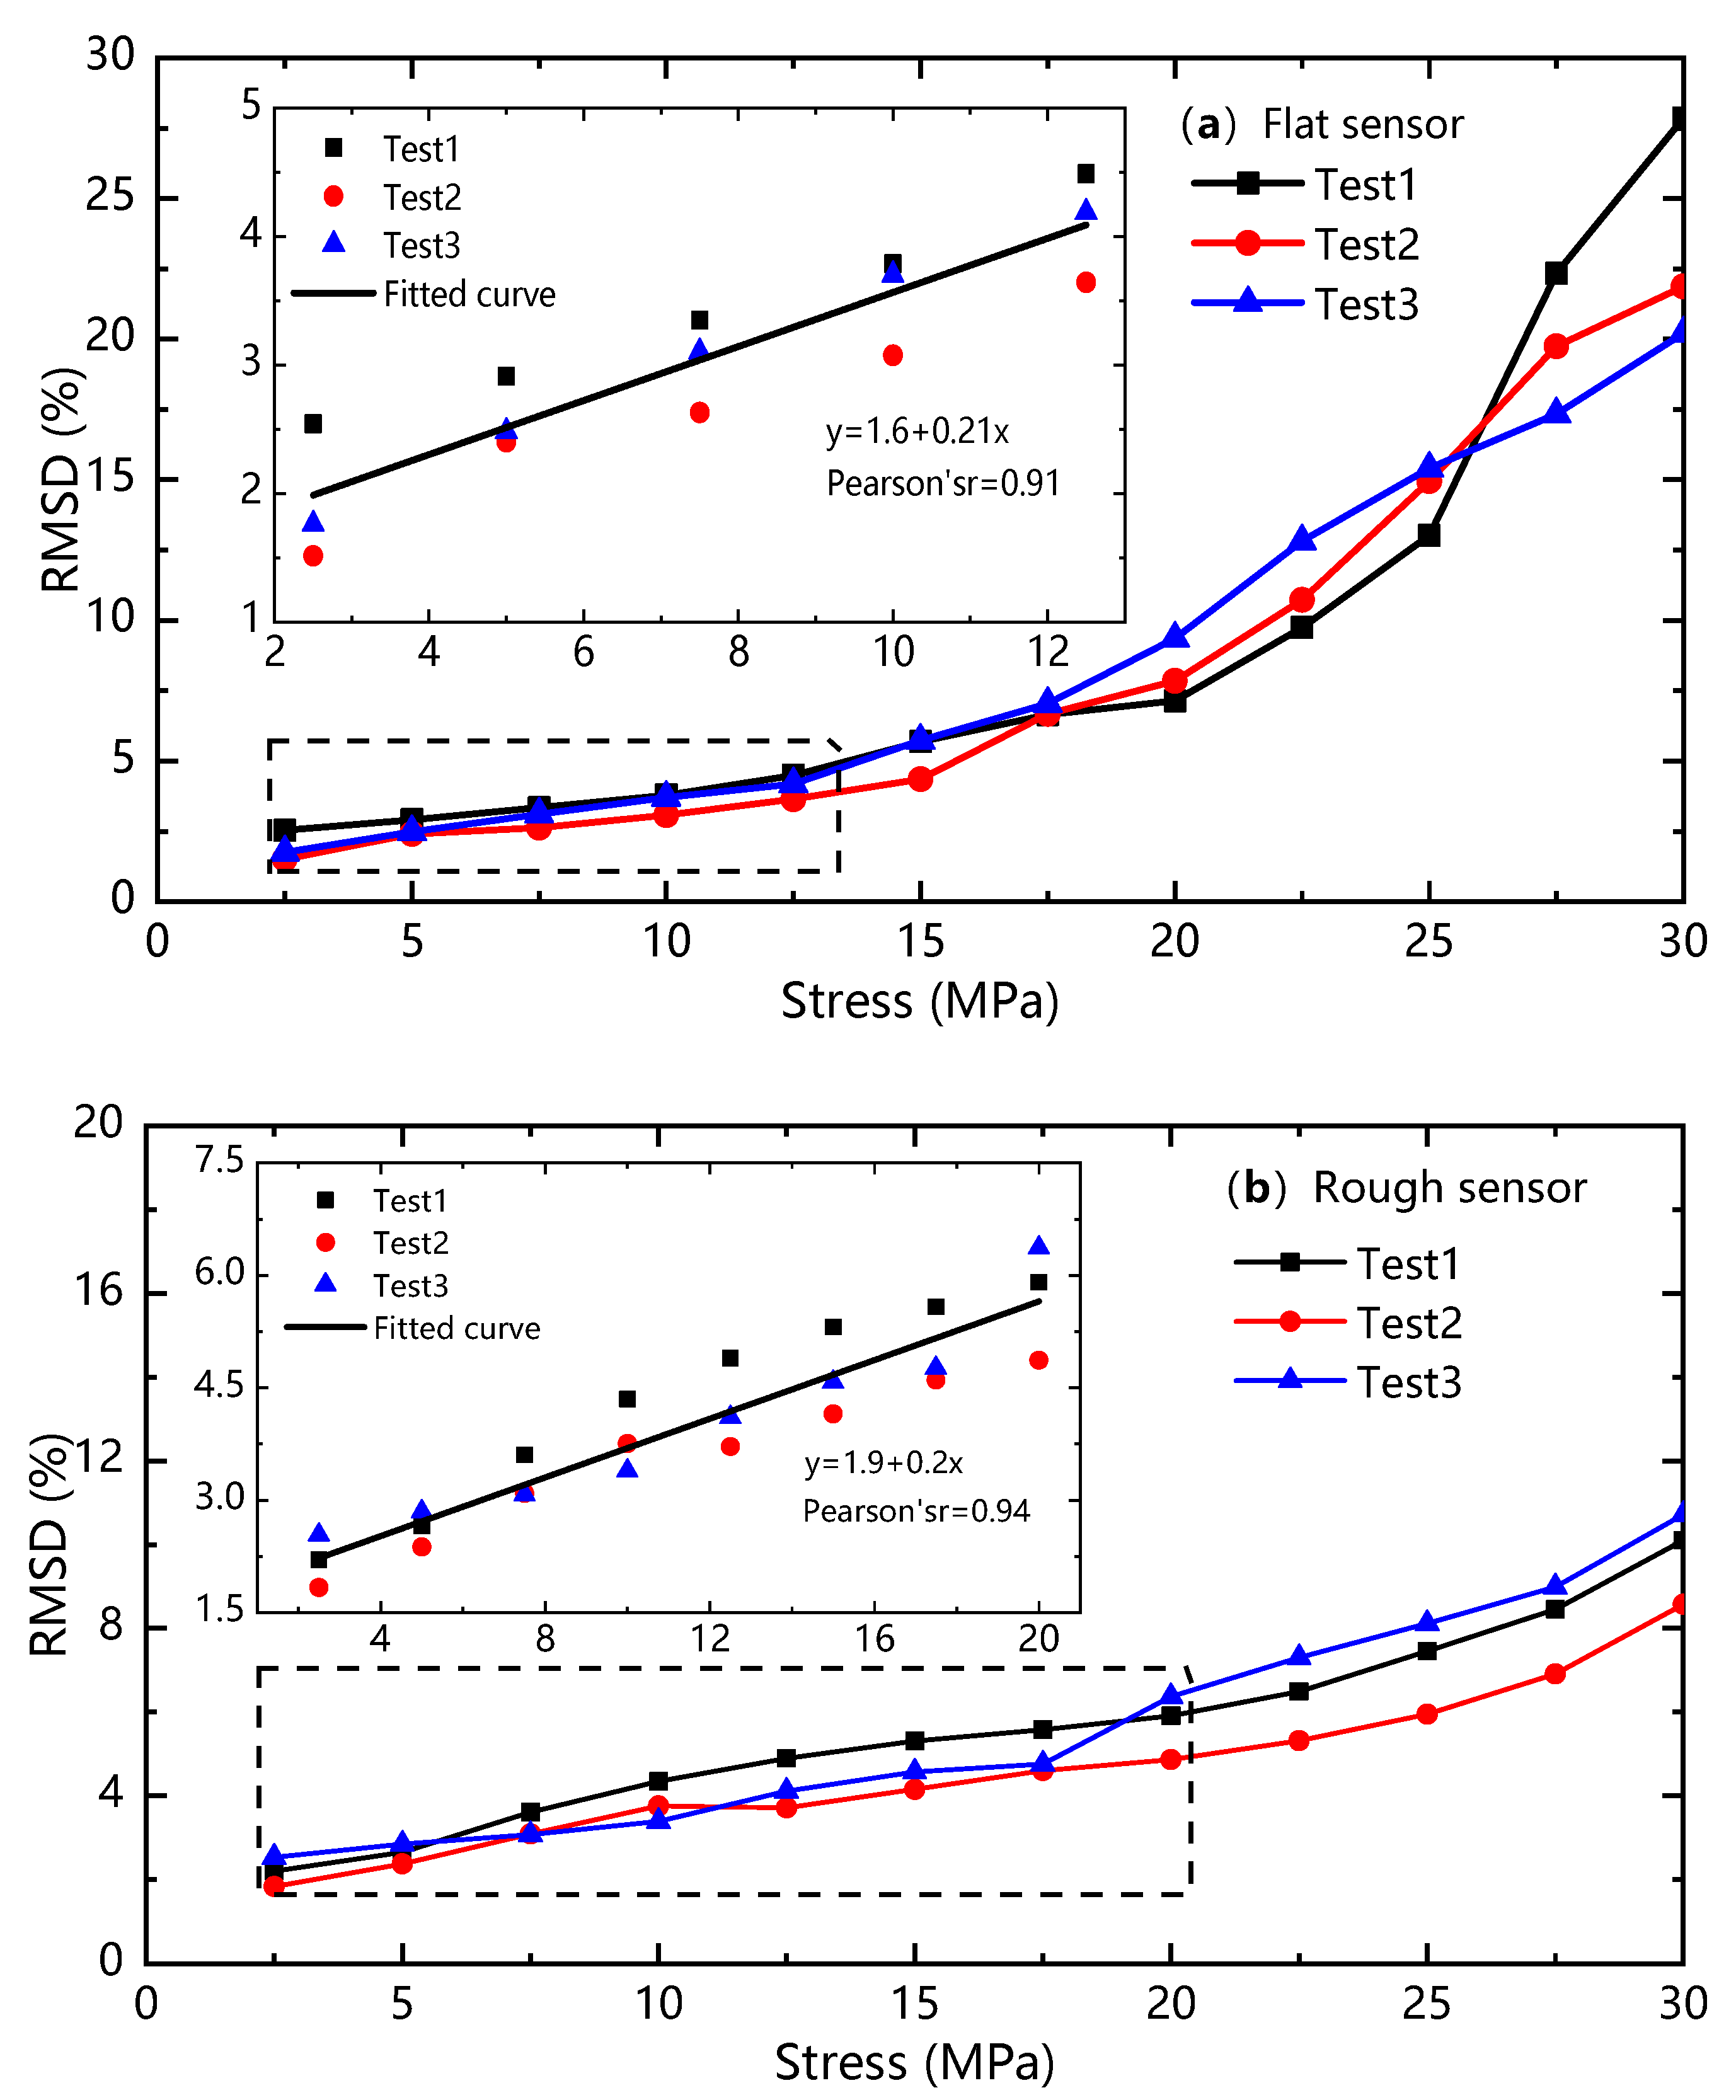
3.2. Effect of Interfacial Roughness on the Reliability of Embedded Sensors

Figure 12a–c shows the conductance signatures measured from the 90° flat sensors embedded in three independent specimens. In each test, the conductance signature obtained at the initial stress-free state is taken as the baseline. When the applied stresses are less than 15 MPa, changes in the conductance signatures with increasing stresses cannot be visually observable, corresponding to the low sensitivity of the sensors for stress monitoring in specimens under elastic deformation. This is consistent with the numerical results shown in Figure 8. However, when the applied stresses are larger than 15 MPa, changes in the conductance signatures with increasing stresses become remarkable, corresponding to the high sensitivity of the sensors for damage assessment in specimens under inelastic deformation.
Although similar upward and leftward trends of the predominant peaks with increasing loading are observed in experiments as numerical results, it is difficult to quantify the shifts of the peaks over a similar frequency range like that in Figure 10a,b. Some previous experiments have validated that the shifts of predominant peaks are closely related to the changes in the mechanical impedances of the sensor and host structure ( Z A ω and Z S ω ), as presented in Equation (1), and the dynamic interaction between the sensor and host structure [6,30,49]. However, the contribution of the interfacial interaction is still unclear.
Figure 13a–c shows the conductance signatures measured from the 90° rough sensors embedded in three independent specimens. Similar to that in flat tests, changes in the conductance signatures with increasing stresses are very small when the applied stresses are less than 15 MPa, indicating the low sensitivity of sensors in specimens under elastic deformation. As the loading stress increases beyond 15 MPa, changes in the predominant peaks increase but are still less significant than that of the flat sensors. It is also noted that, even for specimens under high stresses, the predominant peak frequencies still stay at around 200 kHz. This indicates a stable interfacial stiffness between the rough sensor and concrete, which is more reliable than that in tests with flat sensors where the predominant peak frequencies show an observable leftward shifting, indicating a discernable stiffness degradation between the flat sensor and concrete. To quantify the changes in the measured signatures with increasing stresses, the statistical metric (RMSD) can be utilized to indicate the changes in electromechanical impedances of the embedded PZT sensors [50]. The RMSD can be calculated based on the following equation:
RMSD = i = 1 N G i r G i 0 2 i = 1 N G i 0 2
where G i 0 is the i-th conductance of the baseline signature measured at the initial stress-free state, G i r is the i-th conductance of the signature measured under the increased stresses.
Figure 14a,b presents the RMSD indices calculated from the conductance signatures measured from specimens with the flat and rough sensors, respectively. Generally, the RMSD indices increase monotonously with loading stresses. As the loading stresses increase from 2.5 MPa to a threshold value (say 12.5 MPa for flat sensor cases and 20 MPa for rough sensor cases), a nearly linear correlation can be constructed between the RMSD index and loading stress. For specimens with flat sensors, as shown in Figure 14a, three RMSD curves increase linearly from 2.5 MPa to 12.5 MPa at a slope of 0.21% per MPa with the Pearson coefficient of 91%; while for specimens with rough sensors, as shown in Figure 14b, three RMSD curves increase linearly from 2.5 MPa to 20 MPa at a slope of 0.2% per MPa with the Pearson coefficient of 94%. This indicates that the rough sensors have a similar sensitivity but superior sensing range (better reliability) than the flat sensors for concrete stress monitoring. When the loading stresses on specimens increase beyond their corresponding threshold stresses, the RMSD curves for all tests show a nonlinear increasing trend with a remarkable dispersion. This indicates that the interfacial stiffness degradation in specimens with flat sensors contributes much more than that in specimens with rough sensors.

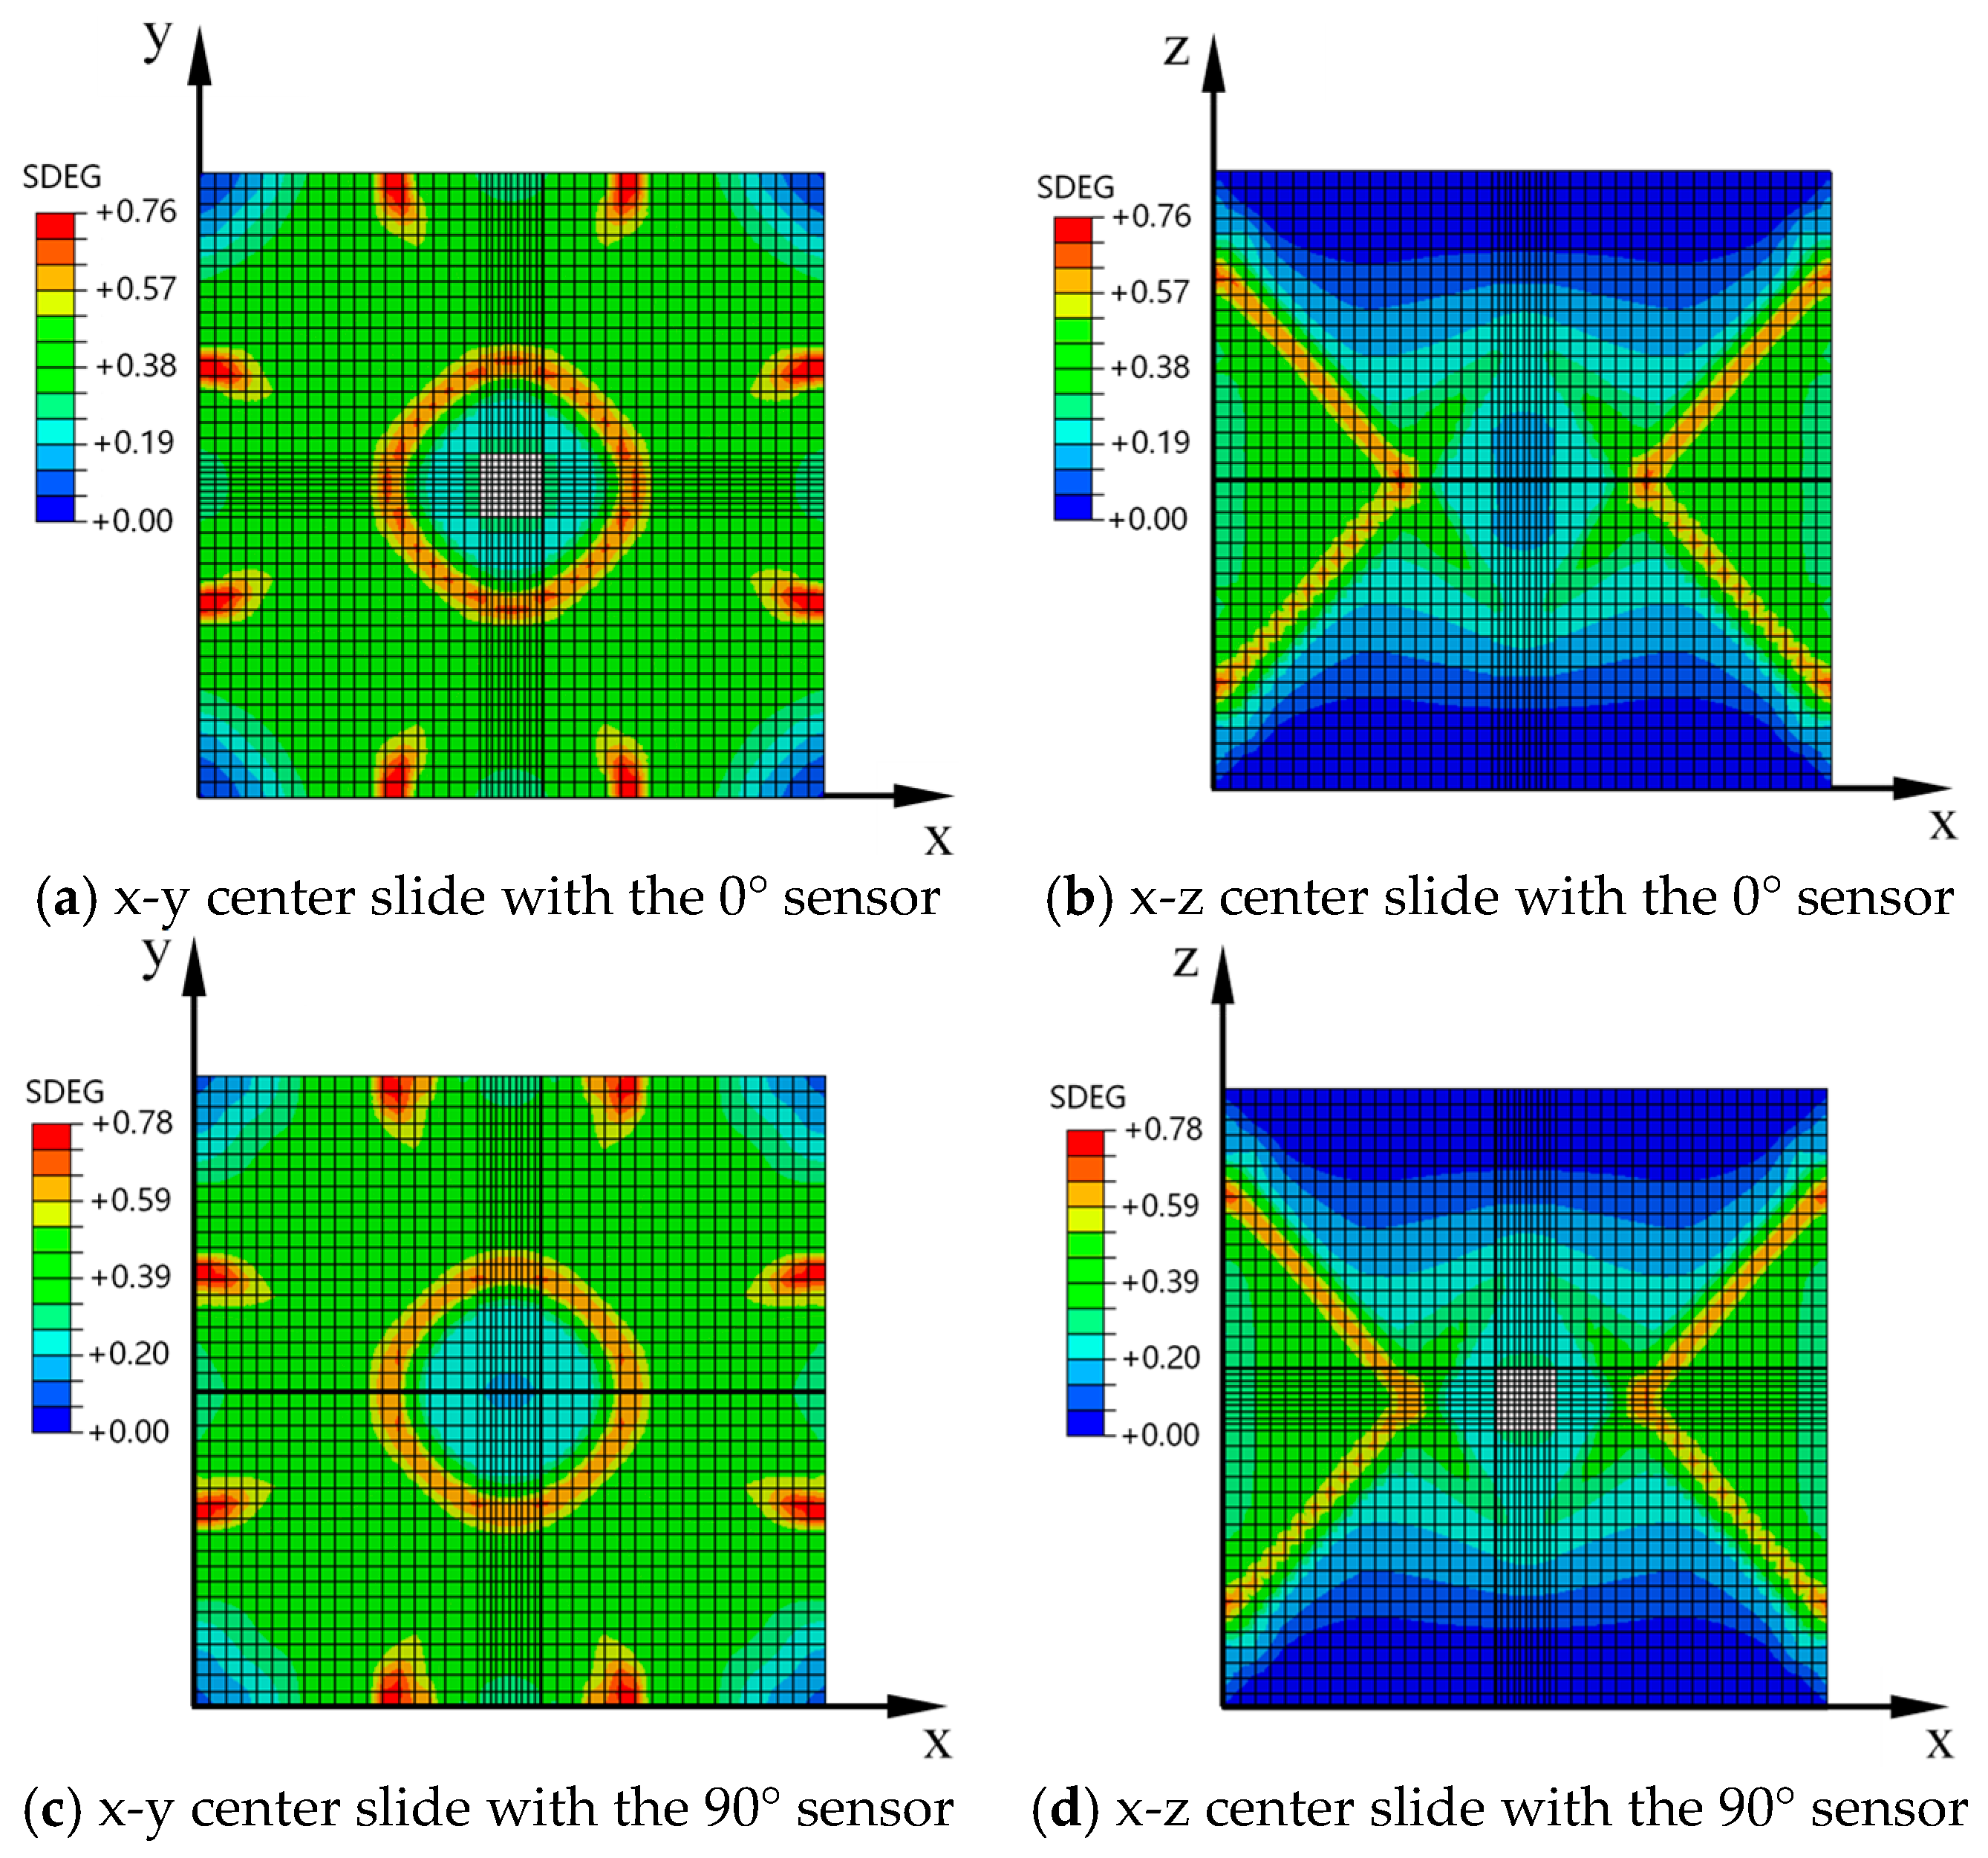
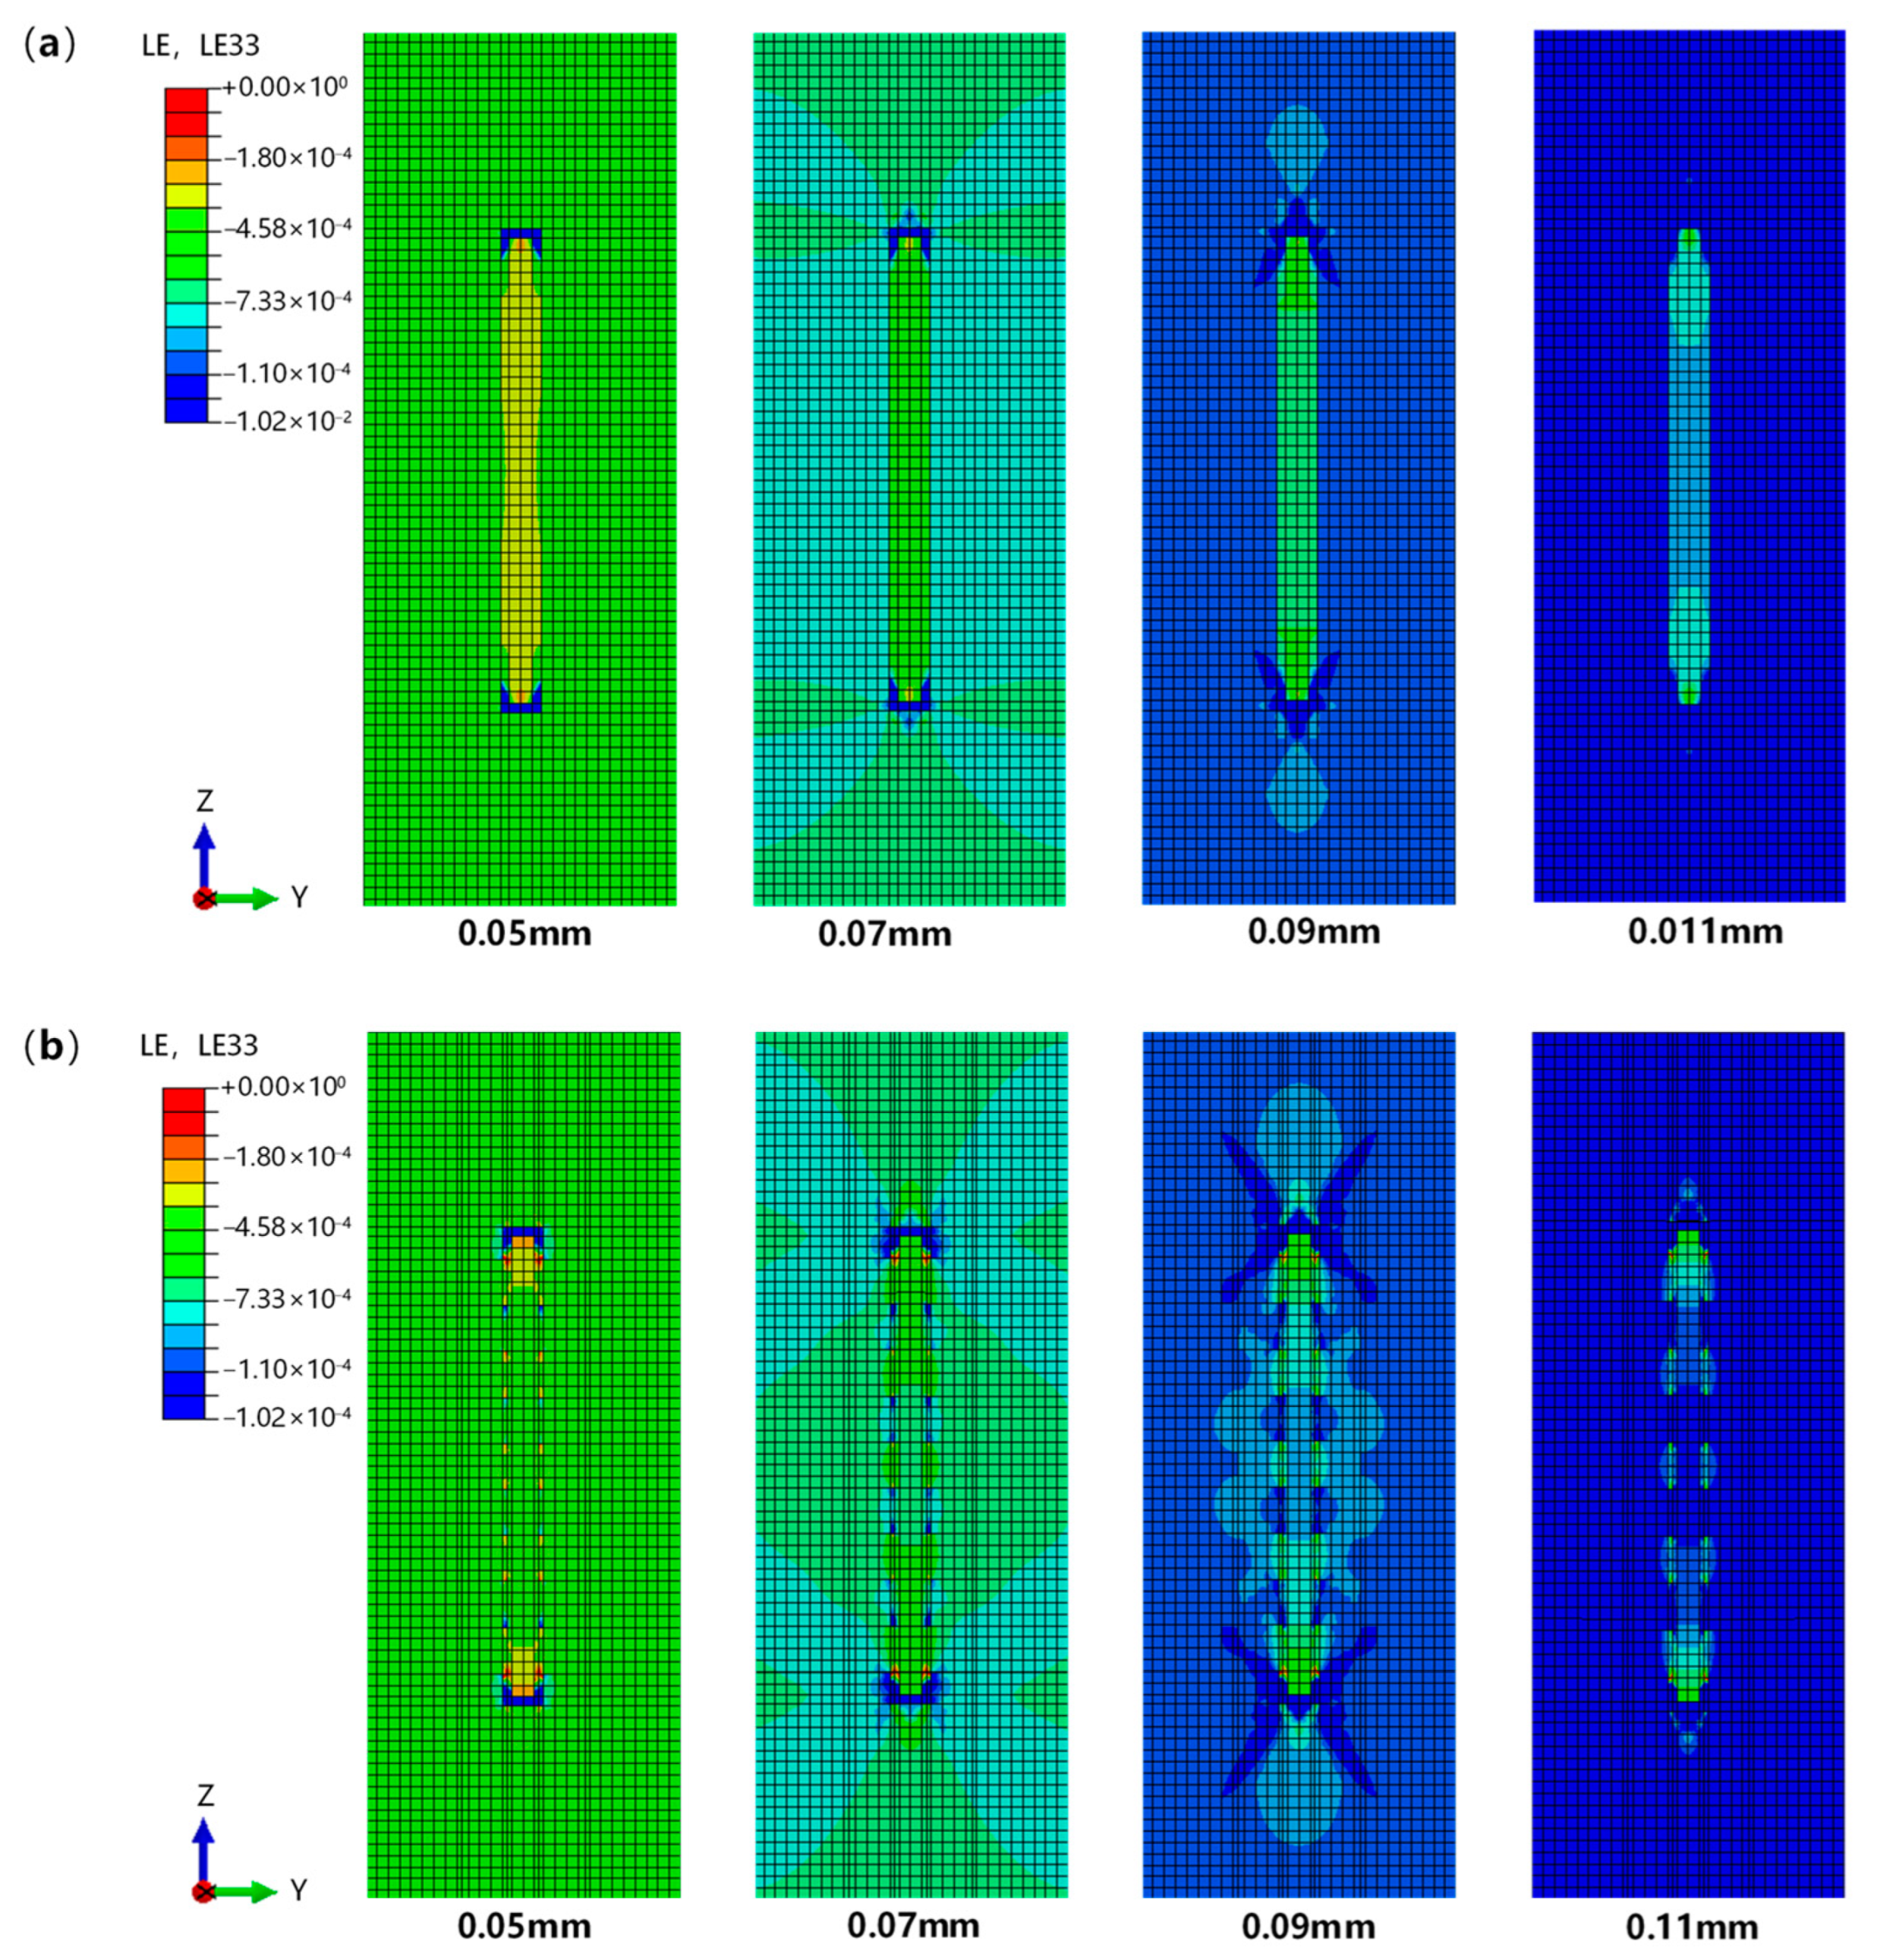
3.3. Mechanism Underlying the Interfacial Effect in Embedded PZT Sensors

To further explore the interfacial effect on the sensing performance of the embedded PZT sensors, the interfaces between the thin epoxy coating layers and the host concrete were modeled explicitly. Figure 15 shows a typical 1/8 symmetrical FE model containing a PZT sensor with either flat or rough interfaces. In each FE model, the outer surfaces of the epoxy layers are assumed to connect with their neighboring concrete via contact interactions, and the inner surfaces can be considered to be tied with the PZT patch. Particularly for models with rough sensors, uniformly distributed cubic sands with a dimension of 0.1 mm are half embedded into epoxy layers for modeling the rough interfaces between the sensor’s outer surfaces and concrete.
In practice, the epoxy coating layers were hardened before concrete curing, so the epoxy–concrete interfaces are more likely to be damaged. According to the assumed mechanical behaviors of the epoxy–concrete interfaces, the hard contact interaction was defined to only transmit shear and normal forces across interfaces. For simplicity, the shear frictional coefficient was specified to be 0.5 and no contact damping was considered herein [51]. With this assumption, the epoxy–concrete contact model can describe interfacial deformation more practically in specimens under large loadings than the epoxy–concrete tie model.
Under small compressive loading, both epoxy and its neighboring concrete in the contact model deform elastically but with different strains due to the mismatch in elastic modulus. The strain difference, shear strain along the epoxy–concrete interfaces, increases with the compressive loading increase. According to our experiments, no visible cracks were observed at the PZT–epoxy–concrete interfaces in the fractured debris of the embedded sensors. This means that the epoxy–concrete interfaces can accommodate the shear strains throughout the whole loading process. Accordingly, the increasing shear strains along the interfaces can be indicated by the interfacial stiffness degradation that correlates with the variation of the electromechanical impedances [52].
Figure 16a,b presents two sets of simulated snapshots of the sensors’ nearby regions, representing the strains along the z direction around the 90° flat and rough sensors, respectively. Generally, strain distributions in the flat sensor model are quite different from those exhibited in the rough sensor model. For both models under a small compressive displacement, such as 0.05 mm, the strains along the z direction firstly concentrate at the top and bottom edges of the PZT sensor. In this snapshot, the concrete and PZT patch deform uniformly, and two enhanced strain zones commence at the top and bottom epoxy layers, indicating the localized stiffness degradation at these spots. As the loading displacement increases, the concrete strains near the epoxy–concrete interfaces increase progressively. For the model with a flat sensor, the concrete strains along the lateral interfaces increase uniformly and yield at strain beyond 0.0007 as the loading displacement reaches 0.07 mm. While for the model with a rough sensor, the concrete strains along the lateral interfaces are partially retarded by the bulged sands. With the increase of loading displacement, some enhanced strain zones are distributed discontinuously along the interfaces due to the interlocking between epoxy and concrete. This retardation further delays the yielding of concrete along the rough interfaces until the loading displacement reaches beyond 0.11 mm. As illustrated in Figure 16b, no evident strain mismatch boundary exists between epoxy and concrete, meaning a retarded stiffness degradation in concrete along the lateral interfaces. This also demonstrates how the act of interlocking leads to a retarded stiffness degradation along the interfaces in the rough sensor cases.
Figure 17a,b presents two sets of strain distributions along the z direction in y-z center slide surrounding the 0° flat and rough sensors, respectively. In both cases under the z displacement of 0.05 mm, almost uniform elastic strains with different values occur in the concrete, epoxy layers, and PZT patch elements. With the loading displacement increasing, the plastic strains commence in the concrete surrounding the sensor edges and propagate along a slip band, acting like a strain shield for preventing the inelastic shear along the epoxy–concrete interfaces. As the loading displacement reaches 0.09 mm, the inelastic shear strains start developing in the concrete adjacent to the interfaces. During this loading process, different strain distributions are observed along the interfaces. In the flat sensor case, inelastic strains in concrete propagate from the ends to the center along the sensor’s interfaces; while in the rough sensor case, inelastic strains are distributed discontinuously along the interfaces.
However, this strain pattern difference diminishes as the loading displacement is increased to 0.11 mm. Under the increased loading condition, both cases exhibit similar strain mismatch patterns along the epoxy–concrete interfaces. The pattern similarity indicates that, compared with the effect of the installation orientation, the effect of interfacial roughness plays a less dominant role in determining the structural impedance around the sensors. In the snapshots of the 0° sensors case, the strain pattern difference due to the interfacial roughness can only be observed in models under the loading displacements from 0.07 mm to 0.09 mm. Whereas in the snapshots of the 90° sensors case, the pattern difference can be observed in models under the loading displacements from 0.07 mm to beyond 0.11 mm.
It was acknowledged that the localized large deformation could lead to the structural stiffness reduction in materials [53]. According to Equation (4), the change in the mechanical impedances measured by the sensors reflects the variation in the equivalent structural parameters, primarily stiffness, of host structural and interfaces. Thus, to capture the mechanical impedance of the host structure more accurately and reliably, the interfacial stiffness degradation should be linearly delayed over a stress range as wide as possible. Particularly for concrete stress monitoring that needs a higher accuracy, the interfacial stiffness degradation should be controlled more precisely by using properly designed interfaces. As illustrated in Figure 16b, an intermittent strain mismatch pattern can still be observed in the case with the 90° rough sensor even when the loading displacement reaches 0.11 mm, which corresponds to the compressive stresses at 0.48 fc. This suggests that a delayed interfacial stiffness degradation can be obtained with proper installation orientation and interfacial roughness for an embedded sensor under loading.

4. Conclusions

This work investigated the interfacial effects of the PZT sensors embedded in concrete, due to the installation orientation and interfacial roughness, on quantitative stress monitoring using FE simulations and EMI tests. The following conclusions can be drawn:
  • From FE simulations, it is found that the sensitivity of the embedded PZT sensors for concrete stress monitoring depends on their installation orientation. Particularly, the 90° sensor performs better than the 0° sensor for concrete stress monitoring in models under compressive loadings.
  • Based on experiments, a linear relationship between the loading stress and the RMSD index calculated from the conductance signatures is established for the specimens with rough sensors. The linear correlation range for concrete stress monitoring in rough sensor cases reaches 0.48 fc (the compressive strength), which is much larger than the flat sensor cases and other previous studies. The results validated an enhanced reliability of the rough PZT sensor for quantitative concrete stress monitoring.
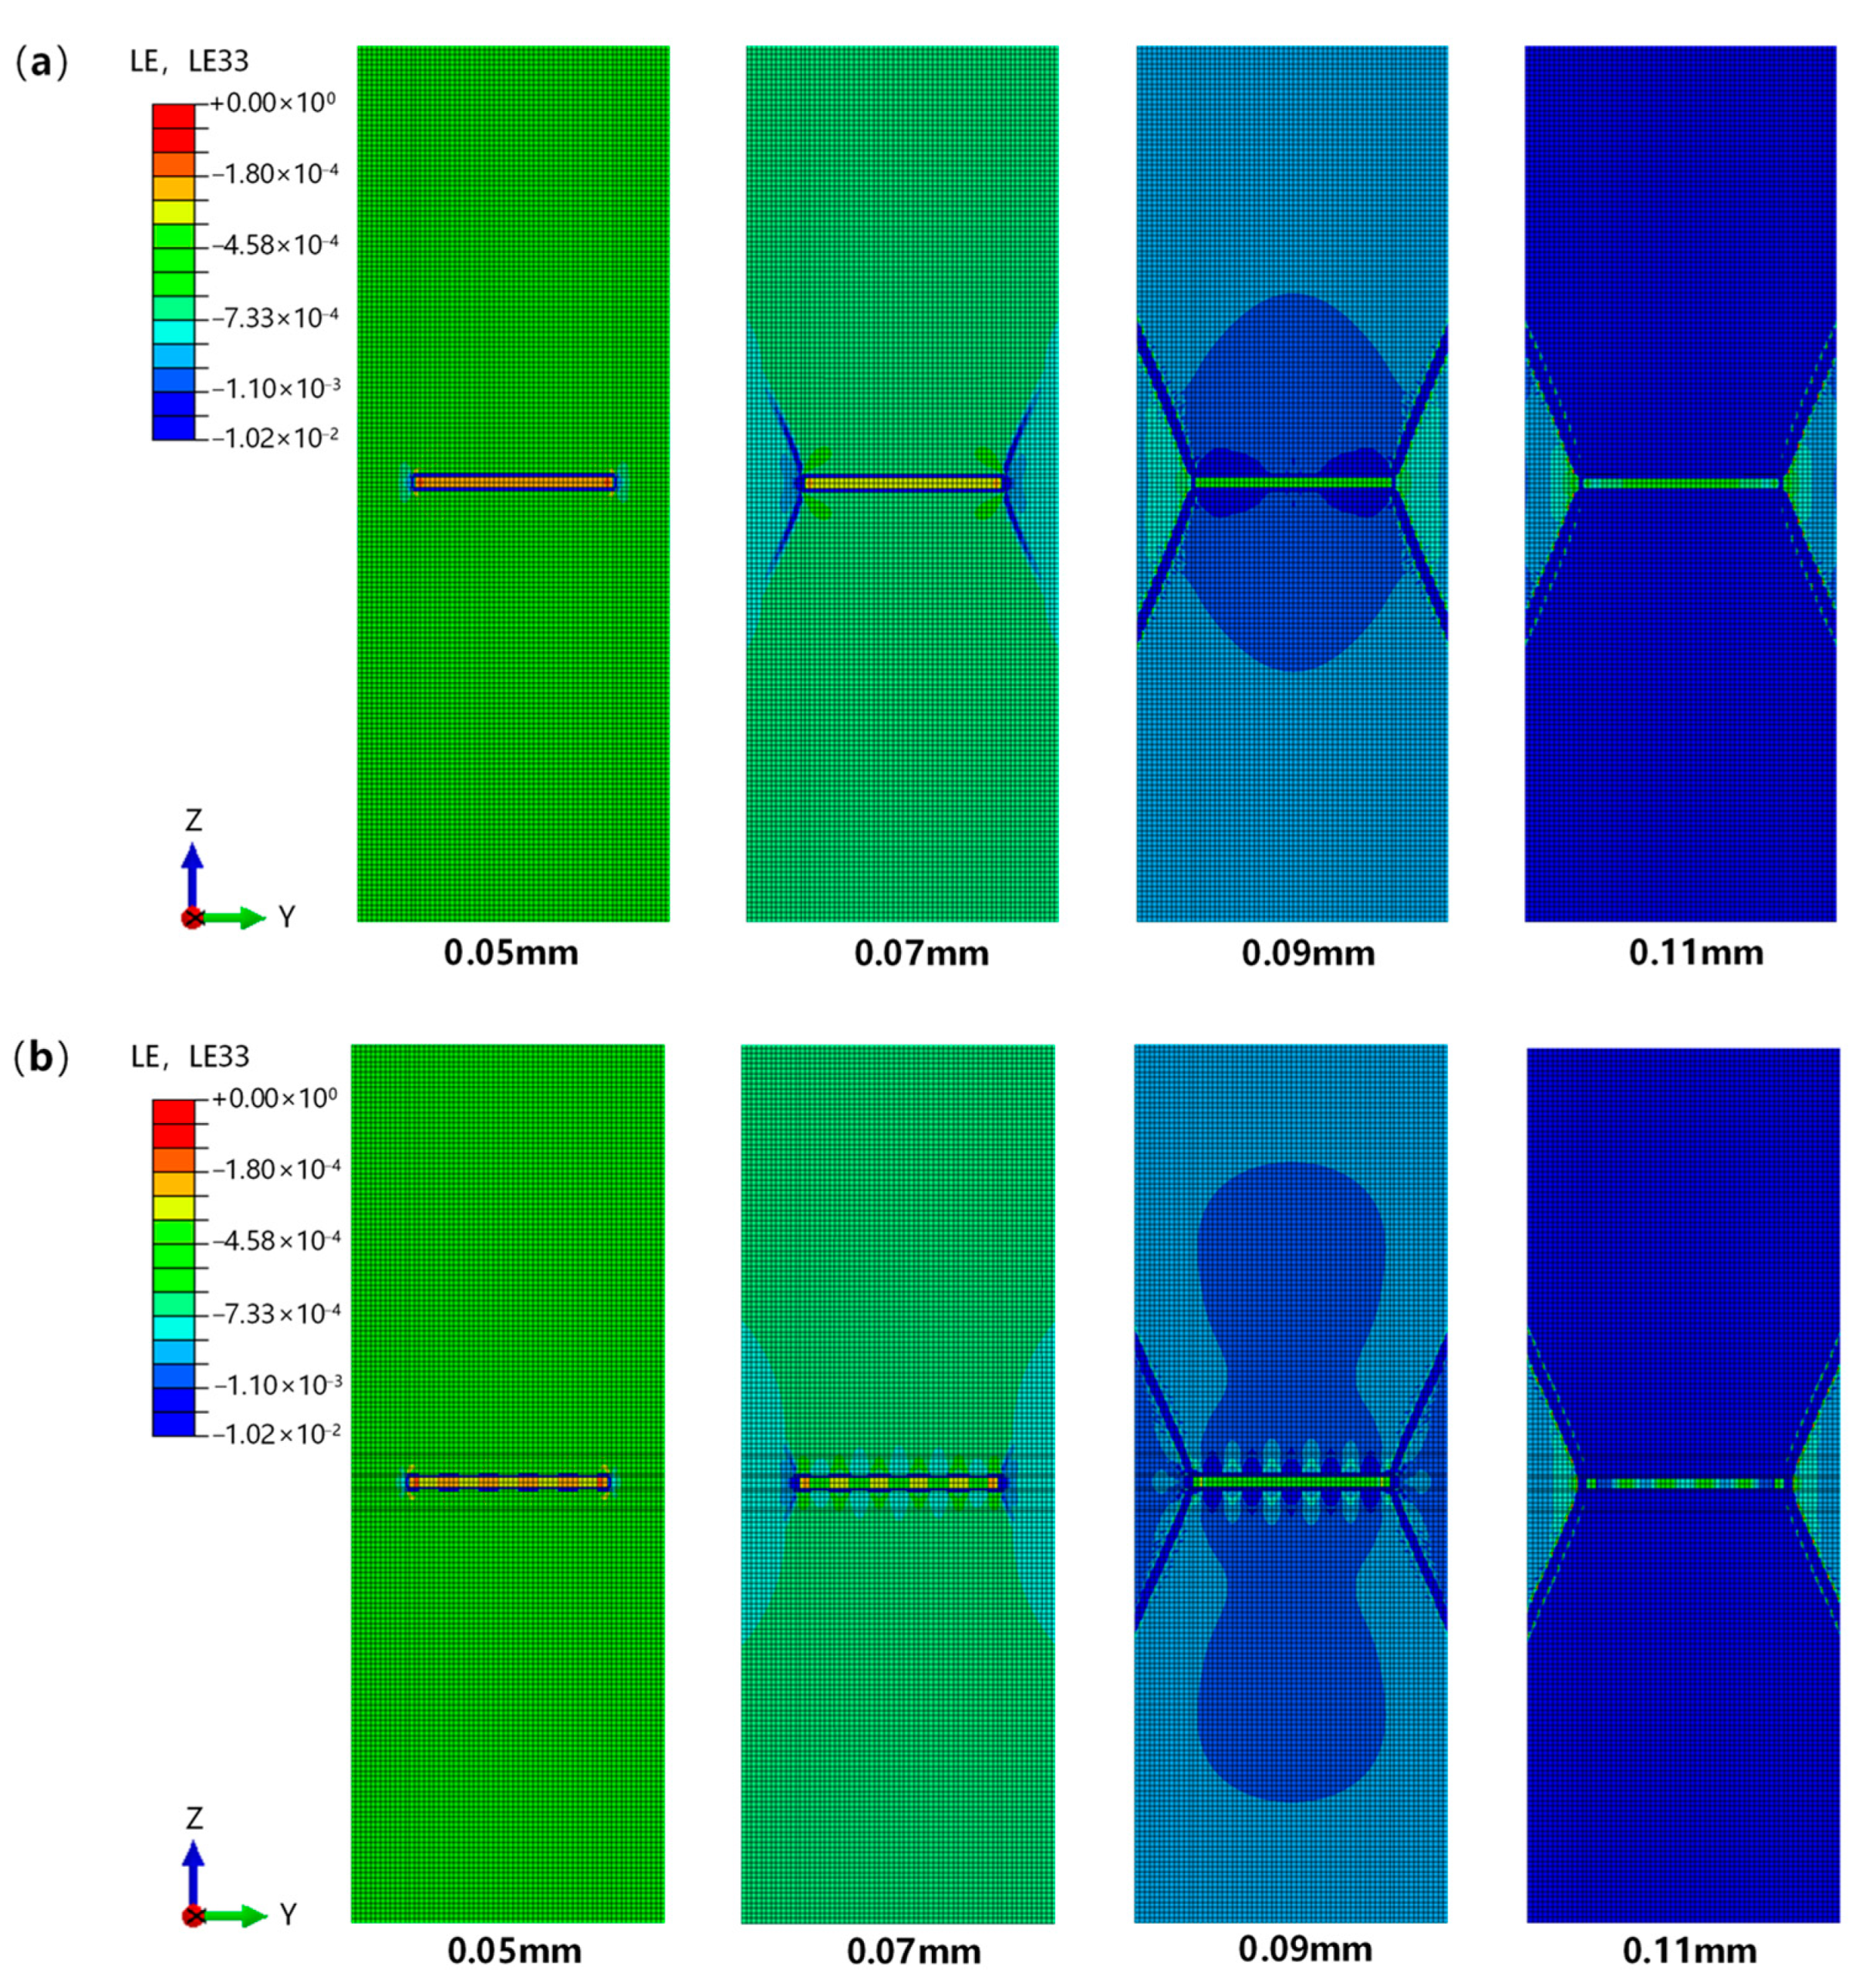
  • FE static analyses demonstrate that the interfacial effect on the sensing performance is closely related to the strain distribution pattern in regions surrounding the embedded PZT sensor. Installation orientation plays a more dominant role than the interfacial roughness on the strain pattern that determines the interfacial stiffness degradation and thereby the structural impedance around the sensor.
It should be noted that the sensing performance of the PZT sensors upon the interfacial effect was obtained from the concrete cubes with small-size coarse aggregates and subjected to compressive loadings. For real-world applications, the influences of defects, geometries, and loading configurations in the host structures should be considered to obtain a more practical sensing performance. Nevertheless, the findings in this study confirmed the remarkable contribution of interfacial effect to the sensitivity and reliability of the embedded PZT sensor for quantitative stress monitoring. More approaches towards interfacial enhancement need to be exploited in the future to improve the sensing performance of the embedded sensors for more practical applications.

Author Contributions

Q.L.: conceptualization, writing—review and editing, funding acquisition; G.D.: investigation, writing—original draft preparation; C.W.: investigation, software, methodology; X.W.: writing—review and editing, project administration; X.R.: writing—review and editing, validation. All authors have read and agreed to the published version of the manuscript.

Funding

This research was funded by the National Natural Science Fund Committee of China (Grant No. 11632014, 51808444), Scientific Research Program of Shanxi Provincial Education Department (18JK0502), State Key Laboratory for Strength and Vibration of Mechanical Structure open Foundation (Grant No. SV2018-KF-35), Startup Foundation of XUST (Grant No. 2018YQ2-05).

Institutional Review Board Statement

Not applicable.

Informed Consent Statement

Not applicable.

Data Availability Statement

Some data or models used during the study are available from the corresponding author by request.

Conflicts of Interest

The authors declare no conflict of interest.

References

  1. Narayanan, A.; Kocherla, A.; Subramaniam, K.V.L. Embedded PZT Sensor for Monitoring Mechanical Impedance of Hydrating Cementitious Materials. J. Nondestruct. Eval. 2017, 36, 64. [Google Scholar] [CrossRef]
  2. Kim, J.-T.; Park, J.-H.; Hong, D.-S.; Cho, H.-M.; Na, W.-B.; Yi, J.-H. Vibration and impedance monitoring for prestress-loss prediction in PSC girder bridges. Smart Struct. Syst. 2009, 5, 81–94. [Google Scholar] [CrossRef]
  3. Wang, D.; Zhang, J.; Zhu, H. Embedded Electromechanical Impedance and Strain Sensors for Health Monitoring of a Concrete Bridge. Shock. Vib. 2015, 2015, 821395. [Google Scholar] [CrossRef] [Green Version]
  4. Friebele, E.J. Fiber Bragg Grating STRAIN SENSORS: PRESENT AND FUTURE APPLICATIONS IN SMART STRUCTURES. Opt. Photonics News 1998, 9, 33. [Google Scholar] [CrossRef]
  5. Liang, C.; Sun, F.P.; Rogers, C.A. An Impedance Method for Dynamic Analysis of Active Material Systems. J. Intell. Mater. Syst. Struct. 1997, 8, 323–334. [Google Scholar] [CrossRef]
  6. Liang, C.; Sun, F.P.; Rogers, C.A. Coupled Electro-Mechanical Analysis of Adaptive Material Systems-Determination of the Actuator Power Consumption and System Energy Transfer. J. Intell. Mater. Syst. Struct. 1997, 8, 335–343. [Google Scholar] [CrossRef]
  7. Ai, D.; Zhu, H.; Luo, H. Sensitivity of embedded active PZT sensor for concrete structural impact damage detection. Constr. Build. Mater. 2016, 111, 348–357. [Google Scholar] [CrossRef]
  8. Dixit, A.; Bhalla, S. Prognosis of fatigue and impact induced damage in concrete using embedded piezo-transducers. Sens. Actuator A Phys. 2018, 274, 116–131. [Google Scholar] [CrossRef]
  9. Narayanan, A.; Kocherla, A.; Subramaniam, K.V.L. Damage detection in concrete using surface mounted PZT transducers. Mater. Today Proc. 2020, 28, 925–930. [Google Scholar] [CrossRef]
  10. Gao, W.; Huo, L.; Li, H.; Song, G. Smart concrete slabs with embedded tubular PZT transducers for damage detection. Smart Mater. Struct. 2018, 27, 025002. [Google Scholar] [CrossRef]
  11. Kocherla, A.; Duddi, M.; Subramaniam, K.V.L. Embedded PZT sensors for monitoring formation and crack opening in concrete structures. Measurement 2021, 182, 109698. [Google Scholar] [CrossRef]
  12. Pan, H.H.; Huang, M.-W. Piezoelectric cement sensor-based electromechanical impedance technique for the strength monitoring of cement mortar. Constr. Build. Mater. 2020, 254, 119307. [Google Scholar] [CrossRef]
  13. Ghafari, E.; Yuan, Y.; Wu, C.; Nantung, T.; Lu, N. Evaluation the compressive strength of the cement paste blended with supplementary cementitious materials using a piezoelectric-based sensor. Constr. Build. Mater. 2018, 171, 504–510. [Google Scholar] [CrossRef]
  14. Su, Y.-F.; Han, G.; Amran, A.; Nantung, T.; Lu, N. Instantaneous monitoring the early age properties of cementitious materials using PZT-based electromechanical impedance (EMI) technique. Constr. Build. Mater. 2019, 225, 340–347. [Google Scholar] [CrossRef]
  15. Zhang, C.; Panda, G.P.; Yan, Q.; Zhang, W.; Vipulanandan, C.; Song, G. Monitoring early-age hydration and setting of portland cement paste by piezoelectric transducers via electromechanical impedance method. Constr. Build. Mater. 2020, 258, 120348. [Google Scholar] [CrossRef]
  16. Ai, D.; Lin, C.; Zhu, H. Embedded piezoelectric transducers based early-age hydration monitoring of cement concrete added with accelerator/retarder admixtures. J. Intell. Mater. Syst. Struct. 2021, 32, 847–866. [Google Scholar] [CrossRef]
  17. Li, Y.; Ma, Y.; Hu, X. Early-age strength monitoring of the recycled aggregate concrete using the EMI method. Smart Mater. Struct. 2021, 30, 055017. [Google Scholar] [CrossRef]
  18. Saravanan, T.J.; Balamonica, K.; Priya, C.B.; Reddy, A.L.; Gopalakrishnan, N. Comparative performance of various smart aggregates during strength gain and damage states of concrete. Smart Mater. Struct. 2015, 24, 085016. [Google Scholar] [CrossRef]
  19. Narayanan, A.; Subramaniam, K.V.L. Early age monitoring of cement mortar using embedded piezoelectric sensors. In Proceedings of the SPIE Smart Structures and Materials + Nondestructive Evaluation and Health Monitoring, Las Vegas, NV, USA, 20–24 March 2016. [Google Scholar]
  20. Oh, T.; Kim, J.; Lee, C.; Park, S.H. Nondestructive Concrete Strength Estimation based on Electro-Mechanical Impedance with Artificial Neural Network. J. Adv. Concr. Technol. 2017, 15, 94–102. [Google Scholar] [CrossRef] [Green Version]
  21. Lu, X.; Lim, Y.Y.; Soh, C.K. A novel electromechanical impedance–based model for strength development monitoring of cementitious materials. Struct. Health Monit. 2018, 17, 902–918. [Google Scholar] [CrossRef]
  22. Zhang, C.; Yan, Q.; Wang, X.; Panda, G.P.; Vipulanandan, C.; Song, G. Measurement and evaluation of soft soil strength development during freeze-thaw process based on electromechanical impedance technique. Meas. Sci. Technol. 2020, 32, 025113. [Google Scholar] [CrossRef]
  23. Taha, H.; Ball, R.J.; Paine, K. Sensing of Damage and Repair of Cement Mortar Using Electromechanical Impedance. Materials 2019, 12, 3925. [Google Scholar] [CrossRef] [PubMed] [Green Version]
  24. Hou, S.; Cui, L.; Xu, X. A piezoelectric-based three-direction normal stress sensor for concrete structures. J. Intell. Mater. Syst. Struct. 2019, 30, 1858–1867. [Google Scholar] [CrossRef]
  25. Zhang, H.; Hou, S.; Ou, J. Smart aggregates for monitoring stress in structural lightweight concrete. Measurement 2018, 122, 257–263. [Google Scholar] [CrossRef]
  26. Hou, S.; Zhang, H.B.; Ou, J.P. A PZT-based smart aggregate for compressive seismic stress monitoring. Smart Mater. Struct. 2012, 21, 105035. [Google Scholar] [CrossRef]
  27. Hou, S.; Zhang, H.B.; Ou, J. SA-based concrete seismic stress monitoring: A case study for normal strength concrete. Smart Mater. Struct. 2016, 25, 095041. [Google Scholar] [CrossRef]
  28. Zhang, J.; Lu, Y.; Lu, Z.; Liu, C.; Sun, G.; Li, Z. A new smart traffic monitoring method using embedded cement-based piezoelectric sensors. Smart Mater. Struct. 2015, 24, 025023. [Google Scholar] [CrossRef]
  29. Xu, B.; Song, G.; Mo, Y.L. Embedded piezoelectric lead-zirconate-titanate-based dynamic internal normal stress sensor for concrete under impact. J. Intell. Mater. Syst. Struct. 2017, 28, 2659–2674. [Google Scholar] [CrossRef]
  30. Park, G.; Sohn, H.; Farrar, C.R.; Inman, D.J. Overview of Piezoelectric Impedance-Based Health Monitoring and Path Forward. Shock. Vib. Dig. 2003, 35, 451–463. [Google Scholar] [CrossRef] [Green Version]
  31. Wang, Z.; Chen, D.; Zheng, L.; Huo, L.; Song, G. Influence of Axial Load on Electromechanical Impedance (EMI) of Embedded Piezoceramic Transducers in Steel Fiber Concrete. Sensors 2018, 18, 1782. [Google Scholar] [CrossRef] [Green Version]
  32. Fan, S.; Zhao, S.; Qi, B.; Kong, Q. Damage Evaluation of Concrete Column under Impact Load Using a Piezoelectric-Based EMI Technique. Sensors 2018, 18, 1591. [Google Scholar] [CrossRef] [PubMed] [Green Version]
  33. Qin, F.; Zhang, Z.; Xie, B.; Sun, R. Experimental Study on Damage Detection in ECC-Concrete Composite Beams Using Piezoelectric Transducers. Sensors 2019, 19, 2799. [Google Scholar] [CrossRef] [PubMed] [Green Version]
  34. Xu, D.; Banerjee, S.; Wang, Y.; Huang, S.; Cheng, X. Temperature and loading effects of embedded smart piezoelectric sensor for health monitoring of concrete structures. Constr. Build. Mater. 2015, 76, 187–193. [Google Scholar] [CrossRef]
  35. Narayanan, A.; Subramaniam, K.V.L. Experimental evaluation of load-induced damage in concrete from distributed microcracks to localized cracking on electro-mechanical impedance response of bonded PZT. Constr. Build. Mater. 2016, 105, 536–544. [Google Scholar] [CrossRef]
  36. Zhao, S.; Fan, S.; Yang, J.; Kitipornchai, S. Numerical and experimental investigation of electro-mechanical impedance based concrete quantitative damage assessment. Smart Mater. Struct. 2020, 29, 055025. [Google Scholar] [CrossRef]
  37. Pan, H.H.; Guan, J.-C. Stress and strain behavior monitoring of concrete through electromechanical impedance using piezoelectric cement sensor and PZT sensor. Constr. Build. Mater. 2022, 324, 126685. [Google Scholar] [CrossRef]
  38. Xu, Y.G.; Liu, G.R. A Modified Electro-Mechanical Impedance Model of Piezoelectric Actuator-Sensors for Debonding Detection of Composite Patches. J. Intell. Mater. Syst. Struct. 2002, 13, 389–396. [Google Scholar] [CrossRef]
  39. Kocherla, A.; Subramaniam, K.V.L. Embedded smart PZT-based sensor for internal damage detection in concrete under applied compression. Measurement 2020, 163, 108018. [Google Scholar] [CrossRef]
  40. Zhao, S.; Fan, S.; Chen, J. Quantitative assessment of the concrete gravity dam damage under earthquake excitation using electro-mechanical impedance measurements. Eng. Struct. 2019, 191, 162–178. [Google Scholar] [CrossRef]
  41. Radhika, M.A.; Annamdas, V.G.M. Experimental studies on structural load monitoring using piezoelectric transducer based electromechanical impedance method. Sci. J. Rev. 2013, 2, 37–50. [Google Scholar]
  42. Lubliner, J.; Oliver, J.; Oller, S.; Oñate, E. A plastic-damage model for concrete. Int. J. Solids Struct. 1989, 25, 299–326. [Google Scholar] [CrossRef]
  43. Lee, J.; Fenves, G.L. A plastic-damage concrete model for earthquake analysis of dams. Earthq. Eng. Struct. D. 1998, 27, 937–956. [Google Scholar] [CrossRef]
  44. Yu, X.; Chen, L.; Fang, Q.; Ruan, Z.; Hong, J.; Xiang, H. A concrete constitutive model considering coupled effects of high temperature and high strain rate. Int. J. Impact Eng. 2017, 101, 66–77. [Google Scholar] [CrossRef]
  45. Oliveira, É.L.; Maia, N.M.M.; Marto, A.G.; da Silva, R.G.A.; Afonso, F.J.; Suleman, A. Modal characterization of composite flat plate models using piezoelectric transducers. Mech. Syst. Signal Process. 2016, 79, 16–29. [Google Scholar] [CrossRef]
  46. Qiu, H.; Li, F. In-plane selective excitation of arbitrary vibration modes using thickness-shear (d 15) piezoelectric transducers. Smart Mater. Struct. 2022, 31, 03LT01. [Google Scholar] [CrossRef]
  47. Sun, F.P.; Liang, C.; Rogers, C.A. Structural Modal Analysis Using Collocated Piezoelectric Actuator/Sensors: An Electromechanical Approach. In Proceedings of the 1994 North American Conference on Smart Structures and Materials, Orlando, FL, USA, 13–18 February 1994. [Google Scholar]
  48. Piana, G.; Lofrano, E.; Carpinteri, A.; Paolone, A.; Ruta, G. Experimental modal analysis of straight and curved slender beams by piezoelectric transducers. Meccanica 2016, 51, 2797–2811. [Google Scholar] [CrossRef]
  49. Na, W.S.; Baek, J. A Review of the Piezoelectric Electromechanical Impedance Based Structural Health Monitoring Technique for Engineering Structures. Sensors 2018, 18, 1307. [Google Scholar] [CrossRef] [Green Version]
  50. Wang, D.; Zhu, H. Monitoring of the strength gain of concrete using embedded PZT impedance transducer. Constr. Build. Mater. 2011, 25, 3703–3708. [Google Scholar] [CrossRef]
  51. Nie, Y.; Xie, T.-Y.; Chen, G.-M.; Zhao, X.-Y.; Lv, J.-B. A 2D generic multi-surface cohesive zone model for simulating FRP-to-concrete mixed-mode debonding failure. Compos. Struct. 2022, 296, 115890. [Google Scholar] [CrossRef]
  52. Huynh, T.-C.; Ho, D.-D.; Dang, N.-L.; Kim, J.-T. Sensitivity of Piezoelectric-Based Smart Interfaces to Structural Damage in Bolted Connections. Sensors 2019, 19, 3670. [Google Scholar] [CrossRef] [PubMed] [Green Version]
  53. Wichtmann, T.; Kimmig, I.; Triantafyllidis, T. On correlations between “dynamic” (small-strain) and “static” (large-strain) stiffness moduli–An experimental investigation on 19 sands and gravels. Soil Dyn. Earthq. Eng. 2017, 98, 72–83. [Google Scholar] [CrossRef]
Figure 1. Typical FE model (a) for the fabricated PZT sensors (b).
Buildings 13 00560 g001
Figure 2. Experimental and numerical conductance signatures of a free PZT sensor over the sweeping frequency range 0~500 kHz.
Buildings 13 00560 g002
Figure 3. (a) The typical FE model for concrete specimens and (b) the detailed dimensions of the embedded PZT sensor.
Buildings 13 00560 g003
Figure 4. Stress–strain curve and damaged plasticity for a typical concrete cube under (a) compressive and (b) tensile loadings.
Buildings 13 00560 g004
Figure 5. Numerically obtained compressive stress-displacement curve of a typical test cube under compressive loading.
Buildings 13 00560 g005
Figure 6. (a) Numerical and (b) experimental results of a crushed specimen.
Buildings 13 00560 g006
Figure 7. Typical embedding positions of PZT sensors with relative angles between the loading direction and normal vibration plane: (a) 0° and (b) 90°.
Buildings 13 00560 g007
Figure 8. Numerical conductance signatures for the (a) 0° flat, (b) 90° flat, (c) 0° rough, and (d) 90° rough PZT sensors embedded in concrete cubes under elastic deformation.
Buildings 13 00560 g008
Figure 9. Stress distributions of the center slides involving the 0° and 90° PZT sensors embedded in concrete cubes under the compressive displacement of 0.04 mm.
Buildings 13 00560 g009
Figure 10. Numerical conductance signatures of the (a) 0° flat, (b) 90° flat, (c) 0° rough, and (d) 90° rough PZT sensors embedded in concrete cubes under inelastic deformation.
Buildings 13 00560 g010
Figure 11. SDEG contours of the x-y and y-z center slides with 0° and 90° PZT sensors embedded in concrete cubes under the inelastic deformation of 0.2 mm.
Buildings 13 00560 g011
Figure 12. Conductance signatures obtained from the experimental tests in concrete cubes with the 90° flat PZT sensors.
Buildings 13 00560 g012
Figure 13. Conductance signatures obtained from the experimental tests in concrete cubes with the 90° rough PZT sensors.
Buildings 13 00560 g013
Figure 14. RMSD indices calculated from the conductance signatures for the PZT sensors with (a) flat and (b) rough interfaces.
Buildings 13 00560 g014
Figure 15. FE models for the typical specimens with the (a) 90° and (b) 0° sensors.
Buildings 13 00560 g015
Figure 16. Strain distribution along the z direction in regions surrounding the 90° (a) flat and (b) rough sensors under progressive compressive displacements.
Buildings 13 00560 g016
Figure 17. Strain distribution along the z direction in regions surrounding the 0° (a) flat and (b) rough sensors under progressive compressive displacements.
Buildings 13 00560 g017
Table 1. Physical properties of PZT and epoxy.
Physical PropertyPZTEpoxy
Density ρ (kg/m3)76001650
Elastic modulus E (GPa)673.2
Poisson’s ratio ν0.320.34
Piezoelectric strain coefficient
d31/d32/d33/d24/d15 (10−10 m/V)
−3.6/−3.6/5.0/5.8/5.8
Dielectric constant
ε 11 σ / ε 22 σ / ε 33 σ (10−8 F/m)
1.75/1.75/2.12
Table 2. Mix proportions of the test C40 concrete. (unit: kg/m3).
Crushed Stone
(kg/m3)
River Sand
(kg/m3)
Cement
(kg/m3)
Fly Ash
(kg/m3)
Limestone Powder
(kg/m3)
Water
(kg/m3)
Water Reducer
(kg/m3)
784.0756.9419.177.621.7191.55.2
Table 3. Mechanical properties of concrete.
Density, ρ (Kg/m3)Elastic Modulus (GPa)Poisson’s
Ratio, ν
Uniaxial Compressive Strength,
f ck (MPa)
Uniaxial Tensile Strength,
f tk (MPa)
Concrete240032.50.226.752.41
Sand240032.00.226.752.41
Disclaimer/Publisher’s Note: The statements, opinions and data contained in all publications are solely those of the individual author(s) and contributor(s) and not of MDPI and/or the editor(s). MDPI and/or the editor(s) disclaim responsibility for any injury to people or property resulting from any ideas, methods, instructions or products referred to in the content.

