1. Introduction
In recent years, shotcrete technology has been widely used in underground engineering, geotechnical engineering and municipal engineering [
1]. The concrete spraying process mainly relies on pneumatic conveying. The problem of pipe wear during pneumatic conveying is common and difficult to avoid. Wear is a common loss phenomenon in industry, with about 80% of machinery parts failing due to wear and tear. According to statistics, the loss of erosive wear has been estimated to range from 1% to 4% of the gross national product of an industrialized country [
2]. In the process of conveying shotcrete material, there are many solid particles such as sand and gravel in the pipeline. In general, high pressure air is the power source of particle transportation in the pipe when spraying concrete. The wet or semi-wet concrete particles are carried by high pressure air through the pipeline and then sprayed on the wall. Solid particles are likely to cause severe collision and friction with the inner wall of the pipeline, resulting in pipe wear [
3,
4,
5]. Moreover, in pipeline transportation, bent pipes are more prone to wear than straight pipes [
6,
7]. If the pipeline is worn, the service life of the pipeline will be reduced and the maintenance cost will be increased. Moreover, energy consumption will increase. If part of the wear is serious, an eddy current will also be generated. The material will not be evenly distributed in the pipeline section, affecting the efficiency of material transportation. If pipes are worn through and materials leak, environmental pollution and safety accidents may occur. Therefore, it is of great significance to study the law of pipeline wear in shotcrete technology and put forward control measures, which can effectively reduce construction costs and energy consumption, prolong the service life of pipelines and prevent safety accidents [
8].
In the early stages, some scholars achieved some theoretical results on erosion wear through experimental methods. However, the erosion wear experiments had some shortcomings with long cycles, complex processes, high experimental costs and a lack of predictability [
9,
10]. Erosion wear experimentation was gradually abandoned by researchers. With the development of science and technology, the development of numerical simulation software is gradually maturing. The study of wear is beginning to adopt the numerical simulation method [
11,
12,
13]. Many scholars have carried out research on erosion wear with the numerical simulation method for typical pipe structures such as elbow pipes and tee pipes. Bitter [
14] studied the theory of deformation wear. The erosion wear was divided into deformation wear and cutting wear, and the total amount of wear was equal to the deformation wear plus the cutting wear. Tilly [
15] examined the theory of secondary erosion wear and divided the erosion process into two stages: the primary erosion caused by the direct incidence of particles and the secondary erosion caused by particle breakage. Zhang et al. [
16] proposed the theory of micro-cutting wear, investigating the relationship between the erosion rate and impact angle and impact velocity. Hutchings [
17] created a material erosion model under continuous impact by particles. This model achieved high calculation accuracy under the impact angle of 90°, but it performed poorly under the rest of the impact angles. The University of Tulsa has refined the empirical model established by Ahlert to predict the wear rate of AISI1018 steel, known as the ‘Tulsa model’, which can be used to predict the wear rates of bends, tees and reducers [
18].
Chen et al. [
19] combined the random rebound model with the Tulsa model and applied it to analyze the wear degree of elbows and tees based on CFD. Ding et al. [
20] analyzed the erosion wear of a right-angle bend pipe using the Tulsa model. The most serious erosion position of the right-angle bend pipe was found to analyze the influence of flow velocity, particle concentration and particle diameter on the erosion rate. Liu et al. [
21] investigated the wear of catalyst particles at 90-degree elbows during hydraulic transport by coupled CFD-DEM. The authors analyzed the effects of the particle model shape, radius of curvature and bending angle on the wear characteristics of liquid–solid two-phase flow. Tan et al. [
22] verified the effectiveness of the coupling model by taking pneumatic conveying as an example. The collision frequency of particles against the elbow was monitored by simulating the shotcrete pumping process. A new time-average collision strength model based on impact force was proposed to study the wear mechanism of the elbow. The location of the maximum erosion wear damage of the elbow was predicted. Wang et al. [
23] investigated the mechanism of charging slurry pipe wear by developing a pipe wear loop test system to test different cement-to-tailings ratios, high concentrations and flow rates.
The factors affecting pipeline wear are mainly divided into three categories: the nature of the conveying materials, the nature of the pipelines and the conveying conditions. Many scholars have studied the factors affecting pipeline wear through numerical simulation. Chen et al. [
24] used CFD-DEM coupling numerical simulation to predict the main wear position of a shotcrete-conveying pipeline and mainly studied the influence of different gas velocities and feed rates on the wear volume of the pipeline. Singh et al. [
25] evaluated the k-ε turbulence model and the mixture model to conduct simulation research and analyzed the effects of different fluid velocities, bend radii of curvature, pipeline diameters and particle sizes on pipeline wear. Wang et al. [
26] took reducing elbow pipes with different structures as their research object and established a flow model of a slurry in reducing elbow pipes by using Fluent to study the erosion wear law of filling a slurry in reducing pipes. Naveh et al. [
27] examined the mechanism of slurry pipeline wear by studying the form of solid particle movement in the slurry. The influence of the slurry flow rate played a key role on the pipeline wear. Li et al. [
28] studied the influence of slurry velocity on pipeline wear under different cement–sand ratios and different mass concentrations of filling slurry based on an ANSYS three-dimensional numerical calculation model. Zhou et al. [
29] used Fluent software to simulate the wear of horizontal conveying pipes. The authors focused on the effect of solid particle concentration on the degree of wear. Sun et al. [
30] conducted numerical simulation on the erosion wear of bends based on the coupled CFD-DEM method and SIEM, which were verified by relevant experimental data. Wang et al. [
31] applied the DPM erosion model to study the wear of pipes in refrigeration systems. The wear condition of impurity particles on the pipe wall was investigated under different gas velocity and solid phase concentration conditions.
The use of reasonable measures can effectively reduce the degree of pipe wear. Many scholars have proposed preventive measures for pipe wear. Ma et al. [
32] studied the two-phase flow motion characteristics of concrete in pipes based on a CFD-DEM coupling model and field measurement. The particle velocity exhibited minimal loss at a bend angle of 90 degrees which provided a guidance in the pipeline wear field. Liu et at. [
33] investigated the protective effect of diamond-like carbon film on pipes through hollow cathode plasma-enhanced chemical vapor deposition (HC-PECVD) technology, which effectively prevented the corrosion and wear of the inner surface of the pipes. Guo et al. [
34] proposed three types of elbow structures with circumferentially distributed bionic transverse grooves, bionic ribs and a single rib on the inner wall to improve the anti-erosion characteristics of the elbows. Zhou et al. [
35] analyzed the effects of air velocity and air pressure on elbow erosion. The pressure drop was studied by an orthogonal design and the best parameters of elbow pneumatic conveying were summarized. Li et al. [
36] used the CFD-DEM coupling method to simulate the transportation process of large-particle coal and found that the concentration of coal particles in the central area was beneficial to reducing pipeline wear.
In summary, many scholars at home and abroad have conducted in-depth research on the wear of grain-conveying pipes, dredging pipes, ash-conveying pipes, natural gas pipelines, etc. They have also put forward corresponding preventive measures. However, the research on the wear of shotcrete particle pneumatic conveying pipes is still relatively scarce, so this paper mainly focuses on the wear law of shotcrete pneumatic conveying pipes and puts forward corresponding preventive or control measures according to the wear law and the wear situation in actual projects.
4. Results and Discussion
4.1. Particle Motion Analysis
The distribution characteristics of the particles are shown in
Figure 2 and
Figure 3. The particles were blown up in suspension by compressed air in the inlet straight pipe. Particles moved forward under the action of air.
Figure 2 mainly represents the movement process of the particles in the pipeline. In order to see the distribution of particles more clearly,
Figure 2b is a partial enlargement of
Figure 2a above it. More information is shown in
Figure 3 which indicates the different states of large and small particles in the pipeline. When the particles reached the bend part, a large number of particles hit the wall and then slid along the outside of the pipe wall. After leaving the bend, the particles still accumulated at the bottom of the pipe due to inertia. They were suspended again in the pipe by the action of air until the outlet of the pipe.
The particles were gradually accelerated by the action of air after entering the inlet section. When the particles reached the bend part, a large number of particles hit the wall and the particle velocity dropped rapidly. However, the particle velocity did not decrease to a minimum value, but gradually decreased as the particles slid along the outside of the pipe. After leaving the bend, the particles were again suspended in the pipe until the outlet of the pipe.
Figure 3a,b shows the particle distribution for particle sizes of 7 mm and 12 mm, respectively. When the particle size was 7 mm, the mass of the particle was smaller and its own inertial force was smaller. The compressed air had a stronger role in carrying the particle. When the particles passed through the bend, some of the particles moved in the direction of the airflow. So, the particles of 7 mm in diameter passing through the bend were partially suspended in the pipe. When the particle diameter was 12 mm, the mass of the particle was relatively large. Its own inertial force was also relatively large and the air was weaker in carrying the particle. When the particles of 12 mm in diameter passed through the bend, the particles almost all moved along the outside of the pipe wall due to inertia. After the particles left the bend, the particles with a size of 7 mm were quickly blown up by the air and suspended in the pipe because of their small mass. On the other hand, particles with a size of 12 mm showed a longer distance before being suspended in the pipeline again. According to the analysis, due to the particle masses of the two different particle sizes being different, the large particles had a large mass and inertia and almost all of them moved along the outside of the pipe wall when passing through the bend. Conversely, due to the small mass and inertia of the small particles, a small number of particles would not move close to the outside of the pipe wall under the carrying effect of air when passing through the elbow. This phenomenon gives an explanation for why large particles cause more serious wear than small particles.
4.2. Pressure Distribution
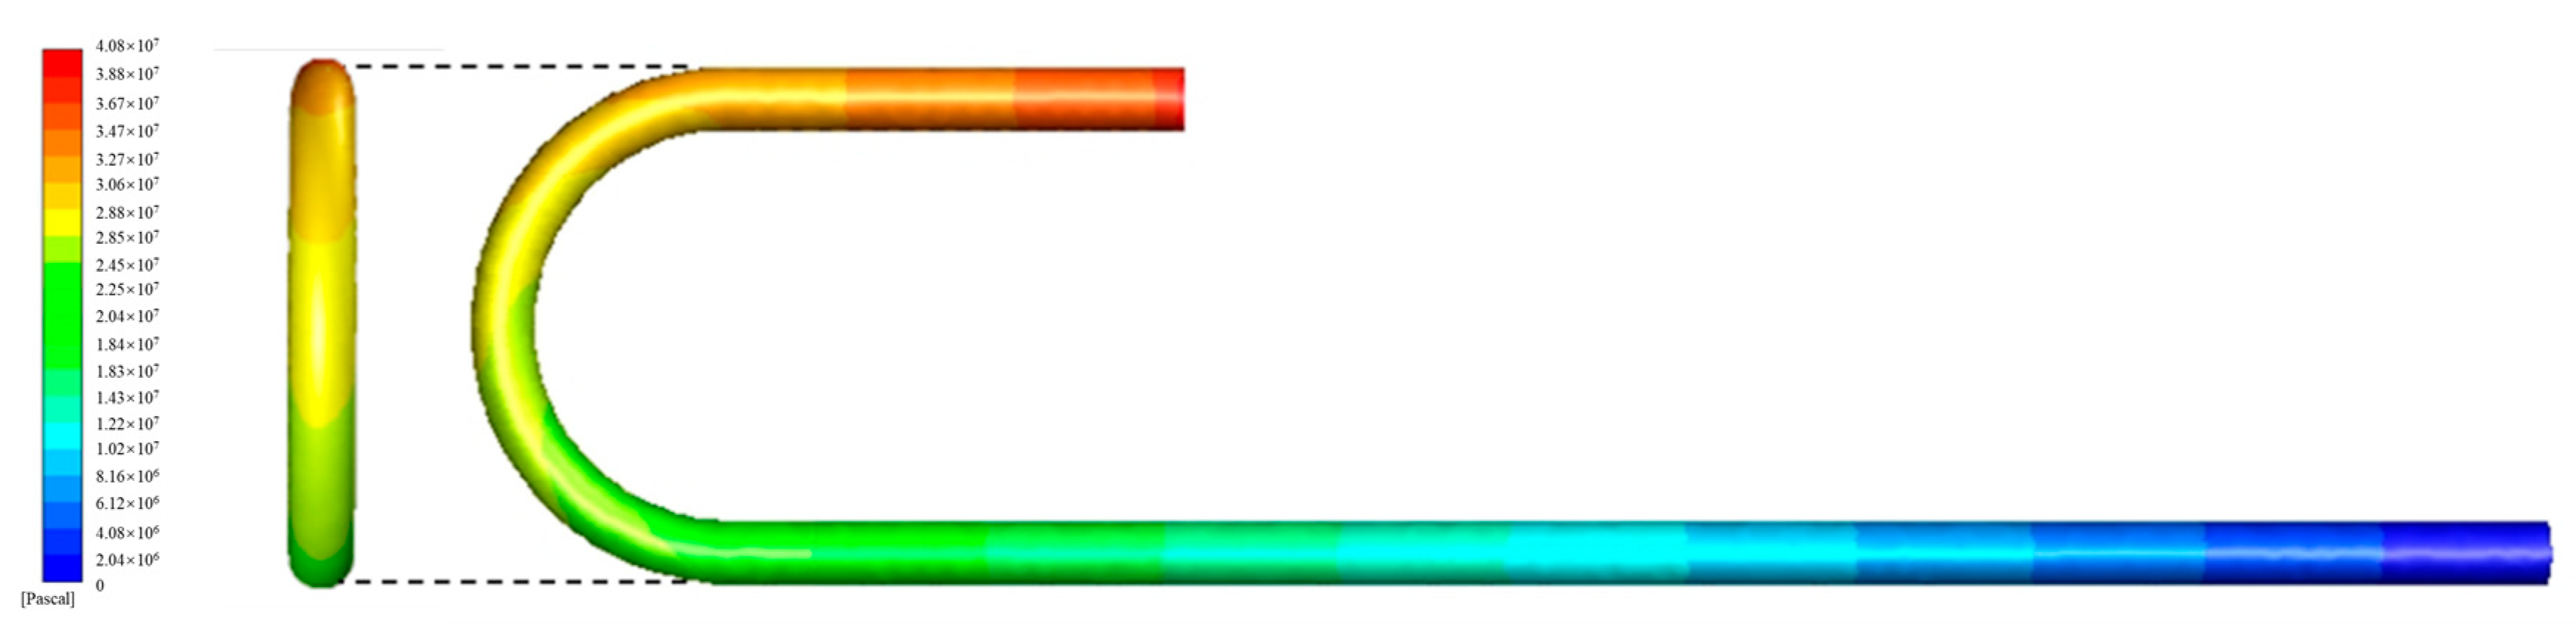
According to the simulation results, the pressure cloud diagram of the pipeline in
Figure 4 was obtained. The pressure was highest at the entrance of the pipe and then gradually decreased along the direction of airflow. Because the upper side of the pipe curvature was near the entrance, the inlet had stronger air pressure. On the other hand, the lower side of the pipe curvature was near the outlet, so its pressure was low. Moreover, as the particle flowed through the pipe, friction occurred with the pipe wall and a potential energy loss of airflow was produced. Therefore, the pressure reduced along the direction of airflow from the upper side to the lower side of the bend. In addition, when the particles passed through the bend, the particles hit the left side of the tube wall and formed contact pressure with the pipe wall because of inertia. The left pressure on the outside of the pipe wall was greater than the right side.
Figure 5 indicates the relationship between the pressure at the pipe inlet and the wind speed. The curve of inlet pressure with wind speed showed an increasing trend. The inlet pressure increased with an increase in wind speed; thus, the higher the wind speed, the higher the wind pressure. According to the analysis, the pressure on the same part of the pipe was different when the wind speed was different. Pressure increased with increasing wind speed. As the wind velocity became larger, the velocity of the solid particles became larger. Thus, the kinetic energy of the solid became larger when the solid particles hit the wall of the pipe.
4.3. Effects of Particle Diameter on Pipe Wear
To conduct the simulations to analyze the effects of different particle diameters on pipe wear, particles with diameters of 7, 8, 9, 10, 11 and 12 mm were selected. According to the simulation results, wear clouds with different particle diameters were obtained as shown in
Figure 6. The pipe wear over almost the entire outer part of the bend can be seen in
Figure 6a, but the amount of wear was low in the particles with diameters of 7 mm. When the particle diameter was 8 mm,
Figure 6b demonstrates that the wear position of the pipe still occupied the entire outer part of the bend, but the amount of wear was significantly larger than that from the 7 mm diameter particles. For the particles with diameters of 9 mm, the wear of the pipe continued to increase as indicated in
Figure 6c. Until the particle diameter increased to 10 mm, the wear of the pipe still continued to increase, with
Figure 6d indicating that the wear location of the pipe was almost entirely concentrated in the upper part of the bend. When the particle diameters increased to 12 mm,
Figure 6f clearly reveals that the location of wear in the pipe was more concentrated and the amount of wear was greater than that of the 11 mm diameter particles in
Figure 6e. The whole phenomenon in
Figure 6 implies that due to the different inertia of particles with different diameters (larger particles having a large inertia), the particles with larger diameters contacted more with the pipe wall than small particles when passing through the elbow, resulting in larger pressure and larger wear.
According to the maximum wear depth of the pipeline under different particle sizes, the relationship between the maximum wear depth of the pipeline and the particle diameter was obtained as shown in
Figure 7.
The maximum wear depth of the pipe became larger as the particle diameter increased. According to analysis, solid particles were mainly subject to their own inertial forces and fluid traction in pipeline transport. When the particles were passing through the bend, the traction of the fluid caused the particles to move in the direction of the airflow. Its own inertial force pushed the particles to strike the inner wall of the elbow. When the particle was small, the mass of the particle was also low, the airflow had a high carrying capacity for particles, this particle was subjected to traction, the inertial force of the particle itself was relatively small and the particles separated from the fluid relatively late. So the velocity of the particles hitting the bend wall was small, the impact angle when hitting the wall was small, and the impact position in bend was also more backward. Thus, when the particle diameter was small, the pipe wear was also slight, and the wear position was near the lower part of the bend. When the particle diameter increased, the mass of the particle increased, the inertial force of the particle increased, the carrying capacity of airflow to the particles decreased, the impact velocity of solid particles on wall surface increased, the amount of pipe wear also increased, the particles were separated from the fluid earlier and the particles hit the wall near the top of the bend.
Figure 8 illustrates that the maximum wear position of the bend part is between 90° and 135° for the particle of 7 mm diameter. The position of maximum wear was shifted upwards to between 45° and 135° for the particles of 8 mm diameter. The most severe wear position was shifted up to between 0° and 90°, when the particle size increased to 9 mm. For the particles of 10 mm and 11 mm, the most severe wear position was still between 0° and 90°, but it was significantly higher than that of the particle of 9 mm size. When the particle size increased to 12 mm, the position of maximum wear was completely shifted up to 0~−45°, closing to 30°.
As the particle diameter increased, the main position of wear gradually shifted upward. As the particle size increased, the mass of the particles also increased, the inertial force of the particle increased and the carrying effect of airflow on them weakened. After entering the elbow, the separation of particles and wind was earlier. The comparison in
Figure 9 between the particle size of 7 mm and 12 mm shows that the particle of 12 mm size is separated from the fluid earlier than that of the particle of 7 mm size. Therefore, as the particle size increased, the position of the particle hitting the elbow moved up in bend.
In summary, the degree of pipe wear increased with the increase in shotcrete coarse aggregate diameter. At the same time, the change in particle diameter was critical to the change in wear location. When the particle size was 7 mm, the slight wear position almost covered the whole bend. The particle size increased and the wear position gradually moved up. When the particle size increased to 12 mm, the wear was almost all concentrated on the outer part of the upper half of the bend. When the particle size was 7 mm, the most severe wear position was located near 135°. The position of the most serious wear gradually moved up with the particle size gradually increased. When the particle size increased to 12 mm, the position of the most serious wear moved up to about 30°.
4.4. Effect of Wind Speed on Pipe Wear
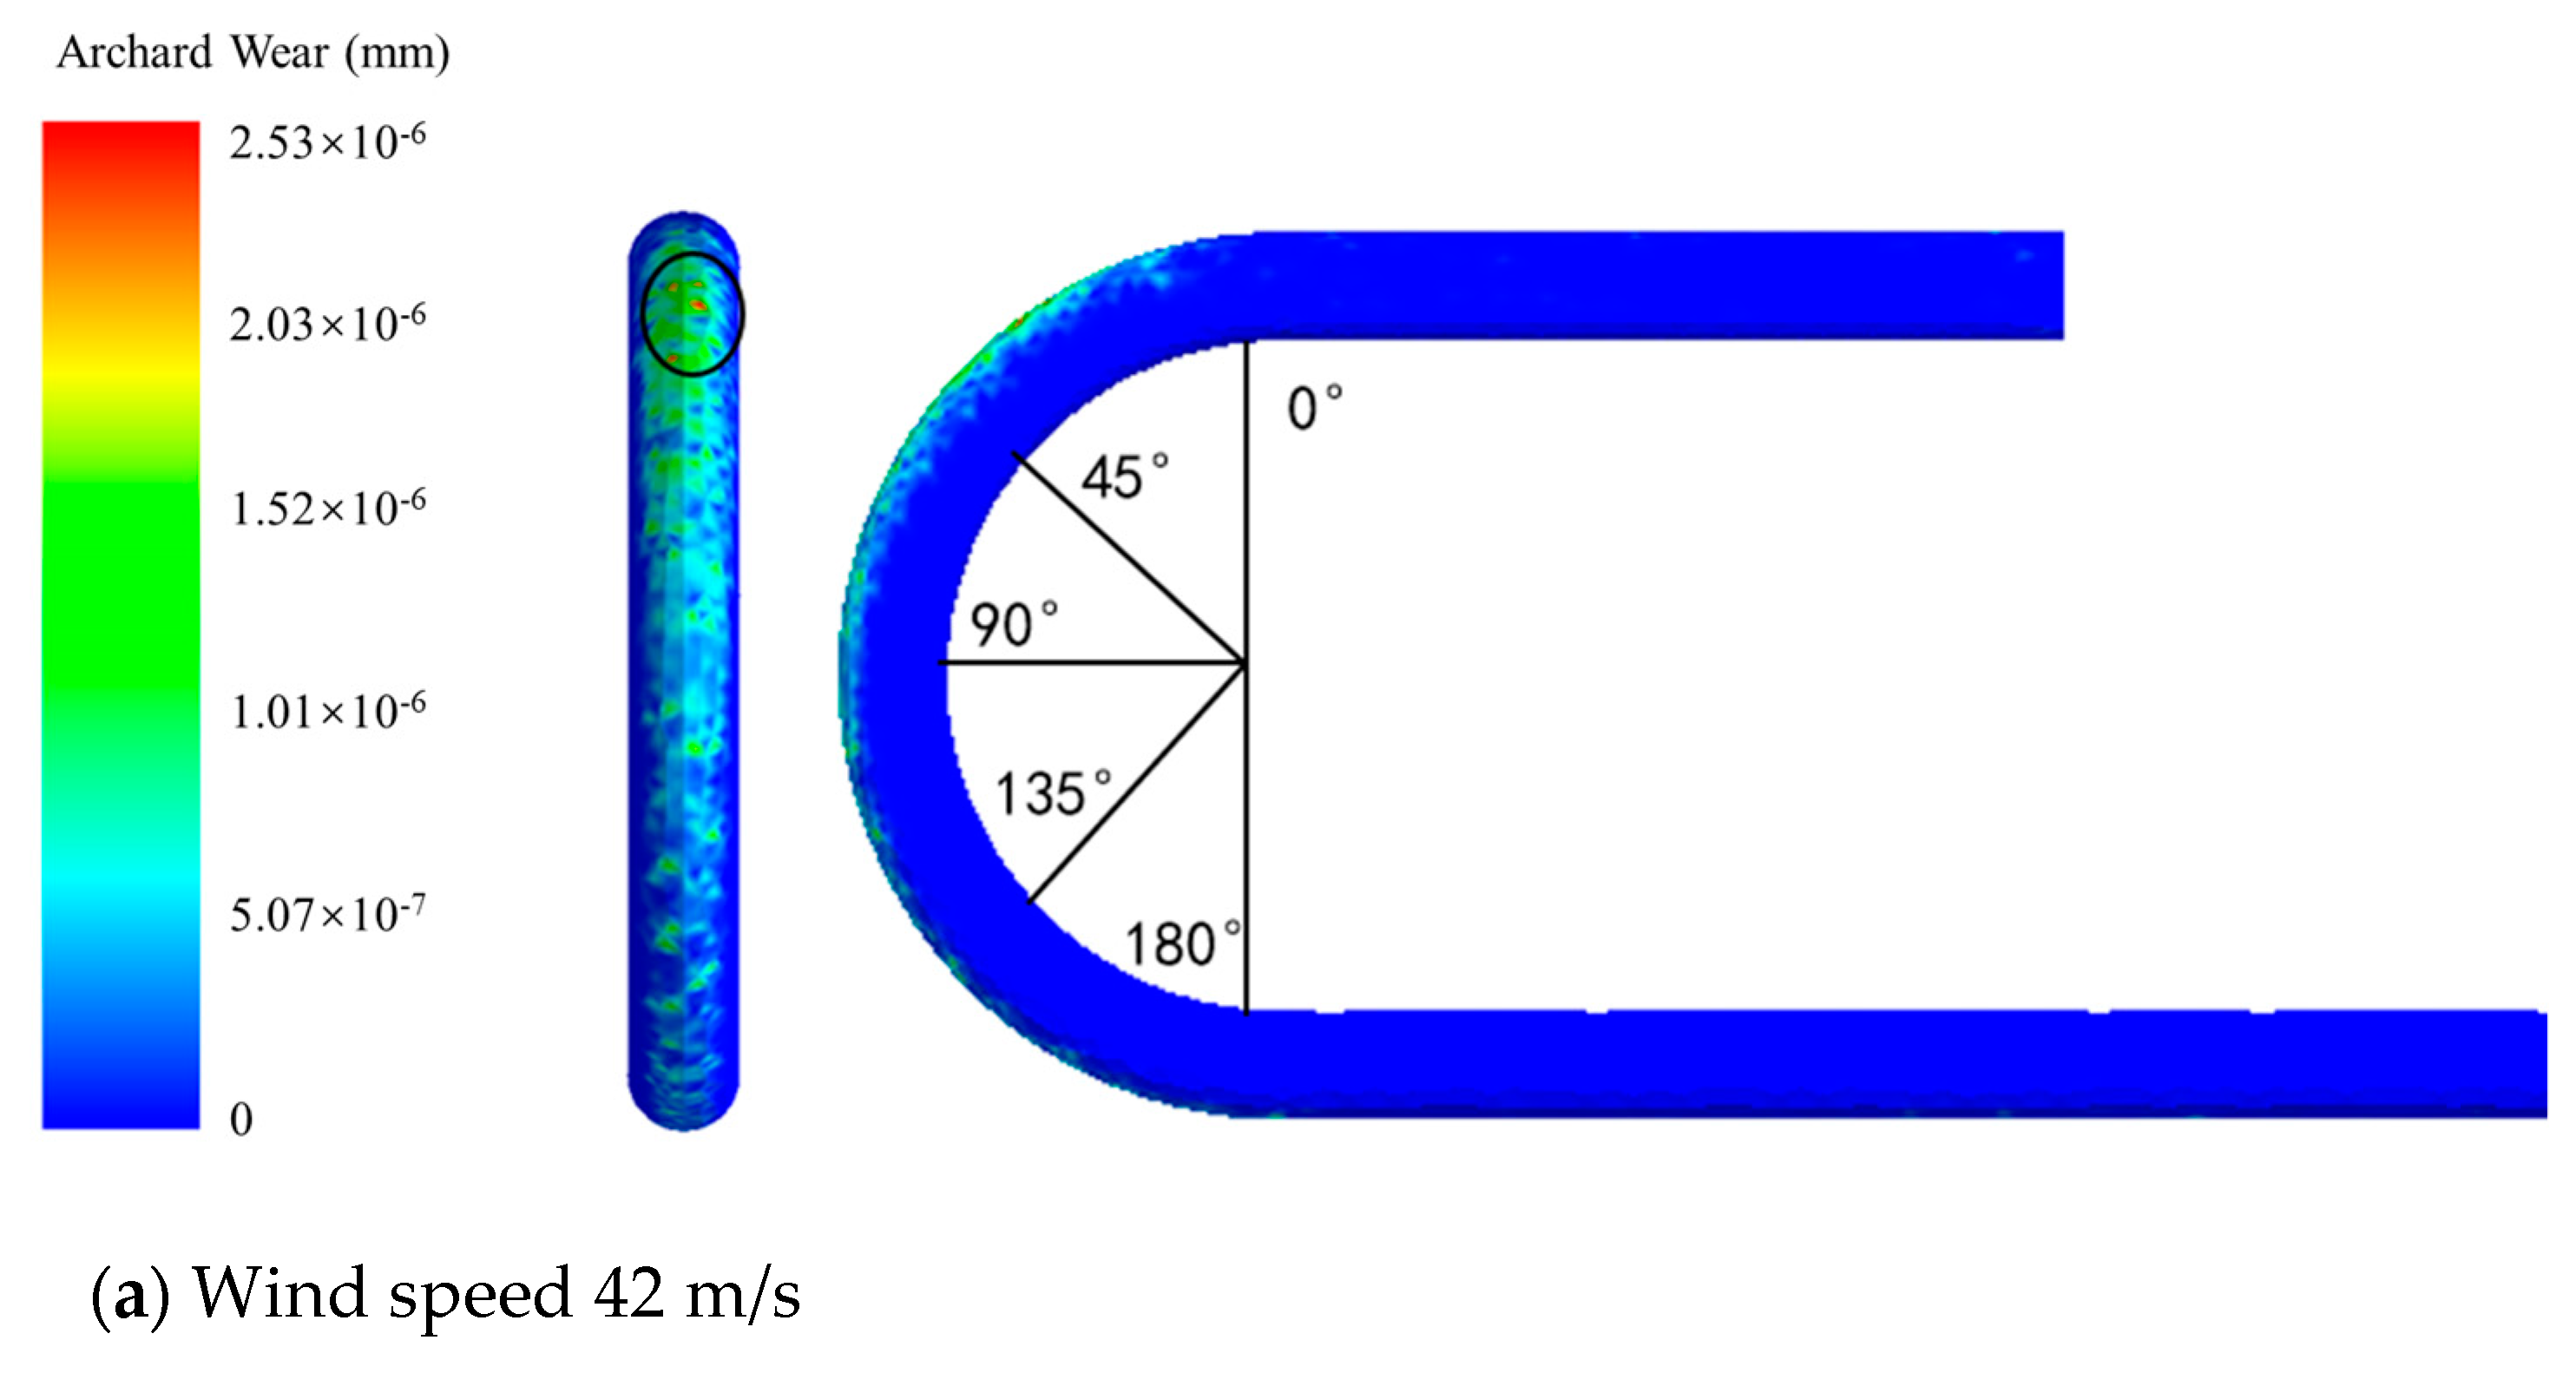
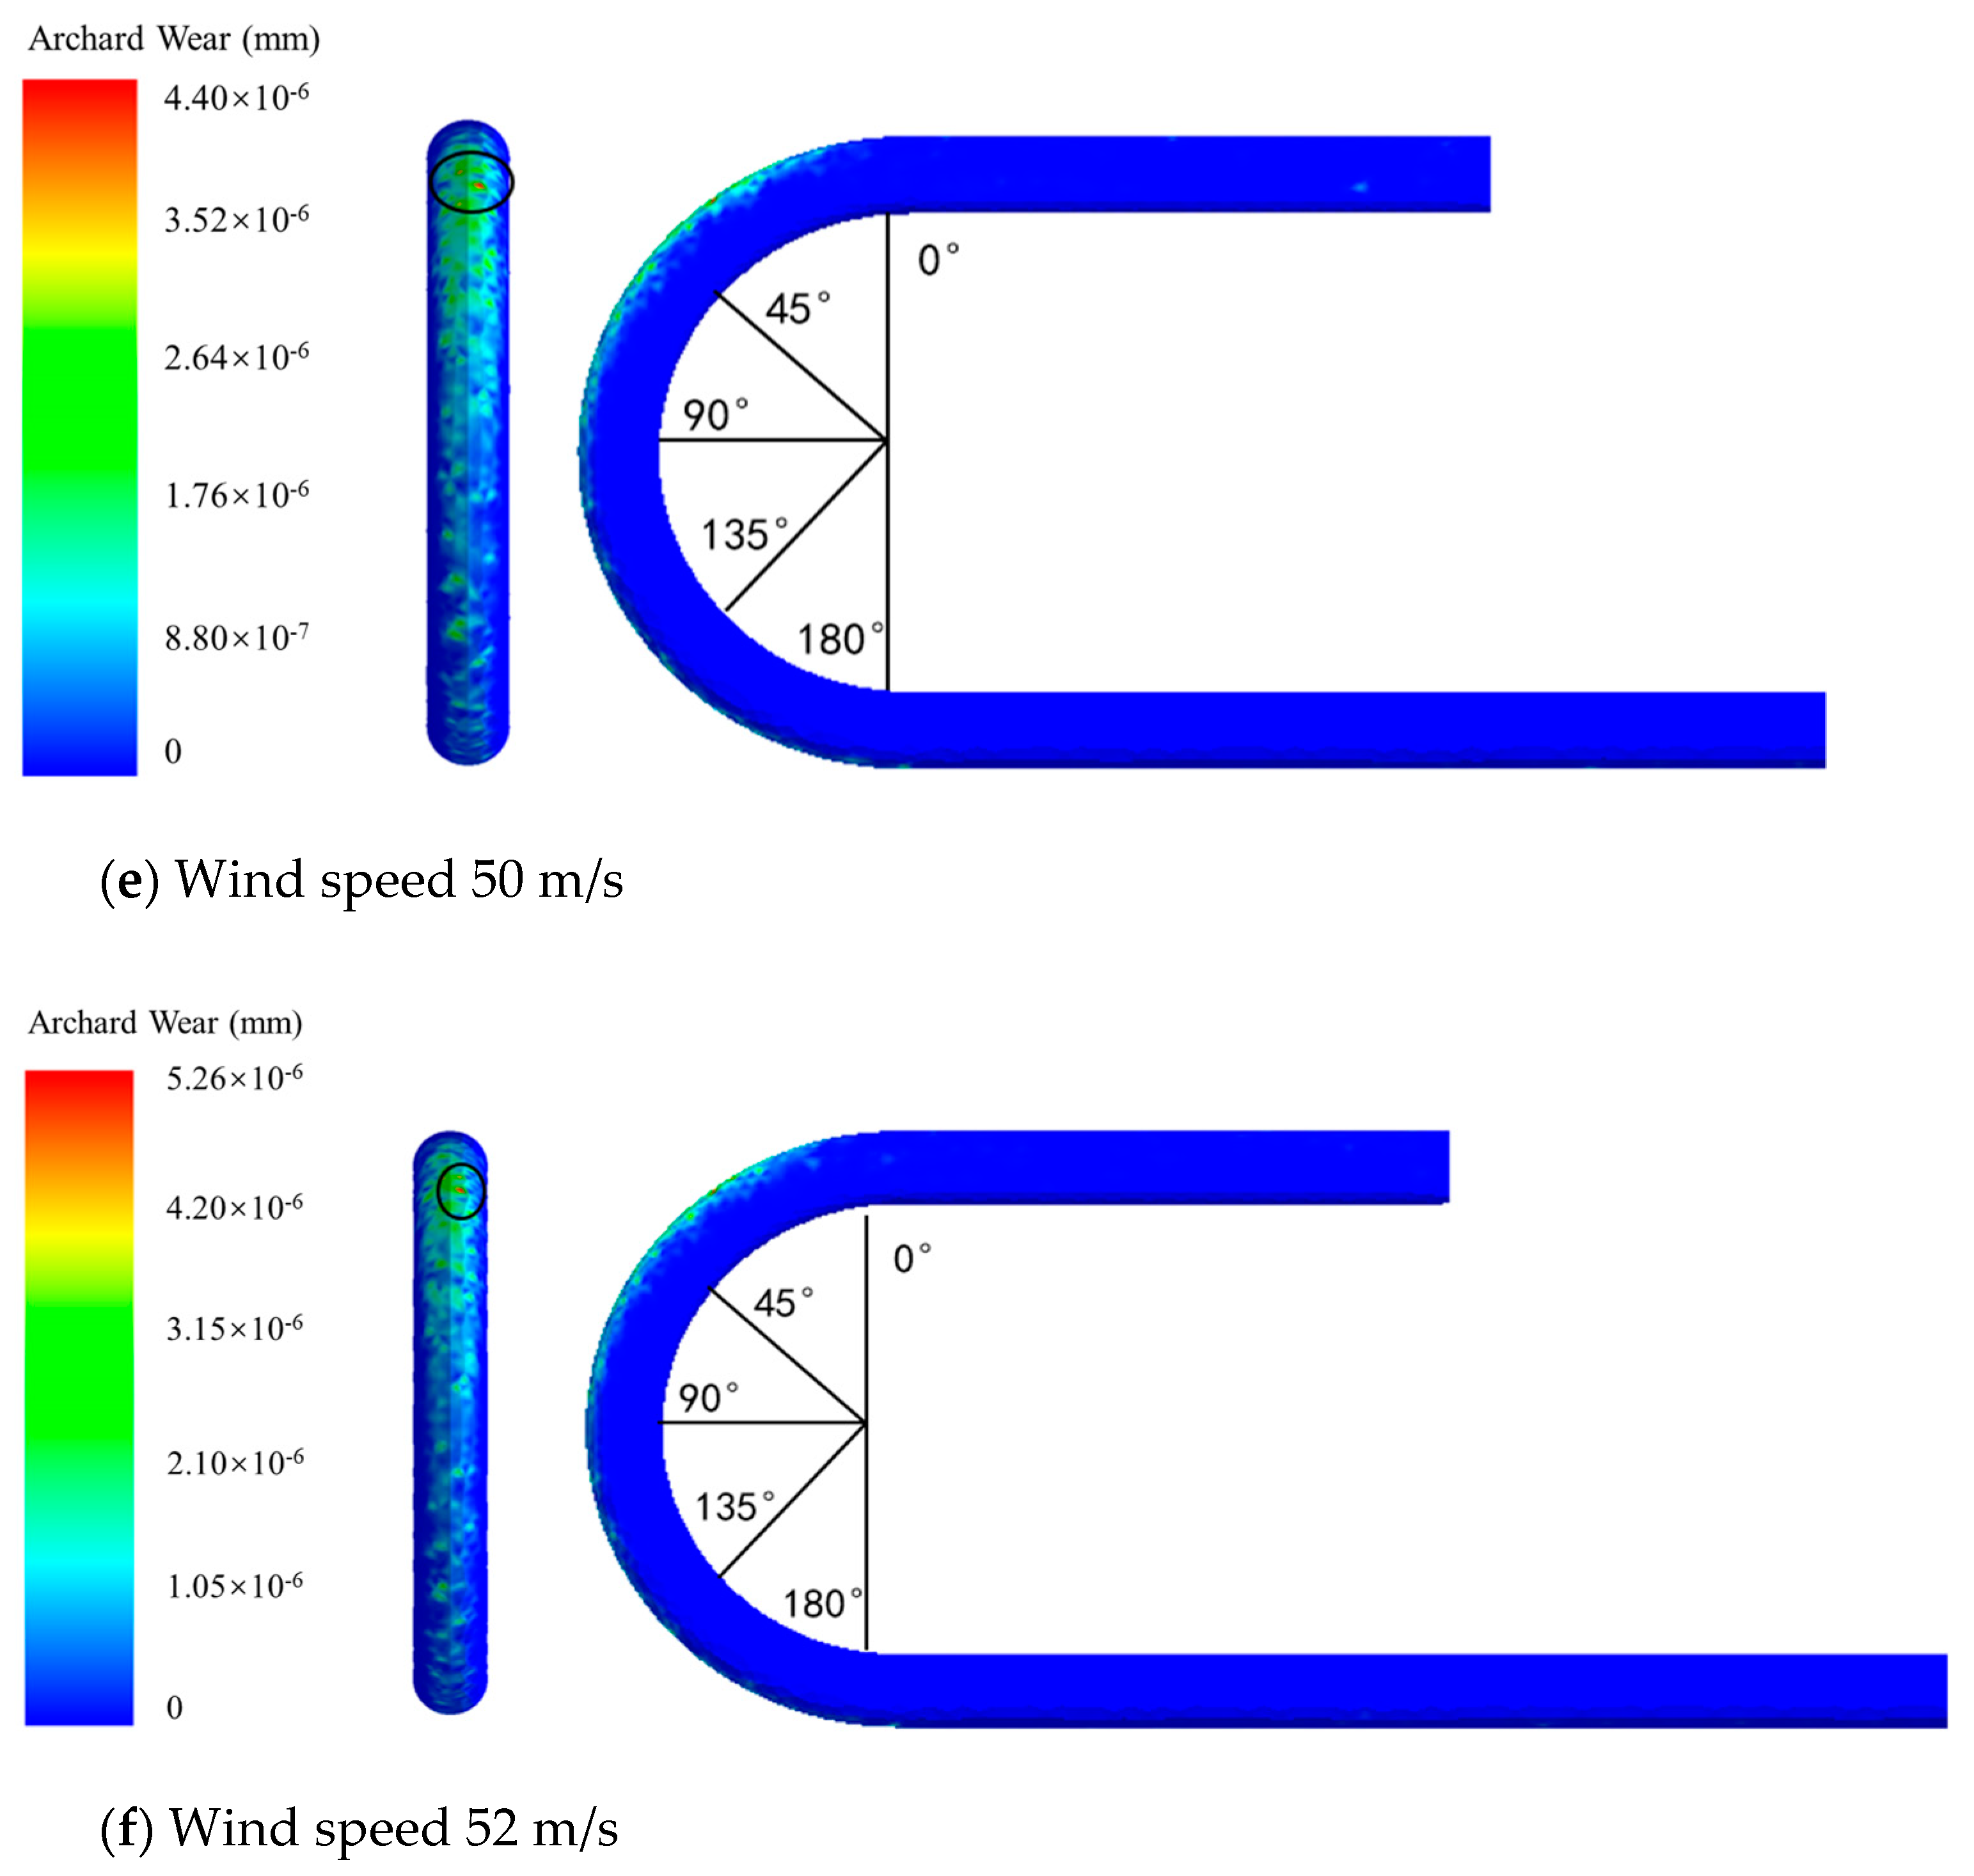
To analyze the effect of wind speed on the wear of conveying pipes, a radius of curvature of 250 mm was specified for the bend and the diameter of the particles was 12 mm. The wind speeds of 42 m/s, 44 m/s, 46 m/s, 48 m/s, 50 m/s and 52 m/s were selected by the control variable method for simulation. According to the simulation results, the influence law of different wind speed on pipe wear is shown in
Figure 10.
The variation in wind speed has almost no effect on the location of the pipe wear for a constant particle diameter as shown in
Figure 10. The entire outside of the bend was worn. The main wear location was still concentrated in the upper part of the bend. The degree of wear increased with the increase in wind speed. According to the maximum wear depth under different wind speeds, the change in the maximum wear depth of the pipeline with the wind speed is shown in
Figure 11.
Figure 11 shows that the maximum wear depth of the pipe increased gradually with the increase in airflow speed. Wear was caused by the collision and friction between solid particles and the pipe wall. All other conditions being equal, the velocity of the solid particles increased as the wind velocity increased. At the same time, since the energy of the solid particles hitting the elbow at a high speed was larger, it was easier to cause more serious wear. It can be seen that the change in wind speed had little effect on the wear position by analyzing
Figure 12. The main wear position was still located at 0–90° and the position with the greatest wear depth was located at 0–45°.
In summary, as the wind speed increased, the maximum wear depth of the pipe increased. The degree of wear was aggravated and the change in wind speed had almost no effect on the location of the wear in the bend.
4.5. Influence of Elbow Curvature Radius on Pipe Wear
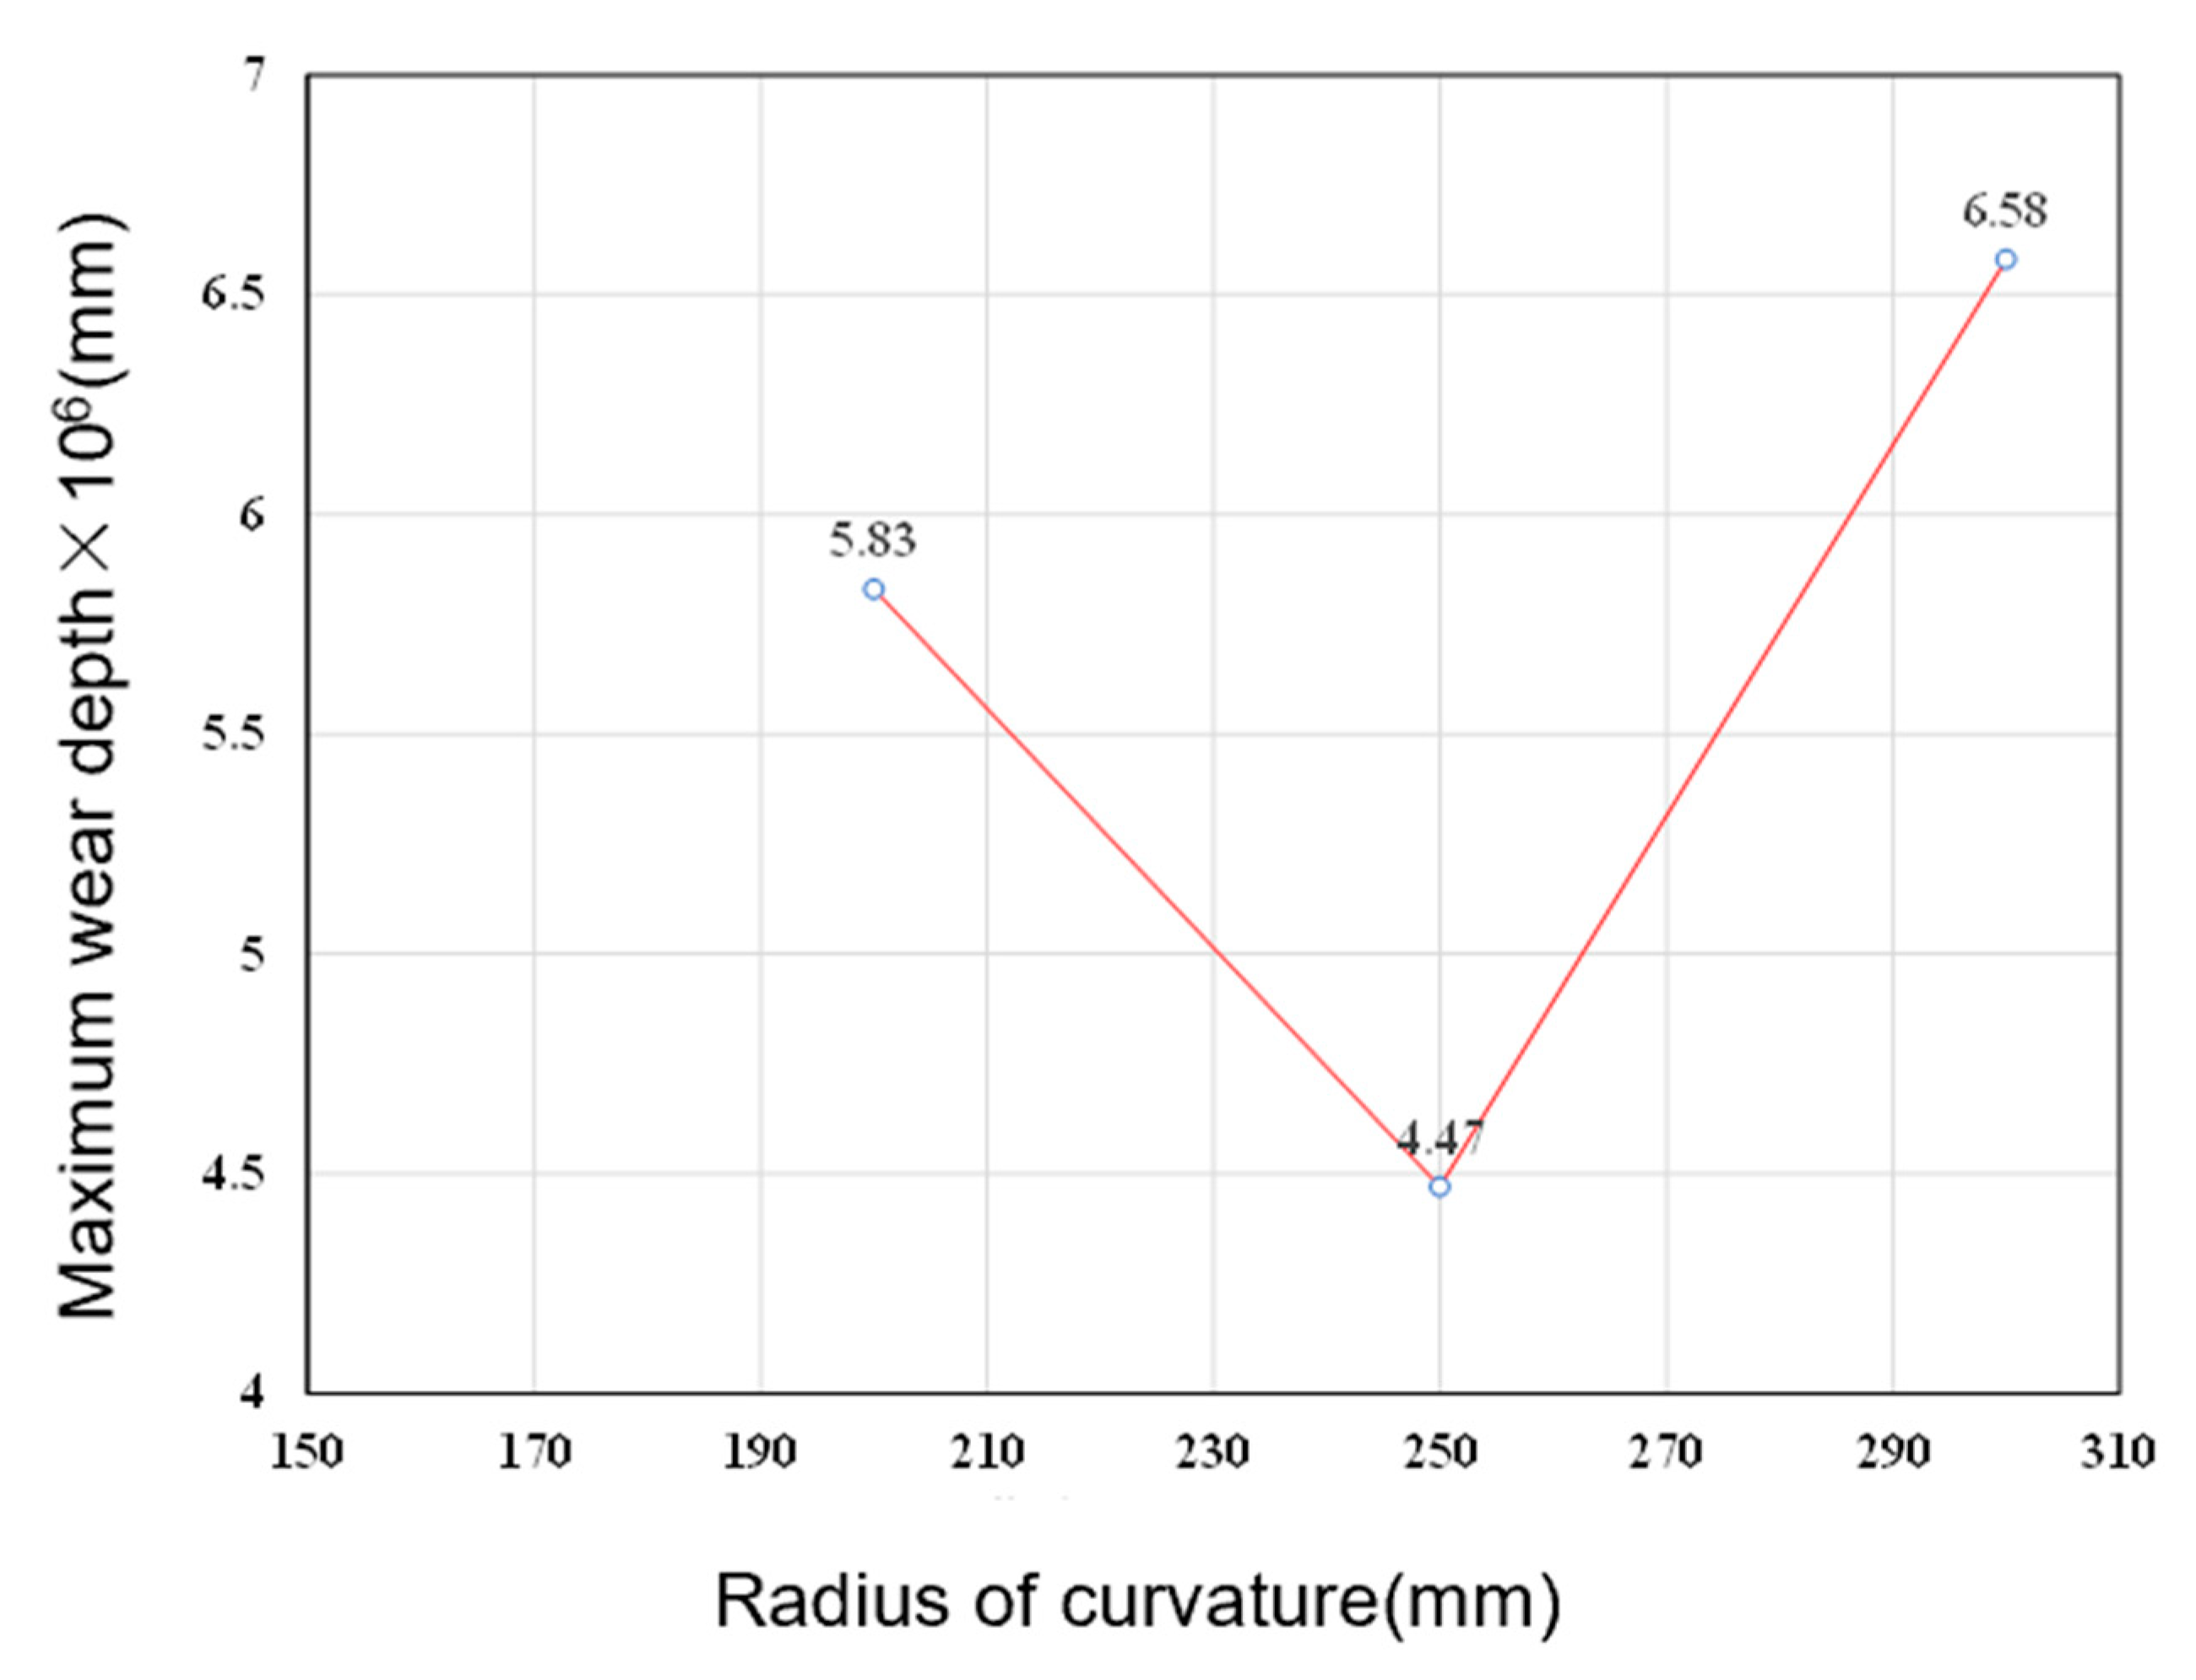
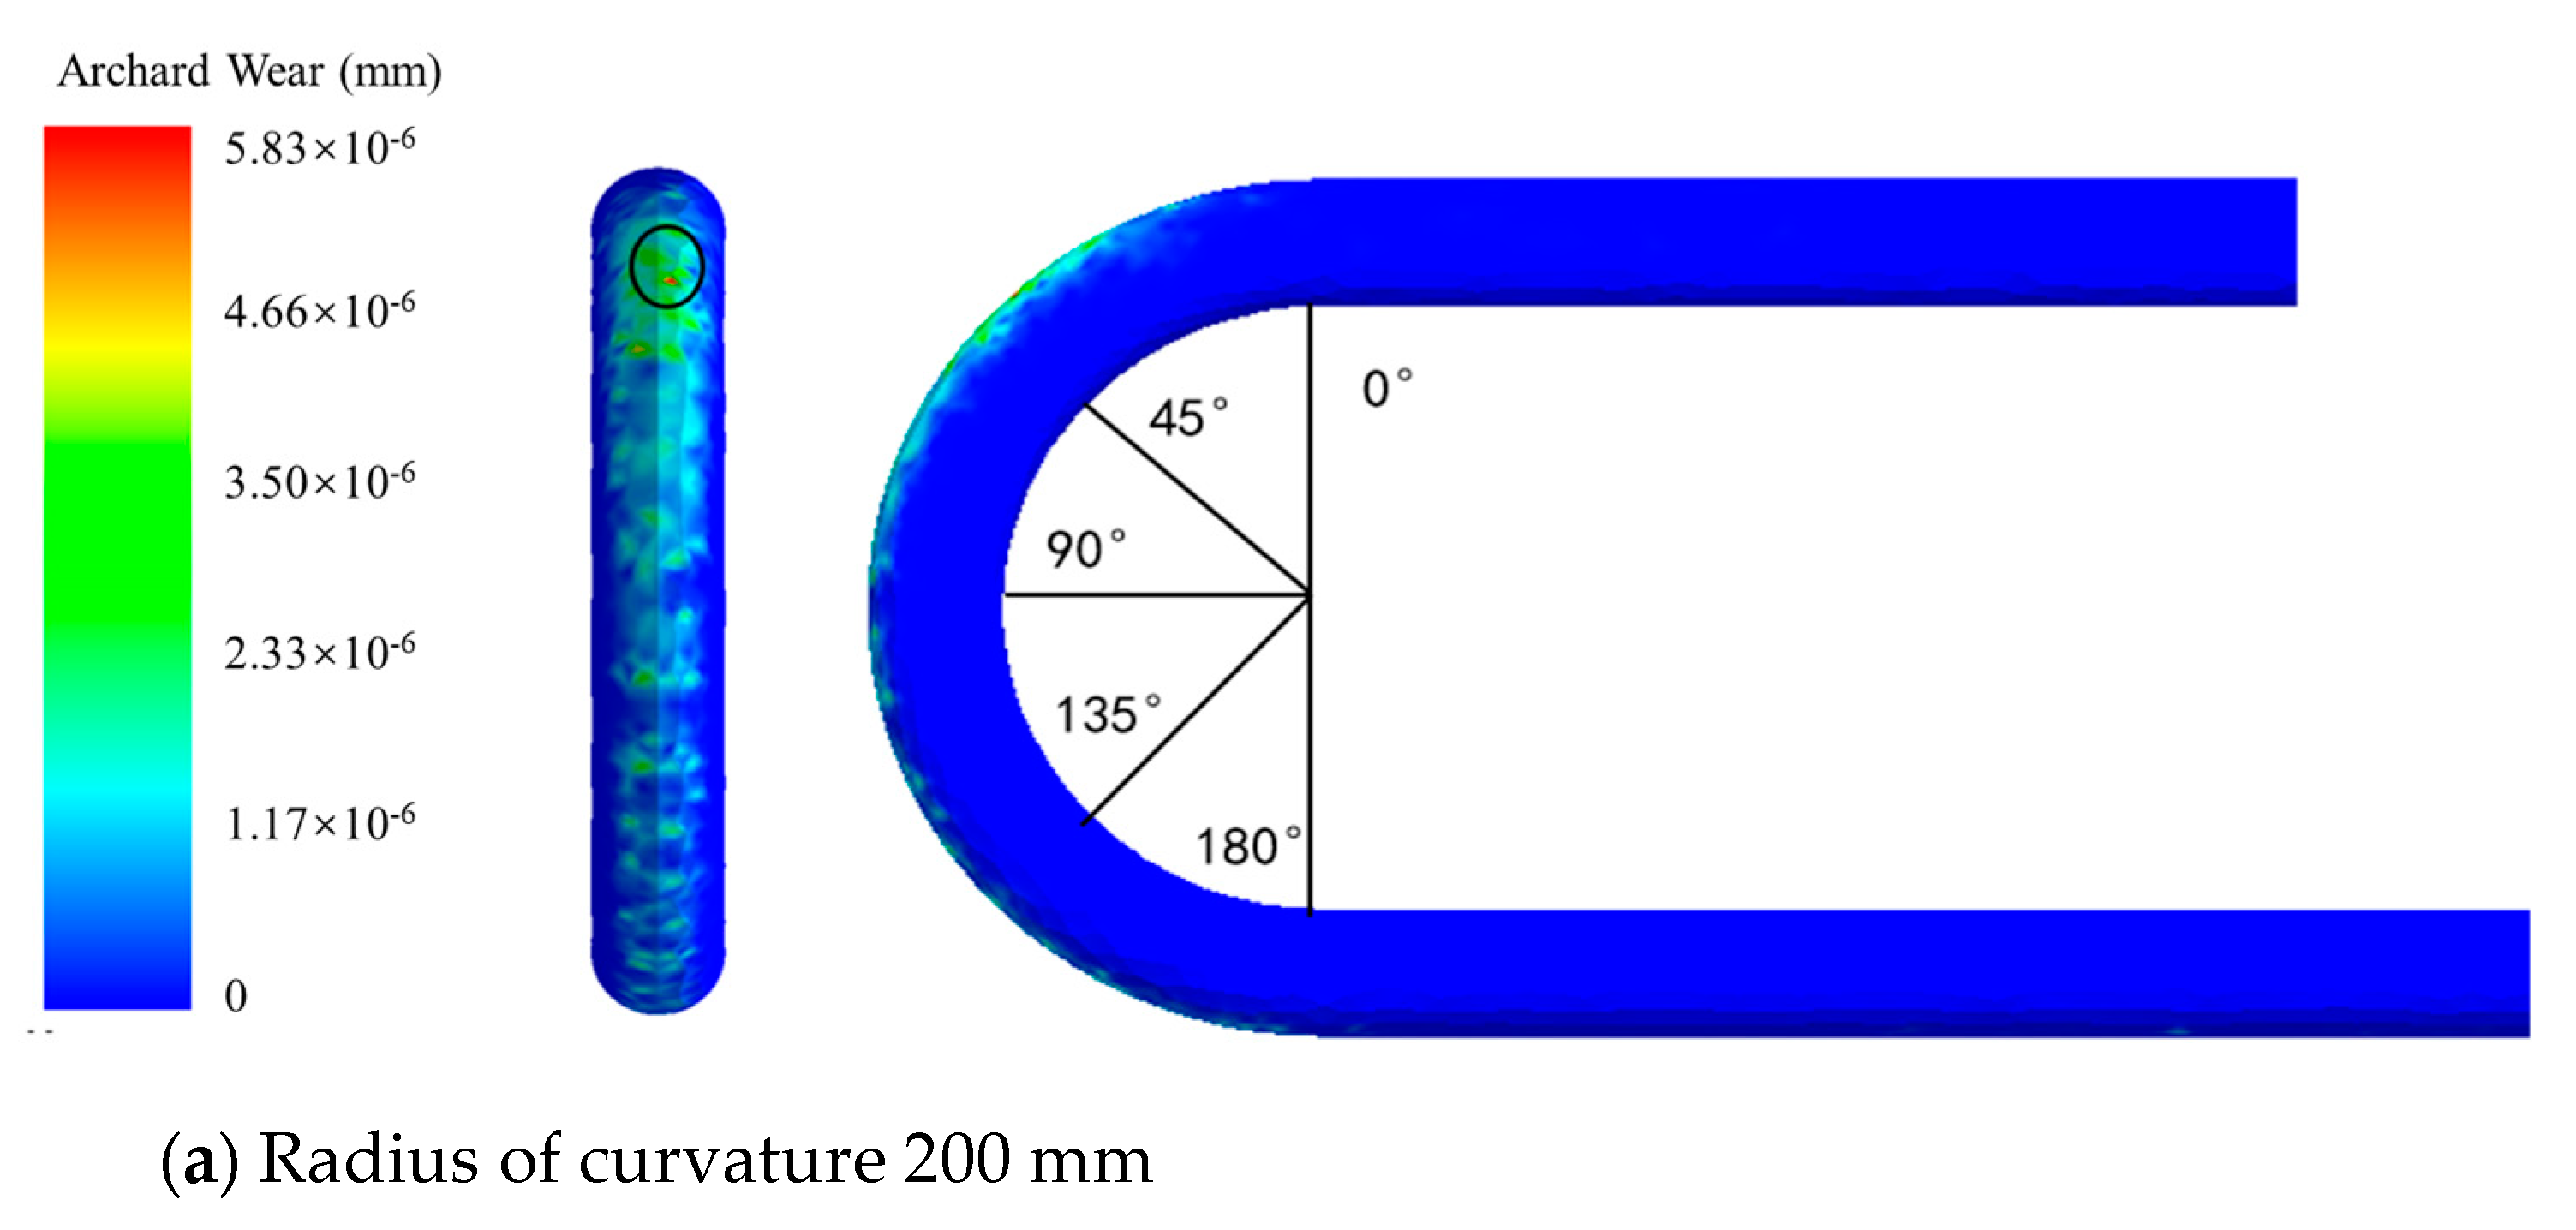
When analyzing the influence of the elbow curvature radius on the wear of the inner wall of the bend pipe, the size of the wind speed was specified as 50 m/s, the particle diameter was 12 mm, and then, the elbow curvature radii were chosen as 200 mm, 250 mm and 300 mm. By conducting simulations, different simulation results were obtained. From the analysis, wear clouds under the conditions of the same particle diameter and wind speed are shown in
Figure 13.
The wear area was mostly concentrated in the upper part of the bend when the curvature radius was 200 mm and the wear amount of the bend as a whole was larger. When the curvature radius increased to 250 mm, the location of the wear area did not change much and remained concentrated in the upper part of the bend, but the overall wear was reduced compared to that of the 200 mm curvature radius. When the curvature radius increased to 300 mm, the overall wear decreased compared to the 250 mm curvature radius, but the difference in bend wear was not significant.
When the elbow curvature radius was 200 mm, the maximum wear depth of the pipeline was 5.83 × 10
−6 mm. When the elbow curvature radius was 250 mm, the maximum wear depth of the pipeline was 4.47 × 10
−6 mm. When the elbow curvature radius was 300 mm, the maximum wear depth of the pipeline was 6.58 × 10
−6 mm. The relationship between the maximum wear depth and the elbow curvature radius is shown in
Figure 14.
Figure 14 shows that the maximum wear depth was minimal at an elbow curvature radius of 250 mm when compared to the wear at elbow curvature radii of 200 mm and 300 mm. The maximum wear depth did not show a clear trend with respect to the elbow curvature radius. The maximum wear depth of the pipe decreased when the elbow curvature radius was increased from 200 mm to 250 mm. When the elbow curvature radius increased, the bend was smoother, the impact angle of the particles on the pipe wall was smaller and the degree of wear was also smaller. However, the maximum wear depth increased when the elbow curvature radius increased to 300 mm, so it is not true that the degree of wear became less as the elbow curvature radius became larger.
It can be seen from
Figure 15 that changes in the curvature radius have less of an influence on the position of pipe wear. At all three radii of the curvature in this study, the major wear locations were between 0° and 90° and the most severe wear location was between 0° and 45°, at approximately 30°.
According to the results of this simulation, the overall wear degree and the maximum wear depth of the elbow decreased when the elbow curvature radius increased appropriately. Moreover, if the elbow curvature radius was too large, the maximum depth of wear would also increase. So, increasing the elbow curvature radius did not ensure a better effect. The elbow curvature radius had almost no effect on the position of wear. The main wear position was on the outside of the upper part of the bend and the most serious wear position was around 30°.
5. Pipe Wear Control Strategy
In the process of conveying shotcrete, the bend pipe is the most easily worn position. It is very easy for solid particles to collide with the pipe wall at the bend and cause wear. If the inner wall of the pipeline is seriously worn, the wear is easy to wear through, affecting material transportation and resulting in safety accidents. Effective measures must be taken to reduce the wear of pipes. Control measures were proposed to reduce the wear of shotcrete-conveying pipes based on some wear laws derived from the previous section and the wear of pipes in actual projects.
(1) Control the size of aggregates
The wear of shotcrete-conveying pipes is mainly caused by the collision and friction between the coarse aggregate and pipe wall, with a greater size of the aggregate having a greater impact on the wear of the pipe. As obtained from the study on the effect of particle diameter on the wear condition of the pipe in the previous section, the maximum wear depth of the pipe increased from 1.48 × 10⁻⁶ mm to 4.58 × 10⁻⁶ mm when the diameter of particles increased from 7 mm to 12 mm, and the degree of wear became larger. In the particle size range studied in this simulation, the maximum wear depth of the pipes increased with an increase in particle diameter. In the case of meeting the requirements of shotcrete for coarse aggregate grading, minimizing the amount of coarse aggregate could effectively reduce the degree of pipe wear.
(2) Control the size of the wind speed
In the study of wind speed affecting pipe wear, it was known that the maximum wear depth of the pipe increased from 2.53 × 10⁻⁶ mm to 5.26 × 10⁻⁶ mm when the wind speed increased from 42 m/s to 52 m/s. In the wind speed range of this simulation study, the maximum wear depth of the pipe wall increased with increasing wind speed. As the velocity of solid particles increased, more energy was applied to hit the pipe wall. An appropriate reduction in wind speed could effectively reduce the degree of pipe wear and the reduction in wind speed could also reduce the energy consumption of shotcrete. However, when the wind speed was too small, the shotcrete would accumulate at the bottom of the pipe under the action of gravity. Therefore, the wind speed should not be reduced indefinitely to ensure normal material flow and also to meet the technical requirements of shotcrete.
(3) Control the bend radius
When using a bend, the bend with a larger radius of curvature could be chosen. When the curvature radius of the pipeline was 200 mm, the maximum wear depth of the pipeline was 5.83 × 10⁻⁶ mm. When the curvature radius of the pipeline was 250 mm, the maximum wear depth of the pipeline was 4.47 × 10⁻⁶ mm. When the curvature radius of the pipeline was 300 mm, the maximum wear depth of the pipeline was 6.58 × 10⁻⁶ mm. The proper radius of curvature should be selected according to the actual working conditions.
(4) Other control measures
In the process of material transportation, improvements are made in terms of the shape of the aggregate, the wear resistance of the pipe itself and the construction of the pipe foundation. When the aggregate shape is irregular, it is likely to cause cutting wear on the pipe wall. In order to reduce the degree of wear of the pipe, smooth surface pebbles could be chosen as coarse aggregate under the condition of meeting the technical requirements of shotcrete. Selecting piping materials with good wear resistance could effectively reduce the degree of piping wear. A layer of wear-resistant material could be wrapped around the outside of the pipe to form a double-layer casing inside and outside to improve the wear resistance of the pipe. For localized wear and leaks that occur in the pipeline, wear repair agents are needed. Scoring thread lines on the inner wall of the tube could change the slurry flow state, thus reducing the deposition of solids and reducing the impact energy of the material on the tube wall.


 ,
, 


