1. Introduction
Australia is ageing, with 16.8% of the population aged 65 and over in 2021 [
1]. Meanwhile, the vast majority of older Australians prefer to age in place, i.e., living in their own homes and communities regardless of age, income, or ability level in order to maintain their safety, independence, and comfort [
2]. This provides a convenient and secure environment, ensures physical and mental well-being, and provides assistance on a daily basis [
3,
4]. Nevertheless, ageing in place can also pose challenges for older individuals due to a variety of factors such as social isolation, increasing cost of long-term care, decreased physical capabilities and lack of preparedness in the community [
5]. Therefore, it is important for local governments and urban planners to provide an environment that is age-friendly on both the community and individual level in order to support ageing in place for older people [
6].
Originally developed in the United States in the 1980s, naturally occurring retirement communities (NORCs) enable older individuals to remain in their homes and avoid relocating into more restrictive living arrangements [
7]. Although the definition of NORCs has changed continuously over the past 35 years depending on chronological, geographic, and residential changes, they are most widely defined as communities where 40% of the heads of households are older adults [
8]. Given the high density of the older population in NORCs, they are well suited to serving older adults and to supporting collaborations among residents, communities, service providers, and the public sector. Therefore, NORCs are viewed as a crucial model for promoting physical and mental well-being of older individuals in the United States, as well as supporting ageing in place [
9].
Referring to the development of NORCs in the US and taking into account the unique demographic characteristics of Australia, E, Xia et al. [
10] proposed an Australian version of the NORC concept, which is defined as a community with 40% or more household members aged 65 years and over. This concept has great potential as a cost-effective and efficient model for promoting successful ageing in place for older Australians. Furthermore, by examining the geographical distribution of the older population in the Greater Brisbane region of Australia between 2006 and 2016 based on the ABS census data, they found that the number of NORCs has increased rapidly (from 25 in 2006 to 92 in 2016) and the distribution of NORCs has been more inclined to coastal and riverine areas. In addition, it was found that the increase of NORCs in coastal areas might be due to the in-migration of older people (65+), as a large percentage of Australians would prefer to reside in an area with a beachside setting, accessible beachfront recreational amenities, and enhanced social connections.
Although the findings from E, Xia et al. [
10] provided insight on the evolution of NORCs in the Greater Brisbane region, data availability (the latest available at the time being 2016 census data) may have prevented revealing the clear trend of this emerging phenomenon in Australian society. In order to better understand the most recent growth trends of NORCs and to validate the results and predictions of the previous study, we conducted a similar spatial analysis using the newly released 2021 census data, and more specifically, examined NORC distribution in the most recent decade (between 2011 and 2021).
This study, therefore, aims to conduct an updated geographical analysis of NORC distribution using the latest 2021 census data and to examine the growth of NORCs in the past decade. The specific objectives were:
Analyze the growth and distribution of NORCs in the Greater Brisbane region over the past decade, using the latest 2021 census data.
Provide insights into the patterns that contribute to the formation of NORCs in the Greater Brisbane region.
Explore the future development of NORCs in the Greater Brisbane region based on the trends identified in the analysis.
By analyzing Australian NORCs from a spatial perspective, this study provides new insights into the formation of NORCs as well as predicts their future growth trends, enabling various stakeholders, particularly policymakers, to assist older Australians in ageing in place by developing age-friendly communities.
2. Materials and Methods
In Australia, the ABS conducts the Census of Population and Housing every five years, counting each individual and household. This study did not use the 2006 Census data for comparison analysis because the basic unit of data collection in the 2006 census and earlier was the Census Collection District (CD) [
11], which has been abandoned since the 2011 Census. For the 2011, 2016 and 2021 Censuses, data from the Census of Population and Housing are aggregated from Mesh Block level into Statistical Area Level 1 (SA1) units in order to maximize the degree of geographic detail and ensure that there are not too few residents in the minimum measurement unit [
12]. SA1s generally have an average population of about 400 people. The SA1 was thus set up as the baseline unit of analysis to measure the community or neighbourhood characteristics of an appropriate number of older adults. NORCs are determined based on the proportion of older adults [
10] in each SA1.
According to the geographical boundaries and characteristics of the census, spatial and temporal data analysis was conducted using a geographical information system (GIS) in order to determine the pattern of distribution of older people and NORCs in Australia. This analysis included spatial autocorrelation, cluster analysis, outlier analysis, and hotspot and cold-spot analyses. The latest Australian Bureau of Statistics (ABS) Census data for 2021 for the Greater Brisbane region was used to compare with the data for 2011 and 2016. Census data from the ABS can be customized to include the character of usual household members based on a selection of geographic regions and age ranges.
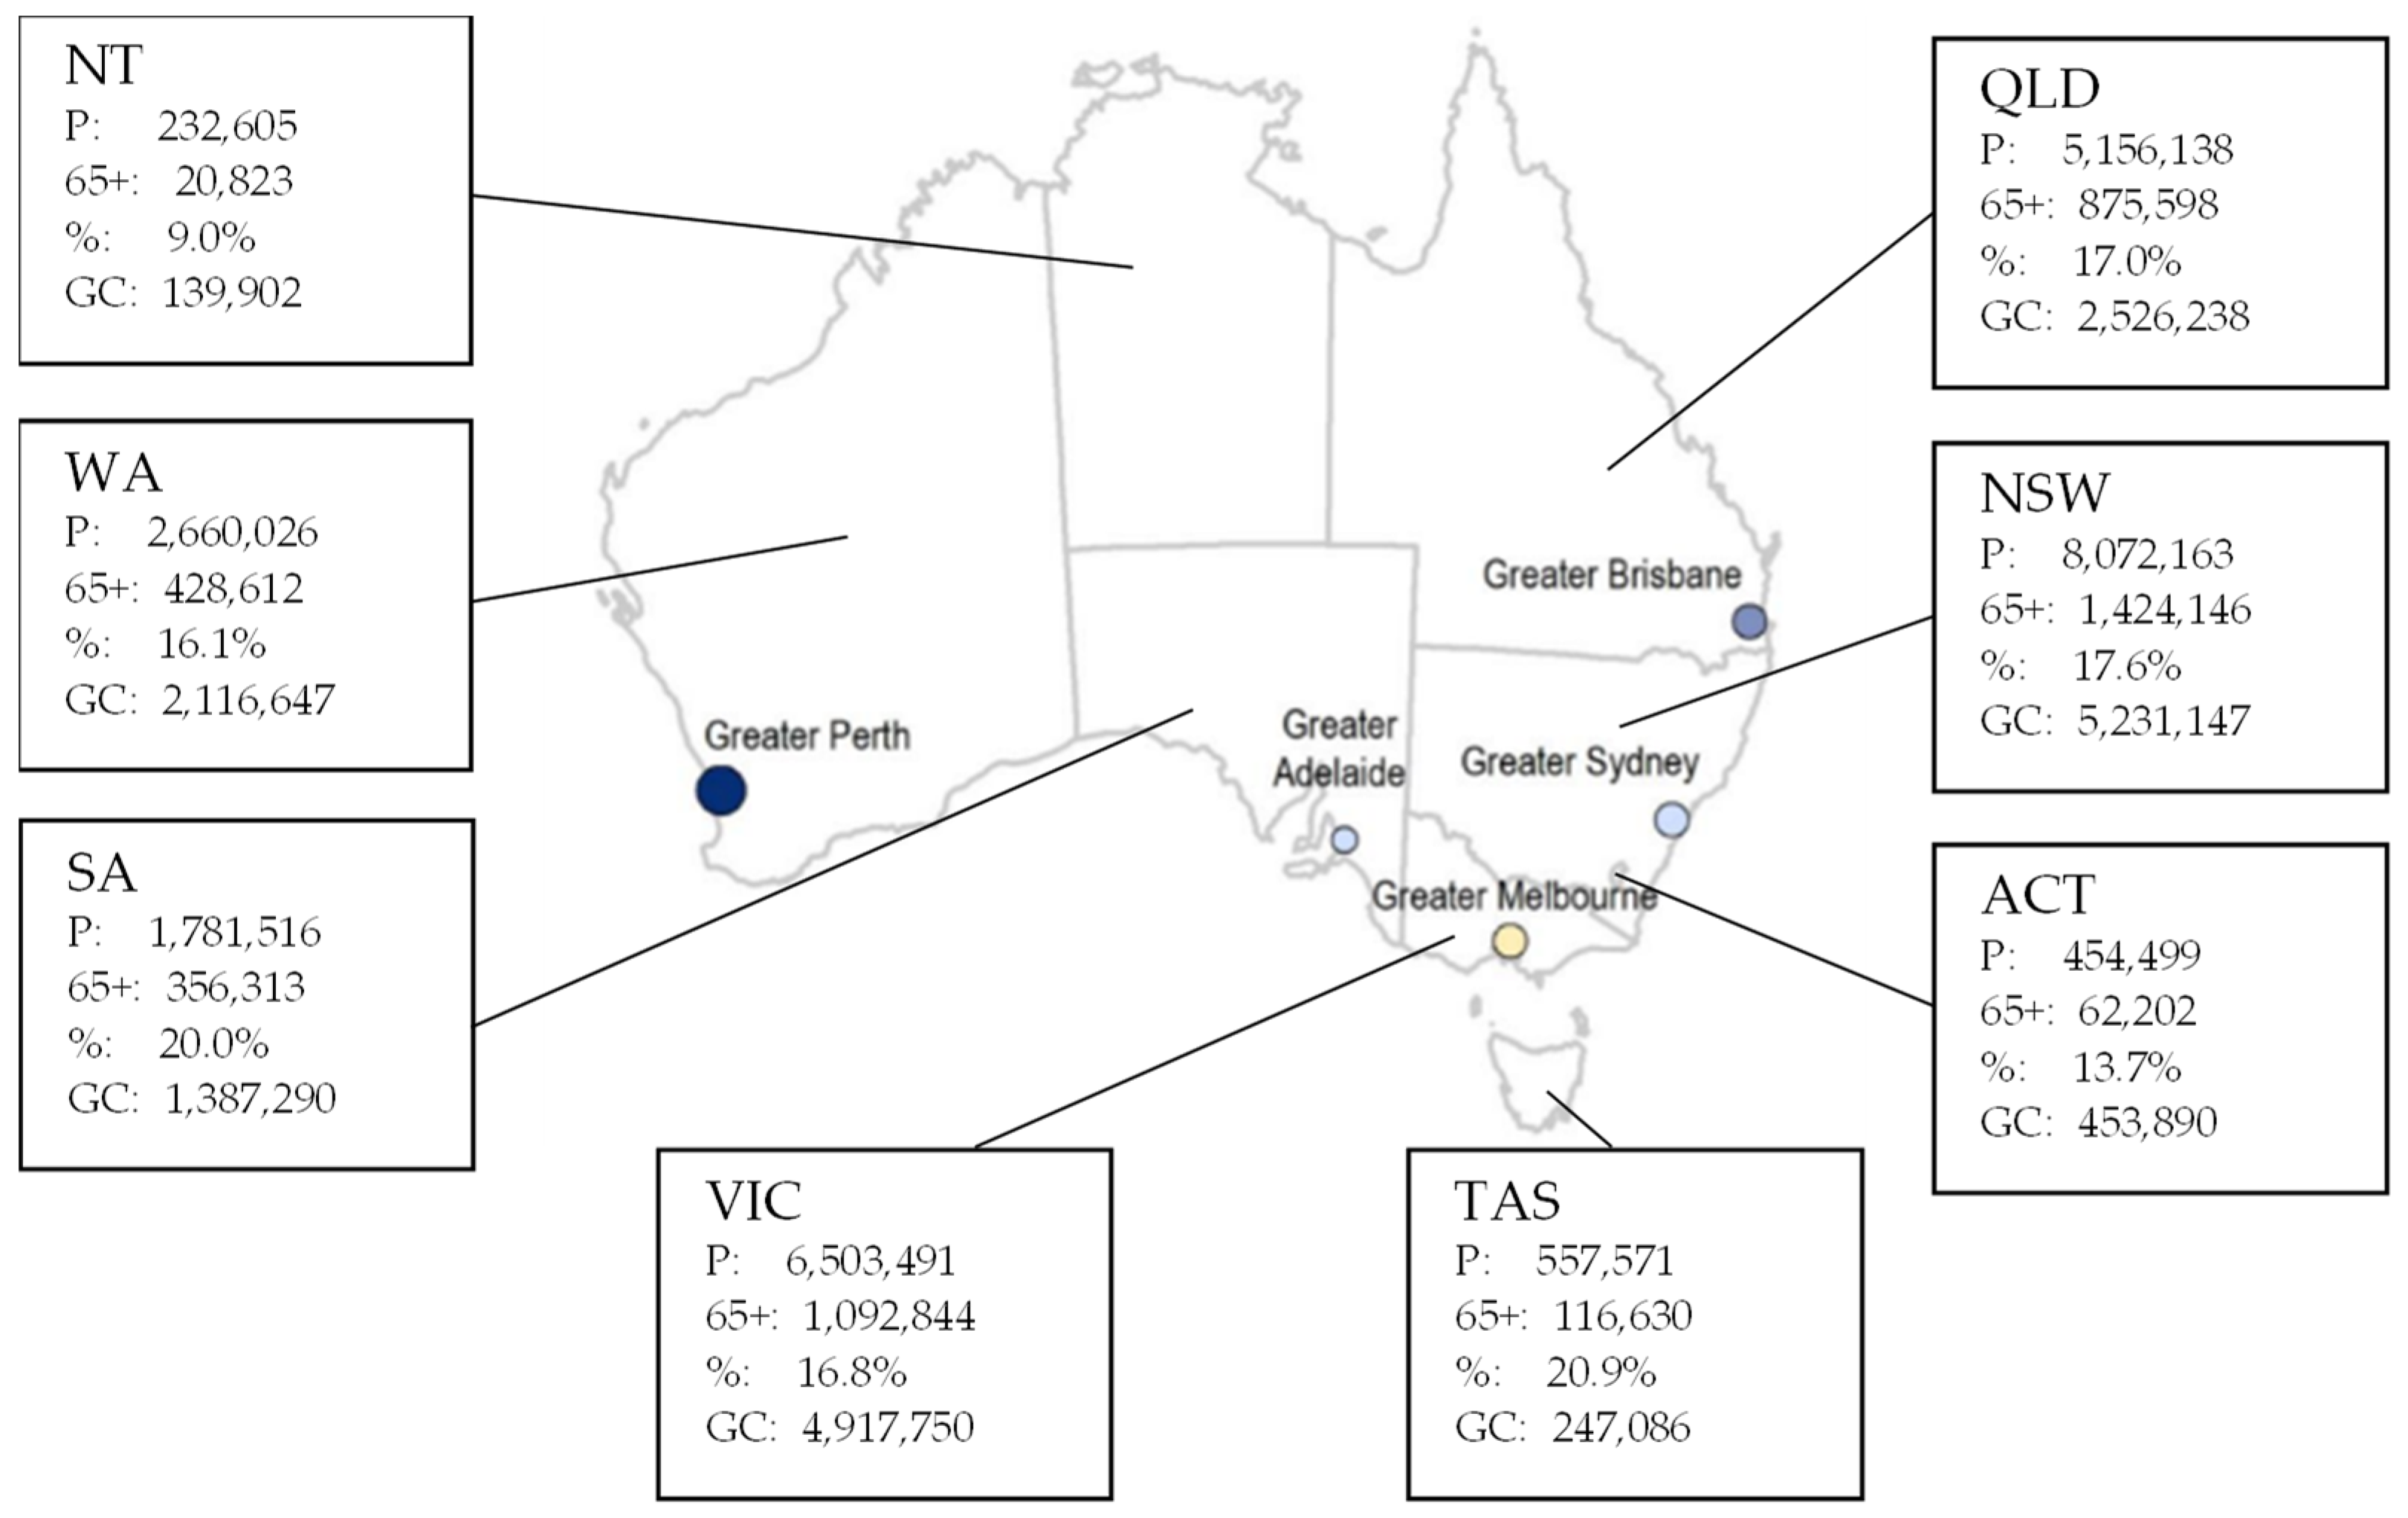
Figure 1 shows the Australia administrative map with the major Greater Capital regions and eight States and Territories, showing total population (P), older population (65+), proportion of older population (%) and population of Greater Capital regions (GC) in each state or territory. The population of each state is concentrated in its Greater Capital (GC) region. Brisbane (QLD) is the third largest city in Australia, behind Sydney (NSW) and Melbourne (VIC) in terms of overall population. Nonetheless, according to the 2016 and 2021 Census, the increase rates in the population aged 65 and over in Greater Capital regions from 2016 to 2021 were 18.2% in the Greater Sydney region, 17.6% in the Greater Melbourne region and 22.7% in the Greater Brisbane region. Likewise, the Greater Brisbane region gained the most people through net internal migration (+3300) in the March 2021 quarter, while the Greater Melbourne region lost the most (−8300), closely followed by the Greater Sydney region (−8200) [
13]. Meanwhile, based on the 2021 Census, the five regions (SA2) with the oldest median ages were Tea Gardens-Hawks Nest (NSW) with a median age of 65.5 years, Bribie Island (QLD) (62.7 years), Tuncurry (NSW) (62.3 years), Cooloola (QLD) (62.0 years), and Paynesville (VIC) (61.2 years). Among these five areas, Bribie Island is the only place located within a Greater Capital region, as part of Greater Brisbane, and has the highest population size of 20,612. The selection of the Greater Brisbane region for this study ensures that the population size and diversity of the Greater Capital region is adequate, while including the typical area with the second highest median age and the largest population size, making the Greater Brisbane region of optimal value for the study in terms of the generality and specificity of the sample. Additionally, a similar study using the prior census data was conducted for the Greater Brisbane region. An updated analysis using the latest census data allows for a more accurate and meaningful comparison of the distribution of NORCs over time, and provides valuable insights into any changes or trends in the distribution of NORCs. Finally, the same data analysis can be conducted in other cities for national comparison in the future.
Following the previous study by E, Xia et al. [
10], the concept of NORC in this study refers to communities with at least 40% of the household members being 65 years of age or older, excluding holiday visitors and nursing home residents. In this research, the SA1 and the proportion of older household members (65+) are selected for spatial analysis so as to understand the characteristics of the distribution of older people in the Greater Brisbane region of Australia based on the definition of NORCs. By examining these variables, this study is able to identify spatial patterns and long-term trends in NORC and non-NORC distributions and to compare these patterns with other areas in the region.
An examination of the formation and development of NORCs was conducted using four methods of spatial analysis. These are: (i) geovisualisation, to identify patterns across large geographical areas when working with spatially referenced data [
14,
15]; (ii) spatial autocorrelation (Global Moran’s I), to determine whether NORCs have spatial autocorrelation; (iii) cluster and outlier analysis (Local Moran’s I), to determine whether NORCs have local clusters or outliers [
16]; and (iv) hotspot and cold spot analysis (Getis-Ord Gi*), to determine statistically significant spatial hotspots or cold spots of the older population within a given distance [
17]. These spatial analysis techniques are frequently used in studies of ageing and healthcare [
18]. In this study, ESRI ArcMap Version 10.8.1 was used.
Geovisualisation is a method for communicating geographical information and spatial data through maps, diagrams, and other visual representations to facilitate the exploration, analysis, and communication of spatial patterns and relationships [
19]. This research employs geovisualisation to identify the distribution of NORCs in 2011, 2016 and 2021, using choropleth maps to display different classes of older people in census units and recognize potential NORCs.
Global Moran’s I is a measure of spatial autocorrelation that is used to identify patterns in data that are distributed over a large area [
20]. This study measures spatial autocorrelation of NORCs based on both distribution and the percentage of older household members. It evaluates whether NORCs are clustered, dispersed, or randomly distributed by considering various features including location, area, and population. Specifically, Global Moran’s I statistic has a value range from −1 to 1 for household members aged 65 and older in each census unit in the Greater Brisbane region. In general, a negative value of I implies a stronger correlation between farther census units and closer ones, and a positive value indicates a stronger connection between closer census units. A value of 0 indicates there is no spatial autocorrelation between census units [
21]. The formula for calculating Global Moran’s I is as follows:
where:
zi is the deviation of an attribute for the feature i from its mean (xi − );
wi,j is the spatial weight between feature i and j;
n is equal to the total number of features;
and S0 is the aggregate of all the spatial weights:
The
zI-score for the statistic is computed as:
where:
Local Moran’s I is a measure of spatial autocorrelation that is used to identify clusters of high or low values within a study area [
22]. This study employs Local Moran’s I to detect the clusters of census units with given proportions of older people in the Greater Brisbane region. Taking into consideration the spatial relationships between the locations, it is calculated by comparing the values of a variable at each location with those at surrounding locations. The formula for calculating Local Moran’s I is as follows:
where:
xi is an attribute for feature i;
is the mean of the corresponding attribute;
wi,j is the spatial weight between feature i and j;
and n is the total number of features:
The Getis-Ord Gi* (Gi*) statistic is a measure of spatial autocorrelation that can be used to identify statistically significant spatial clusters of high or low values [
23]. It is calculated by summing the values of a variable (in this study, the proportion of older household members) for each location in the Greater Brisbane region, weighted by the inverse distance between census units. The resulting statistic is then compared to a critical value to determine if the spatial pattern is statistically significant. If the statistic is greater than the critical value, then there is a statistically significant spatial cluster of high values (hotspots) or low values (cold spots) of the proportion of older household members within a given distance. In addition to describing the current state of aggregation of the older population, hotspot identification also predicts trends of clustering within some neighborhoods with low proportions of older population situated in contexts with high values of older population. Cold spot areas, on the other hand, are defined as aggregations of suburban areas that have low proportions of older residents and neighboring areas that have similar values. The formula for calculating Gi* is as follows:
where:
xj is the attribute value for feature j;
wi,j is the spatial weight between feature i and j;
and n is equal to total number of features:
3. Results
According to ABS 2021 data, the Greater Brisbane region experienced the second highest population growth rate in Australia (after Canberra) from 2011 to 2021, at 20% [
24]. However, the growth rate of the older population in this area was 56% during the same period.
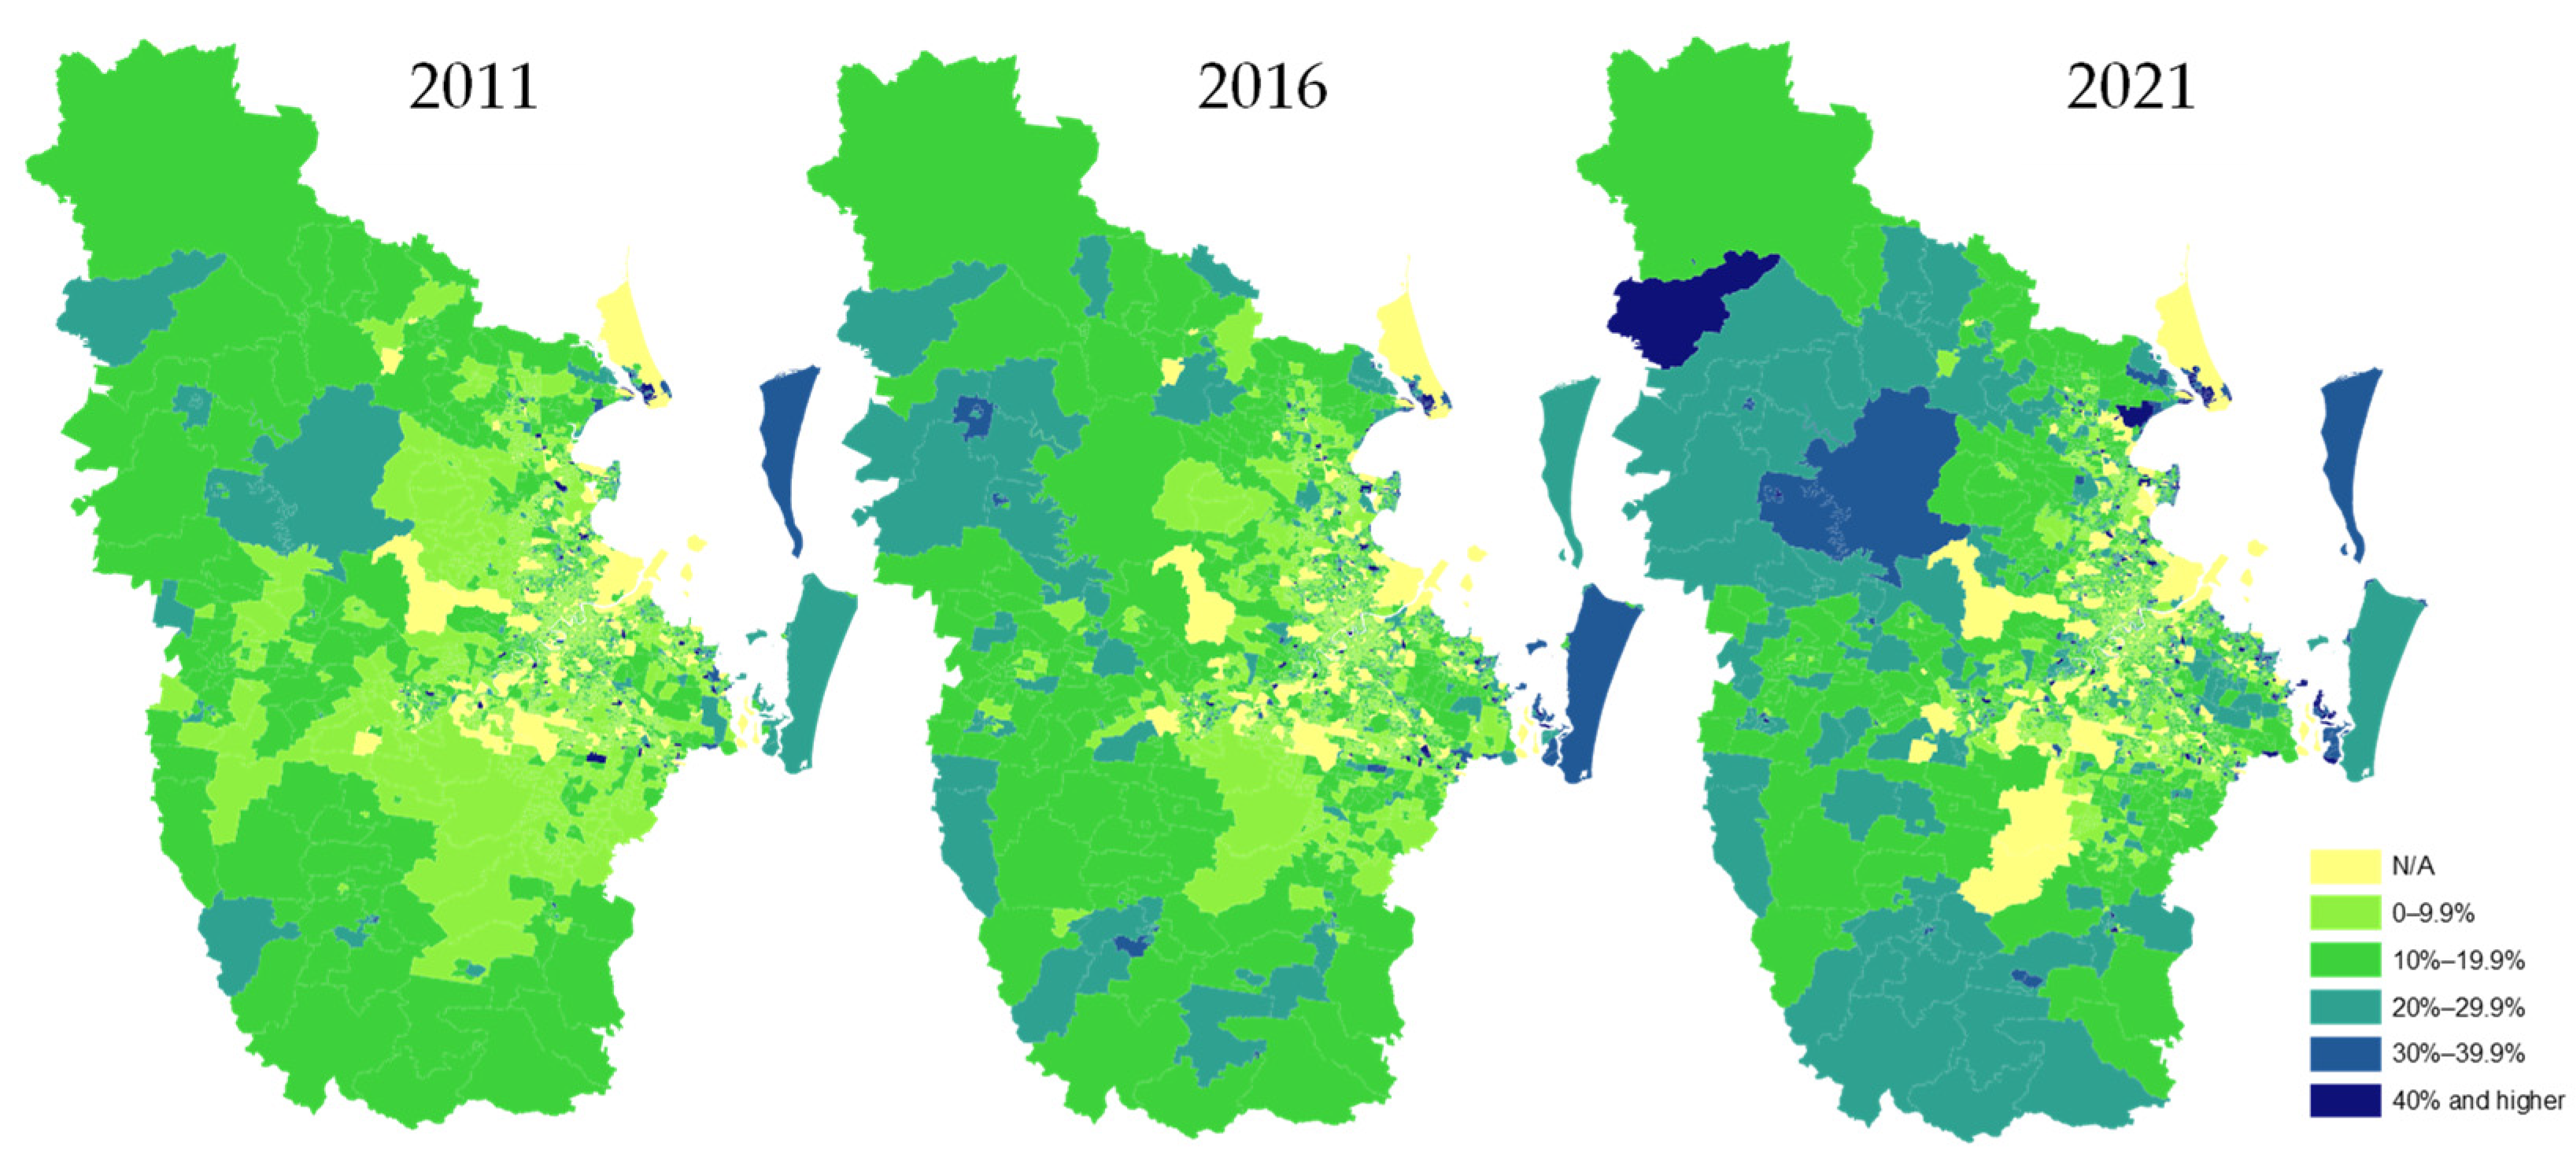
Figure 2 visually illustrates that the proportion of older Australians in the Greater Brisbane region has increased rapidly across census units from 2011 to 2021. The Greater Brisbane region was home to 215,149, 267,281, and 336,707 older people in 2011, 2016 and 2021, respectively. Accordingly, a greater percentage of older household members (aged 65+) were found in the Greater Brisbane region, at 14.23% in 2021, up from 11.15% in 2011 and 12.76% in 2016. Simultaneously, a significant growth rate (56.50%) was observed in older (65+) household members in the Greater Brisbane region between 2011 and 2021, which was twice the rate (22.62%) in total household members.
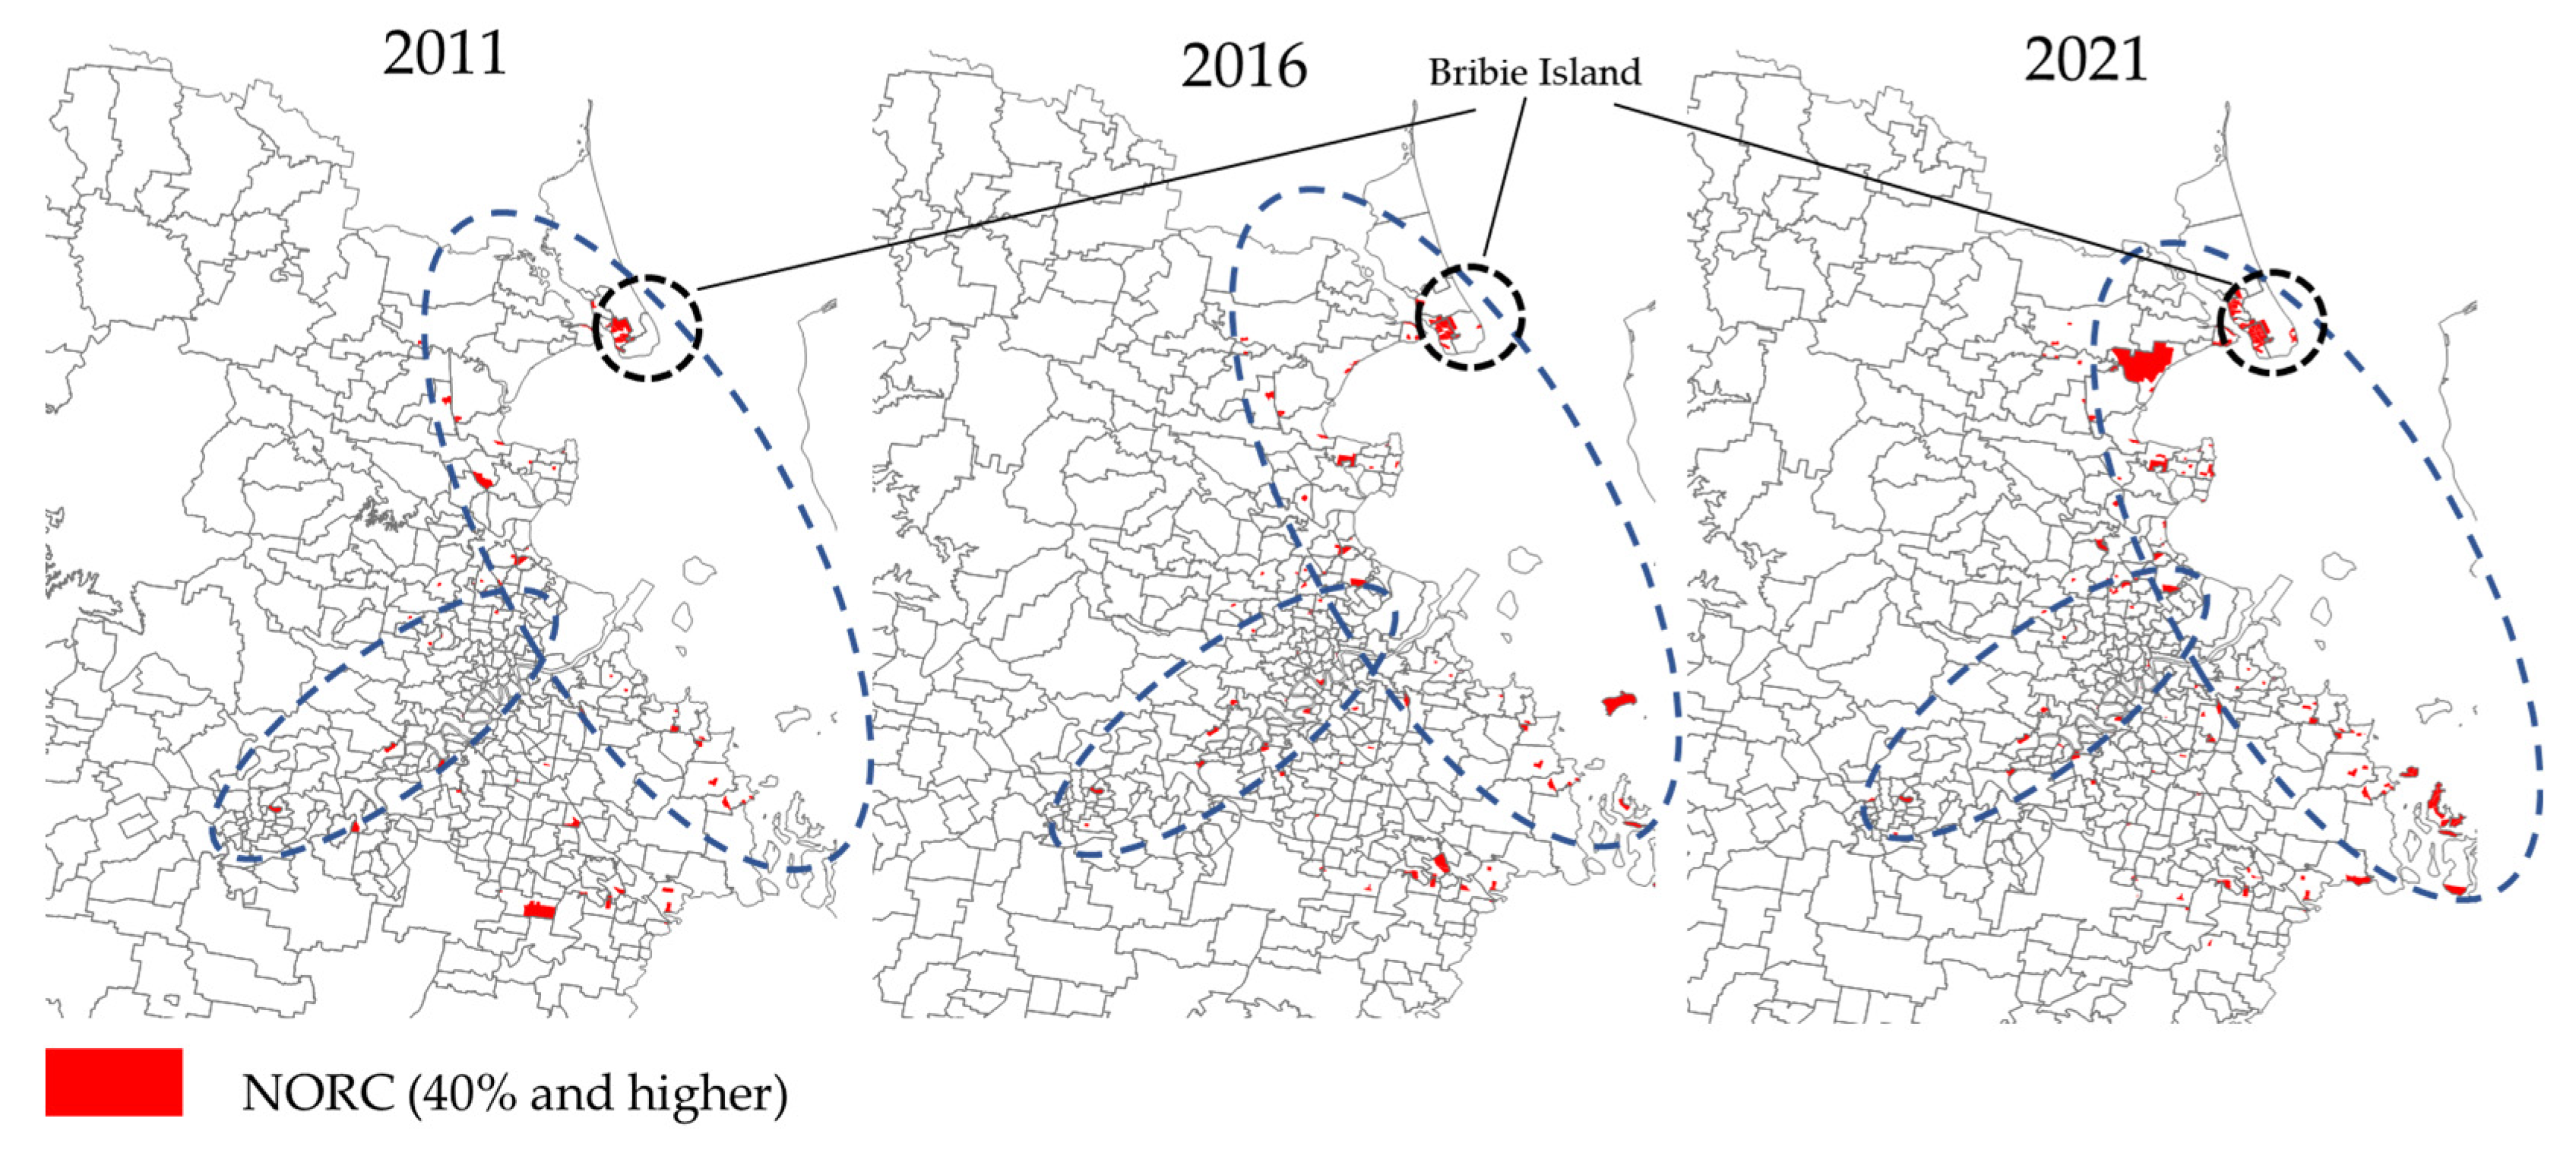
The maps of the locations of NORCs in 2011, 2016, and 2021 are illustrated in
Figure 3. Among the 5164 census units in the Greater Brisbane region in 2011, 65 (1.3%) were identified as NORCs, compared to 92 (1.7%) out of 5373 in 2016. As of 2021, the number of NORCs increased to 165 (2.8%) out of 5971 census units. Both the number and share of NORCs doubled from 2011 to 2021. Furthermore, in 2011 and 2016, 6.1% and 7.2%, respectively, of older household members were living in NORCs in the Greater Brisbane region, while by 2021, the number had increased to 10.1%.
As shown in
Figure 3, NORCs were primarily located along the coast and along the Brisbane River. Specifically, there were already 10 NORCs on Bribie Island accommodating 1961 older household members (65+) in 2011, and the number had increased to 32 NORCs by 2021 with 6405 older householders (65+). According to the 2021 Census, Bribie Island had the second oldest median age (62.7) and the largest older population (9457) in Australia based on Statistical Area Level 2 (SA2) [
25,
26]. Over the five-year period from 2016 to 2021, the number of older people aged 65 and over on Bribie Island grew from 7352 to 9457, a total increase of 2105.However, only 1724 people moved from the 60–64 age group in 2016 to the 65 and over group in the 2021 census.
Using Global Moran’s I as an indicator of the distribution pattern of NORCs, the value in 2021 was 0.305001 (z = 39.869419), which indicates that NORCs or census units with high percentages of older household members aged 65 and over tend to cluster together. Similarly, there was a strong correlation between census units with a low proportion of older household members and those with a similar proportion. Based on the z-scores of 35.10 and 39.87, it is unlikely that this clustered pattern was caused by chance.
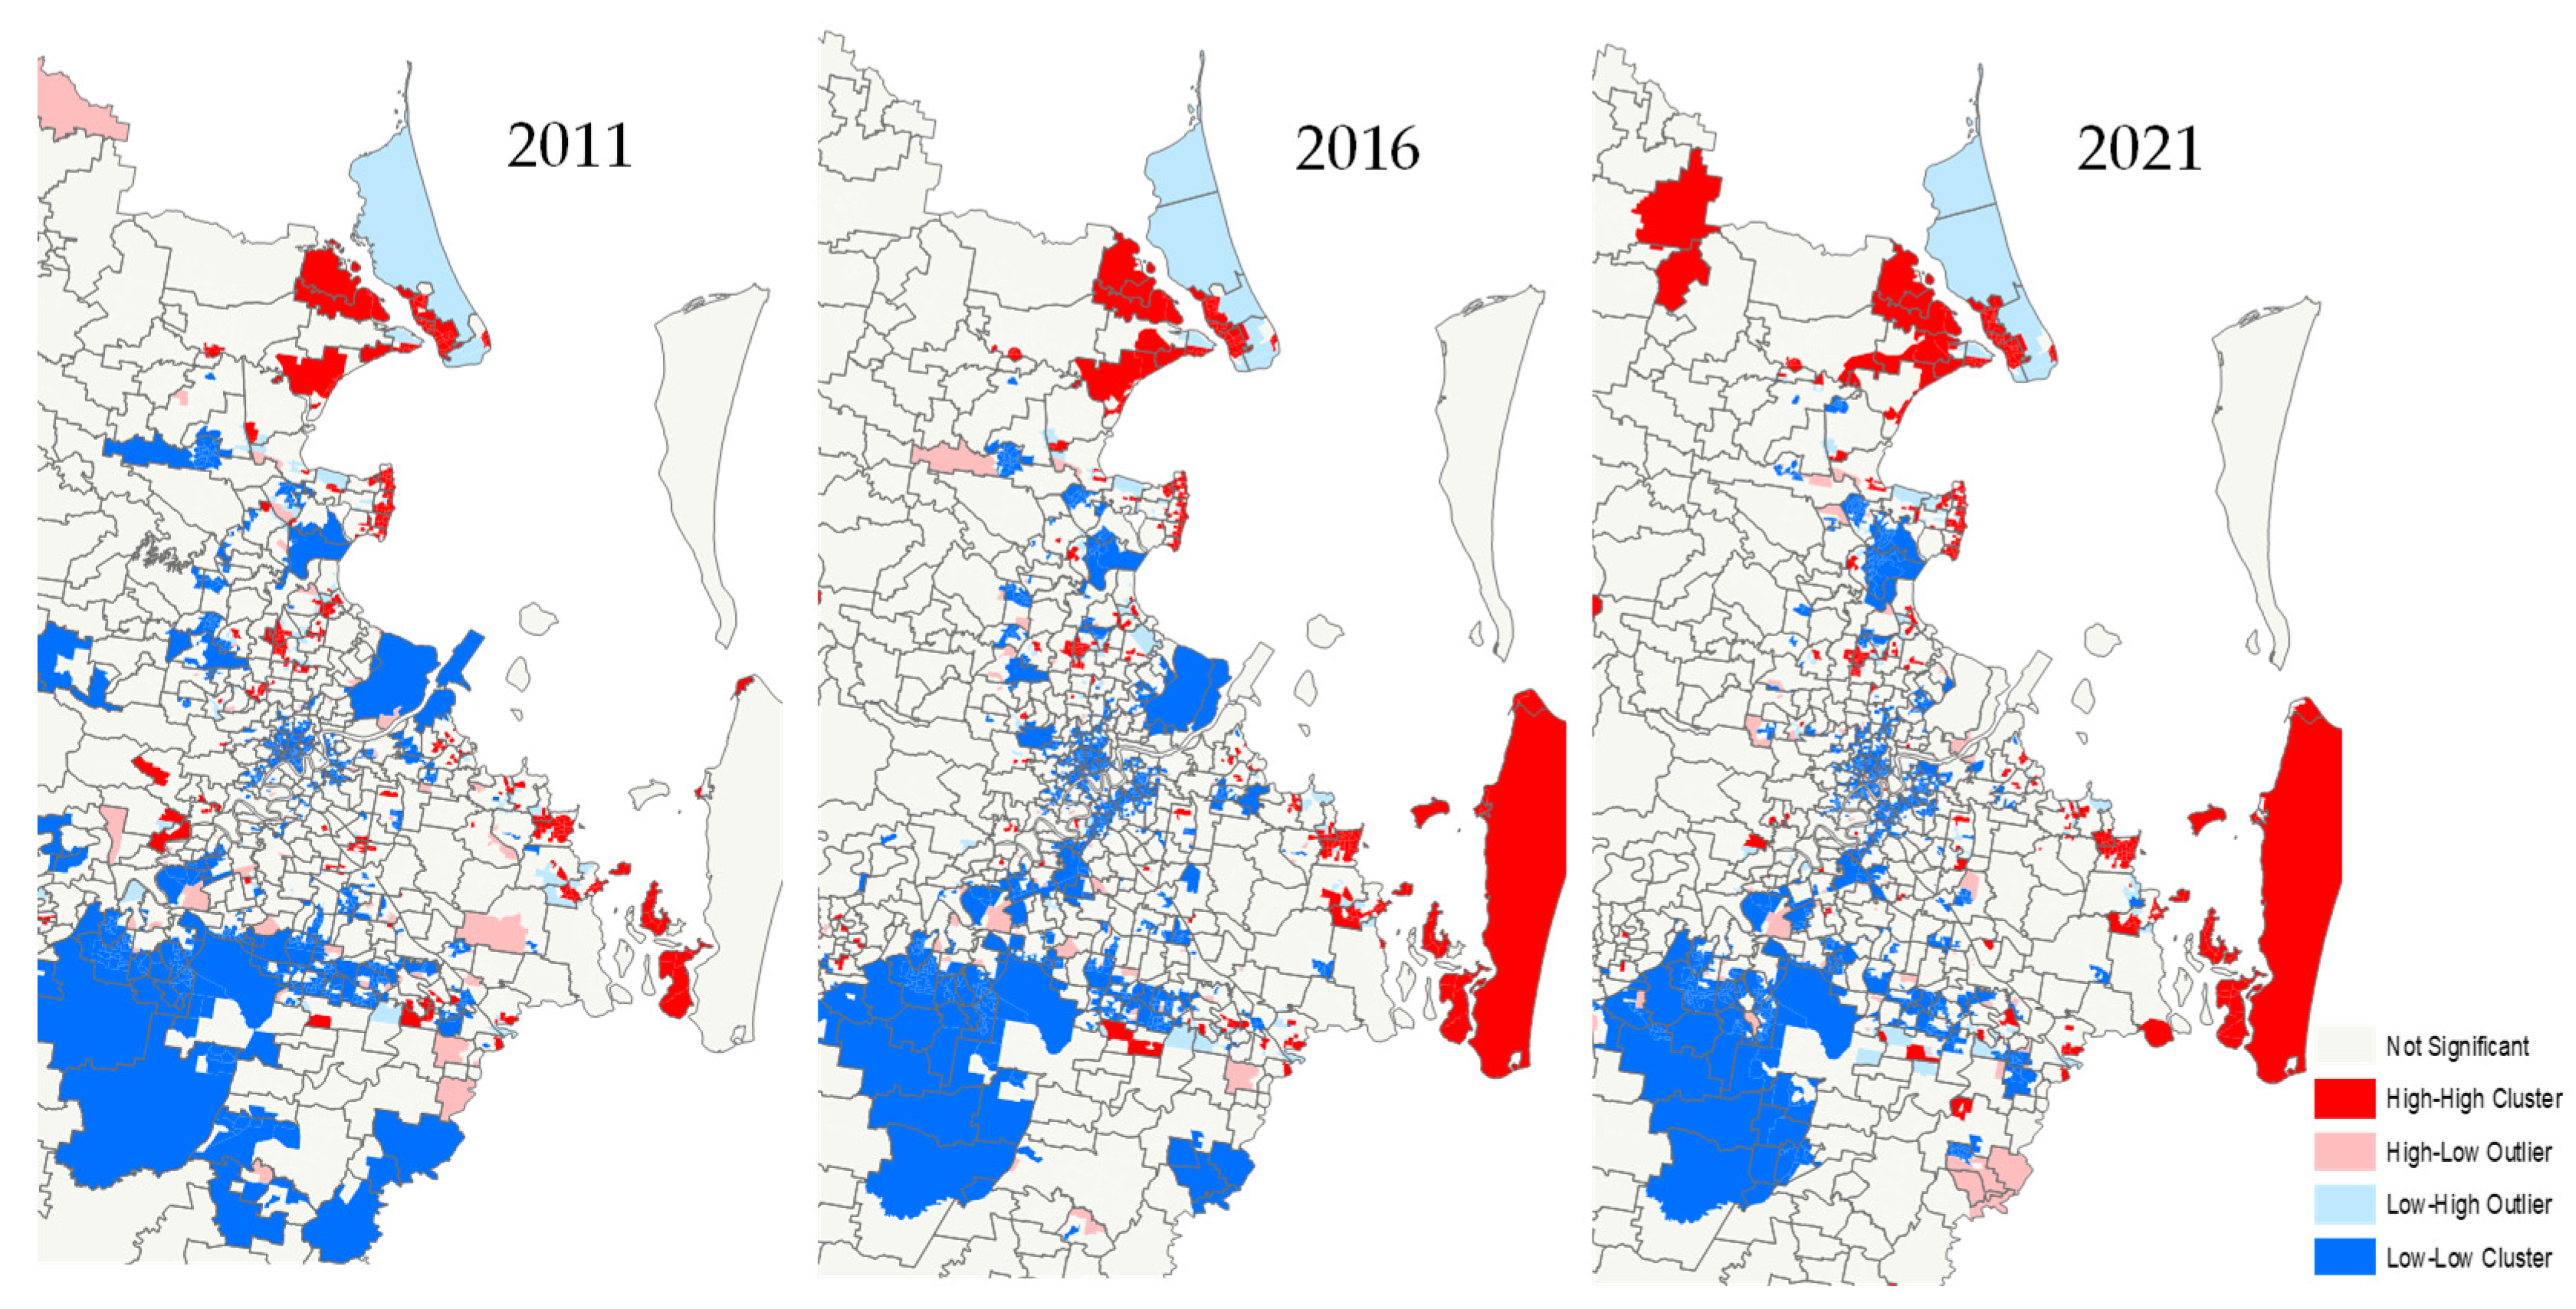
Figure 4 shows the visual results of Local Moran’s I for densely populated areas of the Greater Brisbane region. During the period between 2011 and 2021, the high-high clusters of census units (i.e., the census units clustered or co-located with high proportions of older adults) grew rapidly along the coastline and expanded increasingly. Low-low clusters (i.e., the census units clustered or co-located with low proportions of older people), on the other hand, decreased from 2011 to 2021. As far as low-high and high-low outliers are concerned, no apparent patterns can be discerned between 2011 and 2021.
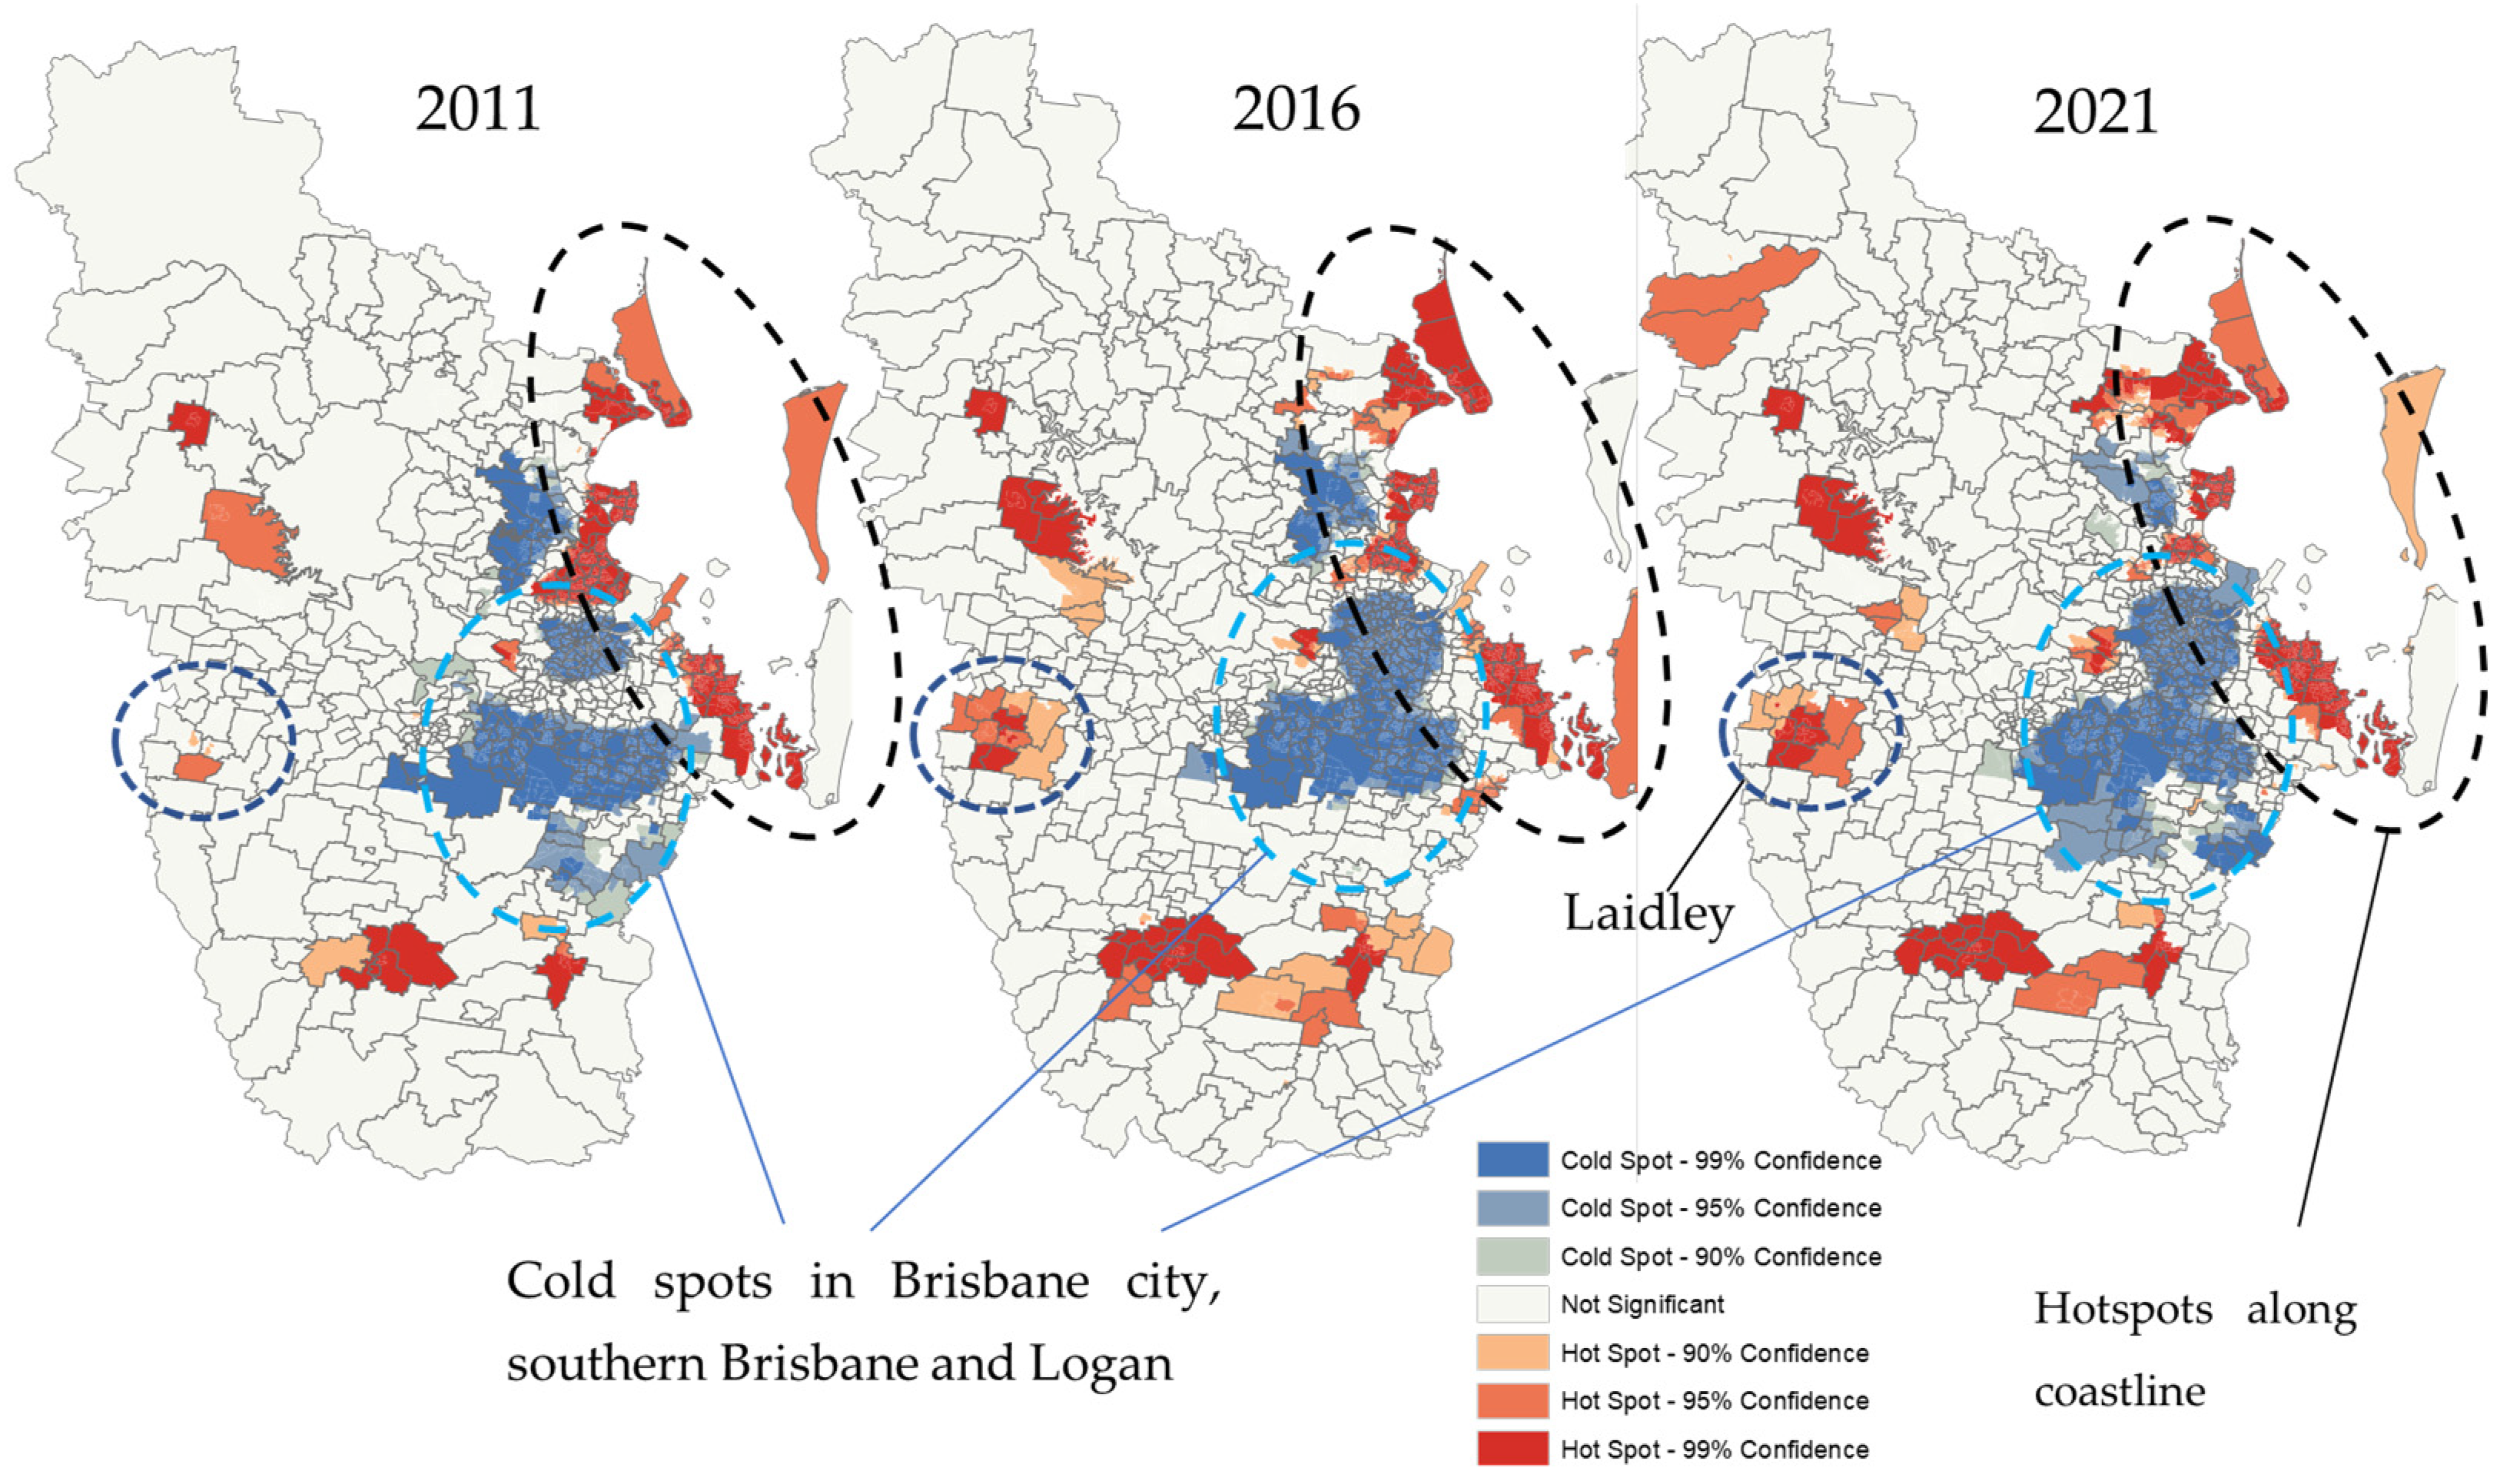
In
Figure 5, hotspots as well as cold spots were visualized for older household members in 2011, 2016 and 2021. The optimized hotspot map shows that the statistically significant hotspot suburbs distributed in coastline areas accommodated 85.6% and 90.8% of the older household members (65+) in the total hotspot areas in 2016 and 2021, respectively. It was estimated that 60,341 older household members (65+) lived in those optimized hotspot areas in 2011, 69,595 in 2016, and 90,258 in 2021, accounting for 28.0%, 26.0% and 26.8% of the total older household members (65+), respectively. While hotspots were mainly occurring in the coastline areas, some inland regions have also become hotspots, although the number of older household members (65+) was quite small. According to the Laidley household statistics of 2011, 2016, and 2021, there were 516 (16.1% of total household members), 619 (18.9%), and 866 (26.5%), respectively, older household members (65+) in their hotspot evaluation.
Meanwhile, cold spots have increased in the southern suburbs of Brisbane and Logan cities during the past decade. These cold spots in the city areas are gradually expanding or remaining as cold spots mainly due to the fact that older people are moving out and an increasing number of young people are moving in for job opportunities.
4. Discussion
Based on the Australian Bureau of Statistics Census data of 2021, this study examines the changing distribution patterns of NORCs compared with the previous census years of 2011 and 2016. The results reveal that the development of NORCs in the Greater Brisbane region over the previous five years (from 2016 to 2021) is in line with the trend from 2006 to 2016, which indicates that NORCs are growing constantly and rapidly and tend to be primarily distributed in coastal areas. Although some inland and remote areas also witnessed NORC hotspots, both the population size and the proportion of older adults living in coastal hotspots are much higher and this trend is steadily on the rise, which indicates that sea-change is much more favored than tree-change among the older population [
27]. The primary reason for the relatively low number of older people seeking tree-change is due to the difficulty of aggregation [
28]. Compared to sea-change, tree-change requires a natural and quiet living environment, which leads people to look for less densely populated areas to enjoy their lives [
29].
From 2011 to 2021, the number of NORCs increased by more than 150% relative to the 50% rise in the older population (65+), suggesting a clear trend that older adults have been moving to communities where a higher proportion of their peers already live. In other words, the rapid increase of NORCs is mainly due to the relocation of older people (i.e., older adults move to a place where the environment is suitable for ageing) rather than the natural ageing process of community residents or the departure of the younger generation [
30]. The example of Bribie Island shows that the number of older residents has grown by 381 more through immigration or relocation over the five-year period from 2016 to 2021 than through natural ageing. Therefore, the rapid growth of NORCs will help achieve the goal of healthy ageing, which creates environments and opportunities that enable people to be and do what they value throughout their lives [
31].
The 10-year plan of the United Nations Decade of Healthy Ageing (2021–2030) describes an opportunity to achieve improvements in the quality of life for older people, their families, and communities by taking concerted, catalytic, and collaborative action [
32]. The growth of NORCs will greatly facilitate governments, civil society, international agencies, professionals, academia, the media, and the private sector to achieve the Healthy Ageing plan, as NORCs contribute positively to areas that need to be addressed in order to promote healthy ageing and improve the lives of older people, their families and communities. This includes changing the way we perceive, feel, and act toward ageing, making sure that communities provide opportunities for older adults to develop their abilities, providing integrated personal care and primary health care services tailored to the needs of older people, and ensuring that older people who require long-term care have access to it [
33].
Given the great potential of NORCs to help older Australians achieve healthy ageing, we recommend that governments at different levels initiate NORC-supportive service programs to offer older people an alternative to retirement villages or nursing homes as a solution to ageing in place. The services provided to NORC participants can include events, trips, and classes related to exercise and dance [
34]. Unfortunately, the Australian government does not currently have any policy supporting NORCs, which means that established ageing policy in Australia is not likely to further optimize resource allocation in a statistically significant manner. Therefore, this study calls for government support for NORCs, as older adults are likely to experience social difficulties due to their age, lifestyles, and health conditions when moving to a new place, and thus would benefit from socializing with people who share similar lifestyles, interests, cultural backgrounds, and educational levels [
35]. If NORCs are officially recognized and given adequate publicity, there will be a greater aggregation effect, since NORCs are formed as a result of mutual attraction among individuals with similar interests, which will in turn contribute to a greater sense of belonging among older residents and more efficient delivery of social services to them.
In addition, given the economies of scale in NORCs (i.e., a large number and high proportion of older people living in the same geographical location), it is an excellent opportunity for the government to provide home care and support in NORCs at a relatively low cost, which would have high potential to reduce both the share of government funding for residential aged care and the overall cost of home care inputs. The economies of scale [
36] in NORCs can be achieved through centralized service delivery, resource sharing among residents, and collective bargaining with service providers, which can help to lower costs for individual residents and make it more feasible for them to age in place. According to the Australian Institute of Health and Welfare [
37], the Australian government spent over
$23.6 billion on aged care during 2020–2021, with residential aged care receiving the majority (60%) of these expenditures, home care and support accounting for 34% of funds, and other care accounting for 8%. When an increasing number of older people relocate into NORCs, clustering effects can enhance economies of scale and healthy ageing, which can help improve the efficiency of senior services and delay the move to residential aged care, reducing overall government expenditures.
It is also worth noting that in the period 2016 to 2021, the Greater Brisbane region experienced the greatest net interstate migration (+54,400) among all Australian capital cities, representing 2.2% of the total population [
38], which must have significantly increased the proportion of in-migration older adults. NORCs would serve as an attraction for immigrant seniors looking for preferred living environment suitable for ageing in place. In particular, Queensland is considered to be a great place for older people to live, being well known as the “sunshine state” [
39].
Finally, NORCs will help maintain the mental health of their senior residents, which is an important indicator of healthy ageing for older people. Promoting mental health in older adults is built on the ties people have with other individuals, groups, and the broader community [
40]. In NORCs, given the high density of older people, it is more likely for people to provide support to others as well as receive support from others. As reported in the ABS Survey of Disability, Ageing and Carers (SDAC) in 2018, there are 647,000 older adults who provide care to others. Furthermore, a study conducted by the ABS General Social Survey (GSS) in 2019 estimated that 638,000 (25%) people aged 70 and older participated in unpaid volunteer work through an organization during the past year. These data suggest that older adults aspire to social connection, seek to participate in social gatherings, and prefer not to be alone, which fits perfectly with the underlying reasons for NORC formation and aligns with the growing trend of NORCs in the Greater Brisbane region.
5. Conclusions
In order to accommodate older Australians who would prefer to age in place, an age-friendly urban environment is of utmost importance. The concept of NORCs has been proposed for more than 35 years, yet the Australian government has failed to recognize the benefits NORCs bring to Australian society, including improving the efficiency of senior services, promoting healthy ageing, and reducing government expenditures. This study investigated the formation and distribution of NORCs using the latest ABS Census 2021 and validated the extrapolation of the previous study, which was based on the census data from 2006 to 2016. In the Greater Brisbane region, NORCs emerged as an age-friendly community, hosting 10.1% of older household members, despite only accounting for 2.8% (165) of all census units in 2021. The result of the latest data analysis is consistent with previous research findings and confirms the prior projection that NORCs are developing at a fast pace. The distribution of NORCs is concentrated in the riverine and coastline areas, attracting a growing number of older adults to relocate to these areas for ageing. NORCs will keep growing rapidly in the future, and it is important for the government to consider supporting NORCs through policies and initiatives in order to improve the quality of life for older adults and their families, as well as to contribute to healthy ageing.
There are some limitations to this study. First, in spite of the fact that indicators of geography influence clusters or outliers of NORCs, multiple factors that are not available in Census data may contribute to the development of NORCs, such as accessibility, the built environment, walkability, natural scenery, and social and health services, and these factors should be considered in future studies. Secondly, future research should investigate the ways in which the distribution of aged care facilities influences the development of NORCs, and vice versa. In particular, the pandemic of the last few years may have changed older people’s perceptions of retirement living, which will influence the regular distribution patterns of NORCs. Thirdly, census units in densely populated areas are divided into relatively small units, while in remote areas census unit areas will be several times bigger than in dense areas. Also, the number of NORC household members living in densely populated areas will be many times greater than in remote areas. This suggests that the density of older people living in densely populated NORCs is much greater than that of remote NORCs, and NORCs with small overall numbers are very sensitive to changes in the proportion of older adults. Future studies need to analyze the formation of remote NORCs and NORCs with different population densities and numbers.


