Article

Parameter Sensitivity Analysis of the Seismic Response of a Piled Wharf Structure

1
Department of Civil Engineering, Dalian Maritime University, Dalian 116026, China
2
CCCC Third Harbor Consultants Co., Ltd., Shanghai 200030, China
*
Author to whom correspondence should be addressed.
Buildings 2023, 13(2), 349; https://doi.org/10.3390/buildings13020349
Submission received: 27 December 2022 / Revised: 15 January 2023 / Accepted: 24 January 2023 / Published: 26 January 2023
(This article belongs to the Collection Innovation of Materials and Technologies in Civil Construction)

Abstract

:
To investigate the seismic response characteristics of piled wharf structures, a numerical model of the soil-structure interaction system is established. Extensive fiducial error and grey correlation analyses are also conducted to obtain the grey correlation degree sequence of the internal force of piled wharf structure and deformation, as well as the acceleration of surrounding soils. The results show that the peak acceleration at the typical point of the soil is more sensitive to the variations in friction angle and ground motion intensity, while the lateral extreme displacement is the most sensitive to the variations in the elastic modulus of the soil. The grey correlation sequences of the peak acceleration and lateral extreme displacement at the feature points of the soil around the pile greatly vary, indicating that the key factors of the different sequences control the target parameters corresponding to them. The sensitivity of the internal force of the pile foundation of the pier structure to the ground motion intensity and friction angle is more sensitive than the elastic modulus and cohesion. This presented parameter sensitivity analysis procedure for the seismic response of piled wharf structures can provide a reference for the seismic design of piled wharf structures, as well as for disaster prevention prediction.

1. Introduction

Earthquakes are among the most common natural hazards in many cities around the world. Piled wharf structures have been widely used in port projects for their simplified structure, light wave reflection, stable berthing conditions, and many other advantages. The seismic performance and stability of a wharf structure are significantly affected by a variety of factors, such as the wharf structure and the surrounding soil under seismic action [1,2,3,4,5,6,7].
To minimize the loss of pile-supported structures during earthquakes, it is essential to develop a sensitivity analysis of seismic response parameters of pile-supported structures, which will contribute to the seismic design of the wharf, as well as carrying out quicker and safer mitigation programs. The ground motion characteristics and the damage mechanisms of piled wharfs have been extensively researched by many authors. Cullough [8] analyzed the mechanism of a lateral large displacement of the recumbent sand layer under a backfilled shore foundation under seismic action on the destabilization damage of a piled wharf by centrifuge model testing. Moghadam et al. [9] investigated the correlation between the variation of pile parameters and the plastic zone of the pile perimeter soil by model tests and finite element numerical analysis for the lateral load carrying capacity of a piled wharf. Fu et al. [10] analyzed the reliability of the quay structure from the perspectives of stiffness and strength of a wharf using the fast Lagrangian analysis of continua method. Chau et al. [11] developed an efficient hybrid optimization approach using central composite design (CDD), the finite element method (FEM), an artificial neural network (ANN), and the multi-objective genetic algorithm (MOGA) to solve the optimization problem. The proposed approach gained high robustness and effectiveness, enabling decision-makers to solve complex optimization engineering problems. Wang et al. [12] established an optimal numerical model that accounted for multiple factors and proposed a novel approach of multi-objective optimization. Su et al. [13] conducted a 3D finite element (FE) study and presented a prototype system, along with the corresponding numerical details, and explored the effect of the resulting seismically-induced ground deformation on the pile-supported wharf system. Li et al. [14] established the finite element analytical models of batter and vertical pile structures under the same construction site, service, and geological conditions to investigate the seismic dynamic damage characteristics of vertical and batter pile-supported wharf structures. They analyzed the dynamic damage characteristics of the two different structures of batter and vertical piles under different seismic ground motions, and concluded that the axial force of batter piles was dominant in the batter pile structure and that batter piles could effectively bear and share seismic load. Mirzaeefard et al. [15] developed a precise finite element model to account for structural aging and the simultaneous seismic shaking, and proposed a set of analytical formulations for a performance index as a function of age, damage state, and seismic hazard level. Wang et al. [16] combined the finite element method (FEM) and theoretical analysis method to analyze the structural property, bearing behavior, and failure mode of an all-vertical-piled wharf in offshore deep water, and to establish simplified calculation methods determining the horizontal static ultimate bearing capacity and the dynamic response for the all-vertical-piled wharf. They proposed a simplified calculation method of the horizontal static ultimate bearing capacity for the all-vertical-piled wharf, according to the failure criterion and P-Y curve method. Su et al. [17] conducted a refined Three-Dimensional (3D) Finite Element (FE) model, including the refined modeling of free-field boundaries and soil-pile interaction, and the seismic performance of the wharf-ground system was systematically explored. Deghoul et al. [18] proposed three soil constitutive models: a linear-elastic perfectly plastic model (MC model), an elastoplastic model with isotropic hardening (HS model), and the Hardening Soil model with an extension to the small-strain stiffness (HSS model) with different accuracy to study the behavior of a pile-supported wharf embedded in a rock dike. Meng et al. [19] noted that the peak acceleration, spectral characteristics, and ground vibration input direction significantly affected the seismic demand of each performance index by analyzing the critical dynamic response characteristics of piled wharfs under earthquake action.
With continuous research on the damage mechanisms of piled wharfs, it was found that there is a complex dynamic interaction between the foundation soil and pile foundation [20,21,22,23]. Cui et al. [24,25] and Meng et al. [26] developed different analytical models for the vertical vibration problems of a floating pile based on different soil pile models and pile-soil interactions. Gao et al. [27] proposed new equivalent damping ratio equations based on Jacobsen’s approach for displacement-based seismic design of pile-supported wharves to account for wharf configurations and soil-pile interaction. They found that the Pivot hysteresis model and the Masing rule can accurately capture the nonlinear behavior of concrete and steel wharves, respectively. Zhang et al. [28] addressed the seismic response of a piled wharf under different conditions considering the interaction of piles and soil. The simulation analysis of the piled wharf was performed under the conditions of different seismic amplitudes, soil intensities, and piles spacing, with or without inclined piles. The seismic response of the wharf was found to augment with increasing seismic amplitude. Liu et al. [29] noted that the soil-structure interaction effect prolongs the natural vibration period of the superstructure system and increases the damping ratio, which leads to a transformation of the dynamic characteristics. On this basis, the theory of soil-pile superstructure interaction was proposed. To further investigate the effects of various parameters on the dynamic characteristics of piled wharfs, some scholars have conducted research on the parameter sensitivity of wharf structures. Su et al. [30] investigated the sensitivity of the lateral spreading of a soil-pile quay wall system to different parameters subjected to ground motion. Zhu et al. [31] analyzed the impact of different parameters on the overall dynamic characteristics of a wharf in terms of probabilistic sensitivity analysis. Zhang et al. [32] compared the dynamic characteristics of an all-vertical-piled wharf with those of a traditional inshore high-piled wharf through numerical analysis, and found that the vibration period of an all-vertical-piled wharf under cyclic loading was longer than that of an inshore high-piled wharf and was much closer to the period of the loading wave. They concluded that dynamic calculation and analysis should be conducted when designing and calculating the characteristics of an all-vertical-piled wharf. Souri et al. [33] performed nonlinear dynamic analyses to evaluate the effects of ground motion duration on the dynamic response of a pile-supported wharf subjected to liquefaction-induced lateral ground deformations, and found that the contribution of peak inertial and peak kinematic loads to the maximum total demand only slightly increases with motion duration and intensity.
This paper conducts a sensitivity analysis of the piled wharf structure, in order to provide design guidance for practical engineering. The flowchart of the parameter sensitivity analysis is shown in Figure 1. Firstly, a numerical model of a foundational soil-piled wharf structure interaction system was established. Then, the grey correlation analysis and fiducial error analysis methods were utilized to consider the influence of multiple variables on the seismic response of the piled wharf. The sequence of parameter sensitivity was also obtained, with the most sensitive variable identified. The presented parameter sensitivity analysis procedure can provide a reference for the seismic design of piled wharf structures, as well as for disaster prevention prediction.
The remainder of this article is expanded in the following sections. Section 2 establishes a numerical model of the piled wharf according to the structure and soil parameters. Section 3 introduces the principles of grey relation analysis. Section 4 carries out fiducial error analysis and grey relational analysis for the piled wharf structure. Section 5 concludes this study and discusses future work.

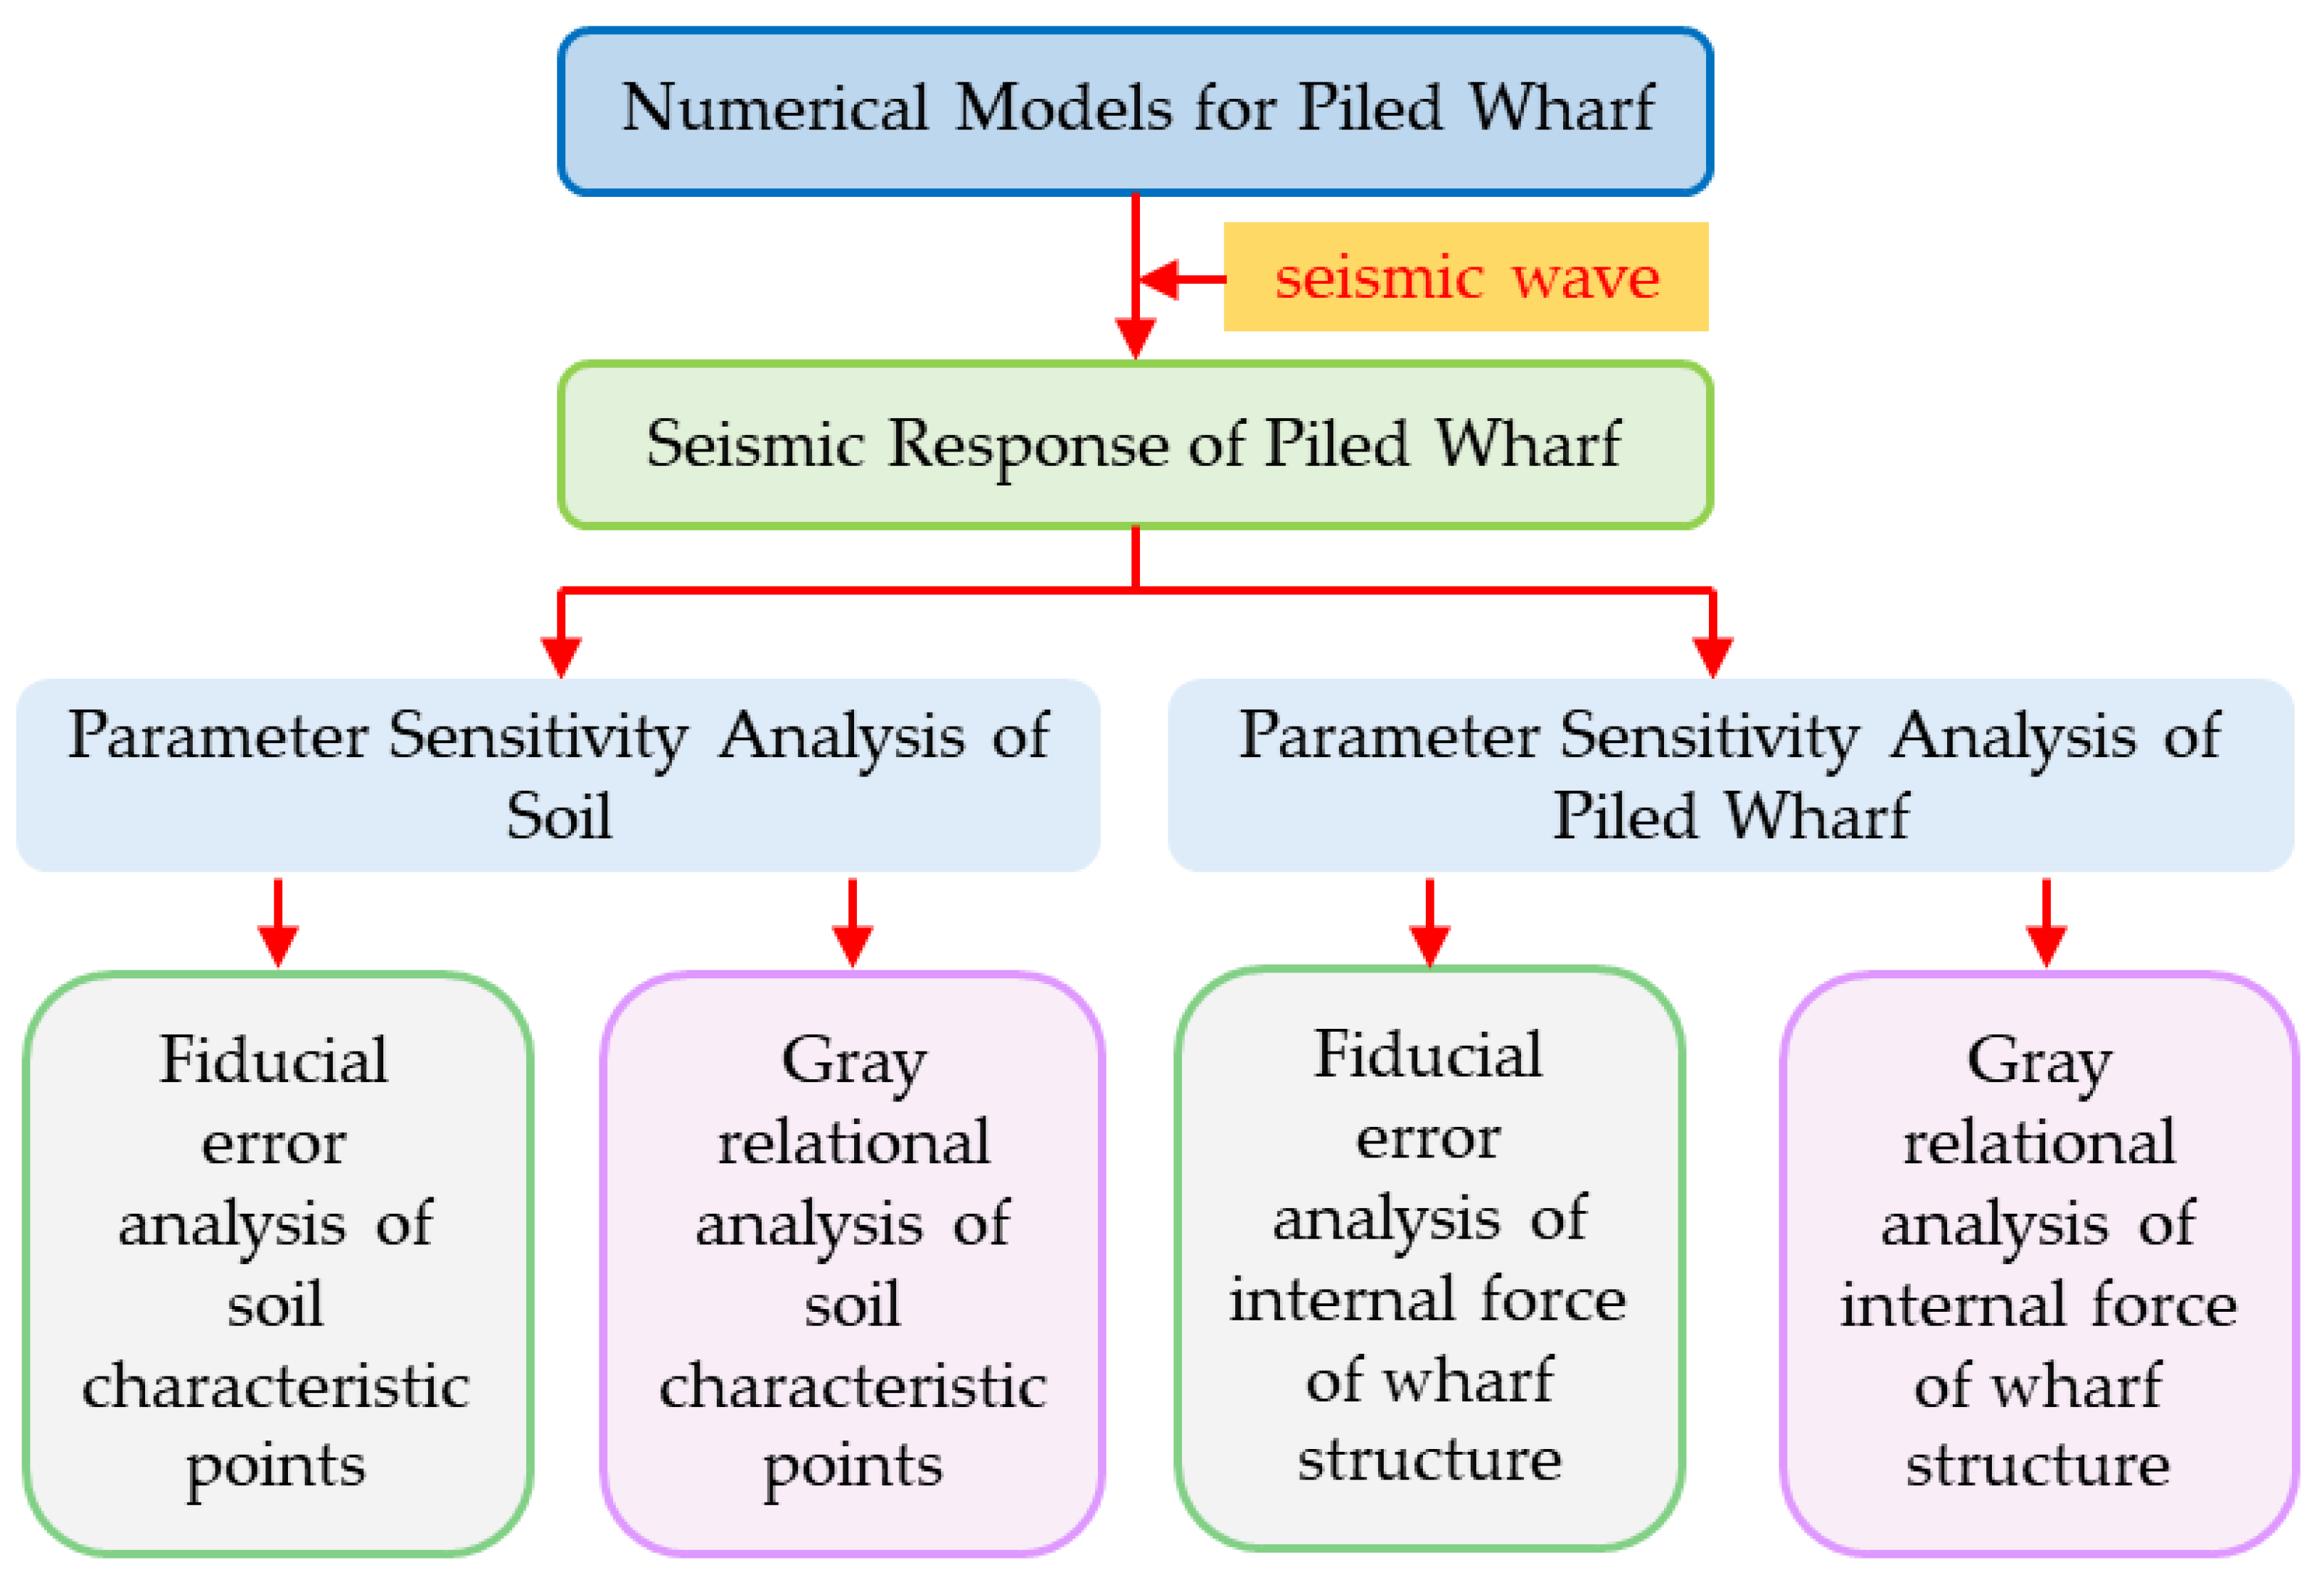
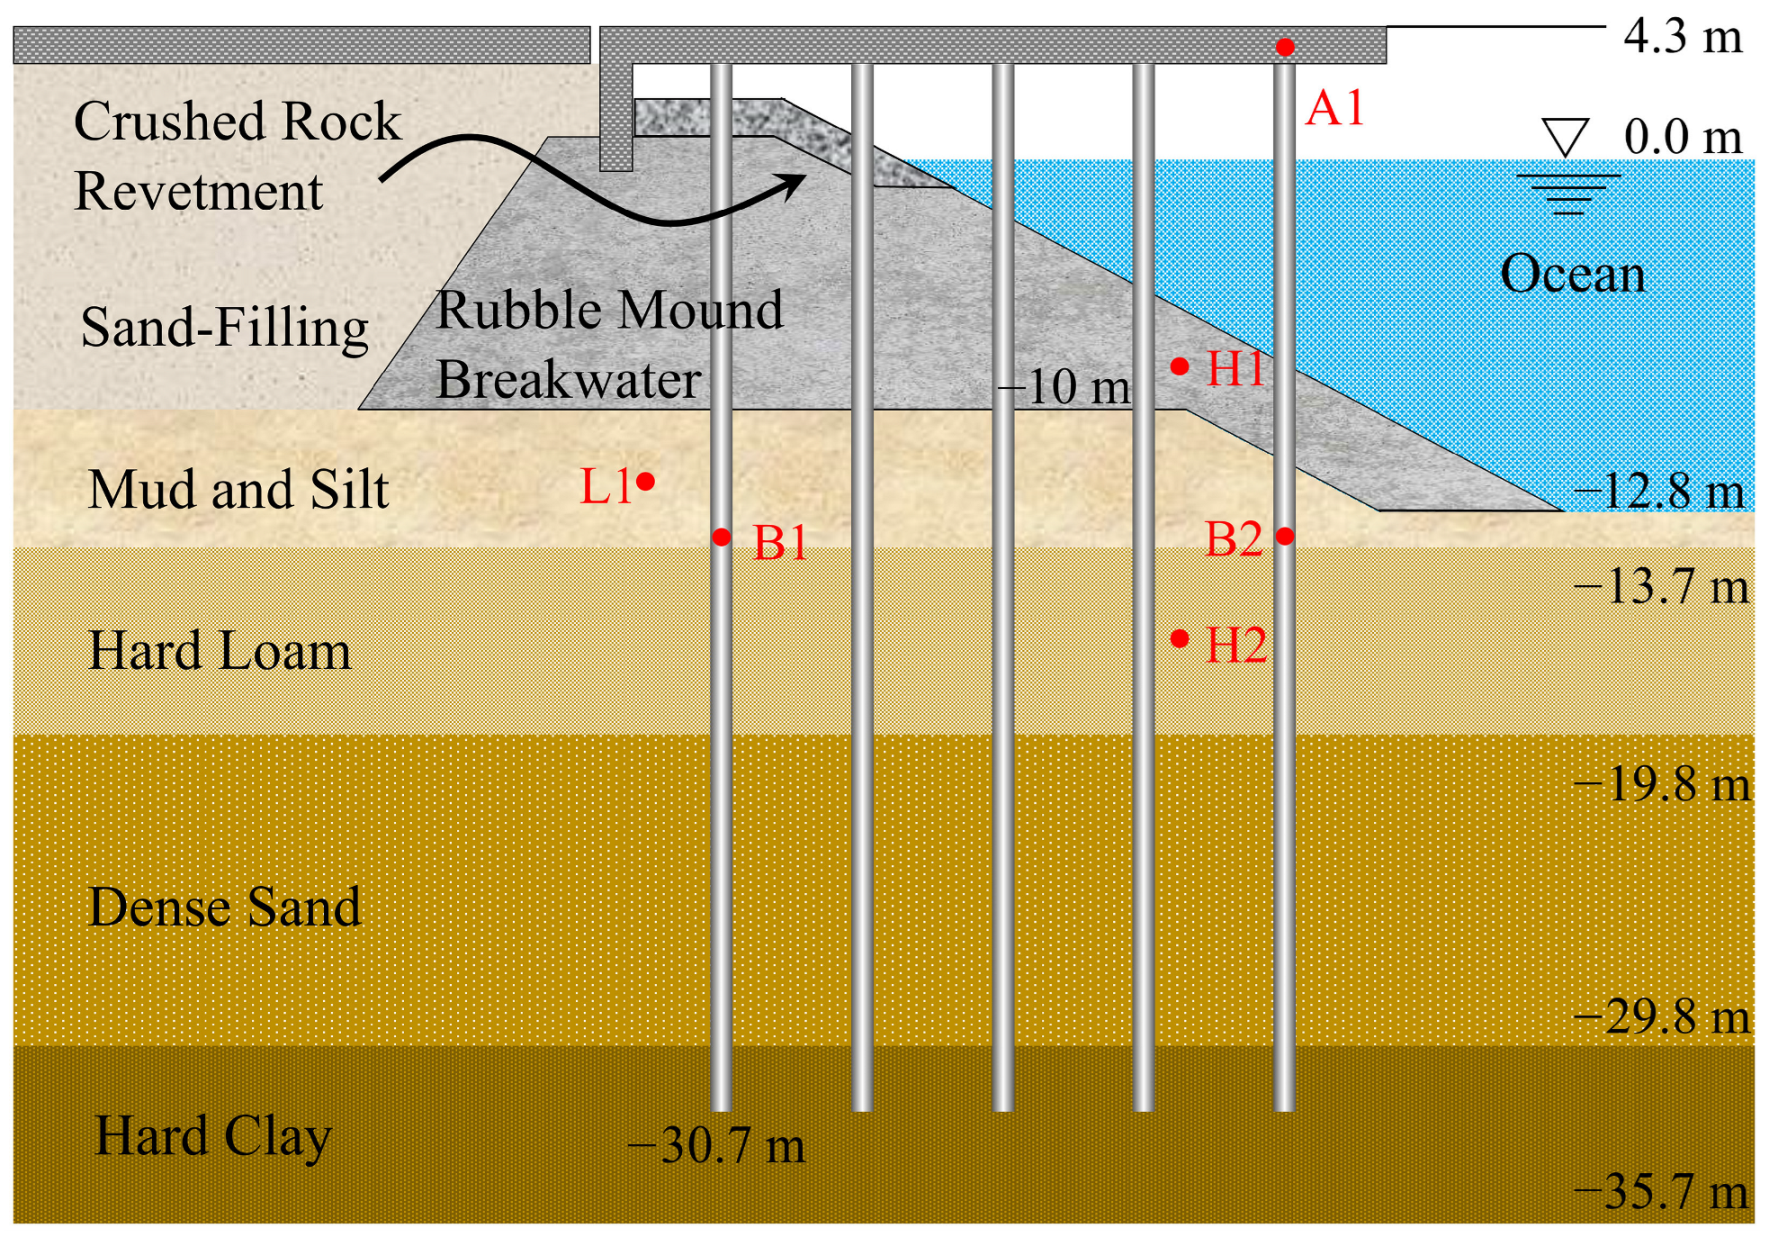
2. Numerical Models for Piled Wharf

The geometrical dimensions of the 2-D model (Figure 2) are 170 × 45 m established in Midas GTS NX. The numerical analyses were performed with five piles, whose length is 30.5 m and whose diameter is equal to 0.6 m. The pile spacing is 5.5 m. In this, the nonlinear dynamic response of the pile concrete material is given primary consideration; the Druker–Prager constitutive is selected as the pile material [34,35,36,37,38].
The thicknesses of both the cushion cap and pavement structure are 0.8 m. There is a 0.2 m expansion joint between the cap and the road. There is a retaining wall with a thickness of 0.8 m located 1.8 m away from the leftmost pile.
It is assumed that the soil layer is horizontal in a semi-infinite medium. The homogeneous medium is considered a viscoelastic and isotropic semi-space. Table 1 shows the material properties used. The piled wharf structure cross-section is shown in Figure 3. Taking the lower left corner as the origin, the numerical model is divided into three major sections. The left section is from 0–53 m, with a mesh size of 3 × 1.6 m. From 53 m to 63 m is a transition section. Then, the middle section (63–108 m) is a concentrated area which is meshed into 0.8 m × 0.8 m, for a total of 4378 grids. There is also a transition area from 108 m to 118 m. Afterwards, the section between 118–170 m section is also meshed into 3 × 1.6 m.
To reflect the effects of volume stress, shear stress, and intermediate principal stress forces on the strength of geotechnical materials, the Drucker-Prager principle [39,40,41,42,43] was selected to describe the constitutive relationship of the soil. The yield function considering the mean stress is:
f ( I 1 , I 2 ) = I 2 a I 1 k = 0
where I1 is the first stress tensor invariant, and I2 is the second stress tensor invariant. a and k are constants related to the cohesion and the internal friction angle of the geotechnical material, which can be expressed as Equations (4) and (5).
Where the expressions of I1 and I2 are shown as:
I 1 = σ 1 + σ 2 + σ 3
I 2 = 1 6 [ ( σ 1 σ 2 ) 2 + ( σ 2 σ 3 ) 2 + ( σ 3 σ 1 ) 2 ]
where σ 1 , σ 2 , and σ 3 are the first principal stress, the second principal stress, and the third principal stress.
Multiple positional interrelationships (Figure 4) between the Drucker-Prager yield curve and the Mohr-Coulomb yield curve are shown in the bias plane. In this paper, the circumcircle principle is used, and the positional relationship according to the M-C criterion and the D-P criterion yields:
a = 2 sin φ 3 ( 3 sin φ )
k = 6 c cos φ 3 ( 3 sin φ )
where c is cohesion, and φ is friction angle.
Free-field boundaries are attributed to the vertical faces and bottom face fixed constraint of the numerical model. Assume the complete coupling of grid nodes between pile-soil units to answer pile-soil interaction problems. Seismic acceleration excitation of the soil and piled wharf structure from the bedrock surface eliminates traveling wave effect. The amplitude of the El-Centro wave was tuned to 0.05 g, 0.1 g, and 0.2 g for excitation of the numerical model. The time history of the El-Centro wave is shown in Figure 5.

3. Grey Relational Analysis Methodology

The superstructure of the high pile pier is placed on the top of the site soil. Failure modes such as extrusion, collision between panels, misalignment, and torsion between pile sills are uncertain under earthquake action. The substructure is embedded in the foundation soil. The soil is multiphase and nonuniform, so the pile-soil interaction under seismic action also has uncertainty. Accordingly, the piled wharf structure and the foundation soil jointly form a grey system. The grey relational analysis method mainly includes Deng’s grey relational degree model, B-related degree model, and T-related degree model, etc., which are widely used in various fields [44,45,46,47]. In this paper, based on Deng’s grey correlation analysis model, grey correlation analysis is carried out by resolving the correlation degree sequence of impact factors [48,49,50,51,52].
According to the constitutive relation of the Druker-Prager principal and the relevant indices of seismic intensity, the sensitivity parameters of the soil are selected as cohesion, friction angle, elastic model, and ground motion intensity; afterward, the parameter matrix is established, as shown in Equation (6):
X = [ X 1 X 2 X i ] = [ x 1 ( 1 ) x 1 ( 2 ) x 1 ( j ) x 2 ( 1 ) x 2 ( 2 ) x 2 ( j ) x i ( 1 ) x i ( 2 ) x i ( j ) ]
where i is the number of parameters and j is the value range of variables.
According to the conditions corresponding to the parameter matrix, the lateral extreme displacement, peak acceleration, and extreme values of the dynamic internal force response of the characteristic units of the piled wharf structure at different feature points of the site are selected as the target matrix, which can be expressed as follows:
Y = [ Y 1 Y 2 Y i ] = [ y 1 ( 1 ) y 1 ( 2 ) y 1 ( j ) y 2 ( 1 ) y 2 ( 2 ) y 2 ( j ) y i ( 1 ) y i ( 2 ) y i ( j ) ]
where i is the number of parameters and j is the value range of variables.
The baseline values of the factors and the range of variation are shown in Table 2. To minimize the absolute value differences of the data and to bring out the variability as well as tendency of the parameter matrix and the target matrix, the above two matrices are normalized:
x i ( j ) = x i ( j ) 1 m j = 1 m x i ( j )
y i ( j ) = y i ( j ) 1 m j = 1 m y i ( j )
where m is the number of columns of the matrix. x i ( j ) and y i ( j ) are the parameter matrix elements and the target matrix elements, respectively. x i ( j ) and y i ( j ) are the normalized results of the parameter matrix elements and the target matrix elements, respectively; where i is the number of parameters and j is the value interval of the variable.
The variance information sequences were constructed based on the normalization results of Equations (8) and (9):
Δ i j = | X i ( j ) Y i ( j ) |
Then, the elements of the grey correlation coefficient matrix can be shown as:
ζ i j = Δ min + ρ Δ max Δ i j + ρ Δ max
where ζ = 0.5 is the identification coefficient and the value interval is [0,1]. If ζ is smaller, the greater the difference between the correlation coefficients, the stronger the discrimination ability. Δ max and Δ min are the two extremes of the discrepancy information sequence matrix. Therefore, the correlation of each uncertainty factor can be shown as:
A i = 1 m j = 1 m ζ i j
where m is the number of columns in the matrix.
The parameter correlation quantifies the sensitivity of the seismic dynamic response to different parameters in the parameter matrix, and its value interval is [0,1] [53].

4. Parameter Sensitivity Analysis of the Piled Wharf

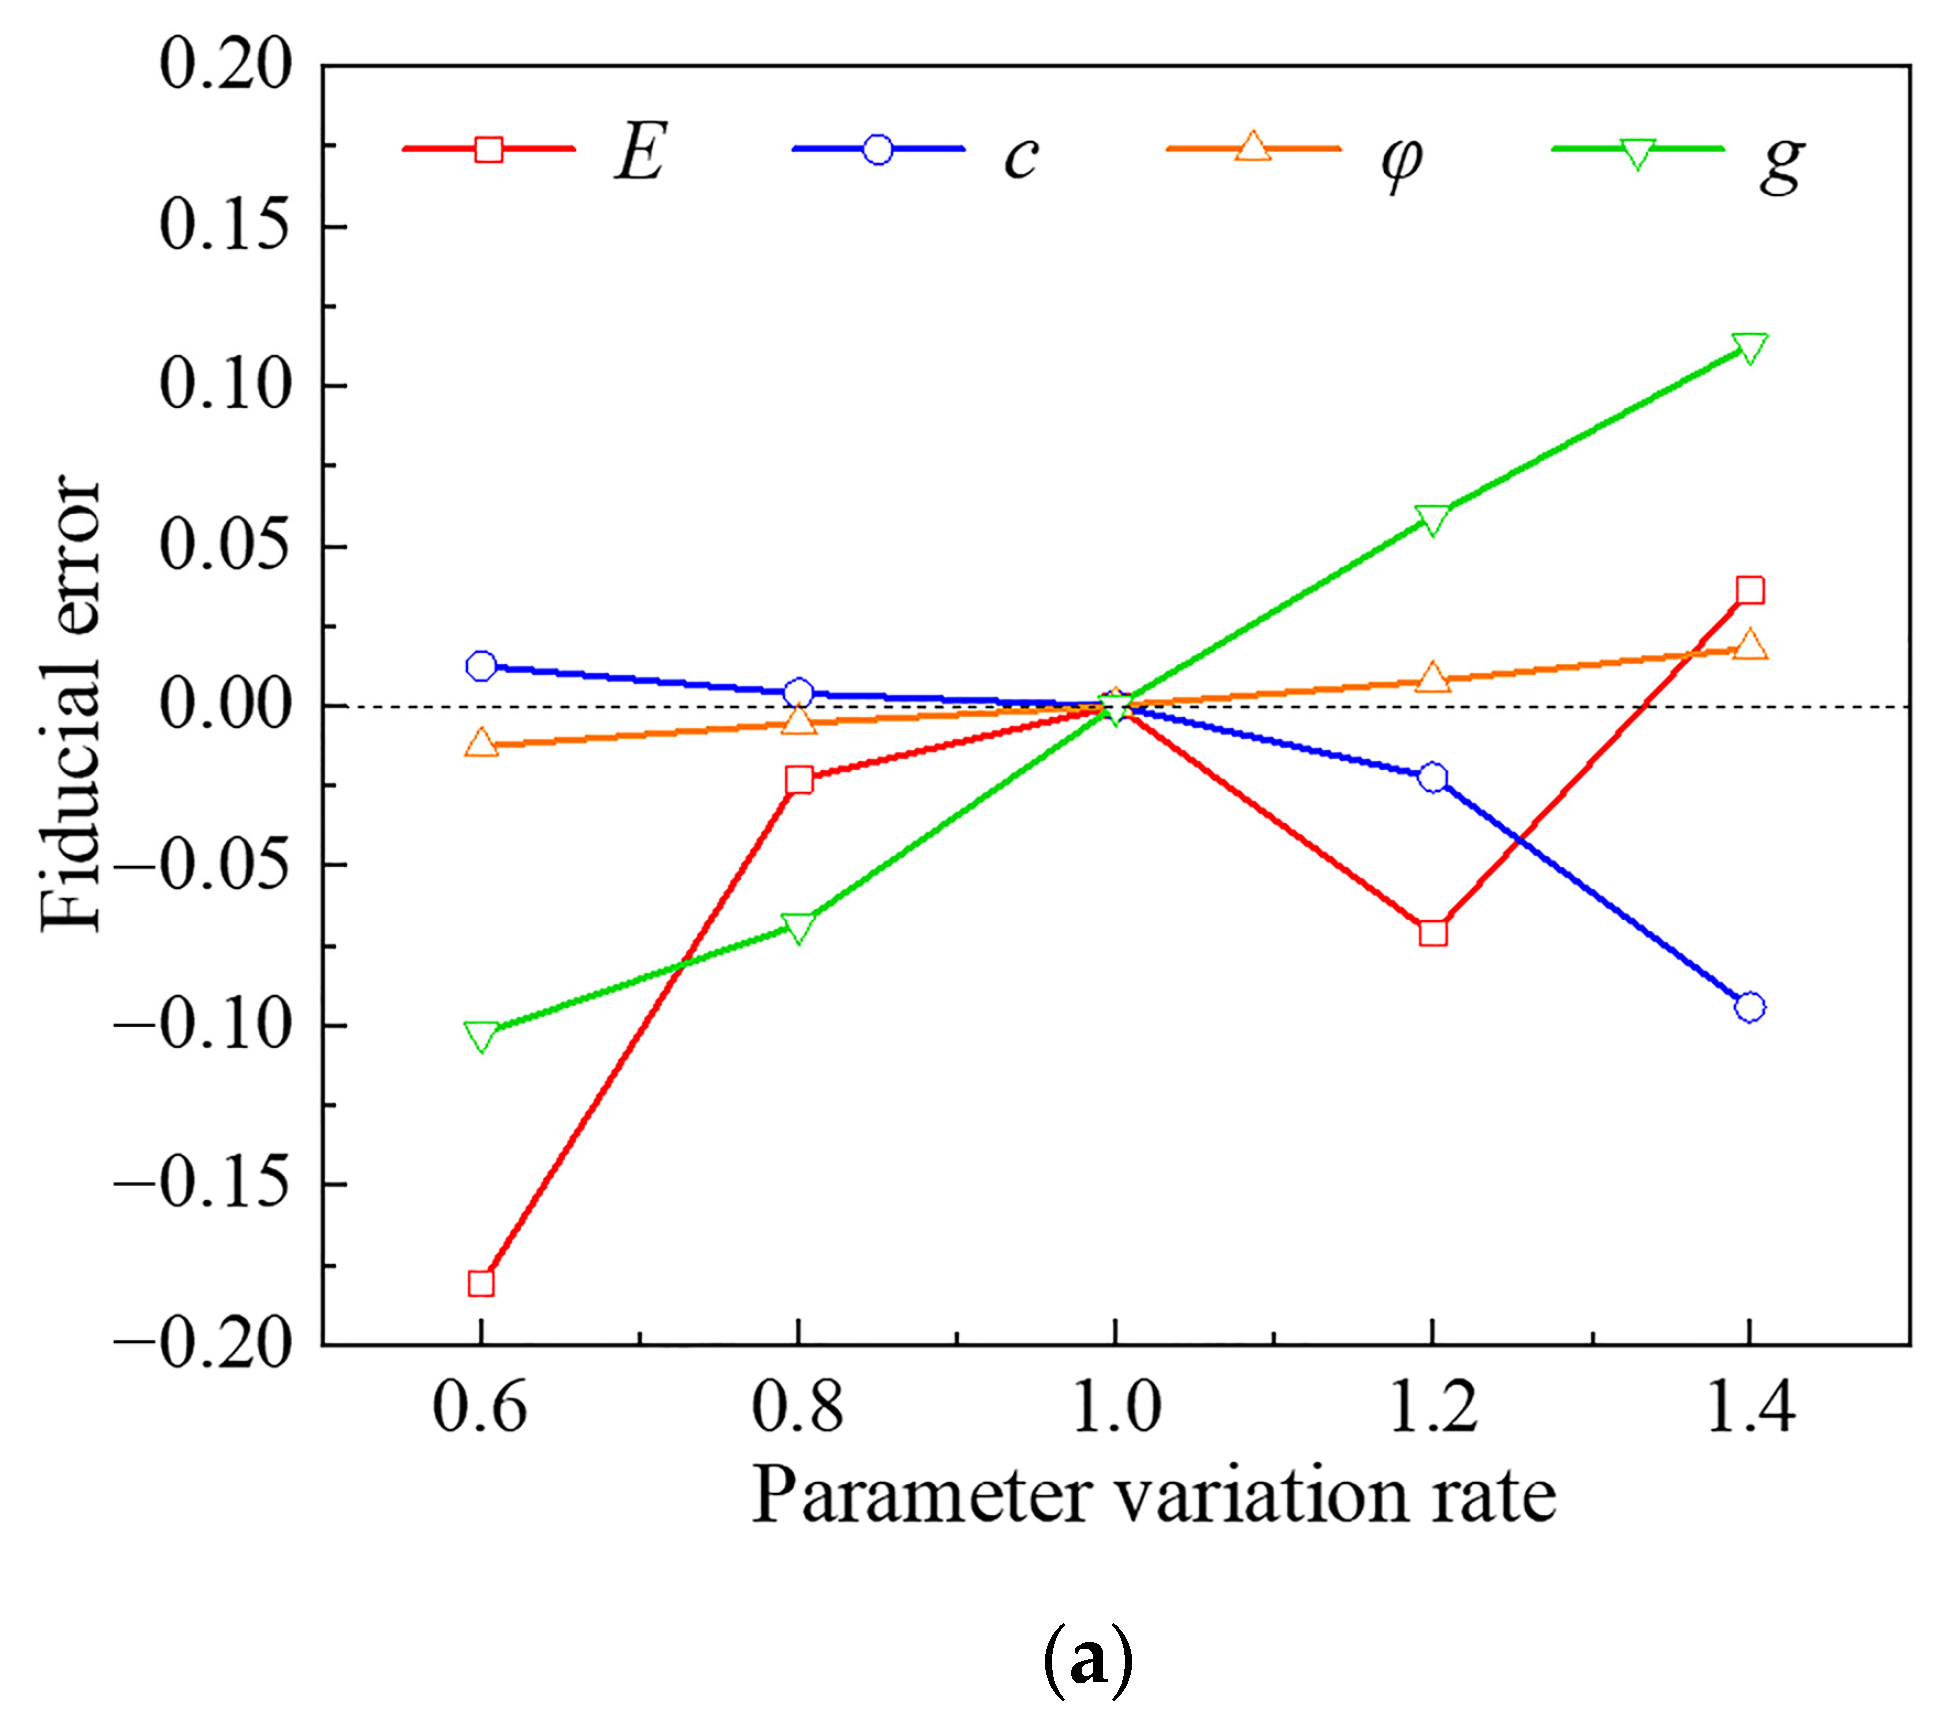
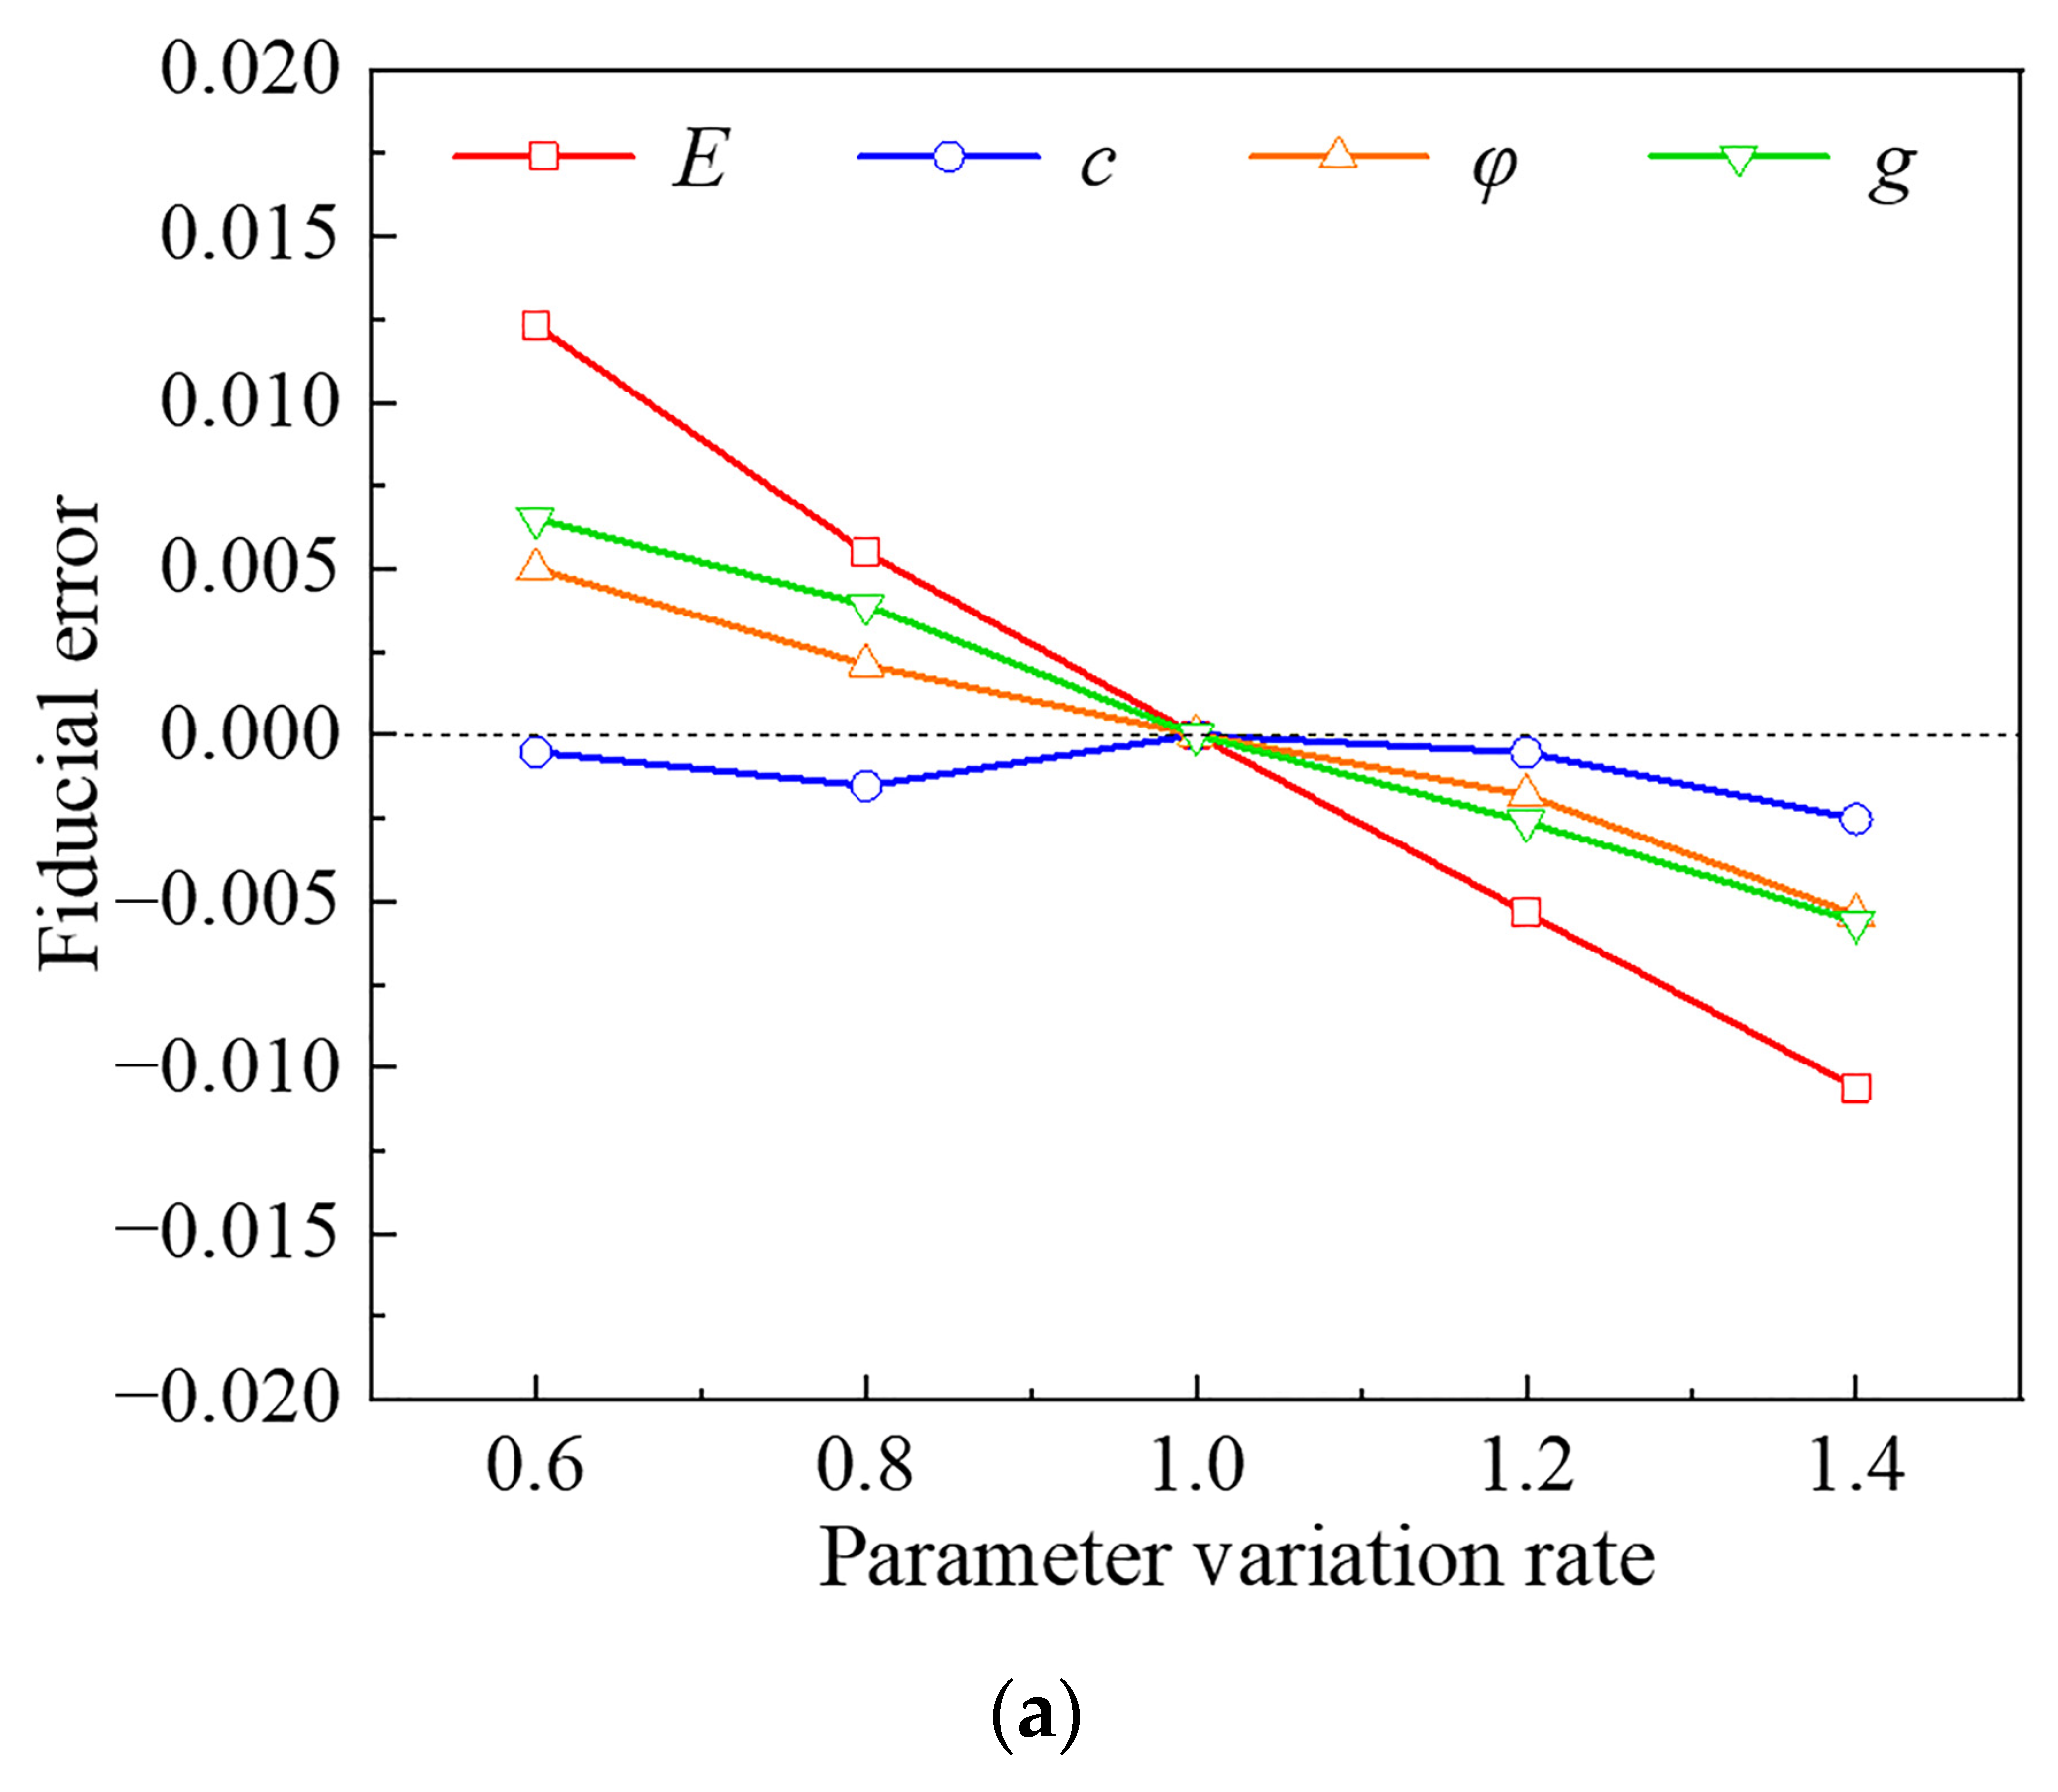
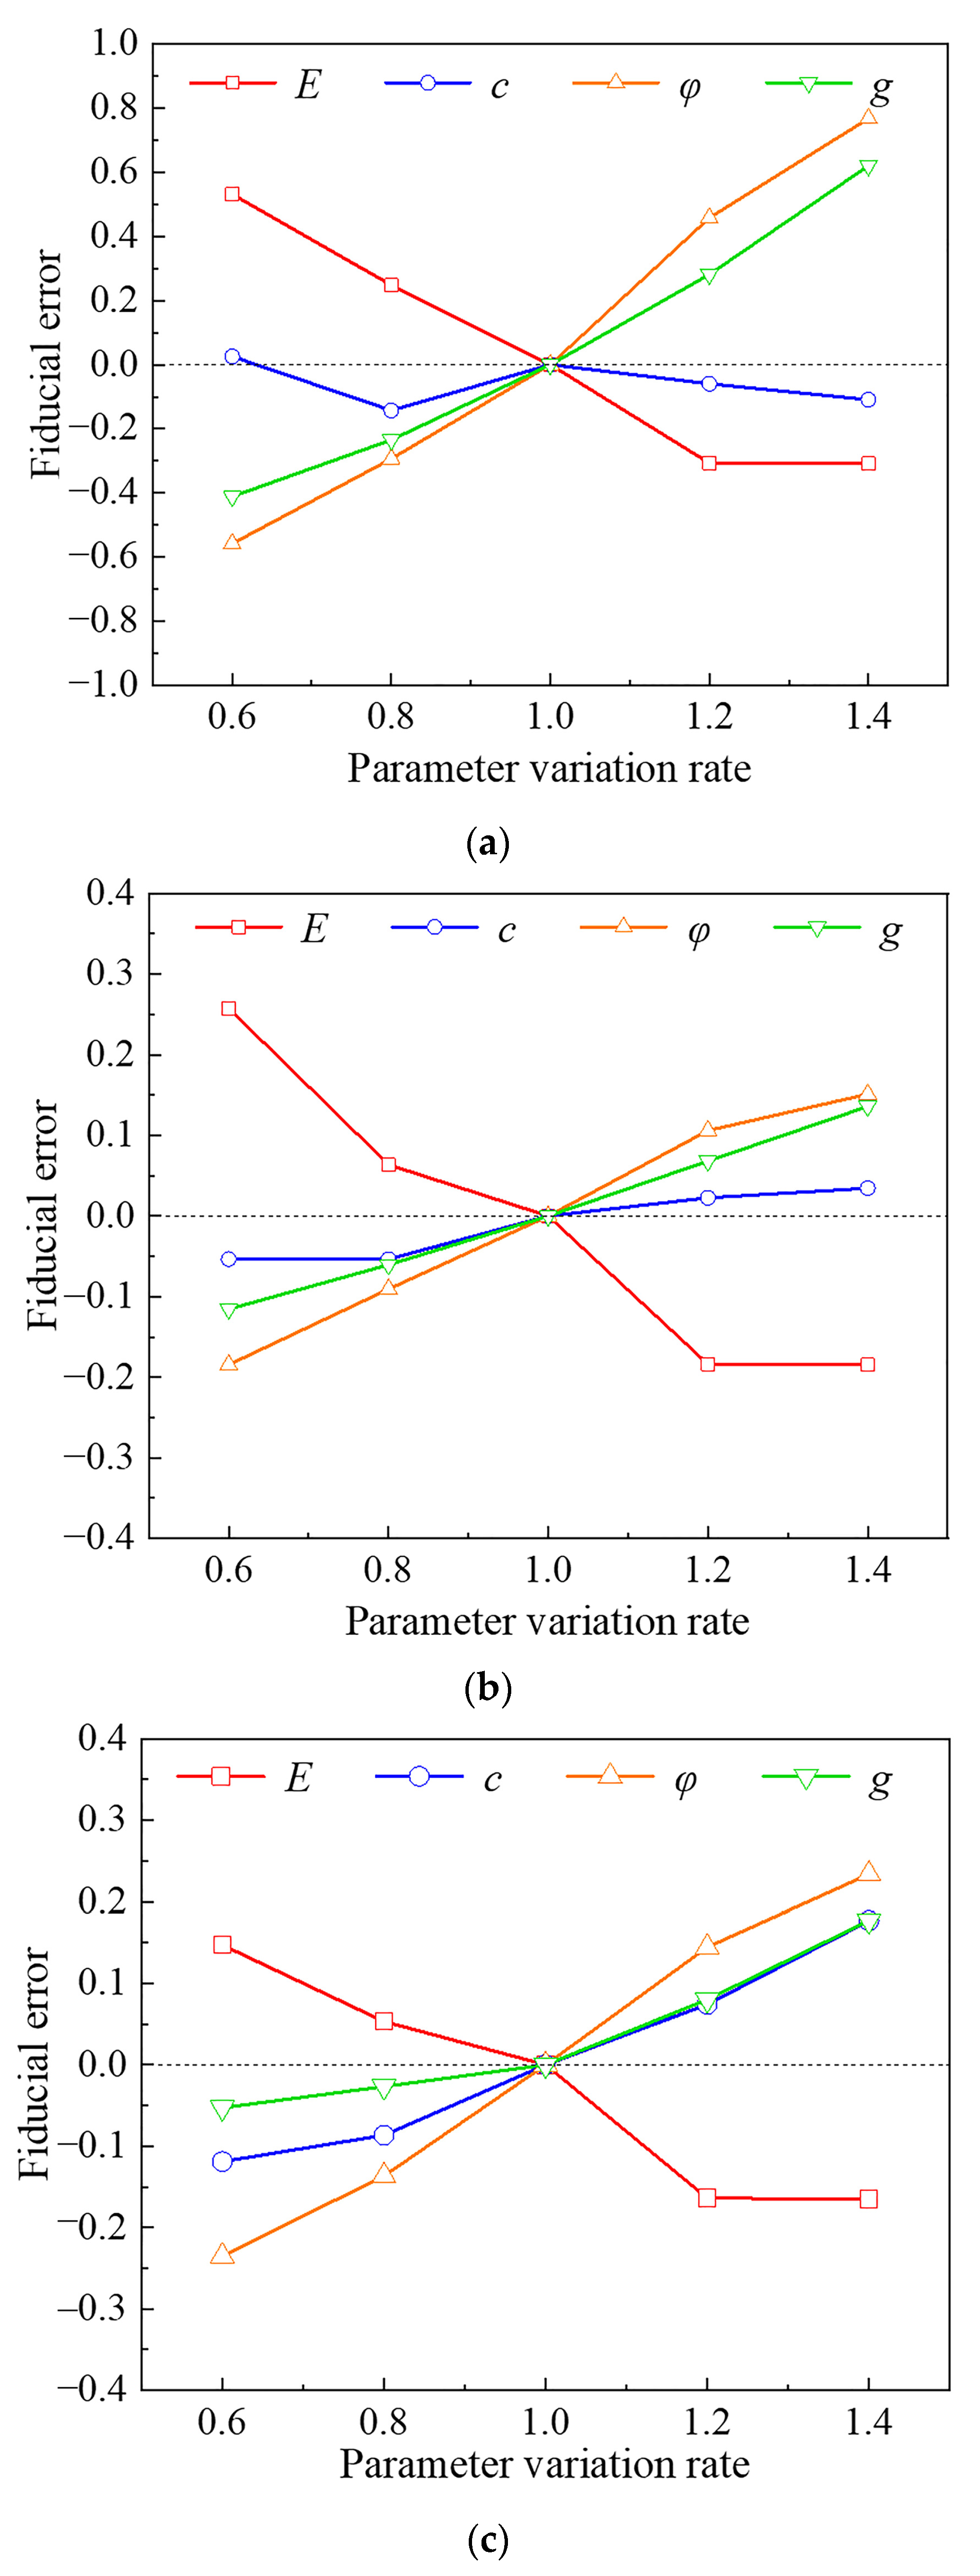
4.1. Fiducial Error Analysis of Piled Wharf

Multifactor issues are converted into multiple single-factor issues through the control variables method. Only the selection range of one parameter in each analysis is changed, keeping the other factors at their baseline values. Nonlinear time history analysis of piled wharf structures is carried out to obtain peak acceleration, extreme lateral displacements, and dynamic internal forces of characteristic units for single variable and target parameters. The influence of the variation in each single factor on the seismic performance of the piled wharf structural system is analyzed through fiducial error analysis.
Due to limited space, the land-side pile perimeter soil feature point L1 (Node 2904) of the piled wharf structure and sea-side pile perimeter soil feature points H1 (Node 3661) and H2 (Node 2088) are selected. Numerical analyses were performed on the site for lateral extreme displacement and peak acceleration. The location distribution of the soil feature points is shown in Figure 3. The fiducial error curves based on the analysis results are shown in Figure 6 and Figure 7.
The peak acceleration of the soil characteristic point around the sea-side pile is positively correlated with the friction angle and ground motion intensity, while it is nonlinearly related to the elastic modulus and cohesion. The parameter correlation of the land-side pile perimeter soil characteristic points is comparable to that of the sea-side pile perimeter soil, where the peak acceleration is nonmonotonically correlated with the elastic modulus. Figure 7 shows that lateral extreme displacement at the characteristic points of land-side pile perimeter soil and sea-side pile perimeter soil are negatively correlated with the elastic modulus, friction angle, and ground motion intensity. The lateral displacement of soil characteristic points around land-side piles is nonlinear with cohesion, while the lateral displacement of soil characteristic points around the sea-side pile is positively correlated with cohesion.
The pile top feature element A1 (element 4355) and the pile body feature elements B1 (element 4247) and B2 (element 4216) (Figure 2) are selected in the foundation soil. Fiducial error analysis was performed on the structure for the bending moment, shear force, and extreme axial force. The fiducial error curves of the dynamic axial force (Figure 8), dynamic shear force (Figure 9), and dynamic bending moment (Figure 10) of the unit section are carried out based on the calculated results. They show that the dynamic axial force, dynamic shear force, and dynamic bending moment are sensitive to the friction angle and ground motion intensity. The variation relationship is positively correlated. The relationship between the dynamic shear force and dynamic bending moment with the elastic modulus is negatively correlated. Additionally, the dynamic axial force and the modulus of elasticity are nonlinear, and the correlation is weak compared to the friction angle and ground motion intensity.

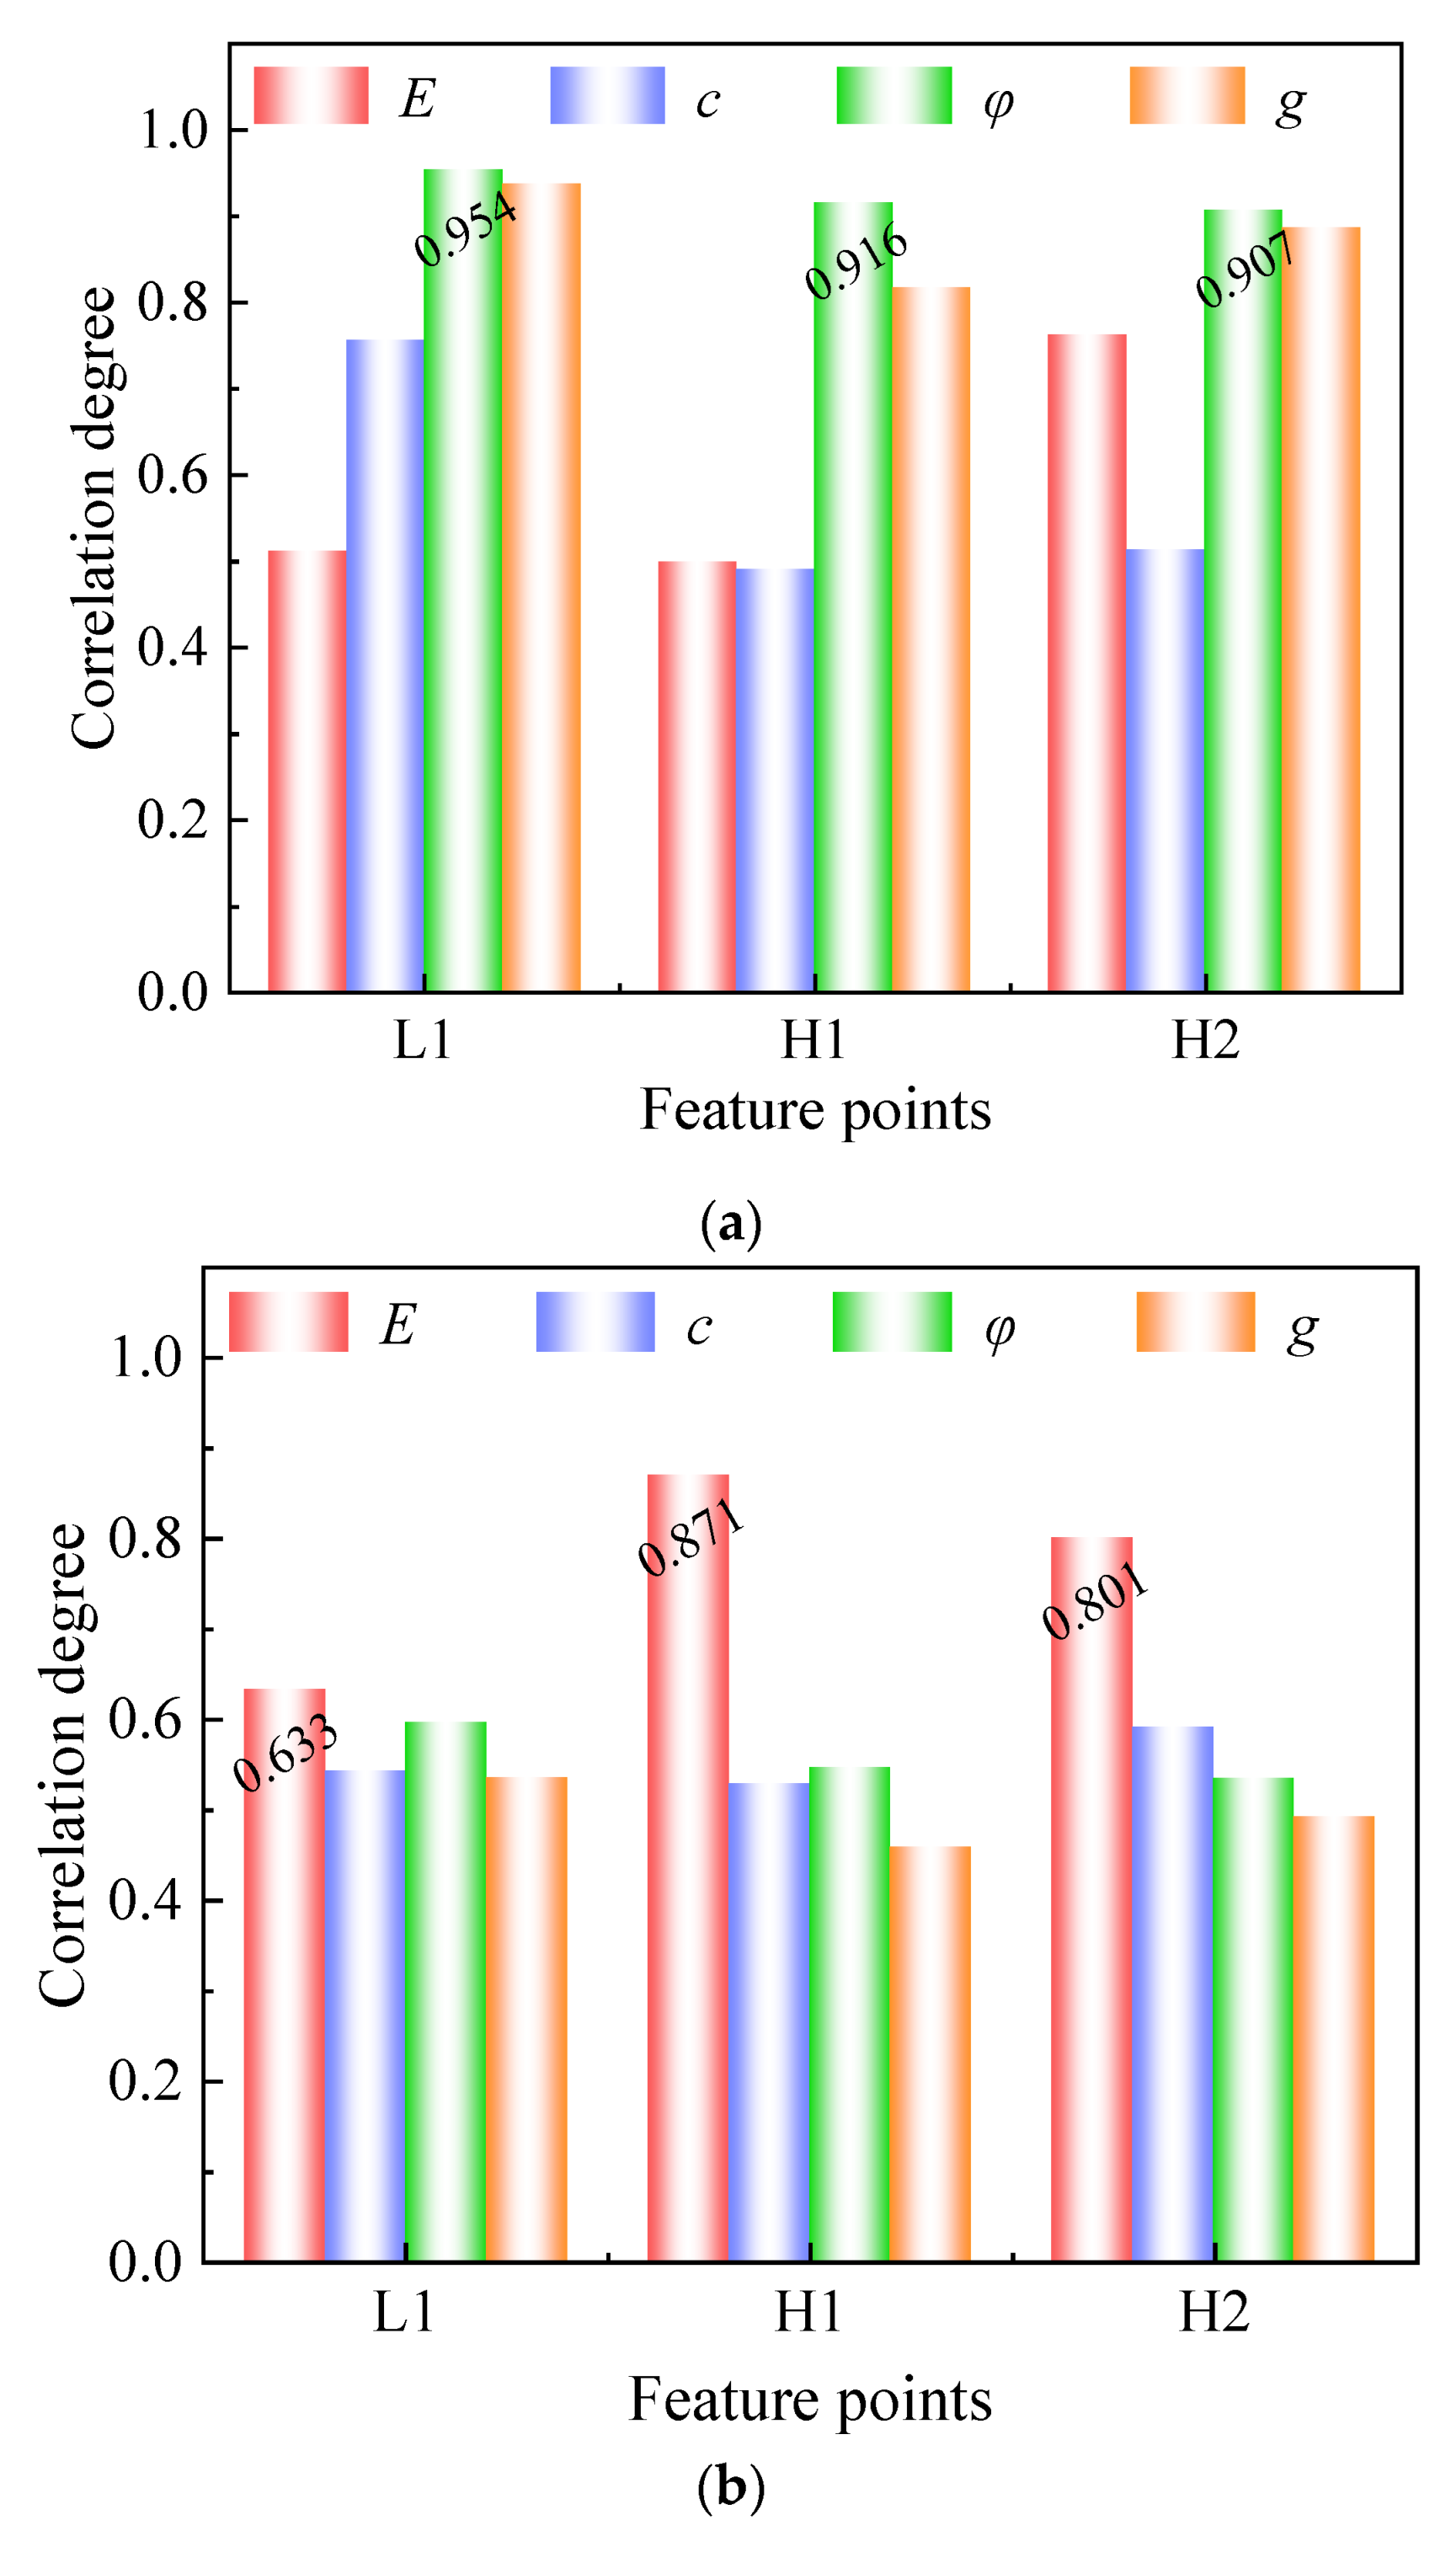
4.2. Grey Relational Analysis of Piled Wharf

Based on the above analysis, it can be seen that the quantified relationship of the target parameter with a single variable and the linear correlation between the target parameter and each variable can be presented through the reference errors calculated by the control variables method. In contrast, a single target parameter in a whole system is normally determined by multiple variables. In this case, it is necessary to give consideration to the effect of the joint effect between relevant variables. Above all, grey correlation analysis is performed to analyze specific parameter sensitivity sequences [54,55].
Figure 11 shows the grey correlation of the peak acceleration and lateral extreme displacement of the soil feature points. The grey correlation series between the peak acceleration and the lateral extreme displacement at the characteristic point of land-side pile perimeter soil are more diverse. The grey correlation series of displacement extremes of soil feature points around the sea-side pile gradually decreases with increasing depth. The grey correlation between the peak acceleration of the feature points and the friction angle, as well as ground motion intensity, is rather significant. In particularly, lateral extreme displacement has the strongest correlation with the elastic modulus of the soil.
Figure 12 shows the grey correlation of the internal forces of the critical units. The distribution of the grey correlation sequence of the dynamic shear force and dynamic bending moment at the characteristic points of the wharf structure is: friction angle, ground motion strength, cohesion, and elastic modulus. Both the dynamic shear force and dynamic bending moment at characteristic points of the pile foundation structure have a strong grey correlation with the friction angle and ground vibration strength. This indicates that the dynamic internal force of the pile foundation is more sensitive to the friction angle and ground motion intensity of the soil.

5. Summary and Conclusions

In this study, a finite element numerical model was developed to analyze the seismic dynamic response of a wharf panel structure and pile foundation structure. The sensitivity parameters in the dynamic system, such as the elastic modulus, cohesion, friction angle, and ground motion intensity, were selected as representative feature points in the soil and wharf structure for fiducial error analysis and grey relation analysis. The following can be determined:
(i) The mean grey relational sequence of acceleration peaks at feature points is friction angle, ground motion intensity, elastic modulus, and cohesion, indicating that it is more sensitive to variations in friction angle and ground motion intensity. The correlation sequence between the lateral extreme displacement and the location of feature points is relatively greater, while the grey correlation sequence of deep soil is lessened. Its correlation mean sequence is elastic modulus, friction angle, cohesion, and ground motion strength.
(ii) For the dynamic shear force and dynamic bending moment, the grey correlation series of different characteristic key unit parameter sensitivities in the same range are approximately similar. Its correlation mean sequence is friction angle, ground motion strength, cohesion, and elastic modulus. The burial depth of the pile foundation has less impact on it.
(iii) The grey correlation sequences of the peak acceleration and lateral extreme displacement at the feature points of the soil around the pile greatly vary, indicating that the key factors of the different sequences control the target parameters corresponding to them. The variability of the grey correlation sequences of the internal forces in different characteristic units of the piled wharf structure is not significant, while the sensitivity of the lower feature unit to cohesive forces is higher than that of the upper feature unit.
(iv) Based on the abovementioned analyses and conclusions, it is suggested that the parameter sensitivity analysis of piled wharf structures should be carried out before their design. According to a parameter sensitivity analysis of the characteristic unit, the possible failure mode is predicted and the vulnerable area can be strengthened to reduce the damage in the earthquake.

Author Contributions

Conceptualization and methodology, J.Z. and C.C.; validation, P.Z., K.W. and M.Z.; data curation, K.W. and M.Z.; writing—original draft preparation, J.Z.; writing—review and editing, C.C. and P.Z.; supervision, C.C. and P.Z.; funding acquisition, C.C. All authors have read and agreed to the published version of the manuscript.

Funding

This research was funded by the National Key Research and Development Program of China (Grant No. 2021YFB2601102), the National Natural Science Foundation of China (Grant No. 51878109, 52178315).

Data Availability Statement

The data reported in this article are available from the corresponding author upon request.

Conflicts of Interest

The authors declare no conflict of interest.

References

  1. Shen, C.; Qian, J.; Chen, X.; Xie, F.; Zhu, J. Nonlinear Behavior of Marine Soil on the Dynamic Stability of Upper Wha-rf Structures: A Numerical Simulation Approach. J. Coast. Res. 2021, 37, 149–155. [Google Scholar] [CrossRef]
  2. Brunet, S.; Llera, J.C.; Jacobsen, A.; Miranda, E.; Meza, C. Performance of port facilities in Southern Chile during the 27 February 2010 Maule earthquake. Earthq. Spectra 2012, 28, S553–S579. [Google Scholar] [CrossRef]
  3. Cui, C.; Meng, K.; Wu, Y.; Chapman, D.; Liang, Z. Dynamic response of pipe pile embedded in layered visco-elastic media with radial inhomogeneity under vertical excitation. Geomech. Eng. 2018, 16, 609–618. [Google Scholar] [CrossRef]
  4. Yuan, B.; Chen, W.; Zhao, J.; Li, L.; Liu, F.; Guo, Y.; Zhang, B. Addition of alkaline solutions and fibers for the reinforcement of kaolinite-containing granite residual soil. Appl. Clay Sci. 2022, 228, 106644. [Google Scholar] [CrossRef]
  5. Yan, Z.; Sun, X.; Yang, Z.; Fu, D. Lateral Bearing Performance of a Defective Pile-Supported Wharf with Batter Piles. J. Waterw. Port Coast. Ocean Eng. 2020, 146, 04020035. [Google Scholar] [CrossRef]
  6. Tang, L.; Zhang, Y.; Ling, X.; Tian, S. Fuzzy optimization for ground motion intensity measures to characterize the response of the pile-supported wharf in liquefiable soils. Ocean Eng. 2022, 265, 112645. [Google Scholar] [CrossRef]
  7. Su, L.; Wan, H.; Dong, Y.; Frangopol, D.; Ling, X. Seismic fragility assessment of large-scale pile-supported wharf structures considering soil-pile interaction. Eng. Struct. 2019, 186, 270–281. [Google Scholar] [CrossRef]
  8. Cullough, N.J.M. The Seismic Geotechnical Modeling, Performance, and Analysis of Pile-Supported Wharves. Ph.D. Thesis, Oregon State University, Corvallis, OR, USA, 2004. [Google Scholar]
  9. Moghadam, A.M.; Ghalandarzadeh, A.; Towhata, I.; Majid, M.; Babak, E.; Pourya, H. Studying the effects of deformable panels on seismic displacement of gravity quay walls. Ocean Eng. 2009, 36, 1129–1148. [Google Scholar] [CrossRef]
  10. Fu, D.; Li, H.; Guo, X.; Yu, D.; Wu, Y. Seismic response analysis of high-pile wharf. Port Waterw. Eng. 2011, 3, 71–75. (In Chinese) [Google Scholar] [CrossRef]
  11. Chau, N.L.; Dao, T.P.; Nguyen, V. An Efficient Hybrid Approach of Finite Element Method, Artificial Neural Network-Based Multiobjective Genetic Algorithm for Computational Optimization of a Linear Compliant Mechanism of Nanoindentation Tester. Math. Probl. Eng. 2018, 14, 7070868. [Google Scholar] [CrossRef]
  12. Wang, C.N.; Yang, F.C.; Nguyen, V.; Vo, N.T.M. CFD Analysis and Optimum Design for a Centrifugal Pump Using an Effectively Artificial Intelligent Algorithm. Micromachines 2022, 13, 1208. [Google Scholar] [CrossRef] [PubMed]
  13. Su, L.; Lu, J.; Elgamal, A.; Arulmoli, A. Seismic performance of a pile-supported wharf: Three-dimensional finite element simulation. Soil Dyn. Earthq. Eng. 2017, 95, 167–179. [Google Scholar] [CrossRef] [Green Version]
  14. Li, J.; Song, B.; Cui, J. Seismic Dynamic Damage Characteristics of Vertical and Batter Pile-supported Wharf Structure Systems. J. Eng. Sci. Technol. Rev. 2015, 8, 180–189. [Google Scholar] [CrossRef]
  15. Mirzaeefard, H.; Mirtaheri, M.; Hariri-Ardebili, M.A. Life-cycle cost analysis of pile-supported wharves under multi-hazard condition: Aging and shaking. Struct. Infrastruct. Eng. 2021, 19, 269–289. [Google Scholar] [CrossRef]
  16. Wang, Y.; He, L. Simplified Calculation Methods for All-Vertical-Piled Wharf in Offshore Deep Water. China Ocean Eng. 2017, 31, 182–191. [Google Scholar] [CrossRef]
  17. Su, L.; Wan, H.; Lu, J.; Lu, J.; Arulmoli, A. Seismic performance evaluation of a pile-supported wharf system at two seismic hazard levels. Ocean Eng. 2020, 219, 108333. [Google Scholar] [CrossRef]
  18. Deghoul, L.; Gabi, S.; Hamrouni, A. The influence of the soil constitutive models on the seismic analysis of pile-supported wharf structures with batter piles in cut-slope rock dike. Stud. Geotech. Mech. 2020, 42, 191–209. [Google Scholar] [CrossRef]
  19. Meng, C.; Tang, L. Effects of Ground Motion Characteristics on Seismic Responses of Pile-Supported Wharf in Liquefia-ble Soils. J. Jilin Univ. Earth Sci. Ed. 2021, 51, 1463–1472. (In Chinese) [Google Scholar] [CrossRef]
  20. Yuan, B.; Li, Z.; Chen, W.; Zhao, J.; Lv, J.; Song, J.; Cao, X. Influence of Groundwater Depth on Pile–Soil Mechanical Properties and Fractal Characteristics under Cyclic Loading. Fractal Fract. 2022, 6, 198. [Google Scholar] [CrossRef]
  21. Shao, W.; Sun, Q.; Xu, X.; Yue, W.; Shi, D. Durability life prediction and horizontal bearing characteristics of CFRP com-posite piles in marine environments. Constr. Build. Mater. 2023, 367, 130116. [Google Scholar] [CrossRef]
  22. Li, H.; Liu, S.; Tong, L. A numerical interpretation of the soil-pile interaction for the pile adjacent to an excavation in clay. Tunn. Undergr. Space Technol. 2022, 121, 104344. [Google Scholar] [CrossRef]
  23. Cui, C.; Liang, Z.; Xu, C.; Xin, Y.; Wang, B. Analytical solution for horizontal vibration of end-bearing single pile in radially heterogeneous saturated soil. App. Math. Model. 2023, 116, 65–83. [Google Scholar] [CrossRef]
  24. Cui, C.; Meng, K.; Xu, C.; Liang, Z.; Li, H.; Pei, H. Analytical solution for longitudinal vibration of a floating pile in s-aturated porous media based on a fictitious saturated soil pile model. Comput. Geotech. 2021, 131, 103942. [Google Scholar] [CrossRef]
  25. Cui, C.; Meng, K.; Xu, C.; Wang, B.; Xin, Y. Vertical vibration of a floating pile considering the incomplete bonding effect of the pile-soil interface. Comput. Geotech. 2022, 150, 104894. [Google Scholar] [CrossRef]
  26. Meng, K.; Cui, C.; Liang, Z.; Pei, H. A new approach for longitudinal vibration of a large-diameter floating pipe pile i-n visco-elastic soil considering the three-dimensional wave effects. Comput. Geotech. 2020, 128, 103840. [Google Scholar] [CrossRef]
  27. Gao, S.; Gong, J.; Feng, Y. Equivalent Damping Ratio Equations in Support of Displacement-Based Seismic Design for Pile-Supported Wharves. J. Dalian Univ. Technol. 2016, 21, 93–530. [Google Scholar] [CrossRef]
  28. Zhang, W.; Zhang, S.; Zhang, M.; Yu, J. Seismic Response Analysis of the High—Pile Wharf Based on the Interaction of Piles and Soil. J. Jiangnan Univ. 2014, 13, 457–462. (In Chinese) [Google Scholar] [CrossRef]
  29. Liu, L.; Yang, X. Dynamic interaction of saturated soil-pile-structure system under seismic loading. Rock and Soil Mech. 2012, 33, 120–128. (In Chinese) [Google Scholar] [CrossRef]
  30. Su, L.; Wan, H.; Li, Y.; Ling, X. Soil-Pile-Quay Wall System with Liquefaction-Induced Lateral Spreading: Experimental Investigation, Numerical Simulation, and Global Sensitivity Analysis. J. Geotech. Geoenviron. 2018, 144, 04018087. [Google Scholar] [CrossRef]
  31. Zhu, R.; Che, Y.; Su, J.; Luo, M.; Wang, J.; Zeng, H. Analysis of sensitivity and correlation of high-piled wharf’s natural frequency. Port Waterw. Eng. 2019, 12, 49–54. (In Chinese) [Google Scholar] [CrossRef]
  32. Zhang, H.; Sun, X.; Wang, Y.; Yin, J.; Wang, C. Dynamic Characteristics and Simplified Numerical Methods of An All-Vertical-Piled Wharf in Offshore Deep Water. China Ocean Eng. 2015, 29, 705–718. [Google Scholar] [CrossRef]
  33. Souri, M.; Khosravifar, A.; Dickenson, S.; McCullough, N.; Schlechter, S. Effects of long duration earthquakes on the interaction of inertial and liquefaction-induced kinematic demands on pile-supported wharves. Soil Dyn. Earthq. Eng. 2022, 154, 107155. [Google Scholar] [CrossRef]
  34. Zhao, Y.; Wang, Y.; Tang, L. The compressive-shear fracture strength of rock containing water based on Druker-Prager failure criterion. Arab. J. Geosci. 2019, 12, 452. [Google Scholar] [CrossRef]
  35. Zhang, L.; Liu, D.; Song, Q.; Liu, S. An analytical expression of reliability solution for Druker-Prager criterion. Appl. Math. Mech. Engl. Ed. 2008, 29, 121–128. [Google Scholar] [CrossRef]
  36. Elshenawy, T.; Li, Q. Influences of target strength and confinement on the penetration depth of an oil well perforator. Int. J. Impact Eng. 2013, 54, 130–137. [Google Scholar] [CrossRef]
  37. Zhu, J.; Peng, K.; Shao, J.; Liu, H. Improved slope safety analysis by new Druker-Prager type criterion. J. Cent. South Univ. Technol. 2012, 19, 1132–1137. [Google Scholar] [CrossRef]
  38. Tolooiyan, A.; Gavin, K. Modelling the Cone Penetration Test in sand using Cavity Expansion and Arbitrary Lagrangian Eulerian Finite Element Methods. Comput. Geotech. 2011, 38, 482–490. [Google Scholar] [CrossRef]
  39. Jiang, J.; Wu, Y. Identification of material parameters for Drucker–Prager plasticity model for FRP confined circular concrete columns. Int. J. Solids Struct. 2012, 49, 445–456. [Google Scholar] [CrossRef] [Green Version]
  40. Liu, H.; Ding, T.; Xiao, J.; Mechtcherine, V. Buildability prediction of 3D–printed concrete at early-ages: A numerical study with Drucker–Prager model. Addit. Manuf. 2022, 55, 102821. [Google Scholar] [CrossRef]
  41. Fan, Z.; Zheng, H.; Lin, S. Shear band static evolution by spatially mobilized plane criterion based Drucker-Prager model and numerical manifold method. Comput. Geotech. 2021, 132, 103962. [Google Scholar] [CrossRef]
  42. Liu, K.; Chen, S.; Gu, X. Analytical and Numerical Analyses of Tunnel Excavation Problem Using an Extended Drucker–Prager Model. Rock Mech. Rock Eng. 2020, 53, 1777–1790. [Google Scholar] [CrossRef]
  43. Zhao, T.; Lages, E.N.; Ramos, A.S.; Paulino, G.H. Topology optimization considering the Drucker–Prager criterion with a surrogate nonlinear elastic constitutive model. Struct. Multidisc. Optim. 2020, 62, 3205–3227. [Google Scholar] [CrossRef]
  44. Wang, C.; Yang, F.; Nguyen, V.; Nguyen, Q.; Huynh, N.; Huynh, T. Optimal design for compliant mechanism flexure hinges: Bridge-type. Micromachines 2021, 12, 1304. [Google Scholar] [CrossRef]
  45. Huynh, N.; Nguyen, T.; Nguyen, Q. Optimum Design for the Magnification Mechanisms Employing Fuzzy Logic–ANFIS. Comput. Mater. Con. 2022, 73, 5961–5983. [Google Scholar] [CrossRef]
  46. Wang, Z. Correlation analysis of sequences with interval grey numbers based on the kernel and greyness degree. Kybernetes 2013, 42, 309–317. [Google Scholar] [CrossRef]
  47. Li, X.; Tan, Y. Sensitivity Analysis of Seepage Stability of Slope with Sudden Drop of Water Level Based on Grey Correlation Degree Theory. Yellow River 2019, 41, 149–154. [Google Scholar] [CrossRef]
  48. Ning, Y.; Tang, H.; Wang, F.; Zhang, G. Sensitivity analysis of toppling deformation for interbedded anti-inclined rock slopes based on the grey relation method. Bull. Eng. Geol. Environ. 2019, 78, 6017–6032. [Google Scholar] [CrossRef]
  49. Liu, W.; Zhang, J.; Jin, M.; Liu, S.; Chang, X.; Xie, N.; Wang, Y. Key indices of the remanufacturing industry in China using a combined method of grey incidence analysis and grey clustering. Cleaner Prod. 2017, 168, 1348–1357. [Google Scholar] [CrossRef]
  50. Ye, S.; Huang, A. Sensitivity Analysis of Factors Affecting Stability of Cut and Fill Multistage Slope Based on Improved Grey Incidence Model. Soil Mech. Found. Eng. 2020, 57, 8–17. [Google Scholar] [CrossRef]
  51. Chen, X.; Deng, Z.; Hu, S.; Gao, J.; Gao, X. Design of a Compliant Mechanism Based Four-Stage Amplification Piezoelectric-Driven Asymmetric Microgripper. Micromachines 2020, 11, 25. [Google Scholar] [CrossRef] [Green Version]
  52. Wang, W.; Xia, W.; Liang, J. Grey Correlation Analysis between Macro Mechanical Damage and Meso Volume Charact-eristics of SBS Modified Asphalt Mixture under Freeze-Thaw Cycles. Buildings 2022, 12, 2118. [Google Scholar] [CrossRef]
  53. Deng, J. The Foundation of Grey Theory; Huazhong University of Science Technology Press: Wuhan, China, 2002; pp. 122–141. [Google Scholar]
  54. Xie, N.; Liu, S. A novel grey relational model based on grey number sequences. Grey Syst. 2011, 1, 117–128. [Google Scholar] [CrossRef]
  55. Yin, K.; Xu, T.; Li, X.; Gao, Y. A study of the grey relational model of interval numbers for panel data. Grey Syst. Theory Appl. 2020, 11, 200–211. [Google Scholar] [CrossRef]
Figure 1. Parameter sensitivity analysis framework flow chart.
Buildings 13 00349 g001
Figure 2. The numerical model.
Buildings 13 00349 g002
Figure 3. The cross-section of the piled wharf structure.
Buildings 13 00349 g003
Figure 4. M-C and D-P in slant plane.
Buildings 13 00349 g004
Figure 5. Acceleration time-history curve of the El-Centro earthquake wave.
Buildings 13 00349 g005
Figure 6. Acceleration limit value error curve. (a) L1; (b) H1; (c) H2.
Buildings 13 00349 g006aBuildings 13 00349 g006b
Figure 7. Displacement limit value error curve. (a) L1; (b) H1; (c) H2.
Buildings 13 00349 g007aBuildings 13 00349 g007b
Figure 8. Key unit dynamic axial force reference value error curve. (a) A1; (b) B1; (c) B2.
Buildings 13 00349 g008
Figure 9. Key unit dynamic shear reference value error curve. (a) A1; (b) B1; (c) B2.
Buildings 13 00349 g009
Figure 10. Key unit dynamic bending moment reference value error curve. (a) A1; (b) B1; (c) B2.
Buildings 13 00349 g010
Figure 11. Soil feature point relational degree histogram. (a) Peak acceleration; (b) Lateral displacement extremes.
Buildings 13 00349 g011
Figure 12. Structural feature point relational degree histogram. (a) Dynamic shear; (b) Dynamic bending moment.
Buildings 13 00349 g012
Table 1. Materials parameters.
MaterialsElevation (m)Elastic Modulus (kN.m−2)Volumetric Weight (kN.m−3)Poisson’s RatioCohesion (kN.m−2)Friction Angle (°)
Concrete (Pile)--3 × 10724.50.152 × 10347
Concrete (Pile Cap)1.3 ~ 4.33.45 × 107250.182 × 10347
Concrete (Pavement)1.3 ~ 4.33.45 × 107250.182 × 10347
Crushed Rock Revetment−1 ~ 2.71 × 10515.20.33740
Rubble Mound Breakwater−12.8 ~ 1.7 2.1 × 105200.3741
Sand-Filling−10 ~ 3.51.37 × 10413.240.33736
Mud and Silt−13.7 ~ −10 4.55 × 10415.20.35930
Hard Loam−19.8 ~ −13.72.5 × 10517.650.312530
Dense Sand−29.8 ~ −19.83.567 × 10519.120.321538
Hard Clay−35.7 ~ −29.88.722 × 10520.10.274031
Table 2. Variable distribution.
Sensitivity ParametersFiducial ValueParameter Variation Range
Elastic modulus (E)E0 = 4.55 × 1040.6–0.8–1.0–1.2–1.4 E0
Cohesion (C)C0 = 70.6–0.8–1.0–1.2–1.4 C0
Friction angle (φ)φ0 = 300.6–0.8–1.0–1.2–1.4 φ0
Ground motion intensity (g)g0 = 0.20.6–0.8–1.0–1.2–1.4 g0
Disclaimer/Publisher’s Note: The statements, opinions and data contained in all publications are solely those of the individual author(s) and contributor(s) and not of MDPI and/or the editor(s). MDPI and/or the editor(s) disclaim responsibility for any injury to people or property resulting from any ideas, methods, instructions or products referred to in the content.

