
Study of the Correlation among Luminous Properties of Smart Glazing for Adaptive Energy Saving Buildings

Abstract
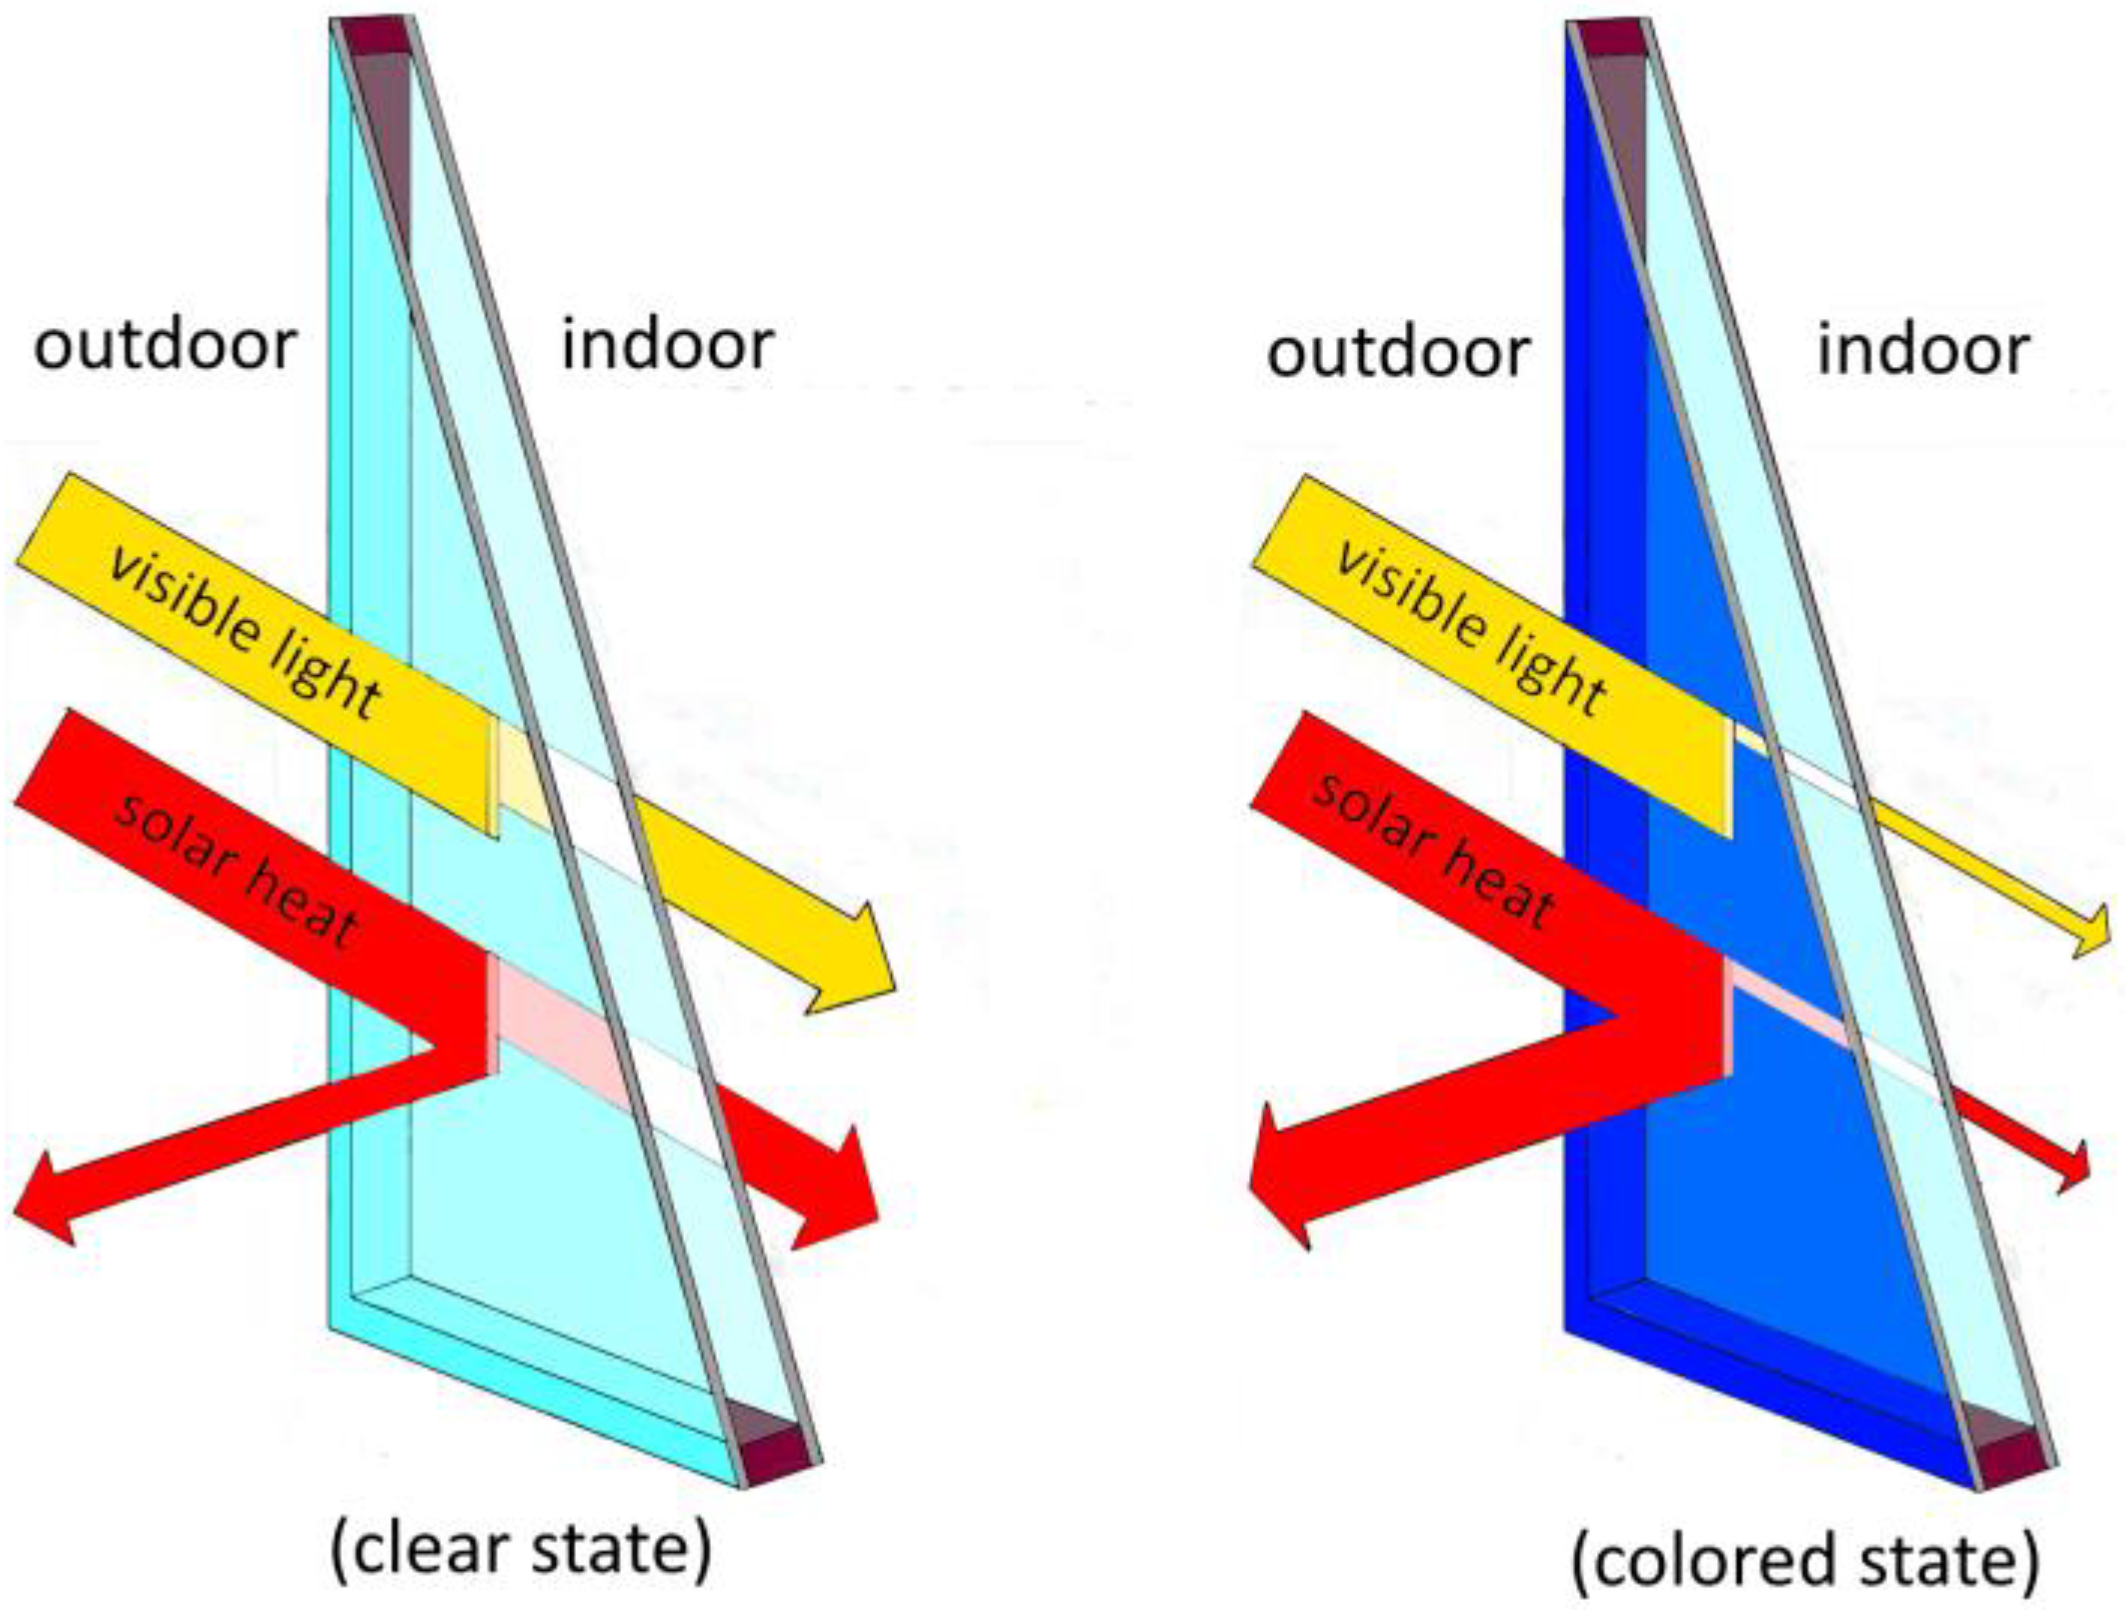
:1. Introduction
2. Materials and Methods
2.1. Sol–Gel: Preparation of Precursor Sol and Film Deposition
2.2. RF Sputtering
3. Results and Discussion
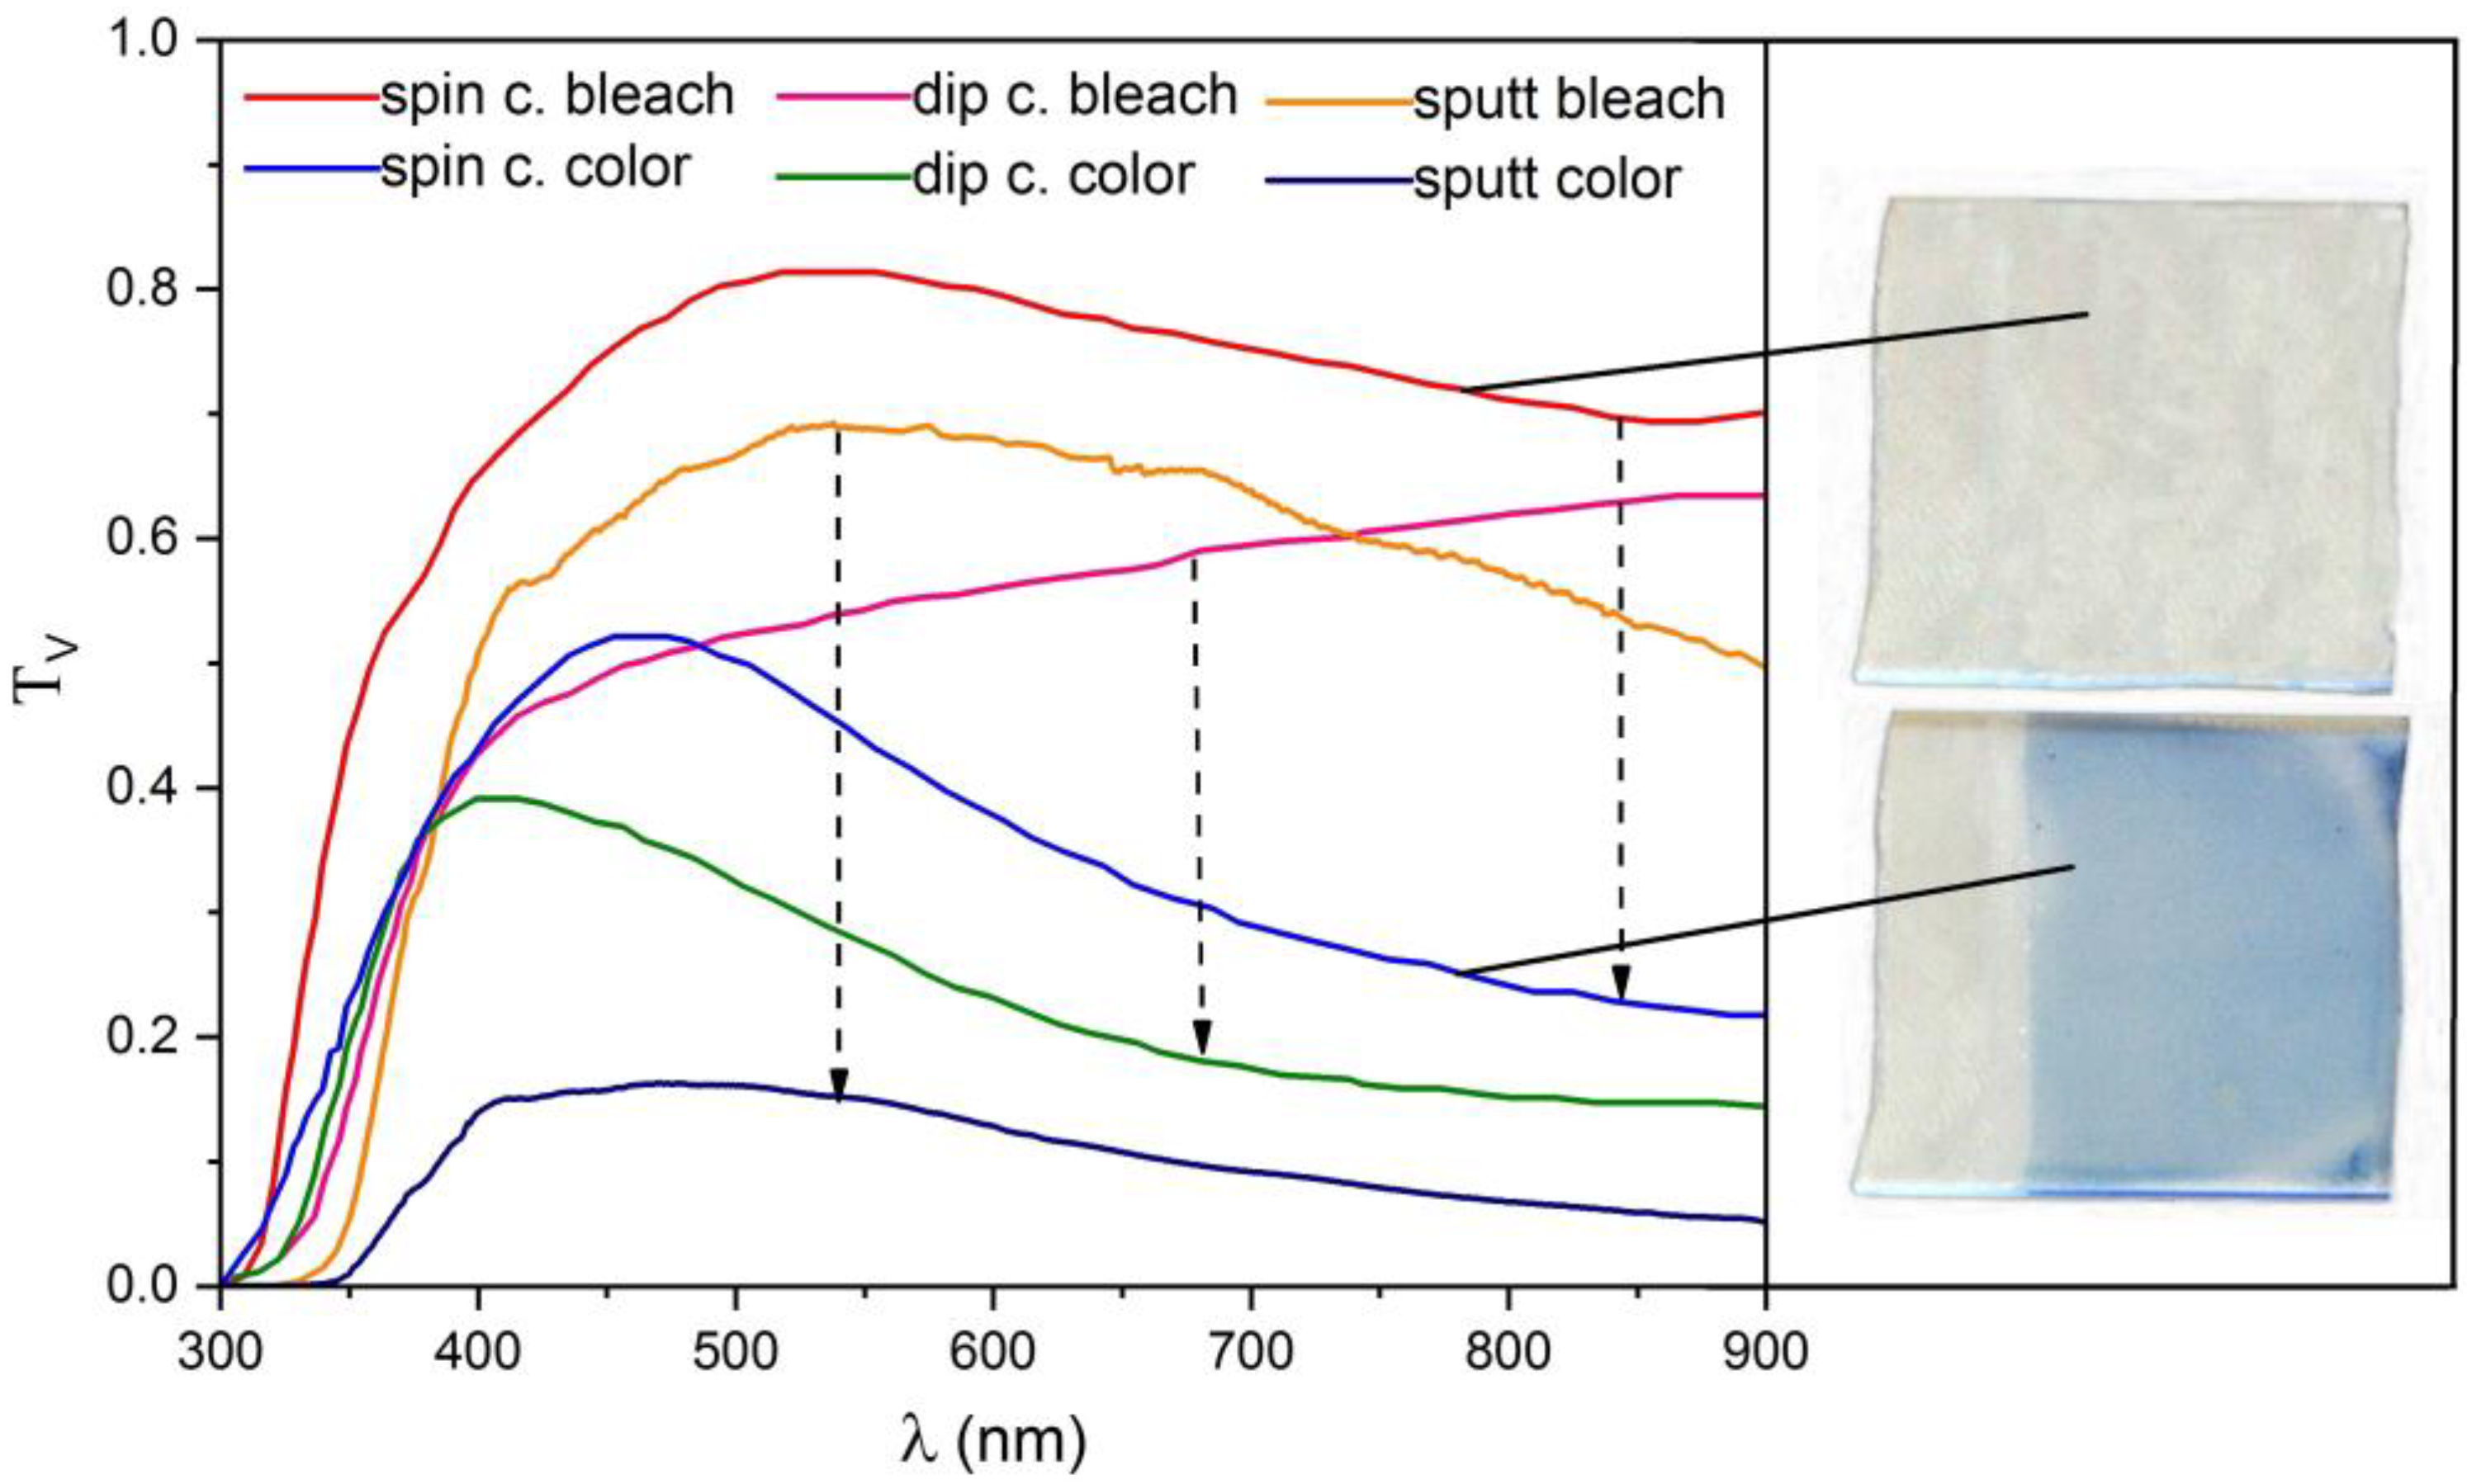
3.1. Evaluation of the Luminous Transmittance
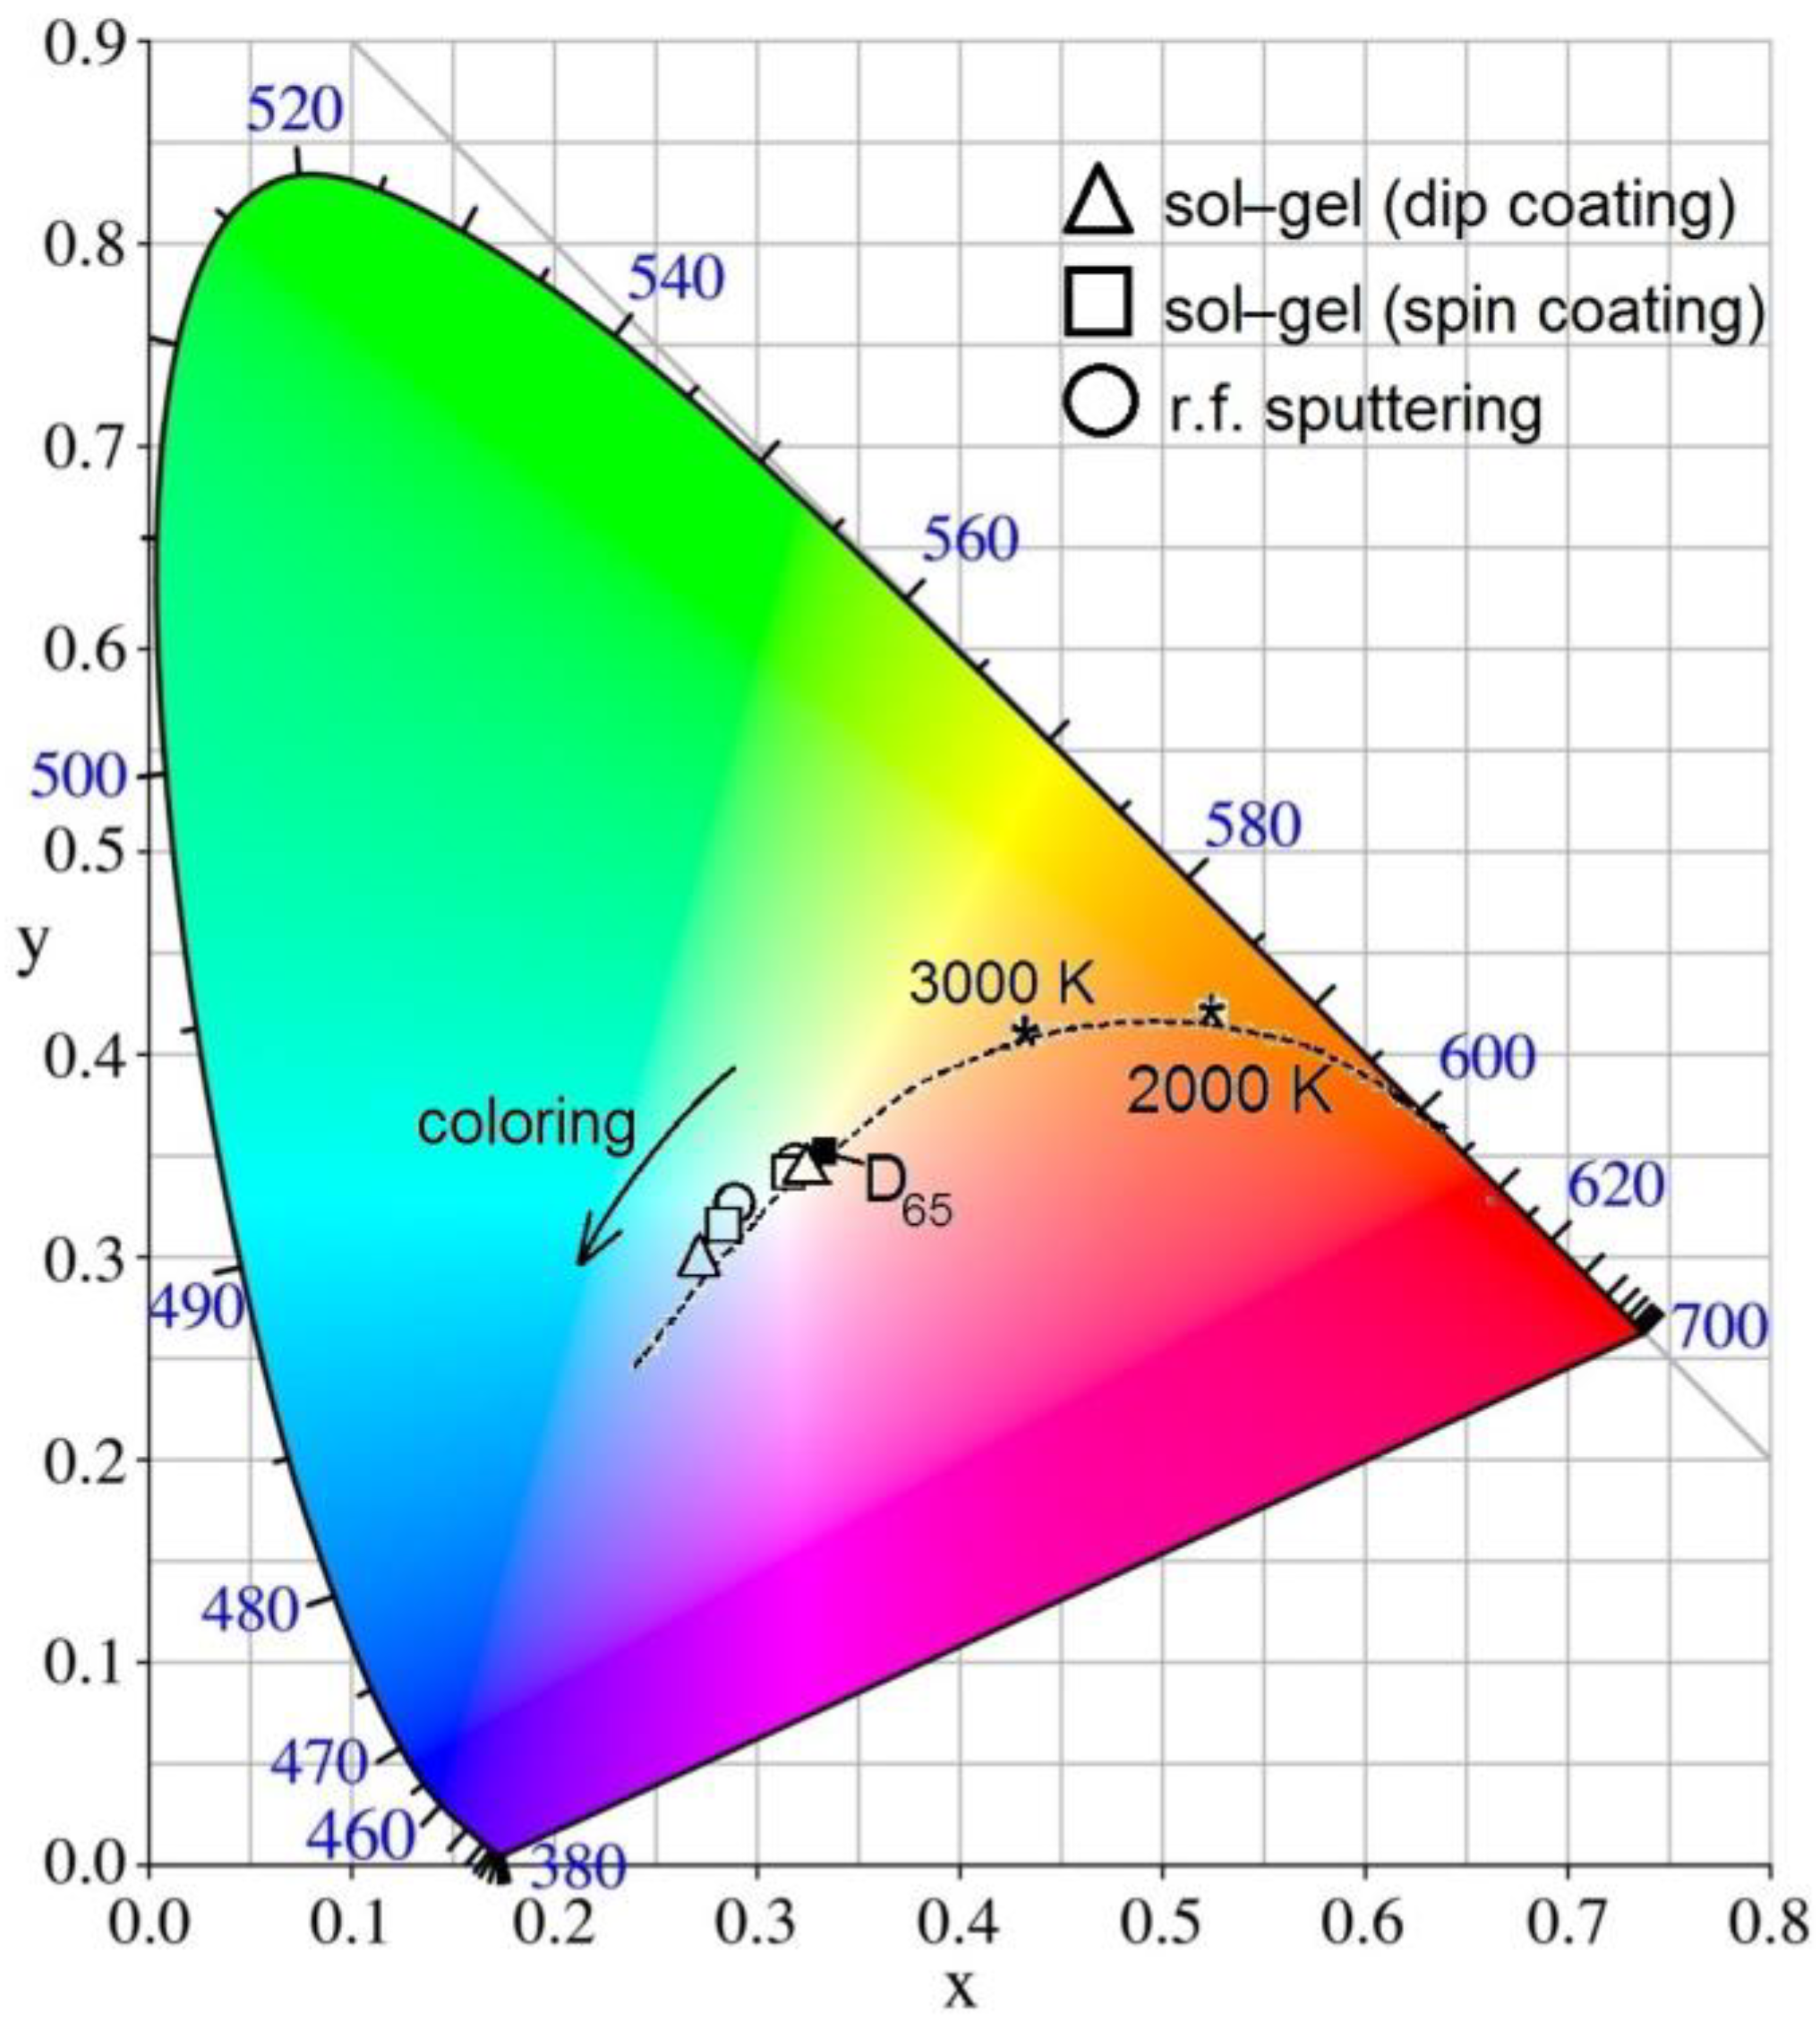
3.2. Evaluation of the Color Coordinates on the CIE-xy 1931 Diagram
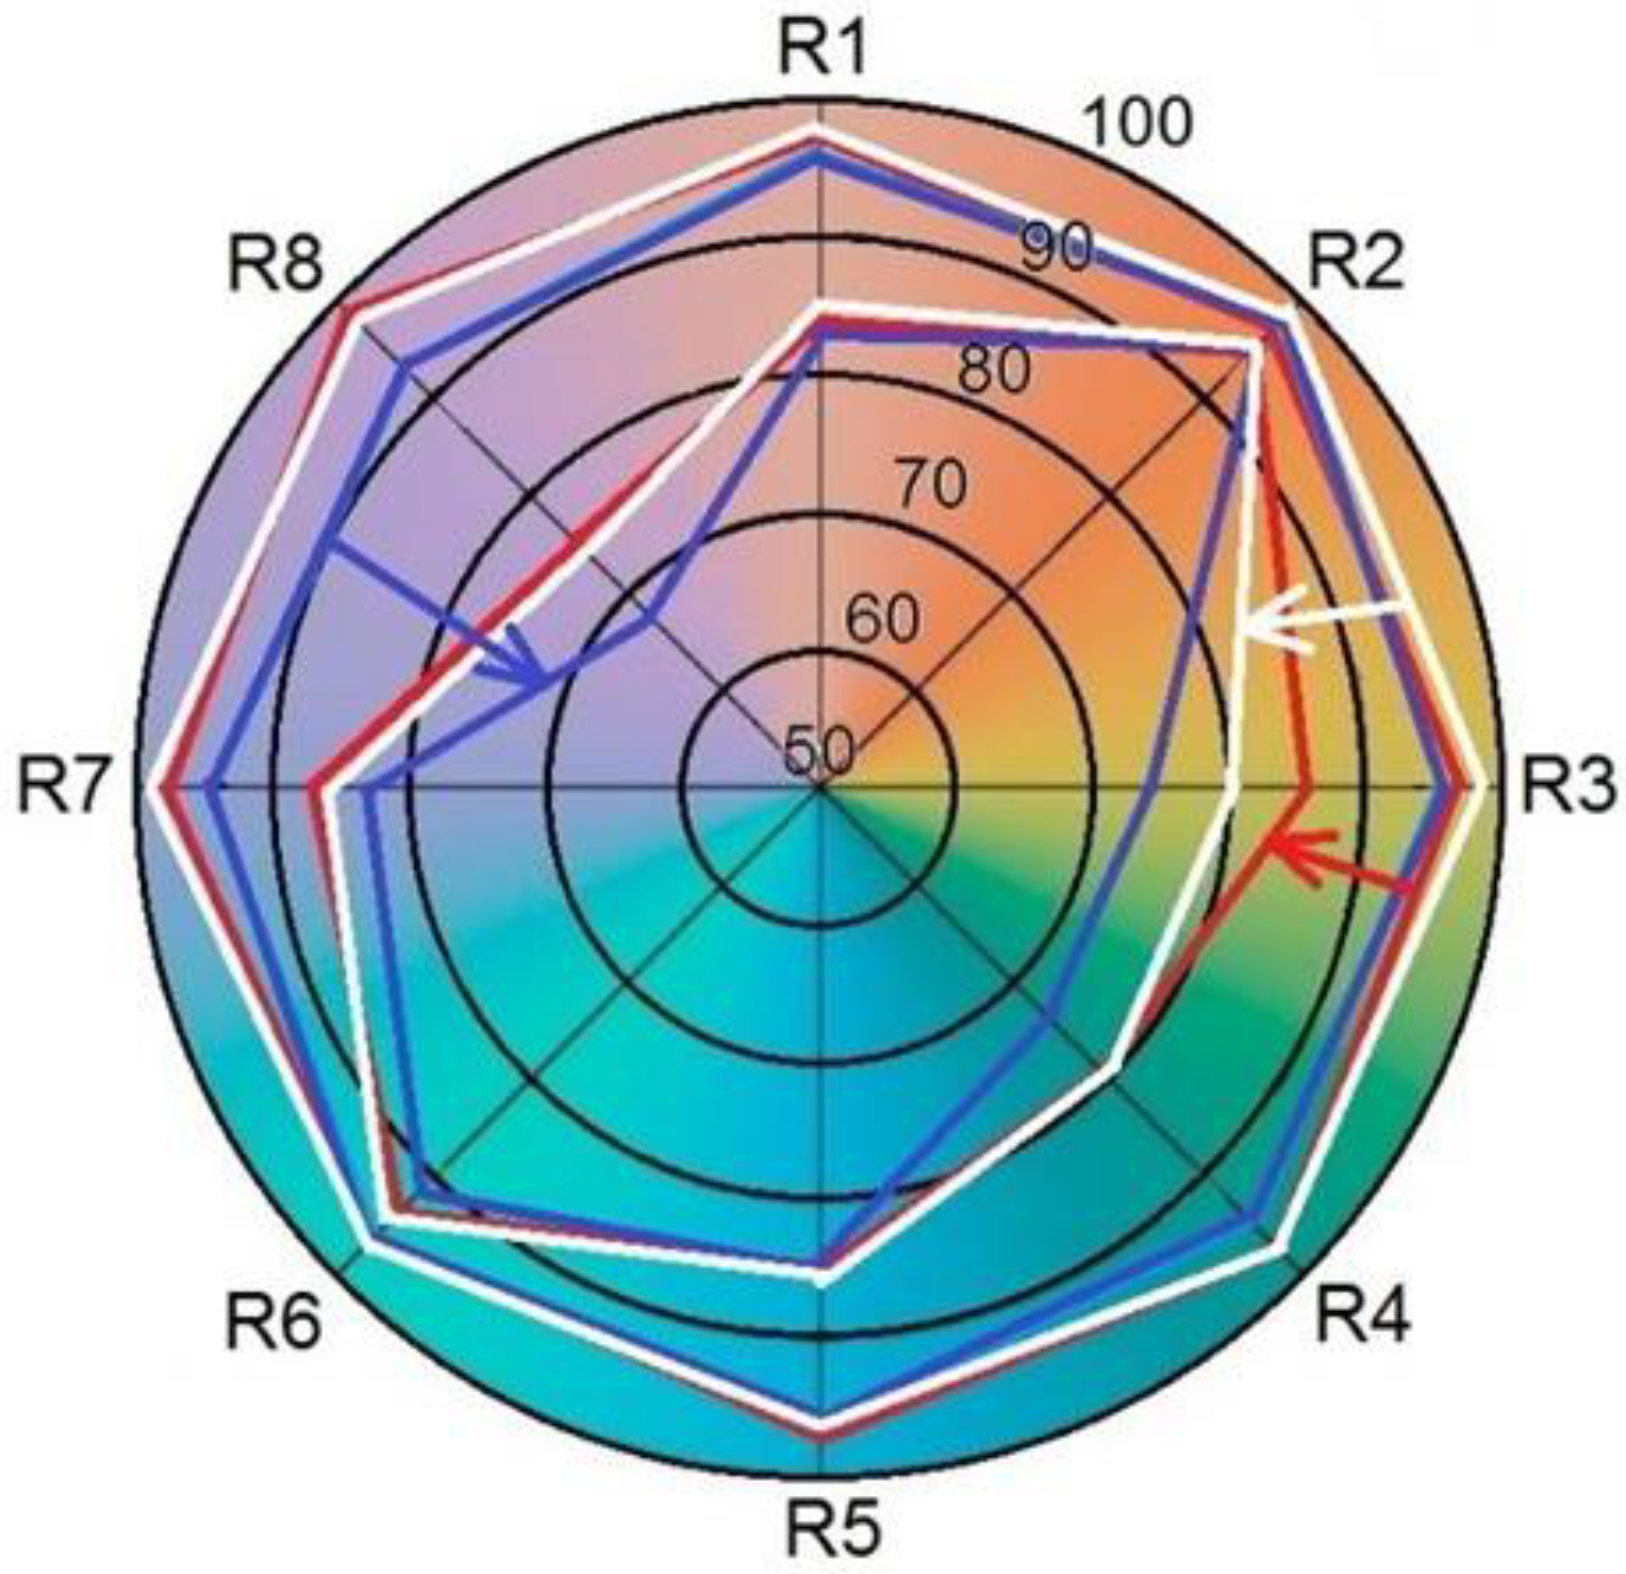
3.3. Evaluation of the Color Rendering Index CIE CRI
3.4. Evaluation of the Correlated Color Temperature CCT
3.5. Study of the Correlation among CRI, CCT, and τV
4. Conclusions
Author Contributions
Funding
Data Availability Statement
Conflicts of Interest
Nomenclature
| APTA | acetylated peroxotungstic acid |
| BIPV | building integrated photovltaic |
| CCT | Correlated Color Temperature (K) |
| CIE | Commission International de l’Eclairage |
| CR | contrast ratio |
| CRI | Color Rendering Index |
| D65 | standard illuminant D65 |
| D65(λ) | relative spectral power distribution of illuminant D65 |
| EC | electrochromic |
| GC | gasochromic |
| ITO | indium tin oxide |
| K glass | glass covered by fluorine-doped tin oxide |
| LCD | liquid crystal devices |
| n = (x − xe)/(y − ye), | parameter of McCamy’s equation (12) |
| pPEGMA | poly (ethylene glycol) ethylethermethacrylate |
| RF | radio frequency |
| Ri | specific color rendering index of the i-th test color |
| SPD | suspended particle devices |
| TC | thermochromic |
| U* | chromaticity adaptation transform |
| V(λ) | spectral luminous efficiency of the standard observer |
| V* | chromaticity adaptation transform |
| W* | chromaticity adaptation transform |
| x | color coordinate on the CIE-xy 1931 chromaticity diagram |
| CIE standard color matching function | |
| X | CIE tristimulus value |
| xe | =0.3320, parameter of McCamy’s equation (12) |
| y | color coordinate on the CIE-xy 1931 chromaticity diagram |
| CIE standard color matching function | |
| Y | CIE tristimulus value |
| ye | =0.1858, parameter of McCamy’s equation (12) |
| z | color coordinate on the CIE-xy 1931 chromaticity diagram |
| CIE standard color matching function | |
| Z | CIE tristimulus value |
| Greek symbols | |
| βi(λ) | spectral reflectance of i-th test color |
| ΔEi | total distortion of i-th test color |
| Δλ | wavelength interval (nm) |
| λ | wavelength (nm) |
| τ | spectral transmittance |
| τV | luminous transmittance coefficient |
| Subscripts | |
| i | refers to the i-th test color |
| r | refers to the reference illuminant |
| t | refers to light transmitted through glazing |
| V | luminous, visible |
References
- Cannavale, A.; Ayr, U.; Fiorito, F.; Martellotta, F. Smart electrochromic windows to Enhance Building Energy Efficiency and Visual Comfort. Energies 2020, 13, 1449. [Google Scholar] [CrossRef] [Green Version]
- Ghosh, A.; Mallick, T.K. Evaluation of colour properties due to switching behaviour of a PDLC glazing for adaptive building integration. Renew. Energy 2018, 120, 126–133. [Google Scholar] [CrossRef]
- Nundy, S.; Ghosh, A. Thermal and visual comfort analysis of adaptive vacuum integrated switchable suspended particle device window for temperate climate. Renew. Energy 2020, 159, 1361–1372. [Google Scholar] [CrossRef]
- Aburas, M.; Soebarto, V.; Williamson, T.; Liang, R.; Ebendorff-Heidepriem, H.; Wuc, Y. Thermochromic smart window technologies for building application: A review. Appl. Energy 2019, 255, 113522. [Google Scholar] [CrossRef]
- Wu, L.Y.L.; Zhao, Q.; Huang, H.; Lim, R.J. Sol-gel based photochromic coating for solar responsive smart window. Surf. Coat. Technol. 2017, 320, 601–607. [Google Scholar] [CrossRef]
- Liu, D.; Sun, Y.; Wilson, R.; Wu, Y. Comprehensive evaluation of window-integrated semi-transparent PV for building daylight performance. Renew. Energy 2020, 145, 1399–1411. [Google Scholar] [CrossRef]
- Khaled, K.; Berardi, U. Current and future coating technologies for architectural glazing applications. Energy Build. 2021, 244, 111022. [Google Scholar] [CrossRef]
- Bienvenido-Huertas, D.; Moyano, J.; Marin, D.; Fresco-Contreras, R. Review of in situ methods for assessing the thermal transmittance of walls. Renew. Sustain. Energy Rev. 2019, 102, 356–371. [Google Scholar] [CrossRef]
- Andersen, M.; Gochenour, S.J.; Lockley, S.W. Modelling ‘non-visual’ effects of daylighting in a residential environment. Build. Environ. 2013, 70, 138–149. [Google Scholar] [CrossRef] [Green Version]
- Bellia, L.; Bisegna, F.; Spada, G. Lighting in indoor environments: Visual and nonvisual effects of light sources with different spectral power distributions. Build. Environ. 2011, 46, 1984–1992. [Google Scholar] [CrossRef]
- Dai, Q.; Cai, W.; Shi, W.; Hao, L.; Wei, M. A proposed lighting-design space: Circadian effect versus visual illuminance. Build. Environ. 2017, 122, 287–293. [Google Scholar] [CrossRef]
- Kim, I.T.; Choi, A.S.; Sung, M.K. Development of a Colour Quality Assessment Tool for indoor luminous environments affecting the circadian rhythm of occupants. Build. Environ. 2017, 126, 252–265. [Google Scholar] [CrossRef]
- Lee, E.S.; Tavil, A. Energy and visual comfort performance of electrochromic windows with overhangs. Build. Environ. 2007, 42, 2439–2449. [Google Scholar] [CrossRef]
- Assimakopoulos, M.N.; Tsangrassoulis, A.; Guarracino, G.; Santamouris, M. Integrated energetic approach for a controllable electrochromic device. Energy Build. 2004, 36, 415–422. [Google Scholar] [CrossRef]
- Assimakopoulos, M.N.; Tsangrassoulis, A.; Santamouris, M.; Guarracino, G. Comparing the energy performance of an electrochromic window under various control strategies. Build. Environ. 2007, 42, 2829–2834. [Google Scholar] [CrossRef]
- Gugliermetti, F.; Bisegna, F. Visual and energy management of electrochromic windows in Mediterranean climate. Build. Environ. 2003, 38, 479–492. [Google Scholar] [CrossRef]
- Cannavale, A.; Ayr, U.; Martellotta, F. Innovative electrochromic devices: Energy savings and visual comfort effects. Energy Procedia 2018, 148, 900–907. [Google Scholar] [CrossRef]
- International Commission on Illumination. Method of Measuring and Specifying Colour Rendering Properties of Light Sources; Commission Internationale de l’éclairage; CIE Central Bureau: Vienna, Austria, 1995. [Google Scholar]
- Aste, N.; Leonforte, F.; Piccolo, A. Color rendering performance of smart glazings for building applications. Sol. Energy 2018, 176, 51–61. [Google Scholar] [CrossRef]
- Gunde, M.K.; Krasovec, U.O.; Platzer, W.J. Color rendering properties of interior lighting influenced by a switchable window. J. Opt. Soc. Am. 2005, 22, 416–423. [Google Scholar] [CrossRef]
- Ghosh, A.; Norton, B. Interior colour rendering of daylight transmitted through a suspended particle device switchable glazing. Sol. Energy Mater. Sol. Cells 2017, 163, 218–223. [Google Scholar] [CrossRef]
- Ghosh, A.; Selvaraj, P.; Sundaram, S.; Mallick, T.K. The colour rendering index and correlated colour temperature of dye-sensitized solar cell for adaptive glazing application. Sol. Energy 2018, 163, 537–544. [Google Scholar] [CrossRef]
- Roy, A.; Ghosh, A.; Bhandari, S.; Selvaraj, P.; Sundaram, S.; Mallick, T.K. Color Comfort Evaluation of Dye-Sensitized Solar Cell (DSSC) Based Building-Integrated Photovoltaic (BIPV) Glazing after 2 Years of Ambient Exposure. J. Phys. Chemestry C 2019, 123, 23834–23837. [Google Scholar] [CrossRef] [Green Version]
- Dangol, R.; Kruisselbrink, T.; Rosemann, A. Effect of Window Glazing on Colour Quality of Transmitted Daylight. J. Daylight. 2017, 4, 37–47. [Google Scholar] [CrossRef] [Green Version]
- Piccolo, A.; Simone, F. Energy performance of an all solid state electrochromic prototype for smart window applications. Energy Procedia 2015, 78, 110–115. [Google Scholar] [CrossRef] [Green Version]
- Park, S.I.; Quan, Y.J.; Kim, S.H.; Kim, H.; Kim, S.; Chun, D.M.; Lee, C.S.; Taya, M.; Chu, W.S.; Ahn, S.H. A Review on Fabrication Processes for Electrochromic Devices. Int. J. Precis. Eng. Manuf. Green Technol. 2016, 3, 397–421. [Google Scholar] [CrossRef]
- BS EN 410:1998; Glass in Building—Determination of Luminous and Solar Characteristics of Glazing. European Committee for Standardization: Brussels, Belgium, 1998.
- Lantonio, N.A.; Krarti, M. Simultaneous design and control optimization of smart glazed windows. Appl. Energy 2022, 328, 120239. [Google Scholar] [CrossRef]
- Piccolo, A.; Simone, F. Performance requirements for electrochromic smart window. J. Build. Eng. 2015, 3, 94–103. [Google Scholar] [CrossRef]
- Piccolo, A.; Pennisi, A.; Simone, F. Daylighting performance of an electrochromic window in a small scale test-cell. Sol. Energy 2009, 83, 832–844. [Google Scholar] [CrossRef]
- Jain, S.; Karmann, C.; Wienold, J. Behind electrochromic glazing: Assessing user’s perception of glare from the sun in a controlled environment. Energy Build. 2022, 256, 111738. [Google Scholar] [CrossRef]
- McCamy, C.S. Correlated color temperature as an explicit function of chromaticity coordinates. Color Res. Appl. 1992, 17, 142–144. [Google Scholar] [CrossRef]
- McCamy, C.S. Correlated color temperature as an explicit function of chromaticity coordinates (Erratum). Color Res. Appl. 1993, 18, 150. [Google Scholar]
- Viola, A.U.; James, L.M.; Schlangen, L.J.M.; Dijk, D.-J. Blue-enriched white light in the workplace improves self-reported alertness, performance and sleep quality. Scand. J. Work Environ. Health 2008, 34, 297–306. [Google Scholar] [CrossRef] [Green Version]
- Mardaljevic, J.; Waskett, R.K.; Painter, B. Neutral daylight illumination with variable transmission glass: Theory and validation. Light. Res. Technol. 2016, 48, 267–285. [Google Scholar] [CrossRef] [Green Version]
- Granqvist, C.G.; Arvizu, M.A.; Qu, H.Y.; Wen, R.T.; Niklasson, G.A. Advances in electrochromic device technology: Multiple roads towards superior durability. Surf. Coat. Technol. 2019, 357, 619–625. [Google Scholar] [CrossRef]
- Salamati, M.; Mathur, P.; Kamyabjou, G.; Taghizade, K. Daylight performance analysis of TiO2@W-VO2 thermochromic smart glazing in office buildings. Build. Environ. 2020, 186, 107351. [Google Scholar] [CrossRef]
- Mardaljevic, J.; Kelly, W.R.; Painter, B. Neutral daylight illumination with electrochromic glazing: Simulation of ‘light mixing’. In Proceedings of the 28th Session of the International Commission on Illumination (CIE 2015), Manchester, UK, 28 June–4 July 2015. [Google Scholar]
- Granqvist, C.G. Recent progress in thermochromics and electrochromics: A brief survey. Thin Solid Film. 2016, 614, 90–96. [Google Scholar] [CrossRef]
- Bogati, S.; Basnet, R.; Graf, W.; Georg, A. Development of photochromic device with magnetron sputtered titanium dioxide and tungsten trioxide films. Sol. Energy Mater. Sol. Cells 2017, 166, 204–211. [Google Scholar] [CrossRef]
- Feng, W.; Zou, L.; Gao, G.; Wu, G.; Shen, J.; Li, W. Gasochromic smart window: Optical and thermal properties, energy simulation and feasibility analysis. Sol. Energy Mater. Sol. Cells 2016, 144, 316–323. [Google Scholar] [CrossRef]
- Meng, Y.; Tan, Y.; Li, X.; Cai, Y.; Peng, J.; Long, Y. Building-integrated photovoltaic smart window with energy generation and conservation. Appl. Energy 2022, 324, 119676. [Google Scholar] [CrossRef]
- Ghosh, A.; Sundaram, S.; Mallick, T.K. Colour properties and glazing factors evaluation of multicrystalline based semi-transparent Photovoltaic-vacuum glazing for BIPV application. Renew. Energy 2019, 131, 730–736. [Google Scholar] [CrossRef]


| Device | Switching State | τV | CR | x | y | z | CIE CRI | CCT |
|---|---|---|---|---|---|---|---|---|
| sol–gel (spin coating) | bleached | 0.80 | 2:1 | 0.315 | 0.339 | 0.346 | 98.0 | 6323 |
| sol–gel (spin coating) | colored | 0.43 | 0.283 | 0.313 | 0.404 | 85.4 | 8719 | |
| sol–gel (dip coating) | bleached | 0.54 | 2:1 | 0.324 | 0.341 | 0.335 | 95.8 | 5880 |
| sol–gel (dip coating) | colored | 0.27 | 0.272 | 0.295 | 0.433 | 81.6 | 10,446 | |
| sputtering | bleached | 0.68 | 5:1 | 0.318 | 0.343 | 0.338 | 97.7 | 6457 |
| sputtering | colored | 0.14 | 0.290 | 0.324 | 0.386 | 85.9 | 7947 |
Disclaimer/Publisher’s Note: The statements, opinions and data contained in all publications are solely those of the individual author(s) and contributor(s) and not of MDPI and/or the editor(s). MDPI and/or the editor(s) disclaim responsibility for any injury to people or property resulting from any ideas, methods, instructions or products referred to in the content. |
© 2023 by the authors. Licensee MDPI, Basel, Switzerland. This article is an open access article distributed under the terms and conditions of the Creative Commons Attribution (CC BY) license (https://creativecommons.org/licenses/by/4.0/).
Share and Cite
Piccolo, A.; Prestipino, M.; Panzera, M.F.; Baccoli, R. Study of the Correlation among Luminous Properties of Smart Glazing for Adaptive Energy Saving Buildings. Buildings 2023, 13, 337. https://doi.org/10.3390/buildings13020337
Piccolo A, Prestipino M, Panzera MF, Baccoli R. Study of the Correlation among Luminous Properties of Smart Glazing for Adaptive Energy Saving Buildings. Buildings. 2023; 13(2):337. https://doi.org/10.3390/buildings13020337
Chicago/Turabian StylePiccolo, Antonio, Mauro Prestipino, Maria Francesca Panzera, and Roberto Baccoli. 2023. "Study of the Correlation among Luminous Properties of Smart Glazing for Adaptive Energy Saving Buildings" Buildings 13, no. 2: 337. https://doi.org/10.3390/buildings13020337